gm/wayne state national case competition
TRANSCRIPT

R.H.D.&L.S. ConsultingGM/Wayne State Supply Chain Case CompetitionDesign, Build, and Sell the World's Best Vehicles
Abigail FoxTierney ReillyKevin Roepe
Marc Vinklarek
Overview
• Requirements & Objectives
• Assumptions
• Recommendation Overview
• Supplier Analysis
• SWOT Analysis
• Key Success Factors
• Corporate Strategy & Vision
• Future Values
• Business Model
• Conclusion

Case Requirements & Objectives
• Achieve Marketing's Increased Demand for ATS • Achieve Marketing's New Demand for Sonic• Meet Timing Requirements • Perform Total Enterprise Cost Analysis • Sourcing Recommendation

Assumptions
• Constant demand for Chevrolet Sonic's without Dockspot
• Every car manufactured is sold
• Supplier's will meet quality specifications
• Supplier's are responsible for second-tier supplier management
• Contingency plan for Tel Aviv
• Shipping cost based on per mile not load size

Powerful Vision, Powerful Strategy
Recommendation
Sole Source Talon Interiors
Market Share Leader
Economic Sustainability

Recommended Strategy Sole Sourcing from Talon Interiors

Recommended Strategy Sole Sourcing from Talon Interiors
$56,886,181$59,009,639
$55,500,000
$56,000,000
$56,500,000
$57,000,000
$57,500,000
$58,000,000
$58,500,000
$59,000,000
$59,500,000
Package Individual
Tota
l Co
st ($
)
Options
PACKAGE VS. INDIVIDUAL
4%
56,886,181
63,577,450
59,780,384
54,434,296
60,152,150
57,501,359
53,964,291
59,642,325
57,014,334
$- $50,000,000 $100,000,000 $150,000,000 $200,000,000
Talon
Liger
Pedro
Total Cost of Ownerships
S
u
p
p
l
i
e
r
s
Overview of Total Cost of OwnershipFY1
FY2
FY3
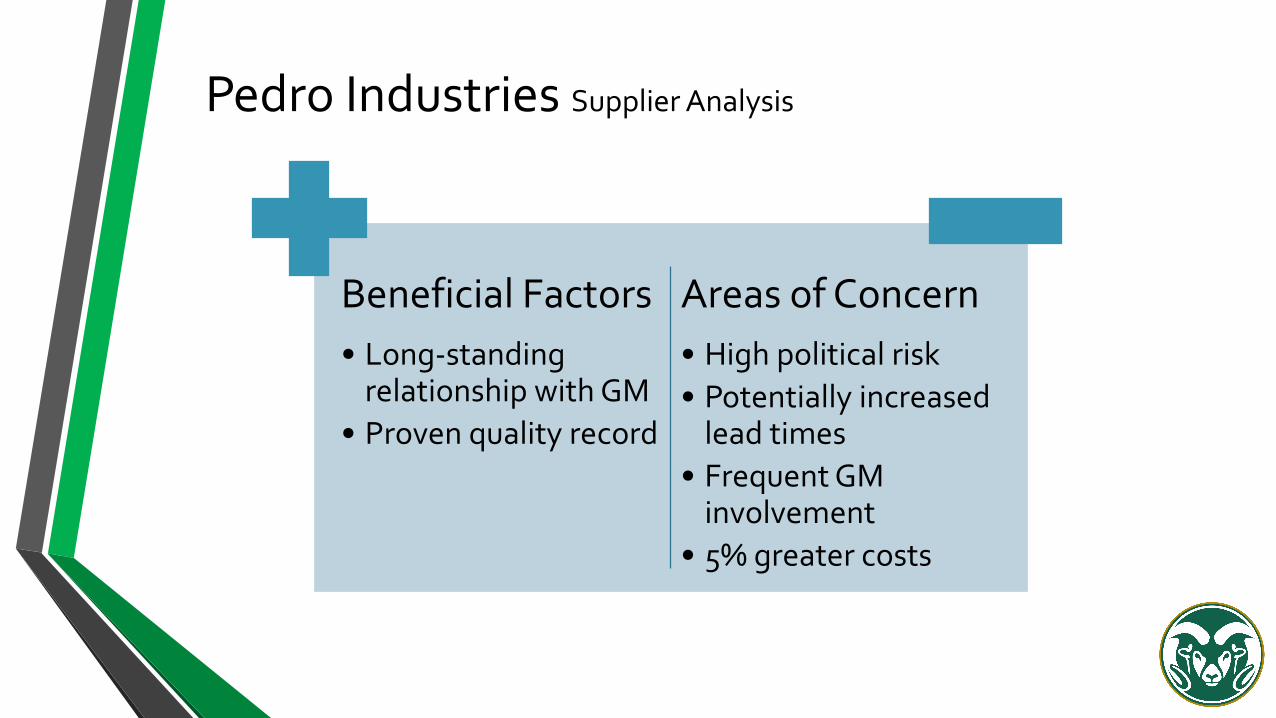
Pedro Industries Supplier Analysis
Beneficial Factors
• Long-standing relationship with GM
• Proven quality record
Areas of Concern
• High political risk
• Potentially increased lead times
• Frequent GM involvement
• 5% greater costs

FY1 FY2 FY3
Total Cost: Package Award $ 59,780,384.21 $ 57,501,359.21 $ 57,014,334.21
Total Cost : Independent ATS Award $ 43,299,974.00 $ 41,539,774.00 $ 41,139,574.00
Total: Independent Sonic Award $ 17,481,864.00 $ 16,892,344.00 $ 16,797,584.00
Pedro Industries Three Year Cost Overview

Liger Industries Supplier Analysis
Beneficial Factors
• Geographic proximity
• Top-rated supplier
• High service rating
Areas of Concern
• 12% higher costs
• History of price creep

Liger Industries Three Year Cost Overview
FY1 FY2 FY3
Total Cost: Package Award $ 63,577,450.00 $ 60,152,150.00 $ 59,642,325.00
Total Cost : Independent ATS Award $ 43,933,832.50 $ 41,700,120.00 $ 41,294,295.00
Total: Independent Sonic Award $ 20,534,790.00 $ 19,673,010.00 $ 19,567,170.00
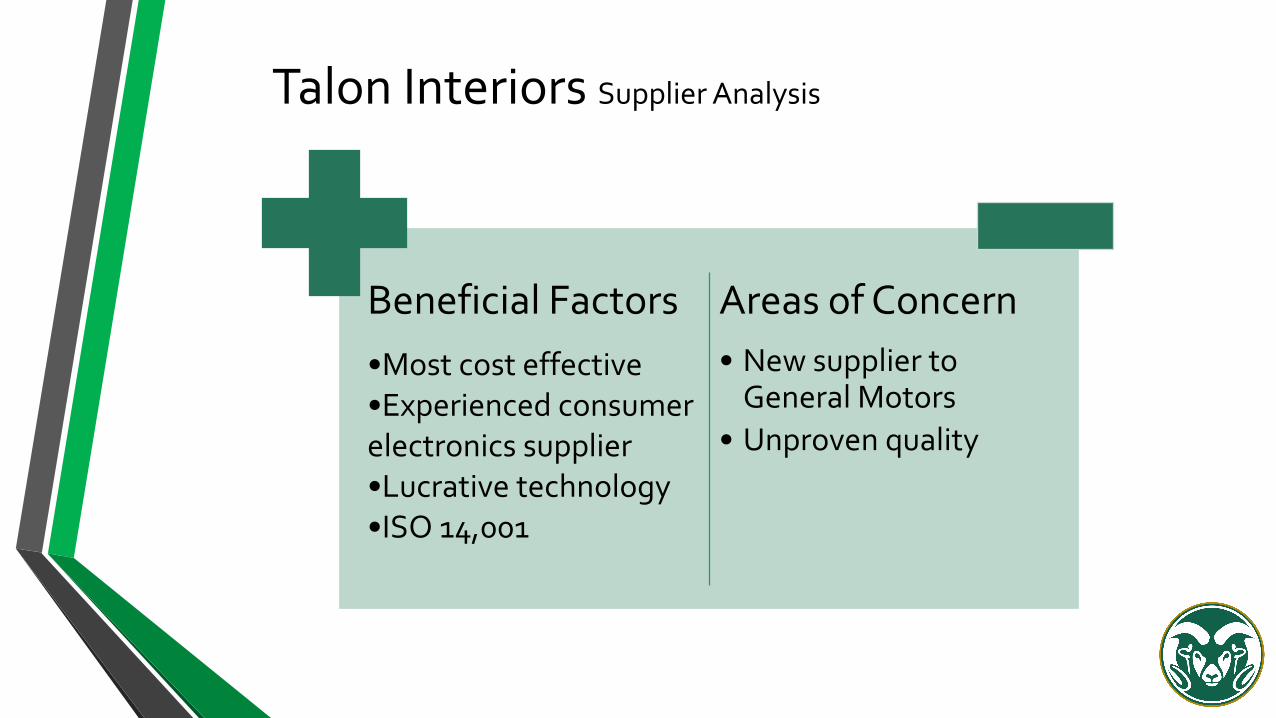
Talon Interiors Supplier Analysis
Beneficial Factors
•Most cost effective•Experienced consumer electronics supplier•Lucrative technology•ISO 14,001
Areas of Concern
• New supplier to General Motors
• Unproven quality

Talon Interiors Three Year Cost Overview
FY1 FY2 FY3
Total Cost: Package Award $ 56,886,180.76 $ 54,434,295.76 $ 53,964,290.76
Total Cost : Independent ATS Award $ 42,903,299.00 $ 41,008,274.00 $ 40,613,249.00
Total: Independent Sonic Award $ 15,709,665.00 $ 14,641,305.00 $ 14,557,125.00
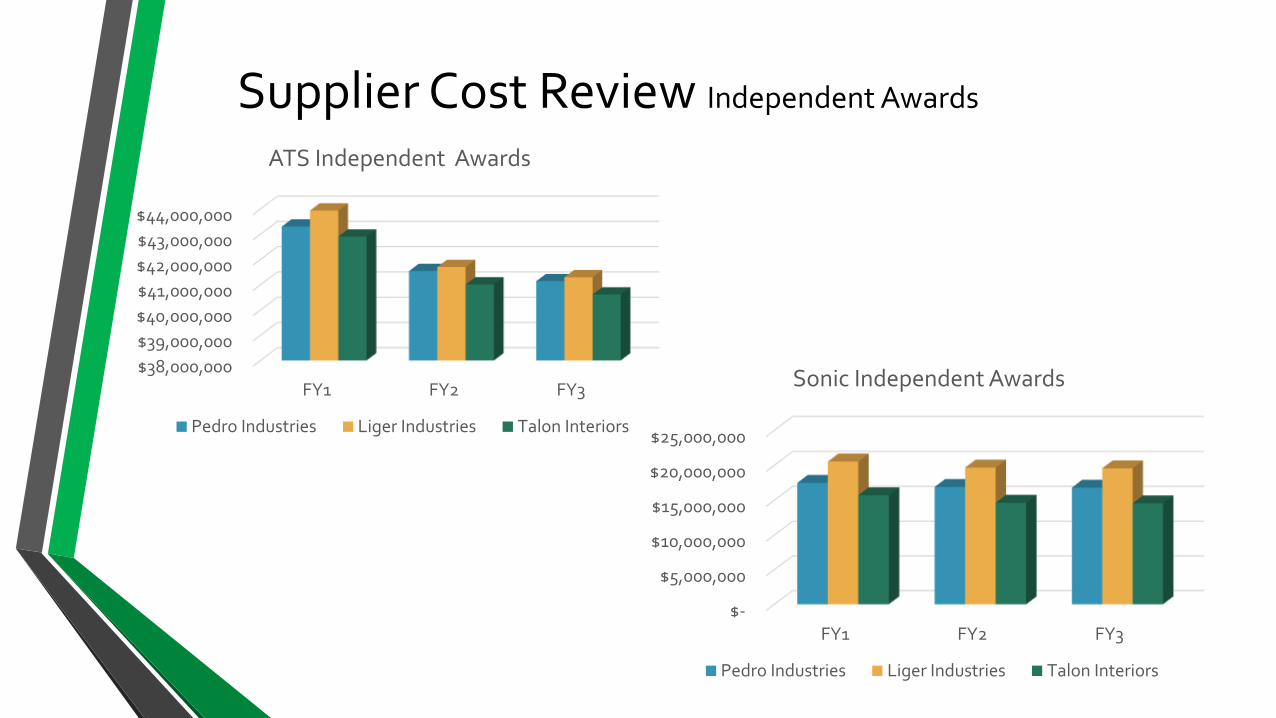
Supplier Cost Review Independent Awards
$38,000,000
$39,000,000
$40,000,000
$41,000,000
$42,000,000
$43,000,000
$44,000,000
FY1 FY2 FY3
ATS Independent Awards
Pedro Industries Liger Industries Talon Interiors
$-
$5,000,000
$10,000,000
$15,000,000
$20,000,000
$25,000,000
FY1 FY2 FY3
Sonic Independent Awards
Pedro Industries Liger Industries Talon Interiors

Supplier Cost Review Package Award
$48,000,000
$50,000,000
$52,000,000
$54,000,000
$56,000,000
$58,000,000
$60,000,000
$62,000,000
$64,000,000
FY1 FY2 FY3
Pedro
Liger
Talon
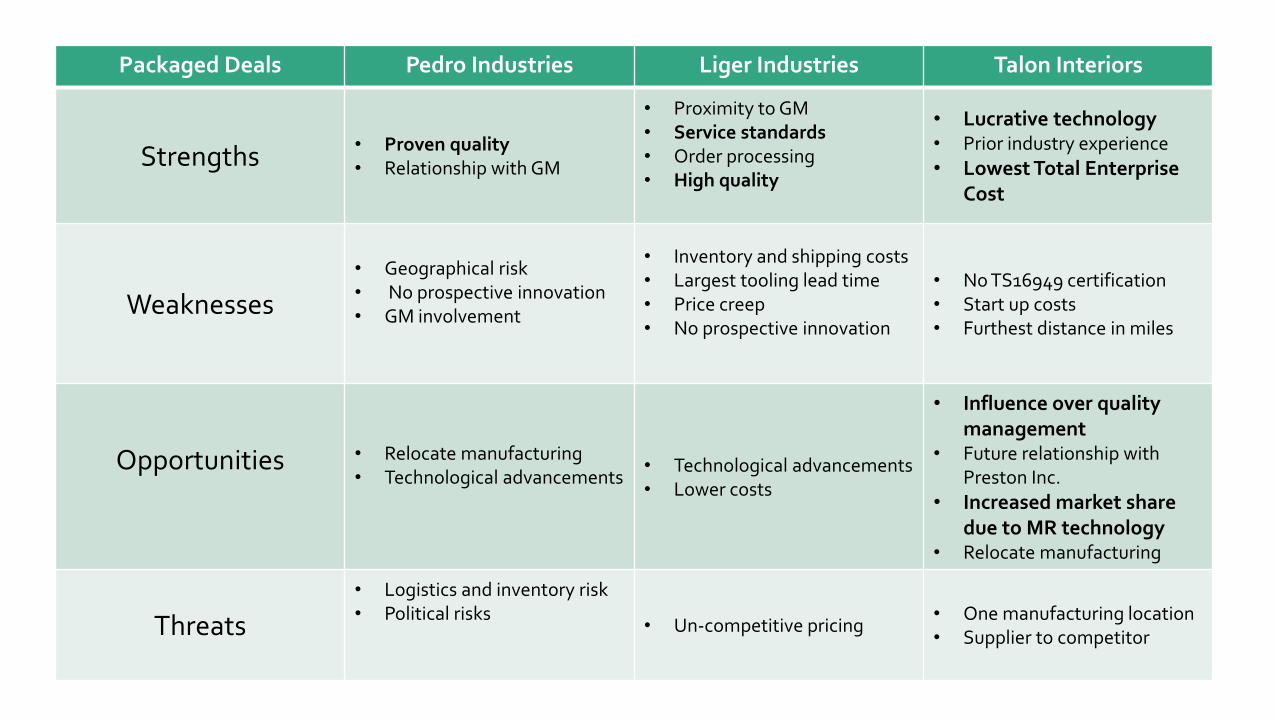
Packaged Deals Pedro Industries Liger Industries Talon Interiors
Strengths• Proven quality• Relationship with GM
• Proximity to GM• Service standards• Order processing• High quality
• Lucrative technology• Prior industry experience
• Lowest Total Enterprise Cost
Weaknesses
• Geographical risk• No prospective innovation• GM involvement
• Inventory and shipping costs• Largest tooling lead time• Price creep• No prospective innovation
• No TS16949 certification • Start up costs• Furthest distance in miles
Opportunities • Relocate manufacturing • Technological advancements
• Technological advancements• Lower costs
• Influence over quality management
• Future relationship with Preston Inc.
• Increased market share due to MR technology
• Relocate manufacturing
Threats
• Logistics and inventory risk• Political risks
• Un-competitive pricing• One manufacturing location• Supplier to competitor

Become Market Share Leader
Produce Quality Products
Strategically Source Parts and Materials
Continuously Innovate
Key Success Factors

GM Corporate Strategy
Current State
- Ensure economic viability
- Improve brand strength amongst Millennials
- Reinvest in a self-sustaining cycle
Future State
- Use advanced technology
- Reinvent transportation
- Create world-class products
Key Success Factors
- Become market leader
- Produce quality products
- Strategically source parts and materials
- Continuously innovate
- Transform our business
- Fortify our balance sheet
- Win in the marketplace
Corporate Vision

Implementing Future Values
• Sustain relationship
• Open-book and quarterly audits
• Supplier strategy development
• Tier 2 supplier development
• Heighten MR barriers of entry
• Negotiate for lower costs, fixed pricing
• Redesign container increased piece per shipment
• Protection against committed spend
• Require TS 16949 Certification
0.0230.047
0.0730.115
0.1540.179 0.194 0.207
0
0.05
0.1
0.15
0.2
0.25
1 2 3 4 5 6 7 8
% o
f to
tal s
ale
s
Years
Global Wireless Charger Handset Sales (% of Total)
Global Wireless Charger Handset Sales (% of Total)
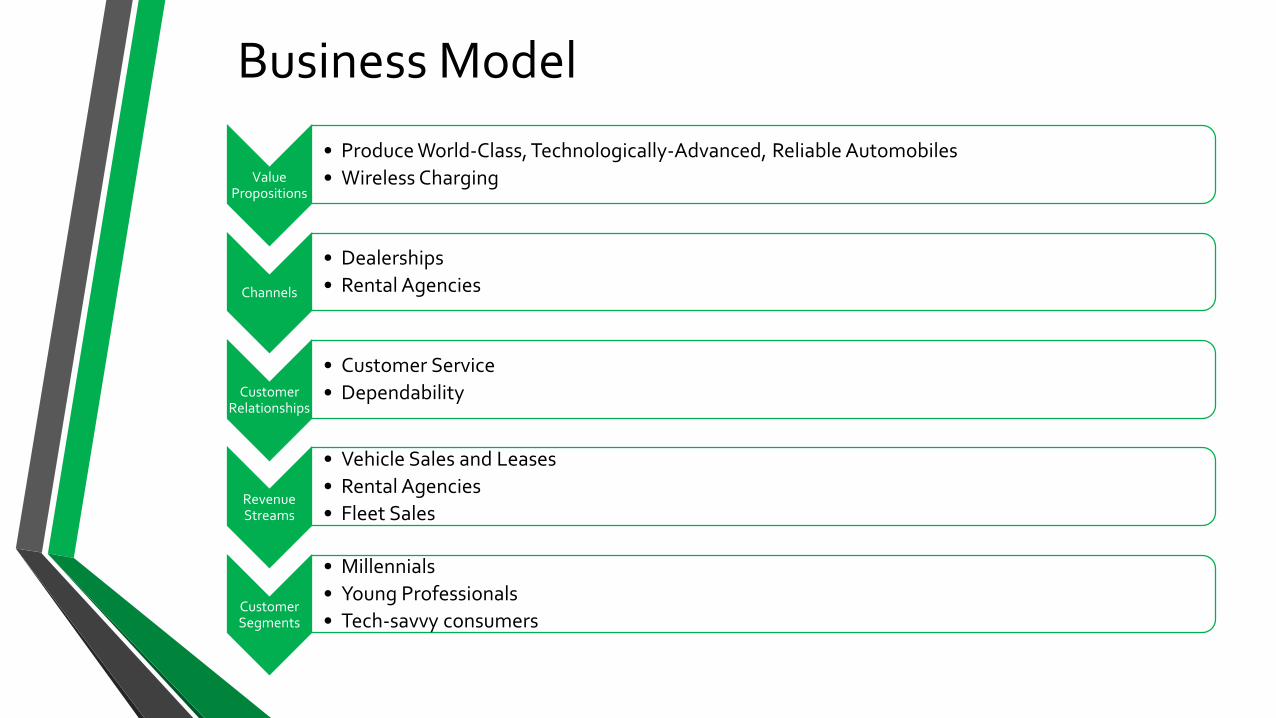
Business Model
Value Propositions
• Produce World-Class, Technologically-Advanced, Reliable Automobiles
• Wireless Charging
Channels
• Dealerships
• Rental Agencies
Customer Relationships
• Customer Service
• Dependability
Revenue Streams
• Vehicle Sales and Leases
• Rental Agencies
• Fleet Sales
Customer Segments
• Millennials
• Young Professionals
• Tech-savvy consumers

Conclusion
• Sole sourcing Talon Interiors most economically sustainable option
• New supplier relationship brings innovation to GM
• Long-term relationship to ensure supplier sustainability
TalonFuture State

Thank you for your time and consideration

Appendix A

KSF’s
KPI’s
CriticalProcesses
Become Market Share Leader
Consistently produce quality
products
Strategically source parts and
materials
Continuously innovate
Increase Number of SalesImprove MarginsDecrease Costs
Minimize number of recallsIncrease residual value
DevelopComprehensiveSupplierscorecard
Utilize improved technologies in
vehicles
Raise brand awareness
Sell!
Implement 6 Sigma/Lean
practices
Perform Supplier Audits/
Development
Focus on Research and development.
Customer preferences
Use advanced technology to reinvent the future of transportation and create world-class products in order to transform our business, fortify our balance sheet and win in the marketplace.
Integrity, individual respect and responsibility
Innovative and trusting
Win with Integrity
Automotive manufacturer looking toensure economic viability throughimproving brand strength amongstmillennials and continuously
reinvesting in a self-sustaining cycle.
Vision:Future State
Mission:Current State
Motivators:Values
GM Corporate Strategy Map

Business Model CanvasKey Partners
• Talon Interiors
• PrestonIncorporated
• Original Equipment Manufacturers
Key Activities• Production
• Strategic Sourcing
• Research and Development
Value Propositions
• Produce world-class, technologically-advanced, reliable automobiles
• Wireless charging
Customer Relationships• Customer
Service
• Dependability
CustomerSegments
• Millennials (Sonic)
• Young Professionals (ATS)
• Tech-savvy consumers (Both)
Key Resources• Innovative
technology• Suppliers
Channels• Dealerships• Rental
Agencies
Cost Structure• Manufacturing • Labor• Marketing and Sales
Revenue Streams• Vehicle Sales and Leases • Fleet Sales • Rental Agencies

Transit Distances and Costs Pedro Industries
Pedro Industries(Saltillo, MX)
Lansing, MI Orion, MI
Distance 1,771.5 Miles 1,844.2 Miles
Costs
53’ Standard $49,705.31 $29,024.54
53’ Drop Deck $46,211.60 $51,135.19
53’ Standard IM $49,049.84 $28,342.2
60’ Boxcar $95,664.66 N/A
86’ Boxcar $134,200.00 N/A
53’ Expedited $50,785.94 $30,149.52

Transit Distances and Costs Liger Industries
Liger Industries(Michigan)
Lansing, MI Orion, MI
Distance Intercity Intercity
Costs
53’ Standard $46,895.00 $26,095.00
53’ Drop Deck $43,293.00 $48,093.00
53’ Standard IM N/A N/A
60’ Boxcar N/A N/A
86’ Boxcar N/A N/A
53’ Expedited N/A N/A

Transit Distances and Costs Talon Interiors
Talon Interiors(San Diego, CA)
Lansing, MI Orion, MI
Distance 2,278 Miles 2,365 Miles
Costs
53’ Standard $50,535.92 $29,878.60
53’ Drop Deck $47,027.04 $51,973.20
53’ Standard IM $49,305.80 $28,601.50
60’ Boxcar N/A N/A
86’ Boxcar N/A N/A
53’ Expedited $52,176.08 $31,581.40

Containers per Transport Type
53’ Standard 53’ Drop Deck 60’ Boxcar 86’ Boxcar
Cadillac ATS 52 Containers 48 Containers 96 Containers 138 Containers
Arrangement (13L x 2W x 2H) (10L x 2W x 2H) (2L x 2W x 2H)
(16L x 2W x 3H) (23L x 2W x 3H)
Orientation (48” x 45” x 54”) (48” x 45” x 54”)(54” x 48” x 45”)
(45” x 54” x 48”) (45” x 54” x 48”)
Chevy Sonic 26 Containers 48 Containers 72 Containers 102 Containers
Arrangement (13L x 2W x 1H) (10L x 2W x 2H)(2L x 2W x 2H)
(12L x 2W x 3H) (17L x 2W x 3H)
Orientation (48” x 45” x 60”) (48” x 45” x 60”)(60” x 48” x 45”)
(60” x 48” x45”) (60” x 48” x 45”)
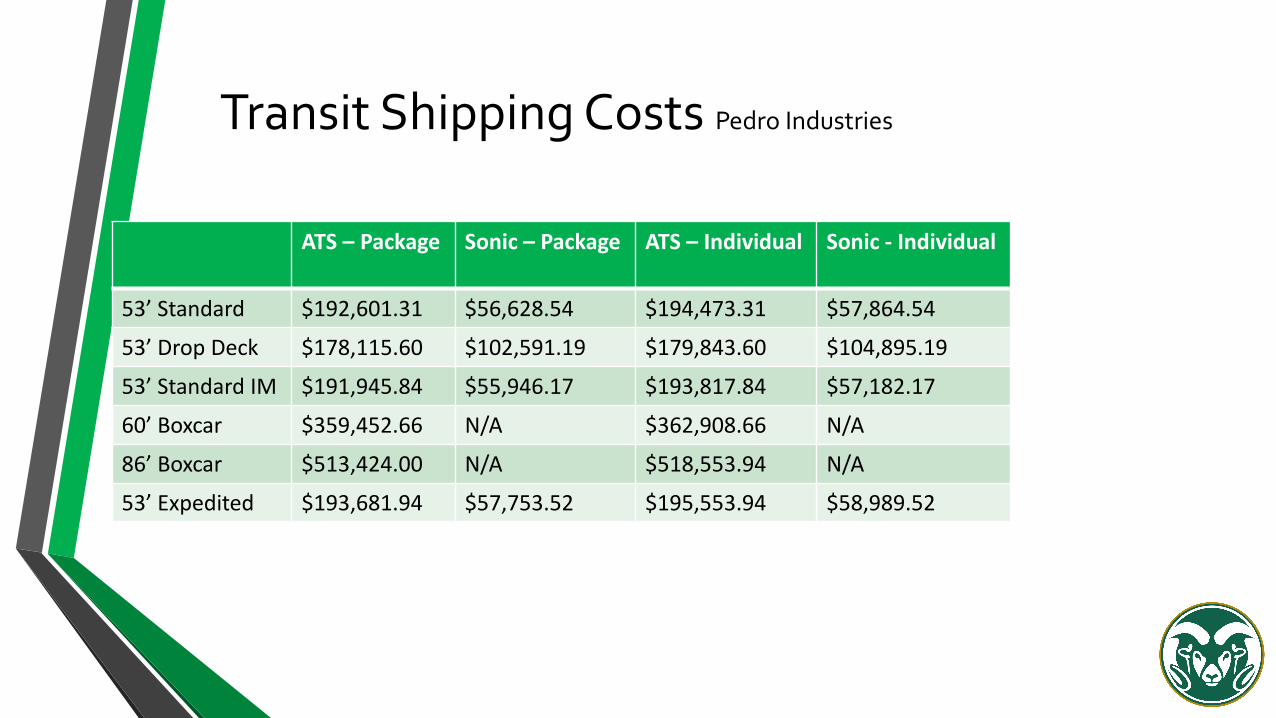
Transit Shipping Costs Pedro Industries
ATS – Package Sonic – Package ATS – Individual Sonic - Individual
53’ Standard $192,601.31 $56,628.54 $194,473.31 $57,864.54
53’ Drop Deck $178,115.60 $102,591.19 $179,843.60 $104,895.19
53’ Standard IM $191,945.84 $55,946.17 $193,817.84 $57,182.17
60’ Boxcar $359,452.66 N/A $362,908.66 N/A
86’ Boxcar $513,424.00 N/A $518,553.94 N/A
53’ Expedited $193,681.94 $57,753.52 $195,553.94 $58,989.52

Transit Shipping Costs Liger Industries
ATS – Package Sonic – Package ATS – Individual Sonic - Individual
53’ Standard $191,663.00 $57,324.60 $192,599.00 $58,395.80
53’ Drop Deck $176,925.00 $106,307.40 $177,789.00 $108,304.20
53’ Standard IM N/A N/A N/A N/A
60’ Boxcar N/A N/A N/A N/A
86’ Boxcar N/A N/A N/A N/A
53’ Expedited N/A N/A N/A N/A

Transit Shipping Costs Talon Industries
ATS – Package Sonic – Package ATS – Individual Sonic - Individual
53’ Standard $190,935.92 $53,939.40 $193,431.92 $54,722.20
53’ Drop Deck $176,627.04 $96,824.40 $178,931.04 $98,283.60
53’ Standard IM $189,705.80 $52,662.30 $192,201.80 $53,445.10
60’ Boxcar N/A N/A N/A N/A
86’ Boxcar N/A N/A N/A N/A
53’ Expedited $192,576.08 $55,642.20 $195,072.08 $56,425.00

Total Cost of Ownership Pedro Industries Package Award
Package FY1 FY2 FY3
Start-Up Costs - - -
Total Piece Price $49,420,500.00 $48,917,000.00 $48,493,500.00
Tooling Cost + Expedited Costs $1,500,000.00 - -
Expedited Costs $200,000 - -
Transportation Cost $757,621.00 $763,966.00 $781,560.00
Carrying Cost $7,413,075.00 $7,337,550.00 $7,274,025.00
Package: Total Less Expediting $59,091,196.00 $57,018,516.00 $56,549,085.00
Package: Total Cost $59,291,196.00 $57,018,516.00 $56,549,085.00

Total Cost of Ownership Pedro Industries Independent ATS Award
Independent: ATS FY1 FY2 FY3
Start-Up Costs - - -
Total Piece Price $35,844,000.00 $35,496,000.00 $35,148,000.00
Tooling Cost + Expedited Costs $1,200,000.00 - -
Expedited Costs $160,000.00 - -
Transportation Cost $602,152.00 $608,144.00 $611,177.00
Carrying Cost $5,376,600.00 $5,324,400.00 $5,272,200.00
Independent ATS: Total Less Expediting $42,420,600.00 $40,820,400.00 $40,420,200.00
Independent ATS: Total Cost $43,182,752.00 $41,428,544.00 $41,031,377.00

Total Cost of Ownership Pedro Industries Independent Sonic Award
Independent: Sonic FY1 FY2 FY3
Start-Up Costs - - -
Total Piece Price $14,659,200.00 $14,494,400.00 $14,412,000.00
Tooling Cost + Expedited Costs $400,000 - -
Expedited Costs - - -
Transportation Cost $287,651.00 $290,513.00 $291,962.00
Carrying Cost $2,198,880.00 $2,174,160.00 $2,161,800.00
Independent Sonic: Total Less Expediting $17,545,731.00 $16,959,073.00 $16,865,762.00
Independent Sonic: Total Cost $17,545,731.00 $16,959,073.00 $16,865,762.00

Total Cost of Ownership Liger Industries Package Award
Package FY1 FY2 FY3
Start-Up Costs - - -
Total Piece Price $51,708,000.00 $51,184,000.00 $50,748,000.00
Tooling Cost + Expedited Costs $1,600,000.00 - -
Expedited Costs $1,200,000.00 - -
Transportation Cost $305,970.00 $305,970.00 $305,970.00
Carrying Cost $7,756,200.00 $7,677,600.00 $7,612,200.00
Package: Total Less Expediting $62,264,200.00 $58,861,600.00 458,360,200.00
Package: Total Cost $62,264,200.00 $58,861,600.00 $58,360,200.00

Total Cost of Ownership Liger Industries Independent ATS Award
Independent: ATS FY1 FY2 FY3
Start-Up Costs - - -
Total Piece Price $36,075,750.00 $35,496,000.00 $35,148,000.00
Tooling Cost + Expedited Costs $1,000,000.00 - -
Expedited Costs $600,000.00 - -
Transportation Cost $305,970.00 $305,970.00 $305,970.00
Carrying Cost $5,411,362.50 $5,324,400.00 $5,272,200.00
Independent ATS: Total Less Expediting $42,793,082.50 $41,126,370.00 $40,726,170.00
Independent ATS: Total Cost $43,393,082.50 $41,126,370.00 $40,726,170.00

Total Cost of Ownership Liger Industries Independent Sonic Award
Independent: Sonic FY1 FY2 FY3
Start-Up Costs - - -
Total Piece Price $16,396,800.00 $16,217,600.00 $16,128,000.00
Tooling Cost + Expedited Costs $600,000.00 - -
Expedited Costs - - -
Transportation Cost $305,970.00 $305,970.00 $305,970.00
Carrying Cost $2,459,520.00 $2,432,640.00 $2,419,200.00
Independent Sonic: Total Less Expediting $19,762,290.00 $18,956,210.00 $18,853,170.00
Independent Sonic: Total Cost $19,762,290.00 $18,956,210.00 $18,853,170.00

Total Cost of Ownership Talon Interiors Package Award
Package
FY1 FY2 FY3
Start-Up Costs $500,000.00 $ - $ -
Total Piece Price $47,012,100.00 $46,532,200.00 $46,123,500.00
Tooling Cost + Expedited Costs $1,400,000.00 $ - $ -
Expedited Costs $ - $ - $ -
Transportation Cost $215,757.00 $215,757.00 $215,757.00
Carrying Cost $7,051,815.00 $6,979,830.00 $6,918,525.00
Package: Total Less Expediting $56,179,672.00 $53,727,787.00 $53,257,782.00
Package: Total Cost $56,179,672.00 $53,727,787.00 $53,257,782.00

Total Cost of Ownership Talon Interiors Independent ATS Award
Independent: ATS FY1 FY2 FY3
Start-Up Costs $500,000.00 $ - $ -
Total Piece Price $35,380,500.00 $35,037,000.00 $34,693,500.00
Tooling Cost + Expedited Costs $1,000,000.00 $ - $ -
Expedited Costs $ - $ - $ -
Transportation Cost $600,139.00 $606,111.00 $609,039.00
Carrying Cost $5,307,075.00 $5,255,550.00 $5,204,025.00
Independent ATS: Total Less Expediting $42,787,714.00 $40,898,661.00 $40,506,564.00
Independent ATS: Total Cost $42,787,714.00 $40,898,661.00 $40,506,564.00

Total Cost of Ownership Talon Interiors Independent Award
Independent: Sonic FY1 FY2 FY3
Start-Up Costs $500,000.00 $ - $ -
Total Piece Price $12,645,600.00 $ 12,499,200.00 $ 12,426,000.00
Tooling Cost + Expedited Costs $ 400,000.00 $ - $ -
Expedited Costs $ - $ - $ -
Transportation Cost $ 267,225.00 $ 267,225.00 $ 267,225.00
Carrying Cost $ 1,896,840.00 $ 1,874,880.00 $ 1,863,900.00
Independent Sonic: Total Less Expediting $ 15,709,665.00 $ 14,641,305.00 $ 14,557,125.00
Independent Sonic: Total Cost $ 15,709,665.00 $ 14,641,305.00 $ 14,557,125.00

EOQ Delivery Pedro Industries
Orion, Michigan (Package)
FY 1 FY 2 FY 3
53' Standard $ 577,803.93 $ 577,803.93 $ 577,803.93
53' Drop deck $ 534,346.80 $ 534,346.80 $ 534,346.80
53' IM $ 575,837.53 $ 575,837.53 $ 575,837.53

EOQ Delivery Pedro Industries
Orion, Michigan (Individual)
FY 1 FY 2 FY 3
53' Standard $ 226,514.15 $ 226,514.15 $ 226,514.15
53' Drop deck $ 307,773.57 $ 307,773.57 $ 307,773.57
53' IM $ 223,784.69 $ 223,784.69 $ 223,784.69

Pedro
Lansing, Michigan (Package)
(Package) FY1 FY2 FY3
53' Standard $ 770,405.24 $ 770,405.24 $
770,405.24
53' Drop deck $ 712,462.40 $ 712,462.40 $
712,462.40
53' IM $ 767,783.37 $ 767,783.37 $
767,783.37
60' Railcar $ 1,078,357.98 $ 1,078,357.98 $
1,078,357.98
86' Railcar $ 1,540,272.00 $ 1,540,272.00 $
1,540,272.00

PedroLansing, Michigan (Individual)
(Individual) FY1 FY2 FY3
53' Standard $ 777,893.24 $ 777,893.24 $
777,893.24
53' Drop deck $ 719,374.40 $ 719,374.40 $
719,374.40
53' IM $ 775,271.37 $ 775,271.37 $
775,271.37
60' Railcar $ 1,088,725.98 $ 1,088,725.98 $
1,088,725.98
86' Railcar $ 1,555,176.00 $ 1,555,176.00 $
1,555,176.00

Liger
Orion, Michigan (Package or Individual)
FY1 FY2 FY3
Standard 53' $ 312,550.00 $ 312,550.00 $ 312,550.00
Dropdeck 53' $ 305,970.00 $ 305,970.00 $ 305,970.00

Liger
Lansing, Michigan (Package or Individual)
FY1 FY2 FY3
Standard 53' $ 312,550.00 $ 312,550.00 $ 312,550.00
Dropdeck 53' $ 305,970.00 $ 305,970.00 $ 305,970.00
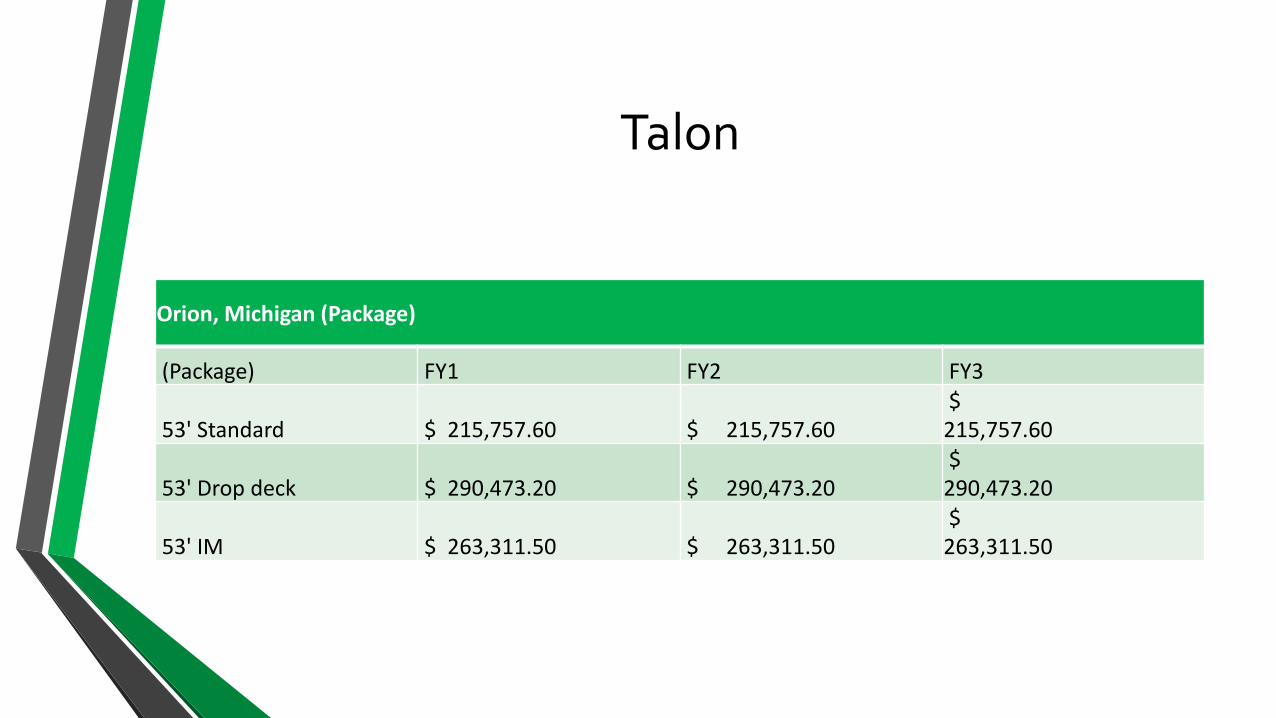
Talon
Orion, Michigan (Package)
(Package) FY1 FY2 FY3
53' Standard $ 215,757.60 $ 215,757.60 $
215,757.60
53' Drop deck $ 290,473.20 $ 290,473.20 $
290,473.20
53' IM $ 263,311.50 $ 263,311.50 $
263,311.50
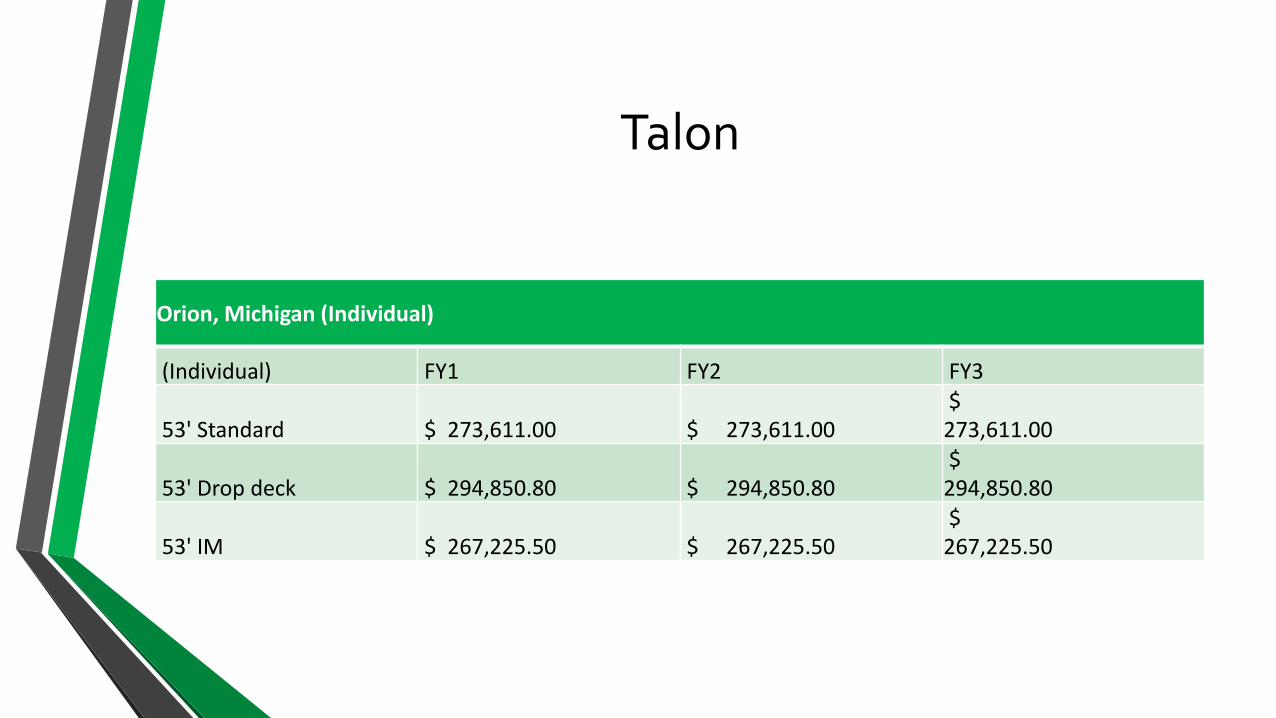
Talon
Orion, Michigan (Individual)
(Individual) FY1 FY2 FY3
53' Standard $ 273,611.00 $ 273,611.00 $
273,611.00
53' Drop deck $ 294,850.80 $ 294,850.80 $
294,850.80
53' IM $ 267,225.50 $ 267,225.50 $
267,225.50

Talon
Lansing, Michigan (Package)
(Package) FY1 FY2 FY3
53' Standard $ 763,743.68 $ 763,743.68 $ 763,743.68
53' Drop deck $ 706,508.16 $ 706,508.16 $ 706,508.16
53' IM $ 758,823.20 $ 758,823.20 $ 758,823.20

Talon
Lansing, Michigan (Individual)
(Individual) FY1 FY2 FY3
53' Standard $ 773,727.68 $ 773,727.68 $ 773,727.68
53' Drop deck $ 715,724.16 $ 715,724.16 $ 715,724.16
53' IM $ 768,807.20 $ 768,807.20 $ 768,807.20

Appendix BFormulas
Total Cost of Ownership
• TCO = (Total Piece Price + Tooling Costs+ Expedited Tooling
Costs+ Transportation Costs + Carrying Costs)
EOQ Cost
• EOQ =√[2((Annual Demand )*Transportation Cost)/(Total Piece
Price*Carrying Cost)]
Total Piece Price
• Total Piece Price = (Piece Price * Annual Demand)

Expedited Tooling Cost
• Expedited Tooling Cost= ((Tooling Cost* Expedited Tooling Cost percentage)*(Number of weeks / Reduction weeks rate))

Distance Calculations
• Distances Calculated using Google Maps
• Saltillo, MX to Lansing, MI
• Saltillo, MX to Orion, MI
• San Diego, CA to Lansing, MI
• San Diego, CA to Orion, MI
• Intercity distances were not calculated

Transportation Costs
• Transportation Costs = ((Unit Price * Units per Trailer) * Shipping Costs)

Containers per Trailer
• Process for determining the number of containers that could fit in a specific trailer type
• Researched dimensions for all four trailer types
• Divide trailer length, width and height, by container length, width and height to identify maximum number of containers per dimension
• Visually modeled containers per trailer to determine best orientations and arrangements
• Assumed that containers could be rotated on all three axis to determine best combination
Units per Trailer
• Units per Trailer = (Number of Containers per Trailer * Number of Pieces per Container)
Shipping Costs
• The cost of shipping a truckload of sub-assemblies from supplier to manufacturing site
• Shipping Costs = (( Distance * Rate per Mile) + (Cost per Container * Containers per Trailer))

Carrying Costs
• Carrying Costs = (( Annual Demand * Piece Price) * 15%)

Percent Change in Global Handset Sales
• Used for supporting our choice of Talon Interiors based on the adaptation of MR Technology
• Percent Change=(%2020-%2014)