gnss back office systemsmb.cision.com/public/migratedwpy/89467/763592/9f41b745ba6fb15f.pdf ·...
TRANSCRIPT

BACK OFFICE SYSTEMS
TRAFFIC MANAGEMENT
GNSS
2009+ COMPANY
Q-FREE ASA
+ REFERENCE TYPE
ANNUAL REPORT + REVENUES (IN NOK MILLION)
804
Q-FREE / ANNUAL REPORT / 2009
+ CALENDER 2010
29 APRIL 2010 / RESULTS Q110
20 MAY 2010 / ANNUAL GENERAL MEETING / OSLO
19 AUGUST 2010 / RESULTS Q210 AND FIRST HALF YEAR 2010
21 OCTOBER 2010 / RESULTS Q310
+ QUARTERLY PRESENTATIONS WILL BE HELD AT
FELIX CONFERENCE CENTER / AKER BRYGGE / BRYGGETORGET 3 / OSLO
+ THE PRESENTATIONS WILL BE BROADCASTED LIVE THROUGH THE FOLLOWING LINK
WWW.Q-FREE.COM
+ FOR FURTHER INFORMATION, PLEASE CONTACT
CEO ØYVIND ISAKSEN (+47 905 59 401)
CFO ROAR ØSTBØ (+47 932 45 175)
+ ABOUT Q-FREE
Q-FREE IS A LEADING GLOBAL SUPPLIER OF SOLUTIONS AND PRODUCTS FOR ROAD USER
CHARGING AND TRAFFIC MANAGEMENT HAVING APPLICATIONS MAINLY WITHIN ELECTRONIC
TOLL COLLECTION FOR ROAD FINANCING, CONGESTION CHARGING, TRUCK-TOLLING, LAW
ENFORCEMENT AND PARKING/ACCESS CONTROL. Q-FREE OFFERS SOLUTIONS AND PRO-
DUCTS BASED ON STATE OF THE ART TECHNOLOGY, AND IS THE LEADING SUPPLIER WITHIN
DSRC (TAG) - AND ALPR (AUTOMATIC LICENSE PLATE RECOGNITION) AND GNSS (GLOBAL NAVI-
GATION SATELLITE SYSTEM) BASED SOLUTIONS, WITH DELIVERIES IN EUROPE, ASIA-PACIFIC,
MIDDLE EAST AND NORTH- AND SOUTH AMERICA. THE COMPANY HAS APPR. 300 EMPLOYEES
IN 11 LOCATIONS AND REPRESENTATIVES IN 7 OTHER COUNTRIES. HEADQUARTER IS BASED IN
TRONDHEIM, NORWAY. Q-FREE IS LISTED ON THE OSLO STOCK EXCHANGE WITH THE TICKER
QFR. HTTP://WWW.Q-FREE.COM

CONTENT
PART 1. INTRODUCTION 2
+
KEY FIGURES 5
HISTORY 6
Q-FREE WORLDWIDE 2009 8
THE CEO’S CORNER 10
MANAGEMENT TEAM 12
+
PART 2. BUSINESS REVIEW 14
+
1. MARKET DRIVERS AND TRENDS 16
2. RUC TECHNOLOGIES AND THEIR DEPLOYMENT 17
3. STRATEGY AND POSITIONING GOING FORWARD 18
4. Q-FREE’S OFFERING 20
5. MARKET UPDATE 21
6. OUTLOOK 22
+
PART 3. GOVERNANCE & REPORTING 24
+
CORPORATE GOVERNANCE 26
BOARD OF DIRECTOR’S REPORT 38
ANNUAL ACCOUNTS 44
AUDITOR’S REPORT 91
ABBREVIATIONS 92
Q-FREE
OFFERS
SOLUTIONS
AND
PRODUCTS
BASED ON
STATE OF
THE ART
TECHNOLOGY
+

Q-FREE
IS ALWAYS
LOOKING
FOR THE
RIGHT
PEOPLE
+
MONITORING FUNCTIONALITY OF RSE (ROAD SIDE EQUIPMENT)
PART 1. INTRODUCTION
>> Q-FREE EMPLOYEES ARE PRESENT IN 18 COUNTRIES AND FOUR
CONTINENTS. AT YEAR END THE COMPANY HAD 300 EMPLOYEES.
A TOTAL OF 92 PERCENT OF THE EMPLOYEES HOLD A UNIVERSITY
DEGREE OR SIMILAR, MAINLY TECHNICAL DEGREES.

2 + 3NOC (NETWORK OPERATIONAL CENTER)
INITIATING ON-SITE SERVICE
CORRECTIVE ACTIONS

+ REVENUES (MNOK)
804+ INCREASED REVENUES
58%+ EBIT (MNOK)
103+ ORDER INTAKE (MNOK)
1,177+ ORDER BACKLOG (MNOK)
713
>>
WE ARE CURRENTLY EXECUTING THE
MOST SIGNIFICANT AND ADVANCED
PROJECTS WITHIN THE ROAD USER
CHARGING SEGMENT. THIS FORMS
A STRONG BASIS FOR EXPLORING
SIMILAR CASES GOING FORWARD.
<<
( INTRODUCTION )

FIGURES IN TNOK
Profi t & Loss Account
2004 2005 2006 2007 2008 2009
Operating revenues 291,803 509,160 386,942 410,854 509,246 804,403
Cost of goods sold 137,615 233,300 154,104 160,981 219,978 303,249
Operating Expenses 154,540 154,174 186,450 212,021 224,034 365,769
EBITDA -352 121,686 46,387 37,852 65,233 135,205
EBIT -18,901 105,372 29,373 20,875 44,283 102,743
PROFIT BEFORE TAX -25,874 118,675 45,024 14,555 50,915 109,698
PROFIT AFTER TAX -26,811 112,316 33,868 5,015 36,287 78,150
Gross margin % 52.8% 54.2% 60.2% 60.8% 56.8% 62.3 %
EBITDA % -0.1% 23.9% 12.0% 9.2% 12.8% 16.8 %
EBIT % -6.5% 20.7% 7.6% 5.1% 8.7% 12.8 %
SELECTED BALANCE SHEET ITEMS
Intangible fi xed assets 11,172 11,780 23,288 40,320 128,017 155,860
Tangible fi xed assets 37,495 42,083 45,274 53,406 63,938 71,874
Cash 58,581 166,518 162,174 124,283 119,617 274,615
Total assets 358,851 429,558 426,395 393,055 514,425 767,534
Equity (incl minority ) 197,274 241,000 295,505 300,596 351,663 548,601
Interest bearing debts 4,469 4,022 3,392 2,992 2,202 1,412
KEY FIGURES PER SHARE
Earnings per share, ordinary -1.90 1.84 0.65 0.03 0.60 1.41
Earnings per share, diluted -1.89 1.83 0.62 0.03 0.60 1.39
Cashfl ow 0.77 3.96 0.35 -0.24 1.54 2.01
Book equity 3.90 4.74 5.71 5.75 6.52 9.88
Average no of shares 50,618 50,809 51,779 52,274 53,976 55,536
OTHER KEY FIGURES
Order backlog 339,930 224,000 293,573 371,356 338,868 713 039
Return on capital employed (ROCE) 0.81 1.19 0.91 1.05 0.99 1,05
Net interest bearing debts 4,469 4,022 3,392 2,992 2,202 1 412
Cash fl ow from operations 39,155 201,082 18,354 -12,718 83,096 111 852
Operational investment 9,697 15,793 14,951 25,164 87,762 71 075
Equity ratio 55% 56% 69% 76% 68% 71 %
Gearing 1.2% 0.9% 0.8% 0.8% 0.4% 0.2 %
Average number of employees 180 181 188 198 232 282
KEY FIGURESQ-FREE / ANNUAL REPORT / 2009 (4 + 5)

The history of Q-Free is a history of cus-
tomer orientated innovation. From the start
of the company, focus has been on devel-
oping advanced technology optimising our
customers’ profi tability. The fi rst implemen-
tation of a full-speed non-stop electronic
toll collection system was deployed in an
R&D program from 1986 to 1988. When
the Ranheim Toll station (Trondheim, Nor-
way) opened in 1988, the technology was
GROUNDBREAKING, offering the motorist to
pass and pay at a 160 km per hour using
OBUs with expected lifespan of 45 years. No
technology at that time could offer perform-
ance matching the Q-Free system and the
cost of the equipment was 25 to 50 percent
of the cost presented by “similar” systems.
The early success of the Q-Free system at
Ranheim Toll Station was further expanded
to the large toll collection systems deployed
in Oslo in 1990 and Trondheim in 1991. Both
these projects turned out to become GREAT
COMMERCIAL SUCCESSES for the owner
of the system, creating a fi nancial basis for
a rapid road and public transport develop-
ment in the two cities. In 1991, the fi rst inter-
national project also appeared at the scene
when Brisa of Portugal ordered the fi rst elec-
tronic toll collection system at Carcavelos toll
plaza, later to be expanded to include also
the other toll plazas surrounding Lisbon,
Loures, Sacavem and 25th of April Bridge.
With the systems operational in Oslo, Trond-
heim and Lisbon, Q-Free had proven its
ability to design, implement and operate
complex and large scale information sys-
tems for the purpose of fee collection. Thus,
when Brisa chose their technology partner
for the deployment of Europe’s fi rst nation-
wide toll collection system based on the new
standardised frequency 5.8 GHz in 1994,
Q-Free became their choice. The system
was set into operation early 1995, and the
same system is still in operation.
In 1997, The European Committee for
Standardisation (CEN) decided on the so-
called TC278 family of standards for Dedi-
cated Short Range Communication (DSRC).
Q-Free followed suit and in January 1998,
the World’s fi rst commercial system based
on this standard was delivered by Q-Free to
the Austrian Ökopunkte system and later on
to Switzerland’s LSVA truck tolling system.
1999 became the year of commercial boost.
The TC278 standards had facilitated a rapid
growth in system designs for road toll collec-
tion and in the autumn of 1999, Q-Free won
the contract for the development and imple-
mentation of large scale toll collection sys-
tems in Brazil, Australia and Norway. Q-Free
also confi rmed its leading position through
winning the Dutch Rekeningrijden contract
in a tough technology contest. This project
was the most advanced study of a MLFF
system at that time.
In 2002, Q-Free was listed on the Oslo Stock
Exchange. Transforming from a technology
company owned by a few founding partners,
Q-Free is today still a publicly listed company
with more than a thousand shareholders.
2004 became yet another landmark for
Q-Free. Through winning the contract for
the roadside system and OBUs to the
Stockholm Congestion Tax System, Q-Free
reconfi rmed the company’s leading role, not
only in DSRC but also in Automatic License
Plate Recognition (ALPR). Due to the local
legislation, ALPR became eventually the
only technology used for identifi cation. The
ALPR system delivered by Q-Free probably
offers the best performance of any such sys-
tem currently in operation worldwide. The
Stockholm Congestion Tax System is the
world’s only ALPR solution where the clients’
accounts are charged automatically solely
on the basis of machine read images.
In 2005 the business of automatic fare
collection (ticketing) was demerged from
Q-Free forming a new public listed com-
pany–Fara ASA. Q-Free held shares in this
company ASA until 2007.
In 2008, Q-Free confi rmed its intention to
be a technology neutral solution provider.
The acquisition of the companies Dacolian
(ALPR SW engines) and Building Capital
(GNSS based toll collection solutions) repre-
sent important steps in this direction.
In 2009, Q-Free achieved record high order
intake and revenues. Through the award of
the two biggest contracts in the industry
since 2005, the Slovakia truck tolling project
and the AENOR MLFF project in Portugal,
Q-Free has further strengthened its market
position.
25 YEARS OF INNOVATIVE HISTORY
( INTRODUCTION )

+ 2009
Q-FREE SIGNED MAJOR CONTRACTS IN SLOVAKIA, PORTUGAL, THAILAND
+ 2008
ACQUISITION OF DACOLIAN BV AND BUILDING CAPITAL LTD.
+ 2005
STOCKHOLM CONGESTION TAX SYSTEM DELIVERED
+ 2003
INTRODUCTION OF FULLY AUTOMATIC TOLL COLLECTION
+ 2002
IPO AND LISTED AT OSLO STOCK EXCHANGE
+ 1999
AUTOPASS CONTRACT AWARDED Q-FREE / BREAKTHROUGH IN BRAZIL AND AUSTRALIA
+ 1997
ESTABLISHMENTS OF THE EUROPEAN CEN DSRC STANDARDS
+ 1995
5.8 GHZ SYSTEM INSTALLED IN PORTUGAL
+ 1991
CONTRACT FOR TRONDHEIM TOLL CORDON
+ 1990
CONTRACT FOR OSLO TOLL CORDON
+ 1988
FIRST FREE FLOW TOLLING SYSTEM OPERATIONAL
+ 1986
CONTRACT WITH NORWEGIAN PUBLIC ROADS ADMINISTRATION
+ 1984
ESTABLISHED UNDER THE NAME MICRO DESIGN
THE HISTORY OF Q-FREE IS A HISTORY OF CUSTOMER ORIENTATED
INNOVATION. FROM THE START OF THE COMPANY, FOCUS HAS
BEEN ON DEVELOPING ADVANCED TECHNOLOGY OPTIMISING OUR
CUSTOMERS’ PROFITABILITY.
07 JAN 09+ TAG ORDER FROM AUSTRALIA 32 MNOK
Q-FREE / ANNUAL REPORT / 2009 (6 + 7)

Q-FREE
WORLDWIDE
2009
( INTRODUCTION )

8 + 9
1. TRONDHEIM / HEADQUARTER
2. OSLO / OFFICE
+ COUNTRIES WE ARE PRESENT IN
+ NUMBER OF EMPLOYEES
292
18

M
THE CEO’S CORNER
y ambition is to establish Q-Free as the
indisputable world leading supplier of Intel-
ligent Transport Systems for Road User
Charging (RUC) and Traffi c Management.
This will be achieved by having the right
strategy and world class execution.
Our strategy is to be a technology neutral
global solution provider, and today we have
achieved to become the leading supplier,
having competence, products and solu-
tions within all relevant technologies for
various RUC applications.
The activity in the company has been very
high the last years, 2009 in particular, and
we are proud to present to our sharehold-
ers and employees all time high revenues,
record high order intake and strong profi ta-
bility for 2009. This is clearly the best motiva-
tion factor we can get and the achievements
accomplished in 2009 bring out more energy
and eagerness to set new records.
Over and above the fact that our achieve-
ment in 2009 implies good fi nancial per-
formance, it is also important to understand
and appreciate the unique opportunity we
now have to further develop and profes-
sionalise the company. The added refer-
ences through successful delivery of the
major projects, such as in Slovakia, Por-
tugal and Thailand, are invaluable tools for
Q-Free when competing for future projects
in the market.
The global ITS market is expected to con-
tinue to grow considerably for many years,
and Q-Free’s market position is continu-
ously strengthening. Our strategic position-
ing has been well received in the market.
During 2009 the company achieved all time
high order intake of well above 1 BNOK.
2010 will also be an important year in
positioning the company for many bigger
infrastructure projects facilitating long term
growth.
Even though Q-Free in 2009 experienced a
record year during a time period for which
many businesses were impacted by the
fi nancial crises, we need to be aware that
all businesses will go through tough times
and should hence be ready to implement
whatever measures needed. That said, as
seen today, there is no doubt that Q-Free
is a part of a long term growing market
segment – a new mega trend. Our mar-
ket segment is still in an early stage, – the
penetration of the solutions we can offer
is still low, or non-existing, in many coun-
tries. In addition, new application areas will
develop, among them the implementation
of electronic license plate schemes.
To effi ciently explore this growing market,
we will continue to strengthen our compe-
tence and capacity. The sales organisation
will be expanded to cover new geographi-
cal areas, operational excellence will be a
continuous focus to secure high quality and
cost effi ciency, and the company’s R&D
activity will futureproof the company.
During the year we have celebrated the
25th year’s anniversary for the company.
Many important millstones have been
achieved during these 25 years. I will have
broad support when stating that the com-
pany has never been in better shape and
the market development and trends have
never been more visible. We all look forward
to the next 25 years, further development
of the company guided by our vision to be
a globally preferred partner in the area of
Intelligent Transport Systems having world-
wide leadership in Road User Charging and
Traffi c Management.
2007 showed 6% growth, 2008 showed
24% growth and 2009 showed 58% growth.
The company is fi nancially strong, has a
good cash position and no long term debt.
The market is growing and Q-Free has a
more attractive portfolio and offering than
ever. I do look forward to take the next steps
and motivate the Q-Free team to outsmart
the competition, and hence enhance share-
holder value and customer satisfaction.
Thanks to all clients, employees and partners
for your strong commitment to Q-Free.
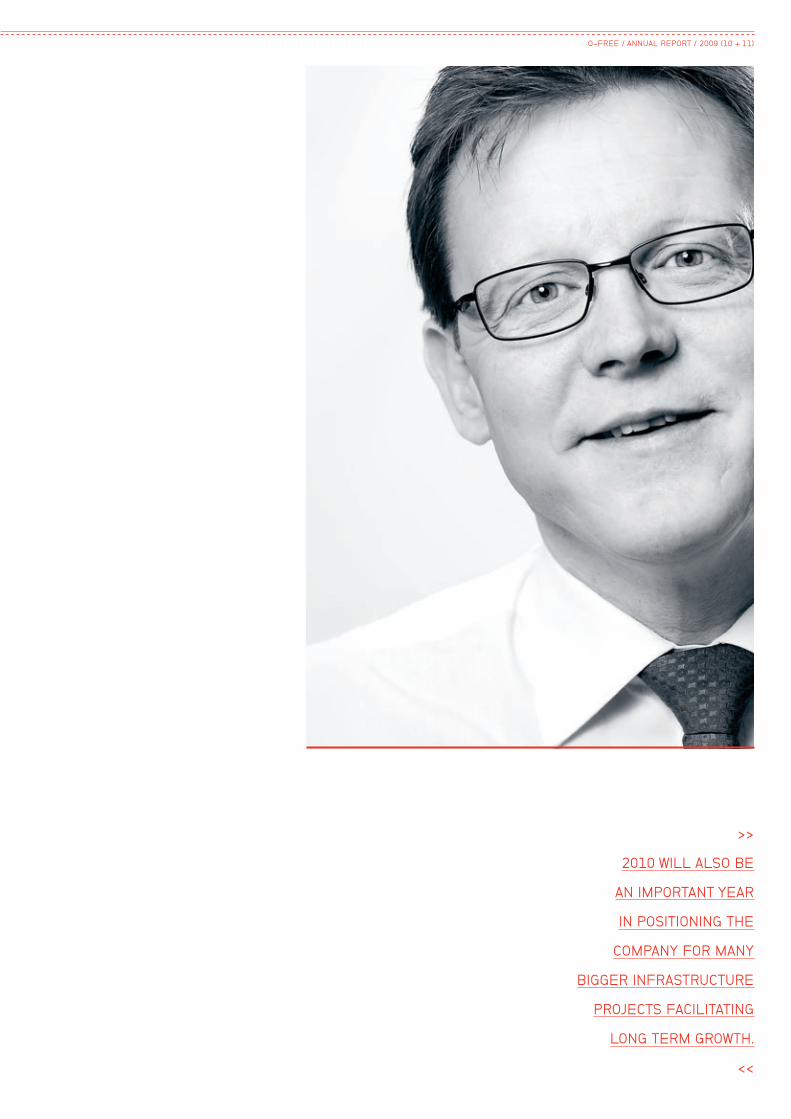
DR. ØYVIND ISAKSEN
President & CEO
(sign.)
( INTRODUCTION )
>>
2010 WILL ALSO BE
AN IMPORTANT YEAR
IN POSITIONING THE
COMPANY FOR MANY
BIGGER INFRASTRUCTURE
PROJECTS FACILITATING
LONG TERM GROWTH.
<<
Q-FREE / ANNUAL REPORT / 2009 (10 + 11)

1. DR. ØYVIND ISAKSEN
President and CEO
+ Dr. Øyvind Isaksen (1963) has held the
position as CEO since 2006. He has a PhD
in Physics (University of Bergen 1994). Dr.
Isaksen has held positions as President of
Nera Networks (2002-2006), Roxar Flow
Measurement and Fluenta. He has also held
management positions in ABB Research and
Christian Michelsen Research.
2. ROAR ØSTBØ
Chief Financial Offi cer (CFO)
+ Roar Østbø (1961) has been employed in
Q-Free ASA since 2009. Østbø comes from
the same position in AquaLyng Group and has
previously held the CFO position in the publicly
listed companies Q-Free ASA and CorrOcean
ASA, and in the oil service company Reslab
AS and Sintef. Mr Østbø is a Certifi ed Public
Accountant from the Norwegian School of
Economics and Business Administration
(1988) and has also worked as auditor in Arthur
Andersen & Co.
3. MARIANNE SANDAL
Vice President Operation
+ Marianne Sandal (1965) has been with
the company since 2006. She holds an
engineering degree from the University of
Bergen (1988), in addition to credits within
management from Norwegian School of
Management (BI). Marianne Sandal has been
working in Nera Networks since 1988, has
extensive experience in project management,
and since 2003 she has been heading the
world wide operation activity of Nera.
4. PER ECKER
Vice President Sales
+ Per Ecker (1969) has been with the
company since 2007. He comes from the
position as Sales Director in Siemens Mobile
Networks (1992–2007) with responsibility
for Eastern European markets in particular.
Mr. Ecker has extensive experience from
international sales both in Asia and Europe.
He is educated by The Norwegian Army
Offi cers Training School (1986-1989) as
Second Lieutenant in Electronics.
5. DR. JOS A.G. NIJHUIS
VP ITS
+ Dr. Jos Nijhuis (1965) has been employed
since 1999. Nijhuis holds a M.Sc. (with
honors) in Electrical Engineering 1987; and
a Ph.D. in Natural Sciences from Nijmegen
University in 1992. Nijhuis has extensive
experience in ITS software development
from various positions within academia
and industry. Nijhuis is also the CEO and
co-founder of Dacolian B.V.
1
4
6
5
MANAGEMENT TEAM
( INTRODUCTION / MANAGEMENT TEAM )

6. HENRIK F. STOLTENBERG
Vice President M&A
+ Vice President M&A Henrik F. Stoltenberg
(1960) comes from the position as Group
Executive Vice President, responsible for
the daily operation of JAI Group (Denmark),
and with focus on implementing the
corporate strategy. Mr. Henrik F. Stoltenberg
holds a HD Degree from Business School
Copenhagen. He has been Chief Financial
Offi cer and member of the management
team in JAI since 2006.
Henrik F. Stoltenberg has previously also
been fi nance director at Merkantildata A/S
and Bruhn A/S.
7. DR. HANS CHRISTIAN BOLSTAD
Vice President R&D
+ Dr. Hans Christian Bolstad (1962) has
been employed in his current position since
2007. Bolstad holds a MSc. in Physics and
Mathematics 1987; and a Ph.D. in physical
electronics from NTNU (Norwegian University
of Science and Technology, 1994). Bolstad
has extensive experience within research and
development from both telecom, medical
and offshore sectors through his work at
NTNU, Sintef, Optomed, Optoplan and
Q-Free ASA .
8. STEINAR FURAN
Vice President Business Development & Compliance
+ Steinar Furan 1963) has been employed
since 1990 and holds an engineering degree
in electronics (Trondheim Ingeniørhøyskole
1984 and University of Tromsø 1987). He
has extensive experience in various senior
positions within the company including
project and business unit management. He
is now responsible for managing Q-Free’s
business development activities as well as
being responsible for securing compliance
with standards and statutory requirements
applicable.
9. STEIN-TORE NYBRODAHL
Human Resource Manager
+ Stein-Tore Nybrodahl (1965) is Q-Free’s
Human Resource Manager and started with
the company in 2006. He holds a Master’s
degree in Business(Copenhagen Business
School, Denmark, 1992) and successfully
completed the senior executive program
INSEAD in France (1993). He has extensive
HR and strategy experience having held
various senior management roles at Telenor
(Norway), where he became director of
strategy and HR development. At Q-Free,
Mr. Nybrodahl is responsible for the
management and development of human
resources.
3
2
9
8
7
Q-FREE / ANNUAL REPORT / 2009 (12 + 13)
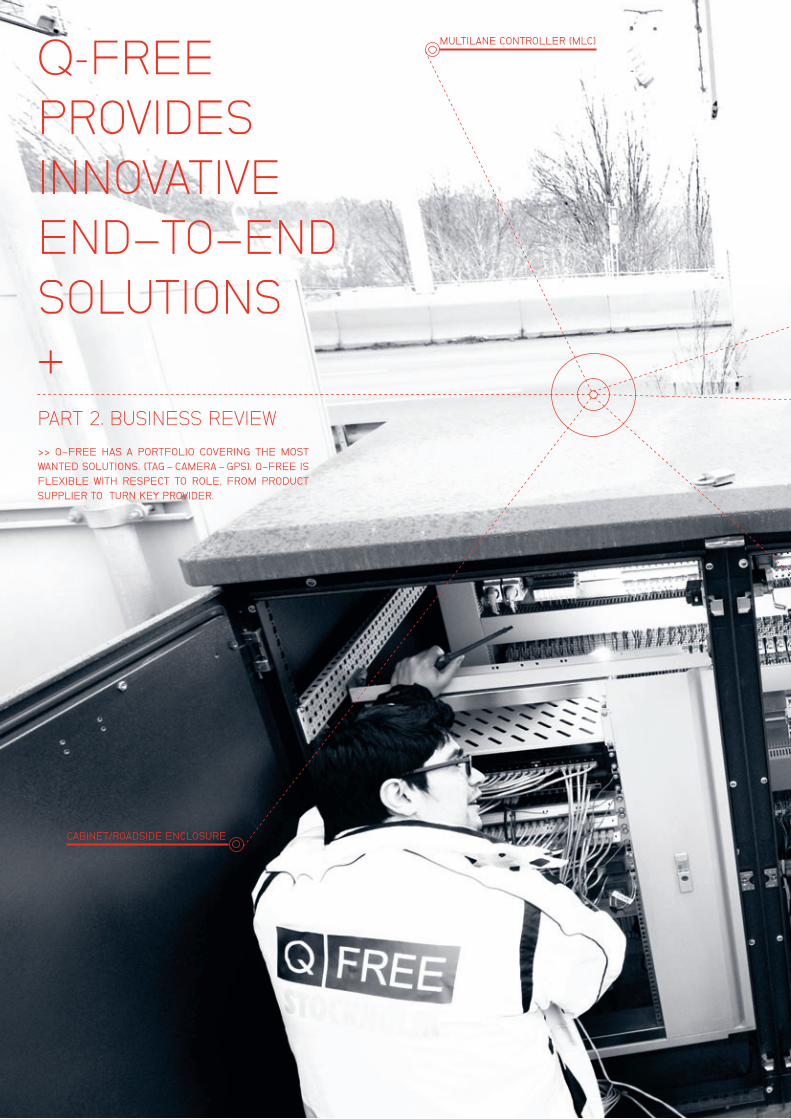
>> Q-FREE HAS A PORTFOLIO COVERING THE MOST
WANTED SOLUTIONS. (TAG – CAMERA – GPS). Q-FREE IS
FLEXIBLE WITH RESPECT TO ROLE, FROM PRODUCT
SUPPLIER TO TURN KEY PROVIDER.
MULTILANE CONTROLLER (MLC)
CABINET/ROADSIDE ENCLOSURE
Q-FREE
PROVIDES
INNOVATIVE
END-TO-END
SOLUTIONS
+PART 2. BUSINESS REVIEW

14 + 15
TRANSACTION MONITORING
COMMUNICATION LINE ROADSIDE /BACKOFFICE
+ SERVICE ENGINEERS STOCKHOLM
ANALYZING/TESTING THE MLC

+ 1. MARKET DRIVERS AND TRENDS Q-Free operates mainly in the market of Road User Charging (RUC). Through the acquisi-
tion of Dacolian BV the company has intensifi ed its activity within Traffi c Management,
delivering software components for law enforcement, parking / access control and travel
time systems.
The market for RUC solutions is still in an early stage and a double-digit annual growth
percentage is expected in the years to come. In some of the most developed RUC markets
the industry is now transitioning from innovation to growth. It is expected that more and
more RUC markets will enter the growth phase in the years to come. When a market has
adopted a RUC technology, the growth phase is expected to last for many years. Through-
out 2009 the sales pipeline has developed positively and many important contracts have
been awarded and more will come in the near future. In 2009 Q-Free achieved a record
high order intake of above 1 billion NOK.
> THE MOST IMPORTANT MARKET DRIVERS FOR RUC SOLUTIONS CAN BE SEGMENTED AS:
1) FINANCING OF INFRASTRUCTURE
2) TRUCK TOLLING
3) EFFICIENCY OF EXISTING RUC SOLUTION
4) CONGESTION MANAGEMENT
5) OTHER RUC SOLUTIONS
6) TRAFFIC MANAGEMENT
FINANCING OF INFRASTRUCTURE
Financing of infrastructure is a strong driver since private equity through government conces-
sion or private public partnership contracts are increasingly involved to fi nance, build and
operate roads, bridges and other major infrastructure. Private equity gets return on invest-
ments through RUC. There is not available suffi cient public funding to realise all needed infra-
structure.
TRUCK TOLLING
Truck Tolling has been extensively used in Germany for a number of years, and truck toll-
ing schemes are also rolled out in the Czech Republic, Slovakia and Austria. All these truck
tolling systems have proven to be viable. With these decisions to implement truck tolling,
and the fi rm plans of Polen, Slovenia, France, to mention the most likely projects in the near
future, it seems obvious that the truck tolling market will constitute a considerable share of
the market for road user charging in Europe going forward.
EFFICIENCY OF EXISTING RUC SOLUTION
There is a large effi ciency potential to convert existing manual operated tolling schemes to all
electronic (automated) RUC systems. This process has already started and operators both
in Europe, Asia and the Americas are in the process of upgrading their existing solutions to
modern electronic solutions, – often Multi Lane Free Flow or Open Road Tolling as they are
called in North America. This conversion will take time, but the trend is clear.
BUSINESS REVIEW
( BUSINESS REVIEW )

CONGESTION CHARGING
Several initiatives are ongoing, but many are still delayed by political processes. Jakarta,
Gothenburg, Helsinki and a number of other cities all have fi rm plans for the introduction of
congestion charging. Stockholm is still the outstanding reference for congestion charging,
clearly demonstrating the concept’s capacity to change travellers’ behaviour thereby con-
tributing to a signifi cant improvement of the city’s environment and the citizens’ quality of
life. Stockholm has reduced traffi c in the city centre by 20-25%, and travel time during rush
hours is reduced by 30-50% (www.stockholmsforsoket.se). The congestion charging market
potential is huge, but will take longer time to materialise compared to the above mentioned
application areas.
OTHER RUC SOLUTIONS
In addition to the above mentioned market drivers, 2009 has shown that new markets are
starting to be visible in the area of road taxation, - namely Electronic Registration and Iden-
tifi cation (ERI). A new regulation has been formalised for European countries and will prob-
ably set the standard in this market segment. Regulators in several countries are now in the
starting phase of developing projects to implement electronic number plates to regulate and
enforce annual taxation and security on the roads in a better way. This represents a huge
market potential since it implies that all cars will be equipped with a tag identifi cation, in addi-
tion to the need for road side infrastructure and central systems.
TRAFFIC MANAGEMENT
Traffi c Management in general is a growing market. Technologies like measurement of travel
time to give data for traffi c planning and average speed measurement are examples of
applications that seem to become increasingly popular. Q-Free has for many years been
supplying technology for applications such as travel time measurements and traffi c planning
based on DSRC technology. With the acquisition of Dacolian, thereby being able to offer also
automatic license plate recognition technology (ALPR), Q-Free takes a more fi rm grip on the
market segment of Traffi c Management.
+ 2. RUC TECHNOLOGIES AND THEIR DEPLOYMENTThe RUC market is segmented globally by its use of RUC technology. The main technologies
employed are DSRC, RFID, GNSS, ALPR and MTC. The following offers an overall descrip-
tion of the different technologies and their spread geographically.
> 1) DSRC – DEDICATED SHORT RANGE COMMUNICATION
DSRC is a technology that follows European CEN and ETSI standards dedicated for RUC
purpose. The cars communicate with the charging point through an OBU installed on the
windshield of the vehicle. The CEN DSRC is a microwave communication link and the OBU
has processing capabilities for communication and security. DSRC based systems are widely
used and successfully implemented in large scale in Europe, Australia, and Latin America.
> 2) RFID – RADIO FREQUENCY IDENTIFICATION
RFID is similar to the CEN DSRC solution except that OBUs usually do not have processing
power. Popularly said the DSRC OBU has active components and the RFID OBU has only pas-
sive components meaning that a RFID based OBU does not need an internal energy source
such as a battery. In some markets the RFID OBU is called a sticker tag. RFID is mainly used in
some RUC systems in North America and in some countries in Latin America. Also RFID may
seem as an attractive alternative to DSRC for electronic licence plate applications.
> 3) GNSS – GLOBAL NAVIGATION SATELLITE SYSTEM
All systems based on GPS are classifi ed as GNSS. RUC systems based on GNSS require
an OBU in the vehicle that positions the vehicle and by some other means (DSRC, GPRS)
reports its position and movement to the RUC operator. The RUC market where the GNSS
based system is being used is the RUC system for heavy goods vehicles, more specifi cally
the German HGV system and in the Slovakia SkyToll system.
Q-FREE / ANNUAL REPORT / 2009 (16 + 17)
> VIDEOTOLLING IN STOCKHOLM, SWEDEN

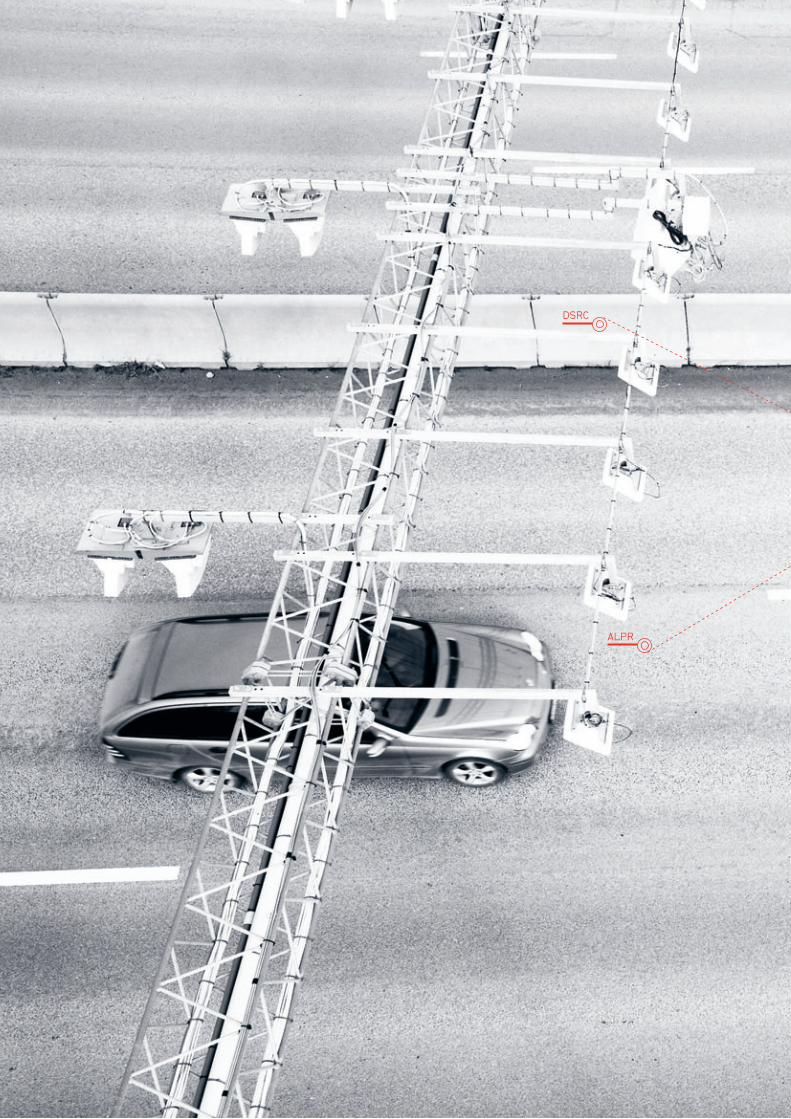
> 4) ALPR – AUTOMATIC LICENSE PLATE RECOGNITION
ALPR technology is based on digital video images of the vehicle’s number plate and soft-
ware that automatically reads the vehicle’s licence number. ALPR based systems are used in
some congestion charging systems such as in Stockholm and London. ALPR is also used as
enforcement measures in RUC systems based on the above described technologies. As all
electronic, fully automated tolling systems are being implemented, video based enforcement
will be increasingly important.
> 5) MTC (MANUAL TOLL COLLECTION SYSTEMS)
MTC is basically manually or semi manually collection of the charge from the road user.
Manually means that there are personnel in a toll booth that collect the charge, and semi
manually means that the manual collection is supported by some technologies like classifi ca-
tion equipment, coin machine and enforcements cameras. MTC has been in use for decades
and is widely in use in markets that introduced RUC a long time ago as well as in emerging
markets. MTC is currently deployed in large scale in North and South America, Asia Pacifi c
and East and South Europe. Upgrade of these MTC systems represents an unexploited
potential in the RUC industry. The RUC market in Asia is still in an innovation phase and it is
too early at this point to predict which technologies will become predominant in Asia.
The above described technologies are industrialised, and technology innovations are
expected to be limited to improvements of price/ performance ratio.
The technology that Q-Free expects to become a universal RUC solution in the long term is
the CALM (Communication Access for Land Mobiles) standard. CALM is the standardisa-
tion of ITS telematics protocols, procedures and management processes. Q-Free is one of
the initiators of CALM. CALM will enable vehicle-to-vehicle communication and vehicle-to-
roadside communication enabling safer and more environmental friendly transport as well as
forming the basis for future RUC applications.
Q-Free has taken a leading role in defi ning the CALM standards and has already, as the fi rst
company in the world, demonstrated prototypes at an international ITS convention. However
commercial products based on CALM are still some years ahead.
+ 3. STRATEGY AND POSITIONING GOING FORWARDThe vision of Q-Free is to be a globally preferred partner in the area of Intelligent Transport
Systems having world-wide leadership in Road User Charging and Traffi c Management.
Q-Free’s ultimate and long term goal is to be a preferred supplier independent of which tech-
nology and solution the customers are looking for. As the RUC global market is segmented
according to the deployment of different technologies, Q-Free is positioning itself further as a
technology independent supplier to capture future growth by being a true global player.
In order to be a true global supplier Q-Free considers a broad portfolio covering the main
RUC technologies to be a necessity. The company will leverage on its leading position within
DSRC and its long lasting experience in the RUC business to become a major player within
all RUC technologies that are offered in the global RUC market. Expanding the company’s
technology and product portfolio will be done in combination with in-house R&D activities,
M&A and by strategic partnership with other ‘best of breed’ players in the industry. In the
execution of this strategy the company acquired two companies in 2008,- Dacolian BV
(ALPR) and Building Capital Ltd. (GNSS). Also recently Q-Free introduced the latest genera-
tion in-house developed DSRC portfolio and back offi ce systems. This implies that Q-Free
has taken a big step in the direction of being able to offer to the market the optimal solution
for RUC and Traffi c Management applications based on the best technology for solving the
problem at hand.
15 JAN 09+ TAG ORDER FROM AUSTRALIA 32 MNOK
( BUSINESS REVIEW )

TECHNOLGY INDEPENDENT
+ PORTFOLIO COVERING MOST WANTED SOLUTIONS (TAG – CAMERA – GPS)
+ ACQUISITION OF DACOLIAN AND BUILDING CAPITAL EXPAND COMPETENCE AND OFFERING
FLEXIBLE WITH RESEPCT TO ROLE
+ FROM PRODUCT SUPPLIER TO TURN KEY PROVIDER
+ NOT COMPETE WITH OUR CUSTOMER SUCH AS OPERATORS AND MAJOR SYSTEM INTEGRATORS
MIGRATE TO AN ITS PLAYER
+ Q-FREE WILL OVER TIME EXPAND OFFERING TO INCLUDE NEW ITS AREA
+ E.G. PARKING ACCESS & CONTROL SYSTEMS AND ERI
A LEADING SUPPLIER OF INTELLIGENT TRANSPORT SYSTEMS FOR ROAD USER CHARGING
AND TRAFFIC MANAGEMENT
VISION AND STRATEGIC POSITIONING
Q-FREE
SE
GM
EN
T
OPERATORS CONCESSIONARIETECHNOLOGY PROVIDERS SYSTEM INTEGRATORS
18 + 19

The vision and strategic positioning can be summarised in the following model:
Q-Free’s product and system / solution supply will cover all main technologies asked for in
the industry – i.e. Q-Free will be a technology independent supplier. Q-Free will be fl exible
when it comes to role and scope for the various market opportunities. Whether Q-Free is
positioned as a technology / product supplier / systems integrator / turnkey supplier, will be
dependent on geography, size and application.
Standardisation plays an important role in the success of any largescale deployment of RUC
technology. Large-scale deployment usually requires interoperability of equipment and sys-
tems coming from many different manufacturers.
This includes certifi cations, compliance testing and security. Based on this Q-Free will con-
tinue to dedicate considerable efforts to international standardisation by taking a leading
position in standardisation work. Q-Free was one of the leading players in defi ning the Euro-
pean DSRC standard and Q-Free is now doing the same with reference to the CALM /WAVE
initiative (See previous description of CALM).
+ 4. Q-FREE’S OFFERING > FROM PRODUCT SUPPLY TO TURNKEY SOLUTIONS
As mentioned above Q-Free will take responsibility for the supply of products/technology to
deliver turnkey systems.
1) SYSTEM/TURNKEY SOLUTIONS
Q-Free’s engineers have twenty-fi ve years of experience in the design, build and operation
of complex road user charging systems. During this time, Q-Free has developed, built and
maintained a broad range of different schemes, ranging from barrier controlled lanes to multi-
lane free fl ow systems. The solutions designed by Q-Free’s engineers have also been utilising
all different types of vehicle classifi cation known and a vast range of different payment meth-
ods. This means that our engineering staff is able to choose the right product mix for each
implementation, always keeping focus on the highest return on investment.
2) BACK OFFICE SYSTEMS
A road user charging system can be seen as a system where the peripheral sensors and
the control stations collect information and where the processing of the data collected takes
place in a centrally controlled environment, often referred to as the back offi ce system.
Q-Free has since the early ‘90s delivered a large number of such systems to customers
world-wide. Q-Free’s current base of back offi ce systems are found in Portugal, Slovakia,
Norway, Australia, Thailand and Iceland. These solutions offer custom designed payment
arrangements and support all known varieties of subscription schemes, such as prepaid,
post-paid and different discount schemes. The back offi ce systems of Q-Free currently han-
dle in excess of two million payment transactions every day.
3) DEDICATED SHORT RANGE COMMUNICATION (DSRC)
Q-Free was among the leading partners for the development of the CEN DSRC standards,
securing common product interfaces for invehicle equipment and roadside communications
equipment. Q-Free has today a range of products supporting the CEN DSRC standards. Dur-
( BUSINESS REVIEW )
1.
> Q-FREE’S NEW DSRC PORTFOLIO
1. TAG
2. READER
2.
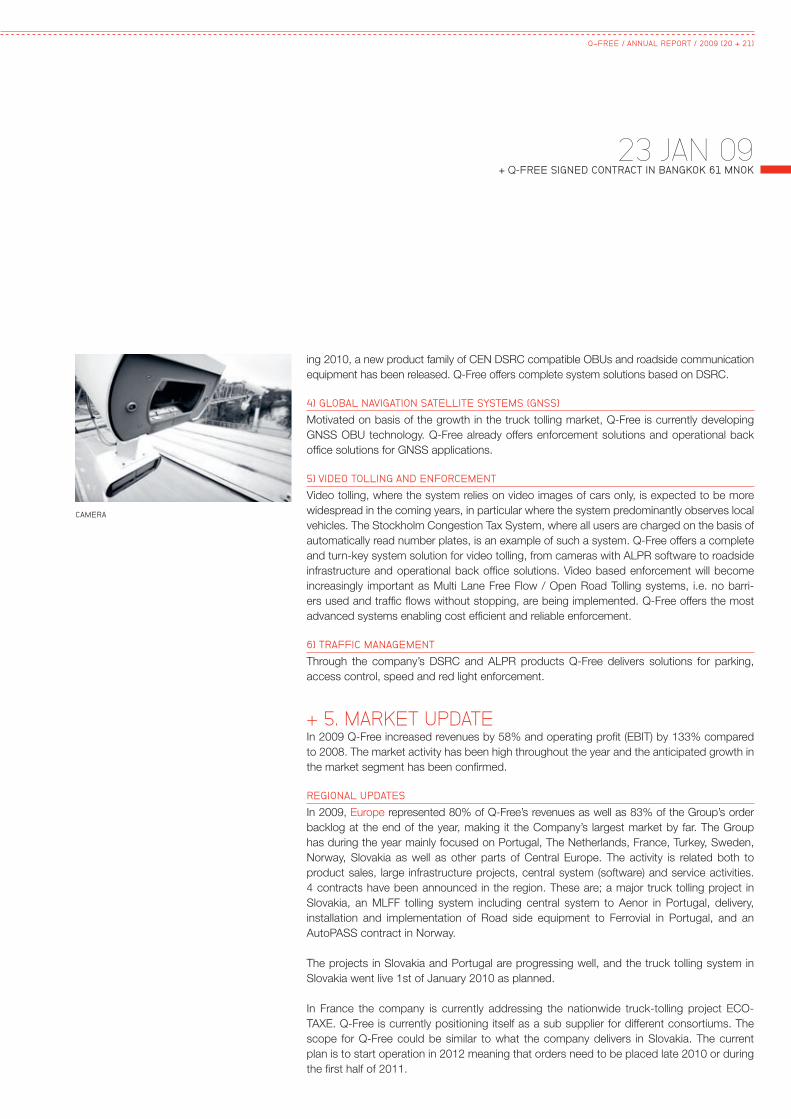
23 JAN 09+ Q-FREE SIGNED CONTRACT IN BANGKOK 61 MNOK
ing 2010, a new product family of CEN DSRC compatible OBUs and roadside communication
equipment has been released. Q-Free offers complete system solutions based on DSRC.
4) GLOBAL NAVIGATION SATELLITE SYSTEMS (GNSS)
Motivated on basis of the growth in the truck tolling market, Q-Free is currently developing
GNSS OBU technology. Q-Free already offers enforcement solutions and operational back
offi ce solutions for GNSS applications.
5) VIDEO TOLLING AND ENFORCEMENT
Video tolling, where the system relies on video images of cars only, is expected to be more
widespread in the coming years, in particular where the system predominantly observes local
vehicles. The Stockholm Congestion Tax System, where all users are charged on the basis of
automatically read number plates, is an example of such a system. Q-Free offers a complete
and turn-key system solution for video tolling, from cameras with ALPR software to roadside
infrastructure and operational back offi ce solutions. Video based enforcement will become
increasingly important as Multi Lane Free Flow / Open Road Tolling systems, i.e. no barri-
ers used and traffi c fl ows without stopping, are being implemented. Q-Free offers the most
advanced systems enabling cost effi cient and reliable enforcement.
6) TRAFFIC MANAGEMENT
Through the company’s DSRC and ALPR products Q-Free delivers solutions for parking,
access control, speed and red light enforcement.
+ 5. MARKET UPDATEIn 2009 Q-Free increased revenues by 58% and operating profi t (EBIT) by 133% compared
to 2008. The market activity has been high throughout the year and the anticipated growth in
the market segment has been confi rmed.
REGIONAL UPDATES
In 2009, Europe represented 80% of Q-Free’s revenues as well as 83% of the Group’s order
backlog at the end of the year, making it the Company’s largest market by far. The Group
has during the year mainly focused on Portugal, The Netherlands, France, Turkey, Sweden,
Norway, Slovakia as well as other parts of Central Europe. The activity is related both to
product sales, large infrastructure projects, central system (software) and service activities.
4 contracts have been announced in the region. These are; a major truck tolling project in
Slovakia, an MLFF tolling system including central system to Aenor in Portugal, delivery,
installation and implementation of Road side equipment to Ferrovial in Portugal, and an
AutoPASS contract in Norway.
The projects in Slovakia and Portugal are progressing well, and the truck tolling system in
Slovakia went live 1st of January 2010 as planned.
In France the company is currently addressing the nationwide truck-tolling project ECO-
TAXE. Q-Free is currently positioning itself as a sub supplier for different consortiums. The
scope for Q-Free could be similar to what the company delivers in Slovakia. The current
plan is to start operation in 2012 meaning that orders need to be placed late 2010 or during
the fi rst half of 2011.
Q-FREE / ANNUAL REPORT / 2009 (20 + 21)
CAMERA

Both Slovenia and Poland are currently
planning for a Request for Quotation (RFQ)
process and Q-Free will actively pursue both
opportunities, – either as a consortium mem-
ber or as a subsupplier. It is expected that
Poland will materialise at the end of 2010
and Slovenia in the fi rst half of 2011. Further,
in the Czech Republic, a Congestion Charg-
ing project is being planned, as well as an
extension of the existing highway truck toll-
ing scheme to also include private cars. The
timing is still uncertain but a bidding process
is expected to be initiated in 2010.
The Netherlands has throughout 2009 been
planning a nationwide “pay as you drive”
scheme for all cars based on GNSS. The
planned scheme is still under discussion
but due to the political situation it is highly
unlikely that this project will materialise in the
near future.
Portugal has been an area of high activ-
ity during the year, both when it comes to
project execution and new sales opportu-
nities. Q-Free has been awarded the only
two MLFF projects related to conversion
of shadow tolling concessions (SCUTs) in
Portugal (Cintra and Aenor/Ascendi). The
project implementation has been success-
ful and Q-Free expects to complete the
projects in the beginning of 2010. Start of
operation will however be dependent of a
political decision to start conversion from
shadow tolling to real tolling, and is currently
expected to happen in the fi rst half of 2010.
Recently the Portuguese government has
decided to increase the number of SCUTs
that will be transformed into real tolls. The
next sale opportunities will most likely be
Algarve (Cintra/Ferrovial) and A25 (Ascendi).
It is still unclear whether these will happen
in 2010 or 2011 but most likely a decision
will not be taken before 2011. In Portugal the
government is also planning to implement a
system for electronic license plates (ERI) for
all vehicles, and the entity responsible for
the scheme has been established. Due to
changes in the political situation, the project
is most likely delayed. The situation should
be clarifi ed within the summer of 2010. The
continuing conversion of SCUT’s to real toll-
ing and the ERI project represent a huge
opportunities for sale of tags.
In Norway there are relatively frequently
deployed smaller and medium sized Auto-
PASS infrastructure projects, also leading
to an increased tag demand and central
system services. As an example, the central
system service Q-Free is delivering to the toll
operators in Norway, has increased in value
since initial contract was awarded from 70
MNOK to 220 MNOK. When it comes to
AutoPASS infrastructure, the next opportu-
nity is to deliver new automated toll stations
for Kristiansand.
The visibility of market opportunities in Swe-
den are increasing. A new congestion charg-
ing scheme, similar to the one in Stockholm,
is expected to materialise in Gothenburg.
Timing is still uncertain but it is assumed that
start up will be in 2013, and hence orders will
be placed in the end of 2011. Also electronic
road tolling will start to be implemented for
infrastructure fi nancing in the same manner
as in Norway. This will in the years to come
represent an even bigger market than in
Norway.
Finland is considering introducing some form
of congestion charging. The City of Helsinki
Board has voted eight to six in favour of intro-
ducing congestion charges for the Finnish
capital.
In Africa Q-Free has during the year posi-
tioned itself for an upcoming tag tender to
be issued by Sanral. The estimated demand
over a 2-3 years period is approximately 3
million tags. It is expected that three vendors
will be pre-qualifi ed, – Q-Free being one of
them. The RFQ for tags will most likely be
issued during the fi rst half of 2010. The
electronic tolling market in South Africa will
increase over the years to come, both when
it comes to new infrastructure projects and
tags. Q-Free will strengthen its presence in
this market going forward.
In 2009, Asia Pacifi c represented 13% of
Q-Free’s revenues as well as 10% of the
Group’s order backlog at the year-end. The
company announced three contracts in the
region during the year. One contract from
BECL for modernisation of exisiting toll roads
in Bangkok Thailand (61 MNOK), and two
tag contracts to RTA in Australia (47 MNOK).
The activity in the region is mainly related to
Thailand, Australia and Indonesia, but new
opportunities in Taiwan, Vietnam and India
are identifi ed.
The most mature market in the region is
Australia, – both new tag order opportunities
and new infrastructure projects will material-
ise in the coming quarters.
The execution of the two ongoing projects in
Bangkok are progressing well and ETA has
now started operating both the new manual
and electronic system delivered by Q-Free.
The need for effi cient tolling systems in Thai-
land is evident, and the company expects
new projects to materialise. Over time the
introduction of electronic tolling systems will
trigger an attractive tag market.
The activity in Indonesia is picking up. The
company is at the moment exploring oppor-
tunities both related to congestion charg-
ing in Jakarta and other electronic tolling
projects in the country.
Latin and North America represented 7% of
Q-Free’s revenues and 7% of the Group’s
order backlog. During the year the company
has announced 3 contracts in the region at
a total value of 96 MNOK. All awards from
Centro Gestao Meios de Pagto (CGMP) for
OBUs.
It is expected that the tag demand in Brazil
will continue to be high going forward, - the
company announced in Q110 a new frame
agreement at a value of 109 MNOK.
The electronic license plate project in Brazil
still remains in a defi nition phase and as such
timing of this project is uncertain. Further the
company is addressing projects and product
sales in Chile, Columbia and Ecuador.
In North America the company is exploring
several business opportunities through the
companies ALPR solutions. The company’s
ALPR solution has over the past two years
been established as the leading solution in
the market and forms a good basis for fur-
ther expansion in the North America.
Video based solutions for enforcement and
interoperability will become increasingly
important in North America as Multi Lane Free
Flow / Open Road Tolling systems, i.e. no
barriers used and traffi c fl ows without stop-
ping, are being implemented. Q-Free offers
the most advanced systems enabling cost
effective and reliable enforcement and tolling.
+ 6. OUTLOOK The vision of Q-Free is to be a globally pre-
ferred partner in the area of Intelligent Trans-
port Systems having world-wide leadership
in Road User Charging and Traffi c Manage-
ment.
( BUSINESS REVIEW )

Q-Free’s ultimate and long term goal is to be the preferred provider independent of techno-
logy and solution the customers are looking for.
The global ITS market is expected to grow considerably over the next years and Q-Free’s
market position is continuously strengthening. Our strategic positioning has been well
received by existing and new customers and partners. During 2009 the company achieved
all time high order intake of above 1 BNOK.
> THE MOST IMPORTANT APPLICATION AREAS IN THE RUC SEGMENT ARE CURRENTLY
+ FULLY AUTOMATED FREE FLOW ELECTRONIC TOLL COLLECTION
+ TRUCK TOLLING
+ CONGESTION CHARGING.
> Q-FREE HAS RELATIVELY RECENTLY EXECUTED, OR ARE CURRENTLY EXECUTING, THE
MOST SIGNIFICANT AND ADVANCED PROJECTS IN ALL THESE THREE APPLICATION AREAS
THROUGH THE EXECUTION OF
+ THE AENOR/ PORTUGAL PROJECT
+ SKYTOLL/SLOVAKIA PROJECT
+ STOCKHOLM PROJECT
This forms a strong basis for exploring similar cases going forward and combined with con-
tinuous focus on improving both offering and execution, this will secure long term positive
development of the company.
From the above regional market report it is clear that 2010 will be an important year to posi-
tion the company for many bigger infrastructure projects going forward. Some of them
maybe concluded in late 2010 but the majority probably in 2011. Further there are several
small/medium sized projects currently being addressed and the product pipeline for 2010
shows some promising opportunities. Addressing these opportunities on the bases of a new
state of the art portfolio, will form a good basis for success.
Q-Free completed a private placement for a total of 5,100,000 new shares during the fourth
quarter 2009. The private placement was signifi cantly over-subscribed. Net proceeds from
the private placement will be applied towards strengthening of Q-Free’s balance sheet in
order to be able to take advantage of potential M&A opportunities.
25 JAN 09+ Q-FREE TO DELIVER SYSTEMS IN SLOVAKIA
Q-FREE / ANNUAL REPORT / 2009 (22 + 23)
SERVICE AND
MAINTENANCE
ON SITE >
ALPR
DSRC

Q-FREE IS
A TECHNOLOGY
INDEPENDENT
SOLUTION
PROVIDER
+
24 + 25
MTC
GNSS
RFID
>> IN ORDER TO BE A TRUE GLOBAL SUPPLIER Q-FREE CONSIDERS
A BROAD PORTFOLIO COVERING THE MAIN RUC TECHNOLOGIES TO
BE A NECESSITY. Q-FREE’S ULTIMATE AND LONG TERM GOAL IS TO
BE A PREFERRED SUPPLIER INDEPENDENT OF WHICH TECHNOLOGY
AND SOLUTION THE CUSTOMERS ARE LOOKING FOR.
PART 3. GOVERNANCE & REPORTING

CORPORATE GOVERNANCE
Q-Free aims to protect and enhance shareholders’ investments through profi table, sustain-
able business activities. Good corporate governance is intended to maximise added value
and decrease business risks, at the same time as the Group’s resources are to be utilised in
an effi cient, sustainable manner. The value added should benefi t shareholders, employees
and the community. Q-Free is listed on the Oslo Stock Exchange and is subject to Norwe-
gian securities legislation and stock exchange regulations.
Stock exchange regulations require listed companies to publish a report on their principles
for Corporate Governance in the Annual Report, in accordance with Section 1 of the Nor-
wegian Code of Practice for Corporate Governance, version dated 21st of October 2009.
Q-Free ASA endeavours to comply with these recommendations. Where the Company dif-
fers from the Code of Practice, an explanation or comment is given.
The description is structured in accordance with the Code of Practice. As recommended,
a greater degree of detail is provided on certain points.
CORPORATE GOVERNANCE AT Q-FREE
Owners Board Management
Shareholders Board CEO
General Meeting Compensation Commitee Corporate Management
Nominating Commitee Audit Committee
The General Meeting elects 3–8
shareholders’ representatives to
the Board based on nominati-
ons from the Nominating Com-
mittee. Two-year terms of offi ce.
Ultimate resonsibility for strategy
and management of the com-
pany. Advice regarding and over-
sight of routine management.
Executive management.
( GOVERNANCE & REPORTING / CORPORATE GOVERNANCE )
1. IMPLEMENTATION OF AND REPORTING ON CORPORATE GOVERNANCE
Q-Free ASA considers Corporate Govern-
ance to be the principles and guidelines
that determine how the Company is man-
aged and defi nes the relationship between
the shareholders, the Board of Directors and
the executive management of the Company.
These principles and guidelines are estab-
lished to protect the interests of sharehold-
ers, as well as other stakeholders such as
employees, customers and suppliers. The
topic of Corporate Governance is subject
to annual reviews and discussions by the
corporate Board of Directors. The Group’s
governance documents are reviewed and
revised annually and the text for this chapter
of the annual report is reviewed in detail.
CODE OF CONDUCT
Q-Free is a world leading vendor of Road
User Charging (RUC) and Traffi c Surveillance
products and systems having applications
mainly within electronic toll collection for
road fi nancing, congestion charging, truck-
tolling, law enforcement and parking/access
control. Q-Free operates worldwide and its
operations are characterised by high ethical
standards. The Company plans to be the
market leader by having a customer oriented
offering, through excellence in execution and
by trustworthy behaviour.
Q-Free has a Code of Conduct (COC) which
is approved by the Board of Directors. The
COC gives guidelines on how to behave
both internally and externally. COC stimu-
lates ethical awareness and is a guideline for
everyday actions.
The COC applies to all members of the
Board of Directors, managers, and all other
employees and representatives of Q-Free
(“employees”). The Company endeavours to
make these guidelines known to its custom-
ers, suppliers and partners. All managers are
responsible for the COC being known, fol-
lowed, and that actions are taken if codes
are broken. Each employee has a responsi-
bility to read and follow the COC.
Violation of the COC will be subject to disci-
plinary action including possible termination
as well as potential criminal prosecution.
In situations where the employee is aware
of any infringement of the COC he/she shall
raise the issue with his/her manager. If this
is diffi cult, the employee shall report the
infringement directly to the HR responsible of
Q-Free ASA. Incidents may also be reported
anonymously if desired.
Deviation from the Code of Practice: None.
2. BUSINESSQ-Free ASA operates an international busi-
ness based on delivering systems and prod-
ucts for Road User Charging and Traffi c
Management. – The Company’s Articles of
Association are in compliance with the Code
of Practice’s recommendation with regards
to a clearly defi ned business activity.
“The Company’s objective is to be engaged
in research, development, production, oper-
ation and sales of information technology
products and systems and everything else in
this connection.”
The Group’s objectives and principal strat-
egies are described in the business review
section of the annual report.
Deviation from the Code of Practice: None.
3. EQUITY AND DIVIDENDS
Q-Free’s policy is to maintain a high equity
ratio to provide a platform for the Company’s
future expansion and growth. Based on this
assumption, Q-Free ASA does not expect
any dividends to be distributed to the share-
holders in the next years to come.
Deviation from the Code of Practice: None.
AUTHORISATION TO THE BOARD OF
DIRECTORS TO ACQUIRE THE COMPANY’S
OWN SHARES (TREASURY SHARES)
The Board of Directors was given an authori-
sation at the Annual General Meeting (AGM)
on the 18th of May 2009 to acquire shares
in Q-Free ASA with a nominal value of up to
NOK 2,051,095.98 divided on 5,397,621
shares, each with a par value of NOK 0.38,
provided that the Company’s shareholding of
own shares shall not exceed 10% of shares
outstanding at any given time. The minimum
and maximum amount that can be paid per
share will be NOK 1 and NOK 100 respec-
tively. The Board of Directors shall have full
discretion with respect to methods of acqui-
sition and disposal of the Company’s shares.
The authorisation shall be valid until the next
AGM, but no longer than 30 June 2010.
Deviation from the Code of Practice: None.
AUTHORISATION TO THE BOARD
OF DIRECTORS TO INCREASE
THE SHARE CAPITAL
Based on the need to secure necessary
fi nancial fl exibility in connection with possi-
ble acquisitions, share offerings, mergers or
other actions within the ITS (Intelligent Traffi c
Systems) sector, the Board of Directors was
given an authorisation from the General
Meeting to increase the share capital by the
issuance of new shares.
The Board of Directors was given an authori-
sation at the AGM on the 18th of May 2009
to increase the share capital with as much
as NOK 2,051,095.98 by the issue of up to
5,397,621 shares (representing 10% of the
registered share capital at the date of the
AGM), each with a par value of NOK 0.38.
The authority comprises right to disregard
the existing shareholders preferential rights
according to the Public Limited Companies
Act sections 10-4 and 10-5, to determine
that non-cash share deposits shall be made,
to subject the Company to special obliga-
tions pursuant to section 10-2 of the Public
Limited Companies Act, and to implement
mergers according to the Public Limited
Companies Act section 13-5. The Board of
Directors are authorized to determine the
terms and conditions for the subscription of
shares, and to amend the Company’s articles
of association in compliance with the increase
of the share capital at all times. The authorisa-
tion shall be valid until the AGM in two years,
but no longer than 18th of May 2011.
Deviation from the Code of Practice:
The mandate applies from the 18th of May
2009 and for a period of two years, which
departs from the Norwegian Code of Prac-
tice for Corporate Governance – recom-
mending that such mandates should be
given for a time period of maximum one
year. Q-Free follows the Norwegian Pub-
lic Limited Companies Act’s regulations for
this mandate. It is the Board’s opinion that
if Q-Free were to follow the recommenda-
tion, the Company may be unnecessary
and inconveniently constrained to short
term agreements in connection with possi-
ble acquisitions, share offerings, mergers or
other actions within the ITS markets. (Intel-
ligent Traffi c Systems)
Q-FREE / ANNUAL REPORT / 2009 (26 + 27)

AUTHORISATION TO THE BOARD OF
DIRECTORS REGARDING SHARE CAPITAL
INCREASE
The Board of Directors was authorised
on the AGM on the 18th of May 2009 to
increase the share capital of the Company by
issuing new shares to key personnel (incen-
tive program). The share capital may be
increased by a maximum of NOK 1,026,000,
by issuing a maximum of 2,700,000 shares
(representing approximately 5% of the regis-
tered share capital at the date of the AGM),
through one or more private placements with
cash deposits towards key personnel, man-
agement and Board members elected by
the shareholders of Q-Free ASA. The Board
is authorised to waive the shareholders’
rights of pre-emption according to the Public
Limited Companies Act, Sections 10-4 and
10-5. The authorisation runs for a period of
3 years for key personnel and management,
and 2 years for shareholder elected Board
members. A maximum of 600,000 shares
are reserved for shareholder elected Board
members, and the remaining 2,100,000
shares are reserved for the share options
scheme for key personnel and management.
See note 14 in the 2009 fi nancial statements
for further information about the incentive
program.
Deviation from the Code of Practice: None
4. EQUAL TREATMENT OF SHAREHOLDERS AND TRANSACTIONS WITH CLOSE ASSOCIATESQ-Free ASA has only one class of shares
and there are no voting restrictions. The
Board of Directors has no intention of putting
forward any proposals to the General Meet-
ing concerning voting restrictions.
An increase in the Company’s capital
might be proposed if the Board of Direc-
tors decides that this would best take care
of shareholders’ long-term interests. If pos-
sible, the Board of Directors will propose
a share issue to existing shareholders in
accordance with their preferential rights. The
Board’s mandate to acquire own shares is
based on the assumption that acquisition will
take place on the market. Acquired shares
may be disposed on the market, as payment
for acquisitions. The Board of Directors is
authorised to increase the share capital of
the Company by issuing new shares to key
personnel (incentive program), and is author-
ised to waive shareholders’ preferential
rights, in favour of key personnel in this pro-
gram. The introduction of an incentive pro-
gram is considered to be in the best interest
of the shareholders and is explained in the
agenda for the General Meeting.
The Company’s policy on transactions with
close associates is based on the require-
ment that any transactions must be at arm’s
length principle and at market prices. Where
possible, the Company has arranged for
a valuation obtained from an independent
third party.
See note 24 in the 2009 fi nancial statements
for more information about transactions with
related parties.
The Company has guidelines (Corporate
Code of Conduct, cf. section 1 above in this
report) to ensure that members of the Board
of Directors and the executive management
notify the Board if they have any material
direct or indirect interest in any transaction
entered into by the Company.
Deviation from the Code of Practice: None
5. FREELY NEGOTIABLE SHARES
Q-Free ASA has no form of restriction con-
cerning freely negotiable shares. The Board
of Directors has no intention of putting for-
ward any proposals to the General Meeting
concerning restrictions on freely negotiable
shares. The Articles of Association place no
restrictions on negotiability.
Deviation from the Code of Practice: None
6. GENERAL MEETINGSThe Board of Directors ensures that as many
shareholders as possible may exercise their
rights by participating in General Meetings of
the company. By virtue of the AGM the share-
holders are guaranteed participation in the
Group’s supreme governing body. The AGM
adopts the Articles of Association. Sharehold-
ers representing at least 5% of the shares can
call for extraordinary General Meetings.
The General Meeting is the Company’s
supreme body, and elects the members of
the Board and the Chairman of the Board.
An AGM will ordinarily be held before 1st of
June each year. The 2010 AGM is scheduled
for the 20th of May.
The Board of Directors and the management
of the Company seek to facilitate the largest
possible attendance at the General Meeting.
In 2009, the Annual General Meeting was
held on the 18th of May and shareholders
representing 69.31% of the share capital
attended in person or by power of attorney.
The Board of Directors has no intention of
putting forward any signifi cant proposals to
the General Meeting concerning changes in
the voting procedures.
Notice call of the meeting and the support
information on the resolutions to be consid-
ered at the General Meeting, including the
recommendations of the Nomination Com-
mittee, is available on the company’s web-
site no later than 21 days prior to the date of
the General Meeting.
The call for the General Meeting is issued in
writing via mail to all shareholders with reg-
istered address. To register for the General
Meeting a shareholder must submit a con-
fi rmation in writing via mail, fax, or e-mail
(provided the registration form is a scanned
document with signature).
The agenda for the General Meeting includes
detailed information on the resolution to be
considered and the recommendation from
the Nomination Committee.
The Company’s Articles of Association regu-
late the notice period. Shareholders them-
selves, or represented by legal representative,
planning to participate at the General Meet-
ing, shall notify the Company within a dead-
line set by the Board of Directors in the notice.
The deadline cannot expire earlier than fi ve
days before the date of the General Meeting.
The agenda at the AGM ensures that the
shareholders attending may vote for the
chairman for the General Meeting.
Shareholders who cannot attend the meet-
ing are given the opportunity to vote. Instruc-
tions are given in the call for AGM. To vote
at the General Meeting, a shareholder must
attend or give a power of attorney to some-
one who is attending. A power of attorney
will only be accepted if submitted by post,
fax, or e-mail (provided the power of attor-
ney is a scanned document with signature).
It is not possible to vote via the Internet or
any other way.
( GOVERNANCE & REPORTING / CORPORATE GOVERNANCE )
The company nominates a person who will be available to vote on behalf of shareholders as
their proxy.
Deviation from the Code of Practice:
There are two deviations on this point.
The fi rst deviation relates to the Board and Nomination Committee’s participation at the
AGM. The entire Board or Nomination Committee has not usually attended the AGM. The
Chairman of the Board is however always present to respond to any questions. The Chair-
man of the Board and the Chairman of the Nomination Committee assess on a case by case
basis, based on the agenda of the AGM, whether all members should participate.
The second deviation is that the proxy form does not open for separate voting instructions
for each matter to be considered by the meeting and for each of the candidates nominated
for election. Q-Free follows the Code of Practise’s recommendation at the AGM in 2010.
7. NOMINATION COMMITTEEThe Company has a Nomination Committee, and the General Meeting elects the Chairperson
and members of the Nomination Committee and determines the committee’s remuneration.
The Nomination Committee is laid down in the Company’s articles of association.
The Nomination Committee consists of three members who are shareholders or representa-
tives acting on behalf of shareholders. Members of the Nomination Committee are elected
for a period of two years.
The Board’s proposal for instruction for the Nomination Committee was unanimously
approved at the AGM in 2008.
THE TASKS OF THE NOMINATION COMMITTEE ARE:
A) to submit a recommendation to the General Meeting regarding shareholder elected mem-
bers of the Board, including the Chairman of the Board, when these are up for election or
in case of a by election. The Board of Directors elects its own deputy chairman from and
amongst the elected Board members;
B) to ensure that the Board of directors make an annual self evaluation of their work and
competence;
C) to propose directors’ remuneration, including remuneration of sub-committees of the
Board;
D) to submit its recommendation to the General Meeting regarding election of members to
the Nomination Committee, including the Chairman of the Nomination Committee.
Q-Free is not aware of the existence of any agreements or business partnerships between
the Company and any third parties in which members of its Nomination Committee have
direct or indirect interests. The composition of the Nomination Committee is such as to main-
tain its independence from the Company’s management.
Information on the Nominating Committee, a form for nominating candidates for the Board
and the deadlines are available on the Group’s website at www.q-free.com.
Prior to the AGM a meeting is held with the Chairman of the Board to review the Board’s
evaluation of its own work. Two of the Board members and one of the Nomination Commit-
tee members are up for election in 2010.
Q-FREE / ANNUAL REPORT / 2009 (28 + 29)

Nomination Committee as at 31st of December 2009:
Name Company Shares Share options For election
Cecilie Johnsen Redback AS /Harburg AS 40,000 0 2010
Harald Arnet Datum AS/ Wega AS 0 0 2011
Petter Fjellstad
Partner and investor in
Grand Haven Capital 240,000 0 2011
Deviation from the Code of Practice: None
8. CORPORATE ASSEMBLY AND BOARD OF DIRECTORS
COMPOSITION AND INDEPENDENCE
The Company is not required to have a corporate assembly, according to Norwegian law.
The members of the Board are elected for a period of two years, and the Board currently has
seven members. Two directors are elected directly by and amongst the Group’s employees.
Directors are elected for two-year terms and can be re-elected. The Chairman of the Board
is elected by the General Meeting. The Deputy Chairman is elected by the Board of Directors
for a period of one year. In the event that the Chairman is absent or legally incompetent to
chair, the meeting will be chaired by the Deputy Chairman. The Company’s executive man-
agement is not represented on the Board of Directors.
Q-Free is not aware of the existence of any agreements or business partnerships between
the Company and any third parties in which its directors have direct or indirect interests.
The composition of the Board is such as to maintain its independence from the Company’s
management.
The share option agreement for Board members regulates an obliged share purchase of a
minimum of 25% of the net income of the exercised share options.
The female representation among shareholder-elected Board members is 40%, which is
within the minimum target according to Norwegian law.
(See following page for presentation of the Board of Directors.)
22 JUN 09+ TAG FRAME AGREEMENT IN BRAZIL 100 MNOK
( GOVERNANCE & REPORTING / CORPORATE GOVERNANCE )

THE BOARD OF DIRECTORS AS AT 31ST OF DECEMBER 2009
Name Position, biographical data and competence Service since Elected untilShareholding
in Q-Free ASA
OLE JØRGEN FREDRIKSEN
(born 1950)
Ole Jørgen Fredriksen has over 25 years experience in the
computer hardware and software industry. He was one
of the co-founders and the President and CEO of ASK,
subsequently Proxima and InFocus, the leading global
projector Company.
2002 2011 Shares: 168,884
Options: 200,000
CHRISTIAN ALBECH
(born 1947)
Christian Albech has substantial experience in the informa-
tion and media industries. He heads Telenor Broadcast’s
operational activities, which consist of Canal Digital, Nor-
kring, Conax and Telenor Satellite Broadcasting. Christian
Albech comes from the position as Senior Vice President
of Telenor Broadcast and has extensive experience from
Telenor’s TV activities.
Albech has previously headed Telenor’s cable TV activities,
and was hired as Head of Canal Digital’s forerunner CTV. Mr
Albech has widespread experience of board management.
2003 2011 Shares: 0
Options: 100,000
MIMI KRISTINE BERDAL
(born 1959)
Mimi K. Berdal has a law degree from the University of Oslo,
and runs her own law and consultancy fi rm, focusing on the
areas of contract law, Company/commercial law, transac-
tions and securities trading. From 1991-2005, Berdal was
a partner at the law fi rm Arntzen de Besche. Berdal has
extensive experience from work as a Board Member.
2007 2011 Shares: 50,000
Options: 100,000
TORILD SKOGSHOLM
(born 1959)
Torild Skogsholm is the Managing Director of Oslo Spor-
vognsdrift AS. She has a post master degree of economics
from the Univ. of Oslo.From 2001-2005, Mrs Skogsholm
was the Minister for Transport and Communications. She
has also held position as State Secretary (Junior Minister) at
the same ministry. She has experience from NetCom, as well
as a civil servant at the Ministry of Transport and Communi-
cations and at the Ministry of Environment
2006 2010 Shares: 0
Options: 100,000
JAN PIHL GRIMNES
(born 1961)
Jan Pihl Grimnes is through his Company Redback AS
investing in the IT, petroleum and mining industries. He
holds 2,64% of the shares in Q-Free ASA. Grimnes founded
Technoguide AS, and holds several board positions both
in listed and non-listed companies. Grimnes holds an MBA
from the Norwegian School of Economics and Business
Administration and a MSc from the Norwegian University of
Science and Technology.
2008 2010 Shares: 1,545,000
Options: 100,000
ANDERS HAGEN
(born 1964)
Mr Hagen holds an MSc in electrical engineering and is
heading the Innovation Team at the R&D department. Mr
Hagen has been working in the Q-Free Group since 1992.
2006 2010 Shares: 0
Options: 0
SISSEL LILLEVIK LARSEN
(born 1961)
Mrs Lillevik Larsen has been with Q-Free ASA since 2000
and holds the position as Technical project manager.
2008 2010 Shares: 0
Options: 0
Q-FREE / ANNUAL REPORT / 2009 (30 + 31)
9. THE WORK OF THE BOARD OF DIRECTORSThe Board of Directors produces an annual plan for its work, with particular emphasis on
objectives, strategy and implementation.
After the Annual General Meeting, the Board of Directors makes a plan for its work in the com-
ing year, specifying numbers of meetings and items to be discussed in each meeting. This
includes reviewing the overall strategy at least once a year, preparing the budget for the next
year, evaluating management and competence needed, making continuous fi nancial reviews
and risk assessments based on budgets and prognoses, as well as evaluating the work of the
Board of Directors. The Board held 16 meetings in 2009.
The Board of Directors is elected by the shareholders to oversee the executive management
and to assure that the long-term interests of the shareholders and other stakeholders are
being served. The Board of Directors has the ultimate responsibility for the management of
the Company and for supervising its day-to- day business and activities in general. The main
responsibility is to determine the Company’s overall vision, goal and strategy. The Board of
Directors also ensures that the activities are soundly organised and keeps itself informed
about the fi nancial situation of the Company, and ensure that the management handles risks
faced by the Company in an appropriate way. The Group’s activities are varied, depend-
ing on each unit’s position in the value chain, and consequently require differentiated ways
of management and follow-up. Internal management systems that are well functioning are
essential, but these must be continuously developed in order to accommodate changes in
fi nancial conditions. The Group’s structure with independent units, also in respect of short
term reporting, facilitates good control and powerful focusing. The internal control is based
on monthly reports specifi ed on regions, units and divisions, while at the same time providing
satisfactory reporting on group level.
The Group also has a separate accounting and fi nance department responsible for preparing
guidelines for internal control, risk management and fi nancial reporting. The Group’s account-
ing and fi nance department ensures that the Company adheres to applicable rules and that the
Board’s strategy, fi scal restrictions and ethical principles, is followed.
The Board of Directors has issued instructions for its own work as well as for the execu-
tive management with particular emphasis on clear internal allocation of responsibilities and
duties.
The guidelines for the Board of Directors are described in the Company’s “Instructions for the
Board of Q-Free ASA”. The purpose of the instruction is to describe the role and functions of
the Board and the interaction with the executive management of the Company. The instruc-
tions for the Board of Directors also include detailed requirements on which information and
timing of the information from the executive management.
In order to ensure a more independent consideration of matters of a material charac-
ter in which the Chairman of the Board is, or has been, personally involved, upon the
Board’s consideration of such matters, the meeting is chaired by the deputy chairman.
The deputy chairman is elected by the Board of Directors annually according to the
instructions.
The Board’s proceedings and minutes are in principle confi dential unless the Board decides
otherwise or there is obviously no need for such treatment. This is pursuant to the instruc-
tions to the Board.
The Board of Directors evaluates its performance and expertise annually directly to the Nomi-
nation Committee.
17 AUG 09+ Q-FREE AWARDED A CONTRACT IN PORTUGAL 26 MNOK
( GOVERNANCE & REPORTING / CORPORATE GOVERNANCE )

COMPENSATION COMMITTEE
Three out of seven members of the Board
act as the company’s Compensation Com-
mittee, and are elected by the Board of
Directors for a period of two years.
The Board approved an instruction for the
Compensation Committee in 2006 (revised
in 2008).
The Compensation Committee makes pro-
posals to the Board regarding employment
terms and conditions and total remuneration
of the CEO and other senior management
employees. These proposals are also rel-
evant for other employees entitled to variable
salaries. Evaluation of senior management’s
achievements is based on input from the
CEO. The Board makes comparisons with
other companies when deciding the terms
and conditions and remuneration of the
CEO. The Board also delimits the scope of
the remuneration of the executive manage-
ment team.
With effect from 18th of June 2009, the Com-
pensation Committee is composed as follows:
Ole Jørgen Fredriksen (Chairman)
Christian Albech
Sissel Lillevik Larsen
AUDIT COMMITTEE
The Public Companies Act stipulates that
large companies must have an Audit Com-
mittee. Three out of seven members of the
Board act as the company’s Audit Commit-
tee, and are elected by the Board of Direc-
tors for a period of two years.
The Board approved an instruction for the
Audit Committee in 2006 (revised in 2008).
The Audit Committee’s main responsibilities
are to supervise the Company’s internal con-
trol systems and to ensure that the auditor
is independent and that the annual accounts
and quarterly reporting give a fair picture of
the Company’s fi nancial results and fi nan-
cial condition in accordance with generally
accepted accounting principles.
The Audit Committee reviews the proce-
dures for risk management and fi nancial
controls in the major areas of the Company’s
business activities. The Audit Committee
receives reports on the work of the external
auditor and the results of the audit. In addi-
tion, the committee reviews the Company’s
work on Corporate Governance.
With effect from 18th of June 2009, the audit
committee is composed as follows:
Mimi Kristine Berdal (Chairman)
Ole Jørgen Fredriksen
Torild Skogsholm
Deviation from the Code of Practice: None
10. RISK MANAGEMENT AND INTERNAL CONTROLQ-Free’s customers are public authori-
ties, private companies operating under
public licences and system integrators.
The Company’s main risk factors are politi-
cal risk, project risk and fi nancial risk. The
Board presents an in-depth review of the
Company’sfi nancial status in the Directors’
Report. It also describes the main elements
related to HSE and related risks.
Q-Free has developed an effective Quality
Management (QM) system and is certifi ed
in accordance with the NS-EN ISO-9001
Quality System. The Company’s ISO 9001
Certifi cate covers all areas of the normal
operations. Q-Free is also certifi ed accord-
ing to the ISO-14001/2004 standard, which
means that the Company has set up sys-
tems for monitoring and improving its
impact on the external environment.
The strategy is to combine estimated future
sales, based on signed contracts or frame
agreements, and purchase and hedge the
net cash fl ow in the foreign currency by
using forward/ future contracts. The risk
factors which Q-Free are subject to, are
closely monitored by the Company and
especially by the VP Business Develop-
ment & Compliance who reports directly to
the CEO of the Q-Free Group. The Board
receives quarterly “The management’s
review of the quality management sys-
tem and the environmental management
system”. Management draws up monthly
performance reports that are sent to and
reviewed by the directors.
Deviation from the Code of Practice:
The Board of Directors does not carry out
an annual review of the Company’s most
important areas of exposure to risk and its
internal control arrangements. The Audit
Committee has requested a presentation
from management of an overall risk man-
agement and internal control procedure,
to be reviewed by the Board and updated
annually. Such risk management document
shall describe the most important overall
risk factors for the Company, its operations
and fi nancial reports, and how these are
handled. The Company will establish a pro-
cedure for an annual review of risk manage-
ment and internal control during 2010.
11. REMUNERATION OF THE BOARD OF DIRECTORSThe Annual General Meeting approves the
Board’s remuneration each year.
The Chairman of the Board of Directors
receives a fi xed salary of NOK 250,000
and each shareholder elected member
receives a fi xed salary of NOK 150,000.
The Chairman of sub-committees receives
a fi xed salary of NOK 10,000 and members
NOK 7,500 for each full-day meeting. The
Board currently consists of fi ve shareholder-
elected non-executive members and two
employee elected members. The employee
representatives receive a fi xed salary of
Board member participation in meetings in 2009.
Participation in meetings in 2009 Board meetings
Compensation
Committee Audit Committee
Ole Jørgen Fredriksen 16 2 6
Christian Albech 13 2
Mimi Kristine Berdal 15 6
Torild Skogsholm 14 6
Jan Pihl Grimnes 16
Anders Hagen 16
Sissel Lillevik Larsen 16 2
Q-FREE / ANNUAL REPORT / 2009 (32 + 33)
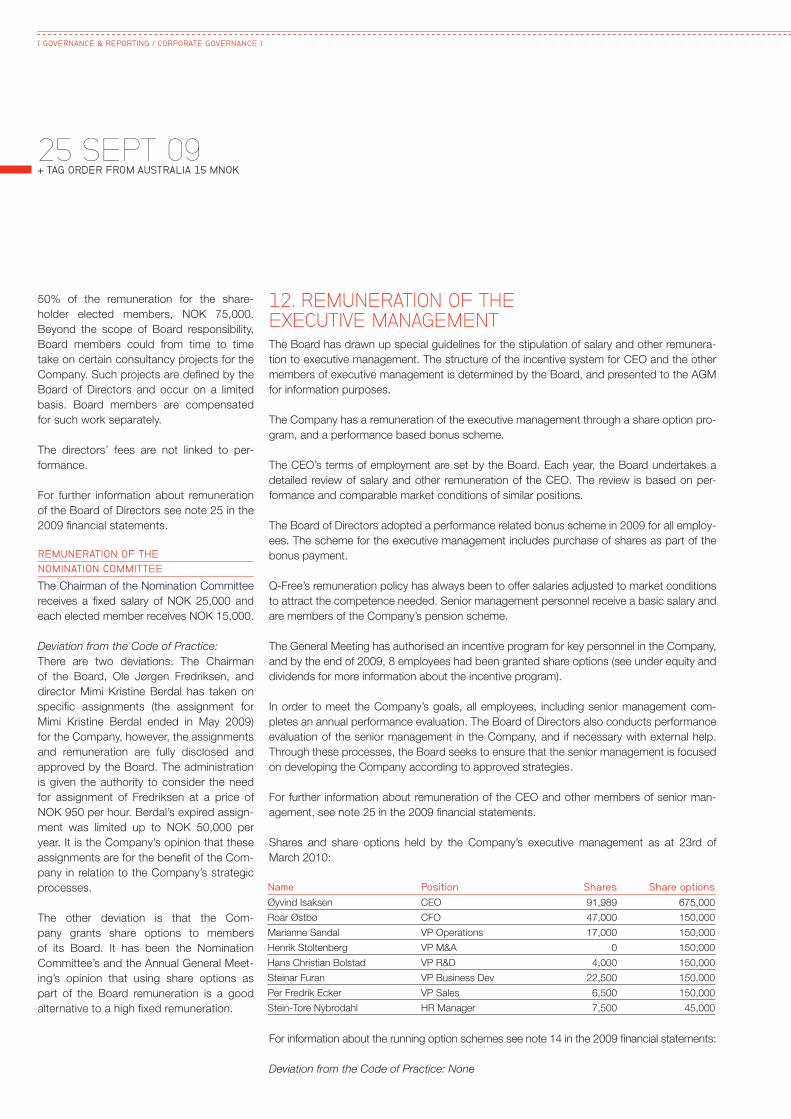
12. REMUNERATION OF THE EXECUTIVE MANAGEMENTThe Board has drawn up special guidelines for the stipulation of salary and other remunera-
tion to executive management. The structure of the incentive system for CEO and the other
members of executive management is determined by the Board, and presented to the AGM
for information purposes.
The Company has a remuneration of the executive management through a share option pro-
gram, and a performance based bonus scheme.
The CEO’s terms of employment are set by the Board. Each year, the Board undertakes a
detailed review of salary and other remuneration of the CEO. The review is based on per-
formance and comparable market conditions of similar positions.
The Board of Directors adopted a performance related bonus scheme in 2009 for all employ-
ees. The scheme for the executive management includes purchase of shares as part of the
bonus payment.
Q-Free’s remuneration policy has always been to offer salaries adjusted to market conditions
to attract the competence needed. Senior management personnel receive a basic salary and
are members of the Company’s pension scheme.
The General Meeting has authorised an incentive program for key personnel in the Company,
and by the end of 2009, 8 employees had been granted share options (see under equity and
dividends for more information about the incentive program).
In order to meet the Company’s goals, all employees, including senior management com-
pletes an annual performance evaluation. The Board of Directors also conducts performance
evaluation of the senior management in the Company, and if necessary with external help.
Through these processes, the Board seeks to ensure that the senior management is focused
on developing the Company according to approved strategies.
For further information about remuneration of the CEO and other members of senior man-
agement, see note 25 in the 2009 fi nancial statements.
Shares and share options held by the Company’s executive management as at 23rd of
March 2010:
For information about the running option schemes see note 14 in the 2009 fi nancial statements:
Deviation from the Code of Practice: None
50% of the remuneration for the share-
holder elected members, NOK 75,000.
Beyond the scope of Board responsibility,
Board members could from time to time
take on certain consultancy projects for the
Company. Such projects are defi ned by the
Board of Directors and occur on a limited
basis. Board members are compensated
for such work separately.
The directors’ fees are not linked to per-
formance.
For further information about remuneration
of the Board of Directors see note 25 in the
2009 fi nancial statements.
REMUNERATION OF THE
NOMINATION COMMITTEE
The Chairman of the Nomination Committee
receives a fi xed salary of NOK 25,000 and
each elected member receives NOK 15,000.
Deviation from the Code of Practice:
There are two deviations. The Chairman
of the Board, Ole Jørgen Fredriksen, and
director Mimi Kristine Berdal has taken on
specifi c assignments (the assignment for
Mimi Kristine Berdal ended in May 2009)
for the Company, however, the assignments
and remuneration are fully disclosed and
approved by the Board. The administration
is given the authority to consider the need
for assignment of Fredriksen at a price of
NOK 950 per hour. Berdal’s expired assign-
ment was limited up to NOK 50,000 per
year. It is the Company’s opinion that these
assignments are for the benefi t of the Com-
pany in relation to the Company’s strategic
processes.
The other deviation is that the Com-
pany grants share options to members
of its Board. It has been the Nomination
Committee’s and the Annual General Meet-
ing’s opinion that using share options as
part of the Board remuneration is a good
alternative to a high fi xed remuneration.
Name Position Shares Share options
Øyvind Isaksen CEO 91,989 675,000
Roar Østbø CFO 47,000 150,000
Marianne Sandal VP Operations 17,000 150,000
Henrik Stoltenberg VP M&A 0 150,000
Hans Christian Bolstad VP R&D 4,000 150,000
Steinar Furan VP Business Dev 22,500 150,000
Per Fredrik Ecker VP Sales 6,500 150,000
Stein-Tore Nybrodahl HR Manager 7,500 45,000
25 SEPT 09+ TAG ORDER FROM AUSTRALIA 15 MNOK
( GOVERNANCE & REPORTING / CORPORATE GOVERNANCE )

13. INFORMATION AND COMMUNICATIONQ-Free wants to maintain an open dialogue
with the capital market, and participates in
regular open presentations for investors,
analysts and others. Regular information will
be published through the Annual Report and
the quarterly reports and presentations. The
Company aims at publishing these reports
within six weeks of the end of the relevant
period, in at least three out of four quarters.
In 2009 the Company complied accordingly.
The quarterly results are also made avail-
able through webcast. Q-Free distributes all
information relevant to the share price to the
Oslo Stock Exchange. Such information is
distributed without delay and simultaneously
to the capital market, the media and on the
Company’s website.
The Company publishes all information
concerning Annual General Meetings, pub-
lication of quarterly reports and presenta-
tions on the Company’s website, as soon
as they are decided.
It is a primary goal for the Company to
maximise the shareholders’ values, in such
a way that the return on investment meas-
ured as the dividends and rise in the share
price, will be at least at the same level as
alternative investments involving similar
risk. Through the Annual Report and the
quarterly reports and presentations, the
Company will provide information on its
major value drivers and risk factors. This will
secure information for investors and make
it possible to evaluate the Company’s risk
and performance.
The CEO and CFO are responsible for the
investor relations in the Company and all
communication with the capital market,
if necessary together with the Chairman
of the Board or appointed members of
the Board. Communication with the capi-
tal market outside regular presentations is
handled by the CEO and CFO. All informa-
tion is communicated within the framework
established by securities and accounting
legislation and the rules and regulations of
the stock exchange.
All information about Q-Free ASA is avail-
able on the Company’s website:
www.q-free.com
Deviation from the Code of Practice: None
14. TAKEOVERS
The Company has no regulations in the articles of associations which limit trade in the
Q-Free shares.
Deviation from the Code of Practice:
The Board has not established regulations in the Board’s instructions on how to react to
takeover bids, but will consider establishing such a regulation in 2010.
15. AUDITORThe Company’s external auditor is appointed by the General Meeting and is responsible for
the fi nancial audit of the parent Company and Group accounts. Independent external audi-
tors have also been appointed for all subsidiaries of Q-Free ASA, including those outside
Norway.
The external auditor for Q-Free ASA submits an engagement letter to the Board each year.
The engagement letter is a plan for the audit of the Company and other information to the
Board about next year’s audit. The auditor attends at least one audit committee meeting
and Board meeting every year to present and comment on its management letter and
other reports related to the audit it has carried out. The reports contain identifi cation of
weaknesses and proposals for improvement. At least once a year, a meeting will be held
between the auditor and the Board without the presence of the CEO or other members of
executive management. The audit committee has a specifi c obligation to survey the audi-
tor’s independence and qualifi cations, and to propose candidates for external audit of the
Company to the General Meeting.
Ernst & Young has been the external auditor for Q-Free ASA for the last seven years and
carries out no other assignments for the Company which could give rise to confl ict of inter-
est. The auditor attends the General Meeting and informs about the auditor’s report and
remuneration for the year. This year’s auditor’s report follows the notes in the annual report.
The Board of Directors has initiated a bid process on external auditing services during the
spring of 2010. This process will be concluded during the Annual General Meeting through
election of auditor.
For further information about remuneration of the auditor see note 25 in the 2009 fi nancial
statements.
Deviation from the Code of Practice: None.
Q-Free Share PriceQ-Free Volume
Mai 09Mar 09 Nov 09Sep 09Jul 09 Mar 10Jan 10
Share Price
Share price development from March 2009 to March 2010
Volume (1000)
0
5
10
15
25 15 000
12 000
9 000
6 000
0
3 000
20
Q-FREE / ANNUAL REPORT / 2009 (34 + 35)

PARAGRAPH 1 The Company’s name is Q-Free ASA.
The Company shall be a public limited Company
PARAGRAPH 2 The Company’s registered offi ce is
in Trondheim, Norway.
PARAGRAPH 3 The Company’s objective is to be
engaged in research, development, production,
operation and sales of information technology
products and systems and everything else in this
connection.
PARAGRAPH 4 The share capital of the Com-
pany is NOK 22,820,554.96, distributed between
60,054,092 shares, each with a par value of NOK
0.38.
The Company’s shares shall be registered in Verdipa-
pirsentralen (The Norwegian Registry of Securities).
PARAGRAPH 5 The Board of Directors shall have
3-8 members subject to the General Meeting’s
decision.
The Board of Directors represents the Company,
and has the right to sign the Company. In addition,
the Chairman of the Board and one member of the
Board jointly have the right to sign the Company.
The Board of Directors may grant powers of pro-
curation.
PARAGRAPH 6 An Ordinary General Meeting will
be held prior to June 30th. The General Meeting
is to take place either in Trondheim Municipal or
Oslo Municipal.
The Ordinary General Meeting shall handle:
1) Pass resolution of result and balance.
2) Allocation of profi t or covering of loss in accor-
dance with the stipulated balance and distribu-
tion of dividends.
3) Election of members to the Board of Directors
and Chairman of the Board of Directors.
4) Pass resolution of remuneration for the members
of the Board.
5) Elect members to the Nomination Committee.
6) Pass resolution of remuneration for the members
of the Nomination Committee.
7) Pass resolution of the auditor’s remuneration.
8) Other cases that the Board submits in their
notice or as a shareholder wishes to address
when such is submitted at the latest 3 weeks
prior to the General Meeting.
9) Other cases that according to Law falls wit-
hin the powers of the General Meeting.
PARAGRAPH 7 The Company shall have a Nomina-
tion Committee. The Nomination Committee’s task
is to submit nomination to the General Meeting for
the election of shareholder-elected members to the
Board, and to suggest remuneration to the Board.
The Nomination Committee consists of three
members who shall be shareholders or represen-
tatives for the shareholders. The General Meeting
elects the members. The Nomination Committee
members are elected for two years at a time. The
General Meeting can pass regulations governing
the Nomination Committee.
PARAGRAPH 8 Furthermore, the Company legisla-
tion at any given time shall be applicable.
Last revised 22nd of October 2009.
TECHNICAL INFORMATION
At 31.12.09, Q-Free ASA had 60,054,092 shares,
each with a face value of NOK 0.38.
The Company had 1,654 shareholders as at
31.12.09.
The Company’s register of shareholders, cp. S.
4-4 of the Public Limited Companies Act (Nor-
way), was registered with the Norwegian Central
Securities Depository (Verdipapirsentralen –VPS) at
03.04.2002 and carries the VPS registration num-
ber ISIN NO 0003103103.
DnBNOR Bank ASA, Oslo, is the account mana-
ger. The share’s Ticker Code on the Oslo Stock
Exchange’s main list is QFR.
The Company’s enterprise number in the Register
of Business Enterprises is 935 487 242.
ARTICLES OF ASSOCIATON
Overview of historical development in share capital
Date Type of change
Face value per
share (NOK)
Change in share
capital (NOK)
Share capital after
change ( NOK)
Number of shares
issued
Number of shares
after change
03/12/2002 Status at IPO 0.05 684,713.40 2,279,163.40 13,694,268 45,583,268
02/05/2004 Exercise of options key personell 0.05 4,833.35 2,283,996.75 96,667 45,679,935
03/10/2004 Exercise of options key personell 0.05 2,500.00 2,286,496.75 50,000 45,729,935
04/20/2004 Share issue 0.05 227,500.00 2,513,996.75 4,550,000 50,279,935
05/10/2004 Exercise of options key personell 0.05 4,583.30 2,518,580.05 91,666 50,371,601
06/08/2004 Exercise of options key personell 0.05 5,966.65 2,524,546.70 119,333 50,490,934
07/26/2004 Exercise of options key personell 0.05 833.35 2,525,380.05 16,667 50,507,601
09/22/2004 Exercise of options key personell 0.05 833.35 2,526,213.40 16,667 50,524,268
10/19/2004 Exercise of options key personell 0.05 6,000.05 2,532,213.45 120,001 50,644,269
01/13/2005 Exercise of options key personell 0.05 2,666.70 2,534,880.15 53,334 50,697,603
03/17/2005 Exercise of options key personell 0.05 2,500.00 2,537,380.15 50,000 50,747,603
06/02/2005 Exercise of options key personell 0.05 500.00 2,537,880.15 10,000 50,757,603
06/23/2005 Exercise of options key personell 0.05 3,000.00 2,540,880.15 60,000 50,817,603
07/04/2005 Exercise of options key personell 0.05 1,250.00 2,542,130.15 25,000 50,842,603
07/27/2005 Exercise of options key personell 0.05 1,250.00 2,543,380.15 25,000 50,867,603
07/29/2005 Exercise of options key personell 0.05 833.30 2,544,213.45 16,666 50,884,269
09/04/2005 Exercise of options key personell 0.05 1,250.00 2,545,463.45 25,000 50,909,269
12/15/2005 Share issue 0.40 17,818,244.15 20,363,707.60 50,909,269
12/15/2005 Reduction of share capital (demerger FARA) 0.38 -1,018,185.38 19,345,522.22 50,909,269
03/30/2006 Exercise of options key personell 0.38 3,800.00 19,349,322.22 10,000 50,919,269
05/02/2006 Exercise of options key personell 0.38 258,780.00 19,608,102.22 681,000 51,600,269
05/11/2006 Exercise of options key personell 0.38 195,953.46 19,804,055.68 515,667 52,115,936
05/12/2006 Exercise of options key personell 0.38 60,166.54 19,864,222.22 158,333 52,274,269
29/08/2008 Share issue 0.38 646,738.72 20,510,960.94 1,701,944 53,976,213
18/05/2009 Exercice of options key personell 0.38 332,500 20,843,460.94 875,000 54,851,213
29/06/2009 Share issue 0.38 31,646.40 20,875,107.34 83,280 54,934,493
06/07/2009 Share issue 0.38 7,447.62 20,882,554.96 19,599 54,954,092
22/10/2009 Share issue 0.38 1,938,000 22,820,554.96 5,100,000 60,054,092
( GOVERNANCE & REPORTING / CORPORATE GOVERNANCE )

36 + 37
The Q-Free Group had an operating profi t of
102.7 MNOK (44.3) in 2009, out of operating
revenues of 804.4 MNOK (509.2). Q-Free
has taken actions to strengthen its position
in a growing market through the last couple
of years. Through the acquisitions of Dacol-
ian BV (NL) and Building Capital Ltd (UK)
and by investing in next generation in-house
developed Dedicated Short Range Com-
munication (DSRC) portfolio the company
has strengthened and broadened its portfo-
lio-enabling to offer the optimal solution for
the various applications at hand. Based on
Q-Free’s current position and strategy going
forward, the Board is optimistic about the
future.
Q-Free is a leading global supplier of solu-
tions and products for Road User Charging
(RUC) and Traffi c Management having appli-
cations mainly within electronic toll collec-
tion for road fi nancing, congestion charging,
truck-tolling, law enforcement and parking/
access control. Q-Free offers solutions and
products based on state of the art technol-
ogy, and is the leading supplier within DSRC
– ALPR (Automatic Licence Plate Recogni-
tion) and GNSS (Global Navigation Satellite
System) based solutions, with deliveries in
Europe, Asia- Pacifi c, Middle East and North
and South America. Q-Free is listed on the
Oslo Stock Exchange with the ticker QFR.
+ ORDERS RECEIVED AND ORDER BACKLOG
At year-end 2009, Q-Free Group had an
order backlog of 713 MNOK, which is 374
MNOK more than at year-end 2008 and rep-
resents a 110% increase. The order backlog
is distributed as follows: Europe 83%, Asia/
Australia 10% and Latin and North America
7%. Orders received in 2009 amounted
to 1,177 MNOK, of which 79% came from
European countries, 12% from Asia/Australia
and 9% from Latin and North America.
+ REPORT ON THE FINANCIAL STATEMENTS FOR 2009In 2009, the Q-Free Group had revenues
amounting to 804.4 MNOK, compared to
509.2 MNOK in 2008. This represents a
growth of 58% from 2008.
The Group’s gross margin for the year was
62.3%, which represents 5.5% increase
compared to 2008 when the gross margin
was 56.8%. The operating profi t (EBIT) for
2009 totalled 102.7 MNOK, compared to
44.3 MNOK in 2008. This is an improve-
ment of 58.4 MNOK, mainly due to a 58%
increase in revenues and good margins on
the projects in 2009. This gives a signifi cant
increase in the gross profi t in 2009. Net
fi nancial items amounted to 7.0 MNOK in
2009, compared to 6.6 MNOK in 2008.
The Group’s profi t before tax was 109.7
MNOK, compared to 50.9 MNOK the previ-
ous year. Tax expenses amounted to 31.5
MNOK, compared to 14.6 MNOK in 2008.
Tax payable at the year end is 5.0 MNOK.
The annual profi t for the Group after minor-
ity interests amounted to 78.3 MNOK, com-
pared to 31.6 MNOK in 2008. Earnings per
share amounted to NOK 1.41, compared to
NOK 0.60 in 2008.
The Q-Free Group had total assets of 767.5
MNOK at year-end 2009, compared to 514.4
MNOK the year before. Work in progress
accounts receivables and other short term
assets, have increased as a result of higher
business volumes. Intangible assets have
increased as a result of the acquisition of
Building Capital Ltd, Dacolian BV and due
to capitalised development projects of the
company’s new DSRC product portfolio.
Working capital requirements have increased
during 2009 relative to last 12 months reve-
nues, but this mostly refl ects the cash funds
from the share issue during the last quarter
of 2009.
The Group’s equity has increased by 196.9
MNOK to 548.6 MNOK and as at 31 Decem-
ber 2009 it totalled 71.5% of total assets.
The Group capitalises costs on product
development activities. Capitalised costs for
2009 consist mainly of the development of a
new generation DSRC tag and reader.
At year-end 2009, the parent company had
69.6 MNOK in free equity.
The Board of Directors’ recommendation is
that no dividends will be paid for the fi scal
year 2009.
CASH FLOW AND WORKING CAPITAL
The Group’s cash funds at the end of 2009
amounted to 274.6 MNOK, compared to
cash funds of 119.6 MNOK the year before.
The difference between operating profi t
before depreciation, amortisation and
impairment (EBITDA) and cash fl ow from
operations is due to working capital
increase (reduction in inventories, increase
of accounts receivable, increase in work in
progress, increase in accounts payables and
decrease of other short term liabilities).
BOARD OF DIRECTORS REPORT
( GOVERNANCE & REPORTING / BOARD OF DIRECTORS REPORT )
The Group has satisfactory fi nancial strength
to initiate self fi nanced investments in tech-
nology and projects. During 2009 the Group
has invested a total of 71.1 MNOK in new
technology to improve future profi tability.
The Group’s current assets are equal to
534.1 MNOK and short term debt amount
for 188.9 MNOK which gives a liquidity ratio
of 2.8. The Group has cash funds of 274.6
MNOK, which gives a satisfactory working
capital situation at the balance sheet date.
Q-Free completed a private placement for
a total of 5,100,000 new shares during the
last quarter of 2009. The private placement
was signifi cantly over-subscribed. Net pro-
ceeds of 105 MNOK from the private place-
ment will be applied towards strengthening
of Q-Free’s balance sheet in order to be able
to take advantage of potential M&A oppor-
tunities.
GOING CONCERN
The Board confi rms that the fi nancial state-
ments are prepared based on the principle
of going concern. It is the Board’s opinion
that the Profi t and Loss Account and Bal-
ance Sheet with notes provide adequate
information on the operations and the state
of the Company at year-end. The Board
emphasises there is normally considerable
uncertainty connected with forward-looking
statements. Nothing of signifi cance has hap-
pened since the turn of the year, other than
described in this report.
+ ORGANISATION, WORKING CONDITIONS, EXTERNAL ENVIRONMENT ANDORGANISATION
Q-Free is headquartered in the city of Trond-
heim, Norway, and is present in 18 countries
on four continents. Outside Norway the Com-
pany is represented directly in The Nether-
lands, Sweden, United Kingdom, Portugal,
Slovakia, France, Spain, Australia, Malaysia,
Thailand, Indonesia and Brazil. The Com-
pany is also represented in Turkey, Greece,
India, Chile and USA. In 2009 Q-Free
acquired Building Capital Ltd, a company
which has specialised within GNSS (satel-
lite/ GNS based tolling/enforcement) with
5 employees in London, UK. In addition
Q-Free owns 53.5% of Noca AS, a contract
electronics manufacturer.
At year-end 2009, the Group had 292
employees, whereof 145 are employed in
the parent company in Trondheim and Oslo,
51 in Noca AS in Trondheim and 96 in com-
panies outside Norway. A total of 92 percent
of the employees hold a university degree or
similar, mainly technical degrees.
IMPROVEMENT MEASURES
In order to enable continued growth for
Q-Free and to ensure that the Group is pre-
pared to meet the demands of a growing
RUC market, it is important to have an on-
going process to professionalise the organi-
sation. This has also been a focus area for
the Group in 2009. Increased interest for the
company, both in Norway and internation-
ally, has lead to a growing number of highly
skilled applicants asking for a Q-Free job.
The Group considers the workforce to be
well prepared to meet the coming challenges
in the future RUC market. The turnover rate
in 2009 has been very low. The Board con-
siders further development of the Group’s
employees to be an important strategic
effort to position the Group.
WORKING ENVIRONMENT AND PERSONNEL
The Board considers the working environ-
ment in the Group to be good, and would
like to take this opportunity to thank the
employees for their contributions in a year
with challenging projects and heavy work-
load. Sick leave in 2009 amounted to 439
days, i.e. 1.4%. A very impressive result
given the extended activity in 2009 and a
reduction from 2.2% in the previous year.
No serious occupational incidents or injuries
were reported during the year.
The Group operates a policy of complete
equality between male and female workers
and does not have differential treatment based
on gender. By tradition, the Group’s recruit-
ment is from a variety of engineering envi-
ronments, and currently the Group has 24%
female and 76% male employees. Q-Free
seeks to employ female engineers and will
have a priority to a female employee to a male
employee, if the rest of the qualifi cations are
similar and aims to have similar remuneration
between male and female. The parent Com-
pany fulfi ls the Norwegian legal requirement of
a minimum of 40% female Board members.
The Group employs and has historically
employed personnel of various nationali-
ties and from various cultures in the parent
company in Norway both in the subsidiar-
ies abroad. The group has a long tradition
of handling a mix of nationalities and has
built an international attitude over the years.
The offi cial language is English. Based on
the importance of these representatives
from different cultures, the group has imple-
mented a policy to avoid discrimination
between people, and groups of people.
There have been no reports on discrimina-
tion incidents in the group in the last years.
ETHICS
The Board focuses on the importance that
everyone who works for the Q-Free Group
represents the Group companies and the
Group’s ideals in a positive way on all arenas
of our global business. The Board therefore
adopted a set of guidelines for ethical con-
duct for Q-Frees personnel (Q-Free Code
of Conduct), applicable to both internal and
external business.
EXTERNAL ENVIRONMENT
The use of Q-Frees products and serv-
ices contribute to reduce traffi c congestion
and consequently give less pollution. The
Group’s activities have no negative impact
on the external environment. The Group’s
environmental programme, which is certifi ed
in accordance with NS-EN ISO 14001:2004,
has shown positive results. All products
introduced after 2005 are produced with-
out the use of lead and other hazardous
environmental substances, as defi ned in the
EU’s RoHS of WEEE directives. Q-Free has
formulated an environmental policy that is
published on the Group web site. Further-
more, the Group is working actively to infl u-
ence subcontractors to choose the most
environmental friendly alternatives when-
ever possible. The Group thus fulfi ls all the
environmental requirements imposed by the
Norwegian authorities and the EU.
RISK SITUATION
An international technology company such
as Q-Free is destined to be exposed to a
number of different risks. Political risk related
to the time involved from sales lead are iden-
tifi ed to contract is awarded and implemen-
tation of projects is particularly signifi cant to
Q-Free’s operations, as RUC projects are
usually always directly or indirectly subject
to a governmental concession. The fact that
road concessions are being privatised in the
most developed RUC markets may reduce
the political risk in the long term.
Other risks:
CURRENCY RISK
Q-Free has considerable foreign currency
exposure since it earns between 70-85%
of its revenues abroad. Q-Free also buys a
substantial share of its needed equipment
and services abroad and runs businesses
outside Norway. This mitigates the Group’s
net foreign currency exposure by 30-50%.
The Group’s most important trading cur-
rencies except for NOK, are USD and EUR.
Q-Free’s policy is to limit currency risk while
actively assessing various currencies’ impor-
Q-FREE / ANNUAL REPORT / 2009 (38 + 39)

Furthermore, continuous technology advances can affect the competitive situation of Q-Free.
Q-Free mitigates this risk by systematic quality control of subcontractors, own technology
and product development, by continuously seeking competence needed to integrate various
technologies into our solutions, and fi nally by making provisions for possible faulty deliveries.
PROJECT RISK
Q-Free’s revenues normally include a substantial element of large-scale project deliveries that
place signifi cant demands on implementation know-how. Q-Free is in possession of a unique
competence in this fi eld, and the development of plans to handle project risks that may arise
is an important element of the Group’s know-how in this respect.
+ CORPORATE GOVERNANCEThe Stock exchange regulations require that companies listed on the Oslo Stock Exchange
must publish a report on their principles for Corporate Governance once a year, in accord-
ance with the Norwegian Code of Practice for Corporate Governance.
The Board of Q-Free adopted the Group’s principles for Corporate Governance in 2008 and
these were updated in 2009. Further details are provided under the section ”Corporate Gov-
ernance” in the printed version of the Company’s Annual Report.
+ SHAREHOLDER SITUATIONSHARE DEVELOPMENT
The price for Q-Free shares in 2009 fl uctuated from NOK 8.20 (January) to NOK 21.60
(December). With a total number of 60,054,092 shares, this implies a market value of
1,297 MNOK at the end of the year.
SHAREHOLDER SITUATION
At year-end 2009, Q-Free ASA had 1,654 shareholders compared to 1,436 in 2008. The
ownership structure consists of investment companies and institutional shareholders in Nor-
way and abroad.
The 20 largest shareholders in Q-Free ASA as at March 23rd 2010:
Holding Percentage Name
10,005,000 16.66 Erste Bank Der Oeste Sparkassen AG
5,203,574 8.66 Odin Norge
3,000,000 5.00 Skagen Vekst
2,550,000 4.25 Kikut AS Arne Nilsen
2,125,000 3.54 DnB NOR SMB VPF
2,062,800 3.43 Holberg Norge v/Holberg Fondsforva
1,974,500 3.29 JP Morgan Chase Bank Special Treaty Lendi
1,633,600 2.72 Andresen Lars Oddgeir
1,495,000 2.49 Redback AS
1,187,017 1.98 Bank Austria Credita Dept. 8811/Mrs. Aimu
1,040,000 1.73 Mons Holding AS
1,026,975 1.71 VPF Nordea Kapital C/O JP Morgan Europe
867,332 1.44 VPF Nordea Avkastnin C/O JP Morgan Europe
750,000 1.25 Deutsche Bank Intern Client Account
655,300 1.09 Warrenwicklund Norge
653,646 1.09 Pensjonskassen Stato C/O JP Morgan Chase
600,493 1.00 NHO – P665ak JP Morgan Chase Bank
581,700 0.97 Vpf Nordea SMB C/O JP Morgan Europe
577,940 0.96 Storebrand Livsforsi P980, Aksjefondet
549,839 0.92 Danske Invest Norge
38,539,716 64.18 TOTAL
The Company has one share class and the nominal value per share is NOK 0.38.
AUTHORISATION TO ACQUIRE THE
COMPANY’S OWN SHARES
On 18th of May 2009, The General Meeting authorised the Board of Directors of Q-Free
ASA to permit the Company to acquire shares in Q-Free ASA with a nominal value of up to
NOK 2,051,095.98, divided between up to 5,397,621 shares, each with a par value of NOK
tance as competitive parameters. The Group
strategy is to combine estimated future sales
and purchases and hedge the net cash fl ow in
the foreign currency by using forward / future
contracts.
CREDIT RISK
The Group is only conducting business with
parties with an acceptable credit record.
To the extent the credit rate is question-
able, payment guarantees, letter of credit or
advance payments will be considered. The
Group has no signifi cant credit risk linked
to an individual contracting party or sev-
eral other contracting parties that can be
regarded as a group due to similarities in
the credit risk. The Group has guidelines for
ensuring that sales are only made to cus-
tomers that have not experienced any signifi -
cant credit problems, and that outstanding
amounts do not exceed given credit limits.
The Group has not provided any guaran-
tees for third parties’ liabilities. The Group
is exposed to risk involved in customers not
having the ability to fulfi l their fi nancial obliga-
tions. However, this risk is considered to be
low since the Group’s customers are major
IT companies, public authorities, larger for-
eign road operators and key road conces-
sionaires in Norway and abroad. This is
documented by a historically low bad debt
ratio on accounts receivables. When the
Group enters a new market, the credit risk
will be assessed in each individual case
and appropriate actions like utilising letter of
credits and other similar tools will be used in
order to reduce credit risk.
INTEREST RATE RISKS
Since the Group has no signifi cant amount of
interest bearing debt the interest risk is imma-
terial. However if the Group will enter any sig-
nifi cant interest bearing debt contracts, the
group emphasises predictability at all times
when changes in the interest level have a sig-
nifi cant infl uence on the consolidated profi t
and will take actions to hedge this risk.
LIQUIDITY RISK
The Q-Free ASA Group’s strategy is to have
suffi cient cash, cash equivalents or credit
facilities at any time to be able to fi nance its
operations and investments over the next
three years as required in the Group’s strat-
egy plan for the same period. Surplus liquid-
ity is either deposited in banks or invested
in money market funds, with the purpose of
obtaining an acceptable return on invested
capital combined with a low risk.
TECHNOLOGY RISK
The Group is exposed to quality problems
both due to the quality of own work and the
quality of deliveries from subcontractors.
( GOVERNANCE & REPORTING / BOARD OF DIRECTORS REPORT )

0.38, provided that the Company’s share-
holding of own shares shall not exceed 10%
of shares outstanding at any given time. The
minimum and maximum amount that can be
paid per share will be NOK 1 and NOK 100
respectively. The Board of Directors shall
have full discretion with respect to methods
of acquisition and disposal of the Company’s
own shares. The authorisation shall be valid
until the next ordinary General Meeting, but
no longer than 30th of June 2010.
AUTHORISATION TO INCREASE
THE SHARE CAPITAL
Based on the need to secure necessary
transactions like possible acquisitions, share
offerings, mergers or other actions within the
ITS (Intelligent Traffi c Systems) sector, the
Board of Directors was given an authorisa-
tion from the General Meeting to increase the
share capital by the issuance of new shares.
In the General Meeting of 18th of May 2009
The Board of Directors was given a new
authorisation to increase the share capital
with as much as NOK 2,051,095.98 by the
issue of as much 5,397,621 shares (10%),
with a par value of NOK 0.38, with a right to
disregard the existing shareholders prefer-
ential rights according to the Public Limited
Companies Act sections 10-4 and 10-5, and
to determine that non-cash share depos-
its shall be made or the right to subject the
company to special obligations pursuant to
section 10-2 of the Public Limited Compa-
nies Act, and mergers according to the Pub-
lic Limited Companies Act section 13-5. The
Board of Directors is authorised to determine
the terms and conditions for the subscrip-
tion of shares, and to amend the company’s
articles of association in compliance with
the increase of the share capital at all times.
The authorisation shall be valid for two years
from the resolution is approved by the Gen-
eral Meeting, but no longer than 18th of May
2011.
AUTHORISATION TO INCREASE THE SHARE
CAPITAL – INCENTIVE PROGRAM
As part of the work of giving key person-
nel, management and shareholder elected
Board members an incentive program,
through the possibility to subscribe shares
in the company, the General Meeting held
18th of May 2009 authorised the Board of
Directors to increase the share capital with
as much as NOK 1,026,000 which cor-
responds to 2,700,000 shares (5%), with
a par value of NOK 0.38, through one or
more private placements with cash depos-
its towards key personnel, management
and shareholder elected board members in
Q-Free ASA. The existing shareholders pref-
erential rights according to the Public Lim-
ited Companies Act sections 10-4 and 10-5
is disregarded. The authorisation is valid
for 2 years from the date of this resolution
approved by the General Meeting, but no
longer than 18th of May 2011.
The authorisation regards the implementa-
tion of a share options program in Q-Free
ASA, which runs over a period of 3 years for
key personnel and management, and 2 years
for shareholder elected board members. As
much as 600,000 shares shall be reserved
for shareholder elected board members,
and the remaining 2,100,000 shares shall be
reserved the share options program for key
personnel and management.
Further details regarding the share option
programme are provided in note 14 of the
fi nancial statement in the Annual Report.
+ OUTLOOKThe Board of Directors would like to point
out that there will always be considerable
uncertainty related to forward-looking state-
ments.
The global ITS market is expected to grow
considerably over the next years and
Q-Free’s market position is continuously
strengthening. Our strategic positioning has
been well received by existing and new cus-
tomers and partners. During 2009 the com-
pany achieved all time high order intake of
above 1 BNOK. 2010 will be an important
year when it comes to positioning the Com-
pany for larger infrastructure projects. Some
of these may be concluded in 2010, but the
majority most likely in 2011.
During 2010 the company will continue to
further develop and proffesionalise the com-
pany. The added references through suc-
cessful delivery of the major projects, such
as in Slovakia, Portugal and Thailand, rep-
resent an important tool for Q-Free when
competing for future projects. To effi ciently
explore this growing market, we will continue
to strengthen our competence and capacity.
The sales organisation will be expanded to
cover new geographical areas, operational
excellence will be a continuous focus to
secure high quality and cost effi ciency, and
the company’s R&D activity will futureproof
the company by developing new products
and solutions.
+ ALLOCATION OF PROFITSThe Board proposes that the profi t for
the year in the parent company of NOK
52,199,000 is distributed to other equity.
+ STATEMENT FROM THE DIRECTORS AND THE CEO We confi rm that, to the best of our knowl-
edge, the fi nancial statements for the period
from 1 January to 31 December 2009 have
been prepared in compliance with applicable
fi nancial reporting standards and that the
disclosures in the accounts give a true and
fair view of the Company’s and the Group’s
assets, liabilities, fi nancial position and
results of operations as a whole, and that
the Directors’ Report gives a fair review of
the development, profi t/loss and position of
the Company and the Group, along with a
description of the main risk and uncertainty
factors facing the Company.
Trondheim 31st of December 2009 / 23rd of
March 2010:
Ole Jørgen Fredriksen (Chairman of the Board)
Mimi Kristine Berdal
Christian Albech
Torild Skogsholm
Anders Hagen
Sissel Lillevik Larsen
Jan Pihl Grimnes
Øyvind Isaksen (CEO)
Q-FREE / ANNUAL REPORT / 2009 (40 + 41)

1. OLE JØRGEN FREDRIKSEN
Chairman of the Board
+ Ole Jørgen Fredriksen has over 25 years experience in the computer hardware and soft-
ware industry. He was one of the co-founders and the President and CEO of ASK, subse-
quently Proxima and InFocus, the leading global projector company.
2. CHRISTIAN ALBECH
Board member
+ Christian Albech has substantial experience in the information and media industries. He
heads Telenor Broadcast’s operational activities, which consist of Canal Digital, Norkring,
Conax and Telenor Satellite Broadcasting. Christian Albech comes from the position as
Senior Vice President of Telenor Broadcast and has extensive experience from Telenor’s TV
activities.
Albech has previously headed Telenor’s cable TV activities, and was hired as Head of Canal
Digital’s forerunner CTV. Mr Albech has widespread experience of board management.
BOARD OF DIRECTORS
1
3
2
4
( GOVERNANCE & REPORTING / BOARD OF DIRECTORS )

3. MIMI KRISTINE BERDAL
Board member
+ Mimi K. Berdal has a law degree from the
University of Oslo, and runs her own law
and consultancy fi rm, focusing on the areas
of contract law, company/commercial law,
transactions and securities trading. From
1991-2005, Berdal was a partner at the law
fi rm Arntzen de Besche. Berdal has extensive
experience from work as a Board Member.
4. TORILD SKOGSHOLM
Board member
+ Torild Skogsholm is the Managing Direc-
tor of Oslo Sporvognsdrift AS. From 2001-
2005, Mrs Skogsholm was the Minister for
Transport and Communications. She has
also held positions as political advisor to the
Ministry of the Environment and Parliamen-
tary Secretary at the Ministry of Transport
and Communications.
5. JAN PIHL GRIMNES
Board member
+ Jan Pihl Grimnes is through his company
Redback AS investing in the IT, petroleum
and mining industries. He holds 2.49% of
the shares in Q-Free ASA. Grimnes
founded Technoguide AS, and holds sev-
eral board positions both in listed and non-
listed companies. Grimnes holds an MBA
from the Norwegian School of Economics
and Business Administration and a MSc
from the Norwegian University of Science
and Technology.
6. ANDERS HAGEN
Employee elected memeber of the Board
+ Mr Hagen holds an MSc in electrical engi-
neering and is heading the Innovation Team
at the R&D department. Mr Hagen has been
working in the Q-Free Group since 1992.
7. SISSEL LILLEVIK LARSEN
Employee elected memeber of the Board
+ Mrs Lillevik Larsen has been with Q-Free
ASA since 2000 and holds the position
of Technical project manager.
Q-FREE / ANNUAL REPORT / 2009 (42 + 43)
7
5 6

ANNUAL ACCOUNTS 2009 +
CONTENT
ANNUAL ACCOUNTS 44
+
CONSOLIDATED INCOME STATEMENT 46
INTERIM CONSOLIDATED STATEMENT OF COMPREHENSIVE INCOME 47
BALANCE SHEET 31.12 48
STATEMENT OF CHANGES IN EQUITY 50
CASH FLOW STATEMENT 51
NOTES TO THE CONSOLIDATED FINANCIAL STATEMENTS 52
AUDITOR’S REPORT 91
ABBREVIATIONS 92
+ CASH FLOW FROM OPERATIONS (MNOK)
112+ EQUITY RATIO
71%+ PROFIT AFTER TAX (MNOK)
78

44 + 45

Parent company Group
2008 2009 Note 2009 2008
OPERATING REVENUES
317,498 601,168 Revenues 7 798,276 502,747
6,499 6,127 Other operating income 8 6,127 6,499
323,997 607,295 TOTAL OPERATING REVENUES 804,403 509,246
OPERATING EXPENSES
142,987 242,228 Cost of goods sold 16 303,429 219,978
66,277 103,010 Payroll expenses 14, 15, 25 153,712 107,488
95,432 176,922 Other operating expenses 26 212,057 116,547
304,696 522,160 TOTAL OPERATING EXPENSES 669,198 444,012
19,301 85,135 Operating profi t before depreciation - EBITDA 135,205 65,233
15,271 20,780 Depreciation, amortisation and impairment 11 32,461 20,950
4,030 64,355 Operating profi t – EBIT 102,743 44,283
FINANCIAL ITEMS
-24,343 -23,860 Financial expenses -26,375 -29,502
30,783 30,166 Financial income 33,330 36,134
9,794 217 Financial income from Group companies 0 0
16,234 6,524 TOTAL FINANCIAL ITEMS 6, 13 6,955 6,633
20,264 70,878 Profi t before tax 109,698 50,915
-3,620 -18,679 Taxes 9 -31,549 -14,629
16,643 52,199 Profi t / (-) loss for the year 78,150 36,287
Minority share -160 4,659
Equity holders of the parent 78,310 31,628
DISTRIBUTION OF PROFIT FOR THE YEAR
0 0 Share premium reserve
16,643 52,199 Other equity
16,643 52,199 TOTAL DISTRIBUTED
Earnings per share 10 1.41 0.60
Diluted earnings per share 10 1.39 0.60
CONSOLIDATED INCOME STATEMENT
FIGURES IN TNOK
( ANNUAL ACCOUNTS )
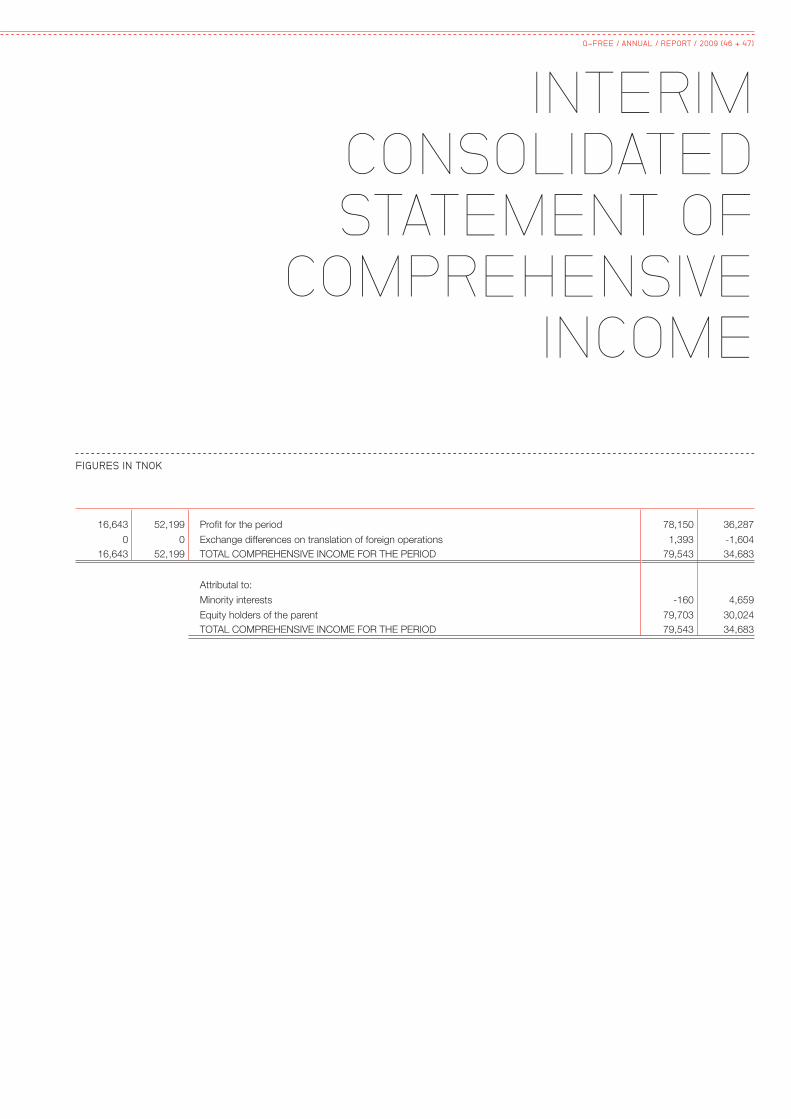
INTERIM CONSOLIDATED STATEMENT OF
COMPREHENSIVE INCOME
16,643 52,199 Profi t for the period 78,150 36,287
0 0 Exchange differences on translation of foreign operations 1,393 -1,604
16,643 52,199 TOTAL COMPREHENSIVE INCOME FOR THE PERIOD 79,543 34,683
Attributal to:
Minority interests -160 4,659
Equity holders of the parent 79,703 30,024
TOTAL COMPREHENSIVE INCOME FOR THE PERIOD 79,543 34,683
FIGURES IN TNOK
Q-FREE / ANNUAL / REPORT / 2009 (46 + 47)
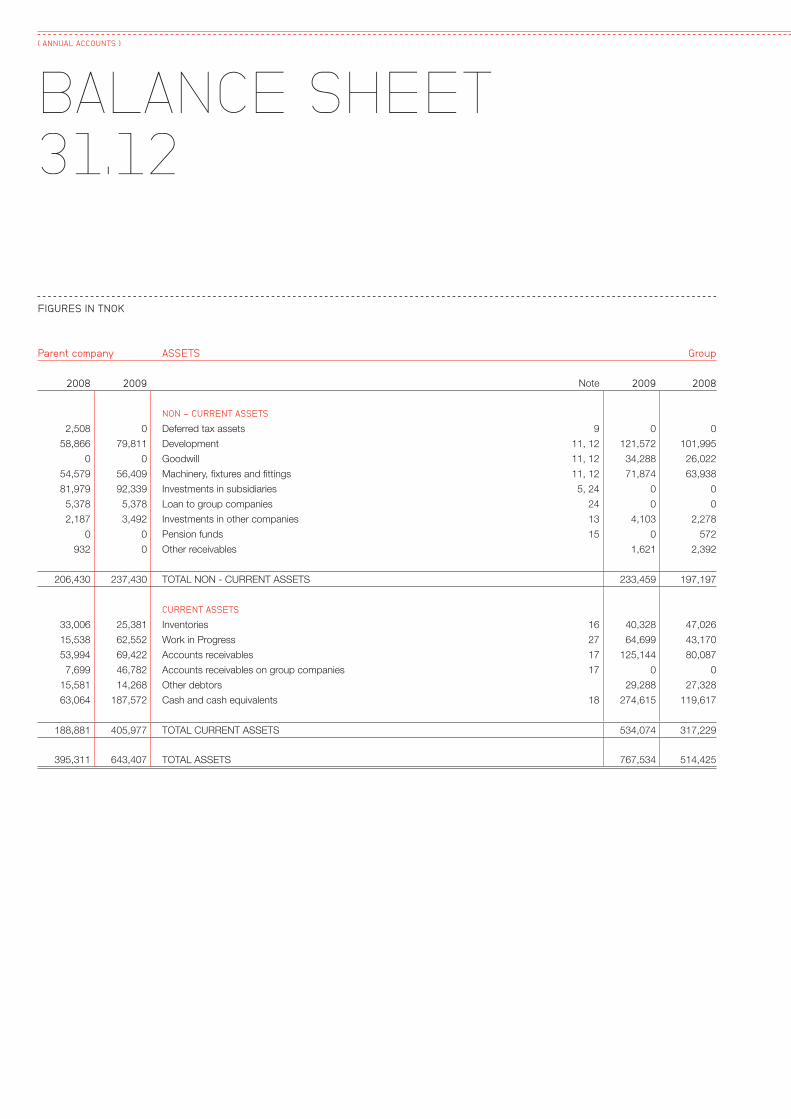
FIGURES IN TNOK
Parent company ASSETS Group
2008 2009 Note 2009 2008
NON - CURRENT ASSETS
2,508 0 Deferred tax assets 9 0 0
58,866 79,811 Development 11, 12 121,572 101,995
0 0 Goodwill 11, 12 34,288 26,022
54,579 56,409 Machinery, fi xtures and fi ttings 11, 12 71,874 63,938
81,979 92,339 Investments in subsidiaries 5, 24 0 0
5,378 5,378 Loan to group companies 24 0 0
2,187 3,492 Investments in other companies 13 4,103 2,278
0 0 Pension funds 15 0 572
932 0 Other receivables 1,621 2,392
206,430 237,430 TOTAL NON - CURRENT ASSETS 233,459 197,197
CURRENT ASSETS
33,006 25,381 Inventories 16 40,328 47,026
15,538 62,552 Work in Progress 27 64,699 43,170
53,994 69,422 Accounts receivables 17 125,144 80,087
7,699 46,782 Accounts receivables on group companies 17 0 0
15,581 14,268 Other debtors 29,288 27,328
63,064 187,572 Cash and cash equivalents 18 274,615 119,617
188,881 405,977 TOTAL CURRENT ASSETS 534,074 317,229
395,311 643,407 TOTAL ASSETS 767,534 514,425
BALANCE SHEET 31.12
( ANNUAL ACCOUNTS )

FIGURES IN TNOK
Parent company EQUITY AND LIABILITIES Group
2008 2009 Note 2009 2008
EQUITY ATTRIBUTAL TO EQUITY HOLDERS OF THE PARENT
20,511 22,821 Subscribed share capital 19 22,821 20,511
171,399 283,946 Share premium reserve 283,946 171,399
7,680 10,219 Other paid-in capital 10,348 7,809
97,257 149,456 Other equity 210,635 130,933
296,847 466,443 Total equity attributal to equity holders of the parent 527,750 330,652
0 0 Minority interests 20,851 21,011
296,847 466,443 TOTAL EQUITY 548,601 351,663
LIABILITIES
Non-current liabilities
0 0 Liabilities to fi nancial institutions 20 1,412 2,202
0 15,847 Deferred tax 9 27,121 11,465
574 1,725 Pension liabilities 15 1,466 733
574 17,572 Total non-current liabilities 29,999 14,399
Current liabilities
51,574 80,502 Accounts payable 23 105,411 58,613
1,041 12 Advance payments from customers 5,415 5,550
1,577 23,358 Debt to group companies 24 0 0
0 0 Tax payable 9 4,959 4,246
6,353 7,849 Public duties payable 13,653 9,924
37,345 47,672 Other short-term liabilities 21 59,496 70,029
97,891 159,393 Total current liabilities 188,934 148,363
98,464 176,965 TOTAL LIABILITIES 218,933 162,762
395,311 643,407 TOTAL EQUITY AND LIABILITIES 767,534 514,425
BALANCE SHEET 31.12
Trondheim 31 December 2009/ 23 March 2010
Ole Jørgen Fredriksen (Chairman of the Board) sign.
Mimi Kristine Berdal Christian Albech Torild Skogsholm sign. sign. sign.
Anders Hagen Sissel Lillevik Larsen Jan Pihl Grimnes sign. sign. sign. Øyvind Isaksen (CEO) sign.
Q-FREE / ANNUAL / REPORT / 2009 (48 + 49)

STATEMENT OF CHANGES IN EQUITY
( ANNUAL ACCOUNTS )
FIGURES IN TNOK
CHANGES IN EQUITY
Parent company
NoteShare
capital
Share Premium
reserve
Other paid-in capital
Other equity
TOTAL EQUITY
Equity per 01.01.2008 19 19,864 155,231 5,116 80,613 260,825
Total comprehensive income for the period 0 0 0 16,643 16,643
Share issue arising from acquisitions 5, 19 647 16,168 0 0 16,815
Cost of share-based payment 14 0 0 2,564 0 2,564
Total equity of the parent company per 31.12.08 20,511 171,399 7,680 97,256 296,847
Equity per 01.01.2009 19 20,511 171,399 7,680 97,256 296,847
Total comprehensive income for the period 0 0 0 52,199 52,199
Share issue arising from acquisitions 5, 19 2,310 112,547 0 0 114,857
Cost of share-based payment 14 0 0 2,539 0 2,539
TOTAL EQUITY OF THE PARENT COMPANY PER 31.12.09 22,821 283,946 10,219 149,456 466,443
Group
Equity attributal to equity holders of the parentMinority interests
TOTAL EQUITY
NoteShare
capital
Share Premium
reserve
Other paid-in capital
Other equity
Foreign currency
translation reserve Total
Equity per. 01.01.2008: 19 19,864 155,231 5,245 103,904 284,244 16,352 300,596
0
Total comprehensive income for the period 31,628 -1,604 30,024 4,659 34,683
Transferred equity subsidiary -1,422 -1,422 -1,422
Reclassifi ed deferred tax subsidiary -1,573 -1,573 -1,573
Share issue arising from acquisitions 5, 19 647 16,168 16,815 16,815
Cost of share-based payment 14 2,564 2,564 2,564
Total equity of the Group per 31.12.2008 20,511 171,399 7,809 132,537 -1,604 330,652 21,011 351,663
Equity per. 01.01.2009: 19 20,511 171,399 7,809 132,537 -1,604 330,651 21,011 351,663
Total comprehensive income for the period 78,310 1,393 79,703 -160 79,543
Share issue arising from acquisitions 5, 19 2,310 112,547 114,857 114,857
Cost of share-based payment 14 2,539 2,539 2,539
TOTAL EQUITY OF THE GROUP PER 31.12.2009 22,821 283,946 10,348 210,847 -211 527,750 20,851 548,601
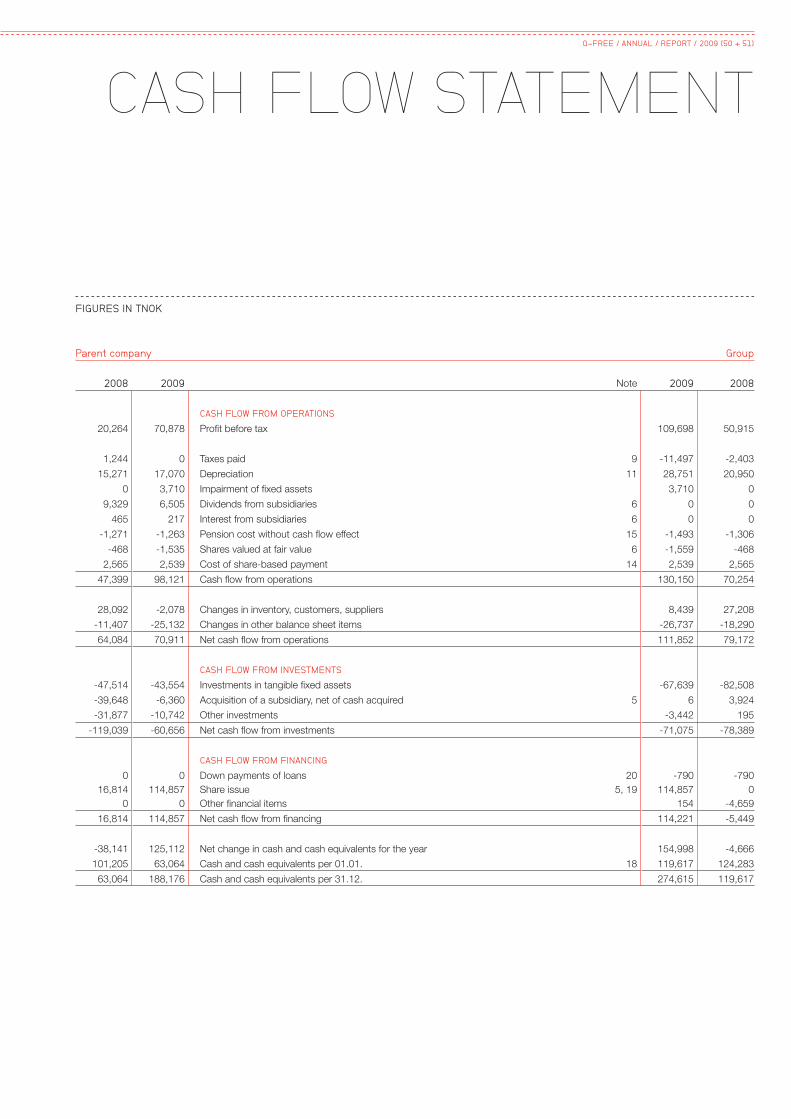
CASH FLOW STATEMENTQ-FREE / ANNUAL / REPORT / 2009 (50 + 51)
Parent company Group
2008 2009 Note 2009 2008
CASH FLOW FROM OPERATIONS
20,264 70,878 Profi t before tax 109,698 50,915
1,244 0 Taxes paid 9 -11,497 -2,403
15,271 17,070 Depreciation 11 28,751 20,950
0 3,710 Impairment of fi xed assets 3,710 0
9,329 6,505 Dividends from subsidiaries 6 0 0
465 217 Interest from subsidiaries 6 0 0
-1,271 -1,263 Pension cost without cash fl ow effect 15 -1,493 -1,306
-468 -1,535 Shares valued at fair value 6 -1,559 -468
2,565 2,539 Cost of share-based payment 14 2,539 2,565
47,399 98,121 Cash fl ow from operations 130,150 70,254
28,092 -2,078 Changes in inventory, customers, suppliers 8,439 27,208
-11,407 -25,132 Changes in other balance sheet items -26,737 -18,290
64,084 70,911 Net cash fl ow from operations 111,852 79,172
CASH FLOW FROM INVESTMENTS
-47,514 -43,554 Investments in tangible fi xed assets -67,639 -82,508
-39,648 -6,360 Acquisition of a subsidiary, net of cash acquired 5 6 3,924
-31,877 -10,742 Other investments -3,442 195
-119,039 -60,656 Net cash fl ow from investments -71,075 -78,389
CASH FLOW FROM FINANCING
0 0 Down payments of loans 20 -790 -790
16,814 114,857 Share issue 5, 19 114,857 0
0 0 Other fi nancial items 154 -4,659
16,814 114,857 Net cash fl ow from fi nancing 114,221 -5,449
-38,141 125,112 Net change in cash and cash equivalents for the year 154,998 -4,666
101,205 63,064 Cash and cash equivalents per 01.01. 18 119,617 124,283
63,064 188,176 Cash and cash equivalents per 31.12. 274,615 119,617
FIGURES IN TNOK
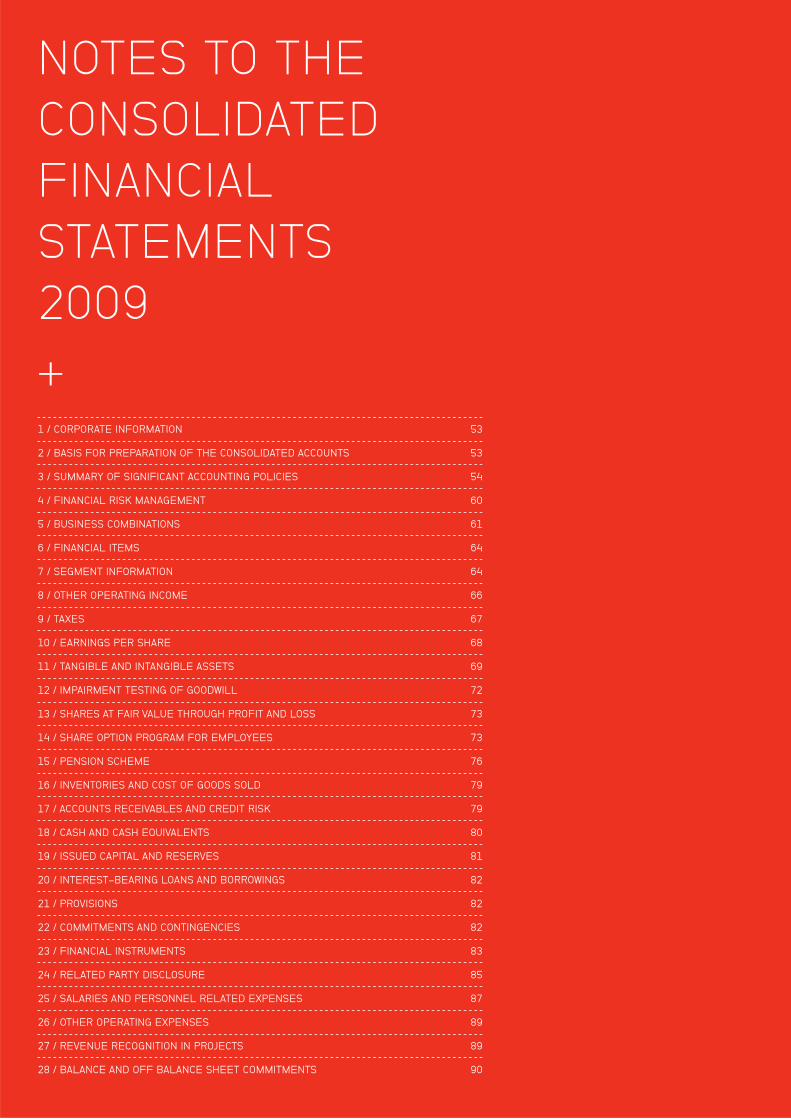
NOTES TO THE
CONSOLIDATED
FINANCIAL
STATEMENTS
2009
+1 / CORPORATE INFORMATION 53
2 / BASIS FOR PREPARATION OF THE CONSOLIDATED ACCOUNTS 53
3 / SUMMARY OF SIGNIFICANT ACCOUNTING POLICIES 54
4 / FINANCIAL RISK MANAGEMENT 60
5 / BUSINESS COMBINATIONS 61
6 / FINANCIAL ITEMS 64
7 / SEGMENT INFORMATION 64
8 / OTHER OPERATING INCOME 66
9 / TAXES 67
10 / EARNINGS PER SHARE 68
11 / TANGIBLE AND INTANGIBLE ASSETS 69
12 / IMPAIRMENT TESTING OF GOODWILL 72
13 / SHARES AT FAIR VALUE THROUGH PROFIT AND LOSS 73
14 / SHARE OPTION PROGRAM FOR EMPLOYEES 73
15 / PENSION SCHEME 76
16 / INVENTORIES AND COST OF GOODS SOLD 79
17 / ACCOUNTS RECEIVABLES AND CREDIT RISK 79
18 / CASH AND CASH EQUIVALENTS 80
19 / ISSUED CAPITAL AND RESERVES 81
20 / INTEREST-BEARING LOANS AND BORROWINGS 82
21 / PROVISIONS 82
22 / COMMITMENTS AND CONTINGENCIES 82
23 / FINANCIAL INSTRUMENTS 83
24 / RELATED PARTY DISCLOSURE 85
25 / SALARIES AND PERSONNEL RELATED EXPENSES 87
26 / OTHER OPERATING EXPENSES 89
27 / REVENUE RECOGNITION IN PROJECTS 89
28 / BALANCE AND OFF BALANCE SHEET COMMITMENTS 90

NOTE 1. CORPORATE INFORMATION
The consolidated accounts for the year ended at 31 December 2009 were approved by the Board of Directors at its meeting on 23 March
2010. Q-Free ASA is a limited liability company with 292 employees in 11 locations and representatives in 7 other countries. The headquarter
is based in Trondheim, Norway. Q-Free is listed on the Oslo Stock Exchange with the ticker QFR.
Q-Free is a leading global supplier of solutions and products for Road User Charging and Traffi c Surveillance having applications mainly
within electronic toll collection for road fi nancing, congestion charging, truck-tolling, law enforcement and parking/access control. Q-Free
offers solutions and products based on state of the art technology, and is the leading supplier within DSRC (tag) - ALPR (Automatic License
Plate Recognition) and GNSS (Global Navigation Satellite System) based solutions, with deliveries in Europe, Asia-Pacifi c, Middle East and
North- and South America.
For further information, the business segments are described in Note 7.
NOTE 2. BASIS FOR PREPARATION OF THE CONSOLIDATED ACCOUNTS 2.1 : GENERAL PRINCIPLES
The consolidated fi nancial statements are presented using the historical cost principle, with the exception of derivative fi nancial instruments
which are measured at fair value. The consolidated fi nancial statements are presented in Norwegian kroner and all fi gures are rounded to the
nearest thousand (TNOK) unless otherwise specifi ed.
> STATEMENTS OF COMPLIANCE
The consolidated fi nancial statements of Q-Free ASA (the “Parent Company”) and all its subsidiaries (The “Group”), have been prepared in
accordance with International Financial Reporting Standards (IFRS) as adopted by EU. The below listed principles are used both for the Par-
ent company and The Group if not stated otherwise.
2.2 : USE OF ESTIMATES WHEN PREPARING THE ANNUAL FINANCIAL STATEMENTS
The preparation of the Group’s consolidated fi nancial statements require management to make judgments, estimates and assumptions that
effect the reported amounts of revenues, expenses, assets and liabilities, and the disclosure of contingent liabilities, at the end of the report-
ing period. However, uncertainty about these assumptions and estimates could result in outcome that require a material adjustment to the
carrying amount of the asset or liability affected in future periods.
In the process of applying the Group’s accounting policies, management has made the following judgments, which have the most signifi cant
effect on the amounts recognised in the consolidated fi nancial statements:
> PENSION FUNDS / LIABILITIES
The cost of defi ned benefi t pension plans and other post employment medical benefi ts is determined using actuarial valuations. The actuarial
valuation involves a number of assumptions about discount rates, expected rates of return on assets, future salary increases, mortality rates
and future pension increases. Due to the long term nature of these plans, such estimates are subject to signifi cant uncertainty. All assump-
tions are reviewed at the reporting date. The net employee pension liabilities for the Group as at 31 December 2009 is TNOK 1,725 Corre-
sponding fi gures for 2008 was net funds TNOK 574. Further details are given in Note 15.
> WARRANTY ACCRUALS
The Group is estimating probable warranty costs in relation to tags delivered with faults based on similar cost for previous years and an evalu-
ation of the portfolio of delivered tags still under warranty. Total provisions for warranty costs as at 31 December 2009 is TNOK 9,073 for the
group. Corresponding fi gures for 2008 was TNOK 10,477. Further details are given in Note 21.
> BUSINESS COMBINATIONS AND ESTIMATES USED IN PPA-ANALYSIS AT ACQUISITIONS (PRICE PURCHASE ALLOCATION)
In order to determine the fair value of certain intangible assets, it is necessary to calculate the expected future cash fl ows of the Company to
the purchase price of the Company. This reconciliation is performed via a base enterprise business valuation (BEV). In order to perform this
calculation at the Building Capital Ltd acquisition we have used the following estimates.
The nominal WACC is estimated to 10.4 percent. The risk free rate is assessed at 3.8 percent (based on 10-year Euro zone government
bond risk free rate). We have used 5 percent as an estimate of the general market risk premium. 69.4 percent is used as weight of equity,
based on the balance sheet as at 31.12.2009 and the market capitalisation of Q-Free. It is assumed that this capital structure provides a
reasonable estimate for future capital structure. Further details are given in note 5.
Q-FREE / ANNUAL / REPORT / 2009 (52 + 53)

> REVENUE RECOGNITION IN PROJECTS
Revenue recognition in projects is measured as a percentage calculated as accrued production costs as a percentage of total anticipated
production costs. Total anticipated production costs are estimated on the basis of a combination of historical fi gures, the follow up of effi -
ciency targets and best estimates. Total order’s for the Group as at 31 December 2009 is TNOK 648,867. Corresponding fi gures for 2008
was TNOK 215,502. Further details are given in Note 28.
> DEFERRED TAX ASSETS
Deferred tax assets are recognised for all unused tax losses to the extent that it is probable that taxable profi t will allow the losses to be
utilised. Management periodically evaluates positions taken in the tax returns with respect to situations in which applicable tax regulations
are subject to interpretation and establishes provisions where appropriate. The carrying value of recognised deferred tax liabilities as at 31
December 2009 was TNOK 27,121 for Group and TNOK 15,847 for Parent (2008: TNOK 11,465 of deferred tax liabilities for Group and
TNOK 2,508 of deferred tax assets for Parent). Neither the Parent company nor the Group had any unrecognised deferred tax assets as at
31 December 2009 or as at 31. December 2008. Further details regarding deferred taxes are given in note 9.
> DEVELOPMENT COSTS
Development costs are capitalised in accordance with the accounting policy in Note 3.7. Initial capitalisation of costs is based on manage-
ment’s judgment that technological and fi nancial feasibility is confi rmed, usually when a product development project has reached a defi ned
milestone according to the project management model. In determining the amounts to be capitalised, management makes assumptions on
the expected future cash generation of the project, discount rates to be applied and the expected period of benefi ts. As at 31 December
2009, the carrying amount of capitalised product development costs as at 31. December 2009 was TNOK 121,572 (2008: TNOK 101,995).
Further details are given in Note 11 Tangible and Intangible Assets.
NOTE 3. SUMMARY OF SIGNIFICANT ACCOUNTING POLICIES 3.0 : BASIS OF CONSOLIDATION
The consolidated fi nancial statements comprise the fi nancial statements of Q-Free ASA and its subsidiaries as at 31 December each year.
The fi nancial statements of the subsidiaries are prepared for the same reporting period as the parent company, using consistent accounting
policies.
Minority interests represent the portion of profi t or loss and net assets not held by the Group and are presented separately in the income
statement and within equity in the consolidated balance sheet, separately from parent shareholders’ equity. Acquisitions of minority interests
are accounted for using the parent entity extension method, whereby, the difference between the consideration and the book value of the
share of the net assets acquired is recognised as goodwill.
> SHARES IN SUBSIDIARIES
Investments in subsidiaries are accounted for according to the cost method in the parent company’s accounts. The investments are rec-
ognised at their fair value on the date of acquisition. Fair value is attributed to identifi able assets and liabilities. Excess value that cannot be
assigned to identifi able assets is classifi ed as goodwill.
> ELIMINATION OF TRANSACTIONS
Intra-Group balances and unrealised gains and losses that arise between Group entities are eliminated at consolidation. Unrealised gains
from transactions with associates are eliminated proportionally against the investment. Unrealised losses are eliminated correspondingly,
unless they are related to impairment. All intra-Group transactions are eliminated in the consolidation process.
> MINORITY INTERESTS
The minority interests include the minority’s share of the carrying amount of subsidiaries, including the share of identifi ed excess value on the
date when a subsidiary is acquired.
Losses in a consolidated subsidiary that can be attributed to the minority interests cannot exceed the minority’s share of equity in the con-
solidated subsidiary. Excess losses are recognised against the equity holders of the parent in the subsidiary to the extent that the minority is
not obligated and can incur its share of the loss. If the subsidiary starts making a profi t, the majority’s share of the subsidiary’s equity shall be
adjusted until the minority’s share of past losses are covered.
3.1 : BUSINESS COMBINATIONS AND GOODWILL
Business combinations are accounted for using the acquisition method. The cost of an acquisition is measured as the fair value of the assets
given, equity instruments issued and liabilities incurred or assumed at the date of exchange, plus costs directly attributal to the acquisition.
( ANNUAL ACCOUNTS )
Identifi ed assets acquired and liabilities and contingent liabilities assumed in a business combination are measured initially at fair values at the
date of an acquisition, irrespective of the extent of any minority interests.
Goodwill is initially measured at cost being the excess of the cost of the business combination over the Group’s share in the net fair value of
the acquiree’s identifi ed assets, liabilities and contingent liabilities. If the cost of acquisition is less than the fair value of the net assets of the
subsidiary acquired, the difference is recognised directly in the income statement.
After initial recognition, goodwill is measured at cost less any accumulated impairment losses. For the purpose of impairment testing, good-
will acquired in a business combination is, from the acquisition date, allocated to each of the Group’s cash generating units that are expected
to benefi t from the synergies of the combination, irrespective of whether other assets or liabilities of the acquiree are assigned to those units.
Where goodwill forms part of a cash-generating unit and part of the operation within that unit is disposed of, the goodwill associated with
the operation disposed of is included in the carrying amount of the operation when determining the gain or loss on disposal of the operation.
Goodwill disposed of in this circumstance is measured based on the relative values of the operation disposed of and the portion of the cash-
generating unit retained.
When the Group acquires a business, derivatives separated from the host contract by the acquiree are not reassessed on acquisition unless
the business combination results in a change in the terms of the contract that signifi cantly modifi es the cash fl ows that would otherwise be
required under the contract.
3.2 : RECOGNITION OF REVENUES
Revenues are recognised when it is probable that transactions will generate future fi nancial benefi ts that will accrue to the company and the
size of the amount can be reliably estimated. Sales revenue are presented net of value added tax and discounts. Q-Free’s business activi-
ties are product and system deliveries as well as provision of service and maintenance and license revenues within the tolling business with
a length in time from a couple of months up till two to three years. Q-Free distinguishes between construction contracts/system deliveries,
goods/standard production, services/maintenance and license revenues. Governmental grants is classifi ed as “Other income”.
> CONSTRUCTION CONTRACTS/SYSTEM DELIVERIES
Revenues relating to construction contracts or system deliveries are recognised in the income statement according to the stage of comple-
tion. Stage of project completion is calculated as accrued production costs as a percentage of total anticipated production costs. Total
anticipated production costs are estimated on the basis of a combination of historical fi gures, the follow up of effi ciency targets and best esti-
mates. If the project’s results cannot be reliably estimated, only revenue equal to the accrued project costs will be recognized as revenue. Any
estimated loss on a contract will be recognised in the income statement for the period when it is identifi ed that the project will lead to a loss.
Change orders are defi ned as additions to existing contracts. Change orders are recognised when the probability of customer acceptance
of the change order can be ascertained with a high degree of probability. Additional contractual services and estimated additional costs are
included in the original project prognosis and recognised as income with a shared profi t on the contract and the same degree of completion.
Invoicing normally takes place when contractually agreed milestones are reached. Differences between invoicing and revenue recognition are
shown as “Work in Progress” in the balance sheet. Advance payments from the customers are presented under current liabilities.
> SERVICE AND MAINTENANCE FEES
Services delivered which are not part of a construction contract or licensed sales are recognised as revenue incrementally as the service and
maintenance is provided, as described under construction contracts.
> GOODS/STANDARD PRODUCTION
Revenues from the sale of goods are recognised in the income statement once delivery has taken place, the risk has been transferred and
the company has established a receivable due by customer.
> LICENSE REVENUES
The Group also sells licences for the use of software systems. Licence revenues are normally recognised as revenue in their entirety when
the system is delivered. For a defi nition of when a product is considered to have been delivered, see the description under “Goods/standard
production” above.
> GOVERNMENTAL GRANTS
Subsidies from the authorities are not recognised until it is reasonably certain that the company will meet the conditions stipulated in connec-
tion with the receipt of the subsidies and that the subsidies actually will be granted. The recognition of subsidies is postponed and amortised
over the period that the costs relating to that which the subsidies are intended for are incurred. Subsidies are recognised as deductions from
Q-FREE / ANNUAL / REPORT / 2009 (54 + 55)

the cost that the subsidy is meant to cover. Subsidies received to buy non-current assets are capitalised. Government grants are accounted
as other operating income when the cost are incurred or as reduction of personnel expenses if the Group has approved projects in the gov-
ernmental tax relief program “Skattefunn”. Further details are given in Note 8.
3.3 : FOREIGN CURRENCY
Functional currency and presentation currency
The consolidated fi nancial statements are presented in NOK, which is the Company’s functional and presentation currency. Each entity
in the group determines its own functional currency and items included in the fi nancial statements of each entity are measured using that
functional currency. Transactions in foreign currencies are initially recorded at the functional currency rate ruling at the date of the transac-
tion. Monetary assets and liabilities denominated in foreign currencies are retranslated at the functional currency rate of exchange ruling at
the balance sheet date. All differences regarding retranslation are included in the profi t and loss account.
> GROUP COMPANIES
The assets and liabilities of foreign operations are translated into NOK at the rate of exchange prevailing at the reporting date and their
income statements are translated at exchange rates prevailing at the date of the transactions. The exchange differences arising on the
translation are recognised in other comprehensive income. On disposal of a foreign operation, the component of other comprehensive
income relating to that particular foreign operation is recognised in the income statement.
3.4 : PROVISIONS
Provisions are recognised when the Group has an obligation (legal or constructive) as a result of a past event, it is probable that an outfl ow
of resources embodying fi nancial benefi ts will be required to settle the obligation and a reliable estimate can be made of the amount of the
obligation. Provisions are reviewed on each balance sheet date and refl ect the best estimate of the liability. When the effect on time is insig-
nifi cant, the provisions will be equal to the size of the expense required to be released of the liability. When the effect of time is signifi cant,
the provisions will be the present value of future payments to cover the liability. Further details are given in Note 21.
3.5 : FINANCIAL INSTRUMENTS
> FINANCIAL ASSETS AND LIABILITIES
Financial assets and liabilities consist of derivatives, investments in shares, accounts receivable and other receivables, cash and cash
equivalents, loans, accounts payable and other liabilities.
A fi nancial instrument is recognised when the Group becomes party to the instrument’s contractual provisions. Upon initial recognition,
fi nancial assets and liabilities are measured at fair value plus directly attributable expenses. Transaction costs relating to the acquisition
or incurrence of fi nancial instruments at fair value through profi t or loss are however recognised in profi t or loss as they are incurred. An
ordinary purchase or sale of fi nancial assets is recognised and derecognised from the time an agreement is signed. Financial assets are
derecognised when the Group’s contractual rights to receive cash fl ows from the assets expire, or when the Group transfers the asset to
another party and does not retain control, or transfers practically all risks and rewards associated with the asset. Financial liabilities are
derecognised when the Group’s contractual obligation has been satisfi ed, discharged or cancelled.
> CLASSIFICATION
Q-Free classifi es fi nancial assets and liabilities according to IAS 39 in the following categories: fi nancial assets and liabilities at fair value
through the profi t or loss, loans and receivables, loans and borrowings and other fi nancial liabilities.
Financial assets and liabilities through profi t and loss includes fi nancial assets held for trading and derivative fi nancial instruments that are
not designated as hedging instruments in hedge relationships as defi ned in IAS39. Subsequent changes in fair value are carried in the
statement of fi nancial position at fair value with changes in fair value recognised in fi nance income or fi nance cost in the income statement.
After initial measurement loans and receivables are measured at amortised cost, less impairment for expected losses. The Group’s loans
and borrowings are subsequent to initial recognition measured at amortised cost using the effective interest rate method.
Further details on fi nancial risk management are given in note 4.
> IMPAIRMENT OF FINANCIAL ASSETS
The Group assesses at each reporting date whether there is any objective evidence that a fi nancial asset or a group of fi nancial assets is
impaired.
A fi nancial asset or a group of fi nancial assets is deemed to be impaired if, and only if, there is objective evidence of impairment as a result
of one or more events that has occurred after the initial recognition of the asset (an incurred loss event) and that loss event has an impact
on the estimated future cash fl ows of the fi nancial asset or the group of fi nancial assets that can be reliably estimated. Evidence of impair-
( ANNUAL ACCOUNTS )

ment may include indications that the debtors or a group of debtors is experiencing signifi cant fi nancial diffi culty, default or delinquency in
interest or principal payments, the probability that they will enter bankruptcy or other fi nancial reorganisation and where observable data
indicate that there is a measurable decrease in the estimated future cash fl ows, such as changes in arrears or economic conditions that
correlate with defaults.
If, in a subsequent period, the amount of the impairment loss decreases and the decrease can be related objectively to an event occurring
after the impairment was recognised, the previously recognised impairment loss is reversed, to the extent that the carrying value of the
asset does not exceed its amortised cost at the reversal date. Any subsequent reversal of an impairment loss is recognised in profi t or loss.
3.6 : PROPERTY, PLANT AND EQUIPMENT
Property, plant and equipment are stated at cost less accumulated depreciation and any accumulated impairment losses. Depreciation is
calculated to reduce the cost of assets, other than land that is not depreciated, to their estimated residual value, if any, over their estimated
useful lives. The cost of assets include professional fees. Depreciation commences when the assets are ready for their intended use.
Depreciation is calculated on a straight-line basis over the following periods of time :
> MACHINERY AND LAB EQUIPMENT: 4 - 6 YEARS
> OFFICE AND COMPUTER EQUIPMENT: 3 – 5 YEARS
> BUILDING INSTALLATIONS: 5 - 7 YEARS, DISTRIBUTED OVER THE REMAINING RENTAL PERIODS.
3.7 : INTANGIBLE ASSETS
Intangible assets acquired separately are measured initially at cost. The cost of intangible assets acquired in a business combination is the
fair value at the date of acquisition. Following initial recognition, intangible assets are carried at cost less any accumulated amortisation and
any accumulated impairment losses.
The useful lives of intangible assets are assessed as either fi nite or indefi nite.
Intangible asset with fi nite lives are amortised over the useful fi nancial lives. Useful lives and amortisation method for intangible assets with
fi nite useful life is reviewed at least annually. The straight-line depreciation method is used for intangible assets as this best refl ects the con-
sumption of the assets.
> RESEARCH AND DEVELOPMENT
Expenses for research activities are recognised and expensed as they accrue.
Expenses related to product development activities are capitalised if the product development activities comply with defi ned criteria for
capitalisation. Capitalisation assumes it is possible to identify the intangible asset to be developed and demonstrated that it is likely that
the development work will be successful, and that the future fi nancial benefi ts attached to the intangible asset will accrue to the enterprise.
Depreciation is carried out using the straight-line method over the estimated useful lifetime. The estimated useful lifetime is continuously
evaluated.
If the criteria are satisfi ed, expenses recognised on the balance sheet will include the cost of materials, direct payroll expenses and a per-
centage of the directly allocated administration expenses. Capitalised development costs are recognised on the balance sheet at acquisi-
tion cost less accumulated depreciation and write-downs.
Expenses related to ongoing efforts to improve a product or enhance a product’s quality are defi ned as product maintenance and expensed
as they incur.
3.8 : IMPAIRMENT OF NON-FINANCIAL ASSETS
All non-fi nancial assets, with the exception of inventories and deferred tax assets, are reviewed for each reporting period to determine
whether there are indications of impairment. Where indications of impairment exist, recoverable amounts are calculated. For goodwill, the
recoverable amount per cash-generating units is estimated every year at the same time. Impairment testing is described in Note 12 “Impair-
ment test of goodwill”.
The recoverable amount of an asset or cash-generating unit is its value in use or fair value less costs to sell, whichever is higher. Value in use
is calculated as the net present value of future cash fl ows. The calculation of net present value uses a discount rate that is before tax and
refl ects current market assessments of the time value of money and the risks specifi c to the asset. The recoverable amount is calculated
on the basis of the estimated future cash fl ow based on the Group’s budget and strategic plans for the upcoming fi ve-year planning period.
The budget has been approved by Q-Free’s management and Board of Directors.
Q-FREE / ANNUAL / REPORT / 2009 (56 + 57)

Impairment is recognised if the carrying amount of an asset or cash-generating unit exceeds its recoverable amount. A cash-generating unit is
the smallest identifi able group that generates a cash infl ow that is largely independent of other assets or groups. Impairment related to cash-
generating units is intended fi rst to reduce the carrying amount of any goodwill allocated to the unit and then to reduce the carrying amount
of the other assets in the unit on a pro-rated basis. These assets will normally be property, plant and equipment, and other intangible assets.
> GOODWILL
Goodwill from an acquisition of a business activity (business combination) is identifi ed if the consideration exceeds the value of identifi able
assets and liabilities. Goodwill is recognised on the balance sheet at cost less any accumulated impairment loss. Goodwill is allocated to
cash-generating units that are expected to gain fi nancial benefi ts from the synergies of the business combination. A cash-generating unit is
the smallest identifi able group that generates a cash infl ow that is largely independent from other assets or groups. Goodwill is non-depreci-
able, but tested for impairment annually in Q4, and whenever there are indications of impairment on the balance sheet date. Impairment of
goodwill cannot be reversed.
Impairment is calculated by comparing the recoverable amount with the individual cash-generating unit’s carrying amount. The recoverable
amount is the value in use or net realisable value, whichever is higher. In estimating value in use, expected future cash fl ows are discounted
to net present value using a discount rate before tax that refl ects today’s market assessments of the time value and the specifi c risk attached
to the asset. Goodwill is described in Note 12 “Impairment test of goodwill”.
3.9 : SHARE BASED PAYMENT
The group has a share option program for key employees. To the extent share options or shares are issued to lower than market price, the
difference between market price and issue price is reported as payroll expense.
The cost of equity-settled transactions with employees is measured to fair value at grant date. The cost of equity-settled transactions is rec-
ognised, together with a corresponding increase in equity, over the year in which the performance conditions are fulfi lled, ending on the date
on which the relevant employees become fully entitled to the award (vesting date). The market value of granted share options are measured
by using Black & Sholes model which take into consideration time and conditions of the share options.
Social security tax is accrued each quarter on the difference between the market value and the exercise value of the granted but not exer-
cised share options.
3.10 : BORROWING COSTS
Borrowing costs are expensed when incurred. Interest expenses on loans are recognised using the effective interest method of accounting.
3.11 : INVENTORIES
Inventories under manufacturing are estimated to lowest of manufacturing cost and net realisable value. For fi nished goods, the net realisable
value is calculated as the sales value less selling costs. For work in progress and fi nished products, the acquisition cost is calculated as direct
and indirect costs. Inventories are assessed using the FIFO method.
3.12 : LEASES
“The determination of whether an arrangement is, or contains, a lease is based on the substance of the arrangement at inception date:
whether fulfi lment of the arrangement is dependent on the use of a specifi c asset or assets or the arrangement conveys a right to use the
asset.
> GROUP AS A LESSEE
Finance leases, which transfer to the Group substantially all the risks and benefi ts incidental to ownership of the leased item, are capitalised
at the commencement of the lease at the fair value of the leased property or, if lower, at the present value of the minimum lease payments.
Lease payments are apportioned between fi nance charges and reduction of the lease liability so as to achieve a constant rate of interest on
the remaining balance of the liability. Finance charges are recognised in the income statement.
Leased assets are depreciated over the useful life of the asset. However, if there is no reasonable certainty that the Group will obtain owner-
ship by the end of the lease term, the asset is depreciated over the shorter of the estimated useful life of the asset and the lease term.
Operating lease payments are recognised as an expense in the income statement on a straight line basis over the lease term.
> GROUP AS A LESSOR
Leases where the Group does not transfer substantially all the risks and benefi ts of ownership of the asset are classifi ed as operating leases.
Initial direct costs incurred in negotiating an operating lease are added to the carrying amount of the leased asset and recognised over the
lease term on the same bases as rental income. Contingent rents are recognised as revenue in the period in which they are earned
( ANNUAL ACCOUNTS )
3.13 : INVESTMENT IN SHARES
Investments in shares are classifi ed as fi nancial assets at fair value through profi t or loss. The fair value of investments are determined by
reference to quoted market bid prices at the close of business on the balance sheet date. For investments where there are no active market,
fair value is determined applying commonly used valuation techniques. For further details see note 13.
3.14 : ACCOUNTS RECEIVABLE AND OTHER RECEIVABLES
Accounts receivable and other receivables are entered at face value after deduction for provision for impairments on receivables. Provision for
impairment on receivables is done on the basis of an individual assessment of each receivable and overall an assessment of the total portfolio
of receivables.
A provision for impairment is made when there is objective evidence (such as the probability of insolvency or signifi cant fi nancial diffi culties
of the debtor) that the Group will not be able to collect all of the amounts due under the original terms of the invoice. The carrying amount of
the receivable is reduced through use of an allowance account. Impaired debts are derecognised when they are assessed as uncollectable.
3.15 : PENSION COSTS AND PENSION ASSETS AND LIABILITIES
Q-Free ASA has a defi ned benefi t- and a defi ned contribution pension plan for the employees. Both pension plans meet the criteria for
OTP. Pension cost are calculated according to IAS 19 for both plans. Net pension cost for the year include estimated pension contribution
including future salary growth, estimated return on pension funds and potential effects of changes in pension plans and estimates. Net pen-
sion cost are classifi ed as payroll expense in the profi t and loss statement. Pension funds and pension liabilities are valued based on best
estimates adjusted annually based on actuary reports. The accumulated effects from changes in actuarial and fi nancial assumptions are dis-
tributed over the remaining recognition period for the portion of the change exceeding more than 10% of the largest of pension liabilities and
pension funds as of 1 January. The pension liabilities are secured through an insurance company.
3.16 : TAXES
Tax is expensed as it accrues, i.e. the tax is related to the accounting net profi t. Tax includes both payable tax (tax on the year’s taxable result)
and changes in net deferred tax/tax assets. Income from long-term production contracts is not recognised for tax purposes until the contract
has been completed. A change in deferred tax/tax assets refl ects future payable tax that arises as a result of the year’s activities. Deferred
tax and deferred tax assets are presented net in the balance sheet. Capitalisation of the deferred tax asset has been made on the basis of
anticipated future earnings where the tax assets will be applicable.
Tax on group contribution given from the parent company and tax on group contribution that is entered directly against equity, is entered
directly against payable tax in the balance sheet. Deferred tax asset is calculated at nominal value in both the company accounts as well as
the consolidated accounts.
Deferred taxes are calculated on net tax-increasing differences between the balance sheet items used for accounting purposes and those
used for taxation purposes, adjusted for temporary tax-decreasing differences and tax losses carried forward according to the liability method.
3.17 : CASH AND CASH EQUIVALENTS
Cash includes cash in hand and at bank. Cash equivalents are short-term liquid investments that can be converted into cash within six
months and to a known amount, and which contain insignifi cant risk elements.
3.18 : CASH FLOW STATEMENT
The cash fl ow statement is prepared according to the indirect method. Cash is considered as a deposit at call in bank or similar fi nancial
institutions. Consented, not full-drawn bank overdrafts is not considered liquid capital. All items in the cash fl ow statement is net effects from
the continued operation unless stated otherwise.
3.19 : EVENTS AFTER THE BALANCE SHEET DATE
New information on the company’s positions at the balance sheet date is taken into account in the annual fi nancial statements. Events after
the balance sheet date that do not affect the company’s position at the balance sheet date, but which will affect the company’s position in the
future, are stated if signifi cant. No such signifi cant events has occurred in 2010.
3.20 : BUSINESS SEGMENTS
For management purposes, the Group is organised into geographical areas based on the location of the customer. Transfer prices between
operating segments are on an arm’s length basis, similar to transactions with third parties. Further details on the groups reporting segments
are given in note 7.
Q-FREE / ANNUAL / REPORT / 2009 (58 + 59)

3.21 : CHANGES IN ACCOUNTING POLICY AND DISCLOSURES
The accounting policies adopted are consistent with those of the previous fi nancial years.
The below listed standards or interpretations are adopted by the Group. The adaptation of the standards and interpretations has no impact
on the fi nancial statements or performance of the Group.
IFRS 7 FINANCIAL INSTRUMENTS: DISCLOSURES EFFECTIVE 1 JANUARY 2009
IAS 1 PRESENTATION OF FINANCIAL STATEMENTS EFFECTIVE 1 JANUARY 2009
IAS 23 BORROWING COSTS (REVISED) EFFECTIVE 1 JANUARY 2009
IAS 32 FINANCIAL INSTRUMENTS: PRESENTATION AND IAS 1 PUTTABLE FINANCIAL INSTRUMENTS AND OBLIGATIONS ARISING ON
LIQUIDATION EFFECTIVE 1 JANUARY 2009
IAS 39 FINANCIAL INSTRUMENTS: RECOGNITION AND MEASUREMENT - ELIGIBLE HEDGED ITEMS EFFECTIVE 1 JULY 2009
IFRIC 9 REMEASUREMENT OF EMBEDDED DERIVATIVES AND IAS 39 FINANCIAL INSTRUMENTS: RECOGNITION AND MEASUREMENT
EFFECTIVE FOR PERIODS ENDING ON OR AFTER 30 JUNE 2009
IFRIC 13 CUSTOMER LOYALTY PROGRAMMES EFFECTIVE 1 JULY 2008
IFRIC 16 HEDGES OF A NET INVESTMENT IN A FOREIGN OPERATION EFFECTIVE 1 OCTOBER 2008
IFRIC 18 TRANSFERS OF ASSETS FROM CUSTOMERS EFFECTIVE 1 JULY 2009
IMPROVEMENTS TO IFRSS (MAY 2008)
3.22 : NEW STANDARDS AND INTERPRETATIONS NOT YET ADOPTED
The following are new IFRS standard, amendments and interpretations not effective for the year ended 31. December 2009, and have not
been applied in preparation of these consolidated fi nancial statements.
IFRS 2 SHARE-BASED PAYMENT: GROUP CASH-SETTLED SHARE-BASED PAYMENT TRANSACTIONS EFFECTIVE 1 JANUARY 2010
IFRS 3 REVISION OF IFRS 3 BUSINESS COMBINATIONS
IFRS 9 FINANCIAL INSTRUMENTS
IAS 24 RELATED PARTY DISCLOUSURES
IAS 27 CONSOLIDATED AND SEPARATE FINANCIAL STATEMENTS
AMENDMENT TO IAS 32 CLASSIFICATION OF RIGHTS ISSUED
AMENDMENT TO IAS 39 ELIGIBLE HEDGED ITEMS
IFRIC 12 SERVICE CONCESSION ARRANGEMENTS
IFRIC 15 AGREEMENTS FOR THE CONSTRUCTIONS OF REAL ESTATE
IFRIC 17 DISTRIBUTIONS OF NON-CASH ASSETS TO OWNERS
IFRIC 18 TRANSFER OF ASSETS FROM CUSTOMERS
NOTE 4. FINANCIAL RISK MANAGEMENT
Q-Free has centralised management of fi nancial risk. The Board has adopted guidelines for the Group’s fi nancial risk management, which
are embodied in the corporate Financial Policy. Q-Free seeks to limit fi nancial risk and increase predictability while exploiting fi nance as a
competitive factor.
The Group is exposed to different fi nancial market risks arising from our normal business activities, mainly these:
A) CREDIT RISK
B) CURRENCY RISK
C) LIQUIDITY RISK
D) INTEREST RATE RISK
A) CREDIT RISK
The Group is conducting business with parties with an acceptable credit record. To the extent the credit rate is questionable, payment guar-
antees, letter of credit or advance payments will be considered. The Group has no signifi cant credit risk linked to an individual contracting
party or several other contracting parties that can be regarded as a group due to similarities in the credit risk. The Group has guidelines for
ensuring that sales are only made to customers that have not experienced any signifi cant credit problems, and that outstanding amounts
do not exceed given credit limits. The Group is exposed to risk involved in customers not having the ability to fulfi l their fi nancial obliga-
tions. However, this risk is considered to be low since the Company’s customers are major IT companies, public authorities, larger foreign
road operators and key road concessionaires in Norway and abroad. This is documented by a historically low bad debt ratio on accounts
( ANNUAL ACCOUNTS )

receivables . When the Company enters a new market, the credit risk will be assessed in each individual case and appropriate actions like
utilising letter of credits and other similar tools, will be used in order to reduce credit risk.
An aging analysis of trade receivables as at 31. December 2008 and 2009 are given in note 17.
B) CURRENCY RISK
Q-Free has considerable foreign currency exposure since it earns between 70-85% of its revenues abroad. Q-Free also buys a substantial
share of its needed equipment and services abroad and runs businesses outside Norway. This mitigates the Group’s net foreign currency
exposure by 30-50%. The Group’s most important trading currency except for NOK, is EURO. Q-Free’s policy is to limit currency risk while
actively assessing various currencies’ importance as competitive parameters.
The Group strategy is to combine estimated future sales and purchases and hedge the net cash fl ow in the foreign currency by using forward
/ future contracts. The effects of the forward/ future contracts as effi cient hedging instruments are recognised with the transaction they are to
hedge, while a possible ineffi ciency in the hedging is recognised as a fi nance cost.
Forward currency contracts are being used to hedge the foreign currency risk of the expected future sales. The Group holds two foreign
exchange contracts as at 31 December 2009 and these are assessed with an unrealised gain on TNOK 137. (2008: Nil). These foreign
exchange contracts are classifi ed as other fi nancial assets measured as fair value. See note 23 for the fair value hierarchy and a specifi cation
on valuation technique applied.
See note 23 for a presentation of a sensitivity analysis regarding changes in EURO as at 31. December 2008 and 2009 and how this will
affect the Group’s EBIT.
C) LIQUIDITY RISK
The Q-Free ASA Group’s strategy is to have suffi cient cash, cash equivalents or credit facilities at any time to be able to fi nance its operations
and investments over the next three years as required in the company’s strategy plan for the same period. Surplus liquidity is either deposited
in banks or invested in money market funds, with the purpose of obtaining an acceptable return on invested capital combined with a low risk.
See note 24 for a presentation of the Group’s maturity profi le of the Group’s fi nancial liabilities as at 31 December 2008 and 2009.
D) INTEREST-RATE RISK
The Group is exposed to interest rate risk through funding and cash management activities. Changes in interest rates affect the fair value of
assets and liabilities. Interest income and interest expense in the income statement are infl uenced by changes in interest rates in the market.
The main consideration regarding management of interest rate risk is to reduce the fi nancial risk and minimise interest cost over time. The
Group emphasises predictability at all times when changes in the interest level have a signifi cant infl uence on the consolidated profi t and will
take actions to hedge this risk.
See note 23 for a presentation of a sensitivity analysis regarding changes in the interest rate and how this will affect the Group’s EBIT as at
31 December 2008 and 2009.
NOTE 5. BUSINESS COMBINATIONSACQUISITIONS IN 2008
> ACQUISITIONS OF DACOLIAN BV
On 13th of August 2008 the Group acquired 70 percent of the voting shares of Dacolian BV, and has an option and an obligation to buy
remaining shares, within 1. May 2010, according to an Earn-Out model. The main activities of Dacolian include the development and com-
mercialisation of OEM software connected to video and picture processing to be used in Intelligent Traffi c Systems (ITS).
Q-Free has an option and an obligation to buy the remaining shares during the coming two years. Total payment for 100% of the shares in
Dacolian will depend on Dacolian’s development in 2008 and 2009, but will amount to a minimum of EUR 7.1 million and a maximum of EUR
13,1 million. The consideration for the shares will be a combination of cash and Q-Free shares at a ratio of approximately 60/40, but no less
than 60% in cash. Tranche 1 as the initial payment of the 70 percent of shares consits of TNOK 39,648 in cash and TNOK 31,049 in shares.
Q-Free ASA increased the share capital of the company of NOK 646,738.72 and issued 1,701,944 new shares related to the acquisition of
Dacolian shares. The subscription rate is NOK 9.8797 per share, which refl ects a total payment of NOK 16,814,700 (the equivalent of EUR
2,100,000 based on the exchange rate EUR/NOK 8.007 as at August 12 2008). The share premium of NOK 16,167,961.28, equivalent to
NOK 9.4997 per share, is transferred to the share premium reserve.
Q-FREE / ANNUAL / REPORT / 2009 (60 + 61)
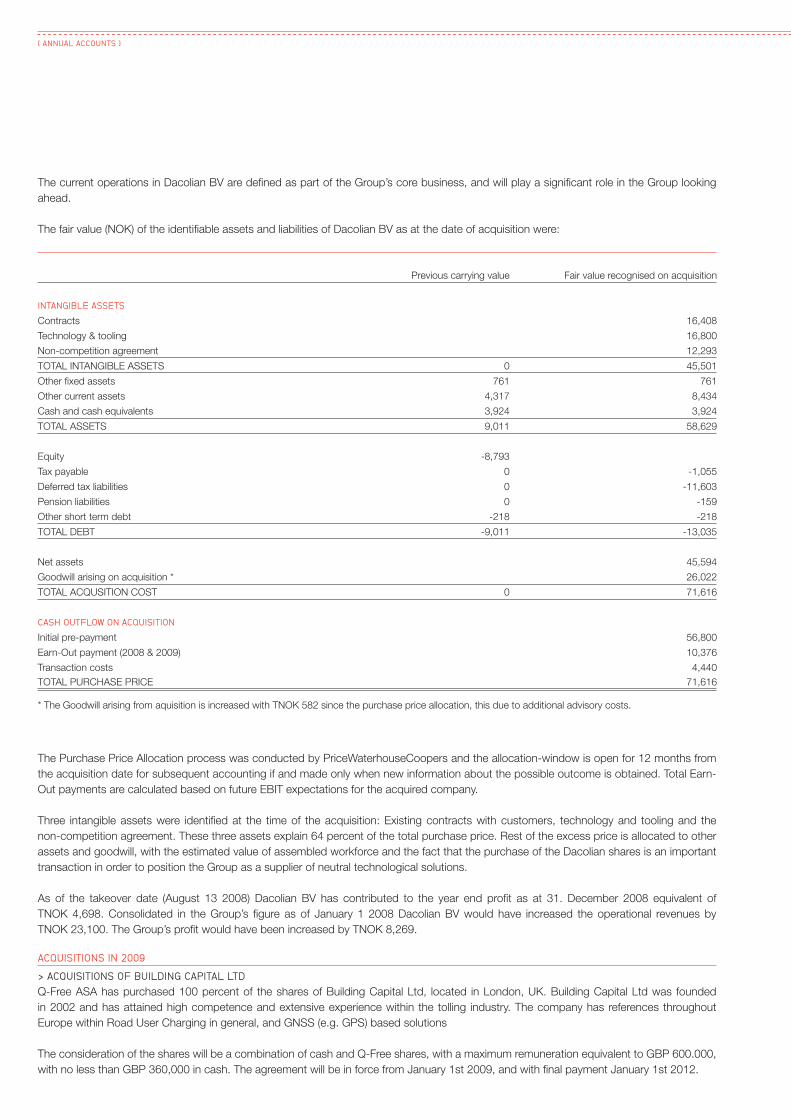
The current operations in Dacolian BV are defi ned as part of the Group’s core business, and will play a signifi cant role in the Group looking
ahead.
The fair value (NOK) of the identifi able assets and liabilities of Dacolian BV as at the date of acquisition were:
Previous carrying value Fair value recognised on acquisition
INTANGIBLE ASSETS
Contracts 16,408
Technology & tooling 16,800
Non-competition agreement 12,293
TOTAL INTANGIBLE ASSETS 0 45,501
Other fi xed assets 761 761
Other current assets 4,317 8,434
Cash and cash equivalents 3,924 3,924
TOTAL ASSETS 9,011 58,629
Equity -8,793
Tax payable 0 -1,055
Deferred tax liabilities 0 -11,603
Pension liabilities 0 -159
Other short term debt -218 -218
TOTAL DEBT -9,011 -13,035
Net assets 45,594
Goodwill arising on acquisition * 26,022
TOTAL ACQUSITION COST 0 71,616
CASH OUTFLOW ON ACQUISITION
Initial pre-payment 56,800
Earn-Out payment (2008 & 2009) 10,376
Transaction costs 4,440
TOTAL PURCHASE PRICE 71,616
* The Goodwill arising from aquisition is increased with TNOK 582 since the purchase price allocation, this due to additional advisory costs.
The Purchase Price Allocation process was conducted by PriceWaterhouseCoopers and the allocation-window is open for 12 months from
the acquisition date for subsequent accounting if and made only when new information about the possible outcome is obtained. Total Earn-
Out payments are calculated based on future EBIT expectations for the acquired company.
Three intangible assets were identifi ed at the time of the acquisition: Existing contracts with customers, technology and tooling and the
non-competition agreement. These three assets explain 64 percent of the total purchase price. Rest of the excess price is allocated to other
assets and goodwill, with the estimated value of assembled workforce and the fact that the purchase of the Dacolian shares is an important
transaction in order to position the Group as a supplier of neutral technological solutions.
As of the takeover date (August 13 2008) Dacolian BV has contributed to the year end profi t as at 31. December 2008 equivalent of
TNOK 4,698. Consolidated in the Group’s fi gure as of January 1 2008 Dacolian BV would have increased the operational revenues by
TNOK 23,100. The Group’s profi t would have been increased by TNOK 8,269.
ACQUISITIONS IN 2009
> ACQUISITIONS OF BUILDING CAPITAL LTD
Q-Free ASA has purchased 100 percent of the shares of Building Capital Ltd, located in London, UK. Building Capital Ltd was founded
in 2002 and has attained high competence and extensive experience within the tolling industry. The company has references throughout
Europe within Road User Charging in general, and GNSS (e.g. GPS) based solutions
The consideration of the shares will be a combination of cash and Q-Free shares, with a maximum remuneration equivalent to GBP 600.000,
with no less than GBP 360,000 in cash. The agreement will be in force from January 1st 2009, and with fi nal payment January 1st 2012.
( ANNUAL ACCOUNTS )
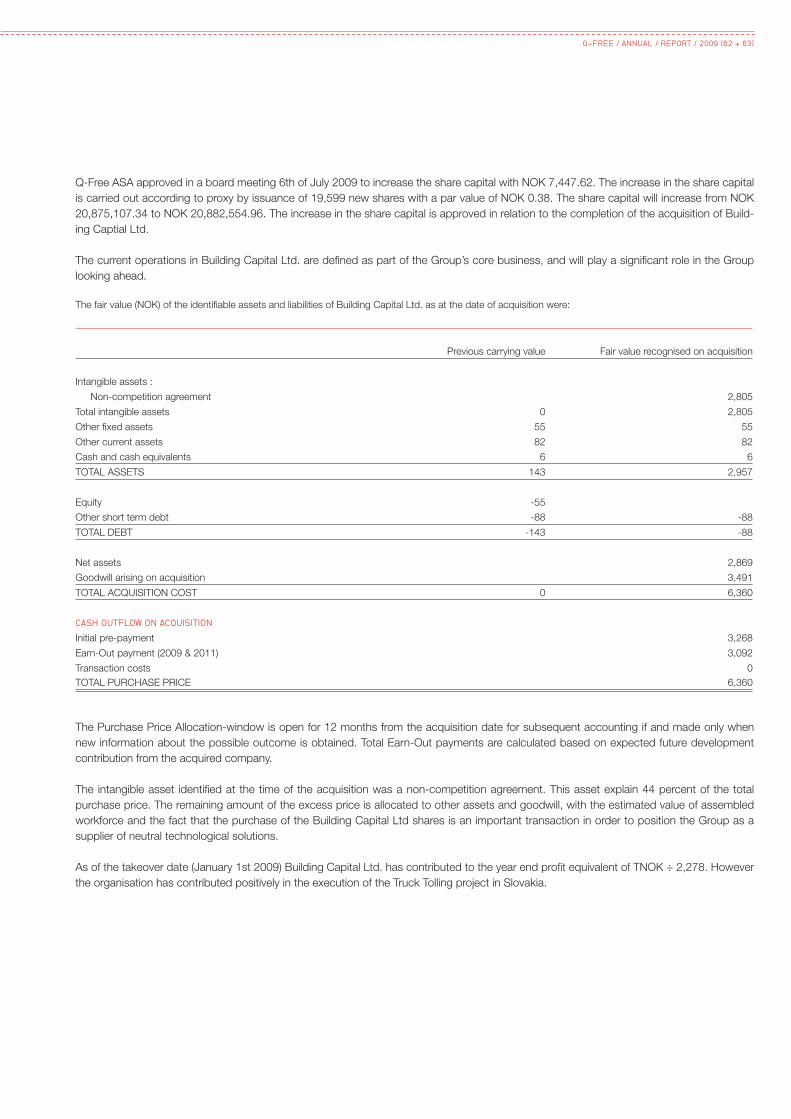
Q-Free ASA approved in a board meeting 6th of July 2009 to increase the share capital with NOK 7,447.62. The increase in the share capital
is carried out according to proxy by issuance of 19,599 new shares with a par value of NOK 0.38. The share capital will increase from NOK
20,875,107.34 to NOK 20,882,554.96. The increase in the share capital is approved in relation to the completion of the acquisition of Build-
ing Captial Ltd.
The current operations in Building Capital Ltd. are defi ned as part of the Group’s core business, and will play a signifi cant role in the Group
looking ahead.
The fair value (NOK) of the identifi able assets and liabilities of Building Capital Ltd. as at the date of acquisition were:
Previous carrying value Fair value recognised on acquisition
Intangible assets :
Non-competition agreement 2,805
Total intangible assets 0 2,805
Other fi xed assets 55 55
Other current assets 82 82
Cash and cash equivalents 6 6
TOTAL ASSETS 143 2,957
Equity -55
Other short term debt -88 -88
TOTAL DEBT -143 -88
Net assets 2,869
Goodwill arising on acquisition 3,491
TOTAL ACQUISITION COST 0 6,360
CASH OUTFLOW ON ACQUISITION
Initial pre-payment 3,268
Earn-Out payment (2009 & 2011) 3,092
Transaction costs 0
TOTAL PURCHASE PRICE 6,360
The Purchase Price Allocation-window is open for 12 months from the acquisition date for subsequent accounting if and made only when
new information about the possible outcome is obtained. Total Earn-Out payments are calculated based on expected future development
contribution from the acquired company.
The intangible asset identifi ed at the time of the acquisition was a non-competition agreement. This asset explain 44 percent of the total
purchase price. The remaining amount of the excess price is allocated to other assets and goodwill, with the estimated value of assembled
workforce and the fact that the purchase of the Building Capital Ltd shares is an important transaction in order to position the Group as a
supplier of neutral technological solutions.
As of the takeover date (January 1st 2009) Building Capital Ltd. has contributed to the year end profi t equivalent of TNOK ÷ 2,278. However
the organisation has contributed positively in the execution of the Truck Tolling project in Slovakia.
Q-FREE / ANNUAL / REPORT / 2009 (62 + 63)

NOTE 6. FINANCIAL ITEMSTHE TABLE SPECIFYING THE FINANCIAL ITEMS
> SPECIFICATION
Figures in TNOK
Parent company Group
2008 2009 2009 2008
CATEGORY
9,794 217 Financial income from group companies 0 0
5,712 1,841 Interest income 5,004 9,682
24,603 26,790 Other fi nancial income 26,835 25,985
468 1,535 Net gain on fi nancial assets and liabilities at fair value 1,559 468
-5,081 -1,154 Interest expenses -3,669 -8,028
0 0 Interest on debt and borrowings -118 -222
-19,262 -22,678 Other fi nancial expenses -22,656 -21,252
0 -27 Financial expenses from group companies 0 0
16,234 6,524 TOTAL 6,955 6,633
For a specifi cation of the changes in market value of fi nancial current assets see note 13.
NOTE 7. SEGMENT INFORMATIONFor management purposes, the Group is organised into geographical areas based on the location of the customer, and has three reportable
operating segments as follows:
EUROPE
ASIA PACIFIC
AMERICAS
Management monitors the operating results of its business units separately for the purpose of making decisions about resource alloca-
tion and performance assessment. Segment performance is evaluated based on operating profi t or loss and is measured consistently with
operating profi t or loss in the consolidated fi nancial statements. However, Group fi nancing (including fi nance costs and fi nance income) and
income taxes are managed on a group basis and are not allocated to operating segments.
( ANNUAL ACCOUNTS )

Operating segments 31.12.09 31.12.08
TNOK Europe Asia Pacifi c Americas TOTAL Europe Asia Pacifi c Americas TOTAL
PROFIT & LOSS ACCOUNT
80% 13% 7% 100% 73% 20% 7% 100%
Revenues 640,251 106,151 58,001 804,403 370,724 103,155 35,366 509,246
Cost of goods sold 209,126 56,513 37,790 303,429 146,683 55,640 17,655 219,978
Payroll expenses 132,467 16,764 4,481 153,712 89,418 14,217 3,853 107,488
Operating expenses 187,611 19,386 5,060 212,057 94,993 15,986 5,568 116,547
Total operating expenses 529,205 92,663 47,331 669,199 331,095 85,843 27,075 444,013
EBITDA 111,046 13,488 10,670 135,205 39,630 17,312 8,291 65,233
Depreciation, amortisation and impairment 31,636 254 571 32,461 19,873 527 550 20,950
EBIT 79,410 13,233 10,099 102,743 19,757 16,785 7,741 44,283
BALANCE SHEET
Non current assets 217,450 12,176 3,833 233,459 190,312 3,015 3,870 197,197
Current assets 453,242 49,958 30,874 534,074 250,483 54,930 11,815 317,228
TOTAL ASSETS 670,692 62,134 34,707 767,534 440,795 57,945 15,685 514,425
BALANCE SHEET
Non current liabilities 29,999 0 0 29,999 13,584 0 0 13,584
Current liabilities 123,531 47,525 17,878 188,935 103,439 42,509 2,415 148,364
TOTAL LIABILITIES 153,530 47,525 17,878 218,933 117,023 42,509 2,415 161,947
KEY FIGURES
Operating profi t margin 12.4% 12.5% 17.4% 12.8% 5.3% 16.3% 21.9% 8.7%
Average annual man years 227 39 8 274 187 31 8 226
Average number of employees 234 40 8 282 191 33 8 232
Revenues from one customer amounted to TNOK 228,959 (2008: nil), arising from the European segment.
Revenue composition
2009 2008
Products 258,068 32% 310,640 61%
Service and maintenance 77,537 10% 86,572 17%
Projects 468,798 58% 112,034 22%
TOTAL REVENUES 804,403 100% 509,246 100%
Order backlog by reporting segments
2009 2008
Europe 593,644 83% 271,094 80%
Asia Pacifi c 67,317 10% 27,109 8%
Americas 52,078 7% 40,664 12%
TOTAL ORDER BACKLOG 713,039 100% 338,868 100%
Q-FREE / ANNUAL / REPORT / 2009 (64 + 65)
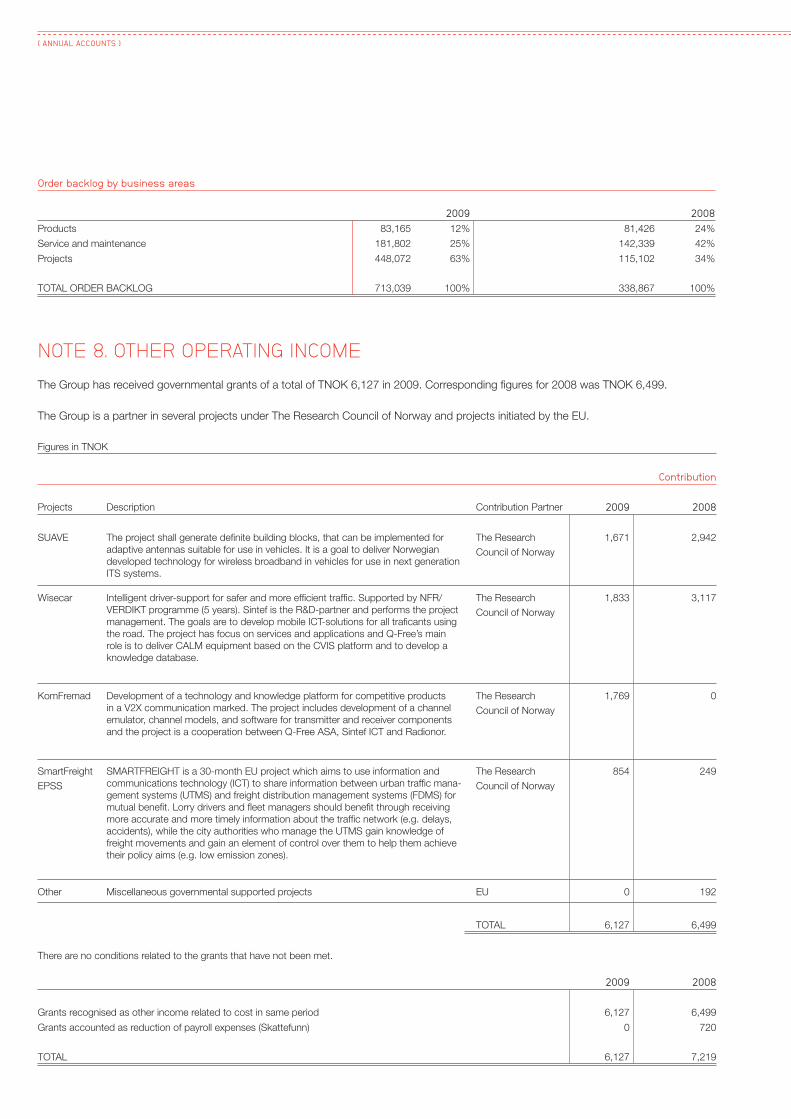
Order backlog by business areas
2009 2008
Products 83,165 12% 81,426 24%
Service and maintenance 181,802 25% 142,339 42%
Projects 448,072 63% 115,102 34%
TOTAL ORDER BACKLOG 713,039 100% 338,867 100%
NOTE 8. OTHER OPERATING INCOME
The Group has received governmental grants of a total of TNOK 6,127 in 2009. Corresponding fi gures for 2008 was TNOK 6,499.
The Group is a partner in several projects under The Research Council of Norway and projects initiated by the EU.
Figures in TNOK
Contribution
Projects Description Contribution Partner 2009 2008
SUAVE The project shall generate defi nite building blocks, that can be implemented for
adaptive antennas suitable for use in vehicles. It is a goal to deliver Norwegian
developed technology for wireless broadband in vehicles for use in next generation
ITS systems.
The Research
Council of Norway
1,671 2,942
Wisecar Intelligent driver-support for safer and more effi cient traffi c. Supported by NFR/
VERDIKT programme (5 years). Sintef is the R&D-partner and performs the project
management. The goals are to develop mobile ICT-solutions for all trafi cants using
the road. The project has focus on services and applications and Q-Free’s main
role is to deliver CALM equipment based on the CVIS platform and to develop a
knowledge database.
The Research
Council of Norway
1,833 3,117
KomFremad Development of a technology and knowledge platform for competitive products
in a V2X communication marked. The project includes development of a channel
emulator, channel models, and software for transmitter and receiver components
and the project is a cooperation between Q-Free ASA, Sintef ICT and Radionor.
The Research
Council of Norway
1,769 0
SmartFreight
EPSS
SMARTFREIGHT is a 30-month EU project which aims to use information and
communications technology (ICT) to share information between urban traffi c mana-
gement systems (UTMS) and freight distribution management systems (FDMS) for
mutual benefi t. Lorry drivers and fl eet managers should benefi t through receiving
more accurate and more timely information about the traffi c network (e.g. delays,
accidents), while the city authorities who manage the UTMS gain knowledge of
freight movements and gain an element of control over them to help them achieve
their policy aims (e.g. low emission zones).
The Research
Council of Norway
854 249
Other Miscellaneous governmental supported projects EU 0 192
TOTAL 6,127 6,499
There are no conditions related to the grants that have not been met.
2009 2008
Grants recognised as other income related to cost in same period 6,127 6,499
Grants accounted as reduction of payroll expenses (Skattefunn) 0 720
TOTAL 6,127 7,219
( ANNUAL ACCOUNTS )

NOTE 9. TAXES
Parent company Group
2008 2009 2009 2008
TOTAL TAX EXPENSES FOR THE YEAR
0 324 Tax payable on this years profi t for Norwegian companies 324 3,122
0 0 Tax payable on this years profi t for foreign companies 4,959 2,804
0 0 Adjusted allocated tax from last year 0 -55
3,620 18,355 Change in deferred tax for Norwegian companies 18,223 4,100
0 0 Change in deferred tax for foreign companies 8,044 4,658
3,620 18,679 TOTAL 31,549 14,628
18% 26% Tax rate 29% 29%
TAX PAYABLE FOR THE YEAR
20,264 70,877 Total ordinary profi t before tax
0 -3,067 Permanent differences
-7,334 -125,175 Change in temporary differences
-12,930 0 Utilisation of previously unrecognised tax losses
0 -57,365 BASIS FOR TAX PAYABLE, NORWEGIAN COMPANIES 0 0
0 0 Tax payable for Norwegian companies (28%) 0 3,122
Tax payable for foreign companies 4,959 2,804
SPECIFICATION OF TAX PAYABLE IN THE BALANCE SHEET
0 324 Tax payable on this years profi t, Norwegian companies * 0 3,122
0 0 Tax payable on this years profi t, foreign companies 4,959 2,804
0 -324 Advance tax payment, foreign companies 0 -959
-720 0 Governmental Tax Relief (skattefunn) 0 -720
-720 0 TOTAL TAX PAYABLE 4,959 4,246
SPECIFICATION ON BASIS FOR DEFERRED TAX
Differences evaluated to be offset:
17,237 9,677 Fixed assets 68,601 81,794
-885 125,168 Current assets 122,259 -12,510
-17,480 -10,798 Liabilities -10,569 -20,387
-7,829 -65,194 Tax losses carry -forward -86,337 -9,368
0 -2,256 Other differences 2,905 572
-8,958 56,597 TOTAL 96,859 40,101
-2,508 15,847 Deferred tax (+) / tax assets (-) 27,121 11,465
DEFERRED TAX (-) / TAX ASSETS (+) IN BALANCE SHEET OF 31.12.
-2,508 15,847 Tax assets (-)/ deferred tax (+) Norwegian companies 13,921 -4,842
0 0 Tax assets (-)/ deferred tax (+) foreign companies 13,199 16,308
0 0 Tax assets (-)/ deferred tax (+) on group contribution 0 0
0 0 Deferred tax asset, off balance sheet 0 0
-2,508 15,847 TOTAL TAX ASSETS (-) / DEFERRED TAX (+) 27,121 11,465
Q-FREE / ANNUAL / REPORT / 2009 (66 + 67)

Parent company Group
2008 2009 2009 2008
RECONCILING THE TAX COST
0 70,877 Earnings before tax 109,698 0
5,674 19,846 Tax on profi ts (28%) 30,716 15,940
-3,620 -18,679 Tax expenses -31,549 -14,629
2,053 1,167 Deviation -834 1,311
SPECIFICATION
2,053 1,167 Tax result permanent differences and tax rate difference 0 -533
0 0 Adjusted allocated tax from last year 0 -349
0 0 Change in deferred tax asset, off balance sheet 0 -430
0 0 Effect of different tax-rate -834 0
2,053 1,167 TOTAL -834 -1,311
* Paid withholding tax in foreign subsidiaries.
Deferred tax assets are recognised on the balance sheet based on the expectation of future taxable income. The estimate are based on
Board of Directors and management’s best judgement and an assessment of future prospects. The actual outcome of future tax costs may
deviate from these estimates.
Of the tax losses carried forward of TNOK 86,337 for the Group, TNOK 65,194 relates to the mothercompany and TNOK 21,143 relates to
foreign companies. Following a change in the tax legislation in Norway in 2005, these tax losses can be carried forward indefi nitely.
For 2008 TNOK 7,829 of the tax losses carried forward for the Group, was related to the mother company and TNOK 1,539 was related to
foreign companies.
NOTE 10. EARNINGS PER SHARE
Basic earnings per share amounts are calculated by dividing net profi t for the year attributable to ordinary equity holders of the parent by the
weighted average number of ordinary shares outstanding during the year.
Diluted earnings per share amounts are calculated by dividing the net profi t attributable to ordinary equity holders of the parent by the
weighted average number of ordinary shares outstanding during the year plus the weighted average number of ordinary shares that would be
issued on the conversion of all the dilutive potential ordinary shares into ordinary shares.
2009 2008
Profi t for the year 78,310 31,628
Weighted average number of ordinary shares 55,536,269 53,976,213
Weighted average of share option 840,000 0
Weighted average number of diluted shares 56,376,269 53,976,213
Earnings per share 1.41 0.60
Diluted earnings per share 1.39 0.60
There have been no other transactions involving ordinary shares or potential ordinary shares between the reporting date and the date of
completion of these fi nancial statements.
( ANNUAL ACCOUNTS )
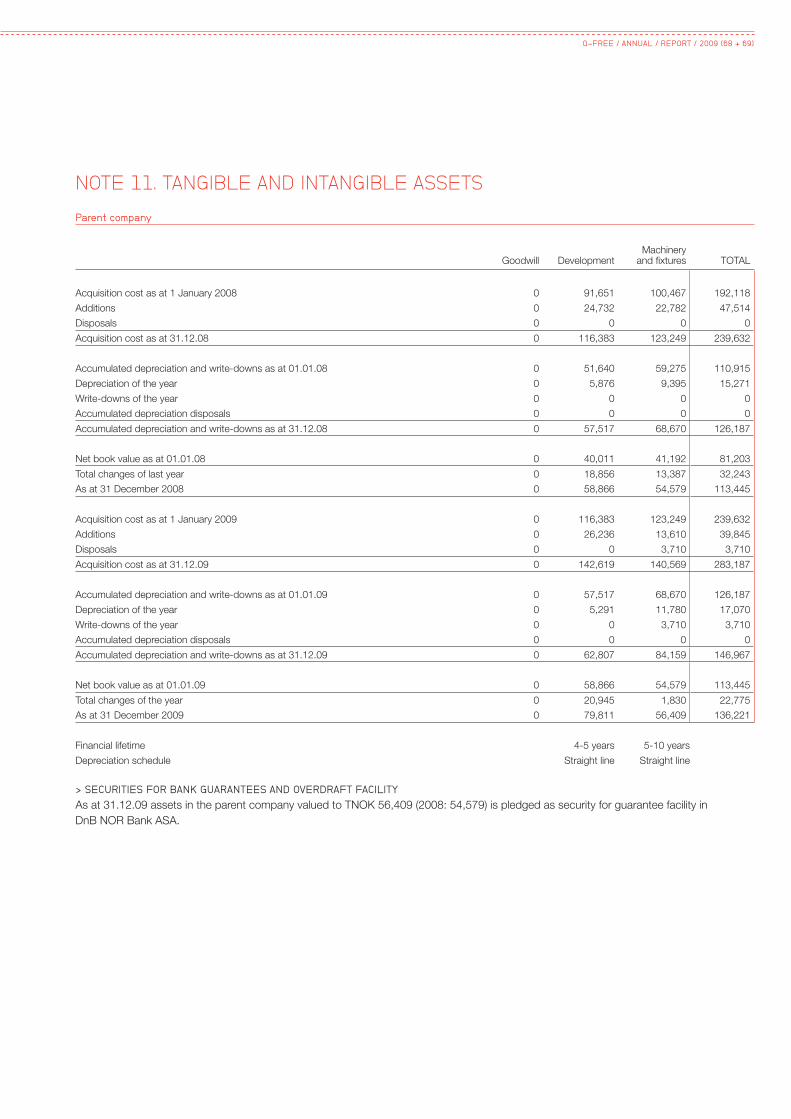
NOTE 11. TANGIBLE AND INTANGIBLE ASSETS
Parent company
Goodwill DevelopmentMachinery
and fi xtures TOTAL
Acquisition cost as at 1 January 2008 0 91,651 100,467 192,118
Additions 0 24,732 22,782 47,514
Disposals 0 0 0 0
Acquisition cost as at 31.12.08 0 116,383 123,249 239,632
Accumulated depreciation and write-downs as at 01.01.08 0 51,640 59,275 110,915
Depreciation of the year 0 5,876 9,395 15,271
Write-downs of the year 0 0 0 0
Accumulated depreciation disposals 0 0 0 0
Accumulated depreciation and write-downs as at 31.12.08 0 57,517 68,670 126,187
Net book value as at 01.01.08 0 40,011 41,192 81,203
Total changes of last year 0 18,856 13,387 32,243
As at 31 December 2008 0 58,866 54,579 113,445
Acquisition cost as at 1 January 2009 0 116,383 123,249 239,632
Additions 0 26,236 13,610 39,845
Disposals 0 0 3,710 3,710
Acquisition cost as at 31.12.09 0 142,619 140,569 283,187
Accumulated depreciation and write-downs as at 01.01.09 0 57,517 68,670 126,187
Depreciation of the year 0 5,291 11,780 17,070
Write-downs of the year 0 0 3,710 3,710
Accumulated depreciation disposals 0 0 0 0
Accumulated depreciation and write-downs as at 31.12.09 0 62,807 84,159 146,967
Net book value as at 01.01.09 0 58,866 54,579 113,445
Total changes of the year 0 20,945 1,830 22,775
As at 31 December 2009 0 79,811 56,409 136,221
Financial lifetime 4-5 years 5-10 years
Depreciation schedule Straight line Straight line
> SECURITIES FOR BANK GUARANTEES AND OVERDRAFT FACILITY
As at 31.12.09 assets in the parent company valued to TNOK 56,409 (2008: 54,579) is pledged as security for guarantee facility in
DnB NOR Bank ASA.
Q-FREE / ANNUAL / REPORT / 2009 (68 + 69)

Group
Goodwill DevelopmentMachinery
and fi xtures TOTAL
Acquisition cost as at 1 January 2008 0 93,022 143,561 236,583
Additions 0 24,578 22,317 46,895
Acquisitions of a subsidiary * 26,022 45,501 761 72,284
Disposals 0 0 0 0
Acquisition cost as at 31.12.08 26,022 163,101 166,639 355,762
Accumulative depreciation and write-downs as at 01.01.08 0 52,702 90,155 142,857
Depreciation of the year 0 8,404 12,546 20,950
Write-downs of the year 0 0 0 0
Accumulated depreciation disposals 0 0 0 0
Accumulated depreciation and write-downs as at 31.12.08 0 61,106 102,701 163,807
Net book value as at 01.01.08 0 40,320 53,406 93,726
Total changes of last year 26,022 61,675 10,532 98,229
As at 31 December 2008 26,022 101,995 63,938 191,955
Acquisition cost as at 1 January 2009 26,022 163,101 166,639 355,762
Additions 4,775 30,648 22,812 58,235
Acquisitions of a subsidiary * 3,491 2,805 0 6,296
Disposals 0 0 3,710 3,710
Acquisition cost as at 31.12.09 34,288 196,554 193,161 424,003
Accumulative depreciation and write-downs as at 01.01.09 0 61,106 102,701 163,807
Depreciation of the year 0 13,876 14,876 28,752
Write-downs of the year 0 0 3,710 3,710
Accumulated depreciation disposals 0 0 0 0
Accumulated depreciation and write-downs as at 31.12.09 0 74,982 121,287 196,268
Net book value as at 01.01.09 26,022 101,995 63,938 191,955
Total changes of the year 8,266 19,577 7,936 35,780
As at 31 December 2009 34,288 121,572 71,874 227,735
Financial lifetime Impairment tested 4-5 years 5-10 years
Depreciation schedule annually (or Straight line Straight line
when impairment
indicators exists).
* For further details regarding acquisitions of subsidiary, see note 5
> DEVELOPMENT
The group capitalises costs regarding product development activities. Capitalised costs in 2009 consist of product development of a new
generation of OBU’s and road side units that is a part of the company’s toll road systems. Furthermore, the company has capitalised cost
that prepares the company’s products for future wireless communication solutions that enables continuous communication between vehicles
and the roadside infrastructure. Such cooperative vehicle-infrastructure systems will allow new traffi c information-sharing services for greater
safety, effi ciency and a better environment.
For 2009 research-expenses in the P&L has been immaterial.
Capitalised costs mainly consists of personnel expenses, purchase of materials, as well as external services. Product development is depre-
ciated over the products expected lifetime. The estimated useful lifetime is continuously evaluated.
( ANNUAL ACCOUNTS )

The Group classify the intangible assets in the following product categories:
1 ) OEM SOFTWARE CONNECTED TO VIDEO AND PICTURE PROCESSING USED IN INTELLIGENT TRAFFIC SYSTEMS (ITS).
2 ) OBU (ON BOARD UNITS)
3 ) ROAD SIDE EQUIPMENT USED IN TOLLING SYSTEMS
Carrying amount of development costs are allocated to each of the cash-generating units:
1 ) OEM Software 2 ) OBU 3 ) Roadside Equipment TOTAL
TNOK 2009 2008 2009 2008 2009 2008 2009 2008
Carrying amount of development costs 40,256 43,129 52,154 38,489 29,163 20,377 121,572 101,995
121,572 101,995
Intangible assets through acquisitions 1,805 43,129
Intangible assets in house developed 119,767 58,866
121,572 101,995
1) OEM SOFTWARE
The OEM Software was acquired through the purchase of Dacolian BV in 2008.The main activities of Dacolian BV includes development and
commercialisation of OEM software connected to video and picture processing to be used in Intelligent Traffi c Systems (ITS).
2) OBU
The recoverable amount of the OBU’s has been determined based on a value in use calculation using cash fl ow projections from fi nancial
budgets approved by senior management covering a fi ve-year period. The pre-tax discount rate applied to cash fl ow projections is 10.4 percent
(2008: 13.6 percent). The cash fl ows calculations are not done beyond the 5-year period and we have not used extrapolated growth rate in the
calculations. Our estimats is therefore assumed to be a prudent estimate compared to the long-term average growth rate for the ITS industry.
3) ROADSIDE EQUIPMENT
Calculation of the recoverable amount of the roadside equipment is based on the same assumptions as for the OBU’s.
> KEY ASSUMPTIONS USED IN VALUE IN USE CALCULATIONS :
The calculation of value in use for both OBU’s and Roadside Equipment units are most sensitive to the following assumptions:
GROSS MARGINS
DISCOUNT RATES
RAW MATERIALS PRICE INFLATION
MARKET SHARE DURING THE BUDGET PERIOD; AND
GROWTH RATE USED TO EXTRAPOLATE CASH FLOWS BEYOND THE BUDGET PERIOD
GROSS MARGINS – Gross margins are based on budgetary and on forecasting values that is the outcome of the Group’s managerial strategic
process. The forecasting values are increased over the budget period for anticipated effi ciency improvements.
DISCOUNT RATES – Discount rates refl ect the management’s estimate of the risks specifi c to each unit. This is the benchmark used by man-
agement to assess operating performance and to evaluate future investment proposals. In determining appropriate discount rates for each
unit, regard has been given to the yield on a ten-year government bond at the beginning of the budgeted year.
RAW MATERIALS PRICE INFLATION – Estimates are obtained from published indices for the countries from which materials are sourced, as
well as data relating to specifi c commodities. Forecast fi gures are used if data is publicly available (principally for Euroland and the United
States), otherwise past actual raw material price movements have been used as an indicator of future price movements.
MARKET SHARE ASSUMPTIONS – These assumptions are important because, as well as using industry data for growth rates (as noted below)
management assess how the unit’s position, relative to its competitors, might change over the budget period. Management expects the
Group’s share of the RUC market to be stable over the budget period, whereas for the reasons explained above, the Board expects the
Group’s position, relative to its competitors, to strengthen following the acquisitions mentioned in note 5.
GROWTH RATE ESTIMATES – Rates are based on published industry research.
Q-FREE / ANNUAL / REPORT / 2009 (70 + 71)

NOTE 12. IMPAIRMENT TESTING OF GOODWILL
Goodwill obtained through business combination is allocated to the technology acquired and the impairment testing is based on the
discounted cash fl ow calculations for each technology.
TOTAL
TNOK 2009 2008
OEM software connected to video and picture processing used in Intelligent Traffi c Systems (ITS) 30,797 26,022
Global Navigation Satellite Systems (GNSS) technology used in Road User Charging projects 3,491 0
Carrying amount of Goodwill as at 31.12: 34,288 26,022
Impairment testing of Goodwill as at 31. December 2008:
VALUE IN USE AND THE MOST IMPORTANT ASSUMPTIONS
Q-Free group uses the latest detailed calculations of recoverable amounts to impairment test the cerrying amount of Goodwill. Since the
PPA-process was carried out during the second half of 2008 the Group has not conducted an impairment test as at 31 December 2008.
This is because the assets and liabilities that constitute the calculations has not changed signifi cantly since the acquisition took place in
August 2008.
> ESTIMATES USED IN THE CALCULATION OF THE IMPAIRMENT TEST WAS
Nominal WACC is estimated to 12.9 percent. Risk free rate assessed at 4.5 percent (based on 10-year Euro zone government bond risk
free rate as of 13th of August 2008). We have used 5% as an estimate of the general market risk premium. 75.3 percent is used as weight
of equity, based on the balance sheet as at 30 June 2008 and the market capitalisation of Q-Free. It is assumed that this capital structure
provides a reasonable estimate for future capital structure.
Impairment testing of Goodwill as at 31. December 2009:
VALUE IN USE AND IMPORTANT ASSUMPTIONS
The Group performed its annual impairment test as at 31 December 2009. The Group considers the relationship between its market capi-
talisation and its book value, among other factors, when reviewing for indicators of impairment. Impairment testing on goodwill is based on
the technology’s value in use. The discounted cash fl ow method is used to ascertain value in use. The projected cash fl ow is based on the
technologys’ budgets and long-term plans, which are subject to the approval of the Board and the corporate management. Long-term plans
cover a period of fi ve years. Future improvements to products and new developments are not refl ected in the future cash fl ow. After fi ve years
of planning, a terminal value is calculated on the basis of a constant growth rate.
OEM LICENCE SOFTWARE
Revenues are based on the estimated development in the markets in which Dacolian BV operate. It is generally expected that the company
will manage to hold its strong market position in delivering high performance software for video and picture processing used in Intelligent Traf-
fi c Systems. Expectations about the total market development are based on external market expectations, e.g. the estimated growt rate for
the ITS market world wide. Market growth is expected to be approx. 20 per cent per year. The backlog of orders for license revenues is high,
and it has a strong position in niche markets. The forecasted earn-out for the PPA-analysis is maintained.
GNSS TECHNOLOGY
Revenues are based on the individual countries’ future implementation of GNSS-based Road User Charging Systems. So far the technology
has been used and implemented for Truck Tolling systems and future marked expectations shows a market growth as for the rest of the ITS
market. This is specifi c related to the upcomming Truck Tolling projects in Europe, like France, Poland, Slovenia and Hungary.
> ESTIMATES USED IN THE CALCULATION OF THE IMPAIRMENT TEST WAS
The calculation uses a discount rate of 10.4 per cent before tax, which is the Group’s Weighted Average Cost of Capital (WACC). A constant
growth rate of 5 per cent is assumed to extrapolate the terminal value. It is assumed that this capital structure provides a reasonable estimate
for future capital structure.
( ANNUAL ACCOUNTS )

SENSITIVITY TO CHANGES IN ASSUMPTIONS
With regard to the assessment of value-in-use both of the OEM licence software and the GNSS technology, management believes that no
reasonably possible change in any of the above key assumptions would cause the carrying value of the unit to materially exceed its recover-
able amount.
NOTE 13. SHARES AT FAIR VALUE THROUGH PROFIT AND LOSS
Parent company and the Group as at 31 December 2009
TNOK
Company equity
Number of shares
OwnershipBook value in
Parent **Book value in
Group **Included in
the P&L
Vegamot AS 9,388 6,050 13.90% 1,305 1,305 1,305
Leiv Eiriksson AS 41,459 9,919 0.99% 200 200 1
Asti AS 14,388 2,900 13.81% 1,987 1,987 229
Other 0 611 24
Total 3,492 4,103 1,559
Parent company and the Group as at 31 December 2008
Company equity
Number of shares
OwnershipBook value in
Parent **Book value in
Group **Included in
the P&L
Vegamot AS 4,355 6,050 13.90% 0 0 0
Leiv Eiriksson AS 41,318 9,919 0.99% 409 409 83
Asti AS 12,733 2,900 13.81% 1,758 1,758 361
Other 19 110 24
Total 2,187 2,278 468
( * * ) The book value of investments in shares is classifi ed as fi nancial assets at fair value. Fair value for the investments are our portion of
the companys total equity. See note 23 for the fair value hierarchy and a specifi cation on valuation technique applied .
NOTE 14 SHARE OPTION PROGRAMME FOR EMPLOYEES
Q-Free ASA established in May 2006 a three year share option program. According to the Board’s proposal it was unanimously resolved
that the Board, as part of the work of giving key personnel, management and Board members elected by the shareholders an incentive pro-
gram, through the possibility to subscribe shares in the company, the Board of Directors was authorised to increase the share capital with
as much as NOK 969,000, which corresponds to 2,550,000 shares (approximately 5 percent), each with a par value of NOK 0.38, through
one or more private placements with cash deposits towards key personnel, management and Board members elected by the shareholders
in Q-Free ASA. The existing shareholders’ preferential rights according to the Public Limited Companies Act sections 10-4 and 10-5 can be
disregarded. The authorisation given in 2006 was valid for two years.
The authorisation was renewed at the Annual General meeting 10 May 2007 for a period of 2 years to be able to execute the approved three
years incentive program. Due to changes within the organisation the latest year, a minor increase in the new authorisation compared to the
previous authorisation was proposed and approved; from NOK 969.000 to NOK 1.026.000 (equivalent to 5,17 percent of the share capital)
which corresponds to 2.700.000 shares, each with a par value of NOK 0.38.
The General Meeting 9 May 2008 endorsed the proposed 1 year prolongment of the option program for the shareholder elected board
members resolved by the General Meeting of 2006, and that the applicable period is 2007 until 2009 on the same terms and conditions, and
within the same total number of shares. The share option program established in 2006 was completed May 2009.
Q-Free ASA established in May 2009 a new three year share option program. According to the Board’s proposal it was unanimously resolved
that the Board, as part of the work of giving key personnel, management and Board members elected by the shareholders an incentive pro-
gram, through the possibility to subscribe shares in the company, the Board of Directors was authorised to increase the share capital with as
much as NOK 1.026,000, which corresponds to 2,700,000 shares (approximately 5 percent), each with a par value of NOK 0.38, through
Q-FREE / ANNUAL / REPORT / 2009 (72 + 73)

one or more private placements with cash deposits towards key personnel, management and Board members elected by the shareholders
in Q-Free ASA. The existing shareholders’ preferential rights according to the Public Limited Companies Act sections 10-4 and 10-5 can be
disregarded. The authorisation given in 2009 is valid for two years.
The authorisation regards the implementation of a share options program in Q-Free ASA, which runs over a period of 3 years for key person-
nel and management, and 2 years for Board Members elected by the shareholders. 600,000 shares are reserved for Board Members elected
by the shareholders, and the remaining 2,100,000 shares are reserved for the share option program for key personnel and management.
There will not be paid any option premium. The strike price shall be equal to the average share price for the Q-Free ASA shares on the Oslo
Stock Exchange on closing time the last 14 days prior to and the fi rst 14 days subsequent to the ordinary General Meeting in the year prior
to the vesting period.
For key personnel and management who are awarded option rights for a period of 3 years, 1/3 of the options will be allocated annually with
a vesting period of 1 year and the strike price determined as noted above. Correspondingly, ½ of the options will be allocated annually for
Board Members elected by the shareholders. For newly employed key personnel, management and Board Members, the strike price will be
determined on the day they are granted options.
As at 31.12.2009, 840,000 options are outstanding for key personnel, of which 300,000 options have been granted to the Board of Directors.
Exercise of the options can be done during pre-defi ned time periods.
Specifi cation of share option activity:
2009 2008
Remaining share options 01.01 2,325,000 2,415,000
Share options granted 840,000 795,000
Share options exercised -875,000 0
Share options expired/terminated -1,450,000 -885,000
Remaining share options 31.12 840,000 2,325,000
Portion fully earned 2,025,000
> MODIFICATION OF GRANTS
Due to the extention of the option program for the shareholder elected Board Members, the above specifi cation of granted and expired share
options for 2008 include this modifi cation.
Fair value of share options is calculated according to the Black & Scholes pricing model with a reduction of 15% due to illiquidity of the
Q-Free share. Average fair value of granted share options in 2009 is NOK 4.81. Corresponding fi gure for 2008 was NOK 0.99.
The company’s cost of share based payment is calculated using the Black & Scholes pricing model. For 2009 this adds up to a total cost of
TNOK 2,539. Corresponding fi gures for 2008 was TNOK 2,564. See this specifi ed in the Statement of changes in Equity (Group).
875,000 options were exercised in May 2009. All options exercised had a strike price of NOK 9.73, and the market price of the share at
exercise was NOK 15.80
Remaining share options as at 31. December 2009 has the following conditions:
Outstanding Options Vested options
Exercise priceOutstanding Options Per
31.12.2009Weighted average
remaining Contractual LifeWeighted Average
Exercise PriceVested options
31.12.2009Weighted Average
Exercise Price
0,00 - 5,00 - - - - -
5,00 - 10,00 - - - - -
10,00 - 15,00 - - - - -
15,00 - 20,00 790,000 1.97 15.57 - -
20,00 - 50,000 2.35 20.50 - -
TOTAL 840,000 1.97 15.57 - -
( ANNUAL ACCOUNTS )
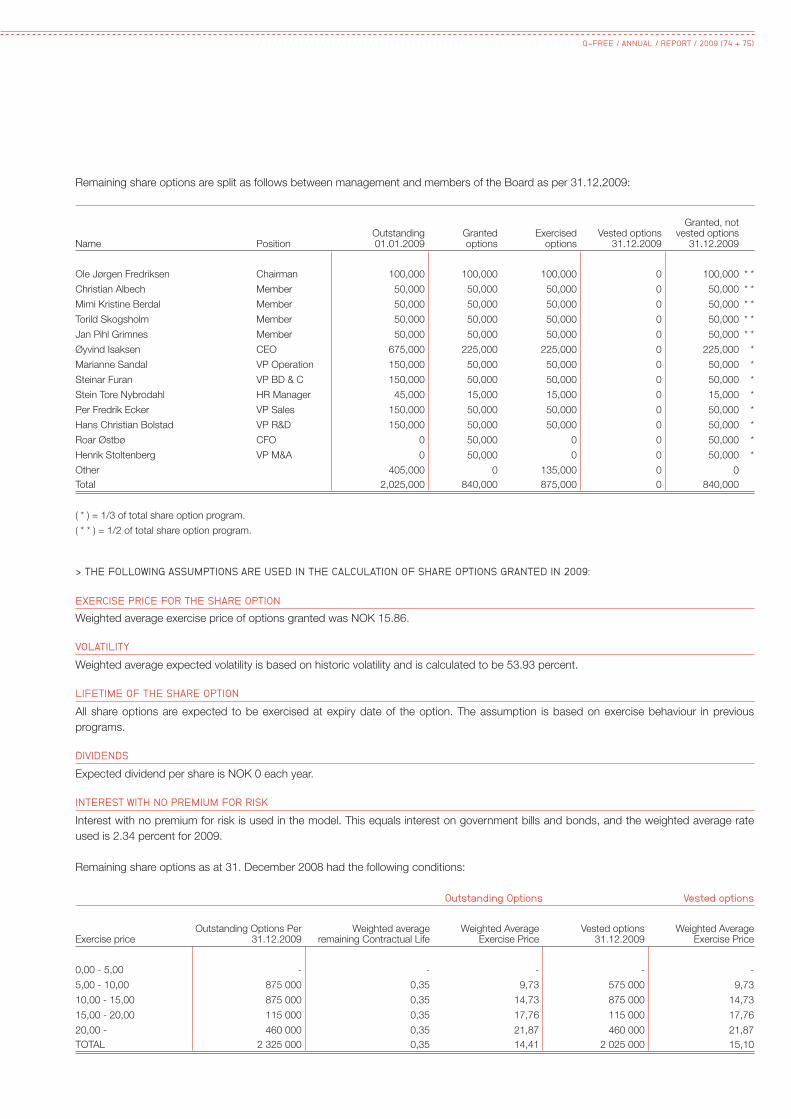
Remaining share options are split as follows between management and members of the Board as per 31.12.2009:
Name PositionOutstanding 01.01.2009
Granted options
Exercised options
Vested options 31.12.2009
Granted, not vested options
31.12.2009
Ole Jørgen Fredriksen Chairman 100,000 100,000 100,000 0 100,000 * *
Christian Albech Member 50,000 50,000 50,000 0 50,000 * *
Mimi Kristine Berdal Member 50,000 50,000 50,000 0 50,000 * *
Torild Skogsholm Member 50,000 50,000 50,000 0 50,000 * *
Jan Pihl Grimnes Member 50,000 50,000 50,000 0 50,000 * *
Øyvind Isaksen CEO 675,000 225,000 225,000 0 225,000 *
Marianne Sandal VP Operation 150,000 50,000 50,000 0 50,000 *
Steinar Furan VP BD & C 150,000 50,000 50,000 0 50,000 *
Stein Tore Nybrodahl HR Manager 45,000 15,000 15,000 0 15,000 *
Per Fredrik Ecker VP Sales 150,000 50,000 50,000 0 50,000 *
Hans Christian Bolstad VP R&D 150,000 50,000 50,000 0 50,000 *
Roar Østbø CFO 0 50,000 0 0 50,000 *
Henrik Stoltenberg VP M&A 0 50,000 0 0 50,000 *
Other 405,000 0 135,000 0 0
Total 2,025,000 840,000 875,000 0 840,000
( * ) = 1/3 of total share option program.
( * * ) = 1/2 of total share option program.
> THE FOLLOWING ASSUMPTIONS ARE USED IN THE CALCULATION OF SHARE OPTIONS GRANTED IN 2009:
EXERCISE PRICE FOR THE SHARE OPTION
Weighted average exercise price of options granted was NOK 15.86.
VOLATILITY
Weighted average expected volatility is based on historic volatility and is calculated to be 53.93 percent.
LIFETIME OF THE SHARE OPTION
All share options are expected to be exercised at expiry date of the option. The assumption is based on exercise behaviour in previous
programs .
DIVIDENDS
Expected dividend per share is NOK 0 each year.
INTEREST WITH NO PREMIUM FOR RISK
Interest with no premium for risk is used in the model. This equals interest on government bills and bonds, and the weighted average rate
used is 2.34 percent for 2009.
Remaining share options as at 31. December 2008 had the following conditions:
Outstanding Options Vested options
Exercise priceOutstanding Options Per
31.12.2009Weighted average
remaining Contractual LifeWeighted Average
Exercise PriceVested options
31.12.2009Weighted Average
Exercise Price
0,00 - 5,00 - - - - -
5,00 - 10,00 875 000 0,35 9,73 575 000 9,73
10,00 - 15,00 875 000 0,35 14,73 875 000 14,73
15,00 - 20,00 115 000 0,35 17,76 115 000 17,76
20,00 - 460 000 0,35 21,87 460 000 21,87
TOTAL 2 325 000 0,35 14,41 2 025 000 15,10
Q-FREE / ANNUAL / REPORT / 2009 (74 + 75)

Remaining share options was split as follows between management and members of the Board as at 31. December 2008:
Name Position Granted options Vested options Exercised options Unvested options
Øyvind Isaksen CEO 675,000 675,000 0 0
Ole Jørgen Fredriksen Chairman 200,000 100,000 0 100,000
Christian Albech Member 100,000 50,000 0 50,000
Mimi Kristine Berdal Member 100,000 50,000 0 50,000
Torild Skogsholm Member 100,000 50,000 0 50,000
Jan Pihl Grimnes Member 100,000 50,000 0 50,000
Marianne Sandal VP Operation 150,000 150,000 0 0
Steinar Furan QA Manager 150,000 150,000 0 0
Stein Tore Nybrodahl HR Manager 45,000 45,000 0 0
Per Fredrik Ecker VP Sales 150,000 150,000 0 0
Hans Christian Bolstad VP R&D 150,000 150,000 0 0
Other employees 405,000 405,000 0 0
TOTAL 2,325,000 2,025,000 0 300,000
> THE FOLLOWING ASSUMPTIONS ARE USED IN THE CALCULATION OF SHARE OPTIONS GRANTED IN 2008:
EXERCISE PRICE FOR THE SHARE OPTION
Weighted average exercise price of options granted was NOK 13.03
VOLATILITY
Weighted average expected volatility is based on historic volatility and is calculated to be 45.51 percent.
LIFETIME OF THE SHARE OPTION
All share options are expected to be exercised at expiry date of the option, 7 May 2009.
DIVIDENDS
Expected dividends per share is NOK 0 each year.
INTEREST WITH NO PREMIUM FOR RISK
Interest with no premium for risk is used in the model. This equals interest on government bills and bonds, and the weighted average rate
used is 6,86 percent for 2008.
NOTE 15. PENSION SCHEME
Q-Free ASA (the parent company) has a defi ned benefi t- and a defi ned contribution pension plan for the employees. Both pension plans
meet the criteria for OTP. Pension cost are calculated according to IAS 19 for both plans. All employees in Norway are included in the pen-
sion plans which entitles them to certain benefi ts for pension in the future. The pension benefi ts are mainly dependable on numbers of years
employed, level of salaries at age of retirement and size of payments.
The pension plans for the Norwegian companies are secured in an insurance company. The liability for the Group includes 185 employ-
ees in 2009, compared to 158 employees for 2008. The liability for the parent company includes 137 employees in 2009, compared to
103 employees for 2008.
( ANNUAL ACCOUNTS )

Figures in TNOK
Parent company Group
2008 2009 2009 2008
4,480 5,300 Net present value of current year’s pension earnings 6,687 5,551
1,100 1,182 Interest on accrued pension liabilities 1,556 1,558
-822 -823 Expected interest on pension funds -1,477 -1,395
0 0 Amortisation of past service cost 0 0
600 230 Amortisation of actuarial (gain) / losses 260 625
131 229 Administrative expenses pension scheme 396 243
774 830 Accrued social security expenses 984 928
6,264 6,947 Net pension expenses * 8,406 7,510
31.12.08 31.12.09 Pension liabilities / (-funds) 31.12.09 31.12.08
31,198 29,429 Estimated pension liabilities 41,101 41,432
-12,251 -20,117 Estimated pension funds -32,071 -23,110
18,947 9,311 Estimated net (pension funds) / -liabilities 9,030 18,322
-18,373 -7,587 Unrecognised change in pension plan and deviation in estimates -7,564 -18,161
574 1,725 Net (pension funds) / -liabilities 1,466 161
574 1,725 Net (pension funds) / -liabilities in balance sheet 1,466 161
19.7 21.5 Estimated remaining contribution periods 18.9 18.9
( * ) = During 2009 costs from the defi ned benefi t pension plan represents TNOK 2. 385, and this is included in the above specifi cation of net pension expenses.
Parent company Group
2008 2009 Pension liabilities : 2009 2008
23,513 31,198 Liabilities per 01.01. 41,432 33,388
4,480 5,300 Service costs 6,687 5,551
-199 -199 Benefi ts paid -547 -490
1,100 1,182 Interest cost 1,556 1,558
0 0 Past service cost 0 0
2,303 -8,052 Actuarial gains/losses -8,027 1,426
31,198 29,429 Total liabilities per 31.12. 41,101 41,432
Parent company Group
2008 2009 Pension funds : 2009 2008
9,866 12,251 Funds per 01.01. 23,110 19,909
4,088 4,851 Net contribution paid 5,505 4,662
-199 -199 Benefi ts paid -509 -450
822 823 Estimated return on assets 1,675 2,211
-2,325 2,391 Actuarial gains/losses 2,290 -3,222
0 0 Acquisition / (disposal) 0 0
12,251 20,117 Total funds per 31.12. 32,071 23,110
Q-FREE / ANNUAL / REPORT / 2009 (76 + 77)

Parent company Group
2008 2009 2009 2008
-31,198 -29,429 Pension liabilities -41,101 -41,432
12,251 20,117 Pension funds 32,071 23,110
-18,947 -9,311 Surplus / (defi cit) -9,030 -18,322
The Group expects to contribute approximately TNOK 7,500 to its pension plans in 2010, corresponding fi gures for 2009 was TNOK 6,500.
> BASIS AND ASSUMPTIONS FOR CALCULATIONS
The assumptions are according to the recommendation of the Financial Supervisory Authority of Norway for both 2008 and for 2009.
2009 2008
Discount rate 4.40% 3.80%
Expected interest on pension funds 5.60% 5.80%
Annual growth in salaries 4.25% 4.00%
Increase in national insurance base rate (G) 4.00% 3.75%
Expected change in pensions 1.30% 1.50%
Social security expenses 14.10% 14.10%
Corridor 10.00% 10.00%
Table K2005 is used for defi nition of mortality rate probability. Expected voluntarily early retirement :
Before 40 years 2% 2%
After 40 years 0% 0%
The Group’s pension fund is managed by Vital Forsikring Finansforvaltning, an insurance company. For 2009 the dividend yield was 4.8 percent.
The funds are distributed as follows :
2009 2008
Shares 14% 4%
Bonds 23% 30%
Money funds 9% 14%
Long term bonds 36% 29%
Property 17% 17%
Other 2% 7%
Total 100% 100%
( ANNUAL ACCOUNTS )

NOTE 16. INVENTORY AND COSTS OF GOODS SOLD
INVENTORY
Parent company Group
2008 2009 Inventory specifi cation 2009 2008
20,188 17,020 Raw material and semi manufactured products 30,639 31,998
133 53 Stock for sub-suppliers 53 133
3,431 1,620 Stock for maintenance contracts 1,620 3,431
0 0 Work in progress 4,353 5,263
13,639 12,892 Finished goods 12,949 13,944
-4,385 -6,204 Obsolescence -9,286 -7,743
33,006 25,381 Total 40,328 47,026
All inventories are valuated at lower of cost and net realisable value. The amount of write-down of inventories recognised as an expense is for
the Parent company TNOK 1,819 in 2009 (2008: 1,049) and for the group TNOK 1,544 in 2009 (2008: -1,789) which is recognised in cost
of goods sold.
COSTS OF GOODS SOLD
Parent company Group
2008 2009 COGS specifi cation 2009 2008
135,210 249,176 Purchase of goods 310,035 208,605
465 321 Freight, customs etc. 889 903
410 356 External services handling of COGS 356 410
6,903 -7,625 Change of inventories -7,851 10,060
142,987 242,228 Total 303,429 219,978
NOTE 17. ACCOUNTS RECEIVABLES AND CREDIT RISK
Parent company Group
2008 2009 2009 2008
56,451 71,743 Accounts receivables 128,242 82,843
13,703 52,183 Accounts receivables on group companies 0 0
-8,461 -8,326 Provision for impairment on receivables -3,098 -2,756
61,693 115,600 Total 125,144 80,087
1,162 456 Loss on receivables 962 1,162
-1,411 -135 Changes in provisions for impairment on receivables -612 -934
-249 321 Total 350 228
For terms and conditions relating to related party receivables, refer to Note 24. Trade receivables are non-interest bearing and are generally
on 30-60 days’ terms.
Q-FREE / ANNUAL / REPORT / 2009 (78 + 79)

As at 31 December, the aging analysis of trade receivables is as follows :
Past due but not impaired
Neither past due nor
impairedAMOUNTS PER 31.12 TOTAL < 30 days 30 – 60 days 60 – 90 day 90 – 120 day > >120 days
2009 128,242 72,971 49,529 1,940 731 126 2,945
2008 82,843 38,744 26,293 8,666 2,811 1,374 4,955
The Group is assessing the needs for provision for doubtful debt on an indiuvidual basis per customer or per project.
Specifi cation of provisions for impairment on receivables 2009 2008
Amount per 01.01. 2,756 4,168
This years provision for impairment on receivables -962 -1,163
Loss on receivables 962 1,162
Provisions utilised during the year 342 -1,411
AMOUNT PER 31.12 3,098 2,756
The maximum risk exposure is represented by the carrying amount of the fi nancial assets, including derivatives, in the balance sheet. Since
the other party involved in derivative trades is normally a bank, the credit risk linked to derivatives is regarded as being insignifi cant. The
Group therefore regards its maximum risk exposure as being the carrying amount of trade receivables as at 31 December 2009 NOK 125.1
mill (2008: NOK 80.1 mill).
NOTE 18. CASH AND CASH EQUIVALENTS
Cash at banks earns interest at fl oating rates based on daily bank deposit rates. Short-term deposits are made for varying periods between
one day and three months, depending on the immediate cash requirements of the Group, and the interest earnings at the respective short-
term deposit rates. The Group has a multiple currency account agreement in DnB NOR Bank ASA.
For the purpose of the consolidated cash fl ow statement, cash and cash equivalents comprise the following as at 31 December:
Parent company Group
2008 2009 Liquidity funds 2009 2008
51,584 87,189 Cash at banks and on hand 158,596 106,142
11,480 100,383 Short term deposits 116,019 13,475
63,064 187,572 TOTAL CASH AND CASH EQUIVALENTS 274,615 119,617
As at 31 December 2009, the Group had available TNOK 64,686 (2008: TNOK 80,140) of undrawn guarantee facilities in which all conditions
precedent had been met.
( ANNUAL ACCOUNTS )

NOTE 19. ISSUED CAPITAL AND RESERVES
The company has one class of shares and there is no voting restrictions. Per 31.12.09 the number of shares was 60,054,092. Face value per
share is kr. 0.38. Total share capital per 31.12.2009 was kr. 22,820,554.96. There are 1,654 share holders.
Ordinary shares
2009 2008
Shares issued per 01.01 53,976,213 52,274,269
Share issue 5,745,379 1,701,944
Share options excercised 332,500 0
TOTAL SHARES ISSUED PER. 31.12. 60,054,092 53,976,213
The company’s largest share holders per 31.12.09: Number of shares Percentage ownership Voting rights
Erste Bank Der Oesterreichischen 10,005,000 16.66% 16.66%
Odin Norge 5,202,774 8.66% 8.66%
Skagen Vekst 3,000,000 5.00% 5.00%
Kikut AS 2,431,000 4.05% 4.05%
Lars Oddgeir Andresen 1,633,600 2.72% 2.72%
Holberg Norge 1,587,800 2.64% 2.64%
DnB NOR SMB 1,503,500 2.50% 2.50%
Redback AS 1,495,000 2.49% 2.49%
VPF Nordea Kapital 1,227,975 2.04% 2.04%
Bank Austria Creditanstalt AG 1,187,017 1.98% 1.98%
VPF Nordea Avkastning 1,067,332 1.78% 1.78%
Mons Holding AS 1,040,000 1.73% 1.73%
Krag Invest AS 1,000,000 1.67% 1.67%
Deutsche Bank International Ltd 750,000 1.25% 1.25%
VPF Nordea SMB 668,700 1.11% 1.11%
Pensjonskassen StatoilHydro 660,600 1.10% 1.10%
Home Capital AS 650,000 1.08% 1.08%
UBS AG, London Branch 620,000 1.03% 1.03%
Storebrand Livsforsikring AS 604,300 1.01% 1.01%
NHO – JP Morgan Chase Bank 600,493 1.00% 1.00%
Other share holders 23,119,001 38.50% 38.50%
TOTAL 60,054,092 100.0% 100.0%
Number of shares held by the senior management, CEO and the board of directors
Name Position Shares
Øyvind Isaksen CEO 72,489
Roar Østbø CFO 37,000
Jos Nijhuis VP ITS 453,246
Marianne Sandal VP Operations 12,000
Per Fredrik Ecker VP Sales 5,000
Hans Christian Bolstad VP R&D 2,000
Steinar Furan VP BD & C 20,000
Stein Tore Nybrodahl HR Manager 5,000
Ole Jørgen Fredriksen Chairman of the Board 168,884
Jan Pihl Grimnes Board member 1,545,000
Mimi Kristine Berdal Board member 50,000
TOTAL 2,300,619
At the end of 2009 2,700,000 shares are reserved according to the share option program descibed in note 14.
Q-FREE / ANNUAL / REPORT / 2009 (80 + 81)

NOTE 20. INTEREST-BEARING LOANS AND BORROWINGS
Parent company Group
Effectiveinterest rate%2008 2009 Specifi cation Type Maurity 2009 2008
0 0 Non-current Secured Bank loan Nordea Bank ASA 4.55% 20. Feb 2012 1,412 2,202
0 0 TOTAL 1,412 2,202
> SECURED BANK LOAN
The secured bank loan is a mortgage loan that is repayable within 3 years of the balance date. The loan is secured over certain fi xed assets
in the Group. For further details regarding book value of assets securing mortgages and guarantees, see note 28.
NOTE 21. PROVISIONS
> WARRANTY COSTS
Provision for warranty costs is calculated depending on the remaining guarantee time for various products and based on the historical
effect of defects and a calculation of probability for the defect to occur for the remaining products under warranty. The calculation is made
on an individual basis per product and the assumptions are varying for the different products and they also take into account the expected
expenses associated with new warranty problems that are identifi ed. Unused accruals for warranties are dissolved at the end of the guaran-
tee-period. All provisions spesifi ed in the table below are classifi ed as current liabilities.
Parent company Group
Provision for warranty
costsOther
expenses
TOTAL CURRENT
PROVISIONS
Provision for warranty
costsOther
expenses
TOTAL CURRENT
PROVISIONS
Amount as at 01.01.08 13,500 0 13,500 13,600 200 13,800
Unused accruals reversed during 2008 0 0
Accruals utilised during 2008 -8,223 -8,223 -8,223 -8,223
Accruals deposited during 2008 4,800 4,800 4,800 100 4,900
AMOUNT AS AT 31.12.08 10,077 0 10,077 10,177 300 10,477
Amount as at 01.01.09 10,077 0 10,077 10,177 300 10,477
Unused accruals reversed during 2009 0 -100 -300 -400
Accruals utilised during 2009 -6,504 -6,504 -6,504 -6,504
Accruals deposited during 2009 5,500 5,500 5,500 5,500
AMOUNT AS AT 31.12.09 9,073 0 9,073 9,073 0 9,073
NOTE 22. COMMITMENTS AND CONTINGENCIES
OPERATING LEASE COMMITMENTS – GROUP AS LESSEE
The Group has entered into commercial leases on certain motor vehicles and items of machinery. These leases have an average life of
between 3 and 5 years with no renewal option included in the contracts. There are no restrictions placed upon the Group by entering into
these leases.
( ANNUAL ACCOUNTS )
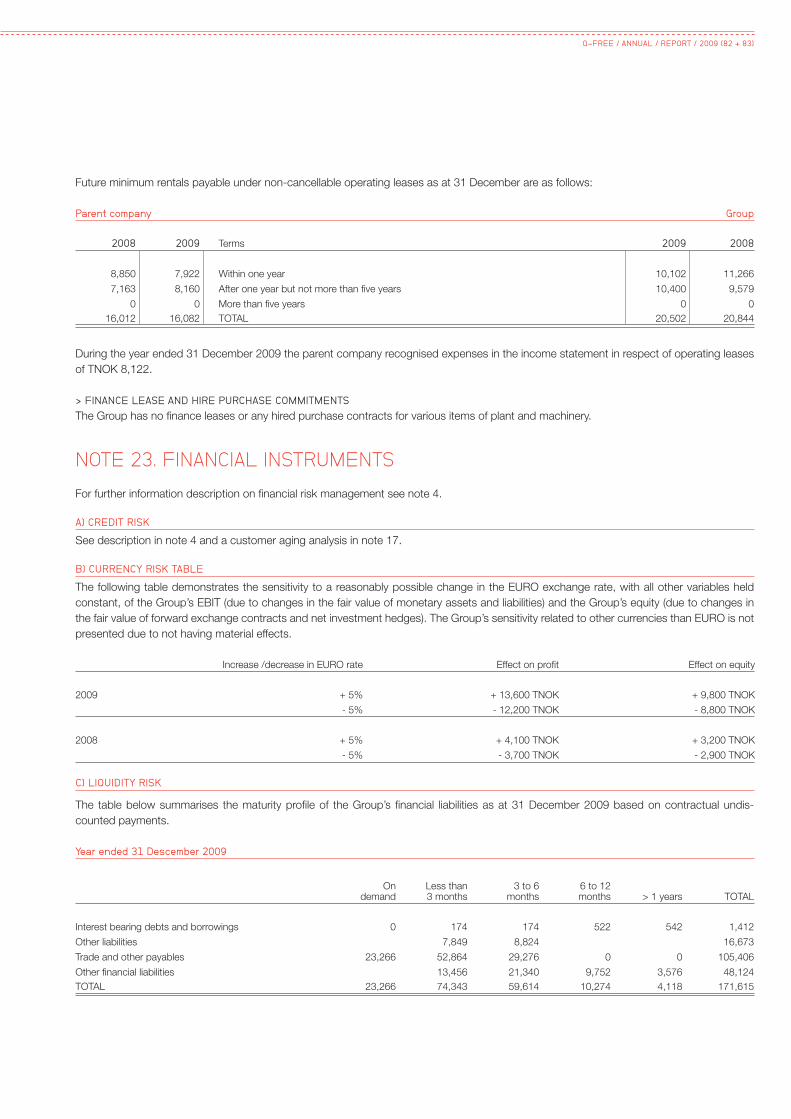
Future minimum rentals payable under non-cancellable operating leases as at 31 December are as follows:
Parent company Group
2008 2009 Terms 2009 2008
8,850 7,922 Within one year 10,102 11,266
7,163 8,160 After one year but not more than fi ve years 10,400 9,579
0 0 More than fi ve years 0 0
16,012 16,082 TOTAL 20,502 20,844
During the year ended 31 December 2009 the parent company recognised expenses in the income statement in respect of operating leases
of TNOK 8,122.
> FINANCE LEASE AND HIRE PURCHASE COMMITMENTS
The Group has no fi nance leases or any hired purchase contracts for various items of plant and machinery.
NOTE 23. FINANCIAL INSTRUMENTS
For further information description on fi nancial risk management see note 4.
A) CREDIT RISK
See description in note 4 and a customer aging analysis in note 17.
B) CURRENCY RISK TABLE
The following table demonstrates the sensitivity to a reasonably possible change in the EURO exchange rate, with all other variables held
constant, of the Group’s EBIT (due to changes in the fair value of monetary assets and liabilities) and the Group’s equity (due to changes in
the fair value of forward exchange contracts and net investment hedges). The Group’s sensitivity related to other currencies than EURO is not
presented due to not having material effects.
Increase /decrease in EURO rate Effect on profi t Effect on equity
2009 + 5% + 13,600 TNOK + 9,800 TNOK
- 5% - 12,200 TNOK - 8,800 TNOK
2008 + 5% + 4,100 TNOK + 3,200 TNOK
- 5% - 3,700 TNOK - 2,900 TNOK
C) LIQUIDITY RISK
The table below summarises the maturity profi le of the Group’s fi nancial liabilities as at 31 December 2009 based on contractual undis-
counted payments.
Year ended 31 Descember 2009
On demand
Less than 3 months
3 to 6 months
6 to 12 months > 1 years TOTAL
Interest bearing debts and borrowings 0 174 174 522 542 1,412
Other liabilities 7,849 8,824 16,673
Trade and other payables 23,266 52,864 29,276 0 0 105,406
Other fi nancial liabilities 13,456 21,340 9,752 3,576 48,124
TOTAL 23,266 74,343 59,614 10,274 4,118 171,615
Q-FREE / ANNUAL / REPORT / 2009 (82 + 83)
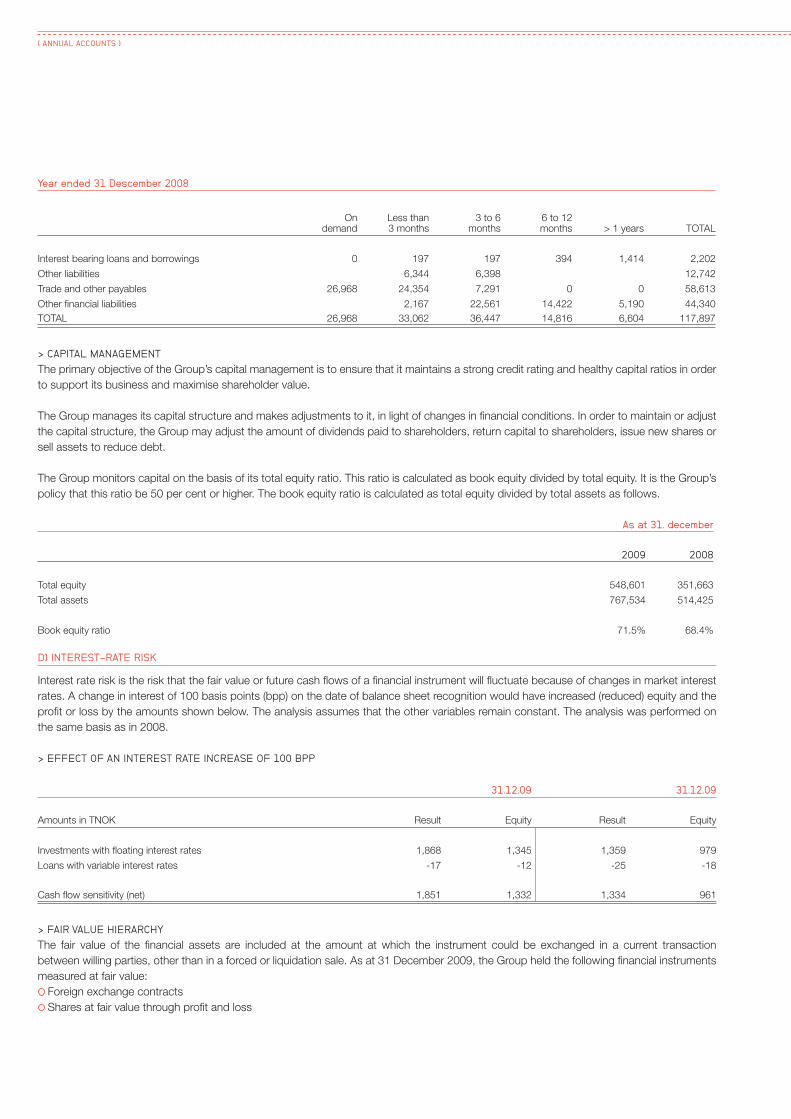
Year ended 31 Descember 2008
On demand
Less than 3 months
3 to 6 months
6 to 12 months > 1 years TOTAL
Interest bearing loans and borrowings 0 197 197 394 1,414 2,202
Other liabilities 6,344 6,398 12,742
Trade and other payables 26,968 24,354 7,291 0 0 58,613
Other fi nancial liabilities 2,167 22,561 14,422 5,190 44,340
TOTAL 26,968 33,062 36,447 14,816 6,604 117,897
> CAPITAL MANAGEMENT
The primary objective of the Group’s capital management is to ensure that it maintains a strong credit rating and healthy capital ratios in order
to support its business and maximise shareholder value.
The Group manages its capital structure and makes adjustments to it, in light of changes in fi nancial conditions. In order to maintain or adjust
the capital structure, the Group may adjust the amount of dividends paid to shareholders, return capital to shareholders, issue new shares or
sell assets to reduce debt.
The Group monitors capital on the basis of its total equity ratio. This ratio is calculated as book equity divided by total equity. It is the Group’s
policy that this ratio be 50 per cent or higher. The book equity ratio is calculated as total equity divided by total assets as follows.
As at 31. december
2009 2008
Total equity 548,601 351,663
Total assets 767,534 514,425
Book equity ratio 71.5% 68.4%
D) INTEREST-RATE RISK
Interest rate risk is the risk that the fair value or future cash fl ows of a fi nancial instrument will fl uctuate because of changes in market interest
rates. A change in interest of 100 basis points (bpp) on the date of balance sheet recognition would have increased (reduced) equity and the
profi t or loss by the amounts shown below. The analysis assumes that the other variables remain constant. The analysis was performed on
the same basis as in 2008.
> EFFECT OF AN INTEREST RATE INCREASE OF 100 BPP
31.12.09 31.12.09
Amounts in TNOK Result Equity Result Equity
Investments with fl oating interest rates 1,868 1,345 1,359 979
Loans with variable interest rates -17 -12 -25 -18
Cash fl ow sensitivity (net) 1,851 1,332 1,334 961
> FAIR VALUE HIERARCHY
The fair value of the fi nancial assets are included at the amount at which the instrument could be exchanged in a current transaction
between willing parties, other than in a forced or liquidation sale. As at 31 December 2009, the Group held the following fi nancial instruments
measured at fair value:
Foreign exchange contracts
Shares at fair value through profi t and loss
( ANNUAL ACCOUNTS )

The Group uses the following hierarchy for determining and disclosing the fair value of fi nancial instruments by valuation technique:
LEVEL 1: quoted (unadjusted) prices in active markets for identical assets or liabilities
LEVEL 2: other techniques for which all inputs which have a signifi cant effect on the recorded fair value are observable, either directly or indirectly
LEVEL 3: techniques which use inputs which have a signifi cant effect on the recorded fair value that are not based on observable market data.
Assets measured at fair value
TNOK 31. Dec 2009 Level 1 Level 2 Level 3
Financial assets at fair value through profi t or loss:
Foreign exchange contracts 137 137
Shares at fair value through profi t and loss 4,103 4,103
31. Dec 2008 Level 1 Level 2 Level 3
Financial assets at fair value through profi t or loss:
Shares at fair value through profi t and loss 2,278 2,278
NOTE 24. RELATED PARTY DISCLOSURES
The fi nancial statements include the fi nancial statements of Q-Free ASA and the subsidiaries listed in the following table:
Etablished Location Country OwnershipVoting share
Functionalcurrency
Q-Free Portugal Lda. 1997 Lisboa Portugal 100% 100% EUR
Q-Free América Latina Ltda. 1998 Sao Paolo Brasil 100% 100% BRL
Q-Free Australia Pty. Ltd. 1999 Sydney Australia 100% 100% AUD
Q-Free Malaysia Sdn. Bhd. 1997 Kuala Lumpur Malaysia 100% 100% MYR
Noca Holding AS – Group ( * ) 2001 Trondheim Norway 100% 100% NOK
Q-Free Sverige AB 2007 Stockholm Sweden 100% 100% SEK
Q-Free Thailand Co Ltd 2007 Bangkok Thailand 100% 100% THB
Dacolian BV (**) 2002 Beilen The Netherlands 85% 100% EUR
Q-Free Slovakia s.r.o. 2009 Bratislava Slovakia 100% 100% EUR
Q-Free UK Ltd 2002 London United Kingdom 100% 100% GBP
TOTAL
(*) Q-Free ASA owns through Noca Holding AS indirectly 48.72% in Noca AS. Q-Free ASA owns directly 4.76% in Noca AS. Q-Free ASA’s
owner share through indirectly and directly ownership in Noca AS therefore totals 53.48%.
(**) Q-Free ASA owns 85% of Dacolian BV at the end of 2009 but has an option and an obligation to buy the remaining shares before April
30th 2010. Based on this, the activity in Dacolian BV is included 100% in the consolidated fi nancial statements of the Q-Free Group.
Q-FREE / ANNUAL / REPORT / 2009 (84 + 85)
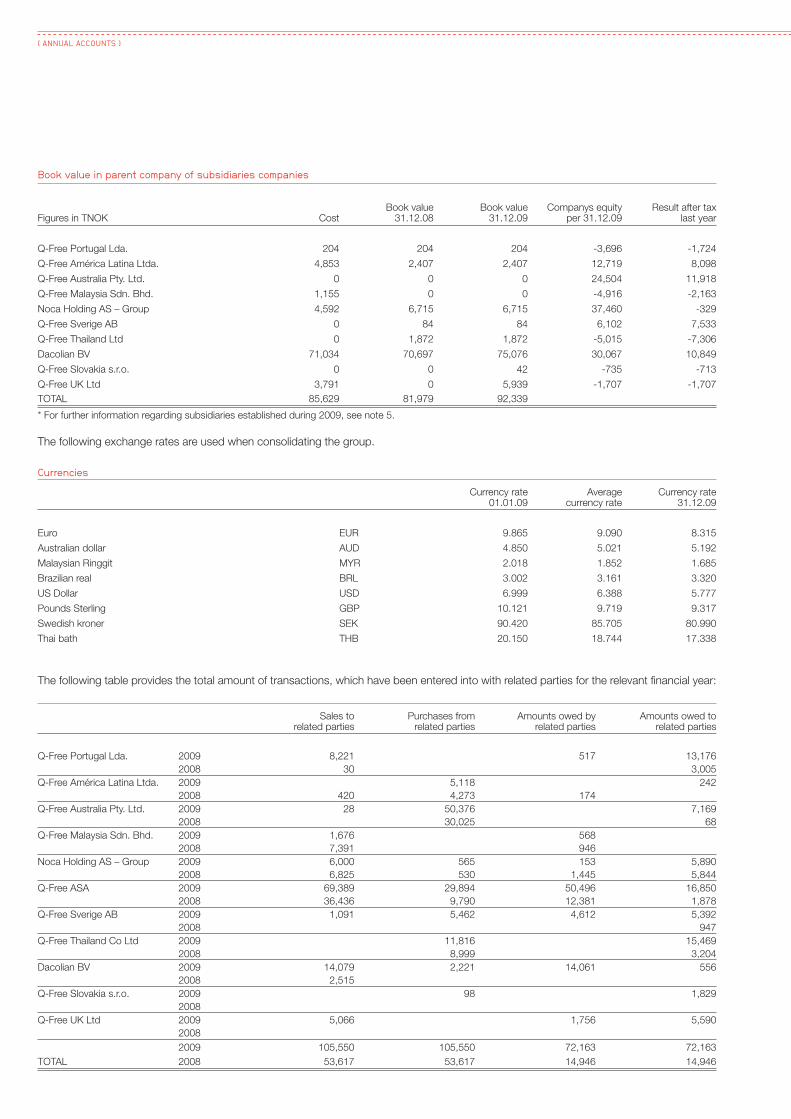
Book value in parent company of subsidiaries companies
Figures in TNOK CostBook value
31.12.08Book value
31.12.09Companys equity
per 31.12.09Result after tax
last year
Q-Free Portugal Lda. 204 204 204 -3,696 -1,724
Q-Free América Latina Ltda. 4,853 2,407 2,407 12,719 8,098
Q-Free Australia Pty. Ltd. 0 0 0 24,504 11,918
Q-Free Malaysia Sdn. Bhd. 1,155 0 0 -4,916 -2,163
Noca Holding AS – Group 4,592 6,715 6,715 37,460 -329
Q-Free Sverige AB 0 84 84 6,102 7,533
Q-Free Thailand Ltd 0 1,872 1,872 -5,015 -7,306
Dacolian BV 71,034 70,697 75,076 30,067 10,849
Q-Free Slovakia s.r.o. 0 0 42 -735 -713
Q-Free UK Ltd 3,791 0 5,939 -1,707 -1,707
TOTAL 85,629 81,979 92,339
* For further information regarding subsidiaries established during 2009, see note 5.
The following exchange rates are used when consolidating the group.
Currencies
Currency rate01.01.09
Average currency rate
Currency rate31.12.09
Euro EUR 9.865 9.090 8.315
Australian dollar AUD 4.850 5.021 5.192
Malaysian Ringgit MYR 2.018 1.852 1.685
Brazilian real BRL 3.002 3.161 3.320
US Dollar USD 6.999 6.388 5.777
Pounds Sterling GBP 10.121 9.719 9.317
Swedish kroner SEK 90.420 85.705 80.990
Thai bath THB 20.150 18.744 17.338
The following table provides the total amount of transactions, which have been entered into with related parties for the relevant fi nancial year:
Sales to related parties
Purchases from related parties
Amounts owed by related parties
Amounts owed to related parties
Q-Free Portugal Lda. 2009 8,221 517 13,176
2008 30 3,005
Q-Free América Latina Ltda. 2009 5,118 242
2008 420 4,273 174
Q-Free Australia Pty. Ltd. 2009 28 50,376 7,169
2008 30,025 68
Q-Free Malaysia Sdn. Bhd. 2009 1,676 568
2008 7,391 946
Noca Holding AS – Group 2009 6,000 565 153 5,890
2008 6,825 530 1,445 5,844
Q-Free ASA 2009 69,389 29,894 50,496 16,850
2008 36,436 9,790 12,381 1,878
Q-Free Sverige AB 2009 1,091 5,462 4,612 5,392
2008 947
Q-Free Thailand Co Ltd 2009 11,816 15,469
2008 8,999 3,204
Dacolian BV 2009 14,079 2,221 14,061 556
2008 2,515
Q-Free Slovakia s.r.o. 2009 98 1,829
2008
Q-Free UK Ltd 2009 5,066 1,756 5,590
2008
2009 105,550 105,550 72,163 72,163
TOTAL 2008 53,617 53,617 14,946 14,946
( ANNUAL ACCOUNTS )

> TERMS AND CONDITIONS OF TRANSACTIONS WITH RELATED PARTIES
The sales to and purchases from related parties are made at normal market prices. Outstanding balances at the year-end are unsecured,
interest free and settlement occurs in cash. There have been no guarantees provided or received for any related party receivables or payables .
For the year ended 31 December 2009, the Group has not recorded any impairment of receivables relating to amounts owed by related par-
ties (2008: Nil). This assessment is undertaken each fi nancial year through examining the fi nancial position of the related party and the market
in which the related party operates.
> RELATED PARTIES
The company has for 2009 received invoices for consultancy services from Spinoza AS in a total of TNOK 627 ( 2008: TNOK 295). 248 TNOK
is oustanding per 31.12.2009 and paid during January 2010. Spinoza AS is owned by the chairman of the board Ole Jørgen Fredriksen.
All transactions between related parties are based on arm length’s principles and the invoicing is according to an agreement between the
Q-Free ASA and the Chairman of the Board concerning consultancy services.
> ASSOCIATED COMPANIES
Q-Free ASA has not had ownership in associated companies in 2009.
NOTE 25. SALARIES AND PERSONNEL RELATED EXPENSES
Parent company Group
2008 2009 2009 2008
69,214 93,062 Salaries 138,353 105,471
10,616 14,811 Social security 17,452 13,468
6,693 5,354 Pension costs 9,033 7,636
-720 0 Skattefunn (governmental tax relief) 0 -788
-19,526 -10,167 Other personnel related expenses -11,125 -18,298
66,277 103,060 Total 153,713 107,488
107 126 Average number of employees 282 232
102 123 Average number of man-years 274 226
Payments to senior management and Board of Directors 2008
TNOK Salary BonusDirector’s
remunerationPension
service costOther remu-
nerationShare
option cost TOTAL
Ole Jørgen Fredriksen, Chairman of the Board 216.7 27.7 311.0 555.4
Christian Albech, Board member 132.5 1.5 155.0 289.0
Torild Skogsholm, Board member 140.0 155.0 295.0
Jan Pihl Grimnes, Board member 90.0 155.0 245.0
Mimi Kristine Berdal, Board member 220.0 0.7 155.0 375.7
Sissel Lillevik Larsen, Employee elected Board member 37.5 37.5
Anders Hagen, Employee elected Board member 62.5 62.5
Pål Rune Johansen **, Employee elected Board member 25.0 25.0
Øyvind Isaksen, Chief Executive Offi cer 2,380.8 250.0 161.3 568.0 3,360.1
Marianne Sandal, Vice President Operations 1,404.6 229.8 126.0 1,760.4
Jos A.G. Nijhuis, General Manager Dacolian B.V. 909.7 102.8 1,012.5
Finn Øistein Nordam*, Chief Financial Offi cer 2,098.0 63.2 218.0 2,379.2
Per Fredrik Ecker, Vice President Sales 1,188.4 160.1 126.0 1,474.5
Stein-Tore Nybodahl, HR Manager 769.2 161.2 38.0 968.4
Steinar Furan, Quality Manager 809.9 108.6 126.0 1,044.5
Hans Christian Bolstad, Vice President R&D 1,065.7 173.0 126.0 1,364.7
Bjørn Kleven***, Acting Chief Financial Offi cer 825.3 92.2 917.5
TOTAL 11,451.6 313.2 924.2 1,189.0 29.9 2,259.0 16,166.9
* Finn Øistein Nordam resigned from the position as CFO 30th June and received salary until 31st of December 2008.** Pål Rune Johansen served as employee elected board member until 10 May 2008.*** Bjørn Kleven has served as Acting CFO since 30t of June 2008.
Q-FREE / ANNUAL / REPORT / 2009 (86 + 87)
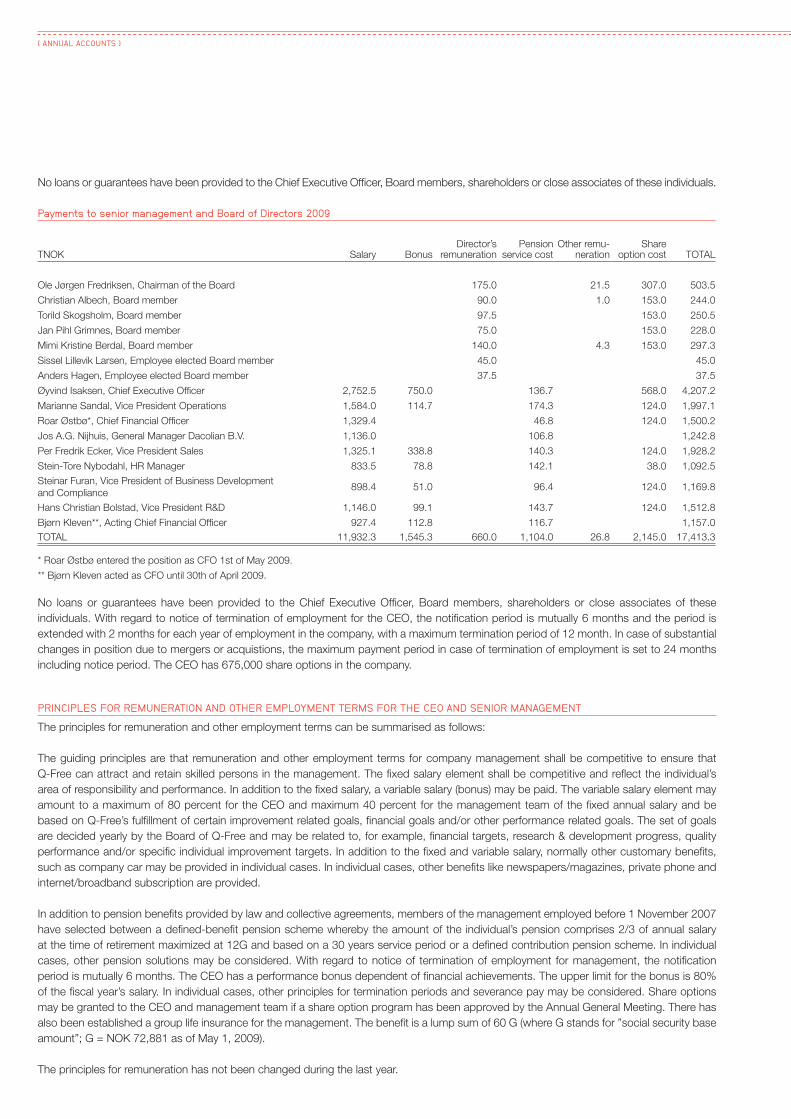
No loans or guarantees have been provided to the Chief Executive Offi cer, Board members, shareholders or close associates of these individuals .
Payments to senior management and Board of Directors 2009
TNOK Salary BonusDirector’s
remunerationPension
service costOther remu-
nerationShare
option cost TOTAL
Ole Jørgen Fredriksen, Chairman of the Board 175.0 21.5 307.0 503.5
Christian Albech, Board member 90.0 1.0 153.0 244.0
Torild Skogsholm, Board member 97.5 153.0 250.5
Jan Pihl Grimnes, Board member 75.0 153.0 228.0
Mimi Kristine Berdal, Board member 140.0 4.3 153.0 297.3
Sissel Lillevik Larsen, Employee elected Board member 45.0 45.0
Anders Hagen, Employee elected Board member 37.5 37.5
Øyvind Isaksen, Chief Executive Offi cer 2,752.5 750.0 136.7 568.0 4,207.2
Marianne Sandal, Vice President Operations 1,584.0 114.7 174.3 124.0 1,997.1
Roar Østbø*, Chief Financial Offi cer 1,329.4 46.8 124.0 1,500.2
Jos A.G. Nijhuis, General Manager Dacolian B.V. 1,136.0 106.8 1,242.8
Per Fredrik Ecker, Vice President Sales 1,325.1 338.8 140.3 124.0 1,928.2
Stein-Tore Nybodahl, HR Manager 833.5 78.8 142.1 38.0 1,092.5
Steinar Furan, Vice President of Business Development
and Compliance898.4 51.0 96.4 124.0 1,169.8
Hans Christian Bolstad, Vice President R&D 1,146.0 99.1 143.7 124.0 1,512.8
Bjørn Kleven**, Acting Chief Financial Offi cer 927.4 112.8 116.7 1,157.0
TOTAL 11,932.3 1,545.3 660.0 1,104.0 26.8 2,145.0 17,413.3
* Roar Østbø entered the position as CFO 1st of May 2009.
** Bjørn Kleven acted as CFO until 30th of April 2009.
No loans or guarantees have been provided to the Chief Executive Offi cer, Board members, shareholders or close associates of these
individuals. With regard to notice of termination of employment for the CEO, the notifi cation period is mutually 6 months and the period is
extended with 2 months for each year of employment in the company, with a maximum termination period of 12 month. In case of substantial
changes in position due to mergers or acquistions, the maximum payment period in case of termination of employment is set to 24 months
including notice period. The CEO has 675,000 share options in the company.
PRINCIPLES FOR REMUNERATION AND OTHER EMPLOYMENT TERMS FOR THE CEO AND SENIOR MANAGEMENT
The principles for remuneration and other employment terms can be summarised as follows:
The guiding principles are that remuneration and other employment terms for company management shall be competitive to ensure that
Q-Free can attract and retain skilled persons in the management. The fi xed salary element shall be competitive and refl ect the individual’s
area of responsibility and performance. In addition to the fi xed salary, a variable salary (bonus) may be paid. The variable salary element may
amount to a maximum of 80 percent for the CEO and maximum 40 percent for the management team of the fi xed annual salary and be
based on Q-Free’s fulfi llment of certain improvement related goals, fi nancial goals and/or other performance related goals. The set of goals
are decided yearly by the Board of Q-Free and may be related to, for example, fi nancial targets, research & development progress, quality
performance and/or specifi c individual improvement targets. In addition to the fi xed and variable salary, normally other customary benefi ts,
such as company car may be provided in individual cases. In individual cases, other benefi ts like newspapers/magazines, private phone and
internet/broadband subscription are provided.
In addition to pension benefi ts provided by law and collective agreements, members of the management employed before 1 November 2007
have selected between a defi ned-benefi t pension scheme whereby the amount of the individual’s pension comprises 2/3 of annual salary
at the time of retirement maximized at 12G and based on a 30 years service period or a defi ned contribution pension scheme. In individual
cases, other pension solutions may be considered. With regard to notice of termination of employment for management, the notifi cation
period is mutually 6 months. The CEO has a performance bonus dependent of fi nancial achievements. The upper limit for the bonus is 80%
of the fi scal year’s salary. In individual cases, other principles for termination periods and severance pay may be considered. Share options
may be granted to the CEO and management team if a share option program has been approved by the Annual General Meeting. There has
also been established a group life insurance for the management. The benefi t is a lump sum of 60 G (where G stands for ”social security base
amount”; G = NOK 72,881 as of May 1, 2009).
The principles for remuneration has not been changed during the last year.
( ANNUAL ACCOUNTS )

Audit fees
The group has the following audit related fees: (All fi gures excl. VAT )
2009 2009 2008 2008
Parent comp. Group
Parent comp. Group
Audit services 286 817 190 381
Other audit related services 113 145 113 124
Tax services 465 584 185 343
Other, non audit related services 106 407 186 192
Total 970 1,953 674 1,040
NOTE 26. OTHER OPERATING EXPENSESSpecifi cation
Parent company Group
2008 2009 CATEGORY 2009 2008
46,525 109,281 External services 117,809 52,454
15,695 24,448 Travel expenses 28,462 16,696
15,043 20,242 Offi ces supplies 24,676 16,070
1,470 1,713 Insurance 2,690 1,865
5,375 4,293 Freight 4,549 5,444
1,838 1,570 Rent machinery & tools 4,591 2,693
4,313 5,756 Marketing / promotions 7,154 4,916
1,924 3,137 Service & Maintenance 4,704 2,049
2,491 2,248 Operating materials 3,210 2,793
-249 320 Bad debt losses 48 -249
1,008 3,913 Other operating expenses 14,162 11,815
95,432 176,922 Total 212,057 116,547
NOTE 27. REVENUE RECOGNITION IN PROJECTS
The Group’s main business activity is to develop and manufacture products and systems as well as provision of service and maintenance
based on orders received. The Group reports gross balance sheet values attached to long-term production contracts. Gross amounts due
from customers for contract work (Work in progress) are recognised on the balance sheet as an asset, and gross amounts due to customers
for contract work (Prepayments from customers) are recognised on the balance sheet as a liability. Projects in progress are the net amount of
accumulated operating revenues less accumulated invoicing for all ongoing contracts where accumulated operating revenues are higher than
accumulated invoicing. Prepayments from customers are the net amount of accumulated operating revenues less accumulated invoicing for
all ongoing contracts where accumulated invoicing is higher than accumulated operating revenues.
Each project is monitored individually and is measured against the updated project prognosis. The estimated accrued contract profi t shall not
exceed a proportional share of the estimated total contract profi t. The proportional share of the contract is based on the degree of comple-
tion of the individual contract, which is largely determined by the costs incurred as a ratio of the expected overall cost at the time of valuation.
If the profi t on a contract cannot be estimated with a reasonable degree of certainty, the project will be recognised without a profi t until the
uncertainty is manageable. All projects are followed up on an ongoing basis with project costing. In the event a project calculation shows a
loss, this loss will be expensed immediately in its entirety.
Q-FREE / ANNUAL / REPORT / 2009 (88 + 89)

Parent company Group
2008 2009 BALANCE SHEET ITEMS 2009 2008
15,538 62,552 Work in progress 64,699 43,170
-1,041 -13 Prepayments from customers -5,415 -5,550
14,497 62,539 Net projects in progress 59,285 37,620
2008 2009 SUMMARY OF ON GOING PROJECTS AS AT 31.12 2009 2008
135,502 519,565 Total orders 648,867 215,502
62,770 414,127 Accumulated revenues 497,141 66,568
72,733 105,439 Remaining revenues 151,727 148,934
42,625 308,759 Accumulated operating expenses 428,083 114,625
13,818 62,658 Remaining operating expenses 96,435 75,640
-1,041 -13 Prepayments received -5,415 0
0 0 Remaining variable expenses on loss-making projects 6,011 0
UNCERTAINTY RELATED TO ESTIMATES
Revenue is recognised on the contracts according to the estimated progress. Progress is calculated as accrued production costs as a
percentage of total expected production costs. Revenues are agreed by contract. Total expected production costs are estimated based on
a combination of historical fi gures, systematic estimation procedures, the follow up of effi ciency targets and best estimates. Ordinarily, the
number of remaining hours employees must use to develop or complete the project will constitute a large part of total production costs. The
uncertainty of the estimates is infl uenced by the project’s duration and technical complexity. Principles have been established for categorising
projects in terms of technological complexity and development content. This forms the basis for risk assessments and taking to account the
profi ts from the projects. The projects are reviewed on a monthly basis.
NOTE 28. BALANCE AND OFF BALANCE SHEET COMMITMENTS
Parent company Group
2008 2009 2009 2008
BALANCE SHEET COMMITMENTS
Guarantees and loans secured by mortgage
0 0 Long-term liabilities 1,412 2,202
0 0 Short-term liabilities 0 0
0 0 TOTAL 1,412 2,202
Book value of assets securing mortgages and guarantees
61,692 115,600 Accounts receivable 115,600 61,692
15,538 62,552 Work in progress 62,552 15,538
33,006 25,381 Inventories 38,404 36,726
54,579 56,409 Tangible assets 59,977 66,232
164,815 259,942 TOTAL 276,533 180,188
OFF BALANCE SHEET COMMITMENT
49,860 134,307 Guarantees to customers, suppliers and lease contracts 135,314 49,860
( ANNUAL ACCOUNTS )

Q-FREE / ANNUAL / REPORT / 2009 (90 + 91)

ABBREVIATIONSDEFINITIONS AND INDUSTRY VOCABULARY
ALPR AUTOMATIC LISENCE PLATE RECOGNITION
CC CONGESTION CHARGING
CALM COMMUNICATION ACCESS FOR LAND MOBILES
CEN COMITÉ EUROPÉEN DE NORMALISATION (EUROPEAN COMMITTEE FOR STANDARDISATION)
DSRC DEDICATED SHORT RANGE COMMUNICATION
ERI ELECTRONIC REGISTRATION AND IDENTIFICATION
ETC ELECTRONIC TOLL COLLECTION
GNSS GLOBAL NAVIGATION SATELLITE SYSTEM
GPS GLOBAL POSITIONING SYSTEM
GSM GLOBAL SYSTEM FOR MOBILE COMMUNICATIONS
ITS INTELLIGENT TRANSPORT SYSTEMS
MLFF TOWARDS MULTI LANE FREE FLOW
MTC MANUAL TOLL COLLECTION SYSTEMS
OCR OPTIMAL CHARACTER RECOGNITION
OBU ON BOARD UNIT
RFID RADIO FREQUENCY IDENTIFICATION
RFQ REQUEST FOR QUALIFICATION
RUC ROAD USER CHARGING
Design and concept: Itera Gazette / Photo: Ole Walter (Cover, pages 2–3, 14–15, 17, 21, 23, 24–25) + Ronny Danielsen (page 20) + Bo Mathisen (pages 11, 12–13) + Yvonne Holth (pages 42–43) / Print: Grøset Trykk

+ HEADQUARTER
Q-FREE ASA
TH. OWESENS GT. 35C
NO–7044 TRONDHEIM
NORWAY
P: +47 73 82 65 00
F: +47 73 82 65 01
+ Q-FREE ASA OSLO
WERGELANDSVEI 1
NO–0167 OSLO
NORWAY
P: +47 23 10 65 00
F: +47 22 42 12 00
+ Q-FREE AUSTRALIA PTY. LTD.
UNIT 2, 65 NICHOLSON STREET
ST. LEONARDS NSW 2065
AUSTRALIA
P: +61 2 9887 8200
F: +61 2 9901 3032
+ Q-FREE LATIN AMERICA
AL. MADEIRA, 53, CJ. 14
ALPHAVILLE, BARUERI
CEP 06454–010 SÃO PAULO
BRAZIL
P: +55 11 4191 6345
F: +55 11 4195 8585
+ Q-FREE FRANCE
168, AVENUE CHARLES DE
GAULLE
92522 NEUILLY SUR SEINE
CEDEX
FRANCE
P: +33 (0)170375306
F: +33 (0)170375353
+ Q-FREE MALAYSIA
19, 2-3 JALAN PJU 8/5F
BANDAR DAMANSARA PERDANA
47820 PETALING JAYA
SELANGOR DARUL EHSAN
MALAYSIA
P: +6 03 7722 4457
F: +6 03 7727 9448
Q-FREE SLOVAKIA
TOWER 115, 11TH FLOOR
PRIBINOVA 25
81109 BRATISLAVA
SLOVAKIA
+ Q-FREE PORTUGAL
TAGUSPARK
NÚCLEO CENTRAL, 371
P 2740–122 OEIRAS
PORTUGAL
P: +351 21 422 7170
F: +351 21 422 7171
+ Q-FREE SVERIGE AB
SUNDBYBERGSVÄGEN 1,
9.DE VÅNINGEN
171 73 SOLNA
SVERIGE
P: +46 706227876
F: +46 706204201
+ Q-FREE THAILAND CO. LTD.
20/22 MOO 12
KASET-NAWAMIN RD
LATHPRAO
10230 BANGKOK
THAILAND
P: +66 255 32 025
+ Q-FREE UK
BUILDING CAPITAL / Q-FREE
SUITE 144, 1ST FLOOR
BERKELEY SQUARE HOUSE,
BERKELEY SQUARE
LONDON
W1J 6BD
UK
P: +44 203 004 2600
F: +44 203 004 2601
+ Q-FREE THE NETHERLANDS
DACOLIAN BV / Q-FREE
POSTBUS 180
9410 AD BEILEN
THE NETHERLANDS
P: +31(0)593 542.055
F: +31(0)593 542.098

VIDEO TOLLING AND ENFORCEMENT
SYSTEM/TURNKEY SOLUTIONS
DSRC
+ ADDRESS
TH. OWESENS GT. 35C
NO–7044 TRONDHEIM
NORWAY
+ MAILADRESS
P.O. BOX 3974 LEANGEN
NO–7443 TRONDHEIM
NORWAY
P: +47 73 82 65 00
F: +47 73 82 65 01
WWW.Q-FREE.COM
BANK: DEN NORSKE BANK
ACC.NO.: 5361 06 10540
S.W.I.F.T DNBANOBBTRD
+ REGISTER OF BUSINESS ENTERPRISES
NO 935 487 242
Q-FREE ASA CONTACT DETAILS