goa arr fy 14 - jercuts.gov.injercuts.gov.in/writereaddata/uploadfile/bpgoa15a_1423.pdf · figure...
TRANSCRIPT

BUSINESS PLANFOR THE
CONTROL PERIOD FY 2016-17 TO FY 2018-19OF
El e c t r ic it y De p a r t m e n t , Go a
Su b m it t e d t o
Jo in t El e c t r ic it y Re g u l a t o r y Co m m is s io n
Gu r g a o n
By
El e c t r ic it y De p a r t m e n t , Go a
SEPTEMBER 2015
Electricity Department-Goa Page 1

Business Plan for the Control Period FY 2016-17 to FY 2018-19
BEFORE THE JOINT ELECTRICITY REGULATORY COMMISSION FOR THE STATE OF GOA, &
UNION TERRITORIES, GURGAON
Filing No............
Case No............
IN THE MATTER OF: Petition for approval of the Business Plan for control period from FY2016-17 to FY 2018-19 for the Electricity Department, Government of Goa as per Regulation 4.2 & 5.1 of JERC (Multi Year Distribution) Tariff Regulations, 2014.
AND
IN THE MATTER OF: Electricity Department, Government of Goa, Vidyut Bhavan, Panaji, Goa
............Petitioner
Electricity Department, Government of Goa (hereinafter referred to as "ED-Goa"), files this
petition for approval of the Business Plan for the control period FY 2016-17 to FY 2018-19 as per Regulation 4.2 & 5.1 of JERC (Multi Year Distribution) Tariff Regulations, 2014.
Electricity Department, Government of Goa Petitioner
Place: Panaji
Dated:___ September 2015
Electricity Department-Goa Page 2

Business Plan for the Control Period FY 2016-17 to FY 2018-19
TABLE OF CONTENTS
CHAPTER 1. IN TRO DU CTIO N ................................................................................................................ 11
1.1 Ba c k g r o u n d - In d ia n Po w e r Se c t o r ............................................................................................................. 111.2 A l l In d ia In s ta l le d Ca p a c it y ................................................................................................................................ 121.3 Po w e r Se c t o r in Go a ............................................................................................................. 151.4 Bu siness A c t iv it ie s ......................................................................................................................................................181.5 OBJECTIVE OF BUSINESS PLAN ...................................................................................................19
1.6 A p p ro a c h t o Bu siness Pl a n ..................................................................................................................................21
CHAPTER 2. POWER BUSINESS IN G O A ..............................................................................................23
2.1 Co n s u m e r Pr o f i l e ...................................................................................................................232.2 Po w e r Pu rc h a s e Po r t f o l i o ...................................................................................................242.3 M e a su re s t o In cre a se Po w e r A v a i l a b i l i t y ...........................................................................242.4 Dis t r ib u t io n In f r a s t r u c t u r e .................................................................................................27
2.5 SWOT A n a ly s is ............................................................................................................................................................292.6 Hu m a n Re s o u rc e Ma n a g e m e n t ............................................................................................332.7 In it ia t iv e s t o Im p ro v e th e Sy s te m .....................................................................................................................392.8 W a y Fo r w a r d f o r ED -G O A ................................................................................................................................ 41
CHAPTER 3. PAST PERFORMANCE ANALYSIS....................................................................................42
3.1 Pr e a m b le ..................................................................................................................................423.2 DATA SOURCING ....................................................................................................................... 423.3 Sa le s ................................................................................................................................................................................... 423.4 T ra n s m is s io n & Dis t r ib u t io n lo s s e s .............................................................................................................. 453.5 Co n s u m e r Ba s e ....................................................................................................................... 46
3.6 Po w e r Pu r c h a s e ........................................................................................................................................................ 473.7 Re v e n u e ............................................................................................................................................................................48
CHAPTER 4. MARKET ASSESSMENT....................................................................................................49
4.1 Pr e a m b le .........................................................................................................................................................................494.2 St a t u t o r y a n d Re g u la t o r y Fr a m e w o r k ..............................................................................49
4.3 Key Pr o v is io n s .........................................................................................................................524.4 Ma r k e t issues a n d c h a l le n g e s ...........................................................................................................................524.5 So l a r RPO St a t u s : ....................................................................................................................................................544.6 No n -So l a r RPO St a t u s : ........................................................................................................................................544.7 Re d u c t io n o f Cro s s Su b s id y .................................................................................................................................554.8 Ma r k e t O u t l o o k .........................................................................................................................................................55
CHAPTER 5. ALLOCATION POLICY FOR WIRES & SUPPLY BUSINESS...........................................57
5.1 Need f o r Co s t A l l o c a t i o n ..................................................................................................... 57
Electricity Department-Goa Page 3

Business Plan for the Control Period FY 2016-17 to FY 2018-19
5.2 A l l o c a t io n b e tw e e n Re t a i l Su p p ly a n d W h e e lin g Bu s in e ss ...............................................575.3 Su m m a ry o f A l l o c a t io n St a t e m e n t ...............................................................................................................605.4 W ire s a n d s u p p ly b usiness a v a i l a b i l i t y .........................................................................................................61
CHAPTER 6. DEMAND & SALES ASSESSMENT.................................................................................. 65
6.1 Pr e a m b le ..........................................................................................................................................................................656.2 Re g u la t o r y Pr o v is io n s f o r Sa le s Fo r e c a s t ................................................................................................ 656.3 A p p ro a c h f o r Sa le s Fo r e c a s t f o r Co n t r o l Pe r io d .............................................................666.4 Sa le s Pr o je c t io n s ....................................................................................................................................................... 67
6.5 A p p ro a c h f o r Co n s u m e r Fo r e c a s t f o r Co n t r o l Pe r i o d .....................................................736.6 Co n s u m e r Fo r e c a s t ................................................................................................................736.7 A p p ro a c h f o r Fo r e c a s t o f Co n n e c te d Lo a d f o r Co n t r o l Pe r io d ......................................786.8 En e r g y Re q u ir e m e n t ...............................................................................................................80
CHAPTER 7. POWER PURCHASE PLAN..................................................................................................81
7.1 Pr e a m b le ......................................................................................................................................................................... 81
7.2 POWER PURCHASE SOURCES ..................................................................................................... 817.3 Sh a re A l lo c a t io n f o r CGS St a t i o n ................................................................................................................ 817.4 Pl a n t Lo a d Fa c t o r f o r CGS St a t i o n s ............................................................................................................827.5 A u x i l ia r y c o n s u m p t io n ...........................................................................................................................................837.6 T ra n s m is s io n Lo s s e s ............................................................................................................... 84
7.7 En e r g y Pr o je c t io n w it h in St a t e Ge n e r a t io n .............................................................................................857.8 Po w e r Pu rc h a s e f r o m T r a d e rs / Sh o r t T e rm .......................................................................867.9 En e r g y f r o m So l a r ....................................................................................................................................................867.10 En e r g y f r o m No n -So l a r ......................................................................................................................................... 877.11 Po w e r Pu rc h a s e Pr o je c t io n s ............................................................................................................................. 88
CHAPTER 8. CAPITAL EXPENDITURE......................................................................................................90
8.1 Pr e a m b le ......................................................................................................................................................................... 908.2 De ta ils o f Ca p ita l Ex p e n d i t u r e ......................................................................................................................... 908.3 Ca p it a liz a t io n s c h e d u le ...................................................................................................... 1128.4 Fu n d in g o f Ca p ita l Ex p e n d itu r e .....................................................................................................................114
8.5 In it ia t iv e s by ED Go a .............................................................................................................................................116
CHAPTER 9. OPERATION & MAINTENANCE EXPENSES.................................................................117
9.1 No rm s f o r O&M Ex p e n s e s ..................................................................................................1179.2 Co m p u ta t io n o f Em p lo ye e Expense No r m s .............................................................................................1189.3 A d m in is t r a t io n a n d Ge n e r a l Expense No r m s ................................................................. 1219.4 Re p a irs a n d Ma in te n a n c e Exp e n se s ...................................................................................123
CHAPTER 10. PRAYERS TO COM M ISSION.................................................................................. 127
10.1 Pr a y e r s t o Ho n ' b le Co m m is s io n .........................................................................................127
Electricity Department-Goa Page 4

Business Plan for the Control Period FY 2016-17 to FY 2018-19
ANNEXURES............................................................................................................................................129
HEAD WISE DETAILS OF CAPITAL EXPENDITURE SCHEMES.......................................................130
11.1. Sc h e m e : Sys te m Im p ro v e m e n t Schem es (P l a n ) .............................................................130
11.2. Sc h e m e : St r e n g t h e n in g o f 220KV T ra n s m is s io n Ne t w o r k ..........................................13611.3. Sc h e m e : Sc h e d u le T r ib e De v e lo p m e n t schem e (P la n ) ............................................... 13811.4. Sc h e m e : Er e c t io n a n d a u g m e n ta t io n o f 33/11KV s u b s ta t io n .................................14111.5. Sc h e m e : APDRP (St a t e schem es) .................................................................................... 14411.6. Sc h e m e : Un d e r g r o u n d c a b lin g schem es (RAPDRP - Du r in g 11th Pla n Pe r io d ) .........145
11.7. Sc h e m e : Pu b lic Li g h t i n g ..................................................................................................14611.8. Sc h e m e : Er e c t io n o f 220KV t ra n s m is s io n lin e f r o m Po n d a t o V e r n a ....................14711.9. Sc h e m e : Er e c t io n a n d c o m m is s io n in g o f 220KV Su b s ta t io n a t V e r n a ...................14811.10. Sc h e m e : Er e c t io n o f 220KV T ra n s m is s io n lin e f r o m X eldem t o Cu n c o l im ...........14911.11. Sc h e m e : Er e c t io n o f 220.33KV s u b s ta t io n a t Cu n c o l im .........................................150
Electricity Department-Goa Page 5

Business Plan for the Control Period FY 2016-17 to FY 2018-19
LIST OF FIGURES
FIGURE 1: ALL INDIA PER CAPITA CONSUMPTION (IN KWH).............................................................................. 11FIGURE 2: ALL INDIA INSTALLED CAPACITY (IN GW) - AS ON AUGUST 2015...................................................... 12FIGURE 3: ALL INDIA FUEL WISE SHARE IN INSTALLED GENERATION CAPACITY (MW) - AS OF AUGUST 2015 ... 14FIGURE 4: ALL INDIA PEAK AND ENERGY DEFICIT...............................................................................................15FIGURE 5: GOA MAP..........................................................................................................................................16FIGURE 6: ACTUAL CATEGORY-WISE CONSUMPTION FOR 2014-15....................................................................23FIGURE 7: EXISTING EHV INFRASTRUCTURE...................................................................................................... 28FIGURE 8: SWOT ANALYSIS OF ED-GOA............................................................................................................. 29FIGURE 9: EXISTING STRUCTURE OF ED-GOA.................................................................................................... 35FIGURE 10: EXISTING HIERARCHICAL POSTS IN ED-GOA....................................................................................35FIGURE 11: STRUCTURE OF CIRCLE I.................................................................................................................. 36FIGURE 12: STRUCTURE OF CIRCLE II.................................................................................................................37FIGURE 13: CATEGORY-WISE SALES (MUS) - YEAR-WISE...................................................................................43FIGURE 14: CATEGORY-WISE SALES (%) - YEAR-WISE........................................................................................44FIGURE 15: TREND IN TRANSMISSION AND DISTRIBUTION LOSS (%)................................................................ 45FIGURE 16: CONSUMER BASE FOR FY 2014-15.................................................................................................. 47FIGURE 17: POWER PURCHASE RATE PER UNIT FOR THE PAST 5 YEARS..............................................................47FIGURE 18: CATEGORY WISE REVENUE (RS. CRORE) FY 2014-15.........................................................................48FIGURE 19: RPO % MANDATED BY JERC............................................................................................................ 53
Electricity Department-Goa Page 6

Business Plan for the Control Period FY 2016-17 to FY 2018-19
LIST OF TABLES
TABLE 1: TARIFF FILING DETAILS........................................................................................................................ 18TABLE 2: SHARE ALLOCATION FROM CENTRAL GENERATING STATIONS (AS PER POWER FLOW)....................... 24TABLE 3: FUTURE POWER ALLOCATION FROM MOP......................................................................................... 26TABLE 4: PPA EXECUTED WITH CENTRAL SECTOR POWER PROJECTS.................................................................26TABLE 5: NETWORK CONFIGURATION (AS ON 31ST MARCH 2015)....................................................................28TABLE 6: CATEGORY WISE SALES (MUS) FOR LAST SIX YEARS............................................................................ 43TABLE 7: CONSUMER BASE FOR LAST SIX YEARS................................................................................................46TABLE 8: APPLICABLE KEY REGULATIONS FOR ED-GOA...................................................................................... 51TABLE 9: ALLOCATION STATEMENT................................................................................................................... 61TABLE 10: SAIDI AND RI FOR DIVISION I FOR FY 2012-13 TO FY 2014-15............................................................63TABLE 11: WIRES AVAILABILITY FOR ED-GOA.....................................................................................................63TABLE 12: WIRES AVAILABILITY FOR CONTROL PERIOD..................................................................................... 64TABLE 13: SUPPLY AVAILABILITY FOR FY 2014-15 AND FY 2015-16....................................................................64TABLE 14:CAGR FOR SALES CALCULATED AND CONSIDERED FOR CONTROL PERIOD..........................................72TABLE 15: CATEGORY WISE SALES PROJECTION FOR FY 2016-17 TO FY 2018-19............................................... 73TABLE 16:CAGR FOR CONSUMERS CALCULATED AND CONSIDERED FOR CONTROL PERIOD...............................77TABLE 17: CATEGORY WISE PROJECTIONS OF NO. OF CONSUMERS FOR FY 2016-17 TO FY 2018-19................. 78TABLE 18: CATEGORY WISE CONNECTED LOAD PROJECTIONS FOR FY 2016-17 TO FY 2018-19.......................... 79TABLE 19: DISTRIBUTION LOSS REDUCTION (%) TRAJECTORY FOR THE CONTROL PERIOD.................................80TABLE 20: ENERGY BALANCE FOR CONTROL PERIOD......................................................................................... 80TABLE 21: SHARE OF CGS FROM ALLOCATED AND UNALLOCATED CAPACITY (AS PER POWER FLOW)............... 82TABLE 22: ACTUAL PLF OF CGS FROM FY 2009-10 TO FY 2013-14......................................................................83TABLE 23: PLF CONSIDERED FOR THE NEXT CONTROL PERIOD...........................................................................83TABLE 24: AUXILIARY CONSUMPTION CONSIDERED FOR NEXT CONTROL PERIOD............................................ 84TABLE 25: TRANSMISSION LOSSES CONSIDERED FOR THE NEXT CONTROL PERIOD........................................... 84TABLE 26: AVERAGE OF WEEKLY LOSSES FOR WESTERN REGION FOR H2 OF FY 2013-14...................................85TABLE 27: DETAILS OF LOI ISSUED BY ED-GOA FOR POWER PURCHASE FOR THE MONTH OF APRIL 2015..........86TABLE 28: DETAILS OF LOI ISSUED BY ED-GOA FOR POWER PURCHASE FOR THE MONTH OF MAY 2015............86TABLE 29: DETAILS OF RPO OBLIGATION FOR ED-GOA FOR ENTIRE CONTROL PERIOD.......................................88TABLE 30: ENERGY REQUIREMENT IN MU'S FOR THE ENTIRE CONTROL PERIOD............................................... 89TABLE 31: PROPOSED CAPITAL EXPENDITURE FOR CONTROL PERIOD (RS.CRORE).............................................92TABLE 32: WORKS TAKEN UP UNDER INFRASTRUCTURE DEVELOPMENT FROM ELECTRICITY DUTY.................. 98TABLE 33: PROPOSED CAPITALIZATION SCHEDULE.......................................................................................... 113TABLE 34: FUNDING SOURCES FOR PROPOSAL CAPITAL EXPENDITURE........................................................... 115TABLE 35: REPLACEMENT PLAN OF STREETLIGHT WITH LEDS..........................................................................116TABLE 36: ENERGY SAVING POTENTIAL OF ENERGY EFFICIENCY PROJECTS FOR THE CONTROL PERIOD.........116TABLE 37: ACTUAL EMPLOYEE EXPENSES FOR THE LAST SIX YEARS.................................................................. 119TABLE 38: EMPLOYEE PARAMETER FOR THE LAST FIVE YEARS.........................................................................120TABLE 39: EMPLOYEE NORMS CALCULATIONS.................................................................................................120TABLE 40: PROPOSED NORM FOR EMPLOYEE EXPENSES................................................................................. 121TABLE 41: ADMINISTRATION AND GENERAL EXPENSES FOR THE LAST SIX YEARS.............................................122TABLE 42: A&G EXPENSE NORMS CALCULATION............................................................................................. 122TABLE 43: PROPOSED A&G EXPENSE NORMS..................................................................................................123TABLE 44: R&M EXPENSE AND PARAMETERS FOR THE LAST FIVE YEARS......................................................... 124TABLE 45: CALCULATION OF NORMS FOR R&M EXPENSES...............................................................................124TABLE 46: PROJECTION OF R&M EXPENSE FOR THE CONTROL PERIOD............................................................ 125
Electricity Department-Goa Page 7

Business Plan for the Control Period FY 2016-17 to FY 2018-19
TABLE 47: PROPOSED R&M EXPENSE NORMS..................................................................................................125TABLE 48: EXPENDITURE FOR SAFETY OF MANPOWER.................................................................................... 125TABLE 49:EXPENDITURE FOR CGRF FOR FY2014-15......................................................................................... 126
Electricity Department-Goa Page 8

Business Plan for the Control Period FY 2016-17 to FY 2018-19
List of AbbreviationsSr.
NoAbbreviations Descriptions
1. A&G Administrative and General
2. AC Auxiliary Consumption
3. ABR Average Billing Rate
4. APR Annual Performance Review
5. ARR Aggregate Revenue Requirement
6. c a g r Compound Annual Growth Rate
7. c a p e x Capital Expenditure
8. c e r c Central Electricity Regulatory Commission
9. je r c Joint Electricity Regulatory Commission
10. cg s Central Generating Station
11. CoS Cost of Supply/ Service
12. CPPs Captive Power Plants
13. Crs Crores
14. c w ip Capital W ork in Progress
15. DF Distribution Franchisee
16. Discom Distribution Companies
17. d p c Delayed Payment Charges
18. d s m Demand Side Management
19. d t c Distribution Transformer
20. EA/The Act The Electricity Act 2003
21. EDG/ED-Goa Electricity Department-Goa
22. FY Financial Year
23. GFA Gross Fixed Assets
24. G.O.G Government Of Goa
25. Go I Government of India
26. HR Human Resource
27. HT High Tension
28. IPP Independent Power Producers
29. KV Kilo Volt
30. kVA Kilo Volt Ampere
31. kVAh Kilo Volt Ampere Hour
32. kW Kilo Watt
33. kWh Kilo W att Hour
34. lf Load Factor
35. lt Low Tension
36. MD Maximum Demand
Electricity Department-Goa Page 9

Business Plan for the Control Period FY 2016-17 to FY 2018-19
Sr.
NoAbbreviations Descriptions
37. MOD Merit Order Despatch
38. M o P Ministry of Power
39. MOU Memorandum of Understanding
40. MU Million Units (Million kWh)
41. M VA Mega Volt Ampere
42. MW Mega Watt
43. MYT Multi Year Tariff
44. NEP National Electricity Policy
45. NTP National Tariff Policy
46. NTPC National Thermal Power Corporation
47. O&M Operation & Maintenance
48. PAF Plant Availability Factor
49. PF Provident Fund
50. p fc Power Finance Corporation
51. plf Plant Load Factor
52. plr Prime Lending Rate
53. PPA Power Purchase Agreement
54. R-APDRPRestructured-Accelerated Power Development and Reform Programme
55. r ec Rural Electrification Corporation
56. R&M Repair and Maintenance
57. ROE Return on Equity
58. RPO Renewable Purchase Obligation
59. Rs Rupees
60. sbi State Bank of India
61. T&D Transmission and Distribution
62. w.e.f W ith effect from
63. Y-o -Y Year on Year
Electricity Department-Goa Page 10

Business Plan for the Control Period FY 2016-17 to FY 2018-19
CHAPTER 1. INTRODUCTION
1.1 Background - Indian Power Sector
1.1.1 The Indian power sector has witnessed versatile changes over the last decade post the passage of The Electricity Act, 2003. These changes include introduction of significant reform measures, enhanced regulatory regime, increased level of private
sector participation, development of state-of-the-art grid linking the entire country and focus on renewable energy generation.
1.1.2 Energy requirement and supply is a strategic input and one of the key drivers for economic and social development behind any growing country.
1.1.3 As energy plays a very vital role in industrial production, economic growth and common man's life, it has become extremely essential to boost the growth in energy segment for the growth of the Country.
1.1.4 With the growing demand in energy requirement, the annual per capita energy
consumption has grown significantly. However the low per capita consumption in the Country as compared to the world average indicates significant potential for sustainable growth in the demand of electricity.
Figure 1: All India per Capita Consumption (in kWh)
1200
1000
800
600
400
200
0FY 06 FY 07 FY 08 FY 09 FY 10 FY 11 FY 12 FY 13 FY 14
Source: CEA/Executive Summary
Electricity Department-Goa Page 11

Business Plan for the Control Period FY 2016-17 to FY 2018-19
1.1.5 According to 18th Electric Power Survey (EPS), India's peak demand is expected to grow at a CAGR of 9.6% over a period of 8 years (FY 2014 to FY 2022) and would require a generating capacity of 289GW by 2022. The peak demand of Goa is
expected to grow to 1191 M W by 2022.
1.1.6 Distribution is the most critical segment of the electricity business chain. The distribution segment is still largely government owned and will require sustained attention of the authorities if the sector performance is to improve. The real
challenge of reforms in the power sector lies in efficient management of the distribution sector, which has been neglected so far. It is therefore necessary to improve the distribution infrastructure and the management of distribution utilities.
1.2 A ll India Installed Capacity
1.2.1 India is one of the largest power-generating countries in the world with an installed capacity of 276,782 M W (as of August, 2015). Over the last 6 years, the installed capacity of the country grew at a CAGR of 11.5% while the total power generated
grew at a CAGR of 4%.
1.2.2 The all India installed capacity (GW) is given hereunder:
Figure 2: All India Installed Capacity (in GW) - As on August 2015
Source: CEA/Monthly reports-August 2015
Electricity Department-Goa Page 12

Business Plan for the Control Period FY 2016-17 to FY 2018-19
1.2.3 India is the fifth largest generation capacity in the world with an installed capacity of ~277 GW as of August, 2015. Per capita electricity consumption of India grew only at 5.34% CAGR from FY 06 to FY 14 mirroring the capacity addition in the country.
However, compared to most of the developed countries like US (~13246 kWh1) or even other developing countries like China (~3298 kWh1), India's per capita consumption is fairly low (~957.14 kWh in FY 2013-14 - Answer in Parliament by Power Minister). India currently suffers from a major shortage of generation capacity, though it is the world's fourth largest energy consumer after United States,
China and Russia.
1.2.4 The Government of India has set an ambitious capacity addition target of 88 GW to be achieved in the 12th plan owing to which the power sector is poised for significant expansion. This has resulted in massive capacity addition plans being proposed in the sub-sectors of Generation, Transmission and Distribution.
1.2.5 The capacity addition has increased rapidly in the last few years i.e. last two years of the 11th Plan and first 2 years of 12th plan. The 11th Plan saw a record capacity addition of ~55 GW which is more than the combined capacity addition of the previous two five year Plans (9th and 10th Plan). The generation capacity in India is a
mix of thermal, hydro, nuclear, and renewable energy sources and over the year's coal (thermal) has become a dominant source of power generation. As of August 2015, thermal energy contributed 70% of the country's total power generating capacity, while hydro energy contributed 15%, renewable energy sources around 13% and nuclear energy contributed 2% to the total capacity. The details of fuel wise
share in power generation are given below (Source: CEA/monthly reports):
1 World Development Indicators, Word Bank
Electricity Department-Goa Page 13

Business Plan for the Control Period FY 2016-17 to FY 2018-19
Figure 3: All India Fuel wise Share in Installed Generation Capacity (MW) - As of August 2015
■ Coal
■ Gas
■ Diesel
■ Nuclear
■ Hydro
■ Renewables
1.2.6 Historically, India has experienced shortages in energy and peak power requirements. The Peak deficit average of 10.66% and energy deficit average of
8.19% was recorded between FY 05 to FY 15 (Source: CEA/LGBR Report).
1.2.7 In spite of significant overall progress in the power sector, the demand supply gap for electricity has hovered ~8-9% for the last few years. The shortages in energy and peak power has been primarily due to the slow pace of capacity addition, fuel
shortage, power evacuation and the growing demand. The deficit from FY 2014 onwards has come down due to pace in capacity expansion, availability of coal and decrease in demand for power as a result of slowdown in the economy. However, the demand is expected to pick-up with the expected revival in the economy, which may increase the deficit if the issues and problems affecting energy generation are not addressed immediately.
Electricity Department-Goa Page 14

Business Plan for the Control Period FY 2016-17 to FY 2018-19
Figure 4: All India Peak and Energy Deficit
Source: CEA/LGBR Reports
1.3 Power Sector in Goa
1.3.1 Goa, a tiny emerald land on the west coast of India, the 25th State in the Union ofStates of India, was liberated from Portuguese rule in 1961. It was part of Union territory of Goa, Daman & Diu till 30th May 1987 when it was carved out to form a
separate State. Goa covers an area of 3,702 square kilometres and comprises two Revenue district viz North Goa and South Goa. Boundaries of Goa State are defined in the North by the Terekhol River which separates it from Maharashtra, in the East and the South by Karnataka State and in the West by the Arabian Sea.
1.3.2 Goa, for the purpose of revenue administration is divided into district viz. North and South Goa with headquarters at Panaji and Margao respectively. The entire State comprises 11 talukas. For the purpose of implementation of development programmes, the State is divided into 12 community development blocks. As per 2011 census, the population of the State was ~14,58,000. Administratively the State
is organised into two districts North Goa comprising six talukas with a total area of 1736 sq. kms. and South Goa comprising five talukas with an area of 1966 sq. kilometres. In all there are 383 villages of which 233 are in North Goa district and 150 in South Goa district.
Electricity Department-Goa Page 15

Business Plan for the Control Period FY 2016-17 to FY 2018-19
Figure 5: Goa Map
Source: goa.gov.in
1.3.3 According to 18th Electric Power Survey (EPS), the peak demand of Goa is expected to grow to 1191 M W by 2022.
1.3.4 Per capita electricity consumption of Goa is highest compared to any other state inthe Country (~2000 kWh as compared to India average of 957 kWh) which iscomparable with most of the developed nations.
1.3.5 The Energy Deficit and the peak deficit as per LGBR report for FY 2015-16 for the
Sate of Goa are anticipated to be 0.5% (18MUs) and 0.9% (5MW) respectively.
1.3.6 Every society has its own peculiarity and that has to be understood individually for the society. The Goan society has very high expectations from its governing bodies. Also Goa is one of the tourism capitals of India and a lot of foreign and domestic
tourists visit Goa frequently on various festive occasions; hence, the basic facilities have to be on world class level especially domestic electricity availability and services. There are so many events being organized in Goa such as International Live Concerts, International Film Festival, Huge Christmas and New Year Celebrations etc.
Such society and such events impose stringent challenges to the governing bodies owing to high public expectations on maintaining un-interrupted power supply.
Electricity Department-Goa Page 16

Business Plan for the Control Period FY 2016-17 to FY 2018-19
1.3.7 ED-Goa takes up efficient measures to provide world class services to the consumers and hence utilizes more capital investment on the system, more number of employees for better operation and maintenance facilities and efficient redressal of
consumer complaints.
1.3.8 Electricity Department Goa: The Electricity Department was formed in January 1963 under the Government of Goa, Daman & Diu. It is the only licensee operating in the State of Goa for transmission and distribution of Electricity.
1.3.9 The State of Goa doesn't have its own generation. The majority of the power requirement for the State of Goa is met through its share from Central Sector Power Stations of the National Thermal Power Corporation (NTPC) as allocated by the Central Government.
1.3.10 ED-Goa had executed a PPA of 48MW Gas Based Combined Cycle Power Plant with M/s. Reliance Infrastructure Limited in September 1997. Subsequent to this vide supplementary agreement in September 2000, the share of ED-Goa was reduced by 12/16MW and Reliance IPP was allowed to supply electricity directly to the consumers on its own network to the extent of this surplus capacity of power. The
said PPA with Reliance IPP has expired on 13th August 2014 and all the consumers are now being supplied power and billed by ED-Goa.
1.3.11 ED-Goa also has arrangement of power purchase from three Co-generation Power Plants in the State:
• Goa Energy Private Limited for 14-21 MW
• Goa Sponge and Power Limited for 3 MW
• Sesa Sterlite (Erst while) for minimum 2 MW
1.3.12 ED-Goa came into regulatory regime w.e.f. FY 2011-12 i.e. the first tariff filing year. The details of the tariff petition filing and tariff order issued is summarised in the table below:
Electricity Department-Goa Page 17

Business Plan for the Control Period FY 2016-17 to FY 2018-19
Table 1: Tariff Filing Details
Sr. Particulars FY11-12 FY12-13 FY13-14 FY14-15 FY15-16No
1 Petition Filing date 19.10.2011 31.12.2011 31.1.2013 7.1.2014 14.1.2015
2 Tariff Order date 27.6.2012 31.3.2013 15.4.2014 6.4.2015
3 Average Tariff Increase (%) 11.85% NIL 7.62% 14%
4 Tariffs effective from date 1.6.2012 -- 1.4.2014 1.4.2015
1.3.13 ED-Goa is under the control of State Government and the maintenance of the accounts or Income and expenditure statement is on "cash" basis unlike other utilities/ licensees where it is being maintained on "accrual" basis. However, ED-Goa has also started preparation of financial statements on commercial principles as per directions of Hon'ble Commission and has completed preparing statements of
accounts up to FY 2010-11 till date. It is envisaged that by November 2015, the financial statements for FY 2011-12 and FY 2012-13 will also be made available.
1.4 Business Activities
1.4.1 The Electricity Department is a deemed Distribution Licensee within the meaning of Section 2 (17) of Electricity Act 2003 and pursuant to the Section 14 of the Electricity Act. Further, Section 42 and 43 of the Electricity Act 2003 prescribes the following duties of the deemed Distribution Licensee:
• To develop and maintain an efficient, co-ordinated and economical distribution system;
• To supply electricity on an application of the consumer in accordance with the provisions specified in the Electricity Act 2003;
• To provide non-discriminatory open access to the consumers;
• To establish a forum for redressal of grievances of the consumers.
1.4.2 The Main purpose is to undertake the transmission, distribution and retail supply of electricity in its license area and for this purpose to plan, acquire, establish, construct, erect, lay, operate, run, manage, maintain, enlarge, alter, renovate, modernize, automate, work and use a power system network in all its aspects and also to carry on the business of purchasing, selling, importing, exporting, wheeling,
trading of electrical energy, including formulation of tariff, billing and collection thereof and then to study, investigate, collect information and data, review
Electricity Department-Goa Page 18

Business Plan for the Control Period FY 2016-17 to FY 2018-19
operations, plan, research, design and prepare project reports, diagnose operational difficulties and weaknesses and advise on the remedial measures to improve and modernize existing sub-transmission and supply lines and sub-stations.
1.5 Objective of Business Plan
1.5.1 A business plan is conventionally defined as:
"Business Plan is a form al statement o f a set o f business goals, the reasons why they are believed attainable, and the plan fo r reaching those goals. It may also contain background information about the organization or team attempting to reach those goals."
1.5.2 Accordingly, the business plan for ED-Goa is developed keeping in mind the growth plan for the control period after considering the strengths and weaknesses of the department and evaluating its business environment. The business environment has
evolved considerably in a number of ways that affects ED-Goa's strategic planning.
1.5.3 The business plan is intended to give a comprehensive and up-to-daterepresentation of the department, its market, the impact of new regulations, and thestrategies that has been developed by ED-Goa to achieve the same. However, as
mentioned above, there are number o f internal and external factors which affect the planning o f the department and thus, it makes this a very dynamic document and calls for regular reviews o f the plan with a view to introduce any corrections.
1.5.4 The Joint Electricity Regulatory Commission, hereafter referred to as Hon'ble
Commission, in exercise of the powers conferred by the Electricity Act, 2003, notified the Joint Electricity Regulatory Commission for the State of Goa and UnionTerritories (Multi Year Distribution Tariff) Regulations, 2014 in May, 2014.
1.5.5 Accordingly Electricity Department of Goa had filed Business Plan for the period
starting from April 2015 to March 2018 in January 2015. However the Hon'ble Commission has deferred the control period by one year i.e. from FY 2016-17 to FY 2018-19. ED-Goa therefore, needs to submit a Business Plan for the period starting from April 2016 to March 2019.
1.5.6 Regulation 5.1 of Joint Electricity Regulatory Commission for the State of Goa and Union Territories (Multi Year Distribution Tariff) Regulations, 2014 states that:
Electricity Department-Goa Page 19

Business Plan for the Control Period FY 2016-17 to FY 2018-19
"The Distribution Licensee shall file Business Plan, fo r Control Period o f three financial years from April 1, 2016 to March 31, 2019, which shall comprise but not be limited to detailed category-wise sales and demand projections, power procurement plan,
capital investment plan, financing plan and physical targets".
1.5.7 Further Regulations 5.2 and 5.3 states that:
"5.2 The capital investment plan shall show separately, on-going projects that will spill into the financial year 2015-2016 and new projects (along with justification) that w ill commence and scheduled to be completed within or beyond the tariff period i.e. by or beyond 31.03.2018. The Commission shall consider and approve the capital investment plan fo r which the Distribution Licensee shall provide relevant technical
and commercial details."
"5.3 The Distribution Licensees shall project the power purchase requirement after considering effect o f target set fo r Energy Efficiency (EE) and Demand Side Management (DSM) schemes.
Provided that the power purchase cost o f the respective Distribution Licensee shall be allowed after considering the target set by the Commission fo r Energy Efficiency (EE) and Demand Side Management (DSM) schemes, if any, and any shortfall in meeting the target shall be disallowed by the Commission at marginal cost o f power purchase o f that Distribution Licensee fo r determination o f tariff. "
1.5.8 The Business Plan prepared by ED-Goa does not include the forecast of Aggregate
Revenue Requirement for the control period (three financial years from April 1, 2016 to March 31, 2019) as the same has to be submitted based on the Business Plan as approved by the Hon'ble Commission by order. The relevant extracts, Regulation 4.2 (ii) and 4.2 (iii), of the MYDT regulations are mentioned below:
"4.2 The Multi-Year Tariff fram ework shall be based on the following elements, fo r calculation o f Aggregate Revenue Requirement and expected revenue from tariff and charges fo r Distribution Business:
ii. A detailed Business Plan based on the Operational Norms and trajectories o f performance parameters specified in these Regulations, fo r each year o f the Control
Period, shall be submitted by the applicant fo r the Commission's approval;
Electricity Department-Goa Page 20

Business Plan for the Control Period FY 2016-17 to FY 2018-19
iii. Based on the Business Plan as approved by the Commission by order, the applicant shall submit a petition with the forecast o f Aggregate Revenue Requirement and expected revenue from existing tariff fo r each year o f the Control Period, and the
Commission shall approve the tariff fo r each year o f the Control Period; "
1.6 Approach to Business Plan
1.6.1 ED-Goa has prepared the Business Plan taking cognizance of the existing internal factors and external business environment affecting the business. ED-Goa submits
that the Business Plan being a dynamic document may need to be updated at periodic intervals taking into account the changes in the internal and external environment and these changes would be intimated to the Hon'ble Commission from time to time.
1.6.2 The Hon'ble Commission has issued directives via letter with Ref No. 50/43/2013-
JERC/1607, dated: 6th July, 2015 stating the requirements that should be incorporated in the Business plan.
Requirements by Hon'ble Commission Compliance by ED-Goa
Detailed category wise sales Chapter 6.4
Power Procurement Plan Chapter 7.11
Proposed measures for compliance of RPO Chapter 4.5 & 4.6
Proposed trajectory of T&D losses Chapter 6.8
Proposed tra jectory of availability of Wheeling
business and Supply business
Chapter 5.4
Capital expenditure plan Chapter 8
Details of schemes of Energy Efficiency and Demand
Side Management
Chapter 2.7.4 and 8.5.3
Expenses related to Safety of Man Power Chapter 9.4.4
Expenses related to CGRF Chapter 9.4.5
Proposed expenses for projects related to Smart Grid and Smart Meters
Chapter 8.5.1
1.6.3 In line with clause 5 of the MYT Regulations 2014, the Business Plan comprises of the category-wise sales and demand projections, power procurement plan, capital investment plan, financing plan, O&M Norms and targets of distribution loss for the
Electricity Department-Goa Page 21

Business Plan for the Control Period FY 2016-17 to FY 2018-19
control period starting from FY 2016-17 for a period of three years up to FY 2018-19. The significant key elements of a Business Plan are as follows:
> SWOT Analysis.
> Market Issues & Challenges
> Past Performance Analysis
> Sales Forecast
> Power Procurement Plan
> O&M Norms.
> Capital Investment Plan
> Allocation Statement for Wires & Supply business.
1.6.4 The projections for data on consumer profile like Sales, Consumer count and connected load are based on the CAGR observed in provisional figures from FY 200910 to FY 2014-15 and considered as base figures for the purpose of projection in
control period.
1.6.5 Therefore, the basic principles considered while preparing the Business Plan is keeping in mind the requisites to address the initiatives to enhance the power sector viz network development, efficient operation, reliability, predictability and customer
service.
Electricity Department-Goa Page 22

Business Plan for the Control Period FY 2016-17 to FY 2018-19
CHAPTER 2 POWER BUSINESS IN GOA
2.1 Consumer Profile
2.1.1 The Electricity Department of Goa caters to around 5.75 Lakh consumers with an annual energy consumption of approx 3092 MUs. The Consumers of the Electricity Department of Goa are classified as under:
• Domestic (25% of consumption)
• Commercial (16% of consumption)
• Industrial (47% of consumption)
• Agriculture (1% of consumption)
• Public Water Works (8% of consumption)
• Public Lighting (1% of consumption)
2.1.2 As seen from the above classification, the energy consumption of industrial consumers is the highest (47%) amongst all categories followed by domestic and
commercial categories.
Figure 6: Actual Category-wise Consumption for 2014-15
Consumption
■ Domestic
■ Commercial
■ Industrial
■ Agriculture
■ Public Water works
■ Public Lightng
■ Others
2.1.3 The present unrestricted demand for the State of Goa is about 525-552 M W which is being met by power from various Central Sector Power Stations and co-generating stations within state and short term power procurement from the market.
Electricity Department-Goa Page 23

Business Plan for the Control Period FY 2016-17 to FY 2018-19
2.2 Power Purchase Portfolio
2.2.1 The Electricity Department of Goa does not have its own generation. The majority of the power requirement for the State of Goa is met through its share from Central
Generating Stations of the National Thermal Power Corporation (NTPC) and Nuclear Power Corporation of India Limited (NPCIL) as allocated by the Central Government. The total firm allocation of power from central sector is approx 512.59 M W excluding share of RGPPL. The peak demand met in FY 2015-16 is 552 M W (as on August 31st, 2015) which was recorded on 27th April 2015. In order to meet the surge
in demand, the Department also purchases power from Co-generation, Exchange and Traders.
Table 2: Share Allocation from Central Generating Stations (As per power flow)
Name of Plant Capacity(MW)
Peak (MW) Othan than Peak (MW)
Average Capacity
(in MW) *
% Allocation* *
Central Generatinq Stations
Korba STPS 2,100 212.72 214.36 214.09 10.19%Korba STPS Unit 7 500 5.79 6.56 6.43 1.29%Vindhyachal STPS-1 1,260 37.43 38.90 38.66 3.07%Vindhyachal STPS - II 1,000 13.84 14.94 14.76 1.48%Vindhyachal STPS - III 1,000 11.84 12.94 12.76 1.28%Vindhyachal STPS- IV 1,000 13.78 15.33 15.07 1.51%Sipat STPS Stage-11 1,000 11.75 12.80 12.63 1.26%Sipat STPS Stage-1 1,980 25.10 28.17 27.66 1.40%Kakrapar APS 440 15.67 16.08 16.01 3.64%Tarapur unit 3 &4 1,080 13.27 14.64 14.41 1.33%Mouda STPS 1,000 13.78 15.33 15.07 1.51%Ratnagiri GPS*** 1,967 - - - 0.00%Kawas GPS 656 12.39 12.39 12.39 1.89%GaandharGPS 657 12.65 12.66 12.66 1.93%Ramagundam STPS 2,100 100.00 100.00 100.00 4.76%
500.01 515.10 512.59
Source: WRPC Allocation letter dated 24th August 2015
2.3 Measures to Increase Power Availability
2.3.1 The allocation of power is as decided by Ministry of Power (MoP);
Electricity Department-Goa Page 24

Business Plan for the Control Period FY 2016-17 to FY 2018-19
2.3.2 The Electricity Department - Goa is also planning to call for tenders under competitive bidding in order to increase the power availability in the State as per the increasing demand.
2.3.3 As regards to the fulfilment of Solar RPO for the period from FY 2010-11 to FY 201415, a PPA has been signed by the Government with M/s NVVNL, New Delhi on 22-82014 for supply of solar power of 6 M W i.e. 10 MUs, for a period of 5 years @ Rs 7.99 per unit exclusive of transmission charges. The supply has commenced from 28
08-2014.
2.3.4 Further M/s Solar Energy Corporation of India had allocated 10 M W of Solar power to the State and also submitted Power Sale Agreement (PSA). However, the said allocation was enhanced by 15MW and hence SECI will be now supplying solar power of 25 M W @ Rs 5.50 per unit (The rate as recommended by the Hon'ble
Commission) exclusive of transmission charges for a period of 25 years. The commencement of power supply is yet to be started; the delay in the commencement is because of Open Access issues. It is anticipated that Power supply will commence from November 1st, 2015. As per this PSA ED Goa is expected to receive around 41 MUs annually. The overall supply from solar power will be around
51.06MUs
2.3.5 In case the above tied up power is not enough to meet the solar obligation, ED Goa may have to purchase RECs in this control period to ensure that there is no obligation carry forward in the next control period.
2.3.6 In order to meet the targets set by MNRE of 100GW solar by 2022, there is much emphasis given on roof top solar. The Hon'ble Commission has already issued Solar Regulations 2015 in order to promote rooftop solar. In this regard, 7 interested private solar power developers had sent proposals, out of which only 2 had quoted
the price of Rs. 8.51 per kWh. ED-Goa anticipates that the price is too high and therefore is in the process of studying the proposals. ED-Goa expects that in the near future an action plan will be formulated to actively carryout solar rooftop activity. Also the policy is being framed by GEDA for the approval of Govt.
2.3.7 ED-Goa has issued an LOI to M/s NVVNL at Rs. 4.49 per kWh (At Goa Periphery) to
purchase 10MW small Hydro power for the fulfilment of non-solar RPO, from the
Electricity Department-Goa Page 25

Business Plan for the Control Period FY 2016-17 to FY 2018-19
Eastern Region. Depending on this fulfilment of Non Solar RPO, ED Goa will buy REC in Q3 and Q4 of 2015-16.
2.3.8 For meeting the peak hour power requirement, power is obtained to some extent
from the grid under Deviation & Settlement Mechanism depending upon permissible grid frequency and also from traders, open market, exchanges etc.
2.3.9 The power allocation made by the Ministry of Power for some of the upcoming power plants of central generating companies is as under:
Table 3: Future Power Allocation from MOP
Sr. No Power Projects Share of ED Goa Likely COD(M W )
1. Subansiri (Lower) 8 MW Dec 2018
2. Kameng 2 MW Apr 2016
3. Kakrapar Atomic Power Project 16 MW Nov 2015
(Unit 3 & 4)
4. Vindhyachal V 5.18 MW October 2015
Source: CEA / NTPC/ NPCIL websites
2.3.10 In addition to the above power allocation, the State of Goa has executed PPAs with
the following Central sector Power Projects:
Table 4: PPA Executed with Central Sector Power Projects
1 Lara STPP - I & II 4000 MW Jun / Oct 2016 23 MW
2 Solapur TPP 1320MW May / Nov 2016 21 MW
3 Khargone STPP 1320 MW Jun / Oct 2019 9 MW
4 Gadarwara STPP 2640 MW May / Sept 2017 17 MW
5 Dhuvaran STPP 1980 MW -— 14 MW
6 Mauda Stage II 1320 MW Mar / Nov 2016 15 MW
Source: Tentative allocation is as per the Letter issued by NTPC as per the request of ED-Goa
Electricity Department-Goa Page 26
Business Plan for the Control Period FY 2016-17 to FY 2018-19
2.4 Distribution Infrastructure
2.4.1 There are no direct link lines between the generating station of central sector andGoa and hence this power is wheeled through the Grids of the neighbouring State of
Maharashtra and Karnataka. Electricity Department pays wheeling charges toMSETCL & KPTCL for using their line network. The nearest Central TransmissionUtility (CTU) point to ED-Goa is Colvale Powergrid substation.
2.4.2 The power from the Western region is wheeled from the MSETCL's 400 kV SubStation at Kolhapur to the 400 kV Sub-Station at Colvale in Goa. The power from
these lines is transmitted at 220 kV level to Ponda and Tivim substations of the Department. Similarly the Southern region power is transmitted from Nagjhari to Ponda. The Karnataka lines of Ambevadi-Ponda link is whenever at fault and till the restoration takes place, power is diverted and re-routed through WR. This adds to 4% losses and excess wheeling charges to WR. Also the changeover takes place in 1-2 hrs with 15 minutes time blocks.
2.4.3 The Department has already taken up the work of linking 33 kV S/S through 33Kvunderground cabling from various main EHV substation to distribution network. The coastal belt of Candolim is covered by underground system and parts of Panaji & Margao town. The Department has adopted overhead line system for transmission
and distribution except for these areas which are covered by underground system.The remaining parts of Panaji and Margao town are now being provided withunderground network.
2.4.4 All the towns and villages of Goa are electrified and any intending consumer can
avail power supply by submitting requisition in the prescribed form to the appropriate office of the Department subject to fulfilling the required conditions and payment of charges as per conditions of supply of Electrical Energy and miscellaneous charges. However, the current infra capacity is not growing in proportion to consumer growth and therefore there is a need for augmentation and
new infrastructure to be installed to cater to new consumers.
2.4.5 The power supply to the consumers shall be released as per the Conditions of Supply framed by ED-Goa which is based on the JERC Electricity Supply Code Regulations 2010.
Electricity Department-Goa Page 27

Business Plan for the Control Period FY 2016-17 to FY 2018-19
2.4.6 The Existing EHV Infrastructure is represented in the diagrammatic format as below:
Figure 7: Existing EHV Infrastructure
EXISTING EHV INFRASTRUCTURE :
2.4.7 The network configuration as on 31s March, 2015 is as given below:
Table 5: Network Configuration (as on 31st March 2015)
S.No. Particulars of Network Numbers
1 No. of 220kV Feeders 14
2 No. of 110kV Feeders 13
3 No. of 33KV S/s 48
4 No. of 33KV Feeders 106
5 No. of 11KV Feeders 287
6 No. of Distribution Transformers 5345
2.4.8 The Transmission and Distribution Losses and the AT&C Losses are comparatively lower than those in many of the other states and Union Territories. The Transmission
& Distribution loss of the system is estimated to be around 15.15% for FY 2014-15.
Electricity Department-Goa Page 28

Business Plan for the Control Period FY 2016-17 to FY 2018-19
2.4.9 The Government of Goa has initiated a lot of schemes to improve the power scenario (The details of the schemes are incorporated in further chapters). The objectives of the schemes are to achieve sustainable development by ensuring
quality and reliable power supply to all consumers at affordable cost and to make the electricity department commercially viable.
2.4.10 The power utilities all over the country have taken up institutional strengthening through sustainable initiatives in a systematic and focused approach. Goa is also
planning to bifurcate the electricity department into two entities i.e. transmission and distribution so as to improve the efficiency and accountability of both the wings.
2.5 SWOT Analysis
2.5.1 The analysis of the strength, weakness, opportunities and threats as perceived by ED-GOA is summarized in the following figure:
Figure 8: SWOT Analysis of ED-GOA
STRENGTHS
Uninterrupted Power supply
High Industrial base
Competitive tariffs and Robust Tariff structure
Relatively Lower Losses
Quality Power Supply
OPPORTUNITIES
Corporatization of the Department
Improvement in system of Meter Reading, Billing and Collection
Establishment of SLDC
Promotion of Renewable sources for energy security through robust RE Policy
Implementation of new technologies in front of metering (AMR, smart meters), distribution.
Implementation of MIS software /system for consumers, assets and infrastructure for efficient management of the Department
WEAKNESS
• Complete dependence on external sources
• Absence of proper SLDC
• Poor MIS database
• Absence of timely availability of audited account
• Irregular (manual) Meter reading, Billing and Collection for LT consumers
• Ageing Distribution Infra and poor maintenance of Asset Mapping
THREATS
• Past revenue gap may lead to tariff increase during subsequent truing-up process
• Increasing Power Purchase Cost may lead to tariff increase (due to coal shortages)
• Additional Requirement of Peaking Power
• Installation of Roof-top solar generation
Electricity Department-Goa Page 29

Business Plan for the Control Period FY 2016-17 to FY 2018-19
2.5.2 STRENGTHS:
• Uninterrupted Power Supply: ED-Goa for long has been able to supplyuninterrupted power to its consumers thereby not letting its consumers subjectto regular load shedding. ED-Goa also has the capability to continue the same in the future.
• High Industrial base: ED-Goa has a high industrial base in terms of hotels, ice manufacturing and steel industries. High Industrial consumer base results in more revenue and less system losses.
• Competitive Tariff and Robust Tariff Structure: ED-Goa has lower tariffs as
compared to the other state utilities in the neighbouring States and the tariffstructure is the one of the simplest and robust when compared to other utilities in the Country.
• Relatively Lower Losses: ED-Goa has been very proficient in reducing the
Distribution Losses over the last few years.
• Quality Power Supply: ED-Goa has been providing quality and reliable power supply to its consumers.
2.5.3 WEAKNESSES:
• Complete Dependence on External Sources for Power: ED-Goa has to entirely rely on power from external sources like CGS. Temporary shutdown or outage of any power plant leads to power cuts or purchase of power form open market/ exchange.
• Absence of Proper SLDC: Due to the lack of SLDC, proper monitoring of grid operation becomes difficult. Optimum scheduling and despatch of electricity within the State in accordance with the contracts entered into with the licensees and considering real time data (15 or 30 minutes time block) becomes a problem.
• Poor MIS database: ED Goa lacks on a proper MIS database. The information regarding the department's network, consumers and the upcoming capex schemes need to be maintained properly and be readily available which is presently being maintained manually.
• Absence of tim ely availability of audited accounts: ED Goa has been maintaining accounts on cash basis and has recently started maintaining it on commercial principles ss desired by Hon'ble Commission from FY 2007-08 onwards. The financial statements up to FY 2010-11 are available and that of FY 2011-12 and 2012-13 would be available by end of November 2015.
Electricity Department-Goa Page 30

Business Plan for the Control Period FY 2016-17 to FY 2018-19
• Irregular (manual) M eter reading, Billing and Collection for LT consumers: TheLT meter reading and Billing is being done on periodic basis (not monthly) and the records are maintained on manual basis. ED-Goa expects that with implementation of APDRP Part-A, the accounting / data maintaining portion would get resolved. The Demand, Collection and balance statements which are
pending from FY 2011-12 onwards are being compiled.
• Ageing Distribution Infra and poor maintenance of Asset Mapping:
The assets of ED-Goa are old and proper maintenance is required on timely basis to ensure quality and reliable power supply. Asset Mapping is crucial activity which will help in identifying the life of assets and having a proper schedule for maintenance of the same.
2.5.4 OPPORTUNITIES:
• Corporatisation of the Department: ED-Goa which is predominantly a transmission and distribution utility in Goa is currently a government department/ body and has the opportunity to transform itself into a self-
sustaining and profit making corporate body, and to improve the level of consumer satisfaction by having segregated entities for each of the functions.
• Improvement in system of M eter Reading, Billing and Collection: ED-Goa has taken steps towards improving LT billing and has outsourced certain activities for majority of its division offices.
• Establishment of SLDC: As the part of APDRP schemes, the establishment of SLDC is under process and it will be ready by December 31st, 2015, which will help in proper scheduling and dispatching of electricity.
• Promotion of Renewable sources of energy through RE policy: Renewable
Energy Policy for the state of Goa is still to be prepared and is in the process of approval. To promote solar and non-solar energy sources in the state of Goa and to fulfil the RPO obligations, there is a need for promotion of renewable sources in the state.
• Implementation of new technologies in front of metering (AM R, smart meters), distribution. ED-GOA, as part of RAPDRP Part A will set up implementation of new energy meters and preferably AMR meters for HT and high value LT consumers. Under RAPDRP Part B, ED Goa has the opportunity to set up distribution infrastructure and to increase the pace and scale of distribution
system strengthening efforts.
Electricity Department-Goa Page 31

Business Plan for the Control Period FY 2016-17 to FY 2018-19
• Implementation of MIS software /system for consumers, assets and infrastructure: ED-Goa has the opportunity to set up MIS software/ system for proper maintenance of data of consumers and distribution infrastructure. Proper Energy Auditing of the system from time to time.
2.5.5 THREATS:
• Past revenue gap may lead to tariff increase after truing-up process- ED Goafeels that once the audited accounts are available and the true-up for FY 201112, FY 2012-13 and FY 2013-14 are filed before the Hon'ble Commission, the
revenue gap may lead to increase in the tariff. An increase in renewable purchase obligation as per targets set by MNRE may also increase the pooled cost of purchase and thereby tariff.
• Increase Power Purchase Cost may lead to tariff increase (coal shortage) - ED-Goa relies on external source of power and the cost of generation has been
increasing (primarily due to domestic fuel supply concerns and use of imported coal) which may lead to increase in tariffs for consumers. Further, the capital cost of new power plants has gone up substantially resulting in higher power tariff from new generating units both under central sector as well as private power generating companies.
• Additional requirement of Peaking Power - Being a tourist destination, ED-Goafaces a lot of peak demand during holidays and during tourism season, apartfrom the seasonal increase in demand. The PPA with Reliance (IPP) to provide the peaking power has expired on 13th August 2014 and there is an urgent
requirement of a source of peaking power. W ithout any considerable PPA, the department will have to resort to open market sources/ exchanges at higher market prices.
• Installation of Roof Top Solar Generation - Power generation on net meteringconcept for roof top solar may reduce consumption from higher category slabs of
consumers and in absence of cross-subsidy charges on them, it could adversely affect finances of GED.
2.5.6 The growth path for ED-Goa would be the key takeaways which have emerged from the SWOT analysis. While, there would be opportunities galore on the horizon, it would be only prudent on part of ED-Goa to first target the short-comings and overcome them. Simultaneously, it would also be necessary to start identifying areas which it intends to target in the short to medium term and which areas it intends to
target in the long term.
Electricity Department-Goa Page 32

Business Plan for the Control Period FY 2016-17 to FY 2018-19
2.6 Human Resource Management
2.6.1 Man Power Planning: The biggest asset of any organization is its work force. Their optimum performance can elevate its progress. At the same time, it is also true that
the career growth of its employees is directly related to the growth of the organization. The responsibility towards maintenance of un-interrupted power supply and the accountability towards discharge of the duties as a service provider have to be shared by the engineers and employees of the ED-Goa.
2.6.2 Considering the fact that Goa is one of the tourism capitals of India and approximately 5 lakh foreign tourists and 20 lakh domestic tourists visit Goa annually, the basic facilities have to be on world class level especially power availability.
2.6.3 ED-Goa takes up efficient measures to provide world class services to the consumers
and hence utilizes more number of employees especially the contractual employees to keep track of the operation and maintenance facilities and efficient redressal of consumer complaints.
2.6.4 Post entry into regulatory regime by Electricity Department-Goa, the activities/ tasks
have increased which has necessitated creation of separate department/ addition in manpower strength. The activities/ tasks which have become routine and needs dedicated resources for successful compliances are:
a) Compliance to Standards of Performance
b) Compliance to Supply Code
c) Implementation of MYT Regulations and responding to JERC draft regulations
d) ED-Goa's expansion of Retail Business
e) Increasing number of Regulatory, Legal and Consumer Court Cases
f) Compliance to various other Directives of JERC
g) Counterpart team for R-APDRP Part - A
2.6.5 The implementation of R-APDRP Part-A, Implementation of IT, Automation including AMR, SCADA, Call centres, Automation of Collection Activities, Procurement- E-
procurement, HR, MIS etc will help the department to optimally utilize its employee resources, especially the ones at the site level i.e. contractual staff, meter readers, lineman, data entry operators etc.
Electricity Department-Goa Page 33

Business Plan for the Control Period FY 2016-17 to FY 2018-19
2.6.6 The Electricity Department has a work force of 6,583 employees as on March 31st,2015 (including those on contract basis) of different ranks who perform multifaceted technical duties, viz., maintaining power supply, metering, billing, revenue
collections, customer services etc.
2.6.7 ED-Goa has opted for using contractual manpower, keeping a lot of existing posts vacant. ED-Goa has planned to reduce the contractual manpower in a phased manner starting from FY 2014-15 and fill the vacant posts for efficient working and
output from the employees. Also, automation of the system would reduce need for manpower.
2.6.8 Organisational Structure: The hierarchy of the organization is with Head Office at the top of the vertical and goes down from Circles to Divisions and Subdivisions. Consumer services and network management are the core function of the Company
for which reporting is from sub-division office to divisions and divisions to circles. In addition to this the department has centralized reporting structures for Civil, Stores, Training, etc. which directly report to the Head office level.
2.6.9 The present structure prevailing in the department of electricity is as follows:
• Total no. of Circles: 2
• Total no. of Divisions: 18
• Total no. of Sub-Divisions: 49
• No. of Divisions in Circle 1- 8 namely division IV,VII,VII,XI,XII,XIV,XVI
• No. of Divisions in Circle 2- 8 namely division I,III,V,VI,X,XIII,XVII
Electricity Department-Goa Page 34

Business Plan for the Control Period FY 2016-17 to FY 2018-19
Figure 9: Existing Structure of ED-Goa
ED-Goa
v.--------------
2.6.10 On the basis of the above discussed Organizational structure, the post wise hierarchy also exists in the department with Chief Electrical Engineer as the head of the department and Superintending Engineer, Executive Engineer, Assistant Engineer
and Junior Engineer reporting to each other respectively as per the organizational structure.
Figure 10: Existing Hierarchical Posts in ED-Goa
Electricity Department-Goa Page 35

Business Plan for the Control Period FY 2016-17 to FY 2018-19
2.6.11 At the site/field level, the departments are divided according to the areas and number of consumers into Circles, divisions and sub-divisions with employees working at offices and field i.e. sub-stations and operation and maintenance of T&D
system.
2.6.12 The organization structure is divided into head office and circle offices which includes staff at division and sub-division level i.e. the field level.
2.6.13 At Circle office level, the organization structure is as follows:
• Circle I (South Goa): The chart below provides the actual existing organization
structure at Circle 1 in South Goa.
Figure 11: Structure of Circle I
• Circle II (North Goa): The chart below provides the actual existing organization structure at Circle II in North Goa.
Electricity Department-Goa Page 36
Business Plan for the Control Period FY 2016-17 to FY 2018-19
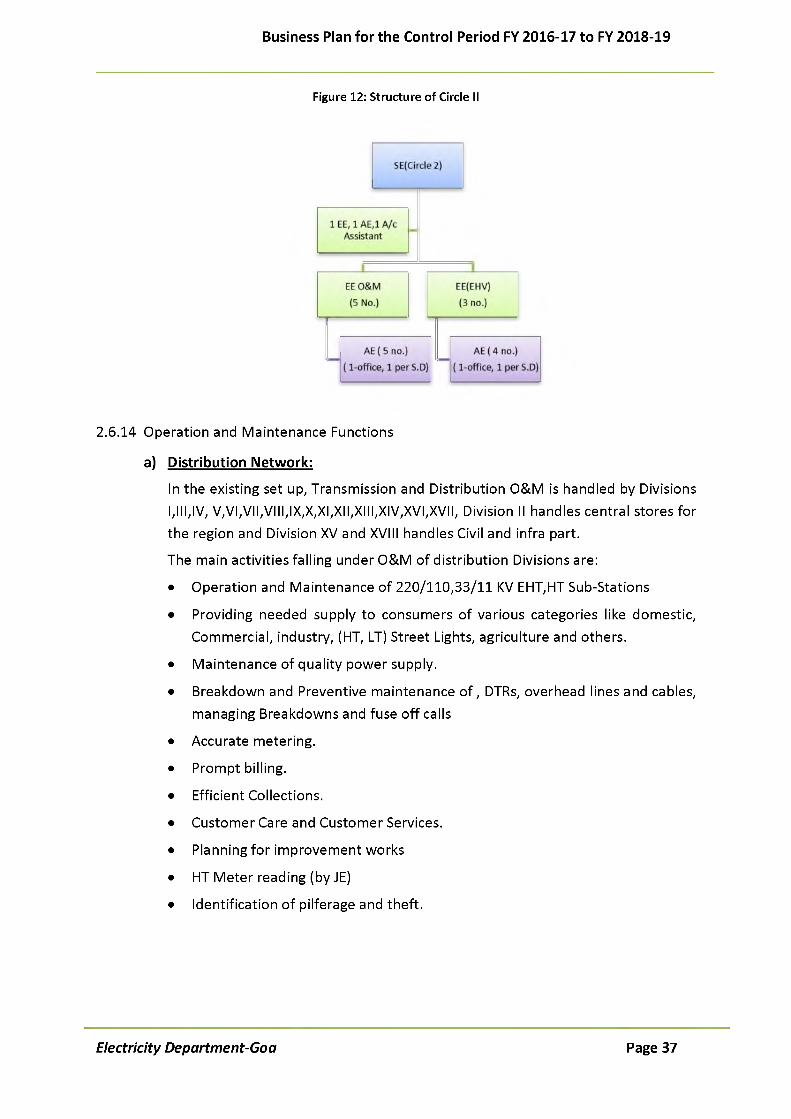
Figure 12: Structure of Circle II
2.6.14 Operation and Maintenance Functions
a) Distribution Network:
In the existing set up, Transmission and Distribution O&M is handled by Divisions I,III,IV, V,VI,VII,VIII,IX,X,XI,XII,XIII,XIV,XVI,XVII, Division II handles central stores for the region and Division XV and XVIII handles Civil and infra part.
The main activities falling under O&M of distribution Divisions are:
• Operation and Maintenance of 220/110,33/11 KV EHT,HT Sub-Stations
• Providing needed supply to consumers of various categories like domestic,Commercial, industry, (HT, LT) Street Lights, agriculture and others.
• Maintenance of quality power supply.
• Breakdown and Preventive maintenance of , DTRs, overhead lines and cables,managing Breakdowns and fuse off calls
• Accurate metering.
• Prompt billing.
• Efficient Collections.
• Customer Care and Customer Services.
• Planning for improvement works
• HT Meter reading (by JE)
• Identification of pilferage and theft.
Electricity Department-Goa Page 37

Business Plan for the Control Period FY 2016-17 to FY 2018-19
2.6.15 Other Functions
a) There are 4 Superintending Engineers (S.E.) in Department of Electricity -Goa.
a. S.E for Circle I(South)
b. S.E. for Circle II(North)
c. S.E. for Planning
d. S.E. for EHV & Commercial
Each S.E. is the head of the above department and reports to CEE. The Superintending Engineer looks after the proper functioning of the circle which includes technical and commercial works, billing, collection and revenue generation, Loss reduction, operation and maintenance, future planning of network and new
projects according to load/consumer growth etc.
b) Scope of work of Executive Engineers:
Each Executive Engineer is the head of the division which correspond to the S.E and some report directly to CEE for different sections such as Operation and
Maintenance (O&M), Civil, EHV and commercial, stores, procurement, interstate power matters, training, vigilance etc. The works of Executive Engineers at circle level comprises mainly of technical profile, i.e. O&M, Civil, EHV, loss reduction, Load projections, DSM measures and abiding by the Standards of Performance of the Hon'ble Commission.
c) W ork responsibility of a Circle
Circle is responsible for 7-8 divisions. The main functions of Circle include review
performance of Subdivisions & sections, review of capital works & various schemes, energy accounting, billing & revenue monitoring, MIS, establishment activities etc. The main functional departments at Division office are Technical, Accounts/Revenue. Circle offices are equipped with computerized infrastructure. The circle is headed by the Superintending Engineer.
d) W ork responsibility of Division
Division is defined as unit comprising of approx 3-5 sub-divisions. The activities
division includes monitoring & co-coordinating between various sub-divisions, Meter reading, Bill printing, Cash collection, and handling commercial complaints. A Subdivision comprises of mainly Technical, Accounts/Revenue, and
general administration departments. Each division is headed by an Executive Engineer and Assistant Engineer and the office staffs helps in operation.
Electricity Department-Goa Page 38

Business Plan for the Control Period FY 2016-17 to FY 2018-19
e) W ork responsibility of Sub-Division
The sub-division is the unit at the bottom of hierarchy and has direct interface
with the consumers. The section is responsible for most of the consumer related activities be it technical (O&M) or commercial. O&M activities of section includes breakdown maintenance of HT & LT line & equipments, attending fuse call, operation & maintenance of Substation, and street light complaints. Commercial activities include recovery, bill distribution, and collection, need based meter
reading, handling billing complaints, release of new connection, meter replacement, and theft detection. In addition to these, activities related to system augmentation are also carried out by sub-division. Junior Engineers, lineman, and other field staff operate at the sub-division level.
2.6.16 Staffing
a) Tech & Non-tech structuring and staffing
Currently the total employee strength of the department is 6,583 including contractual employees. Outsourced/contractual staff is generally at the subdivision level for menial jobs such as linemen helper, sweeper, security guard, watchman for stores and for cleaning of Project Assets/Furniture, cleaning of
structures and horticulture maintenance. Apart from the site work, some contractual positions are at division or sub-division office jobs such as lower division clerks or data entry operators which are required in huge numbers in proportion to the number of consumers.
b) Transferability
All technical employees are transferable to any of the circles and within divisions and sub divisions offices.
2.6.17 Training: There is a need to ascertain the training of the existing human resource and to identify their core competencies with an aim to enhance their skills and finally place them in appropriate job positions. ED-Goa endeavours to conduct training at periodic intervals for capacity building of its manpower.
2.7 Initiatives to Improve the System
2.7.1 RAPDRP Part A & Part B/IPDS
The Government of India, Ministry of Power (MoP) and Power Finance Corporation
(PFC) have taken the process of implementing RAPDRP Part A and Part B for improvement of distribution system and to deliver best possible service to
Electricity Department-Goa Page 39

Business Plan for the Control Period FY 2016-17 to FY 2018-19
consumers.
2.7.2 ED-Goa has got a loan of Rs 31.47 Crores from PFC for implementing PART A for 4 identified towns of Panaji, Madgaon, Marmagaon and Mapusa. The department has
appointed the ITIA and the work related to GIS mapping, consumer indexing, energy audit under RAPDRP part A is expected to be completed by March 2016.
2.7.3 ED-Goa has started DPR preparation work for RAPDRP Part B/IPDS so as to strengthen the distribution network and improve the quality to supply which will
help both the consumer and the ED-Goa.
2.7.4 Demand Side Management: Ministry of Power and Bureau of Energy Efficiency (BEE) have been promoting energy efficiency. Efficient lighting in households, which accounts for 20% of energy, is an important thrust area to reduce peak demand as well as enhance awareness about energy efficiency and conservation to household
consumers. BEE and EESL have signed MoU with ED-Goa for DSM works and EESL entrusted TERI to undertake a detailed load research analysis for the state of Goa to understand the load pattern of various consumer categories (across days/weeks/seasons) and identify peak-coincidence, to estimate potential of energy and demand savings across categories and to identify indicative load reduction
measures.
2.7.5 ED-Goa had also undertaken a pilot project for street lighting under BEE. ED-Goa is also now conducting DSM study under demand side management programme in Goa along with Energy Efficiency Services Limited (EESL). As per the JERC (DSM
Regulations) 2014 of the Hon'ble Commission, a DSM cell has been constituted. As of now, EESL has worked on feasibility and potential assessments and reported that around 35MUs can be saved by replacing the traditional street lights to LEDs
Description Units TotalStreetlight inventory Nos. 1,66,614Existing scenarioConnected load MW 14. 54Energy consumption MU 58.33Post LED retrofitsConnected load MW 6.04Energy consumption MU 23.05SavingsConnected load MW 8. 5
rEnergy MU 35.28
Electricity Department-Goa Page 40

Business Plan for the Control Period FY 2016-17 to FY 2018-19
2.7.6 Promotion of Renewable Power: To promote the use of renewable power in Goa, aRE Policy is in drafting stage. ED-Goa plans on purchasing the energy generated from the various solar PV projects envisaged to be setup under various Government/
private/ NGO sectors. ED-Goa also received 7 proposals from interested private solar Developers as per the Solar Regulations 2015 issued by JERC. The proposals are under scrutiny by the department.
2.8 W ay Forward for ED-GOA
2.8.1 ED-Goa has been successfully supplying power to its consumers throughout theyears, but there is much more that needs and can be done to provide reliable and quality power to the people. To achieve this, ED-Goa has to prioritise the following
activities:
• Improve Meter reading, Billing and Collection;
• Incorporate centralized MIS system and improve information flow from subdivisions to head office.
• Use of technological advance and computerization for improving the
efficiency, accountability, information levels & consumer satisfaction.
• Introduce AMR metering for all revenue intensive consumers.
• Install Meters till Distribution Feeder level to enable complete Energy Audit;
• Estimation of correct Technical and Commercial loss based on Energy Audit
Report.
• Establishment of Proper SLDC
• Power Purchase Strategy in place for optimum day ahead scheduling
• Strengthening of transmission system for getting uninterrupted power supply from Central Generating Station
Electricity Department-Goa Page 41

Business Plan for the Control Period FY 2016-17 to FY 2018-19
CHAPTER 3. PAST PERFORMANCE ANALYSIS
3.1 Preamble
3.1.1 This section provides ED-GOA's overview of power business into operational and financial performance for the past years. A comparative analysis of the operational performance for various years in relation to sales, distribution Loss, collection
efficiency, power purchase cost etc are discussed herewith.
3.2 Data Sourcing
3.2.1 ED-Goa submits that the meter reading, billing and collection process is being streamlined and is going through a transformation phase. In the past it was maintained by several different agencies separately in each division. Each agency had its separate logic build up for bill calculation and bill generation. However now a common agency has taken over all the billing and collection data for LT consumers
(from Jan 1st 2015) and a common process will be followed for all the division to avoid ambiguity in the process and data. While this streamlining and transformation is in process some errors in the legacy data has been discovered and the error rectification process is going on.
3.2.2 It is also submitted that the audited accounts of ED-Goa are available till FY 2010-11
and the audited accounts from FY 2011-12 onwards are in process and hence the data considered in the business plan related to Sales, No of Consumers, Connected Load, Gross Fixed Assets, O&M Expenses, T&D Loss etc may get revised subsequently after the finalisation of respective financial statements.
3.2.3 Due to data discrepancies and lack of proper energy audit in place, the transmission and distribution loss and corresponding Aggregate Technical & Commercial (AT&C) loss may also change during accounts finalisation and / energy audit exercise.
3.2.4 In absence of the same, ED-Goa has considered the provisional data submitted
earlier to this Hon'ble Commission during various tariff filing petitions.
3.3 Sales
3.3.1 The factors affecting the actual consumption of electrical energy are numerous and often beyond the control of the licensees and consumers (like policy, economy,
individual consumer's consumption, recession, weather, consumer mix, etc.)
Electricity Department-Goa Page 42

Business Plan for the Control Period FY 2016-17 to FY 2018-19
3.3.2 The following table shows the total sales from FY 2009-10 to FY 2014-15 as per provisional actual.
Table 6: Category wise Sales (MUs) for last six years
Consumer Category FY 2009-10 FY 2010-11 FY 2011-12 FY 2012-13 FY 2013-14 FY 2014-15LT-Domestic 662.28 702.41 701.51 844.56 804.36 778.75LT Industrial 76.67 88.02 98.00 88.21 116.24 113.04LT- Commercial 281.70 304.66 305.00 266.81 287.13 267.73LT Agriculture 10.77 12.27 10.00 18.47 20.51 23.86LT- Public Lightings 31.33 32.74 31.00 16.21 28.85 36.95LT- Public Water Works 1.67 1.76 2.00 2.36 6.55 5.04HT Industrial 1,209.32 1,306.03 1,278.70 1,343.79 1,413.74 1,456.18HT-Mixed 104.19 110.44 145.11 211.40 113.42 217.13HT-Agriculture 4.79 5.46 4.00 7.73 5.88 6.08HT-Public Water Supply 113.94 120.08 117.00 112.88 139.83 138.45HT-Defence 27.13 28.76 40.00 34.89 25.95 26.89LT-Temporary 13.00 15.00 14.00 14.12 14.78 22.08Total Sales 2,536.79 2,727.63 2,74632 2,961.43 2,977.23 3,092.18
Figure 13: Category-wise sales (MUs) - Year-wise
Category Wise Sales (MUs) Year wise
3200
2400
1600
800
I I I I I
0FY 2009
10
LT -Tem p ora ry
LT A gricu ltu re
H T-Agricu ltu re
LT-Com m ercia l
FY 2010- FY 2011- FY 201211 12 13
■ LT- Public W a te r W orks
■ HT-Defence
- LT Industrial
■ H T-M ixed
F Y 2013- F Y 2014- 14 15
— LT -Pu b lic Lightings
■ HT-Public W a te r Supply
■ HT Industrial
■ LT-Dom estic
Electricity Department-Goa Page 43

Business Plan for the Control Period FY 2016-17 to FY 2018-19
3.3.3
3.3.4
The overall CAGR of sales witnessed by ED-Goa in last 5 years is around 4.0%. The sales for LT-Domestic category have shown a growth rate of around 5.0% and HT- Industrial at around 4.0%. However all the other categories have shown a nominal
growth rate over the last 5 years.
Figure 14: Category-wise sales (%) - Year-wise
Category Wise Sales (%) Year wise
100%
80%
60%
40%
20%
0%FY 2009- FY 2010- FY 2011- FY 2012- FY 2013- FY 2014
10 11 12 13 14 15
■ LT-Dom estic ■ LT- Com m ercial ■ LT Industrial ■ HT Industrial ■ Others
Sales Mix: As seen from the above figure HT Industrial consumption although varying but remains the highest (47% in FY15) consuming category followed by Domestic category at 27%. The HT Industrial and LT Industrial contribute for more than 51% of the total consumption. The sales mix of ED-Goa has been trending in similar fashion
since the last 5 years.
Electricity Department-Goa Page 44
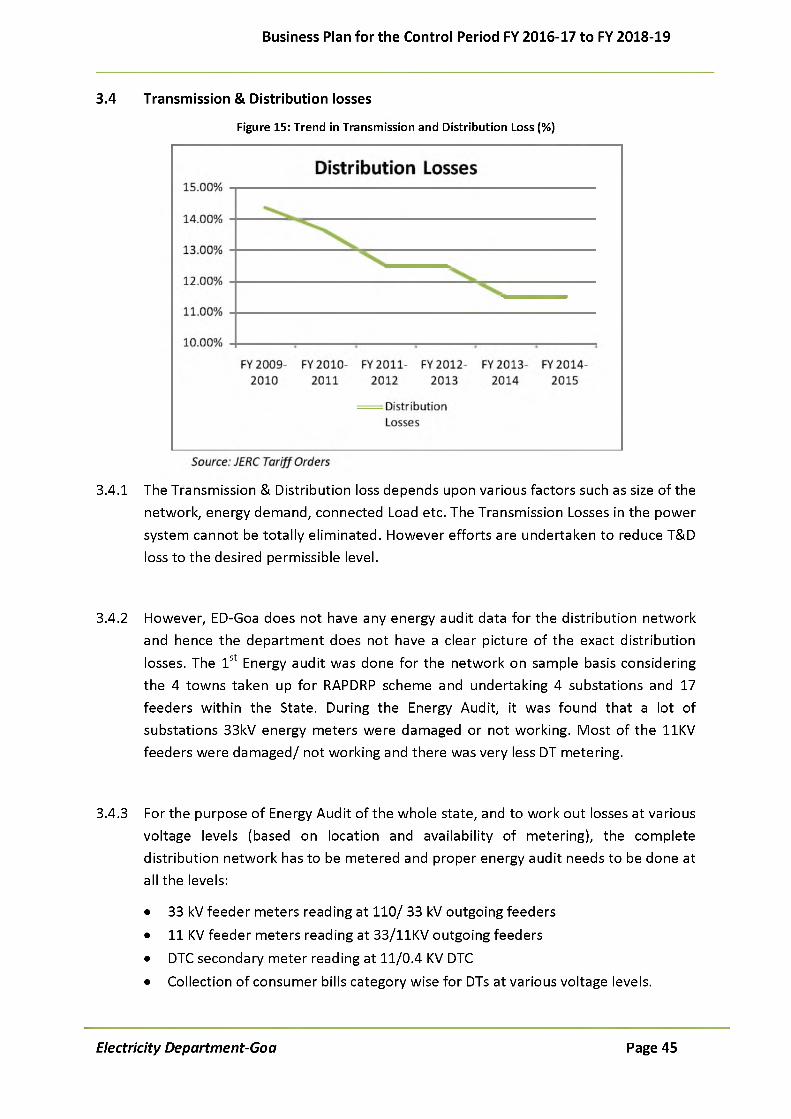
Business Plan for the Control Period FY 2016-17 to FY 2018-19
3.4 Transmission & Distribution losses
Figure 15: Trend in Transmission and Distribution Loss (%)
3.4.1 The Transmission & Distribution loss depends upon various factors such as size of the network, energy demand, connected Load etc. The Transmission Losses in the power
system cannot be totally eliminated. However efforts are undertaken to reduce T&D loss to the desired permissible level.
3.4.2 However, ED-Goa does not have any energy audit data for the distribution network and hence the department does not have a clear picture of the exact distribution
losses. The 1st Energy audit was done for the network on sample basis considering the 4 towns taken up for RAPDRP scheme and undertaking 4 substations and 17 feeders within the State. During the Energy Audit, it was found that a lot of substations 33kV energy meters were damaged or not working. Most of the 11KV feeders were damaged/ not working and there was very less DT metering.
3.4.3 For the purpose of Energy Audit of the whole state, and to work out losses at various voltage levels (based on location and availability of metering), the complete distribution network has to be metered and proper energy audit needs to be done at all the levels:
• 33 kV feeder meters reading at 110/ 33 kV outgoing feeders
• 11 KV feeder meters reading at 33/11KV outgoing feeders
• DTC secondary meter reading at 11/0.4 KV DTC
• Collection of consumer bills category wise for DTs at various voltage levels.
Electricity Department-Goa Page 45

Business Plan for the Control Period FY 2016-17 to FY 2018-19
3.4.4 The Department has completed metering at substation/feeder level and is trying to complete the metering at DT level. ED-Goa will complete the same before the completion of Part A of RAPDRP. Once the metering is complete and 2nd Energy Audit
as well as RADPRP Part A is complete, a clear picture of the distribution losses will emerge and the losses as portrayed in above tables might change during true-up process.
3.5 Consumer Base
3.5.1 Currently, ED-GOA is serving 5,75,633 consumers of which around 4,66,345 of the consumers are domestic consumers. The second largest consumer profile is of LT- Commercial consumers with a weight age of around 15%.
3.5.2 Given below is a graph depicting the number of consumers across different categories for the period from FY 2009-10 to FY 2014-15, It can be seen that the number of consumers have been marginally increased over the period. The majority of the consumers are in the LT-Domestic category followed by LT Commercial
Category.
Table 7: Consumer Base for last six years
Consumer Category FY 2009-10 FY 2010-11 FY 2011-12 FY 2012-13 FY 2013-14 FY 2014-15LT-Domestic 4,27,930 4,53,862 4,54,448 4,55,471 4,69,371 4,66,345LT Industrial 6,940 7,967 9,500 9,692 6,574 6,038LT- Commercial 84,253 91,119 94,259 94,471 85,275 85,797LT- Agricultural 9711 11060 11000 11024.7638 10882 10821LT- Public Lighting 7400 8000 9000 9020.26125 6450 2740LT-Public Water Works 515 542 546 547.229183 464 373HT Industrial 404 435 466 467 546 574HT-Mixed 176 186 201 201 161 172HT-Agriculture 40 45 42 42 40 41HT-Public Water Supply 30 31 31 31 33 35HT-Defence 10 10 12 12 12 12LT- Temporary 360 389 408 4,196 3,478 2,581Total Number of Consumers 5,37,769 5,73,646 5,79,913 5,85,177 5,83,286 5,75,548
Electricity Department-Goa Page 46

Business Plan for the Control Period FY 2016-17 to FY 2018-19
Figure 16: Consumer Base for FY 2014-15
Number of Consumers for FY 2014-15
□ LT-Dom estic □ LT-Com m ercia l LT Industrial
□ LT -Pub lic Lightings HT Industrial □ Tem p orary & O thers
3.6 Power Purchase
3.6.1 ED-Goa has been purchasing majority of its power from Central Generating Stations (CGS) as per the allocation decided by Ministry of Power. The purchase cost from FY 2011-12 to FY 2014-15 is based on Provisional Actuals.
Figure 17: Power Purchase Rate per unit for the past 5 Years
3.6.2 The figure depicts per unit rate of power purchase for ED-Goa during last 5 years.
The significant increase in power purchase cost is mainly on account of huge
Electricity Department-Goa Page 47

Business Plan for the Control Period FY 2016-17 to FY 2018-19
dependence on external sources for purchase of power and the increase in fuel cost of generating stations.
3.7 Revenue
3.7.1 The revenue generated from the consumption of electricity to various categories is shown in the chart below. Even though no. of consumers of HT consumers is very few, the highest revenue is obtained from the HT Industrial consumers i.e. 57% of
the total revenue. LT Domestic Category with the highest no. of consumers generates only 14% revenue.
Figure 18: Category wise Revenue (Rs. Crore) FY 2014-15
Revenue (Rs. Crores)
5% 4%
6%14%
10%
5%
57%
I LT-Dom estic
LT -C om m erc ia l
LT Industrial
HT Industrial
H T-M ixed
H T-Public W a te r Supply
O th ers
Electricity Department-Goa Page 48

Business Plan for the Control Period FY 2016-17 to FY 2018-19
CHAPTER 4. MARKET ASSESSMENT
4.1 Preamble
4.1.1 In order to prepare a Business Plan, it is necessary to understand the market and diverse forces acting in the market. Market Assessment is broadly categorized into following:
1. Statutory and Regulatory Framework
2. Key Provisions
3. Market Issues and Challenges
4. Market Outlook
4.2 Statutory and Regulatory Framework
4.2.1 Under the Electricity Act, 2003, "Distribution" is a licensed activity and is to be regulated as per license conditions and licensing regulations that govern the
distribution business. The Electricity Act, 2003 has bestowed numerous responsibilities for distribution on the Central Government, State Government and the State Electricity Regulatory Commissions (SERCs)/ Joint Electricity Regulatory Commission (JERC).
4.2.2 As per the Electricity Act, 2003, the Central Government has to prepare the National
Electricity Policy, National Electricity Plan and National Tariff Policy for development of the power system. In line with this, the Central Government has notified the National Electricity Policy, 2005 which aims at laying guidelines for accelerated development of the power sector, providing supply of electricity to all areas and protecting interests of customers and other stake holders.
4.2.3 Likewise, National Tariff Policy (NTP) has also been notified and has laid down the following objectives:
S Ensure availability of electricity to customers at reasonable and competitive rates.
S Ensure financial viability of the sector and attract investments.
S Promote transparency, consistency and predictability in regulatory approaches across jurisdictions and minimize perceptions of regulatory risks.
Electricity Department-Goa Page 49

Business Plan for the Control Period FY 2016-17 to FY 2018-19
4.2.4 The Electricity Act, 2003, amended in the year 2007 was notified to:
"...consolidate the laws relating to generation, transmission, distribution, trading and use o f electricity and generally fo r taking measures conducive to development o f
electricity industry, promoting competition therein, protecting interest o f customers and supply o f electricity to all areas, rationalization o f electricity tariff, ensuring transparent policies regarding subsidies, promotion o f efficient and environmentally benign policies..."
4.2.5 The Electricity Act, 2003 states that the State Commissions shall be guided by the National Electricity Policy, National Electricity Plan and National Tariff Policy in discharge of its functions.
4.2.6 Section 83 of the Electricity Act, 2003 refers to the constitution of Joint Commission and has been empowered to determine tariff for generation, supply, transmission and wheeling of electricity, wholesale, bulk or retail as the case may be within the constituent States and UTs and shall specify/ enforce standards with respect to
quality, continuity and reliability of service by power distribution utility, in addition to discharge of such other functions as assigned to it under Electricity Act, 2003.
4.2.7 In exercise of the powers conferred by Section 83 of the Electricity Act, 2003 the Central Government constituted a two member (including Chairperson) Joint Electricity Regulatory Commission for all the Union Territories of India except Delhi.
Later with the joining of the State of Goa, the commission came to be known as "Joint Electricity Regulatory Commission for the State of Goa and Union Territories (JERC)" as notified on May 30, 2008. The JERC started functioning with effect from August, 2008.
4.2.8 In discharge of its function, the JERC issued various rules and regulations applicable to the State of Goa and UTs. Some of the key regulations/polices issued by the JERC are outlined below:
Electricity Department-Goa Page 50

Business Plan for the Control Period FY 2016-17 to FY 2018-19
Table 8: Applicable Key Regulations for ED-Goa
1 JERC Conduct of Business Regulations, 2009 - Guidelines to power Sector utilities in the the State of Goa and UTs for undertaking various regulatory activities.
2 JERC Appointment and Functioning of Ombudsman Regulations, 2009 and its amendment- Guidelines to the distribution licensee in the State of Goa and UTs for appointment and functioning of Ombudsman.
3 JERC Establishment of Forum for Redressal of Grievances of Consumers Regulations, 2009 and its amendment - Guidelines to the distribution licensee in the State of Goa and UT for establishing forum for redressal of consumer grievances.
4 JERC Treatment of Other Business of Transmission Licensees and Distribution Licensees Regulation, 2009 - Guidelines for treatment of other business of the licensee in the State of Goa and UTs.
5 JERC Standards of Performance Regulations, 2009 - Stipulates the standards of performance to be adhered by the distribution licensee
6 JERC Open Access in Transmission and Distribution Regulation, 2009 - It is applicable for access to and use of the distribution system of distribution licensees
7 JERC Terms and Conditions for Determination of Tariff Regulations, 2009 - Terms and conditions for determination of tariff for licensees and laying down the performance parameters
8 JERC Electricity Supply Code Regulations, 2010 and its amendments - Obligations of the distribution licensee and consumers vis-a-vis each other and set of practices that shall be adopted by distribution licensee to provide efficient, cost-effective and consumer friendly service to consumers.
9 JERC Procurement of Renewable Energy Regulations, 2010 - Regulations for the development of power generation from renewable energy sources and for procurement of energy from renewable sources by distribution licensee
10 JERC Distribution Code Regulations, 2010- Obligations of the distribution licensee and consumers vis-a-vis procedures for the management of day to day technical situations in the Distribution System, taking into account a wide range of operational conditions likely to be encountered under both normal and abnormal conditions.
11 JERC (Multi Year Distribution Tariff Regulations), 2014 - For determination of tariff from April 1, 2015 up to March 31, 2018 - (Deferred the control period by 1 year) i.e. from April 1, 2016 to March 31, 2019.
12 JERC Demand Side Management Regulations, 2014 - Guidelines for advancement and implementation of cost effective DSM initiatives in the State of Goa and UTs.
13 JERC (Solar Power -Grid Connected Ground Mounted and Solar Rooftop and Metering ) Regulations, 2015 - Guidelines for Solar capacity addition in the license area
4.2.9 The power sector in Goa is being regulated based on the above outlined regulations
and the same has also brought in an element of regulatory certainty as envisaged in Electricity Act, 2003. As mentioned previously, the above mentioned enactments have had an impact on the sector at the national as well as the state level.
Electricity Department-Goa Page 51

Business Plan for the Control Period FY 2016-17 to FY 2018-19
4.2.10 Thus, it can be observed that a number of path breaking initiatives have been takenin the recent past in terms of policy pronouncements to revamp the power system. The unleashing of the non-discriminatory open access to the transmission system
will have a positive impact on wheeling of power from power surplus states to deficit areas, however there is a threat of high revenue HT consumers moving out network. On the threat of climate change, there is a need to look at renewable energy as an option for generation on a large scale; However, Goa doesn't have much potentialfor conventional as well as renewable energy generation due to its climatic
conditions and absence of adequate land spaces.
4.3 Key Provisions
4.3.1 The key provisions of the Electricity Act, 2003 and other policy enablers which havethrown up opportunities as well as challenges to ED-Goa are:
S Renewable Purchase Obligation
S Multi-year Tariff Regime
4.3.2 While there a number of enablers in the environment for growth opportunities, there are also challenges that would need to be analysed, along with the inherent strengths and weakness of ED-Goa to consider the future outlook of the Electricity Department.
4.4 Market issues and challenges
4.4.1 Tariff Design under M YT Regime -ED-Goa understands that the retail tariffs forensuing year would be approved by the Commission every year and there would be
true-up and performance review as well. ED-Goa also presumes that even if some figures are not accurately available in absence of audited accounts and true-up submissions, JERC would allow pass through of corresponding tariff impact since, it may not be possible to recover tariff in lumped instalments. ED-Goa also understands that MYT regime is introduced so that utilities are rewarded for
performance and there is accuracy in projections.
4.4.2 M ining Activities in Goa - The Government of Goa had suspended the mining operations due to certain illegal matters in September 2012. As a result of this, there was a drop in electricity consumption in 2nd half of FY 2012-13. It is expected that Mining activities would start up soon in Goa and will lead to increase in power
consumption by more industrial and commercial consumers. This would be key factor in the relevant financial year for ED-Goa in terms of arranging required power.
Electricity Department-Goa Page 52

Business Plan for the Control Period FY 2016-17 to FY 2018-19
Also, with Goa's recent Investment Policy, electricity consumption could rise as more industries get attracted to Goa.
4.4.3 Renewable Purchase Obligation - The Electricity Act, 2003, mandates the State Electricity Regulatory Commissions to promote cogeneration and generation from renewable energy sources by providing suitable measures for connectivity with the grid.
4.4.4 In this regard, the Commission has passed the regulation for development of power generation from renewable energy sources and for procurement of energy from renewable sources by distribution licensee. ED-Goa submits most of the SERCs have mandated RPO in an increasing trend considering there would be corresponding increase in renewable energy generation. However, ED-Goa does not have much potential for Ground Mounted renewable generation since there is scarcity of land in
Goa. Most of the utilities are unable to meet RPO requirement by way of renewable energy generation due to inadequate renewable potential within the licensee area and are required to purchase RECs, which is proving to be a costly proposition.
Figure 19: RPO % mandated by JERC
Minimum Quantum of RPO (%in KWh consumed)
Financial Year 1 Total RPO Solar RPO (%) Non-Solar RPO (%)
2010-11 1.00 0.25 0.75
2011-12 2.00 0.30 1.70
2012-13 3.00 0.40 2.60
2013-14 3.00 0.40 2.60
2014-15 3.30 0.60 2.70
2015-16 3.55 0.85 2.70
2016-17 3.95 1.15 2.80
2017-18 4.30 1.50 2.80
2018-19 4.65 1.85 2.80
2019-20 5.10 2.20 2.90
2020-21 5.50 2.60 2.90
2021-22 6.00 3.00 3.00
Electricity Department-Goa Page 53

Business Plan for the Control Period FY 2016-17 to FY 2018-19
4.4.5 However there is an issue of availability of renewable energy within the licence area. ED-Goa is purchasing Renewable power from various organizations outside the State in order to fulfil the RPO.
4.5 Solar RPO Status:
4.5.1 As regard to fulfilment of Solar RPO is concerned, PPA has been executed for 6 MW
i.e. 10 MU's per year by the Electricity Department with M/s NVVNL, New Delhi on 22-8-2014 for supply of solar power for a period of 5 years @ Rs 7.99 per unit exclusive of transmission charges. The supply has started w. e. f. 28-08-2014. This is for the clearance of backlog from FY 2010-11 to 2014-15.
4.5.2 Further M/s Solar Energy Corporation of India had allocated 10 M W of Solar power to the State and also submitted Power Sale Agreement (PSA). However, said allocation was enhanced by 15MW and hence SECI will be now supplying solar power of 25 M W @ Rs 5.50 (The rate as recommended by the Hon'ble Commission) per unit exclusive of transmission charges for a period of 25 years. The
commencement of supply is yet to be started; the delay in the commencement is because of Open Access issues. It is anticipated that Power supply will commence from November 1st, 2015. As per this PSA ED Goa is expected to receive around 41.06MU's annually.
4.5.3 In case the solar obligation is not fulfilled from the above mentioned sources, ED Goa
may have to purchase RECs in control period to ensure that there is no carry forward of Solar RPO in the next control period.
4.5.4 To meet Solar RPO, if necessity gets developed, ED-Goa has purchase RECs in control period to ensure there is no carry forward of Solar RPO in second control period.
4.6 Non-Solar RPO Status:
4.6.1 The Electricity Department has met the non solar RPO for the year FY 2014-15 by purchasing RECs from the exchanges at Rs.1.50/kWh. For the same year, initially the proposals were invited to purchase electricity from non solar Renewable energy sources. As the rates offered were on higher side & considering miniscule business of ED-Goa, it was decided to purchase REC's.
Electricity Department-Goa Page 54

Business Plan for the Control Period FY 2016-17 to FY 2018-19
4.6.2 ED-Goa has issued an LOI to M/s NVVNL (Date: 09.07.2015) at Rs. 4.49 per kWh (At Goa Periphery) for 10MW of hydel power from small Hydro power plant from Eastern Region to meet Non Solar RPO for the year FY 2015-16. Depending on RPO
status by way of purchasing above hydel power, ED Goa will further decide on purchasing RECs in the Q3 and Q4 of 2015-16 to fulfil entire non solar RPO.
4.7 Reduction of Cross Subsidy
With the enactment of Electricity Act 2003 and various policy initiatives thereof, the utilities
need to gradually reduce the cross subsidy and move the tariffs towards +/- 20% of the "Cost of Supply". Traditionally, in the Indian context, tariffs for domestic and agricultural consumers have been heavily subsidised either by the state through subsidies and subventions or through cross subsidisation by other consumer categories, primarily the consumers using electricity at high voltages. Hence constant rationalisation of consumer categories and tariff is required.
4.7.1 As per Section 61 (g) of Electricity Act, 2003,
"The tariff progressively reflects the cost o f supply o f electricity and also, reduces and eliminates cross-subsidies within the period to be specified by the Appropriate Commission."
4.7.2 ED-Goa considers this as a challenge for all stakeholders to achieve the desired level of cross subsidy.
4.8 Market Outlook
4.8.1 Power Distribution reforms are widely viewed as fundamentals for improvingcommercial performance and financial viability of the power sector in India. Reformsin Distribution sector post Electricity Act, 2003 have been at steady pace but are
going to occur in the near future. As per the recently released World Bank report titled "M ore power to India - the challenge of electricity distribution", the Electricity Act, 2003 and associated policies constitute an enabling policy and regulatory framework for the sector's development— the focus now must be on implementation.
4.8.2 The primary focus of these reforms has been to improve the efficiencies in the Power Distribution Sector and various models have been tried such as privatisation
model, distribution franchisee model, APDRP schemes etc.
Electricity Department-Goa Page 55

Business Plan for the Control Period FY 2016-17 to FY 2018-19
4.8.3 With respect to ED-Goa, its license area is quite different from the other distribution areas in the country, in terms of sourcing power almost entirely from CGS, supplying quality and uninterrupted power, having a diversified consumer profile and having
relatively low distribution losses in the system.
4.8.4 Considering the fact that ED-Goa is bound for significant reforms in the distribution segment with introduction of MYT regime, demand side management initiatives, promotion of renewable energy, R-APDRP activities etc the future of power sector
looks optimistic.
Electricity Department-Goa Page 56

Business Plan for the Control Period FY 2016-17 to FY 2018-19
CHAPTER 5. ALLOCATION POLICY FOR WIRES & SUPPLY BUSINESS
5.1 Need for Cost Allocation
5.1.1 The Hon'ble Commission for the State of Goa and Union Territories in its JERC (Multi Year Distribution Tariff) Regulations, 2014 (MYDT Regulations 2014) has provided that distribution licensee shall maintain separate books of accounts for Wheeling
Business and Retail Supply Business for such period until accounts are segregated and separate books of accounts are maintained.
"33. Segregation o f Retail Supply and Wheeling Business
The Commission shall decide the ratio o f allocation o f all expenses and return component, based on data obtained from the Distribution Licensees. The following broad principles shall be followed fo r allocation o f costs towards wheeling business and supply business, out o f the total annual revenue requirements determined:
(a) Power purchase cost shall be allocated to the Supply business;
(b) Operation and Maintenance expenses shall be segregated between wheeling and supply businesses in such manner as may be determined by the Commission;
(c) M ajority o f the capital expenditure related expenses, viz., depreciation, interest
and return on equity, shall be included under the wheeling business.
Note - The Supply Business would require only a small component o f the capital expenditure towards billing and collection activity."
5.2 Allocation between Retail Supply and W heeling Business
5.2.1 The financial statements of Electricity Department Goa (ED-Goa) are being preparedon commercial basis to ensure regulatory compliances. Considering the provisions of MYDT Regulations 2014 and allocation statement provided by other SERCs, ED-Goa is
hereby preparing the Allocation Statement for Retail Supply and Wheeling Business for the first control period for the kind approval of Hon'ble Commission. The salient features of this methodology are as follows:
5.2.2 Power Purchase Cost and Transmission Charges
• The Power Purchase costs including Transmission Charges are related partly relatedto Wheeling / Fixed and partly to Retail Supply business. ED-Goa based on the figures
of fixed/ capacity charges of power purchase and Withdrawal charges of PGCIL Transmission charges, has computed allocation between W heeling and Retail Supply Business as 30:70. ED-Goa also submits that in future if there are cases of
Open access and power purchase capacity is stranded, the % would be reviewed and submitted to Commission for approval.
Electricity Department-Goa Page 57

Business Plan for the Control Period FY 2016-17 to FY 2018-19
5.2.3 Capital Cost/ Fixed Assets
• All Network Assets up to laying of service cables line have been taken for Wheeling Business and beyond that have been considered as part of Retail Supply Business;
• The Common assets such as buildings, furniture etc have been considered 60% for Wheeling and 40% for Retail Supply Business;
• ED-Goa submits that costs already incurred are sunk cost and needs to be recovered from consumers who go out of system.
• Based on the above, ED-Goa has analysed the past GFA and has found that the ratio works out to around 95:5 for Wheeling and Retail Supply business. Hence considering the same, Capital Cost/ Gross Fixed Assets are suggested to have an allocation o f 95:5 fo r Wheeling and Retail Supply Business fo r this control period.
5.2.4 Employee Expenses
• The employee expense includes costs such as wages & salaries of the employee who are directly engaged with ED-Goa and salaries of employees on contractual basis.
• ED-Goa has segregated its employees in Pay Group of A, B, C &D into Wires, Supply
and employees common for Wires & Supply. Basically the employees in Wires business are more of technical and related to field work.
• ED-Goa submits that employee costs are fixed in nature and will have to be
recovered from consumers who go out of system.
• Based on above, it is suggested to have an allocation o f 90:10 fo r Wheeling and Retail Supply Business for Employee Expenses fo r this control period.
5.2.5 Administrative and General Expenses
• Administrative and General Expenses comprise of various sub-heads/ accounts and
pertains to both Wheeling and Supply Business. ED-Goa submits that A&G expenses related to power purchase, metering, billing and collection, Legal & Professional charges, financing expenses on loan related to retail supply business may be allocated to retail supply business. Office expenses like telephone, stationery, electricity, lease rent, etc. might be apportioned between wires and retail supply
business on the basis of predominant usage concept. Remaining heads of A&G expenses have been allocated in the ratio of 15% for retail supply and 85% for wires business. This is due to a fact that majority of expenses towards rent rates and taxes, telephone and postage, professional and consultancy fees, conveyance and travel charges, electricity charges, security arrangements, stationery and bank charges
might be attributed to wires business. Hence an allocation assumption o f 75:25 for Wheeling and Retail Supply Business is considered fo r A&G Expenses fo r this control period.
Electricity Department-Goa Page 58

Business Plan for the Control Period FY 2016-17 to FY 2018-19
5.2.6 Repairs and Maintenance Expenses
• The Repairs and Maintenance expenses comprises of stores & spares, building repairs, Plant and Machinery repairs etc which are direct costs of ED-Goa. The majority of the expenses are related to distribution network / systems. However there are some expenses like office repairs, furniture repairs etc which are common
for both i.e. Wires & Supply. Hence considering this element and ratio o f GFA, R&M Expenses are suggested to have an allocation o f 95:5 fo r Wheeling and Retail Supply Business fo r this control period.
5.2.7 Depreciation
• Depreciation is a provision made as notional expenditure for wear and tear of asset and also to enable the replacement of asset after its useful life. Since it is linked to GFA, the depreciation is also allocated in proportion to 95:5 fo r Wheeling and Retail Supply Business fo r this control period.
5.2.8 Interest on Loan and Return on Equity
• The Licensee needs to arrange for the funding of Capital Expenditure either in form of Loans or Equity or combination of both. Since the requirement of both is for capital assets, the Interest on Loan expense and Return on Equity will be allocated in proportion to 95:5 fo r Wheeling and Retail Supply Business fo r this control period.
5.2.9 Interest on Working Capital
• The Working Capital would be computed as per JERC MYDT Regulations 2014 for
Retail Supply business. On the same lines, working capital for Wires business would
be computed. Alternatively, ED-Goa proposes to have allocation in proportion to 95:5 fo r Wheeling and Retail Supply Business fo r this control period.
5.2.10 Demand Side Management (DSM) Expenses
• As per the provisions of Electricity Act 2003 and various regulations issued by JERC,
licensee needs to undertake DSM activities. It is submitted that ED-Goa is undertaking DSM activities where capex incurred would be applicable for both Wheeling & Retail Supply business. For eg. The replacement in Street Lights by LED lamps is a wheeling expenditure and cannot be attributed to Retail Supply business.
Considering all such aspects, 25:75 costs are allocated to W heeling and Retail
Supply Business fo r this control period fo r DSM expenses.
Electricity Department-Goa Page 59

Business Plan for the Control Period FY 2016-17 to FY 2018-19
5.2.11 Interest on Security Deposits
• The Security deposits are collected from consumers as per provisions of EA 2003 and provisions of Supply Code Regulations issued by JERC in proportion to one / two months billing as the case may be. Since the billing amount comprises of both Wheeling and Retail Supply ARR, it would be incorrect to consider 100% amount in
Retail Supply Business and logical approach would be to consider Wheeling and Retail Supply ARR ratio of all elements.
• ED-Goa proposes allocation o f 10:90 fo r Wheeling and Retail Supply Business is appropriate fo r Interest on Security Deposit fo r this control period.
5.2.12 Non-Tariff Income
• There is no such trend or assurance for Non-Tariff income and is an effect of Retail
Supply Business. It is suggested that same Wheeling and Retail Supply ARR ratio be used for Non-Tariff Income also for control period. Further Non-tariff Income also includes portion of Sale of fixed assets under scrap. The income from assets rented out will also qualify as NTI from wheeling business. Considering all such aspects, an allocation assumption o f 75:25 fo r Wheeling and Retail Supply Business is considered fo r Non-Tariff Income fo r first control period.
5.2.13 Other Charges
• During the course of business in the control period, there may be case where other
elements such as Load Despatch Charges, Lease Charges, and Income from Open Access Charges etc may happen and the allocation for the same will be decided on case to case basis keeping in mind above discussed allocations.
5.3 Summary of Allocation Statement
5.3.1 The Allocation Statement for Wheeling & Retail Supply Business is given in the belowtable:
Electricity Department-Goa Page 60

Business Plan for the Control Period FY 2016-17 to FY 2018-19
Table 9: Allocation Statement
Sr. Cost Elements Wheeling Retail% Supply %
1 Power Purchase Cost & Transmission Charges 30% 70%
2 Employee Expenses 90% 10%
3 Administrative and General Expenses 75% 25%
4 Repairs and Maintenance Expenses 95% 5%
5 Depreciation 95% 5%
6 Interest on Loan 95% 5%
7 Interest on Working Capital 95% 5%
8 Return on Equity 95% 5%
9 DSM Expenses 25% 75%
10 Interest on Security Deposit 10% 90%
11 Non-Tariff Income 75% 25%
5.3.2 ED-Goa submits that the Hon'ble Commission may allow the petitioner to revise the
Allocation Statement based on the actual scenario after this financial year i.e. FY 2015-16. ED-Goa believes that such reconciliation process would help at arriving correct Wheeling and Retail Supply ratio and will overall benefit all stakeholders. Further, going forward the allocation policy may be subjected to change due toreasons such as change in asset ratio for assets added during year, change in ratio
due to increase in number of employees in wheeling / retail business etc. In the interim, the Hon'ble Commission may kindly consider the proposed Allocation Policy as submitted by the petitioner.
5.4 W ires and supply business availability
5.4.1 As per Regulation 34 of JERC MYT Regulations 2014, ED-Goa has to submitavailability index for wheeling and supply business for the control period. The relevant extracts are as follows.
34. Target Availability and Recovery o f ARR
a) The availability index o f wheeling business & supply business shall be maintained
separately by the Licensee and informed to the Commission. The Distribution Licensee shall maintain data on planned maintenance outages, load shedding, force majeure outages and tripping.
Electricity Department-Goa Page 61

Business Plan for the Control Period FY 2016-17 to FY 2018-19
b) The incentive/disincentive shall exclude the circumstances when the actual supply differs from the contracted supply due to force majeure situations, weather conditions, extreme monsoon failure, station outages, etc. which are beyond the
control o f the Distribution Licensee.
c) The Commission shall specify progressively increasing normative levels of Availability fo r Wires and Supply Business o f the Distribution Licensee on the basis o f past performance over the control period.
Provided that the Availability o f Supply Business shall not be lower than 90% and shall gradually increase to 95% or 98% in no less than three years
5.4.2 Moreover Hon'ble Commission vide its letter with Ref No. 50/43/2013-JERC/1607, dated: 6th July, 2015 directed the Department to submit wires and supply availability for the control period in line with the Regulations.
5.4.3 ED-Goa submits that the Regulation specifies the Utility to maintain certain data pertaining to planned maintenance outages, load shedding, force majeure outages and number of tripping in order to arrive at index for supply and wires availability. However there is no methodology specified in the Regulations to come out with a trajectory for wires and supply availability for the control period.
5.4.4 ED-Goa has therefore adopted the following methodology for calculation of wires and supply indices based on the actual data available for FY 2012-13 to FY 2014-15. The methodology adopted is explained in the subsequent paragraphs.
5.4.5 Wires business availability: There are around 18 divisions in ED-Goa license area and
out of those only 13 divisions are related to O&M. ED-Goa has calculated reliability index for these 13 divisions based on SAIDI formula for FY 2012-13 to FY 2014-15. The following table shows the sample reliability index calculated for Division I of ED- Goa license area for FY 2012-13 to FY 2014-15
Electricity Department-Goa Page 62

Business Plan for the Control Period FY 2016-17 to FY 2018-19
Table 10: SAIDI and RI for Division I for FY 2012-13 to FY 2014-15
SA ID I D etails Tn minutesYear Sub-Division SAIDI for 11KV
feederRI for 11KV feeder in &age
SAIDI for consumers
RI forconsumers in
2014-2015 S/D I (Corlim) 1,024.67 99.80 1,213.06 99.772014-2015 S/D II(Panjim) 178.21 99.96 191.25 99.962014-2015 S/D III(Bambolim) 984.00 99.81 1,083.00 99.802014-2015 S/D IV(Taleigao) 3,003.00 99.42 3,049.18 99.41
Year Sub-Division SAIDI for 11KV feeder
RI for 11KV feeder
SAIDI for consumers
RI forconsumers in
2013-2014 S/D I (Corlim) 1,194.67 99.77 1,503.12 99.712013-2014 S/D II(Panjim) 181.07 99.96 178.46 99.962013-2014 S/D III(Bambolim) 998.00 99.81 1,026.00 99.802013-2014 S/D IV(Taleigao) 2,124.00 99.59 2,541.17 99.51
Year Sub-Division SAIDI for 11KV feeder
RI for 11KV feeder
SAIDI for consumers
RI forconsumers in
2012-2013 S/D I (Corlim) 1,115.17 99.78 1,422.45 99.732012-2013 S/D II(Panjim) 183.57 99.96 145.17 99.972012-2013 S/D III(Bambolim) 1,020.00 99.80 1,046.00 99.802012-2013 S/D IV(Taleigao) 2,672.00 99.49 2,809.10 99.42
5.4.6 ED-Goa in similar fashion has calculated the SAIDI indices and reliability index for all the O&M division for FY 2012-13 to FY 2014-15. In order to carry out the weighted average index sales of FY 2014-15 has been taken as base figures.
Table 11: Wires Availability for ED-Goa
Division 2012-13 2013-14 2014-15 Average
I 99.76% 99.78% 99.75% 99.76%III 98.89% 98.89% 98.66% 98.81%IV 99.03% 98.78% 98.48% 98.76%V 98.72% 98.53% 98.14% 98.46%VI 98.47% 98.54% 98.59% 98.53%VII 90.76% 89.38% 86.52% 88.89%X 96.72% 97.43% 96.36% 96.84%XI 99.41% 99.28% 99.21% 99.30%XII 99.87% 99.85% 99.92% 99.88%
XIV 98.98% 99.26% 90.63% 96.29%XVI 99.50% 99.54% 99.55% 99.53%XVII 99.34% 99.24% 99.14% 99.24%
W eigh ted Avg. 98.31% 98.22% 97.05% 97.86%
Electricity Department-Goa Page 63

Business Plan for the Control Period FY 2016-17 to FY 2018-19
5.4.7 The weighted average calculated in the above table for entire state of ED-Goa is considered for entire control period as shown in the table below.
Table 12: Wires Availability for Control Period
ParticularsFY 2016
17FY 2017
18FY 2018
19Wires Availablity 97.86% 97.86% 97.86%
5.4.8 Supply Business Availability: The actual data of FY 2014-15 and projected data of FY
2015-16 have been considered to assess the supply business availability. The actual contract peak load supply is taken from the WRPC data and the actual peak load is taken from the LGBR report of 2015-16. Since the base load is not available, we have considered base load as peak load. The overall supply availability in the license area of ED-Goa is therefore calculated at 99% and the same is considered for control
period.
Table 13: Supply Availability for FY 2014-15 and FY 2015-16
S.No. Particulars Units 2014-15 2015-161) Base Load Supply Availabilitya) Actual Contracted non peak Load Supply in
MW495 515
b) Non peak Load in MW 501 515c) Non peak Load Supply Availability (%) c=a-rb 99% 100%
2) Peak Load Supply Availabilityd) Actual Contracted Peak Load Supply in MW 490 500e) Peak Load in MW 501 515f) Peak Load Supply Availability (%) f=d^e 98% 97%
3) Supply Availability ((20/24)*c+ (4/24)*f)
99% 99%
5.4.9 It is therefore submitted that the supply availability is considered at 99% for FY 201617 to FY 2018-19.
Electricity Department-Goa Page 64

Business Plan for the Control Period FY 2016-17 to FY 2018-19
CHAPTER 6. DEMAND & SALES ASSESSMENT
6.1 Preamble
6.1.1 Demand and sales assessment is one of the prime factors for consideration, as itgives the correct reflection of revenues to be earned by the Distribution Company.There are several approaches to project the demand and sales for the future years
ranging from traditional CAGR method to advanced end use survey method. CEA has been using partial end use method to project demand in various states. However, the technique which is to be adopted mainly depends on the kind of data that is available, nature of consumption and size of customer category.
6.1.2 Further, Demand and Sales Assessment is not a one-time exercise but needs to be constantly monitored against actual demand and updated for any major development or changes in other external drivers like policies, regulatory developments, industrial growth, changes in specific industry segments etc.
6.2 Regulatory Provisions for Sales Forecast
6.2.1 The Commission in Regulation 15 and 16 of MYT Tariff Regulations, 2014 hasspecified the methodology for projecting metered and un-metered sales. The
relevant provisions of the JERC MYT Tariff Regulations, 2014 are extracted for reference as under:
"15.1 Forecasting Methodology
Metered sales shall be treated as an uncontrollable parameter:
Provided that open access transactions shall not form part o f the sales:
Provided further that sales forecast shall be based on past trends in each o f the slabs o f consumer categories. The compounded annual growth rate (CAGR) o f past 2 to 3 years o f sales within each o f the slabs o f a consumer category as per audited books o f account shall be used to forecast up to short and medium (5 years) time range.
Provided also that in cases where slab-wise sales to each consumer category are not available in audited books o f accounts and only consolidated sales are available, the Distribution Licensee shall include the slab-wise sales in annexure to its Annual Report from next year onwards:
Electricity Department-Goa Page 65

Business Plan for the Control Period FY 2016-17 to FY 2018-19
Provided also that if Audited books o f accounts are not available, the DistributionLicensee shall get the accounts audited within a year o f roll out o f these tariff
regulations so as to ensure that audited sales figures, by slab by consumer category, fo r last three preceding years are available fo r sales estimation from next year onwards
16 Un-metered Sales Forecast
Methodology for determination of un-metered sales
16.2 The Central Electricity Authority issued CEA (installation and operation of meters), Regulations 2006. However in some utilities under the jurisdiction o f JERC 100% metering has not yet taken place. Till such time 100% metering is achieved, the energy sales to unmetered consumers shall be considered on normative and it will be a controllable parameter."
6.3 Approach for Sales Forecast for Control Period
6.3.1 The actual audited sales for FY 2009-10 and FY 2010-11 and provisional actual salesfor FY 2011-12 to FY 2014-15 is considered for projecting sales for control period. The sales for FY 2015-16 are estimated as per escalation on 2014-15 actual sales
figures. The Petitioner has considered the CAGR method for projecting sales for the control period from FY 2016-17 to FY 2018-19.
6.3.2 The Petitioner has plotted CAGR for last four, five and six years (FY 2014-15 and beyond) and then assumed an escalation which synchronizes with these plotted
CAGR's for better perception of growth in a particular category. This growth rate assumed for each category is applied on the sales that are estimated as per escalation on 2014-15 actual sales figures for FY 2015-16; for estimating sales of FY2016-17 to FY 2018-19. The Petitioner has provided justification for considering a particular growth rate for all consumer categories showing negligible, negative or abnormal growth in the past years.
6.3.3 It is submitted that certain categories has been revised vide Tariff Order dated 6th April 2015 for which no historical analysis is possible at present and may result in incorrect picture. Therefore, ED-Goa has considered sales, consumers and connected load CAGR based on old categories. ED-Goa would like to submit that once the CAGR
is arrived on old categories the same has been applied on new categories based on certain assumptions mentioned in subsequent paragraphs.
Electricity Department-Goa Page 66

Business Plan for the Control Period FY 2016-17 to FY 2018-19
6.3.4 The audited figures are available till FY 2010-11 and preparation of audited books for FY 2011-12 onwards is in progress. Therefore it is to be noted that the figures from
FY 2011-12 to FY 2014-15 are yet to be audited and hence are provisional actual. In order to deal with such a situation, Petitioner has considered three scenarios before considering a growth rate for entire control period. The Petitioner has calculated CAGR for past three, four and five years staring from FY 2014-15 and then considered a growth rate for projections of control period so that audited numbers of FY 2009-10 and FY 2010-11 also form part of this exercise.
It is also submitted that after cessation / termination of Reliance IPP Power Purchase Agreement, the consumers earlier fed by Reliance IPP are now fed through ED-Goa's network effective from 14th Aug 2014. There are ~ 22 LTP Motive power consumers with connected load of ~ 900 HP and 33 HTI Industry Consumers with demand of ~
41000 kVA are now part of the Petitioner's network. Due to increase in the industrial consumer base, the sales of HT industrial and LTP motive power is expected to increase in the control period.
6.4 Sales Projections
6.4.1 Based on the actual historic sales available with ED-Goa, category wise analysis ofthe Sales has been carried out in the subsequent paragraph with the Growth occurred in last 4, 5 and 6 years as well as growth assumed for each category based on certain assumptions.
6.4.2 LTD-Domestic: There has been an increasing trend in sales of domestic category on y -o -y basis. The growth rate has been steady over the past few years with CAGR hovering around 3% in different scenarios. However, ED-Goa assumes a growth rate of 5% for this category.
Sr.No
Consumer CategoryActual Audited Provisional Actual Growth Calculation
FY09-10 FY10-11 FY11-12 FY12-13 FY13-14 FY14-15 4 Year CAGR
5 Year CAGR
6 Year CAGR
GrowthAssumed
1(a)T a r if f LTD/Domestic and N on-Com m ercia l
655 695 696 831 790 763 3% 2% 3% 5%
6.4.3 LTD Low Income Group and LT Domestic Mixed: The growth in the Low Income
Group category has not been very consistent in the last 4-5 years. 5 year CAGR and 6 year CAGR is coming out to be negative. Hence, NIL growth is assumed for this
Electricity Department-Goa Page 67

Business Plan for the Control Period FY 2016-17 to FY 2018-19
category. The sales for LT Domestic Mixed category show a sudden increase in sales from FY 2013-14 and onwards. It is submitted that previously most of the consumers
of LT Domestic Mixed were being billed under LT Domestic category which was rectified in FY 2013-14 and therefore the boost in sales. As the growth rate is uneven, ED-Goa has therefore assumed a growth rate of 10% for this category.
Sr.No
Consumer CategoryActual Audited Provisional Actual Growth Calculation
FY09-10 FY10-11 FY11-12 FY12-13 FY13-14 FY14-15 4 Year CAGR
5 Year CAGR
6 Year CAGR
GrowthAssumed
1(b)T a r if f LTD/Low Incom e G rou p
6 6 4 9 7 5 9% -4% -2 % 0%
1(c)T a r if f LTD/Dom estic M ixed
1 1 2 4 7 10 159% 90% 64% 10%
6.4.4 LTC-Commercial: Commercial Consumers have been showing a negative trend in
their consumption. However 5% growth is assumed in commercial activities considering various developments and increasing tourism activities in the State.
Sr.No
Consumer CategoryActua Audited Provisional Actual Growth Calculation
FY09-10 FY10-11 FY11-12 FY12-13 FY13-14 FY14-15 4 Year CAGR
5 Year CAGR
6 Year CAGR
GrowthAssumed
2 Tariff-LTC/Commercial 282 305 305 267 287 268 -4% -3% -1% 5%
6.4.5 LT Industrial: LT Industrial was made by merging LT Motive Power, LT Ice Manufacturing, and LT Public W ater Works. In order to make projections for LT
Industrial Category, it is necessary to consider historical CAGR of all these three categories. Accordingly CAGR has been calculated for the following categories.
Sr.No
Consumer CategoryActual Audited Provisional Actual Growth Calculation
FY09-10 FY10-11 FY11-12 FY12-13 FY13-14 FY14-15 4 Year CAGR
5 Year CAGR
6 Year CAGR
GrowthAssumed
3 LTP-Motive Power 72 83 92 76 97 102 3% 5% 7% 5%
Sr.No
Consumer CategoryActual Audited Provisional Actual Growth Calculation
FY09-10 FY10-11 FY11-12 FY12-13 FY13-14 FY14-15 4 Year CAGR
5 Year CAGR
6 Year CAGR
GrowthAssumed
4 LTP-lce Manufacturing - - - 7 10 8 0% 0% 0% 0%
Sr.No
Consumer CategoryActual Audited Provisional Actual Growth Calculation
FY09-10 FY10-11 FY11-12 FY12-13 FY13-14 FY14-15 4 Year CAGR
5 Year CAGR
6 Year CAGR
GrowthAssumed
5 LTP-Public Water Works 2 2 2 2 7 5 36% 30% 25% 5%
6.4.6 As seen from the above table LT Motive power has been showing a steady increase in sales. However LT-Public W ater works category has increased with a significant
CAGR. Historical numbers for LT-Ice Manufacturing is not available for first three
Electricity Department-Goa Page 68
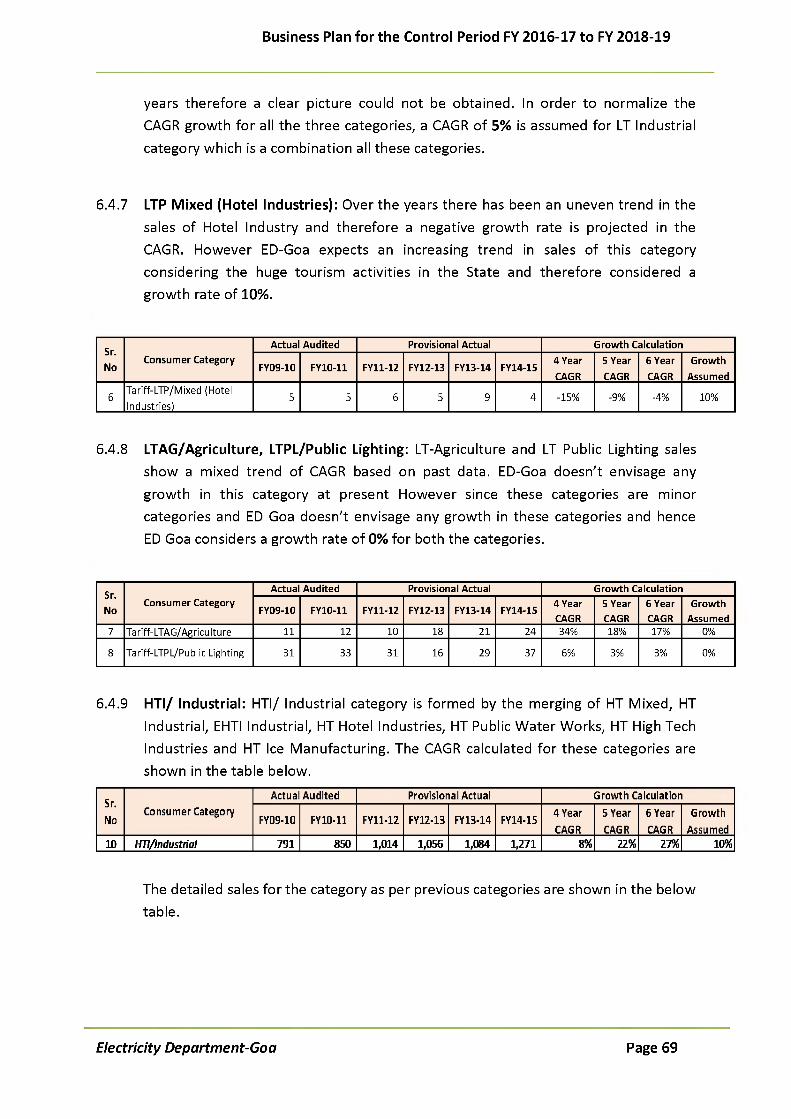
Business Plan for the Control Period FY 2016-17 to FY 2018-19
years therefore a clear picture could not be obtained. In order to normalize the CAGR growth for all the three categories, a CAGR of 5% is assumed for LT Industrial
category which is a combination all these categories.
6.4.7 LTP Mixed (Hotel Industries): Over the years there has been an uneven trend in the
sales of Hotel Industry and therefore a negative growth rate is projected in the CAGR. However ED-Goa expects an increasing trend in sales of this category considering the huge tourism activities in the State and therefore considered a growth rate of 10%.
Sr.No
Consumer CategoryActual Audited Provisional Actual Growth Calculation
FY09-10 FY10-11 FY11-12 FY12-13 FY13-14 FY14-154 Year CAGR
5 Year CAGR
6 Year CAGR
GrowthAssumed
6Tariff-LTP/Mixed (Hotel
Industries)5 5 6 5 9 4 -15% -9% -4% 10%
6.4.8 LTAG/Agriculture, LTPL/Public Lighting: LT-Agriculture and LT Public Lighting sales show a mixed trend of CAGR based on past data. ED-Goa doesn't envisage any
growth in this category at present However since these categories are minor categories and ED Goa doesn't envisage any growth in these categories and hence ED Goa considers a growth rate of 0% for both the categories.
Sr.No
Consumer CategoryActual Audited Provisional Actual Growth Calculation
FY09-10 FY10-11 FY11-12 FY12-13 FY13-14 FY14-15 4 Year CAGR
5 Year CAGR
6 Year CAGR
GrowthAssumed
7 Tariff-LTAG/Agriculture 11 12 10 18 21 24 34% 18% 17% 0%
8 Tariff-LTPL/Public Lighting 31 33 31 16 29 37 6% 3% 3% 0%
6.4.9 HTI/ Industrial: HTI/ Industrial category is formed by the merging of HT Mixed, HT
Industrial, EHTI Industrial, HT Hotel Industries, HT Public Water Works, HT High Tech Industries and HT Ice Manufacturing. The CAGR calculated for these categories are shown in the table below.
Sr.No
Consumer CategoryActual Audited Provisional Actual Growth Calculation
FY09-10 FY10-11 FY11-12 FY12-13 FY13-14 FY14-154 Year CAGR
5 Year CAGR
6 Year CAGR
GrowthAssumed
10 HTl/lndustrial 791 850 1,014 1,056 1,084 1,271 8% 22% 27% 10%
The detailed sales for the category as per previous categories are shown in the below table.
Electricity Department-Goa Page 69

Business Plan for the Control Period FY 2016-17 to FY 2018-19
Sr.No
Consumer CategoryActual Audited Provisional Actual Growth Calculation
FY09-10 FY10-11 FY11-12 FY12-13 FY13-14 FY14-15 4 Year CAGR
5 Year CAGR
6 Year CAGR
GrowthAssumed
9 HT-Mixed 104 110 145 211 113 217 14% 18% 16% 16%
Sr.No
Consumer CategoryActual Audited Provisional Actual Growth Calculation
FY09-10 FY10-11 FY11-12 FY12-13 FY13-14 FY14-15 4 Year CAGR
5 Year CAGR
6 Year CAGR
GrowthAssumed
10 HTI-lndustrial 439 474 577 560 550 578 0% 5% 6% 5%
Sr.No
Consumer CategoryActual Audited Provisional Actual Growth Calculation
FY09-10 FY10-11 FY11-12 FY12-13 FY13-14 FY14-154 Year CAGR
5 Year CAGR
6 Year CAGR
GrowthAssumed
11 HT1 Hotel Industries - - - 52 120 134 0% 0% 0% 5%
Sr.No
Consumer CategoryActual Audited Provisional Actual Growth Calculation
FY09-10 FY10-11 FY11-12 FY12-13 FY13-14 FY14-15 4 Year CAGR
5 Year CAGR
6 Year CAGR
GrowthAssumed
12 EHT1 Industrial 134 144 169 113 143 179 2% 6% 6% 0%
Sr.No
Consumer CategoryActual Audited Provisional Actual Growth Calculation
FY09-10 FY10-11 FY11-12 FY12-13 FY13-14 FY14-15 4 Year CAGR
5 Year CAGR
6 Year CAGR
GrowthAssumed
13 HT Industries (IT High Tech).
1 1 5 7 18 22 65% 114% 87% 0%
Sr.No
Consumer CategoryActual Audited Provisional Actual Growth Calculation
FY09-10 FY10-11 FY11-12 FY12-13 FY13-14 FY14-15 4 Year CAGR
5 Year CAGR
6 Year CAGR
GrowthAssumed
14HT-Public Water Supplyand Sewage
114 120 117 113 140 138 6% 4% 4% 4%
Sr.No
Consumer CategoryActual Audited Provisional Actual Growth Calculation
FY09-10 FY10-11 FY11-12 FY12-13 FY13-14 FY14-15 4 Year CAGR
5 Year CAGR
6 Year CAGR
GrowthAssumed
15 HT-lce Manufacturing - - 1 0 1 1 13% 0% 0% 0%
6.4.10 As seen from the above table, HT Mixed has an increasing growth in the past six years, whereas HT-Industrial, EHT-Industrial and HT-Public W ater Supply have shown a steady growth rate in the past years. Since these are the categories that majorly contribute to the newly merged HT-Industrial Category, growth rate of only these categories are considered for arriving at HT Industrial growth. An increase of 10% is
considered for the merged HTI-Industry Category.
6.4.11 HT Industrial (Ferro Metallurgical/Steel melting/Power Intensive): HT Industrial (Ferro Metallurgical/Steel Melting/Power Intensive), sales have shown a mixed trend and therefore a growth of 2% is assumed considering growth in recent years.
Sr.No
Consumer CategoryActual Audited Provisional Actual Growth Calculation
FY09-10 FY10-11 FY11-12 FY12-13 FY13-14 FY14-15 4 Year CAGR
5 Year CAGR
6 Year CAGR
GrowthAssumed
16H.T.Industrial (Ferro Metallurgical/Steel Melting/Power Intensive)
505 546 480 554 528 484 0% -3% -1% 2%
Electricity Department-Goa Page 70

Business Plan for the Control Period FY 2016-17 to FY 2018-19
6.4.12 HTAG/Agriculture: HTAG/Agriculture consumers are very few and haven't increased in last six years. Hence NIL growth has been assumed for this category.
Sr.No
Consumer CategoryActual Audited Provisional Actual Growth Calculation
FY09-10 FY 10-11 FY11-12 FY12-13 FY13-14 FY14-154 Year CAGR
5 Year CAGR
6 Year CAGR
GrowthAssumed
17 Tariff-HTAG/Agriculture 5 5 4 8 6 6 15% 3% 5% 0%
6.4.13 HT MES/Defence Establishments: For HT MES/Defense Establishment, there has been a mixed trend of decrease in sales over past three year. Hence, NIL growth has been assumed.
Sr.No
Consumer CategoryActual Audited Provisional Actual Growth Calculation
FY09-10 FY 10-11 FY11-12 FY 12-13 FY13-14 FY14-15 4 Year CAGR
5 Year CAGR
6 Year CAGR
GrowthAssumed
18 H.T. MES/Defence Establishments
27 29 40 35 26 27 12% 2% 0% 0%
6.4.14 HT Industrial (Steel Rolling): For HT Industrial Steel Rolling which is now merged with Ferro, growth has been assumed observing positive CAGR in last 4 years.
Sr.No
Consumer CategoryActual Audited Provisional Actual Growth Calculation
FY09-10 FY10-11 FY11-12 FY12-13 FY13-14 FY14-154 Year CAGR
5 Year CAGR
6 Year CAGR
GrowthAssumed
19H.T. Industrial (Steel
Rolling)1,459 1,571 1,585 1,711 1,699 56 6% -21% -16% 1%
6.4.15 Tem porary Consumers, LT Hoarding/Sign Board: For Temporary Consumers, a mixed trend is observed in past sales data. Also, growth of temporary activities cannot be predicted. Hence, to be on conservative side, 0% CAGR has been assumed. LT Hoarding/Sign board has been introduced from FY 14-15 and since past data is not
available, NIL growth is assumed.
Sr.No
Consumer CategoryActual Audited Provisional Actual Growth Calculation
FY09-10 FY10-11 FY11-12 FY12-13 FY13-14 FY14-15 4 Year CAGR
5 Year CAGR
6 Year CAGR
GrowthAssumed
20 LT Temporary 13 15 14 14 15 22 16% 10% 11% 0%
Sr.No
Consumer CategoryActual Audited Provisional Actual Growth Calculation
FY09-10 FY10-11 FY11-12 FY12-13 FY13-14 FY14-15 4 Year CAGR
5 Year CAGR
6 Year CAGR
GrowthAssumed
21 HTTemporary - - - 1 0 - 0% 0% 0% 0%
Sr.No
Consumer CategoryActual Audited Provisional Actual Growth Calculation
FY09-10 FY10-11 FY11-12 FY12-13 FY13-14 FY14-15 4 Year CAGR
5 Year CAGR
6 Year CAGR
GrowthAssumed
22 Hoarding/Sign Board - - - - - - 0% 0% 0% 0%
Electricity Department-Goa Page 71

Business Plan for the Control Period FY 2016-17 to FY 2018-19
6.4.16 The following table shows the CAGR of sales for past four, five and six years for each
category of consumers starting from provisional actual numbers of FY 2013-14 and beyond and the growth rate which is considered for projection sales for the entire control period.
Table 14:CAGR for Sales Calculated and Considered for Control Period
Sr. No Consumer Category
Growth Calculation
4 Year CAGR
5 Year CAGR
6 Year CAGR
GrowthAssumed
LT Supply
1 (a)T a r i f f LT D /D o m e s tic a n d N o n - C o m m .
5% 3% 4 % 5%
1 (b) T a r i f f LTD /Low In c o m e G ro u p 14% -5 % -3 % 0%
1 (c) T a r i f f LT D /D o m e s tic M ix e d 159% 90% 64% 10%
2 T a r i f f -L T C /C o m m e rc i a l 0% 0% 0% 0%
3 T a r i f f L T I/ In d u s try 0% 0% 0% 0%
4T a r if f -L T P / M ix e d (H o te l In d u s tr i es )
2 5% 22% 20% 10%
5 T a r if f -L T A G / A g r ic u ltu r e 4 3 % 19% 17% 0%
6 T a r if f -L T P L / P u b lic L ig h tin g -4 % -4 % -2 % 0 %
Temporary Supply7 T a r if f -L T / T e m p o ra ry 3% -1 % 3% 0%
8 T a r i f f -H T / T e m p o ra ry 0% 0% 0% 0%
9 H o a rd in g / S ig n B o a rd 0% 0% 0% 0%
HT Supply10 H T I/ In d u s tr ia l 8% 22% 27% 0%
11H .T .In d u s tr ia l (F e rro M e t ta l lu r g ic a l/ Steel M e lt in g / P o w e r In te n s iv e )
5% -1 % 1% 2%
12 T a r if f -H T A G / A g r ic u ltu re 21% 3% 5% 0%
13H.T. M ES/D efen ce E s ta b lis h m e n ts
-1 9 % -3 % -1 % 0%
14 H T C o m m e rc ia l 0% 0% 0% 0%
15 H T D o m e s tic 0% 0% 0% 0%
6.4.17 The table below shows the category wise sales for FY 2016-17 to FY 2018-19 as projected based on assumed growth rate applied on estimated FY 2014-15 sales.
Electricity Department-Goa Page 72

Business Plan for the Control Period FY 2016-17 to FY 2018-19
Table 15: Category wise sales Projection for FY 2016-17 to FY 2018-19
Sales P ro je c tio n fo r M YT
Sr. No Consumer Category Projections
FY16-17 FY17-18 FY 18-19
LT Supply 1,388 1,455 1,525
1(a) T a r if f LTD /D om estic and N on -C om m . 802 842 884
1(b) T a r if f LTD /Low Incom e G rou p 5 5 5
1(c) T a r if f LTD /D om estic M ixed 9 10 11
2 Tariff-LTC /C om m e rc ia l 295 310 325
3 T a r if f LT I/ ln du stry 211 221 232
6 T a riff-LT P /M ixe d (H o te l Industries) 6 6 7
7 T a riff-L T A G / A g ric u ltu re 24 24 24
8 T a r iff -L T P iyP u b lic L igh ting 37 37 37
T e m p o ra ry S up p ly 3 3 3
9 T a riff-L T /T e m p o ra ry 3 3 3
10 T a riff-H T / T e m p o ra ry - - -
11 Hoa rd i ng/Sign Boa rd 0 0 0
H T S up ply 1,946 2,029 2,120
12 H TI/ lndustria l 1,325 1,397 1,476
13H .T .In du stria l (Fe rro M etta llu rg ica l/
Steel M e ltin g/ P o w e r In tensive)588 599 611
14 T a riff-H T A G / A g ric u ltu re 6 6 6
15 H .T. M ES/D efence Establishm ents 27 27 27
T o ta l Sales 3,337 3,488 3,648
6.5 Approach for Consumer Forecast for Control Period
6.5.1 The Petitioner has also projected number of consumers for each category of it on
similar lines that are adopted for projecting sales as mentioned in the above paragraph. Category wise analysis of the Consumers has been carried out in the subsequent paragraph with the Growth occurred in last 4, 5 and 6 years as well as growth assumed for each category based on certain assumptions.
6.6 Consumer Forecast
6.6.1 Domestic Consumers: LT Domestic consumers contribute to approx 80% of the total no. of consumers. Based on the past years consumer data, domestic consumers have shown a steady growth at a CAGR of 2% and therefore 2% growth rate has been assumed for the control period on FY 2015-16 numbers.
Electricity Department-Goa Page 73

Business Plan for the Control Period FY 2016-17 to FY 2018-19
Sr. No Consumer Category Provisional Actual Growth Calculation
FY09-10 FY10-11 FY11-12 FY12-13 FY13-14 FY14-15 4 Year
CAGR
5 Year
CAGR
6 Year
CAGR
Growth
Assumed
1(a) Tariff LTD/Domestic
and Non-Commercial
4,11,399 4,36,331 4,40,198 4,41,189 4,57,131 4,58,897 1% 1% 2% 2%
6.6.2 LTD Low Income Group and LT Domestic M ixed: The number of consumers in the LIG category is not expected to grow as more and more consumers are shifting from this category to LT Domestic category due to increased consumption. Hence, NIL growth is assumed for both these categories.
Sr. No Consumer Category Provisional Actual Growth Calculation
FY09-10 FY10-11 FY11-12 FY12-13 FY13-14 FY14-15 4 Year CAGR
5 Year CAGR
6 Year CAGR
GrowthAssumed
1(b)Tariff LTD/Low Income
Group16,485 17,483 14,200 14,232 11,387 3,049 -40% -35% -29% 0%
1(c)Tariff LTD/Domestic
Mixed46 48 50 50 853 4,399 345% 209% 149% 0%
6.6.3 The no. of consumers for LT Domestic Mixed category shows an abrupt jump from 50 to 853 for FY 2013-14. It is assumed that earlier most of the consumers of LT Domestic Mixed were being booked under LT Domestic, which from FY 2013-14
onwards is being correctly billed under LT Domestic Mixed. Once the audited data is provided, a clear picture will be available. Hence 0% growth rate is considered at present.
6.6.4 LTC-Commercial Consumers: Commercial Consumers constitute 15% of total ED Goa's consumers. Though the past data shows a mixed trend, ED-Goa for all practical purposes has considered CAGR of 2%.
Sr. No Consumer Category Provisional Actual Growth Calculation
FY09-10 FY10-11 FY11-12 FY12-13 FY13-14 FY14-15 4 Year CAGR
5 Year CAGR
6 Year CAGR
GrowthAssumed
2 Tariff-LTC/Commercial 84,253 91,119 94,259 94,471 85,275 85,797 -3% -1% 0% 2%
6.6.5 LTI-Industry: LTI Industry is a new category formed by combining LT Motive Power Consumers, LT Ice Manufacturing, and LT Public W ater Works. There is a negative
growth in this category and therefore growth of only 1% has been assumed for projections considering Reliance area consumers are also now part of the ED-Goa.
Electricity Department-Goa Page 74

Business Plan for the Control Period FY 2016-17 to FY 2018-19
Sr. No Consumer Category Provisional Actual Growth Calculation
FY09-10 FY10-11 FYll-12 FY12-13 FY13-14 FY14-15 4 Year CAGR
5 Year CAGR
6 Year CAGR
GrowthAssumed
3 LTI/I ndustrv 7,455 8,509 10,046 10,116 6,899 6,219 -15% -8% ■A% 1%
6.6.6 LTP Mixed (Hotel Industries): LTP Mixed Hotel Industries consumers have not shown any increase in past years and therefore the actual number of consumers of FY 201415 has been considered for the entire control period.
Sr. No Consumer Category Provisional Actual Growth Calculation
FY09-10 FY10-11 F Y ll-1 2 FY12-13 FY13-14 FY14-15 4 Year
CAGR
5 Year
CAGR
6 Year
CAGR
Growth
Assumed
4
Tariff-LTP/Mixed
(Hotel Industries) 9,711 11,060 11,000 11,025 10,882 10,821 -1% -1% 2% 0%
6.6.7 LTAG/Agriculture, LTPL/Public Lighting: A mix trend of CAGR is observed on past
data, hence NIL growth is assumed for both the categories.
Sr. No Consumer Category Provisional Actual Growth Calculation
FY09-1D FY1D-11 FYll-12 FY12-13 FY13-14 FY14-15 4 Year
CAGR
5 Year
CAGR
6 Year
CAGR
Growth
Assumed
5Tariff-Ll AG/Agriculture 9,711 11,060 11,000 11/125 10,882 10,821 1% 1% 2% 0%
6
lariff LI PL/Public Lighting 7,400 8,000 9,000 9/120 6,450 2,740 33% 23% 18% 0%
6.6.8 HTI/ Industrial: HTI/Industrial Category is newly introduced category by combining different HT categories. A positive trend is witnessed in the number of consumers and therefore a growth rate of 5% is assumed for this category.
Sr. No Consumer Category Provisional Actual Growth Calculation
FY09-1D FY1D-11 F Y ll-1 2 FY12-13 FY13-14 FY14-15 4 Year
CAGR
5 Year
CAGR
6 Year
CAGR
Growth
Assumed
10 Tariff KTl/lndustrial 576 642 659 660 703 744 4% 4% 5% 5%
6.6.9 For all other HT Categories NIL growth rate is assumed due to uneven trend in past data.
6.6.10 Tem porary Consumers, LT Hoarding/Sign Board: For Temporary Consumers there is a mixed trend observed in past data. And therefore growth of temporary activities cannot be predicted. Hence NIL growth assumed. LT Hoarding/Sign board has been
introduced from FY 14-15 and since past data is not available, NIL growth is assumed.
Electricity Department-Goa Page 75
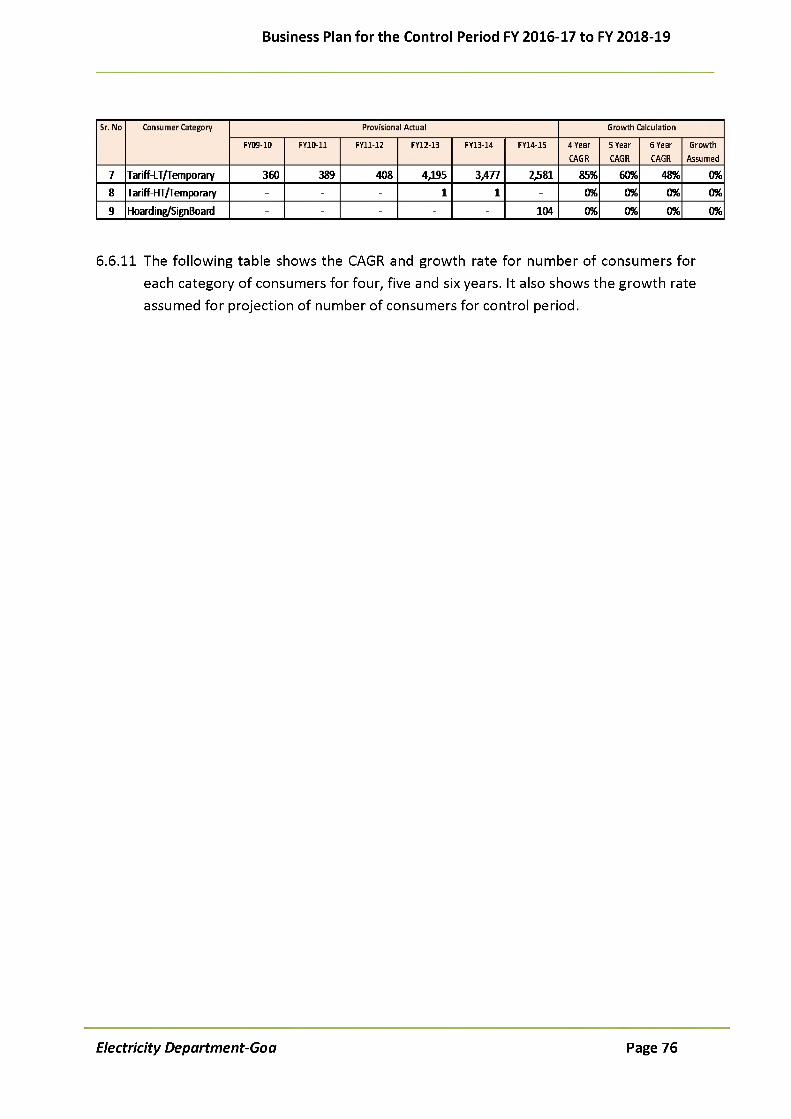
Business Plan for the Control Period FY 2016-17 to FY 2018-19
Sr. No Consumer Category Provisional Actual Growth Calculation
FY09-10 FY1D-11 FYll-12 FY12-13 FY13-14 FY14-15 4 Year
CAGR
5 Year
CAGR
6 Year
CAGR
Growth
Assumed
7 Tariff-LT/Temporary 360 389 408 4,195 3,477 2,581 85% 60% 48% 0%
8 Tariff HT/Temporary - - - 1 1 - 0% 0% 0% 0%
9 Hoarding/Sign Board - - - - - 104 0% 0% 0% 0%
6.6.11 The following table shows the CAGR and growth rate for number of consumers for each category of consumers for four, five and six years. It also shows the growth rate assumed for projection of number of consumers for control period.
Electricity Department-Goa Page 76

Business Plan for the Control Period FY 2016-17 to FY 2018-19
Table 16:CAGR for Consumers calculated and considered for Control Period
Consum er Projection for M YTSr. No Consum er Category Grow th Calculation
3 Year CAG R
4 Year CAG R
5 Year CAG R
Grow thA ssum ed
1(a) T a r if f LTD /D o m e stic and N o n C o m m e rc ia l
2% 2% 3% 2%
1(b) T a r if f LTD /Low In co m e G ro u p -10% -13% -9 % 0%1(c) T a r if f LTD /D o m e stic M ixe d 313% 161% 108% 0%
2 T a riff -L T C / C o m m e rc ia l -5 % -2 % 0% 2%
3 (a) T a r if f -L T P / M o tiv e P o w e r -18% -7 % -2 % 1%3 (b ) T a r iff -L T P / Ice M a n u fa c tu rin g 0% 0% 0% 5%3(a) T a r if f -L T P / M ix e d (H o te l In d u s tr ie s ) 0% 0% 0% 5%
4 T a r if f -L T A G / A g r ic u ltu re -1 % -1 % 3% 0%5 T a riff -L T P L / P u b lic L ig h tin g -15% -7 % -3 % 0%6 T a r if f -L T P W W / P u b lic W a te r W o rk s -8 % -5 % -3 % 0%
7 T a r if f H T -M ix e d -11% -5 % -2 % 0%8(a) T a r if f H T I/ In d u s tria l -3 % 0% 2% 1%8(b) T a r if f H T I/H o te l In d u s tr ie s 0% 56% 0% 1%8(c) T a r if f H TI/Ice M a n u fa c tu rin g 0% 0% 0% 0%
9 H .T .In d u s tria l (F e rro M e tta llu rg ic a l/ S tee l M e lt in g / P o w e r In te n s iv e )
-4 % 0% -1 % 0%
10 T a r if f -H T A G / A g r ic u ltu re -2 % -4 % 0% 0%11 E H T I/ In d u stria l 12% 8% 6% 0%12 H.T. P W / P u b lic W a te r S u p p ly and
S e w a ge3% 2% 2% 2%
13 H.T. M ES /D efen ce E s ta b lish m e n ts 0% 6% 5% 0%14 H.T. In d u s tria l (S te e l R o llin g ) 0% 9% 10% 0%15 T a r if f H T -In d u s tr ie s ( IT H igh Te ch ). 17% 16% 12% 5%
16 Tariff-LT/Temporary 192% 108% 76% 0%17 Tariff-HT/Temporary18 Hoardings and Sign Boards
6.6.12 The table below shows the Category wise number of consumers for FY 2016-17 to FY 2018-19 projected based on assumed growth rate applied on FY 2015-16 consumers.
Electricity Department-Goa Page 77

Business Plan for the Control Period FY 2016-17 to FY 2018-19
Table 17: Category wise Projections of No. of Consumers for FY 2016-17 to FY 2018-19
C o n s u m e rs P r o je c t io n f o r M Y T
S r. N o C o n s u m e r C a te g o r y
F Y 1 6 -1 7 F Y 1 7 -1 8 F Y 1 8 -19
LT S u p p ly 5,94,261 6,05,668 6,17,303
1(a) T a r if f LTD /D om estic and
N on -C om m erc ia l4,77,436 4,86,985 4,96,725
1(b)
T a r if f LTD /Low Incom e
G rou p 3,049 3,049 3,049
1(c) T a r if f LTD /D om estic M ixed4,399 4,399 4,399
2 Tariff-LTC /C om m erc ia l 89,263 91,048 92,869
3 LTI/ ln du stry 6,341 6,403 6,466
4T a riff-LT P /M ixe d (H o te l
Industries)212 222 233
5 T a riff-L T A G /A g ric u ltu re 10,821 10,821 10,821
6 Tariff-LTPL/P ub lic L ighting 2,740 2,740 2,740
T e m p a ra ry S u p p ly 2,600 2,600 2,600
7 T a riff-L T /T e m p o ra ry 2,581 2,581 2,581
8 T a riff-H T / T e m p o ra ry - - -
9 H oarding/Sign Board 19 19 19
H T S u p p ly 835 842 850
10 T a r if f H TI/ lndustria l 758 765 772
11
H .T.Industria l (Fe rro
M etta llu rg ica l/ Steel
M e lting/ P o w e r In tensive)
24 24 24
12 T a riff-H T A G / A g ricu ltu re 41 42 42
13
H.T. M ES/Defence
Establishm ents12 12 12
14
H.T. Industria l (Steel
Rolling)- - -
T o ta l N u m b e r o f
C on sum ers5,97,697 6,09,111 6,20,753
6.7 Approach for Forecast of Connected Load for Control Period
6.7.1 The Petitioner submits that the connected load for the consumer's remains more or less constant. Taking the conservative approach, a CAGR of 0.5% has been considered for LT Domestic and Commercial categories and NIL growth for all other categories. The table below shows the category wise connected load projections on
the basis of CAGR for entire control period.
Electricity Department-Goa Page 78

Business Plan for the Control Period FY 2016-17 to FY 2018-19
Table 18: Category wise Connected Load Projections for FY 2016-17 to FY 2018-19
Sr. No Consum er Category Provisional Actual Approved Projections
FY11-12 FY12-13 FY13-14 FY14-15 FY15-16 GrowthAssumed
FY16-17 FY17-18 FY 18-19
1(a) Tariff LTD/Dom estic and Non-Comm. 6,81,797 10,33,122 10,72,773 11,51,187 11,56,943 0.5% 11,62,728 11,68,541 11,74,3841(b) Tariff LTD/Low Income Group 4,550 1,241 1,820 338 338 0.0% 338 338 3381(c) Tariff LTD/Dom estic Mixed 84 2,074 2,412 13,044 13,044 0.0% 13,044 13,044 13,044
2 Tariff-LTC/Commercial 2,56,810 2,75,155 2,84,983 2,77,352 2,78,739 0.5% 2,80,133 2,81,533 2,82,9413 (a ) Tariff-LTP/M otive Power 3,32,470 1,44,144 1,52,803 1,09,269 1,09,269 0.0% 1,09,269 1,09,269 1,09,2693 (b ) Tariff-LTP/ Ice Manufacturing - 1,924 3,073 2,433 2,433 0.0% 2,433 2,433 2,4333(a) Tariff-LTP/Mixed (Hotel Industries) - 3,363 3,223 4,285 4,285 0.0% 4,285 4,285 4,285
4 Tariff-LTAG/Agriculture 66,250 62,134 66,992 34,481 34,481 0.0% 34,481 34,481 34,4815 Tariff-LTPiyPublic Lighting 12,670 8,450 11,087 9,598 9,598 0.0% 9,598 9,598 9,5986 Tariff-LT PWW/Public W ater Works 12,350 21,313 22,245 3,877 3,877 0.0% 3,877 3,877 3,877
Tota l LT Category 13,66,981 15,52,919 16,21,411 16,05,865 16,13,007 16,20,186 16,27,400 16,34,650
7 Tariff HT-Mixed 72,808 63,017 68,025 75,073 75,073 0.0% 75,073 75,073 75,0738(a) Tariff HTI/lndustrial 2,32,635 2,28,740 2,41,294 2,49,086 2,49,086 0.0% 2,49,086 2,49,086 2,49,0868(b) Tariff HTI/Hotel Industries - 1,18,646 39,080 44,402 44,402 0.0% 44,402 44,402 44,4028(c) Tariff HTI/lce Manufacturing 400 200 364 364 364 0.0% 364 364 364
9 H.T. Industrial (Ferro Mettallurgical/ Steel Melting/ Power Intensive)
99,200 93,200 93,200 94,416 94,416 0.0% 94,416 94,416 94,416
10 Tariff-HTAG/Agriculture 8,450 8,200 8,070 8,378 8,378 0.0% 8,378 8,378 8,37811 EHTI/lndustrial 60,000 64,916 44,500 53,166 53,166 0.0% 53,166 53,166 53,16612 H.T. PW /Public W ater Supply & Sewage 27,080 25,405 29,988 30,885 30,885 0.0% 30,885 30,885 30,885
13 H.T. MES/Defence Establishments 6,675 6,810 7,080 7,080 7,080 0.0% 7,080 7,080 7,08014 H.T. Industrial (Steel Rolling) 20,000 19,250 17,650 20,340 20,340 0.0% 20,340 20,340 20,34015 Tariff HT-lndustries (IT High Tech). 3,188 5,229 5,891 7,004 7,004 0.0% 7,004 7,004 7,004
Total HT Category 5,30,436 6,33,613 5,55,142 5,90,194 5,90,194 5,90,194 5,90,194 5,90,194
C Tem porary Supply 2,620 16,598 9,812 1,098 16,464 1,098 1,098 1,09816 Tariff-LT/Tem porary 2,620 16,597 9,811 1,098 1,098 0.0% 1,098 1,098 1,09817 Tariff-HT/Temporary - 1 1 0 0 - - -
Hoarding / Sign Board 35 35 0.0% 35 35 35Total Connected Load 19,00,037 22,03,131 21,86,365 21,97,156 22,19,665 22,11,477 22,18,692 22,25,942
Electricity Department-Goa Page 79

Business Plan for the Control Period FY 2016-17 to FY 2018-19
6.8 Energy Requirement
6.8.1 The projection for demand has been arrived by grossing up the above consumption projections with distribution loss trajectory proposed by ED-Goa. Considering the optimal distribution loss levels of ED-Goa, it finds it technically difficult to further reduce the transmission and distribution losses. Efforts are being taken to reduce these losses further and with implementation of APDRP schemes it expects results in
control period.
6.8.2 The proposed T&D loss trajectory by ED-Goa for the control period is mentioned below.
Table 19: Distribution Loss Reduction (%) Trajectory for the Control Period
Particulars FY 2016-17 FY 2017-18 FY 2018-19T&D Loss (%) 14% 13.75% 13.5%
6.8.3 The Petitioner requests the Hon'ble Commission to approve the proposed energy balance for the control period based on the above projections.
Table 20: Energy Balance for Control Period
Particulars 2016-17 2017-18 2018-19Metered sales to consumers 3,356 3,507 3,667Distribution Losses (%) 14% 13.75% 13.50%Distribution Losses (MUs) 546 559 572Energy Req. at Goa periphery 3903 4066 4239
Electricity Department-Goa Page 80

Business Plan for the Control Period FY 2016-17 to FY 2018-19
CHAPTER 7. POWER PURCHASE PLAN
7.1 Preamble
7.1.1 ED-Goa has prepared a power purchase plan through which it envisages to source power during the control period. In the previous section, ED-Goa had projected sales and the demand requirement for the State; based on the same power requirement for the control period has been discussed in this chapter.
7.2 Power Purchase Sources
7.2.1 In this section, the Petitioner has projected energy requirement based on the
existing and upcoming sources available to ED-Goa in the next control period. The power required for control period would be met through following sources:
• Central Generating Stations
• Within State Generation (Co-Generation Plants)
• Traders/Open Market/Short Term
7.2.2 Following assumptions have been considered for projecting the quantum of power purchase:
7.3 Share Allocation for CGS Station
7.3.1 The Petitioner has derived share allocation from Central Generating Stations in the
following manner.
7.3.2 Peak and Off Peak Capacity (in MW) for each of the Central Generating Stations (ED- Goa sources its power from) has been taken from REA of WRPC for share allocation dated 24th August 2015.
7.3.3 Weighted average capacity in M W is derived by considering peak capacity for 4
hours and Off Peak capacity for rest of the 20 hours.
7.3.4 Based on Average Capacity in MW, allocation for ED-Goa has been arrived in thisPetition for power purchase projection purpose only.
7.3.5 The following table shows the capacity share allocation for Central Generating Stations considered for projecting quantum of power purchase for the next control period.
Electricity Department-Goa Page 81

Business Plan for the Control Period FY 2016-17 to FY 2018-19
Table 21: Share of CGS from Allocated and Unallocated Capacity (as per power flow)
Name of Plant Capacity(MW)
Peak (MW) Othan than Peak (MW)
Average Capacity
(in MW) *
% Allocation*=a=
Central Generatina Stations
Korba STPS 2,100 212.72 214.36 214.09 10.19%Korba STPS Unit 7 500 5.79 6.56 6.43 1.29%Vindhyachal STPS -1 1,260 37.43 38.90 38.66 3.07%Vindhyachal STPS - II 1,000 13.84 14.94 14.76 1.48%Vindhyachal STPS - III 1,000 11.84 12.94 12.76 1.28%Vindhyachal STPS - IV 1,000 13.78 15.33 15.07 1.51%Sipat STPS Stage-11 1,000 11.75 12.80 12.63 1.26%Sipat STPS Stage-1 1,980 25.10 28.17 27.66 1.40%Kakrapar APS 440 15.67 16.08 16.01 3.64%Tarapur unit 3 & 4 1,080 13.27 14.64 14.41 1.33%Mouda STPS 1,000 13.78 15.33 15.07 1.51%Ratnagiri GPS*** 1,967 - - - 0.00%Kawas GPS 656 12.39 12.39 12.39 1.89%Gaandhar GPS 657 12.65 12.66 12.66 1.93%Ramagundam STPS 2,100 100.00 100.00 100.00 4.76%
500.01 515.10 512.59Source: Allocation dated 24th August 2015
7.3.6 It is submitted to the Hon'ble Commission that the average capacity in M W derived
in the above table has been computed only for the purpose of arriving at % allocation from Central Generating Station in order to project power purchase for the first control period.
7.4 Plant Load Factor for CGS Stations
7.4.1 The Plant Load Factor considered for Central Generating Stations for the first control period has been projected based on the actual PLF of each of the generating stations for the last five years. The Petitioner has considered average of last five years PLF i.e.
from FY 2009-10 to FY 2013-14. The following table shows the actual PLF of Central Generating stations for last five years.
Electricity Department-Goa Page 82

Business Plan for the Control Period FY 2016-17 to FY 2018-19
Table 22: Actual PLF of CGS from FY 2009-10 to FY 2013-14
Name of Plant FY 2009-10 FY 2010-11 FY 2011-12 FY 2012-13 FY 2013-14Korba STPS 97.61% 93.31% 78.95% 90.11% 90.68%Vindhyachal STPS - 1 96.60% 94.59% 90.40% 82.06% 86.93%Vindhyachal STPS - II 96.60% 94.59% 90.40% 82.06% 86.93%Vindhyachal STPS - III 96.60% 94.59% 90.40% 82.06% 86.93%Si pat STPS Stage-II 93.33% 96.53% 93.94% 74.95% 73.43%Kakrapar APS 27.72% 37.54% 98.25% 90.05% 97.37%Tarapurunit 3&4 66.16% 70.88% 75.11% 87.09% 81.98%Kawas GPS 75.87% 67.54% 63.12% 50.47% 24.16%GaandharGPS 78.40% 70.47% 63.80% 60.41% 22.97%Ramagundam STPS 94.81% 90.27% 93.07% 91.26% 86.70%
Source: CEA Monthly reports
7.4.2 In case of new generating stations, normative PLF of 85% has been considered to carry out power purchase projections. The following table shows the PLF that is been considered for the entire control period.
Table 23: PLF considered for the next control period
Name of Plant FY 2016-17 FY 2017-18 FY 2018-19Korba STPS 90.13% 90.13% 90.13%Korba STPS Unit 7 85.00% 85.00% 85.00%Vindhyachal STPS -1 90.12% 90.12% 90.12%Vindhyachal STPS-II 90.12% 90.12% 90.12%Vindhyachal STPS - I I I 90.12% 90.12% 90.12%Vindhyachal STPS - IV 78.03% 78.03% 78.03%Si pat STPS Stage-II 86.44% 86.44% 86.44%Si pat STPS Stage-1 86.44% 86.44% 86.44%Kakrapar APS 95.22% 95.22% 95.22%Tarapurunit 3&4 81.39% 81.39% 81.39%Mouda STPS 85.00% 85.00% 85.00%Kawas GPS 56.23% 56.23% 56.23%GaandharGPS 59.21% 59.21% 59.21%Ramagundam STPS 91.22% 91.22% 91.22%
7.5 Auxilia ry consumption
7.5.1 The Petitioner has considered auxiliary consumption for each of the central generating station as per the revised CERC Tariff Regulations 2014. The following table shows the auxiliary consumption considered for each of the FY of the control
period.
Electricity Department-Goa Page 83

Business Plan for the Control Period FY 2016-17 to FY 2018-19
Table 24: Auxiliary Consumption considered for next control period
Power Plant FY 2016-17 FY 2017-18 FY 2018-19KSTPS 8.50% 8.50% 8.50%VSTPS-I 5.25% 5.25% 5.25%VSTPS-II 5.25% 5.25% 5.25%VSTPS-iil 5.25% 5.25% 5.25%VSTPS-iV 9.00% 9.00% 9.00%KGPP 3.00% 3.00% 3.00%GGPP 3.00% 3.00% 3.00%SIPAT- 1 5.25% 5.25% 5.25%KSTPS-III 9.00% 9.00% 9.00%RSTPS 8.50% 8.50% 8.50%SIPAT- II 5.25% 5.25% 5.25%Mouda 9.00% 9.00% 9.00%KAPS 10.00% 10.00% 10.00%TAPS 10.00% 10.00% 10.00%
7.6 Transmission Losses
7.6.1 The Petitioner has considered transmission losses to the extent of 3.8% for Western Region and 12% for Southern Region. The following table shows the transmission losses that are considered for energy projection.
Table 25: Transmission Losses considered for the next control period
External Losses FY 2016-17 FY 2017-18 FY 2018-19Western Region 3.80% 3.80% 3.80%Southern Region 12.00% 12.00% 12.00%
7.6.2 The Western Region loss of 3.80% has been arrived based on average of actual loss of western region taken on weekly basis for second half of FY 2013-14. The detail
working is shown in the table below.
Electricity Department-Goa Page 84

Business Plan for the Control Period FY 2016-17 to FY 2018-19
Table 26: Average of Weekly Losses for Western Region for H2 of FY 2013-14
Sr.No. Period from - to Loss %1 300913-061013 4.042 071013-131013 3.483 141013-201013 3.564 211013-271013 3.585 281013-031113 3.626 041113-101113 3.967 111113-171113 3.508 181113-241113 3.989 241113-011213 3.9210 021213-081213 4.4011 091213-151213 4.2012 161213-221213 3.8813 231213-291213 3.7814 301213-050114 3.8615 060114-120114 3.9216 130114-190114 3.8617 200114-260114 4.0818 270114-020214 3.7419 030214-090214 3.7620 100214-160214 4.1221 170214-230214 3.5222 240214-020314 3.8023 030314-090314 3.6424 100314-160314 3.6225 170314-230314 3.6426 240314-300314 3.44
Average Losses 3.80Average Losses in % 3.80%
7.6.3 Based on the above assumption power purchase quantum for Central Generating Stations is derived for entire control period.
7.7 Energy Projection w ith in State Generation
7.7.1 ED-Goa has tied up power from three Co-Generating Plants within State namely Goa
Energy Private Limited (GEPL), Goa Sponge and Power Limited (GSPL) and Sesa Sterlite Limited (SSL).
7.7.2 The energy projection from GEPL and GSPL for the entire control period is based on energy estimated to be generated during FY 2014-15. However Sesa Sterlite Limited
(SSL) being a new plant, the net generation is projected based on tied up capacity and normative PLF for the entire control period.
Electricity Department-Goa Page 85

Business Plan for the Control Period FY 2016-17 to FY 2018-19
7.8 Power Purchase from Traders/ Short Term
7.8.1 ED-Goa has issued Letter of Intent for supply of power during FY 2014-15 and FY 2015-16. The projection for energy from traders during FY 2015-16 is made based on these LOI issued during the recent past. The following table shows the energy
projection made for Short Term power purchase based on the month, time and quantum in M W as issued in the LOI.
Table 27: Details of LOI issued by ED-Goa for power purchase for the month of April 2015
Source - Adani No of Days
Time Slots Hours Quantum(MW)
MU's Price(Rs./unit)
Cost(Rs.
Crores)1/4/2015 to 30/4/2015
30.0010:00 to
18:00 8.00 70.00 16.803.64
6.121/4/2015 to 30/4/2015
30.0018:00 to
22:00 4.00 70.00 8.403.64
3.061/4/2015 to 30/4/2015
30.0022:00 to
24:00 2.00 70.00 4.203.64
1.53Total
14.00 29.40 10.70
Table 28: Details of LOI issued by ED-Goa for power purchase for the month of May 2015
Source - PTC No o f
Days
Tim e Slots Hours Quantum
(M W )
M U's Price
(Rs./unit)
Cost (Rs.
C rores)
1/5/2015 to 31/5/2015 31.00 10:00 to 18:00 8.00 70.00 17.36 3.75 6.511/5/2015 to 31/5/2015 31.00 18:00 to 22:00 4.00 100.00 12.40 3.75 4.651/5/2015 to 31/5/2015 31.00 22:00 to 24:00 2.00 50.00 3.10 3.75 1.16
Total 14.00 32.86 12.32
7.8.2 ED-Goa submits that during FY 2016-17, the differential power that is required tomeet the demand is procured from traders. However during FY 2017-18 and FY2018-19, no additional power is needed from traders. It is submitted that during FY
2017-18 and FY 2018-19, merit order dispatch is applied since tied up power is more than sufficient to meet the demand.
7.9 Energy from Solar
7.9.1 ED-Goa has considered solar power from NVVN and Solar Energy Corporation ofIndia (SECI) based on the PPA signed and has already been signed in FY 2014-15. ED- Goa has considered similar energy for the entire control period as that estimated in
FY 2015-16. ED-Goa through this tied up power expects to meet its RPO obligation for solar energy. However in case the RPO is not met through tied up solar power, ED-Goa would be purchasing REC Certificates to the tune of additional units to be
met to satisfy its solar obligation.
Electricity Department-Goa Page 86

Business Plan for the Control Period FY 2016-17 to FY 2018-19
7.9.2 Initiatives by ED-Goa: In order to meet the targets set by MNRE of 100GW solar by2022, there is much emphasis given on roof top solar. The Hon'ble Commission has issued Solar Regulations 2015 in order to promote rooftop solar. In this regards only7 interested private and Govt solar developers have sent proposals, in which only 2
have quote the price of Rs. 8.51 per kWh which is very high. Department is currently studying the proposals and soon, an action plan will be formulated to actively carryon solar rooftop activity.
7.10 Energy from Non-Solar
7.10.1 ED-Goa would be procuring Renewable Energy Certificates/ Non-solar power for meeting the RPO during MYT control period whichever is cheapest and available.
7.10.2 The following table shows the Renewable Purchase Obligation for Solar and Non Solar for ED-Goa and the corresponding REC Certificates to be purchased for the respective years.
Electricity Department-Goa Page 87

Business Plan for the Control Period FY 2016-17 to FY 2018-19
Table 29: Details of RPO Obligation for ED-Goa for entire control period
Sr.No. Description FY 2013-14 FY 2014-15 FY 2015-16 FY 2016-17 FY 2017-18 FY 2018-19
1 Sale w ith in State (M Us) 2,977.29 3,092.18 3,215.23 3,356.45 3,506.75 3,666.94
2 RPO Obligation in (%)
Solar 0.40% 0.60% 0.85% 1.15% 1.50% 2%
Non Solar 2.60% 2.70% 2.70% 2.80% 2.80% 2.80%
3 RPO Obligation in (in M Us)
Solar 11.91 18.55 27.33 38.60 52.60 67.84
Non Solar 77.41 83.49 86.81 93.98 98.19 102.67
4 Shortfall o f RPO Obligation in Past
Years (in M Us)
Solar 19.78 31.69 43.66 33.99 - -Non Solar - 77.41 75.90 31.87 - -
5 Tota l RPO Obligation including
Past Years (in M Us)
Solar 31.69 50.24 70.99 72.59 52.60 67.84
Non Solar 77.41 160.90 162.71 125.85 98.19 102.67
6 RPO Compliance during the year
(in Mus)
Solar - 6.58 27.00 51.06 51.06 51.06
Non Solar - - 10.84 21.68 21.68 21.68
7 Shortfall in RPO Compliance (in
Mus)
Solar 31.69 43.66 43.99 21.53 1.54 16.78
Non Solar 77.41 160.90 151.87 104.17 76.51 80.99
8 REC Certificate Purchase (in Mus)
Solar - 10.00 21.53 1.54 16.78
Non Solar - 85.00 120.00 104.17 76.51 80.99
9 Cum ulative Shortfall in RPO
Compliance (in Mus)
Solar 31.69 43.66 33.99 - - -Non Solar 77.41 75.90 31.87 - - -
10 REC Certificate Price (Rs./Unit)
Solar - 9.30 3.50 3.50 3.50 3.50
Non Solar - 1.50 1.50 1.50 1.50 1.5011 REC Certificate Cost (Rs. Crores)
Solar - - 3.50 7.54 0.54 5.87
Non Solar - 13.03 18.00 15.63 11.48 12.15Total - 13.03 21.50 23.16 12.02 18.02
7.11 Power Purchase Projections
7.11.1 Based on the above assumptions, ED-Goa has considered projection on quantum of power in MU's for FY 2016-17 to FY 2018-19. The following table shows the quantum
of power projected from different sources for the next control period.
Electricity Department-Goa Page 88

Business Plan for the Control Period FY 2016-17 to FY 2018-19
Table 30: Energy Requirement in MU's for the entire control period
Particulars FY 2015-16 FY 2016-17 FY 2017-18 FY 2018-19Central Sector Power StationsNTPC 3,240.85 3,461.07 3,685.36 3,776.17
KSTPS 1,521.14 1,521.14 1,521.14 1,521.14KSTPS-III 32.27 32.27 32.27 32.27VSTPS-1 265.50 265.50 265.50 265.50VSTPS - II 92.55 92.55 92.55 92.55VSTPS -III 77.59 77.59 77.59 77.59VSTPS-IV 72.93 72.93 72.93 72.93KGPP 59.12 59.12 59.12 59.12GGPP 63.56 63.56 63.56 63.56SIPAT-1 150.93 150.93 150.93 150.93RSTPS 731.20 731.20 731.20 731.20SIPAT- II 74.30 74.30 74.30 74.30Mouda 79.44 79.44 46.23 79.44Barh-ll 20.33 40.66 40.66 40.66M ouda II 50.83 101.65 101.65Solapur 71.15 142.30 142.30Lara 1 & II 77.92 155.84 155.84Gadarwara 1 57.60 115.20
NPCIL 248.35 292.26 292.26 292.26KAPS Unit 1 and 2 113.63 113.63 113.63 113.63TAPS Unit 3 and 4 73.54 73.54 73.54 73.54KAPS Unit 3 and 4 61.18 105.08 105.08 105.08
Hydro 10.84 26.01 26.01 43.36N W N L Hydro 10.84 21.68 21.68 21.68Kameng HEP 4.33 4.33 4.33Subansiri (Lower) HEP 17.34
Solar RPO 27.00 51.06 51.06 51.06WWW Solar 10.00 10.00 10.00 10.00Solar Energy Corp. o f India 17.00 41.06 41.06 41.06
Short Term Power (tied-up) 62.26 - - -Trader/Open Market Short Term 171.85 94.88 42.06 112.64Within State GenerationsCO- GENERATION 181.27 181.27 181.27 181.27
Goa Energy Private Limited 122.94 122.94 122.94 122.94Goa Sponge & Power Limited 3.34 3.34 3.34 3.34Sesa Goa Limited 55.00 55.00 55.00 55.00
Total Energy Availablity 3,942.43 4,106.56 4,278.02 4,456.76
Less: PGCIL Losses 192.89 203.71 212.22 217.17Total Energy Availability at Goa
Periphery3,749.54 3,902.85 4,065.80 4,239.59
Electricity Department-Goa Page 89

Business Plan for the Control Period FY 2016-17 to FY 2018-19
CHAPTER 8. CAPITAL EXPENDITURE
8.1 Preamble
8.1.1 Although the ED-Goa has carried out significant improvement in transmission and distribution networks over the last few years, the prevailing infrastructure is insufficient to cater to the present load growth pattern. Hence to meet the increasing demand from HT and LT load and moreover to overcome the constant interruptions, it is absolutely necessary to undertake significant capital expenditure.
The strengthening of the sub-transmission and distribution infrastructure is of utmost importance in order to ensure reliable power supply to the end consumers. The transmission sector new schemes have also been proposed for ensuring flexibility of power supply from the Western Region and Southern Region and having a robust transmission network within the State to take care of future load growth.
Further the network/ infrastructure in some parts of the state is insufficient to carry the required power to the consumers of that area.
8.1.2 The Capital investment plan for the State is needed to improve efficiency and to meet the constant growth in demand of the existing consumers; meet the
requirement of strengthening of the system and to meet the Standards of Performance (SOP) laid down by the Hon'ble Commission. The Capital Investment is essential to undertake following initiatives:
• Improving quality of supply and reduction of interruptions;
• Proactive distribution network planning with viable funding plan;
• Distribution System Loss Reduction;
• Demand Side Management;
• Provide adequate transmission and distribution network to meet the growing load demands and to permit Open Access as per Regulations.
• Measures to improve working (including safety) conditions of employees
8.2 Details of Capital Expenditure
8.2.1 ED-GOA plans to carry out the capital expenditure during the control period for augmentation and expansion of its capacity and to reduce the transmission and
distribution loss in the system. The works to be carried out are with an intention to maintain a reliable and efficient system.
Electricity Department-Goa Page 90

Business Plan for the Control Period FY 2016-17 to FY 2018-19
8.2.2 The major capital expenditure schemes being executed by ED-Goa are as follows:
o EHV New Transmission/Sub-Station/Capacitor banks
o RAPDRP Part A
o RAPDRP Part B/IPDS
o Underground cabling scheme
o Infrastructure development through Electricity Duty (Plan)
o Schedule Tribe Development Scheme
o Erection and Augmentation of 33/11 kV S/S & Lines
o Normal Development Schemes
o Renovation and Improvement Schemes
o Strengthening of 220 KV Transmission Network
o Erection of 220/110/33/11 KV Sub-Station at Verna (New)
o Erection of 220 KV line from Ponda-Verna-Xeldem
o APDRP (State Schemes)
o Construction of Staff Quarters and Office Buildings etc
8.2.3 The following are the proposed capital expenditure to be carried out in the control period.
Electricity Department-Goa Page 91

Business Plan for the Control Period FY 2015-16 to FY 2017-18
Table 31: Proposed Capital Expenditure for Control Period (Rs.Crore)
Name of schemeEstimated Cost
(Rs.Crs)
Expediture incurred till FY
2014-15FY 2015-16 FY 2015-16 FY 2016-17 FY 2017-18 FY 2018-19
Actual Projection Revised Projection Projection Projection
1 2 8 9 10 11 12Scheduled castes developm ent scheme(P) 1.57 - - 0.07 0.50 0.50 0.50Schedule Tribe Developm ent Scheme (P) 263.58 128.58 30.00 45.00 30.00 30.00 30.00M achinery and Equipments (Plan) M oto r Vehicles 0.83 0.83
Infrastructure developm ent through Electricity D uty (Plan) 705.00 - 130.00 130.00 140.00 150.00 150.00Erection and Augm entation o f 33/11 KV S/S line (Plan) 26.00 20.00 3.00 3.00 1.00 1.00 1.00Normal Developm ent Schemes (Plan) 95.82 32.68 16.00 16.00 18.00 20.00 20.00System Im provem ent Schemes (Plan) 15.21 5.21 1.00 4.00 2.00 2.00 2.00Construction o f staff quarters and office buildings (Plan) 9.89 2.73 2.00 2.00 2.00 2.00 2.00Erection o f 220/33 KV 1X50 M V A Sub Station a t Cuncolim 72.74 59.74 1.00 13.00 - - -
Erection o f 220 KV line from Xeldem to Cuncolim 15.87 9.87 6.00 6.00 - - -
Strengthening o f 220 KV Transmission Network 11.85 9.85 1.00 1.00 1.00 - -
Erection o f 220/33KV, 1x50 M V A Sub Station Xeldem 0.14 0.14 - - - - -
Accelerated Power Developm ent Reforms Programm e 0.06 0.06 - - - - -
Erection o f 2nd 100 M VA transfom er at Xeldem 220/110 KV S/S 0.28 - 0.28 - -
Erection o f 220/110/33/11 KV Sub Station a t Verna (New) 90.00 - 20.00 9.00 40.00 30.00 11.00
Erection o f 220 KV line from Ponda-Verna-Xeldem 40.00 10.00 4.00 20.00 10.00 6.00APDRP(State Schemes) 86.00 82.00 6.00 4.00 - - -
Restructured Accelerated Power Developm ent and Reforms Programme Part A
136.73 2.16 70.00 100.00 34.57 - -
Research training and human research developm ent 0.07 0.07 - - - -
Underground Cabling 247.63 19.63 70.00 38.00 40.00 50.00 100.00(R APDRP) during Eleventh Plan period - - - -
Public Lighting Scheme 4.68 0.68 1.00 1.00 1.00 1.00 1.00R-APDRP Part B /IP D S 1,600.00 - 300.00 200.00 400.00 500.00 400.00
EHV new Transmission / Sub-Station / Capacitor banks schemes 800.00 - 150.00 50.00 200.00 250.00 300.00
Total 4,223.95 374.23 817.00 626.35 930.07 1,046.50 1,023.50
Electricity Department-Goa Page 92
Business Plan for the Control Period FY 2016-17 to FY 2018-19
8.2.4 As seen from the ta ble, majority of the capital expenditure is diverted towards establishment of new substations and system strengthening. Also significant amount
of capital expenditure is towards renovation and modernization / augmentation of system capacity under IPDS / DDUGJY (R-APDRP Part B subsumed into these schemes).New EHV schemes have also been planned for having a robust transmission network. The proposed capital expenditure will definitely be helpful to achieve the loss targets set by ED-GOA in its distribution loss trajectory and to meet
any additional load surging due to increase in demand.
8.2.5 This section discusses the scheme wise capital expenditure and funding of the same to be carried out by ED-GOA for the MYT control period. Capital Expenditure Schemes other than Electricity Duty Fund are funded through the internal reserves/
equity contribution from Government of Goa or from the Electricity Duty fund. However for R-APDRP schemes there is a loan being facilitated by Power Finance Corporation (PFC) which will later on get converted to grant upon timely completion of projects and as per the terms and conditions laid down in the agreement.
8.2.6 ED-Goa has discussed below the benefits/ need for undertaking the major types of
capital expenditure schemes, However regarding the cost benefit analysis as directed by the commission, The electricity department Goa submits that, Department is not maintaining any monetary appraisal systems such as the cost benefit analysis for the capital expenditure in the license area for improving the system in terms of performance and reliability. However, as per the directive of the commission via
letter dated 6th July, 2015 (Ref: 50/43/2013-JERC/1607) the Electricity Department Goa is planning to undertake and adopt a systematic approach in capital investment proposals with the help of cost benefit analysis.
EXISTING SCHEMES:
8.2.7 Normal Development Scheme - The Scheme is for extending the HT and LT network and providing distribution transformer centres and releasing of service connections to all categories of consumers. The laying of underground cable for releasing
connection to major consumers are also taken up. Electrification of upcoming hamlets are also taken up. The works are summarised as follows:
1. Extension of 33 KV, 11 KV and LT lines for arranging power supply to individual
and group of consumers;
2. Erection of Transformer centres, metering structure, equipment for releasing of
power supply to the intending consumers;
Electricity Department-Goa Page 93

Business Plan for the Control Period FY 2016-17 to FY 2018-19
3. Releasing of power supply and providing of metering to the intending consumers at different voltage levels.
8.2.8 Benefits arising after Execution:
• Normal Development Schemes are generally undertaken for new consumers; releasing supply connections to them.
• In order to ensure timely connection release to the new intending consumers, ED - Goa undertakes such schemes so that power supply can be commenced without any delay and ensuring customer satisfaction. Such schemes will also ensure that ED - Goa complies with Standard of Performance as laid down by the Hon'ble Commission and compliance to the provisions of Electricity Act 2003.
8.2.9 Renovation and Improvement Scheme - This System improvement scheme / Renovation and improvement Scheme is basically for the change of conductors, cross arms, insulators, metal parts & stay sets, etc. The conversion of LT line from 1 phase to 3 phase is also carried out under this scheme for improving the voltage
profile, also enhancing the capacities of the distribution transformer centres and providing new transformer centres at load centre is taken up under this scheme. In Goa, much of the conductors/poles etc have put in more than 25-30 years of service in the system and thus have become prone to interruptions due to overloading and corrosion of the metal parts. Renovation of the old lines is essential to be carried out
in the State to ensure reliability of power supply to the end consumers and avoid electrical accidents and to meet the Standard of Performance in terms of Reliability of Power Supply.
8.2.10 The ongoing works and other sanctioned works will soon be completed. During the
control period 2015-18, there will be drastic reduction in capital expenditure towards this scheme, since most of the works of this nature have been proposed under the IPDS / DDUGJY scheme of the Central Government wherein grants are given, subject to fulfilment of conditionality.
• Following are the benefits of the scheme:
• To improve voltage at the tail end of each distribution system.
• Better power transformation.
• Line losses reduction.
• Less electrical accidents and breakdowns.
• Avoiding overloading of transformers and lines.
• Meet the standards of Performance laid down by the Hon'ble Commission.
Electricity Department-Goa Page 94

Business Plan for the Control Period FY 2016-17 to FY 2018-19
Benefits arising after Exe cution:
• Renovation and Improvement Schemes are generally undertaken to maintain the distribution network so that breakdowns are avoided and more reliable /uninterrupted services/ supply is available to the consumers
• Such schemes will also ensure that ED - Goa complies with Standard of Performance as laid down by the Hon'ble Commission and compliance to the provisions of Electricity Act 2003.
8.2.11 Construction of Staff Quarters and Office Buildings etc - Under this scheme the construction of new office buildings/ extensions to existing buildings at various places and construction of staff quarters and repairs to existing quarters involving
capital expenditure, taking up a number of works for enhancing the facilities at the quarters etc are carried out by the Civil Division No. XV attached to the Electricity Department. The new office building at Bicholim will be taken up and completed.
Benefits arising after Execution
• New office buildings are proposed in order that the different offices of a Division are housed in a single building which otherwise would often be housed in other rented places.
• Construction of Staff Quarters and Office Buildings is to facilitate the availability
of staff within premises of the Head Quarters for immediate reporting to duty in case of emergencies. Often such offices/quarters are constructed near the Substations.
8.2.12 Schedule Tribe Development Scheme - This scheme is basically for execution of works for the benefit of the Scheduled Tribe population. Works in the areas predominantly inhabited by tribal population are carried out under this scheme. Conversion of O/H HT network to underground cabling in Loutolim constituency,
Conversion of O/H LT network to underground cabling in Raia, Loutolim; Conversion of O/H LT network to underground cabling in Nuvem, Verna etc. which are under execution will be completed. Similarly the conversion of the HT network in Canacona constituency taken up for execution during last year will also be completed in the control period. New works will also be taken up.
8.2.13 This proposed expenditure for this scheme is not mentioned in the above table, as the expenditure for the scheme is not planned as of now, we have requested the
divisions to send proposals regarding the need of the new infrastructure to be constructed in their respective areas by studying at ground level and we have
Electricity Department-Goa Page 95
Business Plan for the Control Period FY 2016-17 to FY 2018-19
received few proposals. We will intimate the same to the commission, once we are ready with the finalized proposals and cost estimates for the same.
8.2.14 Benefits arising after Execution
• This scheme is mainly to facilitate the better power services for those areas where the tribal population accounts for 40% and above of the total population
of that area.
• This will facilitate the development of the area which in turn will ensure the
reliability of power supply to consumers of that area. The scheme is also mandatory in accordance with Govt. of India/ Planning Commission directives.
8.2.15 Erection and Augmentation of 33/11 kV S/S & Lines - This scheme is basically for establishment of new 33/11 KV Sub-Stations in the load areas alongwith the 33 KV line linking this Station, and augmentation of capacities at the existing Sub-Stations. The new Substation at IT Park Dona Paula under execution will be completed. Other works such as renovation of the Sub-Stations at various places will also be
completed.
Benefits arising after Execution
• Initially, the power supply to the consumers in above areas was fed power from other sub-stations & lines which were far away. The length of the feeders was too long resulting into increase in losses and frequent interruptions.
• These schemes are mainly meant for reliability of power supply, bifurcation of feeder length thereby reduction in interruptions and improvement in reliability, better voltage profile and loss reduction.
• Such schemes will also ensure that ED - Goa complies with Standard of Performance as laid down by the Hon'ble Commission and compliance to the
provisions of Electricity Act 2003.
8.2.16 Erection of 220/33 KV 1X50 M VA Sub- Station at Cuncolim - The Xeldem
220/110/33 kV Sub-Station was feeding Salcette, Quepem, Sanguem & Canacona talukas. There was tremendous demand for Power in the surrounding areas including Cuncolim Industrial Estate. Hence the Department had undertaken the above said sub-station at Cuncolim amounting to Rs. 67.03 Crores out of which Rs 57.74 Crores has been capitalized, along with 220KV link line from Xeldem to
Cuncolim for an amount of Rs.8.68 Crores out of which 5.87 crore has been capitalized and only the balance payments have to be effected.
Electricity Department-Goa Page 96

Business Plan for the Control Period FY 2016-17 to FY 2018-19
Benefits arising after Execution
• The total anticipated load of 150MVA will be catered by the 220KV schemes.
• The existing 33/11kV sub-stations viz Cuncolim, Canacona, Benaulim, Velim etc.
and Ramada feeder which were presently fed from Xeldem Sub Station are being fed from Cuncolim Sub-Station there by increasing the Reliability of Power Supply and rendering a better Voltage profile thereby increasing the life of Power equipments.
• The Cuncolim Sub-Station will also help to feed Alternate Power Supply to Margao town.
• The Existing Xeldem Sub Station has a relief of more than 50MVA after commissioning of these projects.
• The Cuncolim Sub Station will also reduce pressure on Xeldem Sub Station and increase availability of power supply to 110KV EHV Consumers to meet the load
growth.
• The relief obtained on commissioning of the Cuncolim Station can be diverted to
the 110/33KV Sub-Station at Verna which will have a standby/Alternate Power supply in the event of failure of 110KV feeder fed from Ponda Sub Station.
• About 40-50MW power can be back fed to KPTCL & MSEB in case of their
requirement.
• Interstate trading of power will be more feasible after commencing of this sub
station thereby boosting the revenue of this Government i.e. power from self generation can be wheeled out of the state.
8.2.17 Infrastructure Development through Electricity Duty - Government of Goa hasissued notification on 28th May 2008 for collection of Electricity Duty from various consumer categories at various notified rates. Further the notification also provides that the duty amount such collected shall be transferred to separate reserve/ fund
account for creation of required transmission & distribution infrastructure development for the State of Goa. There are various works being carried out under this scheme upon recommendation and approval of the Technical Advisory Committee. Since the assets are created from the ED Fund, the costs such as Depreciation, Interest on Loan and return on Equity are not claimed in APR and MYT.
More emphasis was laid for linking major 33 KV Sub-Stations from 110 KV SubStations with 33 KV underground cable link. This ensures reliability in power supply. Augmentation of Sub-Station capacities was also undertaken.
8.2.18 The list of works/Schemes sanctioned under Infrastructure Development from Electricity Duty is shown below:
Electricity Department-Goa Page 97

Business Plan for the Control Period FY 2016-17 to FY 2018-19
Table 32: Works taken up under Infrastructure development from Electricity Duty
Sr.No. Name of Work
Total Cost of Work (Rs.
Lakhs)Status of work
1
Estimate for supply and laying of 33 KV, 3C x 400 sq. mm cable and supply,erection ,testing and commissioning of cable accessories for 33kV DC UG cables from Amona s/s to Kundaim s/s alongwith associated switchgear bus extension and bay arrangements.
1706.00Estimate revised reducing the scope of work to be tendered.
2 Estimate for R & M of 220KV line from Ambewadi to Ponda 302.31 Work almost
completed.
3 Estimate for erection of new 100MVA Power transformer at Ponda. 857.99 Work completed.
4Estimate for replaciong the existing HV/LV incomer BHEL make MOCB with SF6 breakers of 100 MVA at Ponda.
79.71 Work completed
5 Estimate for R & M of 220KV Tillari Ponda & Kolhapur Ponda line
194.18 Work almost completed.
6Estimate for augmentation of 33/11KV Velim substation from 1x6.3MVA to 2x6.3MVA. 226.95 Work completed.
7Estimate for upgradation of existing infrastructure and improving of flexibility at 33/11kV Sub-Stations under jurisdiction of Div-IV, Margao.
350.33 Work completed.
8
Estimate for augmentation of 33/11KV Majorda/Utorda Sub-Station from 1 x 6.3MVA to 16.3MVA by installing additional 10MVA Power transformer.
267.40 Not taken up.
9
Estimate for laying of underground cables for 33KV double circuit feeder from Xeldem substation to Aquem substation in Margao along with the associated switchgear and bay arrangements.
2047.51 Work completed.
10Estimate for SETC of 33KV D/C U.G. cables from Xeldem s/s to Cuncolim 33/11 KV s/s along with associated switch gear and bay arrangements.
1563.31 Work completed.
11
Estimate for SETC of cable and accessories for 33KV D/C U.G. cables from Ponda s/s to Fatorda s/s via Raia s/s in Goa along with associated switch gear and bay arrangement.
2140.18 Work completed.
Electricity Department-Goa Page 98

Business Plan for the Control Period FY 2016-17 to FY 2018-19
12
Estimate for supply, erection, testing and commissioning of cable and accessories for 33KV Double circuit under ground cable from Verna substation to Montehill sub-station in Goa alongwith the associated switchgear and bay arrangements.
2043.4770% work completed. PWD approval for road cutting involved.
13Estimate for S,E,T & C of 2nd 6.3MVA Power transformers alongwith associated equipment at 33/11KV Carmona s/s.
123.66 No taken up.
14Estimate for S,E,T & C of 2nd 6.3MVA Power transformers alongwith associated equipment at 33/11KV Nessai s/s.
169.17 Work completed Departmentally.
15Estimate for augmentation of transformer capacity from 2 x 6.3MVA to 2 x 10MVA Power transformer of 33/11KV Cuncolim s/s
259.34 Not taken up.
16
Estimate for supply & erection of cable and accessories for 33KV underground cable for providing 33KV link lines from 220/33KV Cuncolim sub-station to the existing 33KV feeders running via 33/11KV Cuncolim sub-station.
833.00 Not taken up.
17Estimate for S,E,T & C involving enhancement of the 2 x6.3MVA to 2 x 10MVA Power transformers at 33/11KV Fatorda s/s.
333.46 Work completed Departmentally.
18Estimate for laying of 33KV 3 core x 240sq.mm XLPE armoured underground cable from 1 x 6.3MVA Sanquelim ss to Bhupial 4 pole structure.
264.55 Work Completed
19 Estimate for providing of underground 33KV XLPE cable from Virdi to Sankhali Sub-Station. 303.24 Work Completed
20Estimate for augmentation of capacity of the 33/11KV sub-station at Valpoi from 1 x 6.3MVA to 2 x 6.3MVA.
331.76Work completed Departmentally.
21 Estimate for augmentation of 33/11kV Sub-Station at Bicholim. 102.87 Work Completed
22 Estimate for laying of 11KV XLPE ug cable 3 c x 240sq.mm for Bicholim Industrial Estate 87.62 Work completed.
Electricity Department-Goa Page 99

Business Plan for the Control Period FY 2016-17 to FY 2018-19
23
Estimate for augmentation of 33/11 KV, 4 x 6.3 MVA Sub-Station to (3 x 10 MVA + 6.3 MVA) by introducing 3 nos. of 10 MVA power transformers alongwith its associated equipments at 33/11 KV Sub-Station at Mapusa, Bardez-Goa.
438.34 Work completed.
24
Estimate for laying of underground cable 33KV D/C feeder using XLPE 3 core 400 mm2 cable from 110/33KV Tivim Substation to 33/11KV 4x6.3MVA Mapusa Substation.
1517.45 Cable supplied. Laying work in progress.
25
Estimate for enhancement of capacity of 33/11kV Sub-Station at Nagoa, Mapusa from (3.15+6.3) MVA to (10 MVA + 6.3 MVA) by supply, erection, testing and commissioning of 10 MVA Power Transformer along with the associated equipments and laying of single circuit 11kV, 3 core x185 sq. mm XLPE cable from Nagoa Sub-Station inorder to bifurcate 11kV Sauthawado feeder and Calangute feeder.
262.38 Work completed.
26 Estimate for replacement of existing S & S make 33KV outdoor VCB's at Porvorim sub-station.
15.30 Work completed.
27
Estimate for renovation of 33KV single circuit Mapusa II line from Mapusa sub- station to 8 pole structure at Sangolda and renovation of 8 pole structure at Sangolda.
86.46 Work completed.
28
Estimate for SETC of 1x10MVA,33/11KV Power transf at 2x 6.3MVA,33/11KV Porvorim ss and laying of 11KV S/C XLPE cable 3 c x 185sq.mm from Porvorim ss inorder to bifurcate 11KV Housing Board ,Torda and Porvorim Bazaar feeder.
386.10 Work completed.
29Estimate for laying of 33KV 3 core 400sq.mm D/C XLPE underground cable from 2 x 6.3MVA Porvorim ss to Assembly Complex at Porvorim in Bardez - Goa.
694.78 Work completed.
30
Estimate for laying of 33KV Double Circuit XLPE cable 3 core x 400mm2 from Tivim Substation to 2x6.3MVA Porvorim Substation at Porvorim under Infrastructure development fund.
2107.36 Work completed.
31Est for augmentation of the capacity of 33/11KV substation at Candolim Bardez Goa with 10MVA Power transformer
195.99 Not taken up.
Electricity Department-Goa Page 100

Business Plan for the Control Period FY 2016-17 to FY 2018-19
32
Est for laying of 11KV underground cable in the tourist belt of Candolim,Sinquerim,Calangute,Arpora and Baga areas in Bardez Taluka and the balance portion of 11KV Alor feeder,Baga feeder I and II,Kamat feeder and Ximer feeder.
708.80 Work completed.
33
Estimate for the work of SETC of 33KV, 3 core x 400sq.mm D/C XLPE U.G. cable alongwith associated equipments from 220/110/33KV Tivim s/s to 33/11KV Nagao s/s and 33/11KV Candolim s/s via 33/11KV Saligao sub-station.
2758.00 Not taken up.
34Estimate for augmentation of 33/11KV sub-station at Pontemol- Curchorem from 2x 6.3MVA to 2 x 10MVA Power transformer in Quepem Taluka.
624.54 Work completed.
35 Estimate for augmentation of 33/11 KV, 1 x 3.15 MVA by 1 x6.3 MVA at Shigao - Collem Sub-Station. 136.32 Work completed.
36Estimate for augmentation of 33/11kV Sub-Station at Waddem in Sanguem Taluka from 1 x 3.15MVA to 1 x 6.3MVA.
129.91 Not taken up.
37Estimate for the upgradation/modernization of MRT laboratories,RT unit, HTMT unit & MRT Vigilance pertaining to Div.VIII MRT,Margao
444.51 Not taken up.
38Estimate for the work of replacement of 6 nos. of 110KV SF6 circuit breakers and 11nos. of 33KV MOCB with spring operated SF6 CB,s at Tivim s/s.
136.27 Not taken up.
39
Estimate for laying of 33 KV 3 core x 400mm2 D/C U/G XLPE armored cable from 220/33KV Ponda s/s to 33/11 KV Kundaim s/s via proposed Ponda colony s/s and Madkaim s/s.
2298.08 Work completed.
40
Estimate for augmentation of the 33/11KV substation at Kundaim from existing capacity of 2 x 6.3MVA to 2 x 10MVA alongwith all the associated switchgear and equipments.
168.70 Work completed.
41Estimate for work of providing 33 KV, 3 core x 400 sq. mm XLPE armoured cable from 110KV Kadamba substation to 33/11KV Kundaim sub-station via Corlim.
1264.00Cable supplied. Laying work in progress.
Electricity Department-Goa Page 101

Business Plan for the Control Period FY 2016-17 to FY 2018-19
42
Estimate for replacement of 33KV 630A 3 pole isolator and providing underground 3 core 300sq.mm XLPE cable for connecting 33KV ZIL and 33KV MES feeders from Sancoale sub-station.
7.41 Work completed.
43Estimate for SETC of two nos. of 33KV 3 core x 400 mm2 underground cable link betweeen Sancoale substation and Majorda Substation.
1188.51 Work almost completed.
44Estimate for laying of 33KV XLPE 3 core x 400mm2 under ground cable from Verna sub-station to Kadamba substation at Vasco.
1839.23 Work completed.
45 Revised estimate for S,E,T& C of 2 x 6.3MVA Power transformer at Bogda s/s. 862.91 30% work completed,
balance in progress.
46Estimate for supply, erection, testing and commissioning of 33KV D/C underground feeders from Verna sub-station to Majorda sub-station.
666.94 Not taken up.
47
Estimate for the work of SETC of 33KV, D/C U.G. cable from Ponda s/s to Verna s/s via Borim bridge and 2 sets of 33KV outgoing/incoming bay at Ponda & Verna s/s .
1739.36 Not taken up.
48 Estimate for erection of 110KV & 33KV SF6 breakers at Verna 55.38 Work completed.
49 Estimate for supply, erection, testing and commissioning of 1x10MVA, sub-station at Verna 293.40 Work completed.
50 Estimate for procurement of 6 nos. of 11KV incomer feeder and 8 nos. of 11KV feeder panel. 80.87 Not taken up.
51Revised Estimate for Design, supply, erection, testing and commissioning of 33/11 KV, 2x10 MVA Gas Insulated Sub-Station at EDC Patto Panaji.
2533.88 Not taken up.
52
Estimate for providing of 33KV D/C 3 core x 400sq.mm XLPE cable from Bicholim sub-station to Amona sub-station alongwith the associated equipments.
1985.23 Work taken up recently.
53Estimate for construction of office building and control room for the augmented 2 x 10MVA EDC substation at Patto Panaji
426.14 Not taken up.
Electricity Department-Goa Page 102

Business Plan for the Control Period FY 2016-17 to FY 2018-19
54
Conversion of 11KV( HT) overhead lines to underground network in the areas of coastal belt and tourism places such as Colva, Benaulim, Varca, Mobor and Cavellosim in Benaulim Constituency
9412.59 50% work completed.
55 Estimate for replacement of 11KV panels at Saligao sub-station. 82.60 Work completed.
56
The work of design, supply, erection, testing and commissioning of one 10 MVA, 33/11KV power transformes for augmentation of 33/11 KV Saligao substation from existing 2 x 6.3 MVA to 22.6 MVA by introducing 10 MVA power transformer along with 33 KV bay and 11 KV outgoing structure and associated equipments
188.95 Work not taken up.
57Estimate for revamping of existing 33/11 KV Substations in the State of Goa. 1188.03 Work to be started.
58
Estimate for laying of 33 KV double circuit XLPE 400 mm2 underground cable from 220/110/33 KV Tivim Sub-Station to 2x6.3 MVA 33/11 KV Pernem SubStation for a distance of 29.6 kms and erection of double bus arrangement with associated equipements, control room at Pernem Sub-Station.
1926.50 Work to be tendered.
59Estimate for supply, erection, testing and commissioning of 33/11 KV sub-station at Marcella Ponda
370.34Land not acquired yet.
60Estimate for work of conversion of HT overhead line to Aerial bunched cable for 11 KV Vasco I feeder from Sancoale 33/11 KV S/S.
317.86 Work not taken up.
61Estimate for work of supply, erection, testing and commissioning of 33/11 KV, 1x6.3 MVA S/S at Sal in Bicholim Taluka.
529.22 Tendering Stage.
62Estimate for supply, erection, testing and commissioning of additional 6.3 MVA power transformer and extension of 1 new 11 KV feeder.
88.59 Work not taken up.
63
Estimate for work of renovation and improvement of Shiroda Bazar by erecting separate 11 KV feeder and change of 11 KV conductor of Borim feeder in Shiroda constituency.
80.39 Work not taken up.
Electricity Department-Goa Page 103
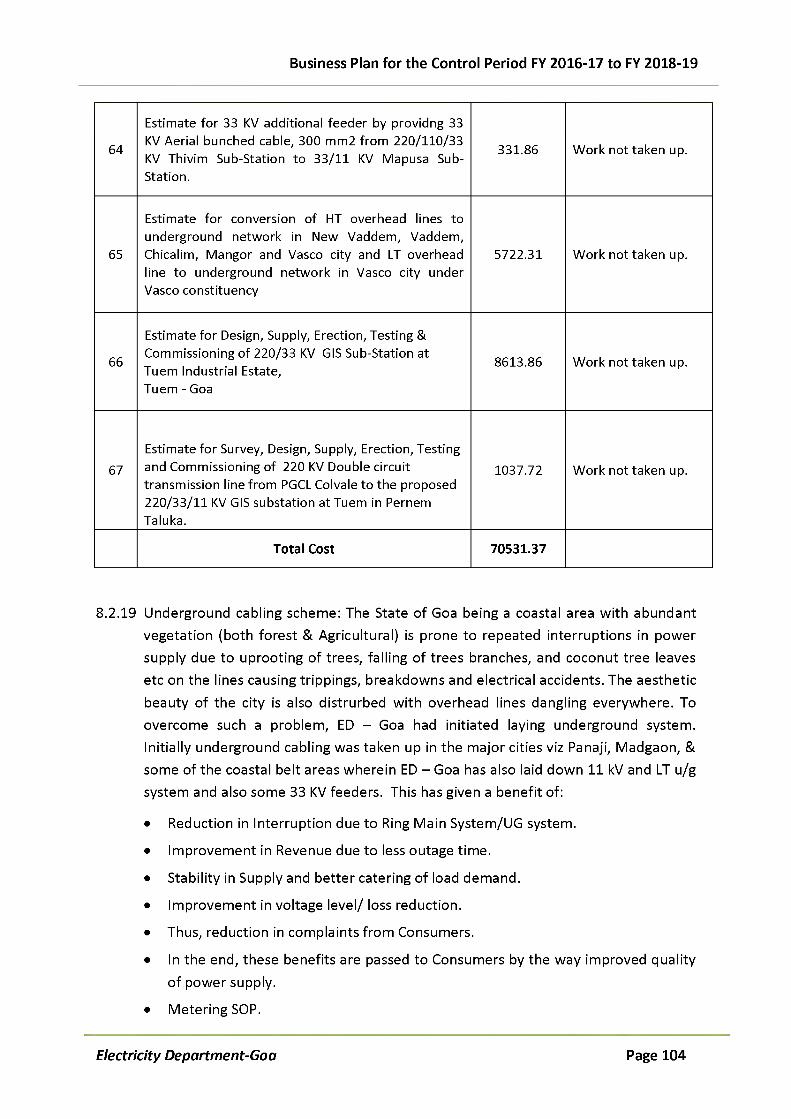
Business Plan for the Control Period FY 2016-17 to FY 2018-19
64
Estimate for 33 KV additional feeder by providng 33 KV Aerial bunched cable, 300 mm2 from 220/110/33 KV Thivim Sub-Station to 33/11 KV Mapusa SubStation.
331.86 Work not taken up.
65
Estimate for conversion of HT overhead lines to underground network in New Vaddem, Vaddem, Chicalim, Mangor and Vasco city and LT overhead line to underground network in Vasco city under Vasco constituency
5722.31 Work not taken up.
66
Estimate for Design, Supply, Erection, Testing & Commissioning of 220/33 KV GIS Sub-Station at Tuem Industrial Estate,Tuem - Goa
8613.86 Work not taken up.
67Estimate for Survey, Design, Supply, Erection, Testing and Commissioning of 220 KV Double circuit transmission line from PGCL Colvale to the proposed 220/33/11 KV GIS substation at Tuem in Pernem Taluka.
1037.72 Work not taken up.
Total Cost 70531.37
8.2.19 Underground cabling scheme: The State of Goa being a coastal area with abundant vegetation (both forest & Agricultural) is prone to repeated interruptions in power supply due to uprooting of trees, falling of trees branches, and coconut tree leaves etc on the lines causing trippings, breakdowns and electrical accidents. The aesthetic
beauty of the city is also distrurbed with overhead lines dangling everywhere. To overcome such a problem, ED - Goa had initiated laying underground system. Initially underground cabling was taken up in the major cities viz Panaji, Madgaon, & some of the coastal belt areas wherein ED - Goa has also laid down 11 kV and LT u/g system and also some 33 KV feeders. This has given a benefit of:
• Reduction in Interruption due to Ring Main System/UG system.
• Improvement in Revenue due to less outage time.
• Stability in Supply and better catering of load demand.
• Improvement in voltage level/ loss reduction.
• Thus, reduction in complaints from Consumers.
• In the end, these benefits are passed to Consumers by the way improved quality
of power supply.
• Metering SOP.
Electricity Department-Goa Page 104

Business Plan for the Control Period FY 2016-17 to FY 2018-19
8.2.20 Under the present underground cabling scheme, conversion of the overhead network to underground cabling has been proposed initially in the cities and coastal areas and then in the hinterland. Accordingly conversion of network has been taken
up in the areas of Bogda, Sada, Baina in Mormugao constituency. Same will be completed during the control period. New sanctioned works in the balance portion of Margao, and the areas of Navelim will be taken up and completed.
8.2.21 APDRP Schemes (State Scheme) - Under these schemes, the works such as Replacement of electromechanical meters with State of art electronic meters,
Conversion from overhead system to underground cabling in the balance areas of Margao Municipal Council etc were being carried out. The works have been completed except for the balance payments to be effected.
NEW SCHEMES IN CONTROL PERIOD:
8.2.22 R-APDRP Schemes/ IPDS/DDUGJY: The Ministry of Power/ Government of India, in its 11th five year plan had launched the Restructured APDRP scheme. The objective of the Restructured APDRP Scheme is to provide quality and reliable power supply to
the consumers and to bring down the AT&C losses.
8.2.23 Restructured Accelerated Power Development and Reforms Programme (R-APDRP) focuses on:
• Actual demonstrable performance in loss reduction;
• Establishment of reliable and automated systems for sustained collection of
accurate base line Data and
• Adoption of information Technology in the areas of Accounting and auditing which will enable objective evaluation of the programme of utility before and after Implementation of the programme
8.2.24 It is a centrally sponsored scheme. Under the programme, the Government of India has sanctioned projects that aim at establishment of reliable and automated systems
for sustained collection of accurate base line data and the adoption of information technology in the area of energy accounting. The Power Finance Corporation has
been nominated as the nodal agency to make the above program operational.
8.2.25 The project is being carried out in two parts:
Electricity Department-Goa Page 105

Business Plan for the Control Period FY 2016-17 to FY 2018-19
PART A : will cover preparation of base-line data for the project area covering consumer indexing, GIS mapping, metering of distribution transformers and feeders and automatic data logging for all distribution transformers and feeders. It will also include adoption of IT applications for meter reading, billing and collection, energy
accounting and auditing.
Status of ED Goa on Part A: ED Goa has entrusted Tata Power Delhi Distribution Limited to carry out the processes and accordingly THE RFP for system integrator has been floated for prospective bidders. The minimum standards fixed for System Integrator is on par with Industry standards. In this regard a pre bid conference has
been done on 25th August, 2015.
8.2.26 The project on pilot basis in Panjim division is expected to roll out by end of 2015. The project is planned to roll out latest by March 31st, 2016 in all the 4 major towns of Goa.
PART B: covers renovation, modernisation and strengthening of 11kV Sub Station and distribution systems.
8.2.27 The scope of works under R-APDRP Part B covers renovation, modernization and strengthening of 11 kV level Substations, Transformers/Transformer Centers, Re- conductoring of lines at 11 kV level and below, Load Bifurcation, feeder separation, load Balancing, HVDS (11 kV), Aerial Bunched Conductoring in dense areas,
replacement of electromagnetic energy meters with tamper proof electronic meters, installation of capacitor banks and mobile service centers etc. In exceptional cases, where sub-transmission system is weak, strengthening at 33 kV or 66 kV levels are also considered.
8.2.28 The Part-B of R-APDRP has been subsumed into IPDS/ DDUGJY, the new schemes that have been launched by the Government of India. The Government of Goa is intent on undertaking the works under the IPDS / DDUGJY since IPDS covers the above said scope of works of Part-B and in addition some other works and the funding is to the extent of 75% grants. The works under IPDS are to be completed
within a period of 2 years. The Government is desirous of availing the benefits of this Central Government scheme so as to upgrade the sub-transmission and distribution network in the State on a massive scale. The rural electrification works such as
bifurcation and dedicated feeders etc can be taken up under DDUGJY.
Electricity Department-Goa Page 106

Business Plan for the Control Period FY 2016-17 to FY 2018-19
8.2.29 Goa has serious issues about reliability of supply due to breakdowns on account of various reasons such as corrosion of cross-arms, poles etc due to saline conditions, under size conductors installed around 20 to 30 years back, and therefore has serious plans to focus on renovating, modernizing, strengthening distribution
network for improving operational and commercial efficiency, aesthetics, reliability and above all making network ready for Smart initiatives in the future. The State is endeavouring to become a Model State in the country as regards the Power sector.
8.2.30 The entire focus will be two dimensional:-
a) Analysis based investment plan for strengthening of network, for which new sub
stations / lines / interconnectors / reconductoring, transformer augmentation / addition, revamping of Sub-Stations, High voltage distribution system, load balancing/feeder segregation, HT/LT Aerial bunched cables, capacitor banks/reactors at 11 KV and 33 KV, Laying of Under Ground cables in densely populated areas, have been planned.
b) Quantum jump in reliability, for which plans are afoot to have Grid Sub-Station automation and integration with SCADA, Strategic distribution RMU, FPI and Integration with DMS, Outage management system and integration with GIS and CRM, provisioning compatibility with SMART technologies etc.
The estimated cost of the works proposed to be executed is to the tune of say Rs. 1000 crores to Rs. 1200 crores. On account of this reason, the new works are not being proposed under the renovation and improvement scheme and hence the
outlay has been curtailed.
8.2.31 EHV New Transmission/Sub-Station/Capacitor banks- Goa receives power from the central sector allocation from Western region and Southern region. The allocation of power from Western region is to the tune of 380MW and from Southern region is to the tune of 100MW.Goa's peak demand is to the tune of 540MW. The short fall in demand is to the tune of 60MW which is met from overdrawal depending upon permissible grid frequency under deviation settlement mechanism and also from
open market.
8.2.32 Goa receives power from 400/220KV substation Colvale from WR region and also
from 220KV Tillari and Kolhapur lines. From SR region it receives from 220KV Ambewadi lines from Karnataka. Goa also receives power from small captive power plants in Goa to the tune of 20MW.
Electricity Department-Goa Page 107

Business Plan for the Control Period FY 2016-17 to FY 2018-19
8.2.33 The allocation on SR region drops considerably depending on the availability of coal and plant efficiency. The allocation on SR region is not sufficient enough to cater the demands of South Goa therefore the WR supply is availed through Ponda substation.
8.2.34 The lines from WR region travels from quite a long distance and reaches to the tail end substation at Cuncolim due to which the voltage profile drops as well is prone to break downs for technical reasons.
8.2.35 In the event of failure of SR Supply the south Goa reels under severe power crisis and the allocation on WR is limited to 75 to 80 M W on diversion of SR allocation forcing
the Industrial and few domestic and Hotel industries under forced load restrictions till SR supply is normalized. Also, higher losses plus wheeling charges on re-routing SR power via WR grid. The SR supply is also unstable due to its aging network and passing through dense forest.
8.2.36 The SR lines in Goa region is renovated by replacing the Hardwares and insulators whereas the lines in the region of KPTCL is not renovated and most of the time the line is subjected to faults in the Karnataka region which has to be attended by the H.T.Maintenance team from Hubli, which is time consuming.
8.2.37 In order to overcome these crises the department proposes to execute the following lines:
(i) Erection of 220KV Double circuit line from 400/220KV substation Colvale to the proposed 220KV substation at Verna w ith LILO at 110KV Kadamba substation to the existing 220/33 KV substation at Cuncolim.
By erecting the proposed line the south Goa can draw their required power directly from WR region from Colvale substation and dependability on SR can be avoided and the power crisis in the event of failure of SR supply can be avoided. This will also act as a ring main to the system.
(ii) Erection of 220/110KV, 2X100MVA GIS substation at Kadamba.
Presently 110/33KV Kadamba substation receives power supply from Ponda and
Tivim Substations. These lines have been erected almost 30 years and are prone to frequent breakdowns. The Kadamba substation is supplying power to the capital city of Panaji and its associated substations.
Electricity Department-Goa Page 108

Business Plan for the Control Period FY 2016-17 to FY 2018-19
8.2.38 In the event of failure of 110KV lines the capital city suffers heavily and the restricted loads are met from 33KV feeders emanating from Ponda and Tivim, which is again prone to tripping's due to overloading's etc.
8.2.39 In view of the above and to overcome the power crisis to the Capital city of Panaji it is proposed to erect a 220/110KV GIS substation in or around Kadamba substation and feed the supply to the existing 110KV substation in order to ensure reliability of power supply to Capital city of Panaji and its associated substations.
8.2.40 The 110KV power supply can also be back fed to Ponda and Tivim substations as a
backup power supply.
(iii) Erection of 110KV D/C lines from Verna substation to the proposed 110/33KV substation at Sancoale fo r a distance of 10Kms by using existing 33KV lines corridor
and dismantling of the same.
Presently the port town of Vasco and Marmugao receives power from 110/33KV substation from Verna. These 33KV lines travel from Verna to Sancoale on the tower lines.
8.2.41 There are 3Nos of 33/11KV substation in the vicinity of port town and there are 10 Nos of 33KV feeders feeding the HT Consumers.
8.2.42 The installed capacity of the substations at 33KV line is to the tune of 100 M VA and
the H.T consumers to the tune of 45MVA. In addition to the above two more substations are under construction. The total installed capacity shall be to the tune of 145MVA.
(iv) Erection of 110/33KV, 2X50 M VA GIS substation at Sancoale.
The current carrying capacity of the existing 33KV lines is not sufficient to accommodate these loads. In view of the above it is proposed to extend 110KV lines from Verna up to Sancoale and erect 110/33KV, 2 x 50 M VA GIS substation in order to overcome the possible crisis.
(v) Erection of 110KV D/C lines from MSL substation to the Proposed 110/33KV
substation at Margao for a distance of 8 KMs, and renovation of existing 110KV S/C lines from Curtorim to MSL and converting the same in to Double circuit.
Electricity Department-Goa Page 109

Business Plan for the Control Period FY 2016-17 to FY 2018-19
(vi) Erection of 110/33KV, 2X50 M VA GIS substation at Margao.
Presently the commercial city of Margao receives 33KV power supply from Ponda,
Verna, and Xeldem substations. There are 8Nos of 33/11KV substations in and around Margao with the installed capacity of 165MVA. Any feeder failure from Ponda, Verna and Xeldem leads to interruption to the commercial city. Besides being commercial city it also attracts tourists to its beautiful beaches being costal belt housing many star hotels and is the venue for international events.
8.2.43 In order to ensure better and stable power supply and to reduce the length of the 33KV feeders it is proposed to erect 110/33KV, 2X50MVA GIS substation at Margao.
(vii) Erection of 110KV Double circuit lines from Tivim substation up to 33/11KV
saligao substation for a distance of 20Kms.
(viii) Establishing of 110/33KV, 2X50MVA GIS substation at Saligao (upgradation of
existing 33/11KV substation.)
The existing Tivim substation feeds the tourist paradise cities from 33/11KV substations of Mapusa, Nagoa, Nachonala, Porvorim and Saligao. The installed capacity of these substations is to the tune of 130MVA. The distance of 33KV lines feeding these substations is approximately 30Kms. These lines are erected over 30
years and are prone to breakdowns thereby causing interruption to the tourist's paradise.
8.2.44 It is therefore proposed to extend 110KV lines from Thivim to Saligao and establish 110/33KV 2x50MVA GIS substation at Saligao.
(ix) Erection of 110KV Double circuit lines from Pulsare to the proposed Kundai Industrial Estate substation for a distance of 5Kms.
(x) Establishing of 110/33KV, 2X50MVA GIS substation at Kundai Industrial Estate.
Presently Kundaim and Madkaim substations are receiving the power supply from Ponda & Kadamba substations.The loads to the tune of 50MVA is acting on these lines besides two nos of substation having the installed capacity of 27MVA. The 33KV
lines erected from ponda and kadamba substations are quite old and are prone to frequent failures thereby causing interruption's to the industrial city of Kundaim and Madkai.
Electricity Department-Goa Page 110
Business Plan for the Control Period FY 2016-17 to FY 2018-19
8.2.45 It is therefore proposed to extend 110KV lines from Pulsare up to Kundaim industrial estate and establish 110/33KV GIS substation at KIE.
8.2.46 By establishing the proposed substation it will help regulating the power supply to
kundaim industrial estate, Kundaim substation, Madkai substation and also it can feed the 33KV substation at Corlim, the lines and substations will also ensure quality power supply to Syngenta a reliance consumer once the changeover is taken place. The 33KV power supply can also be regulated to Bicholim substation on the existing lines.
8.2.47 There are no. of MNC's operating from both industrial estates on these 33KV lines and the industries are likely to be added by closure of Reliance power, there by adding the installed capacity of these lines and substation.
8.2.48 By establishing the proposed substation the lines from the proposed substation to
the nearby substations shall be shorter and shall ensure reliable and quality of power supply to these substations. This substation shall ensure a standby power supply to the Mapusa substation and shall relieve Tivim substation from overloadings etc,
8.2.49 Ponda substation has put on more than 45years of service and is congested due to
increase in equipment's and infrastructure hence needs renovation. The bus bar conductors of the station require replacement and the station equipment's also needs replacements as they have put on the required service are outdated and no spares are available. In view of the above it is proposed to renovate the entire substation by latest technology by adding GIS substation.
8.2.50 After installation of the above proposed EHV projects an additional transmission capacity of 520MVA on 220KV level and 526MVA on 110KV level is expected to be available and the transmission capacity shall increase to 1670MVA on 220KV level and 1150MVA on 110KV level thus making Goa self sufficient for next 25years.
8.2.51 The work wise details of the ongoing schemes (with works which were approved by the government) are attached in the annexure along with the status of the project.
Electricity Department-Goa Page 111

Business Plan for the Control Period FY 2016-17 to FY 2018-19
8.3 Capitalization schedu le
8.3.1 ED-GOA since the account books are maintained on cash basis, though the project is commissioned, if there are pending payments from the department side to contractors, it is not considered as capitalized. The proposed capitalization schedule
of the schemes and works for the control period are as below.
8.3.2 Schemes whose capital expenditure is not yet planned for the control period are not mentioned in the below table.
8.3.3 We request the Hon'ble commission to allow the department to make new capital expenditure proposals and capitalization schedules once we finalize the proposals
for various schemes, especially, scheduled tribe development schemes.
Electricity Department-Goa Page 112

Business Plan for the Control Period FY 2016-17 to FY 2018-19
Table 33: Proposed Capitalization Schedule
Name of scheme Estimated Cost (Rs.Crs)
Actual Capitalisation
during FY 201415
(Rs. Cr.)
Proposed Capitalisation
during FY 201516
(Rs. Cr.)
Revised Capitalisation
during FY 201516
(Rs. Cr.)
Proposed Capitalisation
during FY 201617
(Rs. Cr.)
Proposed Capitalisation
during FY2017- 18
(Rs. Cr.)
Proposed Capitalisation
during FY 201819
(Rs. Cr.)
1 2 14 15 16 17 18Scheduled castes development scheme(P) 1.57 - - 0.07 - 1.00 0.50Schedule Tribe Development Scheme (P) 263.58 10.00 60.00 75.00 10.00 30.00 30.00Machinery and Equipments (Plan) Motor Vehicles 0.83 - - - - - -
Infrastructure development through Electricity Duty (Plan) 705.00 62.81 48.00 48.00 96.00 100.00 50.00
Erection and Augmentation of 33/11 KV S/S line (Plan) 26.00 20.00 - 1.50 2.50 1.00 1.00Normal Development Schemes (Plan) 95.82 21.82 16.00 16.00 18.00 20.00 20.00System Improvement Schemes (Plan) 15.21 2.37 5.00 4.00 1.00 2.00 1.00Construction of staff quarters and office buildings (Plan) 9.89 1.89 1.50 1.50 2.00 2.50 1.00Erection of 220/33 KV 1X50 MVA Sub- Station at Cuncolim 72.74 2.00 1.00 13.00 - - -Erection of 220 KV line from Xeldem to Cuncolim 15.87 4.00 6.00 6.00 - - -Strengthening of 220 KV Transmission Network 11.85 9.85 1.00 1.00 1.00 - -Erection of 220/33KV, 1x50 MVA Sub-Station Xeldem 0.14 - - - - - -Accelerated Power Development Reforms Programme 0.06 - - - - - -
Erection of 2nd 100 MVA transfomer at Xeldem 220/110 KV S/S 0.28 - - 0.28 - - -
Erection of 220/110/33/11 KV Sub-Station at Vema (New) 90.00 - - - - 79.00 11.00
Erection of 220 KV line from Ponda-Vema-Xeldem 40.00 - - - - 34.00 6.00Restructured Accelerated Power Development and Reforms Programme Part A
136.73 - 110.00 106.73 30.00 - -
Underground Cabling 247.63 19.63 25.00 38.00 40.00 50.00 50.00(R-APDRP) during Eleventh Plan period - - - - - - -Public Lighting Scheme 4.68 0.68 1.00 1.00 1.00 1.00 1.00R-APDRP Part B / IPDS 1,600.00 - 200.00 - 300.00 500.00 500.00
EHV new Transmission / Sub-Station / Capacitor banks schemes 800.00 - - 50.00 - 300.00 450.00
Total 4,223.95 168.06 478.50 366.08 501.50 1,120.50 1,121.50
Electricity Department-Goa Page 113

Business Plan for the Control Period FY 2016-17 to FY 2018-19
8.4 Funding of Capital Expenditure
8.4.1 ED-GOA plans on funding majority of its capital expenditure through the Government and from the Electricity Duty fund of Government of Goa. The works carried out under R-APDRP (Part A) and IPDS / DDUGJY is funded by Ministry of
Power, Government of India through Power Finance Corporation / Rural Electrification Corporation.
8.4.2 The disbursement from PFC has been availed against the scheme under R-APDRP Part A. As per the Central Government scheme the same may be converted into grant if the operational targets are achieved. In case of non-achievement of those
operational targets the same disbursements will be considered as loan which may have an interest rate of 12% - 13%. Therefore this is an early stage at present to consider the PFC disbursement as loan or grant.
8.4.3 For IPDS / DDUGJY works the petitioner seeks to avail loan from PFC / REC and also
to link some of the works with IPDS scheme to avail the loans from Central Government. The Integrated Power Development Scheme (IPDS) which is being funded to the extent of 75% by Ministry of Power, Government of India has been proposed to be taken up (at present considered 60% in MYT). The 25% funding for this scheme is proposed to be arranged from the State's own resources.
8.4.4 The EHV new Transmission / Sub-Station / Capacitor banks schemes have also been proposed to be taken up by availing loans from financial Institutions like REC/PFC. Loan repayment is proposed to be arranged through State's own resources.
Electricity Department-Goa Page 114

Business Plan for the Control Period FY 2016-17 to FY 2018-19
Table 34: Funding sources for proposal capital expenditure
P r o j e c t D e t a i ls S O U R C E O F F I N A N C I N G f o r C a p e x S c h e m e
N a m e o f s c h e m e
E q u ity c o m p o n e n tC a p ita l
S u b s id ie s / g ra n ts
Lo anC o n su m e r
C o n tr ib u t io n c o m p o n e n t
T o ta lF u n d in g
E le c tr ic ity D u ty Fu n d
E q u ity in fu sio n - E D G /G o G
1 1 9 2 0 2 1 2 2 2 3 2 4S c h e d u l e d c a s t e s d e v e l o p m e n t s c h e m e ( P ) - 1 .5 7 - - - 1 .5 7S c h e d u l e T r i b e D e v e l o p m e n t S c h e m e ( P ) - 2 6 3 . 5 8 - - - 2 6 3 .5 8M a c h in e r y a n d E q u i p m e n t s ( P l a n ) M o t o r V e h i c l e s - 0 . 8 3 - - - 0 . 8 3
I n f r a s t r u c t u r e d e v e l o p m e n t t h r o u g h E le c t r i c i t y D u t y ( P l a n ) 7 0 5 . 0 0 - - - - 7 0 5 .0 0
E r e c t io n a n d A u g m e n t a t i o n o f 3 3 / 1 1 K V S / S l i n e ( P la n ) - 2 6 . 0 0 - - - 2 6 . 0 0N o r m a l D e v e l o p m e n t S c h e m e s ( P l a n ) - 9 5 .8 2 - - - 9 5 .8 2S y s t e m I m p r o v e m e n t S c h e m e s ( P la n ) - 1 5 .2 1 - - - 1 5 .2 1C o n s t r u c t i o n o f s t a f f q u a r t e r s a n d o f f i c e b u i l d i n g s ( P l a n ) - 9 .8 9 - - - 9 .8 9S t r e n g t h e n i n g o f 2 2 0 K V T r a n s m i s s i o n N e t w o r k - 1 1 .8 5 - - - 1 1 .8 5
E r e c t io n o f 2 2 0 / 1 1 0 / 3 3 / 1 1 K V S u b - S t a t i o n a t V e r n a ( N e w ) - 9 0 . 0 0 - - - 9 0 . 0 0
E r e c t io n o f 2 2 0 K V l i n e f r o m P o n d a - V e r n a - X e l d e m - 4 0 . 0 0 - - - 4 0 . 0 0E r e c t io n o f 2 2 0 / 1 1 0 / 3 3 / 1 1 K V S u b - S t a t i o n a t S o c c o r r o - - - - - -E r e c t io n o f 2 2 0 K V D / C l i n e f r o m C o l v a l e t o S o c c o r r o - - - - - -
E r e c t io n o f H O K V D / C l i n e f r o m S o c c o r r o t o K a d a m b a - - - - - -A P D R P ( S t a t e S c h e m e s ) - 8 6 . 0 0 - - - 8 6 . 0 0R e s t r u c t u r e d A c c e l e r a t e d P o w e r D e v e l o p m e n t a n d R e f o r m s P r o g r a m m e P a r t A - - 1 3 6 .7 3 - - 1 3 6 .7 3
U n d e r g r o u n d C a b l i n g - 2 4 7 .6 3 - - - 2 4 7 .6 3( R - A P D R P ) d u r i n g E l e v e n t h P la n p e r i o d - - - - - -P u b l i c L i g h t i n g S c h e m e - 4 . 6 8 - - - 4 . 6 8R - A P D R P P a r t B / I P D S - - 9 6 0 .0 0 6 4 0 . 0 0 - 1 ,6 0 0 .0 0E H V n e w T r a n s m i s s i o n / S u b - S t a t i o n / C a p a c i t o r b a n k s s c h e m e s - 8 0 0 . 0 0 - - - 8 0 0 .0 0
T o t a l 7 0 5 . 0 0 1 ,6 9 3 .6 1 1 ,0 9 6 .7 3 7 2 8 .6 1 - 4 ,2 2 3 .9 5
Electricity Department-Goa Page 115

Business Plan for the Control Period FY 2016-17 to FY 2018-19
8.5 Initiatives by ED Goa
8.5.1 Smartgrid Initiatives: M/s. Power Grid Corporation of India Limited has been appointed as nodal agency by MoP for smart Grid, accordingly in Goa, they have identified Ribader in North Goa and Vasco feeder I & II in south Goa. M/s PGCIL have
requested certain inputs for preparing the DPR, which is in progress.
8.5.2 Demand Side Management and Energy Efficiency: Under Demand side management, ED-Goa has entrusted EESL to carry out the feasibility study and prepare a proposal for LED street lighting in the state.
8.5.3 Accordingly EESL has carried out technical and financial study on LEB street lighting implementation in the state of Goa. Accordingly Goa has planned to replace its streetlights with LEDs as per the given below plan which can save almost 35 MU of energy every year
Table 35: Replacement plan of Streetlight with LEDs
Description Units TotalStreetlight inventory Nos. 1,66,614Existing scenarioConnected load MW 14. 54Energy consumption MU 58.33Post LED retrofitsConnected load MW 6.04Energy consumption MU 23.05SavingsConnected load MW 8. 5Energy MU 35.28
8.5.4 ED Goa has also projected the energy saving potential for the control period as follows.
Table 36: Energy saving Potential of Energy Efficiency projects for the control period
Year UnitsFY 2015
16
FY2016
17
FY2017
18
FY 201819
Energy Efficiency projectsReplacement of all type St. light fixtures by LED
MU 37 37 37 37
DELP Programme MU 31.32 31.32 31.32 31.32Total Saving MU 66.6 66.6 66.6 66.6
Electricity Department-Goa Page 116

Business Plan for the Control Period FY 2016-17 to FY 2018-19
CHAPTER 9. OPERATION & MAINTENANCE EXPENSES
9.1 Norms for O&M Expenses
9.1.1 The JERC (Multi Year Distribution Tariff) Regulations, 2014 notifies that the Hon'ble Commission will stipulate a separate trajectory of norms for each of the component of O&M expenses viz., Employee cost, R&M expense and A&G expense. The relevant extract of the Regulation is mentioned as follows.
"21. Operation & Maintenance Expenses
(a) The Commission shall stipulate a separate trajectory o f norms fo r each o f the components o f O&M expenses viz., Employee cost, R&M expense and A&G expense.
Provided that such norms may be specified fo r a specific Distribution Licensee or a class o f Distribution Licensees
(b) Norms shall be defined in terms o f combination o f number o f personnel per 1000 consumers and number o f personnel per substation along with annual expenses per personnel fo r Employee expenses; combination o f A&G expense per personnel and A&G expense per 1000 consumers fo r A&G expenses and R&M expense as percentage o f gross fixed assets fo r estimation o f R&M expenses:
(c) One-time expenses such as expense due to change in accounting policy, arrears
paid due to pay commissions etc., shall be excluded from the norms in the trajectory.
(d) The expenses beyond the control o f the Distribution Licensee such as dearness allowance, terminal benefits in Employee cost etc., shall be excluded from the norms
in the trajectory.
(e) The One-time expenses and the expenses beyond the control o f the Distribution Licensee shall be allowed by the Commission over and above normative Operation &
Maintenance Expenses after prudence check.
(f) The norms in the trajectory shall be specified over the control period with due
consideration to productivity improvements.
(g) The norms shall be determined at constant prices o f base year and escalation on account o f inflation shall be over and above the baseline.
(h) The Distribution Licensee specific trajectory o f norms shall be identified by the Commission on the basis o f absolute and relative analysis.
(i) In absolute analysis, Distribution Licensee's audited accounts o f operations fo r last three years, expenses claimed fo r control period, historically approved cost, and prudence check shall be used by the Commission to estimate values of norms.
(j) In relative analysis, performance parameters o f other Distribution Licensees within the same state or in other states shall be considered by the Commission to estimate norms.
Electricity Department-Goa Page 117

Business Plan for the Control Period FY 2016-17 to FY 2018-19
Provided that other Distribution Licensees so chosen shall have similar profile as that o f the Distribution Licensee under consideration in terms o f consumer mix, type of license area (city, state, etc.) type o f distribution networks, viz., underground/overhead, HT-LT ratio, etc.
(k) Suitable average o f outcomes o f absolute and relative analysis shall be taken by the Commission to f ix the norms over the control period fo r the Distribution Licensee.
9.1.2 As mentioned in the above extract of the Regulations, O&M norms have been derived in this particular section. The Operation and Maintenance (O&M) Expenses comprising of Employee Expenses, Administration & General (A&G) Expenses and
Repairs & Maintenance (R&M) Expenses are linked to certain parameters provided in MYT Regulatisons 2014. The petitioner proposes norms in this Business Plan and request that the Hon'ble Commission may approve norms in such a manner that the O&M expenses for future years should not be less than that of actual of previous year plus arrears plus pay revisions if any and pension/ gratuity etc.
9.2 Computation of Employee Expense Norms
9.2.1 The following table shows the actual employee expenses incurred in the past for the
last five years i.e. from FY 2009-10 to FY 2014-15.
Electricity Department-Goa Page 118

Business Plan for the Control Period FY 2016-17 to FY 2018-19
Table 37: Actual Employee Expenses for the last six yearsSr.No Particulars Actuals Actuals Actuals Actuals Actuals Provisional
ActualsFY 2009-10 FY2010-11 FY 2011-12 FY 2012-13 FY 2013-14 FY 2014-15
1 2 3 4 5 6 7 8A Salaries& Allowances
1 P ay in P ay Band 45.02 46.26 49.66 54.44 52.18 61.672 G ra d e Pay 11.07 12.05 12.62 13.71 14.05 14.143 D earness A llo w a n c e 21.78 36.57 32.00 43.26 58.51 76.924 H ouse ren t A llo w a n c e 10.26 10.63 11.41 13.78 12.29 14.505 T ra n s p o rt a ll owa nce 4.46 5.47 5.38 6.23 6.02 8.856 S pecia l Pay 0.01 0.01 0.02 - 0.01 0.027 P erso n a l Pay 0.08 0.10 0.08 0.10 0.08 0.088 D e p u ta tio n pay - - - -9 H o n o ro r iu m - - 0.01 0.0310 W a s h in g A llo w a n c e 0.28 0.23 0.26 0.29 0.78 0.4611 M e d ica l Reim .Charges - 0.90 1.73 0.6112 co n ve ya n ce a llo w a n c e 0.15 0.13 0.19 0.16 0.60 0.0113 Leave encashm en t 1.08 4.19 6.44 1.42 3.80 3.4114 F ie ld A llo w a n c e 0.77 0.77 0.85 0.77 1.09 0.9615 S h ift D uty A llo w a n c e - 0.63 1.02 0.5016 O v e rti me a 11 ow a nce - 0.01 0.00 0.0317 CPF E a rn in gs (G o vt. Co ntr.) - 2.17 4.19 4.0618 Bonus - 3.25 1.84 1.4219 T u tio n fe es /ch ild Ed. A llo w . - 0.40 0.36 0.4520 C yc le A llo w a n ce s - 0.01 0.62 0.0421 C h ild E du ca tion A llo w a n c e - - 0.05 -22 D iffe ren ce o f ACP - 1.10 1.51 2.7823 D iffe ren ce o f P ay P ro te ctio n - 0.04 0.95 0.6624 Fe stiva l A d va n ce - 0.28 1.15 0.9725 LTC 0.01 0.50 0.38
A rre a rs on a cc o u n t o f V Ith P ay C o m m is s io n
25.29 3.01 0.64-
C o n tra c tu a l b a s is 4.05 4.08 6.37 44.21R isk A llow ance 0.10
C ity C o m p en sato ry Allow . 0.14Total 124.29 123.51 125.89 142.96 163.33 237.44
27 Less: A m o u n t c a p ita lize d - - - 0.30 0.1228 N e t a m o u n t 124.29 123.51 125.89 142.96 163.03 237.32
29 Ad d : p r io r p e rio d expenses - - - - 030 Total Employee Expenses 124.29 123.51 125.89 142.96 163.03 237.32
9.2.2 The Regulation specifies the employee expenses norms to be determined based on number of personnel per 1000 consumers and number of personnel per substation. The following table shows the number of personnel per 1000 consumers, number of
personnel per substation and employee expenses per personnel for the last five years. ED-Goa has come under the regulatory regime since FY 2010-11 and further
Electricity Department-Goa Page 119

Business Plan for the Control Period FY 2016-17 to FY 2018-19
the regulations also remain silent on the no. of years to be considered for norms calculation. Hence, the calculation of the norms has been considered on the basis of last 4 year average:
Table 38: Employee Parameter for the last five years
Particulars FY 09-10 FY 10-11 FY 11-12 FY 12-13 FY 13-14 FY 14-15No. of Consumers (at the end of FY) 5,37,769 5,73,646 5,79,913 5,85,177 5,83,286 5,75,633
No. of Employees (at the end of FY) 5,873 5,940 6,157 6,506 6,326 6,583
No. of Substations (33/11KV) 49 50 50 50 50 53
Employee Expenses( Rs.Crore) 124.29 123.51 125.89 142.96 168.41 237.30
No. of Employees/ 1000 Consumers 11 11 11 12 11 12
No. of Employees per substation 120 119 123 130 127 124
Annual expenses per Employee (Rs. Lakh/ employee)
2.20 2.10 2.10 2.20 2.70 3.70
9.2.3 The Regulation specifies the employee expenses norms to be determined based on number of personnel per 1000 consumers and number of personnel per substation. However, the regulations are silent on the weight age to be given for linking the no. of employees with consumers and substations respectively; hence, an assumption of 40:60 weight age is taken for the purpose of calculation of the norms as shown below:
Table 39: Employee Norms Calculations
Computation of Employee NormParticulars FY 09-10 FY 10-11 FY ll-1 2 FY 12-13 FY 13-14 FY 14-15 5 year
AverageNo. of Employees/1000 Consumers 11.00 11.00 11.00 12.00 11.00 12.00 11.40
For Unking 40% to consumers 5.00 4.40 4.40 4.80 4.40 4.80 456Annual expenses per Employee (Rs.
Lakh/employee)
2.20 2.10 2.10 2.20 2.70 3.70 256
No. of Employees per substation 120 119 124 131 127 125 125.20For Linking 60% to Sub-station 72.00 71.40 74.40 78.60 76.20 75.00 75.12
9.2.4 Based on the MYT Regulation, the proposed norms for Employee expenses along
with allocation for wheeling and supply business are tabulated below:
Electricity Department-Goa Page 120

Business Plan for the Control Period FY 2016-17 to FY 2018-19
Tabl e 40: Proposed Norm for Employee Expenses
Proposed Norms with Allocation for Wires & SupplyParticulars Unit Norm Wire
Business (%)Supply
Business (%)
Employee Expenses: 90% 10%Computation of No. of Employees:No. ofEmpl. per substation Nos 77No. of Employees/1000 Consumers Nos 5Annual expenses per Employee (Rs. Lakh/
employee)3.20
9.2.5 It is submitted that ED-Goa has also projected number of employees in MYT as per the sanctioned posts to be filled up and based on other aspects such as retirement,
new recruitments, getting contract employees on payroll etc. ED-Goa submits that Hon'ble Commission may consider these aspects also while approving norms so that it is not deprived of desired manpower strength.
9.2.6 ED-Goa also submits that it has made provision for Pension contribution which is
over and above the employee expenditure computed based on the norms. ED-Goa as per its working for FY 2013-14 has considered pension provision of Rs.11 Lacs per annum for permanent employees over the control period.
9.2.7 The petitioners requests the Hon'ble Commission to kindly approve the above
proposed norms of Employee Expenses for the control period.
9.3 Adm inistration and General Expense Norms
9.3.1 The following table shows the actual administration and general expenses incurredin the past for the last five years i.e. from FY 2009-10 to FY 2014-15.
Electricity Department-Goa Page 121

Business Plan for the Control Period FY 2016-17 to FY 2018-19
Table 41: Administration and General Expenses for the last six years
Sr. No. Particulars Actuals Actuals Actuals Actuals Actuals ActualsFY 2009-10 FY2010-11 FY 2011-12 FY 2012-13 FY 2013-14 FY 2014-15
1 2 3 4 5 6 7 8
1 Rent, rates & taxes 0.20 0.22 0.32 0.22 0.29 0 .3 72 Domestic Travel Allowances 0.33 0.23 0.62 0.37 0.38 0 .2 53 Office Expenses 18.40 16.44 16.44 3.63 4.29 11.044 Regulatory Expenses (License + Petition
Fees)0.37 0.38 0.65 0.55 1.08
0 .7 15 Advertisement & Publicity 0.02 0.21 0.20 0.24 0.27 0 .446 Legal, Professional & Special Service
Charges0.09 0.04 0.47 0.44 0.86
0 .7 97 Other A&G Charges 0.36 0.22 0.51 0.75 0.35 0.338 Registration Charges - PGCIL (WR & SR)
& SCADA/ EMS Charges0.55 0.32 0.33 - -
_
9 Other material related expenses 0.00 0.00 0.00 - - -10 Total 20.33 18.05 19.53 6.20 7.52 13.9411 Add/Deduct share of others (to be
specified)- - - - -
12 Total expenses 20.33 18.05 19.53 6.20 7.52 13.9413 Less: Capitalized 0.15 0.21 0.23 - - -14 Net expenses 20.18 17.84 19.31 6.20 7.52 13.9415 Add: Prior period - - - - - -16 Total A&G Expenses 20.18 17.84 19.31 6.20 7.52 13.94
9.3.2 The Regulation specifies that the administrative and general expenses norms to be
determined based on combination of A&G expense per personnel and A&G expense per 1000 consumers. The following table shows the A&G expense per personnel and A&G expense per 1000 consumers for the last five years. ED-Goa has come under the regulatory regime since FY 2010-11 and further the regulations also remain silent on the no. of years to be considered for norms calculation. Hence the calculation of the
norms has been considered on the basis of last 4 year average:
Table 42: A&G Expense Norms calculation
Computation of A&G NormsParticulars FY 09-10 FY 10-11 FY 11-12 FY 12-13 FY 13-14 FY 14-15 5 year
AverageA&G Expenses(Rs Lakh/1000 Consumer)
3.75 3.11 3.33 1.06 1.35 1.64 252
For Linking 50% to consumers 1.88 1.55 1.GG 0.53 0.67 0.82 126A&G Expenses(Rs Lakh/ per personnel)
0.34 0.30 0.31 0.10 0.12 0.13 02*
For Unking 50% to Employees 0.17 0.15 0.16 0.05 0.06 0.07 012
9.3.3 The Regulation specifies that the administrative and general expenses norms to be determined based on combination of A&G expense per personnel and A&G expense
per 1000 consumers. However, the regulations are silent on the weightage to be given for linking the A&G expenses with consumers and employees respectively; hence, an assumption of 50:50 weight age is taken for the purpose of calculation of the norms.
Electricity Department-Goa Page 122

Business Plan for the Control Period FY 2016-17 to FY 2018-19
9.3.4 Based on the MYT regulation, the proposed average norms for Administration and General Expenses are:
Table 43: Proposed A&G Expense Norms
Proposed Norms with Allocation for Wires & SupplyParticulars Unit Norm Wire Business
(%)Supplv
Business (%)A&G Expenses: 75% 25%
Linked to Consumers Rs.Lakh/1000 Cons.
1.30
Linked to No. of Employees (Rs. Lakh/ emDlovee)
0.12
9.3.5 The petitioners requests the Hon'ble Commission to kindly approve the aboveproposed norms of Administration & General Expenses for the control period.
9.4 Repairs and Maintenance Expenses
9.4.1 The following table shows the actual repairs and maintenance expenses incurred inthe past for the last five years i.e. from FY 2009-10 to FY 2014-15.
Electricity Department-Goa Page 123

Business Plan for the Control Period FY 2016-17 to FY 2018-19
Table 44: R&M Expense and Parameters for the last five yearsSr. No Particulars Actuals Actuals Actuals Actuals Actuals Actuals
FY 2009-10 FY2010-11 FY 2011-12 FY 2012-13 FY 2013-14 FY 2014-15
1 2 3 4 5 6 7 81 P lan t & m ach in ery * 0.01 9.64
-P la n t & Apparatus 0.00
-EHV su bsta tions 0.61
- 33kV su bsta tion 0.03 0.04 0.11 0.03 2.36 4.11- 11kV substa ti on 2.50
- Sw itchgear and cab le connections 3.39
- O thers - - - 0.98 0.17Total 0.03 0.04 0.11 0.03 9.85 13.92
2 B u ild in gs (E le c tr ic ity R esidentia l & N on- R es id e n tia l)
1.52 1.80 1.80 0.81 0.060.96
3 H yd ra u lic w orks & c iv il works - - - - 0.02 -4 Line cab le & netw ork * 0.17 -
-EHV Lines 11.66 10.57 11.00 14.97 0.50 0.71- 33kV lines 3.58 0.83- 11kV lines 0.78 2.21- LT lines 2.49 9.19- M eters and m etering equipm ent 0.04 0.12 0.10 0.05 1.91 0.77- O thers - - - 0.74 3.28Total 11.69 10.68 11.10 15.02 10.18 16.99
5 Vehi cl es - - - - 2.17 3.986 F u rn itu re & fixtu re s - - - - 0.31 0.067 O ffic e equi pments - - - 0.18 0.048 M in o r R&M W o rks 3.45 4.02 4.02 3.08 2.81 6.829 Total 16.69 16.55 17.03 18.94 25.57 42.7710 Add/Deduct share o f others (To be specified) - - - - 2.41 -11 Total expenses 16.69 16.55 17.03 18.94 25.57 42.77
12 Less : C a p ita lized - - - - - --
13 Net e xpenses 16.69 16.55 17.03 18.94 25.57 42.77
14 A d d : pri o r peri od - - - - - -15 Total R&M expenses 16.69 16.55 17.03 18.94 25.57 42.77
9.4.2 The Regulations specifies R&M expenses norms to be determined as a percentage of gross fixed assets (GFA). The following table shows the R&M expenses and GFA for last five years. ED Goa has considered the actual opening value of GFA as per the asset register prepared by the department till FY 2012-13. ED-Goa has come under the regulatory regime since FY 2010-11 and further the regulations also remain silent
on the no. of years to be considered for norms calculation. Hence the calculation of the norms has been considered on the basis of last 4 year average:
Table 45: Calculation of Norms for R&M expenses
Particulars FY 09-10 FY 10-11 FY 11-12 FY 12-13 FY 13-14 5 year Average
Total R&M Expenses (Rs.Crs) 16.69 16.55 17.03 18.94 25.57 17.30Total GFA Opening (Rs.Crs) 420.64 499.57 595.50 693.69 816.84 552.35R&M expenses (% of GFA) 4.0% 33% 2.9% 2.7% 3.1% 3.1%
Electricity Department-Goa Page 124
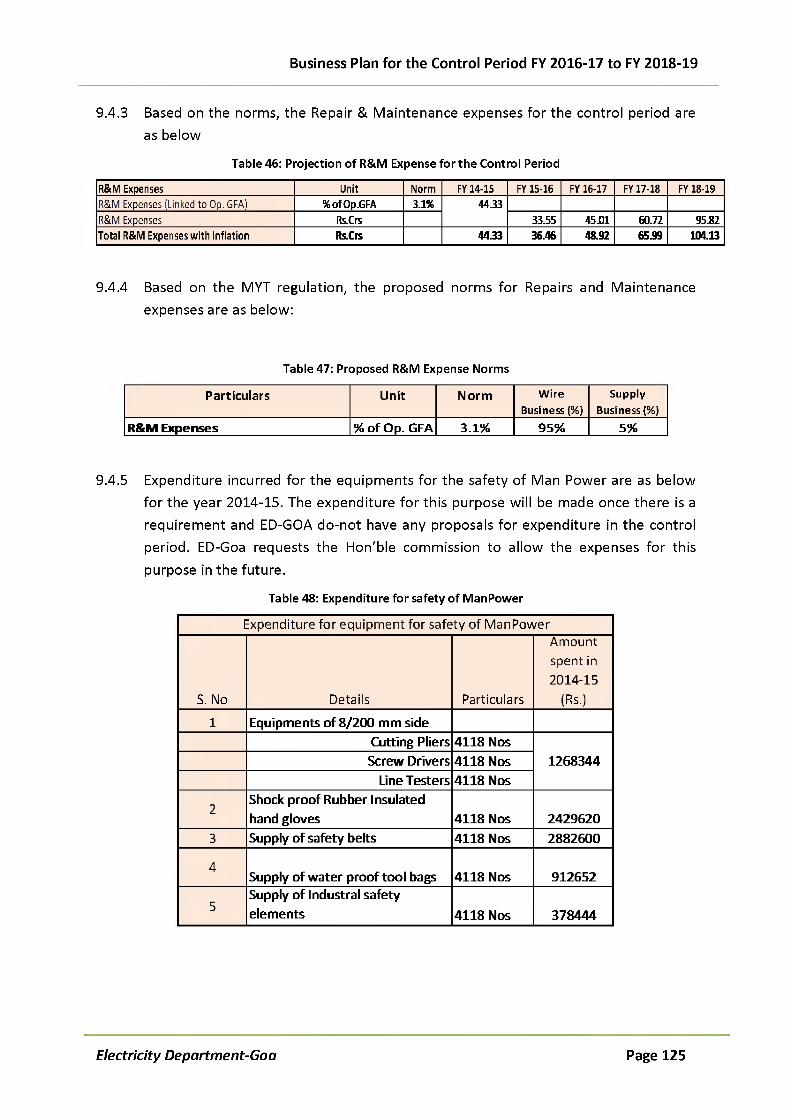
Business Plan for the Control Period FY 2016-17 to FY 2018-19
9.4.3 Based on the norms, the Repair & Maintenance expenses for the control period are as below
Table 46: Projection of R&M Expense for the Control Period
R&M Expenses Unit Norm FY 14-15 FY 15-16 FY 16-17 FY 17-18 FY 18-19
R&M Expenses (Linked to Op. GFA) % o fO p .G FA 3.1% 44.33
R&M Expenses Rs.Crs 33.55 45.01 60.72 95.82
Total R&M Expenses w ith Inflation Rs.Crs 44.33 36.46 48.92 65.99 104.13
9.4.4 Based on the MYT regulation, the proposed norms for Repairs and Maintenance expenses are as below:
Table 47: Proposed R&M Expense Norms
Particulars Unit Norm W ire Business (%)
Supply Business {%}
R&M Expenses % of Op. GFA 3.1% 95% 5%
9.4.5 Expenditure incurred for the equipments for the safety of Man Power are as below for the year 2014-15. The expenditure for this purpose will be made once there is a requirement and ED-GOA do-not have any proposals for expenditure in the control period. ED-Goa requests the Hon'ble commission to allow the expenses for this
purpose in the future.
Table 48: Expenditure for safety of ManPower
Expenditure for equipment for safety of ManPower
S. No Details Particulars
Amount spent in 2014-15
(Rs.)
1 Equipments of 8/200 mm sideCutting Pliers 4118 Nos
1268344Screw Drivers 4118 NosLine Testers 4118 Nos
2Shock proof Rubber Insulated hand gloves 4118 Nos 2429620
3 Supply of safety belts 4118 Nos 2882600
4Supply of water proof tool bags 4118 Nos 912652
5Supply of Industral safety elements 4118 Nos 378444
Electricity Department-Goa Page 125

Business Plan for the Control Period FY 2016-17 to FY 2018-19
9.4.6 Expenditure incurred for the CGRF are as below for FY 2014-15. The expenditure for CGRF is made to ensure and enhance the satisfaction of consumers by addressing their grievances.
Table 49:Expenditure for CGRF for FY2014-15
Sr.No.
ParticularsActual
2014-15 H I 2014-15 H2 2014-151 2 3 4 5
1 Salaries 14.08 12.03 26.112 Domestic Travel Expenses -3 Office Expenses 0.42 2.64 3.064 Advertising and Publicity -5 Other Charges 0.22 3.78 4.006 P.O.L -7 Total (Rs. Lacs) 14.72 18.45 33.17
9.4.7 The petitioner requests the Hon'ble Commission to kindly approve the above proposed norms of O&M Expenses for the control period.
Electricity Department-Goa Page 126

Business Plan for the Control Period FY 2016-17 to FY 2018-19
CHAPTER 10. PRAYERS TO COMMISSION
10.1 Prayers to Hon'ble Commission
The Electricity Department Goa (ED-Goa) respectfully prays to the Hon'ble Commission to:
a) Admit the Business plan of ED-Goa for the Control Period FY 2016-17 to FY 2018-19 in accordance with Regulation 5 of JERC (Multi Year Distribution) Tariff Regulations, 2014.
b) Approve the Business Plan of ED-Goa for the Control Period FY 2016-17 to FY 201819 in accordance with Regulation 4.2 and 5.1 of the JERC (Multi Year Distribution) Tariff Regulations, 2014.
c) Approve the principles and methodology proposed by ED-Goa in the Business Plan.
d) Approve the Allocation Policy for wires and supply business as proposed by ED-Goa in the Business Plan.
e) Approve the Demand and Sales Assessment and projections as proposed by ED-Goa
in the Business Plan.
f) Approve the Power Purchase Plan as proposed by ED-Goa in the Business Plan.
g) Approve the Capital expenditure and source of funding as proposed by ED-Goa in the Business Plan.
h) Approve the O&M norms as prescribed in the Business Plan.
i) Approve the deviations if any from the norms prescribed by MYT Regulations, provisions thereof, as sought in this Business Plan during the control period FY 2016
17 and FY 2018-19.
j) Pass any other Order as the Hon'ble Commission may deem fit and appropriate
under the circumstances of the case and in the interest of justice.
k) Grant any other relief as the Hon'ble Commission may consider appropriate.
Electricity Department-Goa Page 127
Business Plan for the Control Period FY 2016-17 to FY 2018-19
l) Condone any error/omission and to give opportunity to rectify the same.
m) Condone delay in filing this business plan petition.
n) Permit ED-Goa to make further submissions, addition and alteration to this Business
Plan as may be necessary from time to time.
Electricity Department-Goa Page 128

Business Plan for the Control Period FY 2016-17 to FY 2018-19
ANNEXURES
Electricity Department-Goa Page 129

Business Plan for the Control Period FY 2016-17 to FY 2018-19
HEAD WISE DETAILS OF CAPITAL EXPENDITURE SCHEMES
11.1. Scheme: System Improvement Schemes (Plan)
Sr.No. Budget Head Name o f the scheme Date o f Administrative Approval % Completion
Target Dateo fcompletion
Physical Financial1 4801-05-800-22-53 SETC of new 11kv Diwar
Feeder from Corlim sub station under renovetion and Improvement scheme
AS/22/95/CEE/TECH/13- 14/PLG/2547 DT-11/3/14
80% work completed
11013975 workcompleted
2 4801-05-800-22-53 work of SETC of 100 KVA DTC alongwith 0.85 Km U/G 11kv and 0.12 km LT line near khuris Milagris church at Old Goa
AS/22/11/CEE/Tech/2013 - 14/plg/519 dt-24/6/14
100% cmpleted
3 4801-05-800-22-53 work of providing street light from batim village panchayat to curca bridgr in St. Andre constituency
AS/54/48/13- 14/CEE/Tech/PLG/753 dt- 30/7/2013
01-06-2015
4 4801-05-800-22-53 Supply, erection, testing & commissioning of work of R & I of 220KV Kolhapur- Ponda & Tillari- Ponda D/C Lines from Kudichire to 220KV Ponda Receiving Station
No. AS/36/10/ 2008-09/ CEE/ TECH/1129 dtd: 18/12/2008
90% 30-06-2015
Electricity Department-Goa Page 130

Business Plan for the Control Period FY 2016-17 to FY 2018-19
5 4801-05-800-22-53 Supply, erection, testing & commissioning of work of R & I of 220 KV Ambewadi- Ponda D/C line from Karadi point to 220KV Ponda receiving station.
No. AS/36/07/ 2008-09/ CEE/ TECH/781 dtd: 22/09/2008
85% 30-06-2015
6 4801-05-800-22-53 Estimate for conversion under R&I for erection 2 Nos of 100KVA transformer of 100KVA at Zoddi & Povosaowado. ( R & I)
18/06/2013 80% 73% Jun'2015
7 4801,05,800,22,53 Estimate for erection of new 200 KVA Distribution Transformer along with HT under ground Cable and renovation of the existing LT Distribution line at La- Calypso Candolim under renovation and improvement scheme
AS/22/30/2013-14/CEE/TECH/PLG494dt.18/6/2013.
100%
8 4801,05,800,22,53 Revised Estimate for renovation of old deteriorated 11 KV GOAB Switches at 33/11 KV Saligao Sub Station under renovation and improvement scheme
AS/22/30/2013-14/CEE/TECH/PLG/479dt.18/6/2013.
98% 31/7/2015
Electricity Department-Goa Page 131

Business Plan for the Control Period FY 2016-17 to FY 2018-19
9 4801,05,800,22,53 Estimate for erection of new 100 KVA Distribution Transformer and renovation of LT Line at Gaurawaddo Calangute under renovation and improvement scheme
AS/22/30/2013- 14/CEE/TECH/PLG/544 dt. 25/6/2013.
100%
10 4801,05,800,22,53 Estimate for Enhancement of 200 KVA to 400 KVA DTC on Dos Do Mar DTC and renovation of existing LT Line at Gaura waddo Calangute under renovation and improvement scheme
AS/22/43/2013- 14/CEE/TECH/PLG/661 dt. 15/7/2013.
100%
11 4801,05,800,22,53 Estimate for bifurcation of existing 11KV Aldona feeder by providing 11KV underground cable from Nachnola sub-station to Khoirut Aldona under R&I
AS/22/83/2013- 14/CEE/TECH/PLG/235 0 dt. 14/02/2014.
80% 31/8/2015
12 4801,05,800,22,53 Estimate for re-alignment of 11KV S/C line at Deulamol Molcornem at a distance of 0.57kms in the jurisdiction of Division-VII Curchorem under system improvement scheme (plan)
30/06/2014 N.A as as expenditure saction to the proposal is not conveyed by theGovernment.
Electricity Department-Goa Page 132

Business Plan for the Control Period FY 2016-17 to FY 2018-19
13 4801,05,800,22,53 Tender for the work of SETC of revamping of 41 Nos. of Distribution transformer Centers in the jurisdiction of Curchorem Cacora Municipal areas under the jurisdiction of Electricity Sub-Division-I, Div-VII Curchorem
19/03/2010100% 99% work
completedon23/07/2014
14 4801,05,800,22,53 SETC for the work of realignment of existing electrical network for beatification of Petrol Pump Circle and Public Footpath Way to Guardian Angel School at Curchorem
02-08-2013 100% 70% workcompletedon20/01/2015
15 4801,05,800,22,53 Estimate under Renovation & Impovement for erection of 100 KVA DTC alongwith 11 KV/LT line at vakikulanwada in Collem V.P. of Sanvordem
4/9/2013 25% 20% 15/08/2015
16 4801,05,800,22,53 Estimate under Renovation & Impovement for erection of 100 KVA DTC alongwith 11 KV/LT line at Makadiawada in Mollem under system improvement scheme
27/11/2013 75% 16% 15/08/2016
Electricity Department-Goa Page 133

Business Plan for the Control Period FY 2016-17 to FY 2018-19
17 4801,05,800,22,53 Estimate for Re- conductoring of LT lines for distance of approx. 45 kms.covering 17 nos. of Dist. T/C in V.P. Collem & Mollem of Sanvordem Constituency
26/09/2008 10% 14% 31/12/2015
18 4801,05,800,22,53 Work of revamping of 71 nos of distribution T/C of various capacities at various location in Quepem
08-02-2008 80% 85% 30/09/2015
19 4801,05,800,22,53 work of revamping & providing additional power supply line for the improvement of voltage in V.P area of cazur & malkarnem
06-08-2010 85% 85% 30/09/2015
20 4801-05-800-22-53 Estimate for renovation of LT distribution network in the jurisdiction of section office Bethora under V.P. Bethora, Nirankal, Conxem and Codar in Shiroda under R&I
17-10-2013 NITpublishednobodyquoted
21 4801-05-800-22-53 Estimate for renovation of 11KV & LT o/h distribution lines under the jurisdiction of village panchayat Dharbandora and Sancorda in Savordem constituency under system Improvement scheme(Plan)
07-10-2013 NITpublishednobodyquoted
Electricity Department-Goa Page 134

Business Plan for the Control Period FY 2016-17 to FY 2018-19
22 4801-05-800-22-53 Estimate for work under renovation and improvement of laying of 11KV XLPE, 240sq.mm aluminium armoured cable from 33/11KV colony S/S to Ravinagar Khadpabandh four pole structure through HDD method.
09-12-2014 Revised estimate submitted dt. 13/03/2015
23 4801-05-800-22-53 Bifurcation of 11 KV Jordan Feeder by laying of 11kv underground cable at Verna Industrial Estate
25/10/2013 70% 64.90 lakh 25/10/2015
24 4801-05-800-22-53 T.No.4(10): SETC of 9 Nos. 100KVA DTC along with associated HT/LT line for improving the existing LT distribution networks in various areas of Velim Constituency.
05/05/2010, Rs.61,77,650/- 85% 67.16 NIL
25 4801, 05,800, 22, 53 Renovation & Improvement Scheme
21-02-2011 & 07-012011
100% 57% completed- March 2015
Electricity Department-Goa Page 135

Business Plan for the Control Period FY 2016-17 to FY 2018-19
11.2. Scheme: Strengthening of 220KV Transmission Network
Sr.No. BudgetHead
Name of the scheme Date of Administrative Approval
% Completion Target Date of completionPhysical Financial
1 4801-05800-39-53
Supply, installation, testing and commissioning of additional hardware for existing RTUs and Service charges for Sub-Station data integration, Feeder integration and Captive Power Plant (CPP) integration with State Load dispatch Centre (SLDC) under Electricity Department, Goa.
No.AS/36/24/ 2012-13/ CEE/ TECH/1620 dtd. 14/03/2013
Supply - 100% Erection - 50%
30-06-2015
2 4801-05800-39-53
33KV feeder integration with existing RTUs provided at EHV Sub-Stations under Electricity Department, Goa.
No.AS/36/40/2014-15/ CEE/TECH/ 1502 dtd. 24/11/2014
Supply:100%Erection: NIL
31-07-2015
3 4801-05800-39-53
Work of Design, Supply, Erection, Testing and Commissioning of Additional 110KV Transformer Bay alongwith Switchyard Equipments at Tivim S/S
AS/36/31/201314/CEE/TECH/2484 dated 03-03-2014
100% 52.58% Alreadycompleted
Electricity Department-Goa Page 136

Business Plan for the Control Period FY 2016-17 to FY 2018-19
4 4801-05800-39-53
Work of replacement of 40MVA Power Transformer No. I & II (110/33KV) with new 2 x 50 MVA Power Transformer at Tivim Sub-Station and one additional 50MVA 110/33KV Power Transformer
AS/36/30/201314/CEE/TECH/24462602-2014
110KV Control Relay Panel and 33KVControl Relay Panel as an extra/deviated items are balance
94.70% Will be completed within 03 months.
5 4801-05800-39-53
DSETC of 3rd 40MVA 110/33KV Power Transformer at Verna Plateau alongwith all associate equipments and structures
11-01-2012 4.64 cr 98% 31/12/2013
Electricity Department-Goa Page 137

Business Plan for the Control Period FY 2016-17 to FY 2018-19
11.3. Scheme: Schedule Tri be Development scheme (Plan)
Sr.No. Budget Head Name o f the scheme Date o f A dministrative
Approval
% Completion Target Date o f completionPhysical Financial
1 4801-05-796,01,53 Conversion of L.T Overhead lines to Underground network in the Schedule Tribe areas of Loutolm V.P and Raia V.P under Diviion IV, Margao in South Goa District. ..Tender 01(10)(ST)
29/03/2010 84% 72% July'2015
2 4801-05-796,01,53 Conversion of existing 11KV overhead HT network to 11KV underground cable in Loutolim constituency situated in south Goa,Tender 19(08) (ST) 13/08/2008 100% 44%
Work is completed. Rs. 25 lakhs required for settling final bill.
3 4801-05-796,01,53 Estimate for arranging LT power supply to Hamlet Khadel Mangal under tribal area plan by supply, erection, testing & commissioning of 100KVA distribution transformer centre under the jurisdiction of Elec. Sub Div-III, Sanguem.
07-10-2014 - -
N.A as as expenditure saction to the proposal is not conveyed by the Government.
Electricity Department-Goa Page 138

Business Plan for the Control Period FY 2016-17 to FY 2018-19
4 4801-05-796,01,53 Estimate for supply,erection,testing & commissioning of underground cables for existing overhead HT & LT line network in the Muncipal garden & market areas in Quepem Town under the jurisdiction of Sub Div-II, Div-VII, Curchorem in Quepem Constituency
28/11/2012 45% 65% 30/06/2015
5 4801-05-796-01-53 Estimate for work of renovation and improvement of voltage involving work of revamping of existing HT/LT overhead lines transformer centre at Mardol, Veling, Priol
20-08-2014Single tender above 27% cancelled
6 4801-05-796-01-53 Conversion of LT overhead lines to underground network in the ST areas of Nuvem Panchayat
29/03/2010 65% 32.49 cr 20/05/2013
7 4801-05-796-01-53 Conversion of existing 11kv overhead line to underground cable by 11kv 3 core 300sqmm XLPE cabling in various areas under Loutolim Assembly Constituency
13/08/2008 95% 18.49 cr 09-12-2010
8 4801-05-796-01-53 T.No.05(13-14) Conversion of 11KV Overhead line emanating from 33/11KV Canacona & Poinguinim S/S to underground network in Canacona Constituency.
12/4/2013,RS.60,91,25,988/- 50% 47.97 16-12-2015
Electricity Department-Goa Page 139

Business Plan for the Control Period FY 2016-17 to FY 2018-19
9 4801-05-796-01-53 T.No.04(13-14) SETC of 100KVA DTC containing RMU and LV switch board along with laying and erection ofLT overhead line for electrification of 08/02/2013. 100% 44.74 30-04-2015Nadquem village in Canacona under Rs.1,06,72,590/-Schedule Tribe DevelopmentScheme(plan)
Electricity Department-Goa Page 140

Business Plan for the Control Period FY 2016-17 to FY 2018-19
11.4. Scheme: Erection and augmentation of 33/11KV substation
Sr.No. Budget Head Name o f the scheme Date o f Administrative Approval
% Completion Target Dateo fcompletionPhysical Financial
1
4801-05-800-16-53
Estimate for supply erection testing & commission involving augmentation of 33/11 KV KRC substation with an additional 10 MVA power t/c (Augmentation of S/S)
25/06/2010 - -
Pending for want of
clearence from Konkan
railway corporation.
2
4801-05-800-16-53
Conversion of 11 KV and LT overhead lines to underground network in the left out parts of Margao Municipal area under the jurisdiction of Division IV, Margao and bifurcation of U/G feeders for enhancing reliability of power supply.(Augumentation of s/s)
16-05-2014tendering process in progress
Electricity Department-Goa Page 141

Business Plan for the Control Period FY 2016-17 to FY 2018-19
3
4801-05-800-16-53
Conversion of 11KV and LT overhead lines to underground network in the areas of Navelim, Mandop, Davorlim- Dicarpale, Rawanfond and Aquem-Baixo in Navelim Constituency (Augumentation of s/s)
21-02-2014WORK is to
be retendered
4
4801-05-800-16-53
Providing multiple arm (3&4 arm) 4 x 24 W T5 Street Light Fixtures at various places in Navelim in the jurisdiction of S/D-II, Divn-IV, Margao under Public Lighting Scheme (Plan)(Augumentation of s/s)
14-02-2014WORK
tendered but no response
5
4801,05,800,16,53 Estimate for replacement of MS structure on 33 KV bay with HDG Channels and ACSR conductor under Erection and Augmenation of 33/11 KV sub-station lines at lines at Saligao substation.
AS/22/30/2013-14/CEE/TECH/PLG/151dt.22/4/2013.
10% 31/10/2015
Electricity Department-Goa Page 142

Business Plan for the Control Period FY 2016-17 to FY 2018-19
6
4801,05,800,16,53 Work of renovation of 33/11KV Sancoale Substation by replacing MS Structura on 33KV bay with HDG channels alongwith civil works No. EE/DIV.XI/Tech- Tender-07/13-14/5733/ 13-14 dtd 04/03/2014. 07-10-2013
20% Work completed.
---Nil--- 31-08-2015
7
4801, 05, 800, 16, 53
Estimate for supply, erection,testing & commisioning of 33/11 KV 6.3 MVA Power Transformer at Kadamba S/S
11-02-2014
Financial Bid not yet opened
8
4801, 05,800,16, 53
Erection and Augmentation of 33/11 KV Sub-Station Lines (Plan). Bifurcation of Siolim 11kv feeder from Mapusa sub station.
02-08-2013 100% 99.3% completed- May 2015
Electricity Department-Goa Page 143

Business Plan for the Control Period FY 2016-17 to FY 2018-19
11.5. Scheme: APDRP (State schemes)
Sr.No. Budget Head Name o f the scheme Date o fAdministrativeApproval
% Completion Target Date o f completionPhysical Financial
1 4801,05,800,51,53 Conversion of 11 KV and LT overground lines to underground network in the balance parts of margao Municipal area of Salcete Taluka in the state of Goa,for Electricity Department,Govt. Of Goa.,Tender-20(09) (APDRP)
15/9/2008 100% 85% Work is completed. However bill is not settled.
Electricity Department-Goa Page 144

Business Plan for the Control Period FY 2016-17 to FY 2018-19
11.6. Scheme: Undergroun d cabling schemes (RAPDRP - During 11th Plan Period)
Sr.No. Budget Head Name o f the scheme Date o fAdministrativeApproval
% Completion Target Date o f completionPhysical Financial
1 4801-05- 800-53-53 Estimate for conversion of existing overhead 11KV/LT distribution system inth underground system along the main road from Miracle school to Dando junction for beautification of Sanguem Town under underground cabling scheme
26/11/13 N.A as as expenditure saction to the proposal is not conveyed by the Government.
2 4801-05- 800-53-53 Estimate for providing 11KV Town-II feeder for feeding power supply to 8 no's of distribution transformers of Curchorem Town.
28/05/2013 01-02-2016
3 4801,05,800,53,53 Work of conversion of HT/LT overhead lines to underground network in Sada, Bogda, baina area of Mormugao Taluka.No. EE/DIV.XI/T ech-Tender- 02/13-14//4529/ 13-14 dtd 18/12/2013.
18-04-2013 75% 32.37% 11-12-2015
Electricity Department-Goa Page 145

Business Plan for the Control Period FY 2016-17 to FY 2018-19
11.7. Scheme: Public Lighti ng
Sr.No. Budget Head Name o f the scheme Date o f Administrative Approval
% Completion Target Date o f completionPhysical Financial
1 4801,05,800,54,53 Estimate for extension of 1 phase 3 wire LT street light line and providing 128 nos. 1 x40 watts tube light fixtures in the area of Penha -de-Franca , Salvador do-Mund and Socorro in Porvorim under Public Lighting Scheme.
AS/54/87/2013- 14/CEE/TECH/PLG/2345 dt. 14/02/2014.
estimate is to be revised
2 4801-05-800-54-53 Estimate for providing 51 no's of street light fixtures at Amdai Sanguem, Valkini Colony Dhangarwada & Various areas of Banshi & Addem of Sanguem constituency.
20/11/2014 31/12/2015
3 4801-05-800-54-53 Estimate for providing 20 nos of street light fixtures in the areas of Sanguem Constituency covering Desaiwado Mangal, Gaonkarwado Mangal & V.P Caurem Pirla area
01-09-2015 31/12/2015
Electricity Department-Goa Page 146

Business Plan for the Control Period FY 2016-17 to FY 2018-19
11.8. Scheme: Erection of 220KV transmission line from Ponda to Verna
Sr.No. Budget Head Name o f the scheme Date o fAdministrativeApproval
% Completion Target Date o f completionPhysical Financial
1 4801-05-800-4653
Revised administration approval Erection of 220KV D/C line from Ponda to Verna on the existing corridor of 33KV D/C line
TS/36/35/2013-14/CEE/Tech/58
EFC'sapprovalrequired
Electricity Department-Goa Page 147

Business Plan for the Control Period FY 2016-17 to FY 2018-19
11.9. Scheme: Erection and commissioning of 220KV Substation at Verna
Sr.No. Budget Head Name o f the scheme Date o f Administrative Approval
% Completion Target Dateo fcompletion
Physical Financial
1 4801-05-800-4553
Estimate for the work of design, supply Erection & commissioning of 220/110/33KV G IS sub station at the existing Verna sub station.
TS/36/27/2013- 14/CEE/Tech/438 dt. 7/6/2013
Electricity Department-Goa Page 148

Business Plan for the Control Period FY 2016-17 to FY 2018-19
11.10. Scheme: Erection of 220KV Transmission line from Xeldem to Cuncolim
Sr.No. Budget Head Name o f the scheme Date o fAdministrativeApproval
% Completion Target Date o f completionPhysical Financial
1 4801-05-80034-61
Work of design, supply, Erection, Testing and commisioning of 220KV D/C line from existing Xeldem sub station to newly proposed sub station at Cuncolim
AS/36/01/06- 07/CEE/Tech/ 1571 dt. 14/03/2007
100% work completed and commissioned
Electricity Department-Goa Page 149

Business Plan for the Control Period FY 2016-17 to FY 2018-19
11.11. Scheme: Erection of 220.33KV substation at Cuncolim
Sr.No. Budget Head Name o f the scheme Date o fAdministrativeApproval
% Completion Target Date o f completionPhysical Financial
1 4801-05-800-3361
Work of design, supply, Erection, Testing and commisioning of 220/33KV, 3X50MVA sub station at Cuncolim
AS/36/01/06- 07/CEE/Tech/ 1525 dt. 02/03/2007
100% work completed and commissioned
Electricity Department-Goa Page 150