goal 1 assessment record - sdsm&t
TRANSCRIPT
General Education Documentation for Mines: http://www.sdsmt.edu/Academics/Office-of-the-
Provost/Assessment/General-Education-Assessment/
Goal 1 Assessment Record
Goal 1 is as follows: Students will write effectively and responsibly and will understand and interpret the written expression of others. Background All institutions in the South Dakota Board of Regents system adhere to a common set of General Education Goals and Outcomes and policies governing General Education. (See https://www.sdbor.edu/policy/documents/2-7.pdf ). The Goals are as follows:
GOAL #1: Students will write effectively and responsibly and will understand and interpret the written expression of others. GOAL #2: Students will communicate effectively and responsibly through listening and speaking. GOAL #3: Students will understand the organization, potential, and diversity of the human community through study of the social sciences. GOAL #4: Students will understand the diversity and complexity of the human experience through study of the arts and humanities. GOAL #5: Students will understand and apply fundamental mathematical processes and reasoning. GOAL #6: Students will understand the fundamental principles of the natural sciences and apply scientific methods of inquiry to investigate the natural world.
From the mid-1990s to 2017, all “rising juniors” (i.e., students on the verge of entering their junior year) took the Collegiate Assessment of Academic Proficiency (CAAP) exam. Students had to pass all sections (i.e., math, writing, science reasoning, and reading) of the exams based on ‘cut scores’ set for the SD system in order to remain enrolled and complete their undergraduate degrees. CAAP scores and sub-scores were therefore generated for ALL students and served as the system-wide assessment for the attainment of general educational outcomes. Goals 1 and 2 are considered so critical to the professional preparation of STEM students, the faculty teaching composition, technical writing, and speech collaborate each year to conduct additional assessments. Goals 3 and 4 are not adequately assessed via the CAAP exam in the view of SDSMT faculty members; therefore, instructors of humanities, history, psychology, and social science courses collaborate regularly to conduct additional assessments. In 2016, the SD system ceased using the CAAP and developed an artifact-and-rubric-based assessment process that entails system-wide coordination. Implementation begins in fall 2017. What this Document Contains Goal 1 assessment for 2010-2011 Goal 1 assessment for 2011-2012 Goal 1 assessment for 2012-2013 Goal 1 assessment for 2015-2016

General Education Documentation for Mines: http://www.sdsmt.edu/Academics/Office-of-the-Provost/Assessment/General-Education-Assessment/
GOAL 1: Written Communication (2010-2011)
Students will write effectively and responsibly and understand and interpret the written expression of others.
Student Learning Outcomes: As a result of taking courses meeting this goal, students will:
1. Write using standard American English, including correct punctuation, grammar, and sentence structure.
2. Write logically.
3. Write persuasively, with a variety of rhetorical strategies (e.g. expository, argumentative, descriptive).
4. Incorporate formal research and documentation into their writing, including research obtained through modern, technology-based tools.
Measures for Goal 1 Method of Analysis—if applicable Metrics or standards of achievement
Select scores from the National Survey of
Student Engagement, including questions
1c, 1d, 3a, 3b, 3c, 3d, 3e, 11c,
System of analysis in progress
Collegiate Assessment of Academic
Proficiency Exam in Writing Skills
• 75% or more of all Mines students should
score above the national means in writing and
reading
• 5% of all students should score in the 99th
percentile nationally in writing and reading
• 1% or fewer of all Mines students should
require remediation in writing and reading
• 95% or more of Mines students show gains in
writing and reading from freshmen to junior
year according to ACT / CAAP score analysis
Employer Survey at Career Fairs 2007-2009: Career Services interviews employers at
bi-annual career fairs about student skills and
compiles the results of the 9-10 questions asked.
Results given to departments and reported centrally
Rubric-based assessment performed by the
writing faculty
2008-2009 8 papers were randomly selected from
each of the writing courses (ENGL 1010, 279, and
289) for a total of 28 papers. Each paper is evaluated
by 2 writing faculty members using a rubric that is
based on Outcome 4 under Goal 1, including in-text
documentation, references, and sources.
At least 50% of the papers evaluated should be rated
as acceptable in all three documentation and sources
categories.

Last update of this information occurred in June 2016
Data / Results for GOAL 1: Written Communication
Measures for Goal 1 Data / results
Select scores from the NSSE
1c, 1d, 3a, 3b, 3c, 3d, 3e, 11c
1c, 1d, 3a, 3b, 3c, 3d, 3e, 11c
(See below)
Collegiate Assessment of
Academic Proficiency Exam
in Writing Skills
Data for 2008:
1. In writing, 78% of all mines students exceeded national means
2. In reading, 77% of all Mines students exceeded the national means
3. In writing, 4% of all mines students scored in the 99th percentile nationally
4. In reading, 5% of all mines students scored in the 99th percentile nationally
5. 4.1% of all Mines students require remediation in writing
6. 1.7% of all Mines students require remediation in reading
7. 91% of Mines students show gains in writing from freshmen to junior year according to ACT / CAAP score analysis
8. 95% of Mines students show gains in reading from freshmen to junior year according to ACT / CAAP score analysis
Results:
9. MET: (In writing, 78% of all mines students exceeded national means)
10. MET: (In reading, 77% of all Mines students exceeded the national means)
11. Not met (In writing, 4% of all mines students scored in the 99th percentile nationally)
12. MET: (In reading, 5% of all mines students scored in the 99th percentile nationally)
13. Not met (4.1% of all Mines students require remediation in writing
14. Not met (1.7% of all Mines students require remediation in reading
15. Not met (91% of Mines students show gains in writing from freshmen to junior year according to ACT / CAAP score
analysis
16. MET: (95% of Mines students show gains in reading from freshmen to junior year according to ACT / CAAP score
analysis
Employer Survey at Career
Fairs
Q2-How would you rate the communication skills of the SDSM&T students you interviewed?
Q3-How would you rate the communication skills of SDSM&T students compared to students from other colleges?
Q4-How would you rate the resumes submitted by SDSM&T students?
Q5-How would you rate the cover letters submitted by SDSM&T students?
(See below; aggregated quantitative results not possible as number of possible responses changed over time)
Rubric-based assessment
performed by the writing
faculty
The overall results were as follows:
• 10 papers or 41% scored in the top half, receiving 7 – 12 points.
• 13 papers or 59% scored in the bottom half, receiving 0 – 6 points.
Last update of this information occurred in June 2016
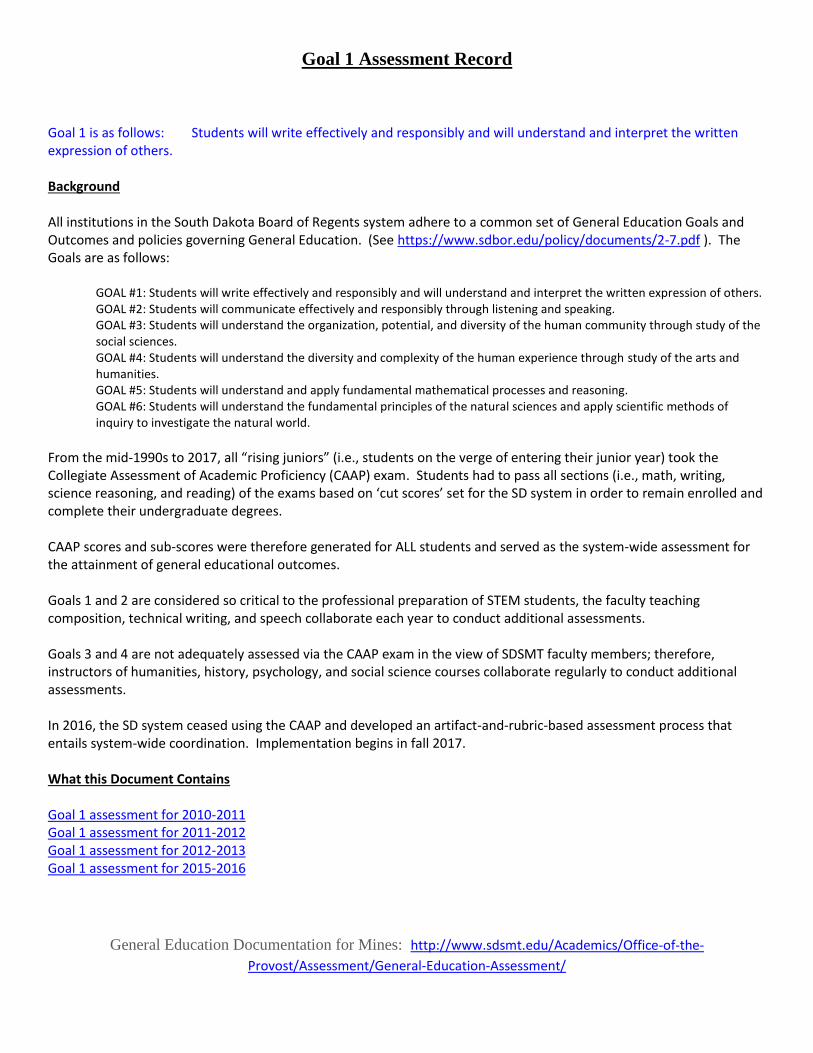
Average scores overall were as follows:
Number of Students
In-text Documentation
Works Cited or reference page
Variety of Sources
Average Total Points
24 1.8 1.8 2.2 5.8
Average overall scores by class level were as follows:
Class Level Number of Students
In-Text Documentation
Works Cited/ References
Variety of Sources
Average Total Points
Engl 101 8 2 1 1.6 4.6
Engl 279 8 2 2.6 2.7 7.3
Engl 289 8 1.5 1.9 2.1 5.5

Last update of this information occurred in June 2016
Analysis / Conclusions Regarding Improvements for
Goal 1: Written Communication
Measures for Goal 1 ANALYSIS / IDEAS FOR IMPROVEMENT
Select scores from the National
Survey of Student Engagement,
including questions
1c, 1d, 3a, 3b, 3c, 3d, 3e, 11c
Frequent writing experiences in all possible classes is—and has long been—the “answer” to getting students to develop solid
writing skills.
Collegiate Assessment of
Academic Proficiency Exam in
Writing Skills
The CAAP test is not proving to be a useful instrument in guiding improvements in reading and writing. The scores are
interesting to look at and to consult regularly, but the real impetus for improvements will come from the other sources of
assessment information cited under Goal 1.
Employer Survey at Career Fairs Employer comments are of potential didactic use and could be shared with students to reinforce teaching points. When
feasible, more use of roll-playing of interviews could improve student preparation
Rubric-based assessment
performed by the writing faculty
Observations and Discussion
• Scores are highest in Engl 279 and go down in Engl 289, perhaps because there is less “hand-holding” in Engl 289.
• The rubric does not account for variations in assignments, such as a literature review that may not require
parenthetical citations.
• Students do well with the Works Cited page, perhaps because they use online citation aids, but they need more work
with in-text parenthetical citations.
• Instructors may emphasize different elements of documentation.
• Some students resist using correct documentation or they do not see the point of using a consistent documentation
system.
• The results suggest that students are not transferring documentation skills from one writing class to the next.
• The results suggest areas of weakness that we can emphasize in our classes.
Suggestions for Improving Documentation in Student Papers
• Use peer review in class for learning documentation.
• Show the class examples of documentation plagiarism by students in the class.
• Assign students work from online tutorials on documentation.
• Create an online summary for Engl 279/289: What you should have learned in Engl 101.
• Run a “boot camp” for documentation at each class level.

Last update of this information occurred in June 2016
• Show students how to use online “easy bib” websites.
• Show students how to use citation builders now available in Office 2007.
Suggestions for Future Assessment of Goal 1
• Repeat assessment of documentation in two years.
• Start collecting papers again in Fall 2010 for assessment in Fall 2012.
• Revise the rubric to include assessment of quality of sources used.
Suggestions for Future Assessment of Goal 1
• Repeat assessment of documentation in two years.
• Start collecting papers again in Fall 2010 for assessment in Fall 2012.
• Revise the rubric to include assessment of quality of sources used.

Last update of this information occurred in June 2016
Results for questions 1c, 1d, 3a, 3b, 3c, 3d, 3e, 11c from NSSE 2008 compared to engineering students nationally (N= 11,000),
engineering and science students nationally (N= 22,000), and also students in all institutions under Carnegie class 4/year public.
School of
Mines
School of Mines compared with:
ENG + SCI ENG
1.c.
Prepared two or more drafts of a paper or
assignment before turning it in
In your experience at your institution during 1=Never, 2=Sometimes, 3=Often, 4=Very often
REWROPAP
FY 2.55 2.45 .10 2.43 .12
SR 2.41 2.28 .13 2.26 * .16
1.d.
Worked on a paper or project that required
integrating ideas or information from
various sources 1=Never, 2=Sometimes, 3=Often, 4=Very often
INTEGRAT FY 2.85 2.87 -.03 2.85 -.01
SR 3.16 3.08 .10 3.12 .05
11.c. Writing clearly and effectively GNWRITE FY 2.55 2.78 *** -.25 2.73 ** -.20
SR 2.84 2.84 .00 2.84 .01
3.a.
Number of assigned textbooks, books, or
book-length packs of course readings 1=None, 2=1-4, 3=5-10, 4=11-20, 5=More
than 20
READASGN LAC
FY 2.92 3.04 * -.14 2.99 -.09
SR 2.73 2.84 -.11 2.81 -.09
3.b.
Number of books read on your own (not
assigned) for personal enjoyment or
academic enrichment 1=None, 2=1-4, 3=5-10, 4=11-20, 5=More
than 20
READOWN
FY 2.12 2.04 .08 1.97 * .17
SR 1.97 2.16 ** -.20 2.09 -.13
3.c.
Number of written papers or reports of 20
pages or more 1=None, 2=1-4, 3=5-10, 4=11-20, 5=More
than 20
WRITEMOR LAC
FY 1.26 1.29 -.05 1.33 -.10
SR 1.85 1.71 * .17 1.88 -.03
3.d.
Number of written papers or reports
between 5 and 19 pages 1=None, 2=1-4, 3=5-10, 4=11-20, 5=More
than 20
WRITEMID LAC
FY 2.04 2.14 -.11 2.13 -.10
SR 2.49 2.40 .09 2.49 .00
For question 11.c
To what extent has your experience at this institution contributed to your knowledge, skills, and personal development in the following areas?
1=Very little, 2=Some, 3=Quite a bit, 4=Very much

Last update of this information occurred in June 2016
Career Fair Surveys of Employers and Employer Representatives
From 2007 through fall 2009 (5 events)
Question 2: How would you rate the communication skills of the SDSM&T students you met? (n=158)
• 34 excellent
• 100 good
• 24 average
Comments accompanying Question 2 responses
Communication skills overall were average. Some students were excellent while others were just okay.
This year's candidate pool was very inconsistent as far as verbal communication. We chose interviews based more on resumes this year than last. Usually, we can get a lot of information about a student's communication skills at the career fair. There were a couple of
surprisingly quiet interviewees and even a few who impressed me more once they started talking. Overall, though, SDSM&T students can put together complete answers and give good detail.
Effective communication is the most important asset a student can have to make a favorable impression
Need more personality and emphasis on this in classes, especially the grad students
Most of them were pretty good, some could use a little more practice.
Communications skills were average/comparable with most students. Prior research by students on companies would present a stronger image
Seemed like the students were really good at being able to talk to me, or very poor at it, but not a lot of "average" students.
Students could definitely benefit from some advice/training on how to sell themselves. Great talking about projects and technical but still
need to improve on selling themselves.
Some students were not sure what to ask, but we did talk to a lot of younger candidates for internships.
There are several very strong candidates for summer internships, as well as some strong prospects for future full time hires.
Students used good manners, dressed appropriately and acted professionally
Last update of this information occurred in June 2016
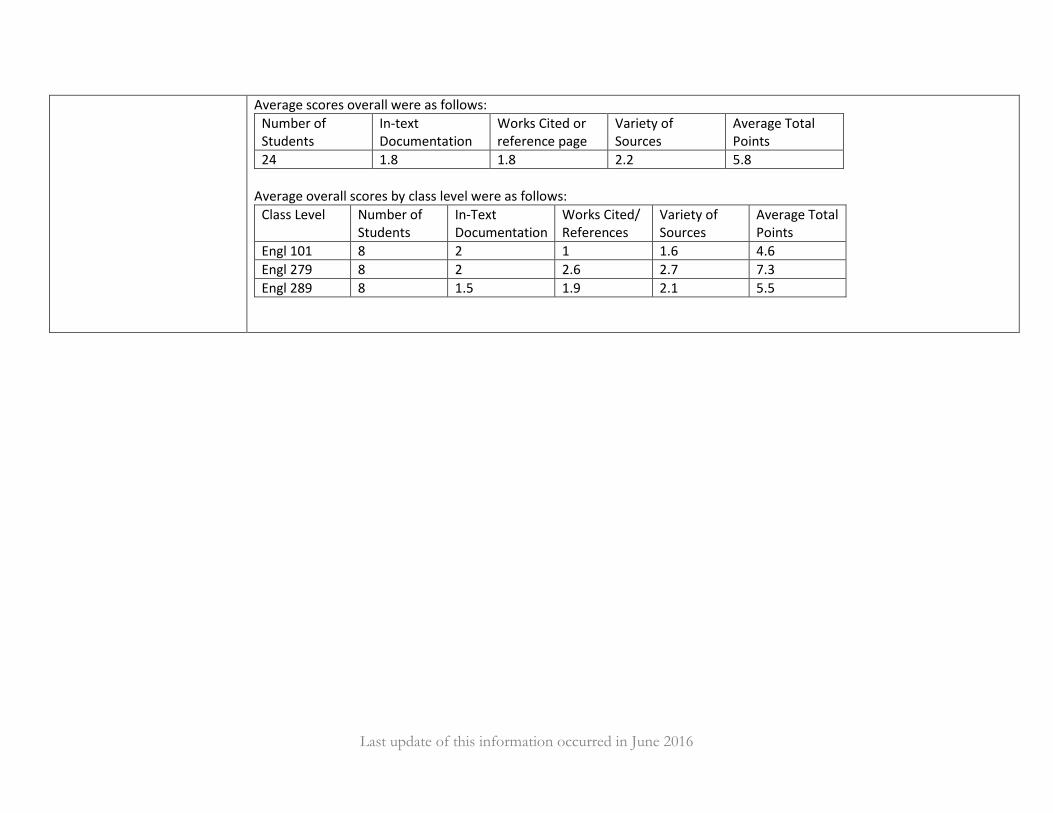
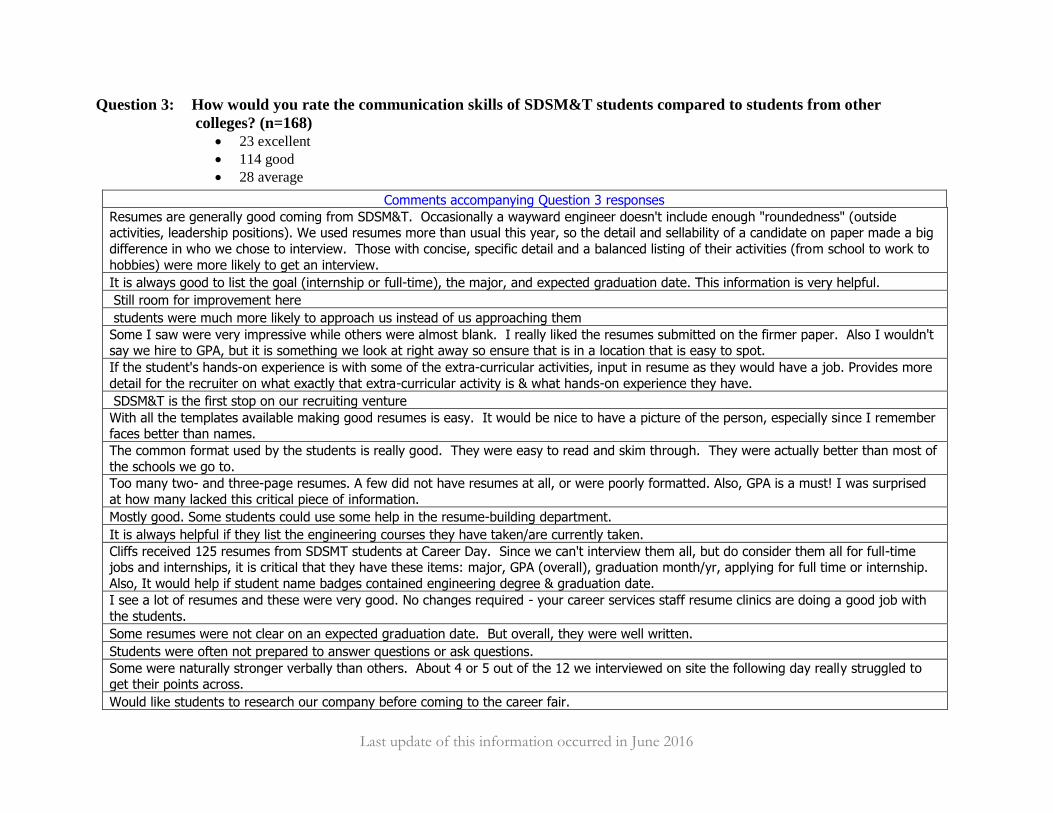
Question 3: How would you rate the communication skills of SDSM&T students compared to students from other
colleges? (n=168)
• 23 excellent
• 114 good
• 28 average
Comments accompanying Question 3 responses
Resumes are generally good coming from SDSM&T. Occasionally a wayward engineer doesn't include enough "roundedness" (outside activities, leadership positions). We used resumes more than usual this year, so the detail and sellability of a candidate on paper made a big
difference in who we chose to interview. Those with concise, specific detail and a balanced listing of their activities (from school to work to
hobbies) were more likely to get an interview.
It is always good to list the goal (internship or full-time), the major, and expected graduation date. This information is very helpful.
Still room for improvement here
students were much more likely to approach us instead of us approaching them
Some I saw were very impressive while others were almost blank. I really liked the resumes submitted on the firmer paper. Also I wouldn't say we hire to GPA, but it is something we look at right away so ensure that is in a location that is easy to spot.
If the student's hands-on experience is with some of the extra-curricular activities, input in resume as they would have a job. Provides more
detail for the recruiter on what exactly that extra-curricular activity is & what hands-on experience they have.
SDSM&T is the first stop on our recruiting venture
With all the templates available making good resumes is easy. It would be nice to have a picture of the person, especially since I remember faces better than names.
The common format used by the students is really good. They were easy to read and skim through. They were actually better than most of
the schools we go to.
Too many two- and three-page resumes. A few did not have resumes at all, or were poorly formatted. Also, GPA is a must! I was surprised
at how many lacked this critical piece of information.
Mostly good. Some students could use some help in the resume-building department.
It is always helpful if they list the engineering courses they have taken/are currently taken.
Cliffs received 125 resumes from SDSMT students at Career Day. Since we can't interview them all, but do consider them all for full-time jobs and internships, it is critical that they have these items: major, GPA (overall), graduation month/yr, applying for full time or internship.
Also, It would help if student name badges contained engineering degree & graduation date.
I see a lot of resumes and these were very good. No changes required - your career services staff resume clinics are doing a good job with
the students.
Some resumes were not clear on an expected graduation date. But overall, they were well written.
Students were often not prepared to answer questions or ask questions.
Some were naturally stronger verbally than others. About 4 or 5 out of the 12 we interviewed on site the following day really struggled to get their points across.
Would like students to research our company before coming to the career fair.

Last update of this information occurred in June 2016
Question 4: How would you rate the resumes submitted by SDSM&T students? (n=168)
• 28 excellent
• 75 good
• 30 average
• 1 poor
• 25 NAs
Comments accompanying Question 4 responses
Could use a little work, the seniors were usually "Good" or "Excellent" but the freshman and sophomore resumes could use work
The number of students with previous internships is very impressive.
Overall good resumes.
Education needs to be listed at the top of the resume.
Less than 10% of the students turned in a cover letter with their resumes.
Did not get any cover letters. Never really read them anyway when they come from events like this. When applying to a specific job, then the cover letter is important.
Not all students had cover letters.
We got very few cover letters from students at SDSM&T. They are not needed in our recruiting generally.
Not applicable to me
We didn't receive many cover letters.
Did not receive many cover letters.
Did not receive any that I am aware of.
I only saw one cover letter which I thought was helpful, but I found sentences ending in prepositions which is something up with which I will
not put.
More had internships and coops than other schools
Don't make me hunt for information. make sure GPA and graduation date and major are prominent.
The GPA's for the students interested in Power Engineering were very low
These unfortunately were all over the map. We received some very outstanding ones and some with numerous spelling errors. Those with
errors were automatically rejected as potential candidates as attention to detail is vital in design engineering and any career I believe.

Last update of this information occurred in June 2016
Question 5: How would you rate the cover letters submitted by SDSM&T students? (n=168)
• 28 excellent
• 82 good
• 28 average
• 2 fair
• 1 poor
• 25 NAs
Comments accompanying Question 5 responses
As I said before, some were very prepared while others didn't seem to know what the company did or where it was even located.
Ranged from didn't exist to excellent
Not many of your students provide cover letters, and those that do tend not to focus on what they can do for us.
About 50%-60% new somewhat who we were and what we did; others had no idea. Suggest that if a student wishes to talk to a
prospective employer, have at least some knowledge of what they do. The internet makes that possible for all.
About half the students we talked to prepared to talk to us and half didn't. Since we are a company that is a long way from campus (1000 miles) and our work involves sensitive subject matter, we understand that students won't entirely know what work we do. However, it is
nearly a deal breaker if students come up to us and say they just "want a job". Times are tough, but that doesn't excuse students from not researching and being aware of a company. We look for people who want most 1000 miles away to work on ships. It's a big personal
decision and it goes a long way for a student if they have at least looked at the possibility.
Found all to be good communicators!
Majority of the students were very prepared. A few students (Jr/Sr level) did not have a resume available to handout.
You could definitely distinguish the seniors and juniors from the lower classmen. Dressed more appropriately and showed more confidence.
The ones who knew they wanted to work with us were very prepared and impressed us. Those that just stopped by because they seen we
were looking for students with their disciplines could have been a little more prepared ahead of time and did a little more research of the company. But that is typical of most students where ever we go. One thing i would suggest is when we bring a student in for an interview
they ought to have researched the company prior to the interview. This shows us that the student is serious about wanting a job.
Most were very well prepared. Still had a lot of students that were not dressed professionally.
Being at the campus over the past 5 years has helped. Each year, more and more of the students are familiar with Cliffs and know about
our business. If they do, when we talk at the career fair we don't have to talk about us, we can let the student talk about themselves.
Could have done some light research ahead of time.
Some better than others. I would suggest more work with interview skills.
Some didn't expect us to be there so were slightly confused.
Most of the students that we met with were very organized and prepared to talk to us.
Would like students to research our company before coming to the career fair.
Students should have questions to ask to demonstrate their interest. This is especially true at an interview.

Last update of this information occurred in June 2016
Goal 1 Assessment 2011-2012 A Group Summary Report for the IDEA Student Ratings of Instruction was obtained for Spring 2011 for 21 course sections that include SDBOR General Education Goal 1 as a course goal:
• 7 sections of Engl 101—Composition I
• 7 sections of Engl 279—Technical Communications I
• 7 sections of Engl 289—Technical Communications II.
Summary: The ratings suggest that we are doing well in helping students understand and meet the course objectives. We also have multiple strengths in the area of teaching methods and styles. Department of Humanities writing faculty met on 13 November 2011 to discuss the report. The following faculty participated: K. Adkins, K. Antonen, A. Boysen, M. Hudgens, J. Lee, S. Palmer, R. Rice, S. Shirley, J. Sneller.
Return Rate: Observations • Seventeen (17) of the 21 sections had a response rate below 65%, the rate considered minimal
for dependable results.
• The average response rate for the 21 sections was 55%. Consequently, the data cannot be considered statistically dependable.
Discussion:
• Improving the response rate should be a primary concern/goal. We need more reliable data before we can have any real confidence in the statistical results.
• It is difficult to get students to respond to the online survey unless some kind of incentive (e.g., extra points) is offered. However, not all faculty are comfortable with offering incentives. Some faculty discussion of this issue might be fruitful.
• A return to paper and pen evaluations in Spring 2012 should result in an increased response rate although it should be noted that faculty can opt to continue using the online administration of the survey.
• For online surveys, we may want to set aside time during class for students to complete the surveys electronically using their tablet PCs.
Section I: Faculty Selection of Important and Essential Objectives: Observations Writing faculty agreed several years ago to mark Objective 8 as Essential and Objectives 9 and 11 as Important. Objective 8 was marked by 100% of the writing faculty. Objective 9 was marked by 95% and Objective 11 by 86%. Selection of all other objectives ranged from 10 – 19%.
Discussion:
• Selection of more than the agreed-upon objectives dilutes the results when the assessment method is analysis of a group report.
• Selection of more than 3 – 5 objectives also dilutes results for an individual course.
Section II: Student Ratings of Overall Outcomes – Comparison to IDEA Database: Observations

Last update of this information occurred in June 2016
• Part 1 shows that the distribution of ratings differs from the expectation: Actual ratings for the top 30% and bottom 30% are lower than expected. Ratings for the middle 40% are higher than expected.
• In Part 2, average converted scores are slightly below or slightly above the IDEA database average of 50-51.
• Part 3 shows the percentage of classes at or above the IDEA database average. Except for raw scores for progress on relevant objectives and the summary, the percentage is below the IDEA average in all categories.
Discussion:
• The results in Part I suggest that we are “holding our own.” The majority of scores are in the “similar” range.
• The engineering and science mission at Mines provides a unique context for the scores: How many institutions in the IDEA database have writing courses filled with engineering students?
Section III: Student Ratings of Overall Outcomes—Comparison to This Institution: Observations
• Part 1 shows that the distribution of ratings differs from the expectation: Actual ratings for the top 10% and bottom 30% are mostly lower than expected. Ratings for the middle 40% and the next higher 20% are higher than expected.
• In Part 2, average converted scores are at or slightly above the institutional average of 50.
• Part 3 shows the percentage of classes at or above the institutional average. Except for scores for excellent course/excellent teacher, the percentage is above the institutional average.
Discussion:
• The excellent course (38/57%) and excellent teacher (48/48%) scores suggest that students “like” our courses about as well as they like other freshmen/sophomore level courses.
• The high percentage (86/86%) of courses above the average for progress on relevant objectives suggests that students do recognize they are making progress towards those objectives.
• We are “holding our own” on campus in two categories.
• Establishing and meeting relevant course objectives is a strength in our Goal 1 courses..
Section IV: Student Ratings of Progression on E and I Objectives: Observations • For Objective 8: Developing skill in expressing myself orally or in writing, the raw average of 4.1
is above both the institutional and the IDEA system average. The bar graph shows that the raw average was at least 4.0 in over 70% of the writing classes surveyed compared to only about 45% of classes in the IDEA system.
• For Objective 9: Learning how to find and use resources for answering questions or solving problems, the raw average of 3.8 is slightly above the 3.7 average for the institution and the IDEA system. The bar graph shows that the raw average was at least 4.0 in 45% of the writing classes surveyed compared to about 35% of classes in the IDEA system.
• For Objective 11: Learning to analyze and critically evaluate ideas, arguments, and points of view, the raw average of 3.8 is slightly above the 3.6 average for the institution but at the 3.8 average for the IDEA system. The bar graph shows that the raw average was at least 4.0 in about 33% of the 21 classes surveyed compared to 28% for the institution and 45% for the IDEA system.

Last update of this information occurred in June 2016
Discussion:
• The ratings for Objective 8 suggest that we are doing well in helping students meet the objective. This is an area of strength for us.
• The ratings for Objectives 9 and 11 suggest that students may misinterpret the questions related to the objectives. “Solving problems” may be interpreted as not applicable for writing because of its association with quantitative skills.
• Objective 11 seems well-suited for Engl 101 but its application is less clear in Engl 279/289.
Section V: Teaching Methods and Styles: Observations These results apply only to those areas reported for 20 – 21 of the sections.
• In the area of Stimulating Student Interest, students in about 42% of our classes marked frequently for “inspired students to set and achieve goals which really challenged them.”
• In the area of Fostering Student Collaboration, students in almost 100% of our classes marked frequently for “formed ‘teams’ or ‘discussion groups’ to facilitate learning” and slightly over 60% marked frequently for “asked students to share ideas and experiences with others whose backgrounds and viewpoints differ from their own.”
• In the area of Establishing Rapport, students in 80% of our classes marked frequently for “explained the reasons for criticisms of students’ academic performance and about 55% marked frequently for “encouraged student-faculty interaction outside of class.”
• In the area of Encouraging Student Involvement, students in 80% of our classes marked frequently for “encouraged students to use multiple resources . . . to improve understanding” and about 60% marked frequently for “related course materials to real life situations.” Students marked frequently for “involved students in ‘hands on’ projects” in about 60% of the classes surveyed.
• Infrequent use at or near 30% appears for only one method: “Introduced stimulating ideas about the subject.”
Discussion:
• We have multiple strengths in the area of teaching methods and styles.
• We do a good job of providing students with feedback on their performance. We can be proud of how much/how often we conference with students.
• The heterogeneous mix of majors in our courses provides opportunities for increasing diversity in learning.
• Students make choices in setting priorities; they don’t see the importance of communication skills in the “big picture.”
• Tech Comm II requirements are not as highly prioritized as the students’ major courses are because of those other courses’ difficulty. We cover what they need in the future.
• Tech comm isn’t a particularly “stimulating” topic. Students need to recognize the freedom they have to pick topics for papers and speeches that they find interesting.
• What’s more important than “interest” is helping students understand the relevance of the writing courses to their future in the workplace.
Section VI: Student Self-ratings and Ratings of Course Characteristics: Observations
• Students’ self-reporting of their “desire to take this course” shows an average of 3.1, well below the institutional average of 3.6 and the IDEA system average of 3.7. In

Last update of this information occurred in June 2016
general, students reported “put[ting] forth more effort than other students on academic work” but did not necessarily work “harder on this course than on most courses.”
• Students’ self-reporting shows the “difficulty of subject matter” at an average of 3.1, below the institutional average of 3.5 and the IDEA system average of 3.4. In 33% of our classes, students marked difficulty at below 3.0. No student marked difficulty at 4.0 or above.
• The students’ self-reported attitude as a result of taking the course (3.5 raw/3.3 adjusted) is below the average for both the institution (3.7/3.6) and the IDEA system (3.9/3.9).
Discussion:
• Students think they work hard overall on their academic work but they don’t work particularly hard in our classes.
• Students have little motivation for taking our writing courses.
• Lack of motivation is difficult for us to address/change.
• Students may interpret “difficulty” differently than we do. Difficulty of subject matter is different from difficulty of course.
• “Difficulty” is almost impossible to define.
• The results don’t necessarily suggest “complaining” about difficulty.
• We can make the subject matter and/or the courses more difficult.
• We can raise the standards for performance without students perceiving an increase in “difficulty.”
• We can try different strategies for increasing difficulty.
• Increasing difficulty won’t necessarily result in students working harder.
Recommendations: Overall: Repeat the group report in Spring 2012 for Goal 1 courses. Faculty unwilling to use only the objectives agreed upon by the group should notify Sue so that those sections are not included in the report.
Additional observations:
• Discussion of the group report is a useful process for thinking about future directions of the department.
• We can add individual questions to the IDEA surveys, so perhaps we could write specific questions to use in all of the group report classes to get a better sense of how our “strengths” actually break down as faculty behaviors.
Submitted January 2012
Last update of this information occurred in June 2016
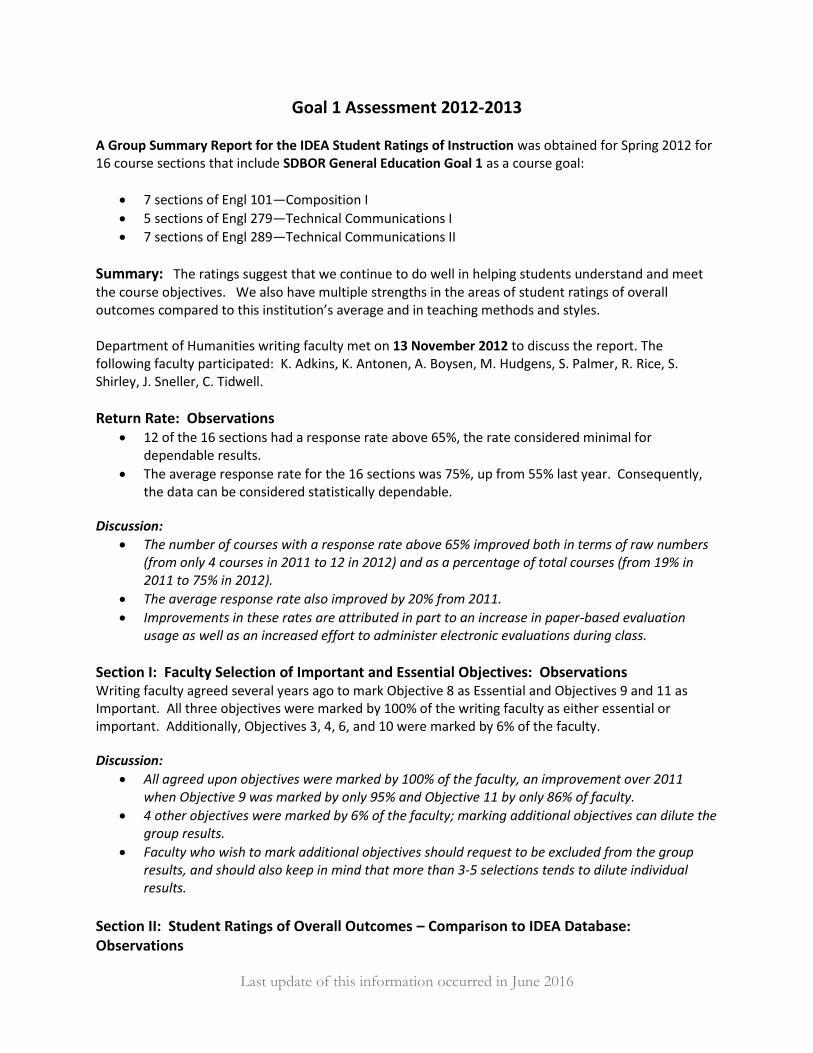
Goal 1 Assessment 2012-2013
A Group Summary Report for the IDEA Student Ratings of Instruction was obtained for Spring 2012 for 16 course sections that include SDBOR General Education Goal 1 as a course goal:
• 7 sections of Engl 101—Composition I
• 5 sections of Engl 279—Technical Communications I
• 7 sections of Engl 289—Technical Communications II
Summary: The ratings suggest that we continue to do well in helping students understand and meet the course objectives. We also have multiple strengths in the areas of student ratings of overall outcomes compared to this institution’s average and in teaching methods and styles. Department of Humanities writing faculty met on 13 November 2012 to discuss the report. The following faculty participated: K. Adkins, K. Antonen, A. Boysen, M. Hudgens, S. Palmer, R. Rice, S. Shirley, J. Sneller, C. Tidwell.
Return Rate: Observations • 12 of the 16 sections had a response rate above 65%, the rate considered minimal for
dependable results.
• The average response rate for the 16 sections was 75%, up from 55% last year. Consequently, the data can be considered statistically dependable.
Discussion:
• The number of courses with a response rate above 65% improved both in terms of raw numbers (from only 4 courses in 2011 to 12 in 2012) and as a percentage of total courses (from 19% in 2011 to 75% in 2012).
• The average response rate also improved by 20% from 2011.
• Improvements in these rates are attributed in part to an increase in paper-based evaluation usage as well as an increased effort to administer electronic evaluations during class.
Section I: Faculty Selection of Important and Essential Objectives: Observations Writing faculty agreed several years ago to mark Objective 8 as Essential and Objectives 9 and 11 as Important. All three objectives were marked by 100% of the writing faculty as either essential or important. Additionally, Objectives 3, 4, 6, and 10 were marked by 6% of the faculty.
Discussion:
• All agreed upon objectives were marked by 100% of the faculty, an improvement over 2011 when Objective 9 was marked by only 95% and Objective 11 by only 86% of faculty.
• 4 other objectives were marked by 6% of the faculty; marking additional objectives can dilute the group results.
• Faculty who wish to mark additional objectives should request to be excluded from the group results, and should also keep in mind that more than 3-5 selections tends to dilute individual results.
Section II: Student Ratings of Overall Outcomes – Comparison to IDEA Database: Observations

Last update of this information occurred in June 2016
• Part 1 shows that the distribution of ratings differs marginally from the expectation. Actual ratings for the top 10% are lower than expected in all categories; ratings for the bottom 10% of Progress on Relative Objectives are lower than expected as well. Ratings for the middle 40% are higher than expected in all categories.
• In Part 2, average converted scores are slightly below or slightly above the IDEA database average of 50-51.
• Part 3 shows the percentage of classes at or above the IDEA database average. Except for Excellent Course, raw scores are above the IDEA averages.
Discussion:
• Compared to last year, actual distribution is more in line with the expected distribution.
• The results in Part I suggest that we are “holding our own.” The majority of scores are in the “similar” range.
• In Part 3, we showed improvement in both Progress on Relevant Objectives and Excellent Teacher. These improvements may be the result of the improved response rates, since we are now seeing a more representative selection of evaluations.
• The engineering and science mission at Mines provides a unique context for the scores: How many institutions in the IDEA database have writing courses filled with engineering students?
Section III: Student Ratings of Overall Outcomes—Comparison to This Institution: Observations
• Part 1 shows that the distribution of ratings differs from the expectation: Actual ratings for the top 10% and bottom 30% are mostly lower than expected. Ratings for the middle 40% are higher than expected; ratings for the next highest 20% are higher than expected in the category of Progress on Relevant Objectives.
• In part 2, average converted scores are higher than the institutional average of 50 except in the category Excellent Course, where they are slightly lower.
• Part 3 shows the percentage of classes at or above the institutional average. Except for raw scores for Excellent Course, the percentage is above the institutional average. Scores improved in all categories over last year.
Discussion:
• The excellent course (31/57%) and excellent teacher (63%/63%) scores suggest that students “like” our courses about as well or better than they like other freshmen/sophomore level courses.
• The high percentage (88/69%) of courses above the average for progress on relevant objectives suggests that students do recognize they are making progress towards those objectives.
• We are “holding our own” on campus in all categories.
• Establishing and meeting relevant course objectives is a strength.
Section IV: Student Ratings of Progression on E and I Objectives: Observations
• For Objective 8: “Developing skill in expressing myself orally or in writing,” the raw average was 4.1, above both the institutional and the IDEA system average. The bar graph shows that the raw average was at least 3.5 in over 80% of the writing classes surveyed compared to only about 55% of classes in the IDEA system and 40% at our institution.

Last update of this information occurred in June 2016
• For Objective 9: “ Learning how to find and use resources for answering questions or solving problems,” the raw average of 3.9 is slightly above the 3.7 average for the institution and the IDEA system. The bar graph shows that the raw average was at least 3.5 in 60% of the writing classes surveyed compared to about 50% of classes in the IDEA system and less than 50% at the institution.
• For Objective 11: Learning to analyze and critically evaluate ideas, arguments, and points of view, the raw average of 3.7 is slightly below the 3.8 average for the IDEA system, but slightly above the institutional average. The bar graph shows that the raw average was at least 3.5 in about 55% of the classes surveyed compared to 45% for the institution and 60% for the IDEA system.
Discussion:
• The ratings for Objectives 8 and 9 suggest that we are doing well in helping students meet the objective. This is an area of strength for us.
• Objective 11 seems well-suited for Engl 101 but its application is less clear in Engl 279/289.
• It may be useful to shift terminology in Engl 279/289 so students recognize that what they are doing does constitute analysis and critical thinking.
Section V: Teaching Methods and Styles: Observations • In the area of Stimulating Student Interest, students in about 25% of our classes marked
frequently for “Stimulated students to intellectual effort beyond that required by most courses“ and “inspired students to set and achieve goals which really challenged them.
• In the area of Fostering Student Collaboration, students in almost 45% of our classes marked frequently for “formed ‘teams’ or ‘discussion groups’ to facilitate learning,” while 30% marked frequently for “asked students to share ideas and experiences with others whose backgrounds and viewpoints differ from their own.”
• In the area of Establishing Rapport, students in 65% of our classes marked frequently for “Displayed a personal interest in students and their learning,” while 55% marked frequently for “explained the reasons for criticisms of students’ academic performance” and about 55% marked frequently for “encouraged student-faculty interaction outside of class.”
• In the area of Encouraging Student Involvement, students in 80% of our classes marked frequently for “encouraged students to use multiple resources . . . to improve understanding”; about 35% marked frequently for “related course materials to real life situations”; around 62% marked frequently for “involved students in ‘hands on’ projects.”
• Infrequent use above 30% appears for only one method (Note: IDEA recommends teaching improvement efforts in areas where infrequent use is greater than 30%.): “Involved students in ‘hands on’ projects such as research, case studies, or ‘real life’ activities.”
Discussion:
• We have multiple strengths in the area of teaching methods and styles.
• We do an especially good job in all areas of Establishing Rapport. We can be proud of how much/how often we conference with students, how well we are connecting with them individually in class, and what a good job we do in providing apt, timely feedback.
• “Hands on” isn’t always recognized as an aspect of writing the way it is in a science lab, and consequently we might do more to define this term for our students.
Notes compiled by Dr. K. Adkins November/December 2012

Last update of this information occurred in June 2016
Section VI: Student Self-ratings and Ratings of Course Characteristics: Observations
• Students’ self-reporting of their “desire to take this course” shows an average of 2.8, below the institutional and IDEA averages of 3.7. In general, students reported “put[ting] forth more effort than other students on academic work” but did not necessarily work “harder on this course than on most courses.”
• Students’ self-reporting shows the “difficulty of subject matter” at an average of 2.9, below the institutional average of 3.5 and the IDEA system average of 3.4. In 50% of our classes, students marked difficulty at below 3.0. No student marked difficulty at 4.0 or above.
• The students’ self-reported attitude as a result of taking the course (3.3 raw/3.3 adjusted) is below the average for both the institution (3.8/3.6) and the IDEA system (3.9/3.9).
Discussion
• Students think they work hard overall on their academic work but they don’t work particularly hard in our classes.
• Students don’t understand the importance of writing in their overall curriculum.
• Lack of motivation is difficult for us to address/change within the context of the Mines curriculum.
• The results don’t necessarily suggest “complaining” about difficulty, suggesting we can make the subject matter and/or the courses more difficult.
• We can try different strategies for increasing difficulty.
• Increasing difficulty won’t necessarily result in students working harder.
• Writing is often viewed as a “talent” rather than a “skill.” Consequently, students may misunderstand questions about the “difficulty” of the course.
• Scores in the category “Amount of reading,” may be skewed by the relative lack of reading assignments in Engl 279/289.
Section VII: Faculty Self-report of the Institutional Context • Faculty employ a variety of teaching methods, but discussion/ recitation is used by 94%.
• 100% of faculty reported that their “desire to teach the course” played a role in the course’s success.
• 100% of faculty reported that their “control over course management decisions” played a role in the course’s success.
Discussion
• The use of discussion in our courses can be tied to our success in establishing a rapport with students.
• Our faculty has a genuine passion for teaching and this drives our successes.
• Our faculty has the opportunity to exercise control over course decisions, and we view this as an essential ingredient in the success or failure of any given course.
Recommendations Overall: Repeat the group report in Spring 2013 for Goal 1 courses. Faculty unwilling to use only the objectives agreed upon by the group should notify Dr. Shirley so that those sections are not included in the report. Additional observations:

Last update of this information occurred in June 2016
• Discussion of the group report is a useful process for thinking about future directions of the department.
• We can add individual questions to the IDEA surveys, so perhaps we could write specific questions to use in all of the group report classes to get a better sense of how our “strengths” actually break down as faculty behaviors.
Submitted November 2012

Last update of this information occurred in June 2016
Goal 1 Assessment 2015-2016
A Group Summary Report for the IDEA Student Ratings of Instruction was obtained for Fall 2015 for 30 course sections that include SDBOR General Education Goal 1 as a course goal:
• 9 sections of Engl 101—Composition I
• 12 sections of Engl 279—Technical Communications I
• 9 sections of Engl 289—Technical Communications II A 31st course was included in the group report received from IDEA, but this course was added incorrectly at some point in the process.
Summary: The FA 2015 ratings suggest we continue to demonstrate a high level of competence in helping students understand and meet the course objectives. We also have multiple strengths in the areas of student ratings of our selected objectives compared to this institution’s average and in teaching methods and styles. Overall, the ratings are consistent with those from SP 2015. Department of Humanities writing faculty who reviewed the group report are K. Adkins, A. Boysen, M. Hudgens, S. Palmer, R. Rice, S. Shirley, J. Sneller, and C. Tidwell.
Return Rate: Observations • Seventeen (17) of the 31 sections (55%) had a response rate above 65%, the rate considered
minimal for dependable results.
• The average response rate for the 31 sections was 68%, a decrease from the average of 76% in SP 2015. The data can be considered minimally dependable.
Discussion:
• Eighty-six (86) percent of the Goal 1 courses were surveyed via electronic forms. Since maintaining dependable response rates is important, we may want to consider returning to paper and pencil surveys or increasing efforts to administer the electronic evaluations during class time.
Section I: Faculty Selection of Important and Essential Objectives: Observations Writing faculty agreed several years ago to mark Objective 8 as Essential and Objectives 9 and 11 as Important. Objective 8 was marked by writing faculty for 100% of the classes. Objectives 9 and 11 were marked for 90% of the classes. Objectives 2, 3, and 7 were also marked.
Discussion:
• Faculty who wish to mark additional objectives are reminded that the data are available on the IDEA reports for all objectives. For the purposes of the group report, however, only 8, 9, and 11 should be marked on the FIF to ensure the most consistent results.
Section II: Student Ratings of Overall Outcomes – Comparison to IDEA Database: Observations

Last update of this information occurred in June 2016
• Part 1 shows that the distribution of ratings differs from the expectation. Actual ratings for the both the top 10% and the bottom 10% are lower than expected. Ratings for the middle 40% are much higher than expected in all categories. Ratings for the next “higher” 20% are also higher than in some categories.
• In Part 2, average converted scores are above the IDEA database average of 50-51. The average converted raw score for Progress on Relevant Objective is 4 points above the IDEA system score (55 vs. 51). This rating shows a statistically insignificant decrease from SP 2015.
• Part 3 shows the percentage of classes at or above the IDEA database averages. The scores are above the IDEA averages in all categories. The results for Progress on Relevant Objectives (77%/65%)--although a decrease from SP 2015--suggest that overall effectiveness was high.
Discussion:
• The bar graph shows consistency of results across all categories.
• According to IDEA, the results suggest that “overall instructional effectiveness was unusually high.
Section III: Student Ratings of Overall Outcomes—Comparison to This Institution: Observations
• Part 1 shows that the distribution of ratings differs from the expectation: Actual ratings for the top 10% and bottom 30% are lower than expected in some categories. Ratings for the middle 40% are higher than expected in all categories; ratings for the next “higher” 20% are also higher than expected in most categories.
• In part 2, average converted scores are higher than the institutional average of 50 except in the raw score for Excellent Course, where the average score is the same as the institutional average. The converted score for Progress on Relevant Objectives is 55/55 compared to 50/50 for the institution.
• Part 3 shows the percentage of classes at or above the institutional average. The percentages are well above the institutional average.
Discussion:
• The percentage (87/87%) of courses above the average for Progress on Relevant Objectives is down slightly from SP 2015 (93/93) but the results nevertheless suggest that students do recognize they are making progress towards those objectives.
• According to the IDEA data the overall effectiveness of Goal 1 courses appears to be highly favorable when compared to the institution.
• The results are fairly consistent across categories and with data from SP 2015.
Section IV: Student Ratings of Progression on E and I Objectives: Observations • For Objective 8: “Developing skill in expressing myself orally or in writing,” the raw average was
4.2, above both the institutional (3.7) and the IDEA system (3.8) averages. The bar graph shows that the raw average was at least 4.0 in 80% of the writing classes surveyed compared to only about 43% of classes in the IDEA system and 38% of classes at our institution.
• For Objective 9: “ Learning how to find and use resources for answering questions or solving problems,” the raw average of 4.0 is slightly above the 3.9 average for the institution and 3.7 for the IDEA system. The bar graph shows that the raw average was at least 4.0 in 50% of the writing classes surveyed compared to about 35% of classes in the IDEA system and 52% at the institution.

Last update of this information occurred in June 2016
• For Objective 11: Learning to analyze and critically evaluate ideas, arguments, and points of view, the raw average of 3.8 matches the 3.8 average of both the IDEA system and the institution. The bar graph shows that the raw average was at least 4.0 in about 35% of the classes surveyed compared to 42% for the institution and 45% for the IDEA system.
Discussion:
• The ratings for Objectives 8 and 9 suggest that we are doing well in helping students meet the objective. This is an area of strength for us, and ratings are consistent with SP 2015.
• For Objective 11, it may be useful to shift terminology in Engl 279/289 so students recognize that what they are doing does constitute analysis and critical thinking. Students may not realize that their work for the writing courses also requires analytical thinking/problem-solving skills.
Section V: Teaching Methods and Styles: Observations • Data for Teaching Methods and Styles are available for 17 of the sections surveyed.
• In the area of Stimulating Student Interest, students in 48% of these classes marked frequently for “inspired students to set and achieve goals which really challenged them.”
• In the area of Fostering Student Collaboration, students in 70% and 75%, respectively, of these classes marked frequently for “asked students to share ideas and experiences with others whose backgrounds and viewpoints differ from their own” and “asked students to help each other understand ideas or concepts.
• In the area of Establishing Rapport, students in 70% of the classes marked frequently for “displayed a personal interest in students and their learning.” Students in 45% and 52%, respectively, of these classes marked frequently for “explained the reasons for criticisms of students’ academic performance” and “encouraged student-faculty interaction outside of class.”
• In the area of Encouraging Student Involvement, students in about 95% of our classes marked frequently for “encouraged students to use multiple resources to improve understanding.” In ~76% of the classes, students marked frequently for “gave projects, tests, or assignments that required original or creative thinking.”
• In the area of Structuring Classroom Experiences, students in 50% of the classes marked frequently for “made it clear how each topic fit into the course.”
• Significant infrequent use was marked for only two methods: “demonstrating the importance and significance of the subject matter “ in 50% of the classes and “stimulated students to intellectual effort beyond that required by most courses” in 35% of the classes.
Discussion:
• We have multiple strengths in the area of teaching methods and styles.
• We do an especially good job in all areas of Establishing Rapport and Encouraging Student Involvement.
Section VI: Student Self-ratings and Ratings of Course Characteristics: Observations
• Students’ self-reporting of their “desire to take this course” shows an average of 2.8, which is below the institutional and IDEA averages of 3.7.
Last update of this information occurred in June 2016
• Students’ self-reporting shows the “difficulty of subject matter” at an average of 2.8, below the institutional and IDEA system averages of 3.4. In 65% of our classes, students marked difficulty at below 3.0. No classes showed difficulty at 4.0 or above.
• The students’ self-reported attitude as a result of taking the course (3.6 raw) is below the average for both the institution (3.9) and the IDEA system (3.9). However, the adjusted score of 3.5 is close to the institution’s adjusted score of 3.6. These scores are consistent with those from SP 2015.
Discussion
• The Fall 2015 scores are consistent with those from SP 2015.
Recommendations
Overall: Repeat the group report in Fall 2016 for Goal 1 courses and compare the results to Spring 2016. Find ways to encourage greater participation in the online surveying of courses, such as having students complete the survey in class on their tablet PCs.
Submitted May 2016 Notes compiled by Sue Shirley