goals and measures for analyzing power consumption data in
TRANSCRIPT

Journal of Data, Information and Managementhttps://doi.org/10.1007/s42488-021-00043-5
ORIGINAL ARTICLE
Goals andmeasures for analyzing power consumption data inmanufacturing enterprises
Soren Henning1 ·Wilhelm Hasselbring1 ·Heinz Burmester2 · Armin Mobius3 ·Maik Wojcieszak4
Received: 16 October 2020 / Accepted: 26 January 2021© The Author(s) 2021, corrected publication 2021
AbstractThe Internet of Things adoption in the manufacturing industry allows enterprises to monitor their electrical powerconsumption in real time and at machine level. In this paper, we follow up on such emerging opportunities for data acquisitionand show that analyzing power consumption in manufacturing enterprises can serve a variety of purposes. In two industrialpilot cases, we discuss how analyzing power consumption data can serve the goals reporting, optimization, fault detection,and predictive maintenance. Accompanied by a literature review, we propose to implement the measures real-time dataprocessing, multi-level monitoring, temporal aggregation, correlation, anomaly detection, forecasting, visualization, andalerting in software to tackle these goals. In a pilot implementation of a power consumption analytics platform, we showhow our proposed measures can be implemented with a microservice-based architecture, stream processing techniques, andthe fog computing paradigm. We provide the implementations as open source as well as a public show case allowing toreproduce and extend our research.
Keywords Power consumption · Energy management · Industry 4.0 · Internet of Things · Microservices · Stream processing
1 Introduction
The immense electrical power consumption of the manu-facturing industry (International Energy Agency 2019) is
� Soren [email protected]
Wilhelm [email protected]
Heinz [email protected]
Armin [email protected]
Maik [email protected]
1 Software Engineering Group, Kiel University, 24098 Kiel,Germany
2 Kieler Zeitung GmbH, Co. Offsetdruck KG, Radewisch 2,24145 Kiel, Germany
3 IBAK Helmut Hunger GmbH, Co. KG, Wehdenweg 122,24148 Kiel, Germany
4 wobe-systems GmbH, Edisonstraße 3, 24145 Kiel, Germany
a considerable cost factor for manufacturing enterprisesand a serious problem for environment and society. Cor-porate values, public relations, energy-related costs, andlegal requirements are therefore leading to an increas-ing energy awareness in enterprises (Shrouf et al. 2017).At the same time, trends toward the Industrial Internetof Things, Industry 4.0, smart manufacturing, and cyber-physical production systems allow to collect energy datain real time and at machine level, from smart meters ormachine-integrated sensors (Shrouf et al. 2014; Mohamedet al. 2019). Furthermore, research on big data providesmethods and technologies to analyze data of huge vol-ume and high velocity, as it is the case with powerconsumption data (Sequeira et al. 2014; Zhang et al.2018). However, even though research suggests a varietyof goals and measures for analyzing power consumptiondata, the full potential of available data is rarely exploited(Shrouf and Miragliotta 2015; Bunse et al. 2011; Coore-mans and Schonenberger 2019).
In our Industrial DevOps research project Titan (Has-selbring et al. 2019), we work on methods and tools forintegrating and analyzing big data from Internet of Thingsdevices in industrial manufacturing. Analyzing power con-sumption data in two enterprises of the manufacturingindustry serves as a case study. Both enterprises are project

J. of Data, Inf. and Manag.
partners of wobe-systems and Kiel University in the Titanproject.
In this paper, we present the goals our studied enterprisesaim at to achieve by analyzing power consumption data andpropose a set of software-based measures that serve thesegoals. As start, we conduct a literature review to identifysimilar goals in related work, suggested measures for ourgoals, and reported implementations in the literature. Ourproposed measures are compiled as part of the Titan projectfrom knowledge of domain experts within the studied pilotcases as well as from our literature review. In a pilotimplementation, we show how our proposed measures canbe implemented in an Industrial DevOps analytics platform,the Titan Control Center (Henning and Hasselbring 2021).To summarize our contributions:
1. We identify the goals reporting, optimization, faultdetection, and predictive maintenance in our pilot cases.Our literature review shows that the goals reportingand optimization are subject of research in variousdisciplines, whereas fault detection and predictivemaintenance based on industrial power consumption arestill in an early stage.
2. Based on suggestions from the domain experts in ourTitan project and results of our literature review, we pro-pose the measures real-time data processing, multi-levelmonitoring, temporal aggregation, correlation, anomalydetection, forecasting, visualization, and alerting. Fur-thermore, we provide a mapping of goals and measuresby rating the impact of measures on goals.
3. With our Titan Control Center (Henning and Has-selbring 2021) analytics platform, we show howour proposed measures can be implemented witha microservice-based architecture, stream processingtechniques, and the fog computing paradigm. We pro-vide the implementations as open source as well as apublic show case allowing to reproduce and extend ourresearch.
The remainder of this paper is structured as follows.Section 2 summarizes the results of our literature review.Section 3 briefly describes the current state of energymonitoring in our studied pilot cases. Section 4 presentsthe goals for analyzing power consumption data identifiedin our pilot cases, followed by our proposed measures fortackling these goals in Section 5. Section 6 shows howour proposed measures can be implemented in an analyticsplatform. Finally, Section 7 concludes this paper.
2 Literature review
Analyzing industrial energy data is an emerging field ofresearch. In this section, we highlight the findings of
our literature review regarding goals and measures foranalyzing power consumption data as well as related workon implementing such measures.
2.1 Goals for analyzing power consumption data
A lot of research exists, in particular, on how energy dataanalysis can contribute to reducing the energy usage inmanufacturing. For example, Vikhorev et al. (2013) pointout that making energy data available for production oper-ators promotes energy awareness. Cagno et al. (2013)show that a lack of energy consumption information pre-vents implementation of energy-saving measures. Detailedinformation is especially required at process and machinelevel for optimizing energy consumption, as highlightedby Thollander et al. (2015). For systematic monitoringand optimizing energy consumption, enterprises are movingtowards establishing an energy management (Cooremansand Schonenberger 2019). Implementing an energy man-agement requires to reveal all energy consumptions withinthe enterprise (Fiedler and Mircea 2012). Schulze et al.(2016) identify organizational measures for implementingan energy management in industry.
Increasing availability of smart meters and Internetof Things (IoT) adoption in the manufacturing industry(Industry 4.0) enable enterprises to collect energy datain great detail (Shrouf and Miragliotta 2015; Miragliottaand Shrouf 2013; Mohamed et al. 2019). This includescommercial metering systems as well as prototypical low-cost systems as proposed by Jadhav et al. (2021). Shroufand Miragliotta (2015) highlight several benefits of IoTadoption for energy data obtained from reviewing literatureand information published by European manufacturingenterprises. Tesch da Silva et al. (2020) present a systematicliterature review on energy management in Industry 4.0.
Implementing an energy management and analyzingmonitored energy data assist an enterprise in understandingits energy consumption (Miragliotta and Shrouf 2013;Vikhorev et al. 2013; Shrouf et al. 2017). It providesinsights into which devices, machines, and enterprisedepartments use how much power and during whichtimes this power is consumed. Combined with informationabout the production processes, reports can thus be usedto identify which processes consume how much power(Herrmann and Thiede 2009). In this way, measures foroptimizing energy consumption can be evaluated and savingpotentials can be identified (Bunse et al. 2011).
Literature focuses particularly on optimizing powerconsumption for economical and ecological reasons (Bunseet al. 2011; Miragliotta and Shrouf 2013; Shrouf et al. 2014;Schulze et al. 2016; Shrouf et al. 2017). Mohamed et al.(2019) report on opportunities provided by IoT energy datafor improving energy efficiency and reducing energy costs.

J. of Data, Inf. and Manag.
Shrouf and Miragliotta (2015) focus on optimizing energyusage to reduce costs and improve reputation, for example,by reducing energy wastage and improving productionscheduling. In their systematic literature review on energymanagement in Industry 4.0, Tesch da Silva et al. (2020)outline methods for improving energy efficiency and pointout current limitations for their implementation.
In order to optimize the overall power consumption, itcan be expedient to optimize the operation of machinesin production individually. For example, Vijayaraghavanand Dornfeld (2010) optimize the power consumption ofmachine tools to reduce the power consumption of an entiremanufacturing system. Shrouf et al. (2014) optimize theproduction scheduling of a single machine for minimizingoverall energy consumption costs.
A special optimization aspect is the reduction of peakloads (Herrmann and Thiede 2009; Vikhorev et al. 2013;Shrouf and Miragliotta 2015). In addition to the basicprice, which is fixed per month, and the price per kilowatthour, large-scale power consumers such as manufacturingenterprises often have to pay a demand rate. The demandrate depends on the maximum demand that occurs withina billing period. In this way, grid operators expect to havea load as uniformly as possible in the electricity grid(Albadi and El-Saadany 2008). Demand peaks are thereforedisproportionately more expensive for the customer. Thus,an optimization should aim to achieve a power consumptionas constant as possible, i.e., to distribute the demand evenlyover time (peak shaving). In order to achieve this, it isnecessary to identify periods during which relatively muchpower is demanded. Likewise, it is important to discoverwhich consumers are responsible for the demand and towhat extent (Herrmann and Thiede 2009).
Other goals besides reporting and optimization canonly rarely be found in literature. Quiroz et al. (2018)report how power consumption, which deviates from itsnormal behavior, can be an indicator for a fault such asa mechanical defect or faulty operation. Analyzing thepower consumption of machines can therefore be used toautomatically detect such faults and to react accordingly(Vijayaraghavan and Dornfeld 2010; Mohamed et al. 2019).Further, analyzing power consumption data may allowto predict future faults such that necessary maintenanceactions can be taken (Shrouf et al. 2014; Mohamed et al.2019).
2.2 Measures for analyzing power consumption data
Many studies consider near real-time processing of energydata to be necessary (Vijayaraghavan and Dornfeld 2010;Vikhorev et al. 2013; Sequeira et al. 2014; Herman et al.2018; Liu and Nielsen 2018). Proposed implementationsare therefore often using stream processing techniques and
tools (see also the following Section 2.3). Several studiespoint out that many types of power consumption analysisrequire consumption data at different levels (Vikhorevet al. 2013; Shrouf and Miragliotta 2015; Kanchirallaet al. 2020). Whereas, for example, the effect of overallpower consumption optimizations can be evaluated withdata of the overall power consumption, detecting defectsin machines requires to acquire data at machine-level.Moreover, different stakeholders are often interested inpower consumption reports of different granularity (Shroufet al. 2017). In addition to aggregating the powerconsumption of multiple consumers to larger groups, itis often required to aggregate multiple measurements ofthe same consumer over time (Shrouf and Miragliotta2015). Analyzing energy data often yields significantlybetter results if, in addition to recorded power consumption,further information is included such as operational andplanning data from the production as well as business data(Vijayaraghavan and Dornfeld 2010; Shrouf et al. 2017).
Most approaches for energy analytics platforms andenergy management systems include data visualizations(Fiedler and Mircea 2012; Vikhorev et al. 2013; Sequeiraet al. 2014; Zhang et al. 2018). Visualizations are oftenrealized as information dashboards, which contains multiplecomponents providing different types of visualization.Individual components show, for example:
– the current status of power consumption as numericvalues or gauges (Rist and Masoodian 2019; Vikhorevet al. 2013)
– the evolution of consumption over time in line charts(Vikhorev et al. 2013; Sequeira et al. 2014; Fiedler andMircea 2012)
– the distribution among subconsumers and categories(also in the course of time) (Vikhorev et al. 2013;Masoodian et al. 2015)
– correlations of individual power consumer (Sequeiraet al. 2014; Masoodian et al. 2017)
– particular important values such as the peak load(Vikhorev et al. 2013)
– detected anomalies (Chou et al. 2017)– forecasted power consumption (Singh and Yassine
2018)
Research also exists on forecasting power consumptionor detecting anomalies in power consumption data. Bothpractices are closely related. Methods for forecastingand anomaly detection create models of the past powerconsumption, explicitly or implicitly, and project it intothe future (forecasting (Martınez-Alvarez et al. 2015)) orcompare the actual power consumption with it (anomalydetection (Chou and Telaga 2014; Liu and Nielsen 2018)).Common approaches use statistical methods such asARIMA (Chujai et al. 2013) or kernel density estimation

J. of Data, Inf. and Manag.
(Arora and Taylor 2016), machine learning methods such asartificial neural networks (Din and Marnerides 2017; Zhenget al. 2017), or a combination of both (Chou and Telaga2014). Whereas much forecasting and anomaly detectionresearch exists on energy consumption of households(Chujai et al. 2013; Liu and Nielsen 2018), buildings (Aroraand Taylor 2016; Chou and Telaga 2014), and electricitygrids (Din and Marnerides 2017; Zheng et al. 2017),approaches regarding power consumption of industrialproduction environments are rare due to their irregularnature (Bischof et al. 2018). Liu and Nielsen (2018)show how alerts could be triggered when anomalies aredetected.
2.3 Implementation of measures
Software systems for implementing such measures arepresented, for example, by Sequeira et al. (2014) andRackow et al. (2015). Yang et al. (2020) propose such asystem for accessing power consumption at a universitycampus. However, these systems only focus on a subset ofmeasures proposed in this paper.
A couple of software architectures for implementingenergy data analysis are suggested. Several architectures(Sequeira et al. 2014; Shrouf et al. 2017; Herman et al. 2018;Liu and Nielsen 2018) follow the Lambda architecturepattern (Marz and Warren 2015). Such architectures deploya speed layer for fast online processing and a batchlayer for correct offline processing of data. In our pilotimplementation (see Section 6), we pursue a more recentarchitectural style of processing data exclusively online(also referred to as Kappa architecture) (Kreps 2014)by utilizing Apache Kafka’s capabilities for reprocessingdistributed, replicated logs (Wang et al. 2015). Additionally,we combine this with the microservice architecture patternand design dedicated, encapsulated microservices peranalytics task. Benefits of using microservices and, inparticular, the associated concept of polyglot persistencefor analyzing industrial energy usage are highlighted byHerman et al. (2018) and Henning et al. (2019).
Big data analytics of energy consumption heavily relieson cloud computing (Shrouf et al. 2014; Herman et al.2018; Sequeira et al. 2014; Mohamed et al. 2018; Yanget al. 2020). Sequeira et al. (2014) propose cloud connectorsoftware components for integrating data from energymeters. Recent studies suggest to apply fog computing forintegrating production data in general (Qi and Tao 2019)and energy consumption data in particular (Mohamed et al.2019). Our pilot implementation follows the suggestions ofPfandzelter and Bermbach (2019) to deploy data analyticsusing stream processing in the cloud and data preprocessingand event processing in the fog. Szydlo et al. (2017) presenthow data transformation at fog computing nodes can be
implemented using flow-based programming and graphicaldataflow modeling.
3 Studied pilot cases
In this section, we give a brief overview of our twostudied pilot cases. Both pilot cases are enterprises of themanufacturing industry.
The first studied enterprise is a newspaper printingcompany. It is characterized by high requirements onproduction speed and the fact that production downtimesare extremely critical. The company has to print and deliverdaily newspapers for the next day within only a few hoursduring the night. If newspapers would be printed too late,they are not up to date anymore and could no longer besold. Production failures would therefore be associated withsignificant economic damage. The characteristic productiontimes, with peaks in the nights before working days, arereflected, for example, in the power consumption of theair compressors as depicted in Fig. 1. In addition todaily newspaper printing, the company prints advertisingsupplements, weekly newspapers, and customer magazinesto utilize production capacity.
The second studied enterprise is a manufacturer ofoptical inspection systems for non-man-size pipelines andwells. This enterprise is characterized by a high verticalrange of manufacturing. Thus, its production environmentoperates a wide range of machines, some of which arelargely autonomous, others are primarily user-controlled.Furthermore, the manufacturer operates a rather largedata center which runs software for its administration,development, and production. In this paper, we focus onpower consumption of the production processes and not onthe power consumption of inspection systems themselves.
Both enterprises already have the necessary physicalinfrastructure to record electrical power consumption inproduction and query it during operation. Electricity metersalready capture the required data with great detail, that is,at machine level and with high frequency. We thereforedo not include approaches and techniques for acquiringpower consumption data in this paper. However, bothcompanies do not yet exploit the full potential of therecorded and stored data. Currently, they analyze the datamainly by hand and only at certain times. Much of theinformation hidden in power consumption data is thereforenot revealed yet. The reasons for this cannot be found inmissing interest, but in a lack of applicable technologies.Currently, the production operators use software providedby metering device manufactures, for example, to visualizethe stored data. However, this software does not meet allrequirements. For example, the amount of visualized datais too large, making it hard to extract the really important

J. of Data, Inf. and Manag.
Fig. 1 Power consumed forgenerating compressed air in thenewspaper printing companyover a period of 2.5 weeks. Thecurve shows a weekly patternand reflects the company’soperating hours with constantlow consumption at the weekendand peak loads at night
information. Another issue is the integration of differenttypes of electricity meters. Although standardized protocolsexist, many metering devices and systems do not applythem.
4 Goals for analyzing power consumptiondata
In this section, we identify motivations for analyzing powerconsumption data in our studied pilot cases. We classifythese motivations into the four goal categories reporting,optimization, fault detection, and predictive maintenance.Our literature review (see Section 2) suggests that thesegoals also occur in other manufacturing enterprises assimilar motivations can be found in related studies. In thefollowing, we describe each goal category in detail.
4.1 Reporting
In both studied enterprises, comprehensive reporting is par-ticularly required for an (ISO 50001 2018) certification.The ISO 50001 standard specifies requirements for orga-nizations and businesses for establishing, implementing,and improving an energy management system. It describesa systematic approach to support organizations in contin-uously improving their energy efficiency. In order to becertified to use an energy management system in compli-ance with ISO 50001, enterprises commission accreditedcertification bodies to perform regular independent audits(Jovanovic and Filipovic 2016). These certifications areusually not required by law, but serve as evidence that acompany is making efforts to save energy.
Both companies consider sustainability as an importantpillar of their corporate philosophy. ISO 500001 certifi-cation allows them to demonstrate their efforts in savingenergy to customers and other stakeholders. Moreover, inGermany, where both enterprises are located, ISO 50001certification enables cost savings as such a certification is aprerequisite for manufacturing enterprises with high power
consumption to reduce regulatory charges (e.g., reducingthe EEG surcharge (Bundesamt fur Wirtschaft und Aus-fuhrkontrolle (BAFA) 2020)). Certification is even essentialfor the manufacturer of optical inspection systems. Its cus-tomers are mainly public authorities, which often requireISO 50001 certification in their calls for tender.
Reports for ISO 50001 certification are required tojustify irregular or increasing power consumption. This is inparticular challenging for the newspaper printing company,where power consumption highly depends on the productionutilization and external influences. Hence, this companyrequires to perform complex analyses for their reports,such as correlations with external data from the productionand the environment. Moreover, the ISO 50001 standardrequires that reports on the enterprise’s energy consumptionare available for customers, stakeholders, employees, andmanagement.
4.2 Optimization
The ecological and economical motivations for optimizingenergy consumption presented in our literature review (seeSection 2) also apply to both our pilot cases. We identifythe following types of optimizing power consumption in thestudied enterprises.
Optimization of Overall Consumption For optimizing theoverall power consumption, a first step is to identify energy-inefficient machines and devices. This knowledge can thenbe used to replace them with more energy-efficient onesor retrofitting them accordingly. Furthermore, time periodsshould be detected in which devices consume energy,although it would not be necessary. Typical examples ofunnecessary energy consumption are keeping machines instandby mode or lighting workplaces outside of workinghours, but also less apparent saving potential is expected tobe discovered.
Optimization of Peak Loads Being large-scale power con-sumers, both studied pilot cases have to pay a demand rate

J. of Data, Inf. and Manag.
based on the maximum demand within a billing period.Thus, demand peaks are disproportionately more expen-sive. An optimization aim is therefore to achieve a powerconsumption as constant as possible, i.e., to distribute thedemand evenly over time (peak shaving). In order to achievethis, it is necessary to identify periods during which rela-tively much power is demanded. Likewise, it is importantto discover which power consumers are responsible forthe demand and to what extent. This includes, on the onehand, the identification of large consumers in general but,on the other hand, also demand fluctuations of individualdevices. Based on this information, production processescan be modified such that, for instance, multiple machineswith a high inrush current are not started at the same time.Reducing the overall energy consumption is highly relatedto reducing peak loads. If measures are taken to replacedevices, this has an effect on both optimization goals. Forexample, if devices that are unnecessarily operated standbyduring load peaks are turned off during these periods, notonly demand peaks are reduced, but also the enterprise’spower consumption in total.
Optimization on Machine-Level Similar to what we presentin Section 2, it is reasonable to optimize the operation ofmachines or production processes to optimize the overallpower consumption or peak loads. A potential power savingmeasure in the newspaper printing company exists in theprinting process. The number of newspapers produced perunit time depends directly on the operating speed of theprinting presses. To determine an optimal printing speed,several other factors are also taken into account, suchas reliability, which decreases when increasing productionspeed. With monitoring and analyzing the printing presses’power consumption, the company can also include energy-related costs when determining the production speed.
4.3 Fault Detection
The studied enterprises report that a power consumptionof machines, deviating from their normal behavior can bean indicator for a fault such as a mechanical defect orfaulty operation. Analyzing the power consumption cantherefore be used to automatically detect such faults andto react accordingly. A typical case of anomalous powerconsumption is a strong increase, for example, when adefect occurs suddenly. A decrease of power consumptioncan also be such an indicator as parts of a machine mayno longer be operated due to a defect. Less noticeableis a slight deviation over a longer period of time, forexample, if several minor defects occur over time. Detectingdeviations or a long-term trend in regularly fluctuatingpower consumption is even more challenging.
The central compressed air supply in the newspaperprinting company is an example for fault detection usingpower consumption data. An extensive pipe networksupplies various areas of the production environment andfinally individual machines with compressed air. Thecompressed air distribution network leaks regularly, causingair to escape. These leaks do not necessarily becomeapparent directly, but should still be repaired. As leaksresult in higher power consumption of the air compressors,power consumption data can provide an instrument forleak detection. However, since power consumption of theair compressors is subject to strong, irregular fluctuations(see Fig. 1), an increase in power consumption does notimmediately become apparent. This may be solved byconsidering the power consumption only in idle times,for example, during the weekend. An increase in powerconsumption over several weekends may thus be anindication of a leak. Figure 2 shows the average powerconsumption between Saturday 12:00 and Sunday 12:00 foreach weekend in 2017 and 2018. The course shows a steadyincrease in 2017 due to leaks in the compressed air supply.In early 2018, the company repaired several leaks, causinga tangible reduction in power consumption.
4.4 Predictivemaintenance
With regular, time-based maintenance intervals, machinesand devices are often maintained even though there is noactual need for it. This means that components and oper-ating materials are replaced since their expected operatingtime expires, although they are still functioning and couldactually continue operating. Predictive maintenance is anapproach that aims for performing maintenance actions onlyif it would otherwise results in defects or limitations inperformance or quality (Yan et al. 2017). The difficulty istherefore to decide when maintenance is really necessary.For this purpose, sensor data of the machine and its environ-ment are collected and automatically analyzed (Yan et al.2017). Our literature review (see Section 2) suggests thatpower consumption can be such data.
We distinguish between predictive maintenance andfault detection as while fault detection aims to detecterrors after they occurred, predictive maintenance refersto the detection of errors before they occur. Nevertheless,predictive maintenance is closely related to fault detectionas occurring faults often cause further faults. Therefore,early fault detection may allow future faults to be detectedand appropriate preventive measures to be taken.
An example for predictive maintenance using powerconsumption are cooling circuits as used in the studiedenterprises. Such circulation systems typically includea filter through which coolant is pumped to removeimpurities. These filters need to be replaced regularly. The

J. of Data, Inf. and Manag.
Fig. 2 Stand-by powerconsumption for generatingcompressed air in the newspaperprinting company at weekendsover a period of two years
electrical power consumption of the pump indicates theresistance within the circulation system and, thus, howpolluted the filter is. Increased power consumption cantherefore serve for detecting an upcoming filter change.Lower power consumption can also provide information.It may indicate that not enough coolant is in the circuit(referred to as dry run) and, thus, coolant needs to berefilled.
5Measures for analyzing powerconsumption data
In this section, we discuss software-based measuresfor analyzing power consumption data that support inachieving the goals defined in the previous section. Basedon our literature review in Section 2 and knowledgefrom domain experts within our studied pilot cases, wesuggest the following measures: real-time data processing,multi-level monitoring, temporal aggregation, correlation,anomaly detection, forecasting, visualization, and alerting.Different use cases weight goals differently and measuresvary in their importance for the individual goals. Wetherefore rate the impact of each measure on eachgoal and visualize these impacts on radar charts shownin Fig. 3. In the following, we briefly describe eachmeasure and characterize how each measure affects eachgoals.
5.1 Near real-time data processing
Near real-time (also referred to as online) data processingdescribes approaches, where data are immediately pro-cessed after their recording. It contrasts batch (also referredto as offline) processing, which first collects recorded dataand then processes all the collected data only at certaintimes. Whereas near real-time data processing is usuallymore difficult to design and implement than batch process-ing, it yields immediate results and, thus, allows to reactimmediately on these results.
Data processing in near real-time supports primarilythe goals optimization (see Fig. 3b), fault detection(see Fig. 3c), and predictive maintenance (see Fig. 3d)(Vijayaraghavan and Dornfeld 2010; Shrouf and Miragliotta2015). Power consumption can be efficiently optimizedif the effectiveness of energy-saving actions are evaluatedimmediately. The sooner a fault is detected and reported,the faster it can be reacted to the fault and, therefore,the more valuable its detection is. Predictive maintenancerequires processing monitoring data in real time asotherwise the time for maintenance may be determinedafter the maintenance should have already been performed(Sahal et al. 2020). Although a real-time overview of theenterprise’s energy usage at any time is not required forISO 50001 audits, it assists in reporting (see Fig. 3a)the power consumption, for example, to the management(Miragliotta and Shrouf 2013).
5.2 Multi-level monitoring
We suggest to organize power consumers in a hierarchicalmodel, where groups of devices and machines are furthergrouped into larger groups (Henning and Hasselbring 2020).Multiple such models have to be maintained in parallel. Forexample, it is reasonable to organize devices by their type(e.g., all air compressors), but also to organize them by theirphysical location (e.g., a certain shop floor).
Besides monitoring groups of consumers, for example,via sub-distribution units, data for groups can also beobtained by aggregating the consumption of all its partialconsumers. In particular, this is necessary for devices which,for reasons of redundancy, have more than one powersupply. Here, the overall machine’s power consumptionis usually more important than the power consumptionof the individual power supplies. Comparing the powerconsumption monitored by sub-distribution units withaggregated data of all known sub-consumers may revealconsumptions, which were unknown so far.
Hierarchical models of power consumers particularlysupport reporting (see Fig. 3a) as they offers insights at

J. of Data, Inf. and Manag.
Fig. 3 Impact rating of theproposed measures for the fourgoals presented in Section 4. Thelarger its distance from the radarchart’s center is, the higher ameasure’s impact was weightedon the corresponding goal
Real-TimeProcessing
Multi-LevelMonitoring
TemporalAggregation
Correlation
AnomalyDetection
Forecasting
Visual-ization
Alerting
(a) Reporting
Real-TimeProcessing
Multi-LevelMonitoring
TemporalAggregation
Correlation
AnomalyDetection
Forecasting
Visual-ization
Alerting
(b) Optimization
Real-TimeProcessing
Multi-LevelMonitoring
TemporalAggregation
Correlation
AnomalyDetection
Forecasting
Visual-ization
Alerting
(c) Fault Detection
Real-TimeProcessing
Multi-LevelMonitoring
TemporalAggregation
Correlation
AnomalyDetection
Forecasting
Visual-ization
Alerting
(d) Predictive Maintenance
which times which consumers or groups consume howmuch power. Power consumption can be optimized (seeFig. 3b) on machine-level as well as on aggregated data (seeSection 2). Furthermore, our literature review shows thatalso fault detection (see Fig. 3c) and predictive maintenance(see Fig. 3d) may be performed on different levels.
5.3 Temporal aggregation
Temporal aggregation refers to summarizing multiplemeasurements of the same consumer over time to onedata point. It serves for: (1) reducing the number of datapoints for storage and (2) simplifying data analysis byproviding a more abstract view on the data. Therefore,temporal aggregation supports humans in comprehendingthe monitored power consumption data and, thus, reporting(see Fig. 3a) as well as manual identifying optimizationpotentials. Also automatic data processing for optimization(see Fig. 3b), fault detection (see Fig. 3c), and predictivemaintenance (see Fig. 3d) may benefit from aggregateddata. We distinguish two different kinds of temporalaggregation as described in the following.
Aggregating TumblingWindows The first kind is to collectand aggregate all measurements in consecutive, non-overlapping, fixed-sized time windows (tumbling windows(Carbone et al. 2019)). An appropriate size for such
windows is, for example, 5 minutes so that every 5 minutesa new aggregation result is computed representing theaverage, minimal, and maximal power consumption overthe previous 5 minutes. The number of data points can thusbe massively reduced, which is required for several formsof storing, analyzing, and visualizing data. We suggest toperform multiple such aggregations (e.g., for time windowsof size 1 minute, 5 minutes, and 1 hour) and store theiraggregation results for different durations. This allows tostore more recent (and more interesting) data with moredetail than data from the previous months or years.
Aggregating Temporal Attributes The second kind oftemporal aggregation is to aggregate all data points havingthe same temporal attribute such as day of week orhour of day. The set of aggregated data points allows tomodel or identify seasonality. For example, aggregating allmeasurements recorded at the same day of week allows toshow the average power consumption course over a week.Likewise, aggregating based on the hour of the day allowsto obtain the average course of a day.
5.4 Correlation
Our literature review (see Section 2) shows how operationaland planning data from the production as well asbusiness data can be included in different types of power

J. of Data, Inf. and Manag.
consumption analysis. Furthermore, it is reasonable tocorrelate the power consumption of different consumers astheir power consumption may depend on each other if theirproduction processes are depended (Bischof et al. 2018).
Correlating power consumption data with productiondata supports reporting (see Fig. 3a) as it allows for betterunderstanding the power consumption. Management levelsmight be interested in a correlation with business data asthis allows to report about, for example, the energy costs perproduced unit. In particular, correlation can serve as triggerfor optimization (see Fig. 3b), fault detection (see Fig. 3c),and predictive maintenance (see Fig. 3d). If, for example,the power consumption of a machine increases rapidly whilealso the production speed increases, the increasing powerconsumption was most likely not caused by a fault. If,however, the production speed remains constant and noother production data justifies the increase, a fault detectioncould be triggered. Correlations of power consumptionof different consumers are interesting for reporting, butalso for optimizations, in particular for reducing loadpeaks.
5.5 Anomaly detection
Anomaly detection (also referred to as outlier detection)describes methods for automatically finding unexpectedpattern in data (Chandola et al. 2009). We suggest to employanomaly detection techniques to discover time periods,during which power consumption is unexpectedly high orlow, like it is done for energy consumption of building orhousehold in related work (see Section 2). This includescontinuously computing anomaly scores for observed powerconsumption and comparing these anomaly scores withpreviously defined thresholds. We suggest to apply anomalydetection both on monitored and aggregated data (seeSection 5.2).
Primarily, anomaly detection serves as a measure forthe goal of fault detection (see Fig. 3c). Faults in devices,machines, or production processes are deviations from thedesired behavior and, thus, anomalous behavior of powerconsumption may indicate an occurring fault. Detectinganomalies in power consumption exclusively in relationto time is often not sufficient. The consumption ofmany devices is subject to external influences such astemperature (Liu and Nielsen 2018) and, especially inproduction environments, the operating times of machinesdo not follow daily or weekly patterns (Bischof et al.2018). Correlating power consumption with environmental,operational, and planing data (see Section 5.4) thereforeassists in detecting anomalies.
Furthermore, anomaly detection allows to identifypotential applications of optimization (see Fig. 3b) andpredictive maintenance (see Fig. 3d) and supports in
explaining power consumption behavior in reporting (seeFig. 3a).
5.6 Forecasting
As highlighted in our literature review (see Section 2), ana-lyzing power consumption data allows to make predictionsabout the future power consumption. Similar to anomalydetection, predicting power consumption in industrial pro-duction poses additional challenges in contrast to predictingpower consumption of households, buildings, or electricitygrids. To cope with the irregular nature of industrial powerconsumption, correlation with environmental, operational,and planning data (see Section 5.4) promises to create moreaccurate models.
Forecasting the power consumption of machines in addi-tion to the overall production environment supports opti-mization (see Fig. 3b) as it allows to detect load peaksbefore they actually occur. Thus, production operators maytake appropriate countermeasures such as replanning pro-duction processes. Making predictions about the futurestatus of the production environment is required for pre-dictive maintenance. Thus, forecasting power consumptionenables predictive maintenance (see Fig. 3d) based on powerconsumption data. Fault detection (see Fig. 3c) based onanomaly detection often relies on forecasts by comparingthe actual consumption with the expected (i.e., forecasted)one. Furthermore, forecasting can be used in reporting (seeFig. 3a) as it supports planing and decision making forbusiness and production operation.
5.7 Visualization
According to our literature review in Section 2, wepropose to visualize analyzed power consumption data ininformation dashboards. This way, visualizations integrateindividual measures proposed in this chapter and serve asa link between data analysis and the users. Dashboardsshould be dynamic and interactive in the sense that theyare updating their visualized data continuously and let usersinteract with them (Rist and Masoodian 2019). For example,dashboards may start with a rough outline of the overallproduction’s power consumption but allow users to zoomin and show specific machines and time periods in detail.We summarize typical visualizations for an industrial powerconsumption dashboard in Section 2.2.
As state-of-the-art libraries and frameworks for datavisualization are largely based on web technologies(Bostock et al. 2011), it is reasonable to implementdashboards as web applications. This has the additionaladvantage that the visualization is user-friendly accessiblesince it does not have further requirements on software orhardware infrastructure than a web browser.
J. of Data, Inf. and Manag.
First and foremost, dashboards enable reporting (seeFig. 3a) on power consumption. Appropriate visualizationallows to understand how power consumption is composed,observe changes in power consumption over time, andcompare the power consumption of different machines andproduction processes. Enterprises may provide differentdashboards for different stakeholders to only show theinformation, which is relevant for the corresponding targetaudience (Shrouf and Miragliotta 2015). Visualizationsassist in optimization (see Fig. 3b) as they allow to identifyoptimization potentials and enable operators to checkwhether optimization actions are effective. Furthermore,interactive visualizations can motivate, trigger, and enableenergy saving actions (Rist and Masoodian 2019). Adashboard may also show information concerning faultdetection (see Fig. 3c) and predictive maintenance (seeFig. 3d) and provide means to verify whether faults andmaintenance actions are detected successfully (Shrouf andMiragliotta 2015).
5.8 Alerting
Industrial production becomes increasingly autonomous(Lasi et al. 2014). Permanently observing a dashboard (seeSection 5.7) and waiting for faults or necessary maintenanceto be detected can therefore be a tedious work. Instead,it would be convenient to automatically notify productionoperators when faults are detected or maintenance actionshave to be taken (see Figs. 3c and 3d). Depending on theirfrequency and severity, such notifications and alerts maybe sent via email or messenger. For reporting (see Fig. 3a)purposes, such notifications may additionally be displayedin a dashboard. Furthermore, operators may be notified ifoptimization potential is detected (see Fig. 3b), for example,by generating an alert if a load peak is about to occur.
6 Pilot implementation of themeasures
In this section, we show how the measures proposed inSection 5 can be implemented in a software architecture thatadopts the microservice architecture pattern, big data streamprocessing techniques, and fog computing. In our Titanproject on Industrial DevOps (Hasselbring et al. 2019), wedevelop methods and techniques for integrating IndustrialInternet of Things big data. A major emphasis of the projectis to make produced data available to various stakeholdersin order to facilitate a continuous improvement process. TheTitan Control Center1 is our open source pilot applicationfor integrating, analyzing, and visualizing industrial big data
1https://github.com/cau-se/titan-ccp
from various sources within industrial production (Henningand Hasselbring 2021).
The architecture of the Titan Control Center followsthe microservice pattern (Newman 2015). It consists ofloosely coupled components (microservices) that can bedeveloped, deployed, and scaled independently of eachother (Hasselbring and Steinacker 2017). Our architecturefeatures different microservices for different types ofdata analysis. Individual microservices do not share anystate, run in isolated containers (Bernstein 2014), andcommunicate only via the network. This allows eachmicroservice to use an individual technology stack, forexample, to choose the programming language or databasesystem that fits the service’s requirements best. In a previouspublication (Henning et al. 2019), we show how thesearchitecture decisions facilitate scalability, extensibility, andfault tolerance of the Titan Control Center.
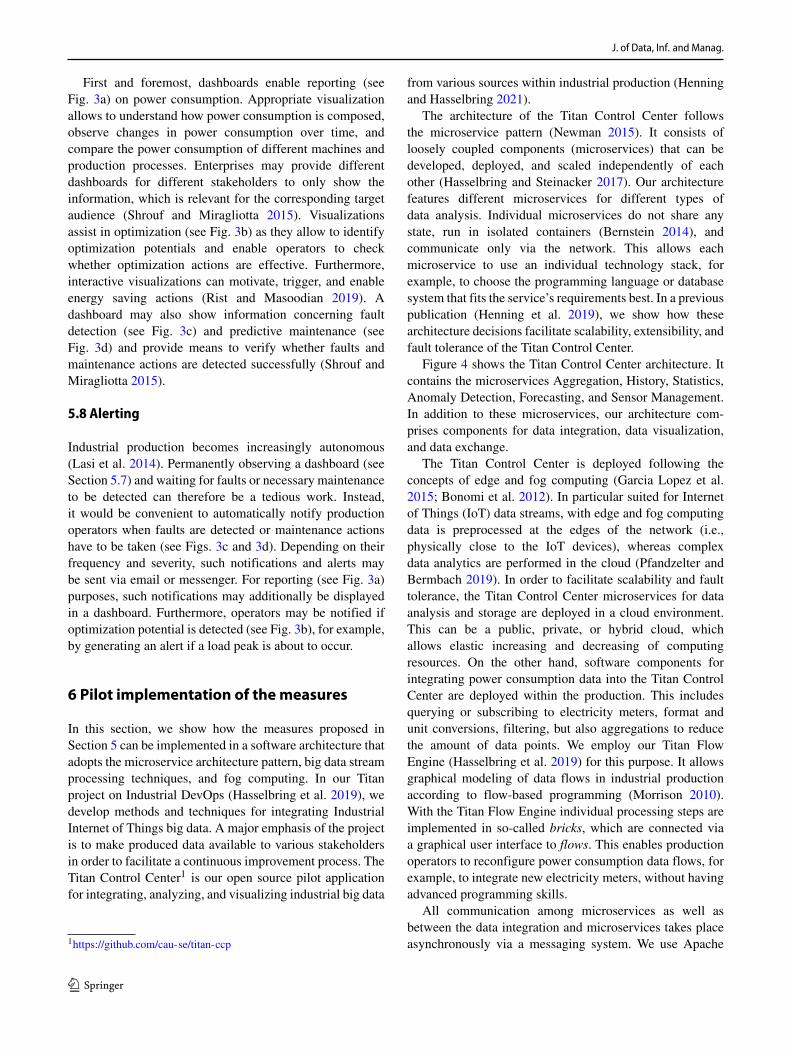
Figure 4 shows the Titan Control Center architecture. Itcontains the microservices Aggregation, History, Statistics,Anomaly Detection, Forecasting, and Sensor Management.In addition to these microservices, our architecture com-prises components for data integration, data visualization,and data exchange.
The Titan Control Center is deployed following theconcepts of edge and fog computing (Garcia Lopez et al.2015; Bonomi et al. 2012). In particular suited for Internetof Things (IoT) data streams, with edge and fog computingdata is preprocessed at the edges of the network (i.e.,physically close to the IoT devices), whereas complexdata analytics are performed in the cloud (Pfandzelter andBermbach 2019). In order to facilitate scalability and faulttolerance, the Titan Control Center microservices for dataanalysis and storage are deployed in a cloud environment.This can be a public, private, or hybrid cloud, whichallows elastic increasing and decreasing of computingresources. On the other hand, software components forintegrating power consumption data into the Titan ControlCenter are deployed within the production. This includesquerying or subscribing to electricity meters, format andunit conversions, filtering, but also aggregations to reducethe amount of data points. We employ our Titan FlowEngine (Hasselbring et al. 2019) for this purpose. It allowsgraphical modeling of data flows in industrial productionaccording to flow-based programming (Morrison 2010).With the Titan Flow Engine individual processing steps areimplemented in so-called bricks, which are connected viaa graphical user interface to flows. This enables productionoperators to reconfigure power consumption data flows, forexample, to integrate new electricity meters, without havingadvanced programming skills.
All communication among microservices as well asbetween the data integration and microservices takes placeasynchronously via a messaging system. We use Apache

J. of Data, Inf. and Manag.
<<microservice>>Sensor
Management
Control Center
<<microservice>>Forecasting
<<microservice>>AnomalyDetection
<<microservice>>Statistics
<<microservice>>History
<<microservice>>Aggregation
<<edge component>>Integration
Dashboard
REST
Fig. 4 Microservice-based pilot architecture of the Titan Control Center for analyzing electrical power consumption
Kafka (Kreps et al. 2011) in our pilot implementation.Moreover, the Titan Control Center features two single-page applications that visualize analyzed data and allows forconfiguring the analyses.
In the following, we present how each measure proposedin Section 5 can be implemented using the Titan ControlCenter.
6.1 Near real-time data processing
Power consumption data is processed in near real time atall architectural levels of the Titan Control Center. Thisstart by the ingestion of monitoring data and immediatefilter, convert, and aggregate operations in the Titan FlowEngine at the edge. The final integration step is sendingthe monitoring data to the messaging system. Following thepublish–subscribe pattern, microservices subscribe to thisdata stream and are notified as soon as new data arrive. Inthe same way, individual microservices communicate witheach other asynchronously. Apache Kafka as the selectedmessaging system is proven for high throughput and lowlatency (Goodhope et al. 2012). Within microservices, weprocess data using stream processing techniques (Cugolaand Margara 2012). This implies that microservicescontinuously calculate and publish new results as new dataarrive. For implementing stream processing architectures inmost of the microservices we use Kafka Streams (Sax et al.2018). As all computations are performed in near real time,also the visualizations can be updated continuously. Hence,the visualization applications (see Section 6.7) periodicallyrequest new data from the individual services.
6.2 Multi-level monitoring
The Aggregation microservice (Henning and Hasselbring2019) of the Titan Control Center computes the powerconsumption for groups of machines by aggregating thepower consumption of the individual subconsumers. Thismicroservice subscribes to the stream of power consumptionmeasurements coming from sensors, aggregates thesemeasurement continuously according to configured groups,and publishes the aggregation results via the messagingsystem as if they were real sensor measurements. In additionto sensor measurements, however, these data are enrichedby summary statistics of the aggregation.
As proposed in Section 5.2, the Aggregation microser-vice supports aggregating sensor data in arbitrary nestedgroups and multiple such nested group structures in paral-lel. In one of our studied enterprises, we integrate powerconsumption data of different kinds of sensors, which pro-vide data in different frequencies. An important requirementfor the Aggregation service was therefore to support dif-ferent sampling frequencies. Furthermore, besides the focuson scalability throughout the entire Control Center archi-tecture, an important requirement for this microservice isto reliably handle downtimes and out-of-order or late arriv-ing measurements. Therefore, it allows to configure therequired trade-off between correctness, aggregation latency,and performance (Henning and Hasselbring 2020).
The Sensor Management microservice of the Titan Con-trol Center allows to assign names to sensors and arrangethese sensors in nested groups. For this purpose, theTitan Control Center’s visualization components provides a

J. of Data, Inf. and Manag.
corresponding user interface. The Sensor Management ser-vice stores these configuration in a MongoDB (MongoDB2019) database. It publishes changes of group configura-tions via the messaging system such that the Aggregationservice (and potentially other services) are notified aboutthese reconfigurations. The Aggregation service is designedin a way that, when receiving reconfigurations, it immedi-ately starts aggregating measurements according to the newgroup structure. Further, as aggregations are performed onmeasurement time and not on processing time, it supportsreprocessing historical data.
6.3 Temporal aggregation
Both types of temporal aggregations discussed inSection 5.3 are supported by the Titan Control Center. Asboth types serve different purposed, they are implementedin individual microservices. Both services subscribe toinput streams, which provide monitored power consump-tion from sensors as well as aggregated power consumptionfor groups of machines.
Aggregating Tumbling Windows The History microservicereceives incoming power consumption measurements andcontinuously aggregates all data items within consecutive,non-overlapping, fixed-sized windows. The results of theseaggregations are stored to an Apache Cassandra (Lakshmanand Malik 2010) database as well as published for otherservices. The History service supports aggregations formultiple different window sizes in parallel, allowing togenerate time series with different resolutions. To preventthe amount of stored data from becoming too large, timeseries of different resolutions are assigned different times tolive. Thus, the Titan Control Center allows, for example, tostore raw measurements captured with high frequency foronly one day, but aggregated values in minute resolution foryears. Window sizes and times to live can be individuallyconfigured according to requirements for trackability andavailability of storage infrastructure.
Aggregating Temporal Attributes The Statistics microser-vice aggregates power consumption measurements by atemporal attribute (e.g., day of week) to determine an aver-age course of power consumption, for example, per weekor per day. These statistics are continuously recomputed,stored in a Cassandra database, and published for other ser-vices, whenever new input data arrives. In our studied pilotcases we found out that in particular the average consump-tions over the day, the week, and the entire year allow todetect pattern in the consumption. Furthermore, aggregatingtemporal attributes such as the month of the year over oneyear allows to observe how monthly peak loads evolve overtime.
6.4 Correlation
The Titan Control Center provides different features forcorrelating power consumption data. One of these featuresis graphical correlation of power consumption of differentmachines or machine groups. Our visualization component(see Section 6.7) provides a tool, which allows a user tocompare the power consumption of multiple consumers intime series plots (see Fig. 5). It displays multiple time seriesplots below each other, each containing multiple time series.The user can zoom into the plots and shift the displayed timeinterval. All charts are synchronized by the time domain,thus zooming or shifting one plot also effects the others(Johanson et al. 2016). This tool allows operators to analyzeinteresting points in time (such as outtakes or load peaks) inmore detail.
Together with the newspaper printing company, weimplemented a first proof of concept for correlating real-time production data with power consumption data. Wecorrelated the printing machines’ power consumption withtheir printing speed. For this purpose, we integrated theproduction management system using the Titan FlowEngine and visualized both types of data in our visualizationcomponent. Even though we were able to show thefeasibility of such a real-time correlation, we identified thatfor in-depth analyses, power consumption data with higheraccuracy is required. Similarly, we prototypically correlatedthe power consumption of air conditioning systems withweather data. We identified a high impact of the outsidetemperature on the power consumed for cooling and,thus, use weather data as a feature for our forecastingimplementations (see Section 6.6).
6.5 Anomaly detection
The Titan Control Center envisages individual microser-vices for independent anomaly detection tasks and, hence,allows to choose an appropriate technique for each task.This includes individual techniques for different productionenvironments and even for different machines.
With our pilot implementation, we already provide anAnomaly Detection microservice, which detects anomaliesbased on summary statistics of the previous powerconsumption. These statistics (e.g., per hour of week)are continuously recomputed by the Stats microservice(see Section 6.3) for each machine and machine groupand published via the Control Center’s messaging system.Our Anomaly Detection microservice subscribes to thisstatistics data stream and joins it with the stream ofmeasurements (from real machines or aggregated groupsof machines). Ultimately, this means each incomingmeasurement is compared to the most recent summarystatistics of the corresponding point in time and machine.

J. of Data, Inf. and Manag.
Fig. 5 Screenshot showing thegraphical correlation of powerconsumption using the TitanControl Center
If the measured power consumption deviates to muchfrom the average consumption of the respective hour andweekday, it is considered as an anomaly. More precisely,for a measurement x and summary statistics providing thearithmetic mean μ and standard deviation σ , the servicecomputes the absolute distance from the arithmetic meand = |x − μ| and tests if d < kσ , where k is theconfigurable number of standard deviations. All detectedanomalies are again published to a dedicated data streamvia the messaging system, allowing other microservicesto access detected anomalies. Moreover, the microservicestores all detected anomalies in a Cassandra database.
The currently implemented method for detecting anoma-lies is rather simple. It does not require complex modeltraining or manual modeling, but is not able to considertrends, seasonality over larger time periods, or externalvariables. We are working on extending our pilot imple-mentation, in order to join the measurement stream withthe data stream published by the forecasting service (seeSection 6.6). This implementation will consider measure-ments as anomalies if they deviate too much from theprediction, which is a common approach for anomaly detec-tion.
6.6 Forecasting
Similar to anomaly detection, we envisage individual Fore-casting microservices for different types of forecasts, forexample, used for different power consumers. Forecastingbenefits notably from the microservice pattern since tech-nologies used for forecasting often differ from the ones usedfor implementing web systems. The Titan Control Centersupports arbitrary Forecasting microservices, each using itsown technology stack. The only requirement for a Fore-
casting service is that it is able to communicate with otherservices via the messaging system.
Our pilot implementation already features a microservicethat performs forecasts using an artificial neural networkwith TensorFlow (Abadi et al. 2016). This neural networkis trained offline using historical data and mounted into themicroservice at start-up. During operation, the Forecastingmicroservice subscribes to the stream of measurements(again monitored or aggregated) and feeds each incomingmeasurement into the neural network. The forecast resultsare stored in an OpenTSDB (The OpenTSDB Authors 2018)time series database and published to a dedicated stream viathe messaging system.
In a first proof of concept, we build and trained suchneural networks together with the newspaper printingcompany. We selected a set of machines in the companywith different power consumption patterns and trainedindividual networks per machine. These neural networksuse not only the historical power consumption of theirmachines as input, but also the power consumption ofother machines as well as environmental data, such as theoutside temperature. We deploy individual instances of ourForecasting microservice for each neural network, allowingfor individual forecasts of each machine.
6.7 Visualization
As suggested in Section 5.7, the Titan Control Center fea-tures web applications for visualizing power consumptiondata. Since visualization serves as a measure to integratethe results of other measures, we also regard the visualiza-tion software components as integration of the individualanalysis microservices. The Titan Control Center providestwo single-page applications for visualization: a graphical

J. of Data, Inf. and Manag.
Fig. 6 Screenshot of the TitanControl Center
user interface, tailored to the specific functions of the TitanControl Centers, and a dashboard for simple, but highlyadjustable data visualizations. In the following, we describeboth applications and their corresponding use cases.
ControlCenter The Titan Control Center user interface2 servesto provide a consistent access to all functionalities of theTitan Control Center. This includes visualizing the analysisresults of microservices, but also control functions for con-figuring microservices. The user interface is implementedwith Vue.js (You 2019) and D3 (Bostock et al. 2011).
Figure 6 shows a screenshot of the Titan Control Center’ssummary view. It consists of several components whichcollect and show the individual analysis results for theentire production. A time series chart displays the powerconsumption in course of time. This chart is interactive,allowing to zoom and shift the displayed time interval.Colored arrows indicate how the power consumptionevolved within the last hour, the last 24 hours, and thelast 7 days. A histogram shows a frequency distributionof metered values serving to detect potential for loadpeak reduction. A pie chart breaks down the total power
2We provide a public show case of the Titan Control Center at http://samoa.se.informatik.uni-kiel.de:8185.
consumption into subconsumers. Line charts display theaverage course of power consumption over the week orthe day, as provided by the Statistics microservice (seeSection 6.3). The visualizations are periodically updatedwith new data. This causes, for example, the time seriesdiagram to shift forward continuously and the arrows tochange color and direction.
Apart form this summary view, our pilot implementationalso provides the described types of visualization forindividual machines and groups of machines. Startingfrom an overview of the total power consumption, auser can thus navigate through the hierarchy of allconsumers. Furthermore, the single-page application allowsto graphically correlate data (see Section 6.4) and toconfigure machines and machines groups maintained by theSensor Management service. Visualizations of forecasts anddetected anomalies are currently under development.
Dashboard The second application is a pure visualizationdashboard implemented with Grafana (Grafana Labs 2020)(see Fig. 7). It provides a set of common visualizations suchas line charts, bar charts, and gauges. As presented in Fig. 7,we mainly display time series charts as bar or line charts.The dashboard is highly adjustable, meaning that users

J. of Data, Inf. and Manag.
Fig. 7 Screenshot of the Titandashboard implemented withGrafana (Wetzel 2019)
can add, modify, and rearrange chart components. Suchadjustments can be performed graphically and only requireusage of provided interfaces. Thus, especially IT savvyproduction operators can customize dashboards. Moreover,they can create own dashboards and share them amongusers. In this way individual dashboards, for example, formanagement and production operators can be implemented.
In contrast to the Control Center, this dashboard does notprovide any control functions (e.g., for sensor configura-tion) and no complex interactive visualizations (e.g., thecomparison tool). Thus, it only serves as an extension tothe Control Center, allowing for visual analysis and report-ing. In particular, this dashboard covers use cases, wherepower consumption data should be integrated in existingdashboards (as it is the case in one studied enterprise) or ifdashboards should be customized by production operators.
6.8 Alerting
Altering in the Titan Control Center is implemented usingthe Titan Flow Engine in the integration component. Allmessages that are published to the messaging system canagain be consumed by the Titan Flow Engine and processed
in flows. This way, production operators can createand adjust alerting flows directly within the productionenvironment. Our pilot implementation already providesa flow that sends an email whenever an anomaly inpower consumption is reported. In dedicated bricks, theoperator can filter the types of anomaly an alert shouldbe generated for and configure how the email shouldbe sent (e.g., message and receiver). The flow engineallows to model flows that perform arbitrary actionsin the production environment when alerts are received.This includes communications with machines again, forexample, to show alerts on machine monitors.
7 Conclusions and future work
In a pilot study with two manufacturing enterprises, weidentify that analyzing power consumption data promises toachieve goals of categories such as reporting, optimization,fault detection, and predictive maintenance. In an additionalliterature review, we observe that research of various disci-plines suggests measures for achieving these goals. Basedon this literature review and expert knowledge within our

J. of Data, Inf. and Manag.
pilot cases, we suggest to implement the following mea-sures in software for achieving these goals: real-time dataprocessing, multi-level monitoring, temporal aggregation,correlation, anomaly detection, forecasting, visualization,and alerting. Finally, we show how microservices, streamprocessing, and fog computing can serve for implementingthe proposed measures in a power consumption analyticsplatform.
For future work, we plan to take advantage of themodular architecture of the Titan Control Center byextending our pilot implementations. In particular, ongoingresearch focuses on developing more precise forecastand anomaly detection approaches as well as detailedvisualizations. Further, we plan to conduct extensiveevaluations in our studied enterprises.
Acknowledgements This research is funded by the German FederalMinistry of Education and Research (BMBF) as part of the Titanproject (https://www.industrial-devops.org, grant no. 01IS17084).
Funding Open Access funding enabled and organized by ProjektDEAL.
Declarations
Conflict of Interests The authors declare that they have no conflict ofinterest.
Open Access This article is licensed under a Creative CommonsAttribution 4.0 International License, which permits use, sharing,adaptation, distribution and reproduction in any medium or format, aslong as you give appropriate credit to the original author(s) and thesource, provide a link to the Creative Commons licence, and indicateif changes were made. The images or other third party material inthis article are included in the article’s Creative Commons licence,unless indicated otherwise in a credit line to the material. If materialis not included in the article’s Creative Commons licence and yourintended use is not permitted by statutory regulation or exceedsthe permitted use, you will need to obtain permission directly fromthe copyright holder. To view a copy of this licence, visit http://creativecommonshorg/licenses/by/4.0/.
References
Abadi M, Barham P, Chen J, Chen Z, Davis A, Dean J, Devin M,Ghemawat S, Irving G, Isard M, Kudlur M, Levenberg J, Monga R,Moore S, Murray DG, Steiner B, Tucker P, Vasudevan V, WardenP, Wicke M, Yu Y, Zheng X (2016) TensorFlow: A system forlarge-scale machine learning. In: Proceedings of the 12th USENIXconference on operating systems design and implementation,USENIX Association, USA, OSDI’16, pp 265–283
Albadi MH, El-Saadany EF (2008) A summary of demand responsein electricity markets. Electr Power Syst Res 78(11):1989–1996.https://doi.org/10.1016/j.epsr.2008.04.002
Arora S, Taylor JW (2016) Forecasting electricity smart meter datausing conditional kernel density estimation. Omega 59:47–59.https://doi.org/10.1016/j.omega.2014.08.008. Business Analytics
Bernstein D (2014) Containers and cloud: From LXC toDocker to Kubernetes. IEEE Cloud Computing 1(3):81–84.https://doi.org/10.1109/MCC.2014.51
Bischof S, Trittenbach H, Vollmer M, Werle D, Blank T, BohmK (2018) HIPE: An energy-status-data set from industrialproduction. In: Proceedings of the ninth international conferenceon future energy systems, ACM, New York, NY, USA, e-Energy’18, pp 599–603
Bonomi F, Milito R, Zhu J, Addepalli S (2012) Fog computing and itsrole in the Internet of Things. In: Proceedings of the first editionof the MCC workshop on mobile cloud computing, ACM, NewYork, NY, USA, MCC ’12, pp 13–16
Bostock M, Ogievetsky V, Heer J (2011) D3 data-driven doc-uments. IEEE Trans Vis Comput Graph 17(12):2301–2309.https://doi.org/10.1109/TVCG.2011.185
Bundesamt fur Wirtschaft und Ausfuhrkontrolle (BAFA) (2020)Merkblatt stromkostenintensive Unternehmen 2020. Brochure.http://www.bafa.de/SharedDocs/Downloads/DE/Energie/bar merkblatt unternehmen.pdf, Accessed: 2020-12-29
Bunse K, Vodicka M, Schonsleben P, Brulhart M, Ernst FO(2011) Integrating energy efficiency performance in pro-duction management – gap analysis between industrialneeds and scientific literature. J Clean Prod 19(6):667–679.https://doi.org/doi.org/10.1016/j.jclepro.2010.11.011
Cagno E, Worrell E, Trianni A, Pugliese G (2013) A novel approachfor barriers to industrial energy efficiency. Renew Sust Energ Rev19:290–308. https://doi.org/10.1016/j.rser.2012.11.007
Carbone P, Katsifodimos A, Haridi S (2019) Stream windowaggregation semantics and optimization. In: Sakr S, ZomayaAY (eds) Encyclopedia of big data technologies, Springer,pp 1615–1623
Chandola V, Banerjee A, Kumar V (2009) Anomaly detec-tion: A survey. ACM Comput. Surv. 41(3):15:1–15:58.https://doi.org/10.1145/1541880.1541882
Chou J-S, Telaga AS, Chong WK, Gibson GE (2017) Early-warning application for real-time detection of energy con-sumption anomalies in buildings. J Clean Prod 149:711–722.https://doi.org/10.1016/j.jclepro.2017.02.028
Chou J-S, Telaga AS (2014) Real-time detection of anoma-lous power consumption. Renew Sust Energ Rev 33:400–411.https://doi.org/10.1016/j.rser.2014.01.088
Chujai P, Kerdprasop N, Kerdprasop K (2013) Time series analysis ofhousehold electric consumption with arima and arma models. In:Proceedings of the international multiconference of engineers andcomputer scientists, pp 295–300
Cooremans C, Schonenberger A (2019) Energy management: A keydriver of energy-efficiency investment? J Clean Prod 230:264–275. https://doi.org/10.1016/j.jclepro.2019.04.333
Cugola G, Margara A (2012) Processing flows of information: Fromdata stream to complex event processing. ACM Comput. Surv.44(3):15:1–15:62. https://doi.org/10.1145/2187671.2187677
Din GMU, Marnerides AK (2017) Short term power load forecastingusing deep neural networks. In: 2017 International conference oncomputing, networking and communications (ICNC), pp 594–598
Fiedler T, Mircea P-M (2012) Energy management systems accordingto the ISO 50001 standard – challenges and benefits. In: 2012International conference on applied and theoretical electricity(ICATE), pp 1–4
Garcia Lopez P, Montresor A, Epema D, Datta A, Higashino T,Iamnitchi A, Barcellos M, Felber P, Riviere E (2015) Edge-centriccomputing: Vision and challenges. SIGCOMM Comput. Com-mun. Rev. 45(5):37–42. https://doi.org/10.1145/2831347.2831354
Goodhope K, Koshy J, Kreps J, Narkhede N, Park R, Rao J, Ye VY(2012) Building LinkedIn’s real-time activity data pipeline. IEEEData Eng. Bull. 35:33–45

J. of Data, Inf. and Manag.
Grafana Labs (2020) Grafana. https://grafana.com/grafana, Accessed:2020-12-29
Hasselbring W, Henning S, Latte B, Mobius A, Richter T, SchalkS, Wojcieszak M (2019) Industrial DevOps. In: 2019 IEEEInternational conference on software architecture companion,pp 123–126
Hasselbring W, Steinacker G (2017) Microservice architectures forscalability, agility and reliability in e-commerce. In: 2017 IEEEInternational Conference on Software Architecture Workshops(ICSAW), pp 243–246
Henning S, Hasselbring W (2020) Scalable and reliable multi-dimensional sensor data aggregation in data-streaming archi-tectures. Data-Enabled Discovery and Applications 4(1):1–12.https://doi.org/10.1007/s41688-020-00041-3
Henning S, Hasselbring W (2021) The Titan Control Center forIndustrial DevOps analytics research. Software Impacts 7:100050.https://doi.org/10.1016/j.simpa.2020.100050
Henning S, Hasselbring W, Mobius A (2019) A scalable architecturefor power consumption monitoring in industrial productionenvironments. In: 2019 IEEE International conference on fogcomputing, pp 124–133
Henning S, Hasselbring W (2019) Scalable and reliable multi-dimensional aggregation of sensor data streams. In: 2019 IEEEInternational conference on big data, pp 3512–3517
Herman J, Herman H, Mathews MJ, Vosloo JC (2018) Usingbig data for insights into sustainable energy consumption inindustrial and mining sectors. J Clean Prod 197:1352–1364.https://doi.org/10.1016/j.jclepro.2018.06.290
Herrmann C, Thiede S (2009) Process chain simulation to fosterenergy efficiency in manufacturing. CIRP J Manuf Sci Technol1(4):221–229. https://doi.org/10.1016/j.cirpj.2009.06.005
International Energy Agency (2019) World energy balances 2019ISO 50001 (2018) Energy management systems – Requirements
with guidance for use. Standard, International Organization forStandardization, Geneva, CH
Jadhav AR, Kiran MPRS, Pachamuthu R (2021) Develop-ment of a novel iot-enabled power- monitoring architecturewith real-time data visualization for use in domestic andindustrial scenarios. IEEE Trans Instrum Meas 70:1–14.https://doi.org/10.1109/TIM.2020.3028437
Johanson A, Flogel S, Dullo C, Hasselbring W (2016) OceanTEA:Exploring ocean-derived climate data using microservices. In:Proceedings of the sixth international workshop on climateinformatics, NCAR Technical Note NCAR/TN, pp 25–28
Jovanovic B, Filipovic J (2016) ISO 50001 standard-basedenergy management maturity model – proposal andvalidation in industry. J Clean Prod 112:2744–2755.https://doi.org/10.1016/j.jclepro.2015.10.023
Kanchiralla FM, Jalo N, Johnsson S, Thollander P, Andersson M(2020) Energy end-use categorization and performance indicatorsfor energy management in the engineering industry. Energies13(2):369. https://doi.org/10.3390/en13020369
Kreps J (2014) Questioning the Lambda architecture. https://www.oreilly.com/radar/questioning-the-lambda-architecture,Accessed: 2020-12-29
Kreps J, Narkhede N, Rao J (2011) Kafka: A distributed messagingsystem for log processing. In: Proceedings of 6th internationalworkshop on networking meets databases, Athens, Greece
Lakshman A, Malik P (2010) Cassandra: A decentralized struc-tured storage system. SIGOPS Oper. Syst. Rev. 44(2):35–40.https://doi.org/10.1145/1773912.1773922
Lasi H, Fettke P, Kemper H-G, Feld T, Hoffmann M (2014) Industry4.0. Business & Information Systems Engineering 6(4):239–242.https://doi.org/10.1007/s12599-014-0334-4
Liu X, Nielsen PS (2018) Scalable prediction-based onlineanomaly detection for smart meter data. Inf Syst 77:34–47.https://doi.org/10.1016/j.is.2018.05.007
Martınez-Alvarez F, Troncoso A, Asencio-Cortes G, Riquelme J(2015) A survey on data mining techniques applied to electricity-related time series forecasting. Energies 8(11):13162–13193.https://doi.org/10.3390/en81112361
Marz N, Warren J (2015) Big data: Principles and best practices ofscalable realtime data systems, 1st edn. Manning Publications Co.,USA
Masoodian M, Buchwald I, Luz S, Andre E (2017) Temporalvisualization of energy consumption loads using time-tone. In:2017 21st International conference information visualisation (IV),pp 146–151
Masoodian M, Lugrin B, Buhling R, Andre E (2015) Visualizationsupport for comparing energy consumption data. In: 2015 19thInternational conference on information visualisation, pp 28–34
Miragliotta G, Shrouf F (2013) Using Internet of Things to improveeco-efficiency in manufacturing: A review on available knowledgeand a framework for IoT adoption. In: Emmanouilidis C, TaischM, Kiritsis D (eds) Advances in production management systems.Competitive manufacturing for innovative products and services,Springer Berlin Heidelberg, Berlin, Heidelberg, pp 96–102
Mohamed N, Al-Jaroodi J, Lazarova-Molnar S (2018) Energy cloud:Services for smart buildings. In: Rivera W (ed) Sustainable cloudand energy services: principles and practice, Springer InternationalPublishing, pp 117–134
Mohamed N, Al-Jaroodi J, Lazarova-Molnar S (2019) Leverag-ing the capabilities of Industry 4.0 for improving energyefficiency in smart factories. IEEE Access 7:18008–18020.https://doi.org/10.1109/ACCESS.2019.2897045
MongoDB I (2019) Mongodb. https://www.mongodb.com, Accessed:2020-12-29
Morrison JP (2010) Flow-based programming, 2nd edition: A newapproach to application development. CreateSpace, Paramount, CA
Newman S (2015) Building microservices, 1st edn. O’Reilly Media,Inc., Newton
Pfandzelter T, Bermbach D (2019) IoT data processing in thefog: Functions, streams, or batch processing? In: 2019 IEEEInternational conference on fog computing (ICFC), pp 201–206
Qi Q, Tao F (2019) A smart manufacturing servicesystem based on edge computing, fog computing,and cloud computing. IEEE Access 7:86769–86777.https://doi.org/10.1109/ACCESS.2019.2923610
Quiroz JC, Mariun N, Mehrjou MR, Izadi M, Misron N,Radzi MAM (2018) Fault detection of broken rotor bar inls-pmsm using random forests. Measurement 116:273–280.https://doi.org/10.1016/j.measurement.2017.11.004
Rackow T, Javied T, Donhauser T, Martin C, Schuderer P, FrankeJ (2015) Green Cockpit: Transparency on energy consump-tion in manufacturing companies. Procedia CIRP 26:498–503.https://doi.org/10.1016/j.procir.2015.01.011. 12th Global Confer-ence on Sustainable Manufacturing – Emerging Potentials
Rist T, Masoodian M (2019) Promoting sustainable energyconsumption behavior through interactive data visualiza-tions. Multimodal Technologies and Interaction 3(3):56.https://doi.org/10.3390/mti3030056
Sahal R, Breslin JG, Ali MI (2020) Big data and stream pro-cessing platforms for industry 4.0 requirements mapping fora predictive maintenance use case. J Manuf Syst 54:138–151.https://doi.org/10.1016/j.jmsy.2019.11.004
Sax MJ, Wang G, Weidlich M, Freytag J-C (2018) Streams and tables:Two sides of the same coin. In: Proceedings of the internationalworkshop on real-time business intelligence and analytics, ACM,New York, NY, USA, BIRTE ’18, pp 1:1–1:10

J. of Data, Inf. and Manag.
Schulze M, Nehler H, Ottosson M, Thollander P (2016) Energymanagement in industry – a systematic review of previous findingsand an integrative conceptual framework. J Clean Prod 112:3692–3708. https://doi.org/10.1016/j.jclepro.2015.06.060
Sequeira H, Carreira P, Goldschmidt T, Vorst P (2014) Energy Cloud:Real-time cloud-native energy management system to monitorand analyze energy consumption in multiple industrial sites. In:2014 IEEE/ACM 7th International conference on utility and cloudcomputing, pp 529–534
Shrouf F, Ordieres J, Miragliotta G (2014) Smart factories inIndustry 4.0: A review of the concept and of energy managementapproached in production based on the Internet of Thingsparadigm. In: 2014 IEEE International conference on industrialengineering and engineering management, pp 697–701
Shrouf F, Gong B, Ordieres-Mere J (2017) Multi-level awareness ofenergy used in production processes. J Clean Prod 142:2570–2585. https://doi.org/10.1016/j.jclepro.2016.11.019
Shrouf F, Miragliotta G (2015) Energy management based onInternet of Things: practices and framework for adoptionin production management. J Clean Prod 100:235–246.https://doi.org/10.1016/j.jclepro.2015.03.055
Shrouf F, Ordieres-Mere J, Garcı?a-Sanchez A, Ortega-Mier M (2014)Optimizing the production scheduling of a single machine tominimize total energy consumption costs. J Clean Prod 67:197–207. https://doi.org/10.1016/j.jclepro.2013.12.024
Singh S, Yassine A (2018) Big data mining of energy time seriesfor behavioral analytics and energy consumption forecasting.Energies 11(2):452. https://doi.org/10.3390/en11020452
Szydlo T, Brzoza-Woch R, Sendorek J, Windak M, GniadyC (2017) Flow-based programming for IoT leveraging FogComputing. In: 2017 IEEE 26th International conference onenabling technologies: infrastructure for collaborative enterprises(WETICE), pp 74–79
Tesch da Silva FS, da Costa CA, Paredes Crovato CD, daRosa Righi R (2020) Looking at energy through the lens ofIndustry 4.0: A systematic literature review of concerns andchallenges. Computers & Industrial Engineering 143:106426.https://doi.org/10.1016/j.cie.2020.106426
The OpenTSDB Authors (2018) Opentsdb. http://opentsdb.net,Accessed: 2020-12-29
Thollander P, Paramonova S, Cornelis E, Kimura O, Trianni A,Karlsson M, Cagno E, Morales I, Jimenez Navarro JP (2015)International study on energy end-use data among industrialsmes (small and medium-sized enterprises) and energy end-useefficiency improvement opportunities. J Clean Prod 104:282–296.https://doi.org/10.1016/j.jclepro.2015.04.073
Vijayaraghavan A, Dornfeld D (2010) Automated energymonitoring of machine tools. CIRP Ann 59(1):21–24.https://doi.org/doi.org/10.1016/j.cirp.2010.03.042
Vikhorev K, Greenough R, Brown N (2013) An advanced energymanagement framework to promote energy awareness. J CleanProd 43:103–112. https://doi.org/10.1016/j.jclepro.2012.12.012
Wang G, Koshy J, Subramanian S, Paramasivam K, Zadeh M,Narkhede N, Rao J, Kreps J, Stein J (2015) Building a replicatedlogging system with Apache Kafka. Proc. VLDB Endow.8(12):1654–1655. https://doi.org/10.14778/2824032.2824063
Wetzel DB (2019) Entwicklung eines Dashboards fur eine IndustrialDevOps Monitoring Plattform. Bachelor’s Thesis, Kiel University
Yan J, Meng Y, Lu L, Li L (2017) Industrial big data in anIndustry 4.0 environment: Challenges, schemes, and applica-tions for predictive maintenance. IEEE Access 5:23484–23491.https://doi.org/10.1109/ACCESS.2017.2765544
Yang C-T, Chen S-T, Liu J-C, Liu R-H, Chang C-L (2020) Onconstruction of an energy monitoring service using big datatechnology for the smart campus. Clust Comput 23:265–288.https://doi.org/10.1007/s10586-019-02921-5
You E (2019) Vue.js. https://vuejs.org, Accessed: 2020-12-29Zhang Y, Ma S, Yang H, Lv J, Liu Y (2018) A big
data driven analytical framework for energy-intensivemanufacturing industries. J Clean Prod 197:57–72.https://doi.org/10.1016/j.jclepro.2018.06.170
Zheng J, Xu C, Zhang Z, Li XL (2017) Electric load forecasting insmart grids using long-short-term-memory based recurrent neuralnetwork. In: 2017 51st Annual conference on information sciencesand systems (CISS), pp 1–6
Publisher’s note Springer Nature remains neutral with regard tojurisdictional claims in published maps and institutional affiliations.