goals as reference points - technosystems · goals as reference points 83 fig. 1. a typical value...
TRANSCRIPT

Cognitive Psychology 38, 79–109 (1999)
Article ID cogp.1998.0708, available online at http://www.idealibrary.com on
Goals as Reference Points
Chip Heath
Fuqua School of Business, Duke University
and
Richard P. Larrick and George Wu
Graduate School of Business, University of Chicago
We argue that goals serve as reference points and alter outcomes in a mannerconsistent with the value function of Prospect Theory (Kahneman & Tversky, 1979;Tversky & Kahneman, 1992). We present new evidence that goals inherit the proper-ties of the value function—not only a reference point, but also loss aversion anddiminishing sensitivity. We also use the value function to explain previous empiricalresults in the goal literature on affect, effort, persistence, and performance. 1999
Academic Press
What makes goals motivating? Why do people strive harder and morediligently when they face a specific, challenging goal, such as completing apaper by the end of the week or losing five pounds by the end of the month?Why do people feel worse when they fail to reach their goals? The relation-ship between cognitive and motivational processes has been a central con-cern in social–cognitive research in recent decades (e.g., Cantor & Kihl-strom, 1987; see Pervin, 1989, for a review). In this paper, we propose thata few basic cognitive and perceptual processes underlie a basic motivationalprocess. Our claim is that goals serve as reference points and systematicallyalter the value of outcomes as described by the psychological principles inProspect Theory’s value function (Kahneman & Tversky, 1979). In this pa-per we show that the principles of the value function are sufficient to explaina wide range of empirical findings on how goals affect motivation.
The authors thank Hal Arkes, Robyn Dawes, Rich Gonzalez, Dale Griffin, Joshua Klayman,George Loewenstein, Ann McGill, and John Payne for helpful comments on earlier drafts.The paper also benefitted from comments by participants at workshops at Carnegie Mellon,Duke, Ohio State, Northwestern, and the University of Chicago.
Address reprint requests to Chip Heath at Fuqua School of Business, Duke University, Box90120, Durham, NC 27708. E-mail: [email protected].
790010-0285/99 $30.00
Copyright 1999 by Academic PressAll rights of reproduction in any form reserved.

80 HEATH, LARRICK, AND WU
This proposal has two implications. First, it implies that the value functioncan provide a unifying explanation for findings in both the goal literatureand the judgment and decision making literature. Second, it suggests thatboth literatures can learn from the insights of the other. For example, thedecision literature has traditionally limited itself to cognitive phenomena likechoice and risk, whereas the goal literature has focused on motivational phe-nomena such as effort, persistence, and performance. And, while the decisionliterature has alluded to reference points other than the status quo, it hasexplored them less frequently; in contrast, the goal literature has conclusivelyshown the importance of non-status quo reference points. Thus, in buildinga bridge between the motivational processes discussed in the goal literatureand the cognitive processes discussed in the decision making literature, wehope to identify new implications for each.
In the first section of the paper, we briefly review the history of the goalconcept in psychology. Then we review the characteristics of the value func-tion proposed by Kahneman and Tversky (1979) and show that goals serveas reference points and distort outcomes in the manner predicted by the valuefunction. In the second section of the paper we show how the major resultsof the goal literature can be explained by the value function.
THE GOAL CONCEPT IN PSYCHOLOGY
The goal concept has played an important role in many classic and contem-porary theories of motivation (Atkinson, 1957; Cantor & Zirkel, 1990; Hull,1931, 1952; Lewin, 1931, 1935; Locke & Latham, 1990; Markus & Ruvolo,1989; Tolman, 1932, 1959). Although we cannot exhaustively review previ-ous work on goals in this paper (see Pervin, 1989, for a review), we willbriefly summarize some aspects of traditional work that highlight the noveltyof our approach. In our approach, we attempt to explain motivational phe-nomena like effort, persistence, and performance by focusing not on externalrewards but on the psychological effects of ‘‘mere’’ goals. Also, althoughexpectancies are clearly important, we explore how many phenomena wecan explain by assuming that goals alter, not expectancies or likelihoods,but the psychological value of outcomes.
Extrinsic Rewards versus Mere Goals
In many situations, goals are associated with a valuable object in the exter-nal environment. For example, Tolman (1959) claimed that hunger makesan organism see a piece of food as a goal. Note that this use of the term‘‘goal’’ is not particularly psychological: the goal is a discrete, tangible,extrinsic reward that has real consequences for physiological well-being.
More psychologically interesting are what we call ‘‘mere’’ goals, whichare specific levels of performance (e.g., finishing a manuscript in 3 days asopposed to 5) that are not accompanied by any discontinuous change in an

GOALS AS REFERENCE POINTS 81
external reward. The most influential evidence for mere goals is containedin the literature on goal setting (Locke, 1968; Locke & Latham, 1990).Scores of laboratory and field studies have documented that mere goals in-crease performance (Locke & Latham, 1991; Mento, Steel, & Karren, 1987;Tubbs, 1986; for a complete review of over 200 studies, see Locke & La-tham, 1990). Performance increases have been documented using tasks rang-ing from cognitive, such as solving anagrams or thinking of creative uses fora common household object, to physical, such as cutting logs and pedaling abicycle. Two key findings have emerged from this literature. First, studiesthat have manipulated goal difficulty have found that performance increasesas the difficulty of the goal increases, even when goals are extremely high.Second, studies that have compared instructions ‘‘to set a specific, challeng-ing goal’’ with instructions to ‘‘do your best’’ have found that performanceis superior for specific, challenging goals.
In this paper, we focus on mere goals because we want to study the cogni-tive relevance of goals without the confounding influence of discrete payoffs.Our definition of mere goals, for example, excludes situations where a sales-person sets a goal to sell 200 units because he or she receives a bonus at 200.Such situations can be analyzed with a straightforward economic calculus,whereas ‘‘mere goals’’ are fundamentally psychological.
Values versus Expectancies in Expectancy–Value Approachesto Motivation
Although our emphasis on mere goals is important, the central feature ofour approach is that we explain the effects of goals in terms of values ratherthan expectancies.
In research on goals, one of the most important developments occurredwhen researchers shifted from a purely behaviorist approach (Hull, 1931,1952; Spence, 1956) to a cognitive one (Lewin, 1935, 1951; Tolman, 1959)that assumed that organisms possess mental representations of goals and oftheir likelihood of achieving them.1 The earliest use of goals to explain moti-vation was by researchers in the behaviorist tradition who did not assumethat goals invoked any kind of mental process. For example, in Clark Hull’sbehaviorist account of learning, goals were reinforcers (like food) that di-rected future behavior through past conditioning. One important aspect ofgoals that Hull attempted to explain was the ‘‘goal gradient’’ response, atendency for organisms to become more motivated as they approached a goal(Hull, 1932, 1938; see also Lewin, 1931; Miller, 1944). For example, ratsran faster as they came closer to the goal box. Although behaviorists in theHull–Spence tradition referred to this motivational increase as a ‘‘fractionalanticipatory goal response,’’ rats did not ‘‘anticipate’’ goals; they simply
1 For reviews of the cognitive approach of expectancy–value theories see Feather (1959,1982), and Fischhoff, Goitein, and Shapira (1981). See, also, Siegel (1957).
82 HEATH, LARRICK, AND WU
acted on conditioned responses that linked stimuli near a goal (such as thefinal turn in a maze) with the goal (food) (Spence, Bergmann, & Lippitt,1950).
In contrast to Hull’s perspective, Tolman (1932, 1959) and Lewin (1935,1951; Lewin, Dembo, Festinger, & Sears, 1944) offered motivational theo-ries in which organisms truly anticipated goals and strove to achieve them.Models in this tradition have been labeled ‘‘expectancy–value’’ models be-cause they emphasize expectations in addition to the values of outcomes(e.g., Atkinson, 1957; see Feather, 1982, for a review), and many of theseexpectancy–value models have focused mainly on expectancies (e.g., seeKlein’s 1991 review). Researchers who study expectancy–value models mayhave overreacted against the behaviorist tradition by focusing solely on themost apparently cognitive aspect of their models: expectancies. In contrast,we will emphasize a cognitive approach to values and will attempt to accom-modate the major findings of goal research, such as ‘‘goal gradients,’’ usingvalues alone. Although expectancies are clearly important, we show that acognitive approach to value is a sufficient explanation of most goal phe-nomena.
Value Function
The Prospect Theory value function (Kahneman & Tversky, 1979; Tver-sky & Kahneman, 1981, 1991, 1992; see also Markowitz, 1952) is a promis-ing source of psychological principles that explain how values are alteredby the presence of a reference point such as a goal. It has been used to explaina variety of behavior in fields ranging from economics (Benartzi & Thaler,1995; Odean, 1998) to medicine (McNeil, Pauker, & Tversky, 1988) to con-sumer behavior (Thaler, 1985) to social psychology and political science(Kramer, 1989; Quattrone & Tversky, 1988).
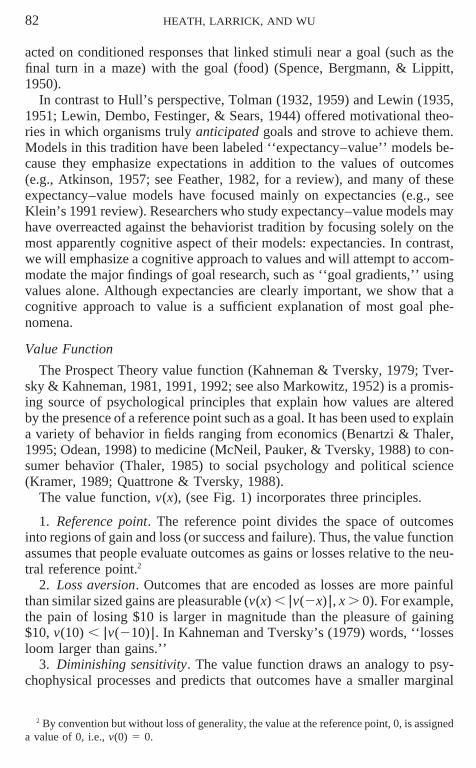
The value function, v(x), (see Fig. 1) incorporates three principles.
1. Reference point. The reference point divides the space of outcomesinto regions of gain and loss (or success and failure). Thus, the value functionassumes that people evaluate outcomes as gains or losses relative to the neu-tral reference point.2
2. Loss aversion. Outcomes that are encoded as losses are more painfulthan similar sized gains are pleasurable (v(x) , |v(2x) | , x . 0). For example,the pain of losing $10 is larger in magnitude than the pleasure of gaining$10, v(10) , |v(210) | . In Kahneman and Tversky’s (1979) words, ‘‘lossesloom larger than gains.’’
3. Diminishing sensitivity. The value function draws an analogy to psy-chophysical processes and predicts that outcomes have a smaller marginal
2 By convention but without loss of generality, the value at the reference point, 0, is assigneda value of 0, i.e., v(0) 5 0.
GOALS AS REFERENCE POINTS 83
FIG. 1. A typical value function. Its three key features are a reference point, loss aversion,and diminishing sensitivity.
impact when they are more distant from the reference point. For example,the pleasure of moving from $110 to $120 is less than the pleasure of mov-ing from $10 to $20 (in general, v″(x) , 0, x . 0), and the pain of movingfrom 2$110 to 2$120 is less than the pain of moving from 2$10 to 2$20(v″(x) . 0, x , 0). Diminishing sensitivity gives the value function itscharacteristic S-shape—concave above the reference point and convex be-low it.3
WHAT DOES THE VALUE FUNCTION IMPLY ABOUT GOALS?
In this section, we explore whether the effects of mere goals are consistentwith the predictions of the value function. First, we show that goals serveas reference points, and second, we show that the valuation of outcomesrelative to a goal can be explained by loss aversion and diminishing sensitiv-ity. As shorthand for this two-part proposition, we will say that goals ‘‘in-herit’’ the properties of the value function.
3 Many studies show diminishing sensitivity for both gains and losses, in riskless judgmentsas well as risky choice (e.g., Galanter & Pliner, 1974; Tversky & Kahneman, 1992; Gonzalez &Wu, 1999).

84 HEATH, LARRICK, AND WU
Implications of the Reference Point
One of the most basic aspects of motivation is that people do not seeoutcomes as neutral, but categorize them as a success or failure and thenthey experience positive or negative emotion based on their categorization.The reference point of the value function plays a key role in this categoriza-tion because it divides the space of outcomes into a positive and negativeregion. This is not a unique prediction of the value function; most othertheories of goals and aspirations also contain some variant of this principle(e.g., Lewin, Dembo, Festinger, & Sears, 1944). The following problemdemonstrates this principle:
Problem 1. [N 5 45] Sally and Trish both follow workout plans that usuallyinvolve doing 25 sit-ups.
One day, Sally sets a goal of performing 31 sit-ups. She finds herself very tiredafter performing 35 sit-ups and stops.
Trish sets a goal of performing 39 sit-ups. She finds herself very tired after per-forming 35 sit-ups and stops.
What emotion is each person experiencing?
One hundred percent (100%) of participants listed a positive emotionalreaction for Sally and a negative emotional reaction for Trish (according toindependent raters).
Problem 1 demonstrates that goals, like reference points, divide outcomesinto regions of good and bad, success and failure. Although the goal literaturehas recognized this point, it has not always recognized what this impliesabout how people react to their performance: If goals are reference points,then people who set goals will sometimes feel worse about their performanceeven when they perform better. Consider the following problem:
Problem 2. Alice typically scores around 80 on weekly 100-point quizzes in oneof her classes. One week she sets a goal of scoring 90. She scores 87.
Betty typically scores around 80 on weekly 100-point quizzes in one of her classes.One week she decides to do her best. She scores 83.
Overall, who will be more satisfied with her performance? [N 5 60]
Both Alice and Betty typically perform at the same level on their weeklyquizzes, and this week both have exceeded their typical score. Thus if theyused their normal performance as their reference point, both should be happybut Alice should be happier. However, because goals operate as referencepoints, Alice ends up in the domain of losses because she performs threepoints below her reference point. Although Alice performs above Betty inabsolute terms, people agree that she will be less satisfied with her perfor-mance (p , .05 by χ2 ). Similar results have been documented in laboratorystudies in the goal-setting literature. For example, Mossholder (1980) foundthat subjects in a goal condition evaluated their performance less positivelythan subjects who had no goal, despite the fact that goal subjects outper-

GOALS AS REFERENCE POINTS 85
formed no-goal subjects by about 15% (see also Kernan & Lord, 1989;Meyer, Schact-Cole, & Gellatly, 1988).
In the decision literature, results such as this have been labeled ‘‘framingeffects.’’ In many cases, the same outcome can be framed as a loss or a gaindepending on which reference point people use to evaluate it, and in turn,framing affects satisfaction. Researchers in the goal-setting literature, how-ever, have not always recognized framing effects. Indeed, a major theoreticaldebate in the goal-setting literature arose when researchers realized that peo-ple who set goals feel less satisfied with their performance than people whodo not set goals. Garland (1984) sparked a debate when he argued that thisresult contradicted expectancy theory: If high goal subjects are less satisfiedwith high performance, then why do they work harder to attain high perfor-mance in the first place? This observation sparked an exchange that lastedfor a number of years (Locke, Frederick, Lee, & Bobko, 1984; Meyer,et al., 1988; Locke & Latham, 1990; Mento, Locke, & Klein, 1992; Klein,1991).
If goal setting researchers had borrowed the notion of reference pointsfrom the value function approach, they could have explained this theoreticalpuzzle more easily. If goals act as reference points, then framing effectsimmediately explain half of Garland’s (1984) question: Why do people withhigher goals feel worse? However, framing effects and reference points can-not explain the second half: Why do they perform better? Below, we useother properties of the value function to explain the second half of thisquestion.
Implications of Loss Aversion
In addition to a reference point, value function also assumes loss aversion,the notion that losses will be more painful than gains will be pleasurable(v(x) , |v(2x) | ). If goals act as reference points, then loss aversion impliesthat people who are below their goal by x units will perceive their currentperformance as a loss relative to their goal; thus they will work harder toincrease their performance by a given increment than people who are abovetheir goal by x units. Empirical work also suggests that, under certain condi-tions, it may be possible to make more specific predictions about the magni-tude of loss aversion. Neither the general nor the specific predictions aboutloss aversion arise in other theories of goals; they are unique predictions ofthe value function.
Magnitude and Slope
The simplest loss aversion prediction is this: If people fall short of theirgoal, they should feel more pain than they would feel pleasure if they sur-passed the goal by an equivalent amount. Consider a modified version ofProblem 1 from the last section:

86 HEATH, LARRICK, AND WU
Problem 3. [N 5 48] Sally and Trish both follow workout plans that usuallyinvolve doing 25 sit-ups.
One day, Sally sets a goal of performing 31 sit-ups. She finds herself very tiredafter performing 35 sit-ups and stops.
Trish sets a goal of performing 39 sit-ups. She finds herself very tired after per-forming 35 sit-ups and stops.
Who is experiencing more emotion? Sally (29%) Trish (71%)
As in Problem 1, if we ask participants which emotion Sally and Trishare experiencing, they agree unanimously that Trish is feeling negative emo-tion and Sally is feeling positive emotion. In addition, a majority of partici-pants agree that Trish is feeling stronger emotion than Sally (p , .05 byχ2 ). These results agree with the prediction of the value function: loss aver-sion implies that v(4) , |v(24) | .
The value function also makes predictions about the kinds of effortfulperformance that have been considered by the goal setting literature.
Problem 4. [N 5 73] Charles and David both follow workout plans that usuallyinvolve doing 25 sit-ups.
One day, Charles sets a goal of performing 30 sit-ups. He finds himself very tiredafter performing 34 sit-ups and, at most, has the energy to perform 1 more.
David sets a goal of performing 40 sit-ups. He finds himself very tired after 34sit-ups and, at most, has the energy to perform 1 more.
Who will work harder to perform the 35th sit-up? Charles (18%) David (82%)
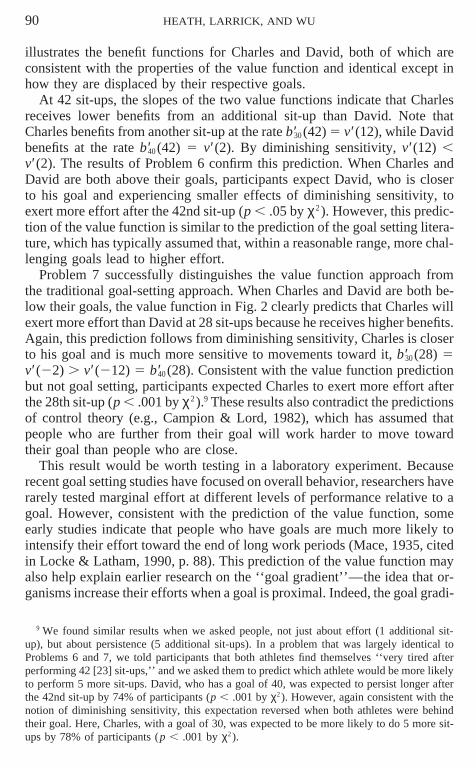
Our subjects reliably predicted that David would exert more effort thanCharles (p , .001 by χ2 ).4 This problem controls for the ability of Charlesand David by stressing that both normally perform 25 sit-ups in their work-outs. Charles and David should be willing to exert effort only if the additionalbenefits of performing 1 more sit-up offset the additional costs. Are the bene-fits received by Charles for doing another sit-up more or less than the benefitsreceived by David? We assume that benefits are determined by the valuefunction, so if bg (x) is the benefit from completing x units of performancewith a goal of g, then this benefit is captured by the value function evaluatedrelative to the goal, bg (x) 5 v(x 2 g). If b′g (x) is the marginal benefit of anincremental increase in performance, then we can formally answer the ques-tion about Charles and David by comparing the value function at b ′30 (35)and b′40 (35). Loss aversion indicates that b ′30 (35) 5 v′(5) , v′(25) 5b′40 (35) (see Fig. 2).5 Thus, the value function predicts David will experience
4 In this problem, and in the Charles and David problems below, we replicated this basicpattern of results with a cover story about Nancy and Martha, two computer programmerswho were completing program modules.
5 Technically, this is only an approximation. More precisely, David benefits more thanCharles from an additional sit-up if b30 (35) 2 b30 (34) . b40 (35) 2 b40 (34), which is equivalentto v(5) 2 v(4) , v(25) 2 v(26). However, the approximation suffices since b30 (35) 2b30 (34) < b ′30 (35) 5 v′(5) and b40 (35) 2 b40 (34) < b′40 (35) 5 v′(25).

GOALS AS REFERENCE POINTS 87
FIG. 2. Value functions for two individuals—one with a goal of 30 and one with a goalof 40 The dotted lines highlight performance at 28, 35, and 42, and the dark slopes indicatethe level of effort each individual will exert at those points.
higher benefits from an additional sit-up than Charles and thus David willexert more effort.
Value of Slope
Problem 4 illustrates the principle that people are more sensitive to lossesthan to equivalent gains. But how much more sensitive? Studies of riskychoice (Tversky & Kahneman, 1992) and riskless choice (Tversky & Kahne-man, 1991; Kahneman, Knetsch, & Thaler, 1990) have presented convergingevidence that losses are weighted approximately two times more than equiva-lent gains (the most common values for this ‘‘coefficient of loss aversion’’fall between 2 and 4).
If previous measurements of the coefficient of loss aversion ranged from2 to 4, then we may be able to predict more specifically how sensitive peopleare to losses and gains relative to a goal. Keeping in mind some potentialproblems with extrapolating from previous results,6 it seems reasonable topredict that individuals would be willing to work twice as hard when theyare approaching their goal than after they have exceeded it. The followingproblem tests this prediction:
Problem 5a. [N 5 61] Lisa has a goal of making 30 sales this month. Going intothe last week of the month, she has completed 30 sales. Although she ordinarily
6 There are several measurement issues that arise in making such estimates, including theneed for a linear scale to assess tradeoffs. Previous studies have measured the value of losingor gaining an item in terms of money, which is likely to be linear in value for small changes.In our tests, we make the same assumption about time, the measure of cost we used.

88 HEATH, LARRICK, AND WU
doesn’t work overtime, she decides to work 2 hours during the last week to complete5 unclosed sales.
Elizabeth has a goal of making 35 sales this month. Going into the last week ofthe month, she has completed 30 sales. Although she ordinarily doesn’t work over-time, she considers doing so during the last week to complete 5 unclosed sales. Howmany hours of overtime is she likely to work?
Problem 5b. [N 5 57] Elizabeth has a goal of making 35 sales this month. Goinginto the last week of the month, she has completed 30 sales. Although she ordinarilydoesn’t work overtime, she works 8 hours of overtime during the last week to com-plete 5 unclosed sales.
Lisa has a goal of making 30 sales this month. Going into the last week of themonth, she has completed 30 sales. Although she ordinarily doesn’t work overtime,she considers doing so during the last week to complete 5 unclosed sales. How manyhours of overtime is she likely to work?
In Problem 5a, Elizabeth is deciding how much time to devote to removea loss of five sales relative to her goal while Lisa is deciding how much timeto devote to move five sales above her goal. If losses are two times morepainful than gains are good, then Elizabeth should be willing to exert abouttwice as much effort to remove her loss as Lisa would exert to create anequivalent gain. If the cost of exerting more time is approximately linear inthis range, then we would predict that, if Lisa is working 2 h, Elizabethshould work about 4 h. Consistent with the value function approach, themedian answer for Elizabeth was 5, implying a coefficient of loss aversionof 2.5 (the 99% confidence interval around the mean coefficient of loss aver-sion was [2.30, 3.85]).
To ensure that the results were reliable, Problem 5b asked a separate groupof participants to predict how much overtime Lisa would work if Elizabethworked 8 h [N 5 57]. Here, the median answer was 4, implying a coefficientof loss aversion of 2 (the 99% confidence interval was [1.37, 2.74]). Despitethe very different starting points, the problems provide converging evidencethat participants expected others to work about two to four times more hoursto eliminate a shortfall from a goal than to exceed a goal by an equivalentamount.7
The results of this problem are consistent with two results from the goalsetting literature. An article by Mento et al. (1992) is the only article we havelocated in the goal literature that provides data that allows us to calculate acoefficient of loss aversion. However, results from two of their studies pro-vide converging evidence that the coefficient of loss aversion for goals is inthe 2–4 range. In Study 1, a graph reporting valences for three different goal
7 We also replicated the scenario with a description of two managers of an office supplystore who were either 400 units ahead or behind of their personal goal for selling units of aparticular office product. We asked participants to predict how many dollars of their ad budgetthe managers would spend to sell an additional 400 units. The results were similar, althoughthe confidence intervals were wider because of high variance in the dollar amounts specifiedby participants.

GOALS AS REFERENCE POINTS 89
levels showed loss aversion coefficients around 2. In Study 8, participantswere asked how satisfied they would be if they performed one level abovetheir goal and one level below it. The mean coefficient of loss aversion was2.4 with a 99% confidence interval of [2.24, 2.66].
Thus some preliminary evidence indicates that the coefficient of loss aver-sion for goals (time and Likert scales) is similar to the coefficient that hasbeen observed for other reference points (monetary values in risky and risk-less choice). The generality of these results is worth further investigation.8
Implications of Diminishing Sensitivity
In this section, we explore the implications of diminishing sensitivity foreffort near a goal, for effort far away from a goal (a situation we will labelthe starting problem) and for risk taking.
Effort Near a Goal
Diminishing sensitivity has a number of implications for goal behavior.Recall that diminishing sensitivity gives the value function its S-shape: con-cave above the reference point and convex below it. Diminishing sensitivitypredicts that goals will affect effort differently depending on whether peopleare above their goals (in the concave region of ‘‘gains’’) or below (in theconvex region of ‘‘losses’’). People should be willing to exert less effort asthey move away from their goal, but they should be willing to exert moreeffort as they approach their goal. The following problems illustrate theseprinciples:
Problems 6 and 7. Charles and David both follow workout plans that usuallyinvolve doing 25 sit-ups.
One day, Charles sets a goal of performing 30 sit-ups. He finds himself very tiredafter performing 42 [28] sit-ups and, at most, has the energy to perform one more.
David sets a goal of performing 40 sit-ups. He finds himself very tired after 42[28] sit-ups and, at most, has the energy to perform one more.
Who will work harder to perform one final sit-up?
Goal 5 30 Goal 5 40Problem 6. After 42 sit-ups [n 5 76] Charles (31%) David (69%)
Problem 7. After 28 sit-ups [n 5 74] Charles (86%) David (14%)
We assume that an individual is willing to exert effort to perform onemore sit-up if the costs of effort are exceeded by the benefits. According tothe value function, the benefits that Charles and David receive from theirperformance are subject to diminishing sensitivity. Consider Fig. 2, which
8 In its pure form, the value function argument just requires that losses loom larger thangains (i.e., a loss aversion coefficient greater than 1). Although empirical evidence thus farsuggests coefficients in the 2–4 range, it would indeed be surprising if the coefficient of lossaversion is in this range for all domains.
90 HEATH, LARRICK, AND WU
illustrates the benefit functions for Charles and David, both of which areconsistent with the properties of the value function and identical except inhow they are displaced by their respective goals.
At 42 sit-ups, the slopes of the two value functions indicate that Charlesreceives lower benefits from an additional sit-up than David. Note thatCharles benefits from another sit-up at the rate b′30 (42) 5 v′(12), while Davidbenefits at the rate b ′40 (42) 5 v′(2). By diminishing sensitivity, v′(12) ,v′(2). The results of Problem 6 confirm this prediction. When Charles andDavid are both above their goals, participants expect David, who is closerto his goal and experiencing smaller effects of diminishing sensitivity, toexert more effort after the 42nd sit-up (p , .05 by χ2 ). However, this predic-tion of the value function is similar to the prediction of the goal setting litera-ture, which has typically assumed that, within a reasonable range, more chal-lenging goals lead to higher effort.
Problem 7 successfully distinguishes the value function approach fromthe traditional goal-setting approach. When Charles and David are both be-low their goals, the value function in Fig. 2 clearly predicts that Charles willexert more effort than David at 28 sit-ups because he receives higher benefits.Again, this prediction follows from diminishing sensitivity, Charles is closerto his goal and is much more sensitive to movements toward it, b ′30 (28) 5v′(22) . v′(212) 5 b ′40 (28). Consistent with the value function predictionbut not goal setting, participants expected Charles to exert more effort afterthe 28th sit-up (p , .001 by χ2 ).9 These results also contradict the predictionsof control theory (e.g., Campion & Lord, 1982), which has assumed thatpeople who are further from their goal will work harder to move towardtheir goal than people who are close.
This result would be worth testing in a laboratory experiment. Becauserecent goal setting studies have focused on overall behavior, researchers haverarely tested marginal effort at different levels of performance relative to agoal. However, consistent with the prediction of the value function, someearly studies indicate that people who have goals are much more likely tointensify their effort toward the end of long work periods (Mace, 1935, citedin Locke & Latham, 1990, p. 88). This prediction of the value function mayalso help explain earlier research on the ‘‘goal gradient’’—the idea that or-ganisms increase their efforts when a goal is proximal. Indeed, the goal gradi-
9 We found similar results when we asked people, not just about effort (1 additional sit-up), but about persistence (5 additional sit-ups). In a problem that was largely identical toProblems 6 and 7, we told participants that both athletes find themselves ‘‘very tired afterperforming 42 [23] sit-ups,’’ and we asked them to predict which athlete would be more likelyto perform 5 more sit-ups. David, who has a goal of 40, was expected to persist longer afterthe 42nd sit-up by 74% of participants (p , .001 by χ2 ). However, again consistent with thenotion of diminishing sensitivity, this expectation reversed when both athletes were behindtheir goal. Here, Charles, with a goal of 30, was expected to be more likely to do 5 more sit-ups by 78% of participants (p , .001 by χ2 ).
GOALS AS REFERENCE POINTS 91
ent prediction was confirmed with both animals (Hull, 1932, 1938) and hu-mans (Fajans, 1933, as cited in Lewin, 1951). Note that much of this researchmay not be directly relevant to our approach because it involves real externalrewards and not just mere goals. However, the value function predicts a goalgradient effect even for mere goals, thereby incorporating this central con-cept from the older goal literature.
Effort Far from a Goal: Starting Problem and Subgoals
If the value function describes how people respond to goals, then diminish-ing sensitivity implies that, far away from the goal, people may not feel thatthey are making much progress toward their goal. In turn, they may find itdifficult to motivate themselves to start a task when they face a difficult goal.We call this implication of diminishing sensitivity the ‘‘starting problem’’and illustrate it with the following problem.
Problem 8. [N 5 47] Jim decides that he would like to donate more time to charity.His schedule won’t permit more than 4 h per week, so he sets a personal goal ofworking 40 h over the next 10 weeks at a neighborhood soup kitchen. Soon afterstarting, Jim learns that the soup kitchen will be forced to close in 4 weeks.
Kyle decides that he would like to donate more time to charity. His schedulewon’t permit more than 4 h per week, so he sets a personal goal of working 200 hover the next year at a neighborhood soup kitchen. Soon after starting, Kyle learnsthat the soup kitchen will be forced to close in 4 weeks.
Who will donate more time to the soup kitchen over the next 4 weeks?Please circle one Jim (81%) Kyle (19%)
Note that Jim and Kyle have set goals that require them to work at asimilar rate (4 h per week). Also note that neither will reach his goal beforethe soup kitchen closes. However, according to the value function, Jim feelsthat he is making more progress than Kyle: b40 (16) 5 v(224) 2 v(240) .v(2184) 2 v(2200) 5 b200 (16). Consistent with the notion of a ‘‘startingproblem,’’ people feel that Kyle will find it more difficult to start workingtoward his high goal.
Some researchers in the goal literature have speculated about a questionthat is related to Problem 8: Do proximal or distal goals inspire higher perfor-mance? Would a dieter, for example, lose more weight if he set a goal oflosing 12 pounds in 3 months or 1 pound a week? Some researchers haveargued that proximal goals may enhance self-efficacy and therefore expecta-tions of future success. For example, ‘‘Attainment of temporally proximalgoals (relative to more distal ones) gives an individual a sense of task masteryand bolsters efficacy. This enhanced efficacy, in turn, increases subsequentaspirations as well as perseverance in the face of discrepant feedback’’(Earley & Lituchy, 1991, p. 83; see also Bandura, 1986). Such argumentsemphasize expectations or beliefs, so they cannot account for the resultsabove. In Problem 8, both goals are set so high that neither can be attained;

92 HEATH, LARRICK, AND WU
therefore goal ‘‘attainment’’ cannot enhance self-efficacy or future expecta-tions of success.
The goal setting literature has attempted to explain related results by in-voking the notion of commitment (Locke & Latham, 1990, 1991; Erez &Zidon, 1984). Although they have typically argued that higher goals improveperformance, goal researchers have noted that people may refuse to committo goals that are too high. In Problem 8, Kyle may be less committed to hisextraordinarily ambitious goal than Jim is committed to his more moderategoal.
In the short run, this ‘‘commitment’’ explanation conflicts with that of thevalue function. According to the value function approach, if people did notcommit to a goal, their reference point would not move and their valueswould not change. However, the conflict can be resolved if we assume thatthe value function causes the commitment problem. Initially, people committo their goal and the goal alters their values. Later, people become less com-mitted to their goal because their altered values produce the starting problem.To test this notion, we gave a separate set of people the scenario above andadded the three questions below.
Problem 9. [N 5 64 for these three questions.]1. At the start, who is more committed to his goal?
Jim (23%) Equal (53%) Kyle (24%)2. Who feels that donating 4 h per week for the next 4 weeks will make more
progress towards his goal?Jim (83%) Equal (11%) Kyle (6%)
3. In the end, who’s going to feel more committed to his goal?Jim (72%) Equal (12%) Kyle (16%)
Note that participants expected Jim and Kyle to be equally committed totheir goals at the start. This result contradicts the traditional commitmentexplanation, which would require that Kyle be less committed to his overlyambitious goal. As the value function predicts, participants expected Jim tofeel that he is making more progress toward his goal. And consistent withthe integration of commitment and the value function, participants expectedJim to end up more committed to his goal (the proportion of people favoringJim in the last two problems significantly exceeds 50%, p , .01 by χ2 ).
Subgoaling. One way to overcome the starting problem is to set subgoals.People who set subgoals are more sensitive to progress than people whofocus only on their ultimate goal. Consider the effect of subgoals in the fol-lowing problem:
Problem 10. [N 5 46] Jill is a high school cross-country runner. One summershe decides to run 1000 miles over the course of the 90-day summer break. Jillthinks of this as running 330 miles a month (30 days). The first day she runs 15miles and wakes up quite sore.
Tina is also a high school cross-country runner. One summer she decides to run

GOALS AS REFERENCE POINTS 93
1000 miles over the course of the 90-day summer break. Tina thinks of this as run-ning 11 miles a day. The first day she runs 15 miles and wakes up quite sore.
Who is more likely to reach her overall goal for the summer?Please circle one: Jill (22%) Tina (78%)
Both runners have the same overall goal for the summer. However, Jillhas divided her overall goal into distant subgoals of 330 miles per month,while Tina has divided her overall goal into proximal subgoals of 11 milesper day. People agree that the proximal subgoals are more likely to produceeventual success. The value function suggests that by separating a task intosubgoals, people should maximize their sensitivity to small movementstoward their overall goal. When Jill wakes up sore after running her first15 miles for the summer, she may find it difficult to motivate herself to runat all. After all, running any feasible number of miles seems to contributeso little to her distant subgoal of 330 miles per month. By dividing themonthly goal into daily subgoals, Tina is better able to see progress relativeto her goal.
Risk
Diminishing sensitivity produces the curvature of the value function, andthe curvature of the value function predicts how people will react to risk. Inthe domain of gains, the concave part of the value function implies that peo-ple will be risk averse (i.e., that they will prefer a sure thing over a gambleof equal expected value). For example, when people choose between $3000for sure or a .80 chance of $4000, the majority prefers the sure thing (Kahne-man & Tversky, 1979). Since the gamble has a slightly higher expected value($3200 versus $3000), this choice suggests that people are risk averse.
Although the traditional literature in economics has assumed that riskaversion was the norm, the decision literature has demonstrated that riskattitudes change depending on whether people are above or below a referencepoint. For example, if the signs are reversed on the gamble above, peopleprefer a .80 chance of losing $4000 over losing $3000 for sure; i.e., they arerisk seeking. For moderate probabilities and values, people tend to be riskaverse when outcomes are above their reference point (hence in gains) andrisk seeking when outcomes are below their reference point (hence in losses)(Tversky & Kahneman, 1979, 1992; Payne, Laughhunn, & Crum, 1980,1981; Fishburn & Kochenberger, 1979).
The value function was proposed, in part, to describe risk seeking in thedomain of losses (Kahneman & Tversky, 1979), and the convex shape ofthe value function in the loss domain implies that people will be risk seeking.Thus, if we are correct, and goals serve as reference points that separatelosses from gains, then specific goals should make people more risk seekingwhen they are below their goal. The following problem demonstrates thisprediction of the value function.

94 HEATH, LARRICK, AND WU
Problem 11. You are the manager of a large manufacturing unit in a Fortune 100company. At the present time, you are in the midst of a year-long plan to cut costsin your unit. Your goal for this quarter is to do your best to save money during thecurrent quarter. [Your goal for this quarter is to save $250,000.]
At present, you are considering two plans:Plan M. Plan M will save $120,000.Plan N. Plan N has an 80% chance of saving $50,000 and a 20% chance of saving
$250,000.Both plans are one-time options. They will not be available later in the year, and
you have time to complete only one of them during the current quarter.Which plan will you choose? [Do your best, N 5 65] Plan N (24%)Which plan will you choose? [Save $250,000, N 5 66] Plan N (47%)
The number of people who choose the more risky Plan N doubles whenpeople have a specific rather than a ‘‘do your best’’ goal (p , .01 by χ2 ).Consistent with the predictions of diminishing sensitivity, people are morerisk seeking when they are below their goal.
Lay Theories and Behavior
We have explored whether goals serve as reference points by exploringwhether goals inherit key features of the value function like loss aversionand diminishing sensitivity. At this point, we have evidence that people’sintuitions about goals agree with the predictions of the value function, butlay theories should also be confirmed with real behavior. In the next section,we review the empirical evidence from the goal setting literature and showthat the value function explains the stylized facts from hundreds of studieswhere goals affect important motivational behaviors like effort and perfor-mance. However, Problems 1–11 contain some novel predictions that wouldbenefit from further study with real behavior.
In other research (Larrick, Heath, & Wu, 1999a), we have confirmed therisk predictions of the value function with real behavior. As in Problem 11,when people make real choices and suffer real consequences, they becomemore risk seeking when they set high goals. When faced with choices amongmonetary gambles, people with high goals were more willing to take gambleswith lower expected payoffs but higher variance. In a social bargaining task,they took positions that empirically ran a higher risk of making their bar-gaining partner walk away, leaving them with nothing. In an anagram task,they attempted to perform harder problems where they were more likelyto fail.
While other predictions of the value function await further behavioral re-search, the section below illustrates that the value function explains someof the key behavioral results in the goal literature.
THE EFFECTS OF GOALS ON MOTIVATION: EFFORT,PERSISTENCE, AND PERFORMANCE
In the introduction, we argued that the value function may help bridge thegap between the decision literature, which has traditionally been concerned
GOALS AS REFERENCE POINTS 95
with cognitive phenomena, and the goal literature, which has traditionallybeen concerned with motivational phenomena. In the previous section, wedemonstrated that goals serve as reference points and inherit the propertiesof the value function. In this section, we use the properties of the valuefunction to explain a large set of empirical results in the goal literature thatconcern one of the most basic question of motivation: When will peoplework harder and longer on a task?
Our attempt to link the value function and goal literature may be somewhatcontroversial. The decision literature has primarily focused on cognitive ex-planations for phenomena like choice , while the goal literature has focusedon affect, effort, persistence, and performance—‘‘hot’’ motivational issues.We argue that the value function bridges these two literatures. When peopleset a goal, their goal acts as a reference point and systematically alters thevalue of outcomes. When values are altered, people not only choose differ-ently, they become more motivated to exert effort and to persist and as aresult they perform better. Below, we briefly review the major empiricalresults in the goal setting literature and we use the properties of the valuefunction to explain them.
Using the value function to explain these results requires a few steps be-cause the empirical results in the goal setting literature concern the aggregateperformance of a collection of individuals. In the section below, we firstconsider how the value function explains the components of individual per-formance—effort and persistence. We then describe a model that explainshow effort and persistence combine to determine an individual’s overall per-formance. Finally, we consider what our model of individual performancepredicts when the performance of a collection of individuals is aggregated.
Explaining Individual Effort and Persistence
In this section, we consider how the value function explains the compo-nents of individual performance—effort and persistence. The literature onthe motivational effects of goals extends to hundreds of studies, so we willonly mention some of the empirical results (see Locke & Latham (1990) fora more comprehensive review).
Effort. On physical tasks, goal subjects exercise at a higher rate, squeezea grip harder, lift more weight, and pedal more rapidly on a bicycle. Oncognitive tasks, goal subjects react faster, perform more rapidly on well-learned tasks like addition and subtraction, and even on tasks like brainstorm-ing or anagrams (cf. Locke & Latham, 1990, pp. 87–90).
Persistence. On physical tasks, people with high goals compress a handdynamometer longer and persist longer in a classic pain tolerance task (im-mersing one’s arm in very cold water). People also persist longer on mentaltasks. On anagrams, high goal participants worked longer and rested less.On a prose comprehension task, they spent more time studying than partici-pants with do your best goals. And individuals with high goals are also less

96 HEATH, LARRICK, AND WU
likely to quit when they encounter difficulties. On bargaining tasks, highgoal participants bargain longer and hold their positions longer rather thancompromising (cf. Locke & Latham, 1990, pp. 90–92).
To explain why people with high goals may exert higher effort and persistlonger, we assume that goals serve as reference points and that the valuefunction explains how the value of outcomes is altered by the goal. We alsoassume that people decide how much effort to exert and how long to persistby weighing the benefits and costs of additional effort or persistence. Thefollowing two assumptions are critical for our analysis:
1. The benefits are determined by the Prospect Theory value function andthe particular goal (reference point) that people set. If bg (x) is the benefitderived from completing x units of performance given a goal g, bg (x) 5v(x 2 g).
2. The cost of producing a unit of performance (e.g., an extra sit-up) in-creases (because of fatigue, boredom, and diminishing returns) as the perfor-mance increases. Letting c(x) denote the cost of performing x units, the as-sumption is equivalent to c′(x) . 0.
In our simple model, we assume that people stop exerting effort or per-sisting when marginal costs equal marginal benefits. In essence, we assumethat people are myopic—they only look one unit ahead and compare themarginal costs and benefits of performing that unit. We call this the myopicvalue model of goal setting or, as shorthand, the myopic value model. Aformal version of the myopic value model is found in Wu, Heath, and Larrick(1998). Note that the myopic value model ignores the effect of expectanciesand places all the explanatory burden on values. However, it will take us along way toward explaining the empirical results on motivation.
Effort
Our analysis of individual effort parallels our earlier analysis of theCharles and David sit-up problems (Problems 4, 6, and 7). Based on ourearlier analysis, it should be clear that the myopic value model predicts that:(i) when both individuals are below a goal, the individual closer to the goalwill exert more effort (Problem 7); (ii) when both individuals are above thegoal, the individual closer to the goal will exert more effort (Problem 6);(iii) when one individual is below a goal, and the other is above the goal bya similar amount, the individual who is below the goal will exert more effort(Problem 4).
These predictions are illustrated by the value functions depicted in Fig.2. If the slope of the value function describes the marginal benefit of attainingan additional unit of performance, then people will be willing to exert highereffort (i.e., absorb higher costs) when marginal benefits are higher. This re-sult follows directly from our assumption that individuals equate marginalcosts and benefits. Thus, to understand which individual is willing to incur

GOALS AS REFERENCE POINTS 97
FIG. 3. Value functions for two individuals in first derivative (marginal) form: one witha goal of 30, b ′30 (x), and one with a goal of 40, b′40 (x). The figure also depicts a sample marginalcost curve, c′(x). The individual with a goal of 30 will stop around 39 units, the individualwith a goal of 40 will stop around 45 units.
higher costs and exert higher effort, we simply need to compare the slopesof the value function at a given level of performance.
Persistence
To explain why people with goals persist longer, it helps to think in termsof marginal costs and benefits. Figure 3 depicts the same curves depictedin Fig. 2, but in marginal terms (i.e., the curves in Fig. 3 show the firstderivative—i.e., the slope—of the curves in Fig. 2). Figure 3 also depictsa sample marginal cost curve.
To understand persistence, we imagine a person asking herself on a contin-ual basis, ‘‘Should I continue with this task?’’ In answering the question,she weighs the additional costs of an extra unit of performance against thebenefits, and she persists at the task until the marginal costs of continuingequal the marginal benefits. Graphically, this occurs where the marginal costcurve intersects the marginal benefit curve. Note that for the person with agoal of 30, the curves intersect at about 39 units, indicating that this personwill stop after completing 39 units. For the person with a goal of 40, thisoccurs at about 45 units, indicating that this person will exceed her goal of45, but will quit soon after.
In general, to understand intuitively why a higher goal might increasepersistence, note that the marginal cost of achieving the nth unit does notdepend on the goal whereas the marginal benefit does. People who set modestgoals and exceed them soon find themselves in the domain of gains wheremarginal benefits decrease swiftly because of diminishing sensitivity. Indi-

98 HEATH, LARRICK, AND WU
viduals who set aggressive goals remain longer in the domain of losses wheremarginal benefits are high (because of loss aversion) and increasing (becauseof convexity).
Explaining Performance
How far can our simple myopic value model take us in understandingindividual performance? When we explained effort and persistence above,it was clear that in many cases, higher goals lead individuals to exert highereffort and to persist longer. However, there were exceptions. How do effortand persistence combine to affect overall individual performance?
Performance is the result of work over time, and work depends on effortand persistence. To guide our analysis of performance, we have constructeda precise mathematical model that describes how the value function wouldsimultaneously affect effort and persistence (Wu et al., 1998). The modelpredicts that if an individual performs above a specific goal, she would haveperformed even better if she had increased her goal slightly, but that if sheperforms below a goal, she would have performed better if she had loweredher goal slightly. The latter result conflicts with the recommendations of thegoal setting literature, which has essentially claimed that (commitment heldconstant) higher goals are always better.
To compare the predictions of our simple myopic value model with theempirical results of the goal setting literature, it is important to note that wemodel a single individual faced with different goals, whereas the goal settingliterature has averaged results over collections of individuals, each of whomhas different abilities and therefore different costs of performance. Below,we first review the standard empirical results on collective performance, andthen we use our model to explain these results.
Results on Collective Performance
In this section, we review the standard empirical results on collective per-formance. In doing so, we must address a confusing aspect of the literatureon goal setting. It has traditionally distinguished two ‘‘kinds’’ of collectiveperformance results even though the value function approach suggests thatthere is only one basic result.
In the goal setting literature, these two kinds of goal effects have beencharacterized by two experimental manipulations:
Goal difficulty. When researchers study goal difficulty, they manipulatethe difficulty of goals and measure how well people perform. The prototypi-cal study in this area compares three goals: low (90% objective probabilityof success), medium (50% success), and high (10% success), where objectiveprobabilities are unknown to participants. Locke & Latham (1991) reportthat in 192 studies of goal difficulty, 91% have found that higher goals pro-duce higher performance.

GOALS AS REFERENCE POINTS 99
Goal specificity. When researchers study goal specificity, they typicallygive one group of subjects a specific, challenging goal and tell another groupto ‘‘do your best.’’ Locke and Latham (1991) report that in 201 studies ofgoal specificity, 91% found that specific, challenging goals led to higherperformance than vague, do your best goals.
Although the goal setting literature has traditionally distinguished the twokinds of results on goal difficulty and goal specificity, the value functionapproach suggests that these effects are identical. In the traditional study ofgoal difficulty, an experimenter assigns a low, medium, and high goal todifferent groups of subjects. This manipulation is clean and convincing. Weargue, however, that the goal specificity manipulation is simply anothermeans of manipulating goal difficulty. In the traditional study of goal speci-ficity, the experimenter gives one group of subjects a specific, challenginggoal, and tells another group of subjects to ‘‘do your best.’’ The literaturehas assumed that this ‘‘do your best’’ instruction is less specific but equallydifficult as the ‘‘specific challenging’’ goal (cf. Locke & Latham, 1990). Weargue that this manipulation is unlikely to equate challenge because the spe-cific goals in previous studies are extremely challenging, with objective prob-abilities of success of only 15% or so (e.g., Locke, 1968, p 5 .13; Camp-bell & Ilgen, 1976, p 5 .20; Frost & Mahoney, 1976, p 5 .14; Mossholder,1980, p 5 .13). Because experimenters and field researchers set such extremegoals in the specific goal condition, it is likely that reference points in thiscondition are higher, on average, than any reference points people adopt inthe ‘‘do your best’’ condition. Thus, the goal ‘‘specificity’’ manipulation isjust another way of manipulating goal difficulty.
Our claim is supported by the conventional wisdom about methodologyfor such studies. Recently, in their book reviewing the field, Locke and La-tham (1990) summarized conventional methodological norms in their list of‘‘guidelines for conducting successful goal setting studies.’’ They note thatin studies that compare do your best with specific goals, a specific ‘‘goalthat only 10% of the subjects can reach is usually difficult enough to producereliable performance differences, but a 50% level of difficulty is not’’(p. 349). Thus, specificity is not enough—specific goals do not work theirmagic if they are not also extremely challenging. Thus, we argue that thetwo performance results, which have been separated for years in the goalsetting literature, are really distinguished only by two different experimentalprocedures for manipulating goal difficulty. Or, as we would say in the valuefunction approach, they are distinguished by two different procedures thatproduce one reference point that is higher than another.
The question, then, is when collective performance is likely to increaseas the reference point increases. In particular to understand the typical resultin the literature, we need to be able to understand why collective performanceincreases when a goal (reference point) shifts from an objective 90% chanceof success to a 50% chance and from a 50% chance of success to a 10%

100 HEATH, LARRICK, AND WU
chance. Together, these two shifts describe the explicit conditions of thetypical ‘‘goal difficulty’’ study, and the latter shift describes the implicitconditions of the typical ‘‘goal specificity’’ study.10 If the myopic valuemodel can explain why these two shifts increase performance, it can explainthe majority of the empirical results in the literature.
Explaining the Collective Performance Results
Recall that the myopic value model predicts that if an individual performsabove a specific goal, she would have performed even better if she had in-creased her goal slightly; but that if she performs below a goal, she wouldhave performed better if she had lowered her goal slightly. With some rea-sonable assumptions, this model can explain why collective performanceincreases when a reference point shifts from a 90% level of difficulty to 50%and from 50 to 10%. In general, in applying our simple model to the aggre-gate results from a collection of individuals, the key question is whether theincreased performance by individuals who are challenged by the higher goalovercomes the decreased performance by individuals who fall further behindtheir goal.
When a reference point increases so that objective success drops from90 to 50%, the typical individual goes from performing above the goal toperforming around the goal. According to our model, individuals who wereoriginally performing above their goal should perform better when their goalincreases, so 90% of individuals should increase their performance. Themodel predicts that the 10% who originally fell short of the low goal willperform worse under the higher goal, but this decrease by 10% is unlikelyto offset the increase by the other 90%.
When the goal is raised so that success drops from 50 to 10%, the modelagain predicts that individuals who failed to reach the 50% goal will performworse, while the individuals who exceeded the 50% goal will perform better.Here, the aggregate predictions of the model are somewhat less obvious be-cause approximately equal numbers of people decrease and increase theirperformance. Even so, the model predicts that average performance is likelyto increase because the size of the performance decreases and increases arenot likely to be symmetric.
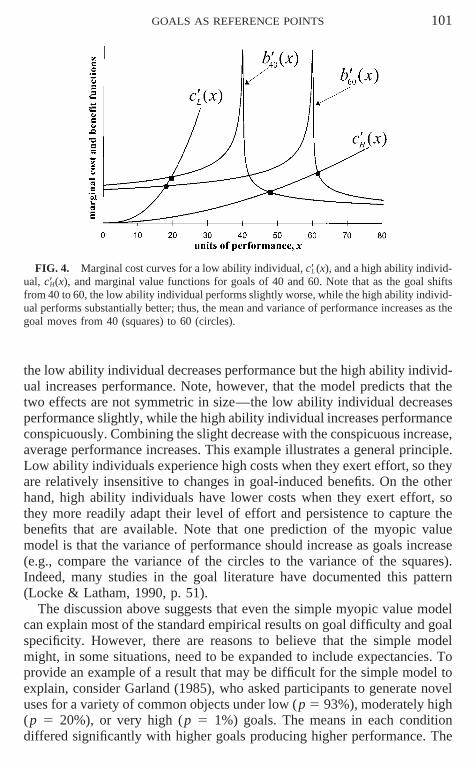
To illustrate the asymmetry between performance decreases and increases,consider Fig. 4, which contains the cost curves of two individuals who havedifferent ability levels (the individual with lower ability has the steeper mar-ginal cost curve, c′L (x)). As predicted by our model, when the goal shifts out,
10 Do your best goals may vary across individuals, but the evidence above suggests thatindividuals who are told to ‘‘do your best’’ on average set goals that correspond to a difficultylevel of 50%. Otherwise, experimenters would not have trouble demonstrating performancedifferences when an experimenter assigns a specific goal with a 50% objective probability ofsuccess (Locke & Latham, 1990, p. 349).
GOALS AS REFERENCE POINTS 101
FIG. 4. Marginal cost curves for a low ability individual, c′L (x), and a high ability individ-ual, c′H(x), and marginal value functions for goals of 40 and 60. Note that as the goal shiftsfrom 40 to 60, the low ability individual performs slightly worse, while the high ability individ-ual performs substantially better; thus, the mean and variance of performance increases as thegoal moves from 40 (squares) to 60 (circles).
the low ability individual decreases performance but the high ability individ-ual increases performance. Note, however, that the model predicts that thetwo effects are not symmetric in size—the low ability individual decreasesperformance slightly, while the high ability individual increases performanceconspicuously. Combining the slight decrease with the conspicuous increase,average performance increases. This example illustrates a general principle.Low ability individuals experience high costs when they exert effort, so theyare relatively insensitive to changes in goal-induced benefits. On the otherhand, high ability individuals have lower costs when they exert effort, sothey more readily adapt their level of effort and persistence to capture thebenefits that are available. Note that one prediction of the myopic valuemodel is that the variance of performance should increase as goals increase(e.g., compare the variance of the circles to the variance of the squares).Indeed, many studies in the goal literature have documented this pattern(Locke & Latham, 1990, p. 51).
The discussion above suggests that even the simple myopic value modelcan explain most of the standard empirical results on goal difficulty and goalspecificity. However, there are reasons to believe that the simple modelmight, in some situations, need to be expanded to include expectancies. Toprovide an example of a result that may be difficult for the simple model toexplain, consider Garland (1985), who asked participants to generate noveluses for a variety of common objects under low (p 5 93%), moderately high(p 5 20%), or very high (p 5 1%) goals. The means in each conditiondiffered significantly with higher goals producing higher performance. The

102 HEATH, LARRICK, AND WU
prediction of the simple model is less plausible here than in the typical studyin the literature because when the 20% goal is compared to the 1% goal, anincrease in performance by 20% of participants must overcome a decrease inperformance by the remaining 80%. However, consistent with our model, thevariance of performance under the 1% goal is 75% higher than the varianceunder the 20% goal (p , .05 by F test). In order to assess the quality of thepredictions of our model (and those of other individual models that have beenproposed in the literature), future goal setting studies should report aspects ofthe distribution of performance in addition to the mean. For example, althoughaverages are hard to interpret, the predictions of individual models are easierto confirm or deny with information about median performance.
To summarize, the simple myopic value model parsimoniously explainsmany of the results in the literature. However, if it needs to be expanded,the logical candidate is to relax the myopia assumption and add expecta-tions—people surely look forward more than one unit when they areweighing the costs and benefits of continuing to perform. Whether research-ers prefer to use the simple myopic value model or some elaboration, ourwork suggests that the value function is a useful way of modeling how peopleexperience outcomes. When goals serve as reference points, individuals per-ceive outcomes differently in a manner predicted by the value function, andthis affects not only the cognitive processes that guide their choices, but alsotheir motivation to work hard, persist, and perform. Thus the value functionserves to bridge the gaps between the cognitive literature on decision makingand the motivational literature on goals.
GENERAL DISCUSSION
The Prospect Theory value function allows us to understand how basiccognitive processes translate into basic motivational processes like affect,effort, persistence, and performance. The first section of the paper demon-strated that goals inherit the properties of the value function (e.g., they serveas reference points and display loss aversion and diminishing sensitivity).In the second section of the paper, we used the properties of the value func-tion to explain the empirical results of hundreds of studies in the goal settingliterature on motivation.
In this section, we consider the advantages and disadvantages of the valuefunction approach as well as some simple extensions of the approach to ad-dress the question of how individuals set goals for themselves. We concludeby proposing that a value function analysis of goals could be extended to avariety of non-status quo reference points.
Further Implications of the Value Function for Goals
The two major advantages of the value function approach are precisionand parsimony; it makes clear predictions and the predictions follow from

GOALS AS REFERENCE POINTS 103
a small number of assumptions. In contrast, the other major theories of goalsetting are not always precise (e.g., many are silent about the majority ofour word problems) or parsimonious (i.e., they rely on various combinationsof value, expectancy, and commitment).
Precision. The major benefit of precision is that it allows researchers tomake a variety of new behavioral predictions. We illustrate this precisionby elaborating on one prediction that we mentioned previously and one thatis new.
We have already mentioned the ‘‘starting problem,’’ the idea that highgoals might be demotivating because they make it difficult for people todiscern progress toward their goals. The starting problem follows directlyfrom diminishing sensitivity away from the goal. The value function allowsresearchers to make a variety of related predictions about subgoals, a promis-ing area for future goal research. The study of subgoals might get a headstart by borrowing from research in ‘‘mental accounting’’ (Thaler, 1985)which has shown that the valuation of transactions depends on whether thetransactions or aggregated or segregated.
A second prediction of the value function approach is that performancewill cluster around (or ‘‘pile up’’) around difficult but attainable goals (Wuet al., 1999). The intuition for piling up is straightforward. When people arebelow their goals, they receive high benefits from removing a ‘‘loss,’’ andthese high benefits are sufficient to encourage them to exert continued effort.However, once they reach their goal and enter the domain of gains, the mar-ginal benefits of additional performance will be substantially smaller. At thatpoint, they are likely to quit, leading performance to pile up in the nearneighborhood of the goal.
Parsimony. The value function approach is not only more precise, it isalso more parsimonious than existing models which frequently invoke, notonly values, but also expectancies, commitment and other factors. Of course,behavior is sufficiently complex that any parsimonious model will fail toaccount for some results. In this paper, we have pushed our analysis as faras possible by considering only values and not expectations. Although itmight be possible to account for other findings by incorporating expectations,the costs of extending the model may be high. For example, adding expecta-tions dramatically complicates the possibility of deriving mathematical re-sults like the ones that underlie our discussion of the myopic value model.If the simple model explains the majority of the data, then the additionalexplanatory power of adding expectations may not be worth the cost.
Dynamic goals. Finally, the value function approach provides some insightinto how people may set goals dynamically to regulate their own motivation.Recall Problem 2: Our participants felt that Alice would be less satisfiedthan Betty even though she scored four points higher than the exam. Eventhough Alice is less satisfied, many people might prefer to be her rather thanBetty. The current myopic value model can explain why Alice performs bet-

104 HEATH, LARRICK, AND WU
ter yet feels worse, but it does not explain why individuals might prefer tobe Alice.
A broader application of the value function would allow people to shifttheir attention from one reference point to another. By doing so, individualsmay solve conflicts like Alice’s between absolute and relative performance.For example, during a task and perhaps immediately after, individuals maypay attention to the reference point specified by their goal, whereas in thelong run, they may shift their attention back to their former status quo refer-ence point and attend to absolute performance. Our observation here echoesLewin et al. (1944) who suggested that individuals may attend to their start-ing point, their previous performance, or others’ performances, in order toovercome their potential sense of failure relative to their aspirations. In gen-eral, we feel that the key theoretical question about goal setting is how peoplestrategically allocate their attention among various reference points and howtheir attention may change over time as they perform and complete theirtasks.
Non-Status Quo Reference Points and Reference Point Selection
The fact that goals serve as reference points and inherit the properties ofthe value function suggests that other possible comparisons may also serveas reference points and may demonstrate similar effects. Although most re-search has focused on the status quo as a reference point, some has explicitlyapplied the reference point concept to other types of non-status quo compari-sons (Boles & Messick, 1995; Larrick & Boles, 1995; Loewenstein, Thomp-son, & Bazerman, 1989; Thaler, 1985). Goals are intriguing because theyare clearly non-status quo reference points. They change how outcomes arevalued despite the fact that they may never be a ‘‘status quo,’’ i.e., ‘‘anexisting state or condition’’ (Webster’s New Universal Dictionary, 1994).This suggests that a wide variety of other non-status quo comparisons, allof which involve varying degrees of mental simulation (Kahneman & Miller,1986; Kahneman & Tversky, 1982; Roese & Olson, 1995), may serve asreference points and alter the value of outcomes according to the value func-tion. For example, researchers have appealed to the value function to explainthe effects of aspirations (Payne et al., 1980, 1981), social comparisons(Loewenstein et al., 1989), and foregone alternatives (Boles & Messick,1995; Larrick & Boles, 1995).
Although the literature provides precedents for applying the value functionto non-status quo comparisons, these precedents are the exception rather thanthe rule. Most research on aspirations, expectations, social comparisons, andforegone alternatives has not specified how these potential reference pointsalter how people perceive value. All of these areas might benefit from consid-ering the value function more systematically. As an illustration, in our ongo-ing work we have applied the value function to the social comparison litera-ture. The social comparison literature has been concerned with two types of

GOALS AS REFERENCE POINTS 105
social comparisons—unfavorable, ‘‘upward,’’ comparisons and favorable,‘‘downward,’’ comparisons. These ‘‘loss’’ and ‘‘gain’’ comparisons, respec-tively, invoke and satisfy different motivations. Like goals, ‘‘upward’’ com-parisons provide the motivation and opportunity to improve one’s circum-stance (Collins, 1996; Taylor & Lobel, 1989; Larrick et al., 1998), whereasdownward comparisons satisfy the desire to protect and enhance self-esteem(Taylor & Lobel, 1989; Tesser, 1988; Wills, 1981). Similar motivations havebeen proposed in comparisons to counterfactuals and foregone alternatives(Larrick, 1993; Roese, 1997).
The value function not only captures the difference in affect between up-ward and downward comparisons, it also predicts that upward comparisonswill be more painful than downward comparisons are pleasant and that bothtypes of comparisons will exhibit diminishing sensitivity. Together, lossaversion and diminishing sensitivity predict that upward comparisons willbe much more motivating than downward comparisons, which is consistentwith the results and claims of previous research (Roese, 1997). And dimin-ishing sensitivity predicts that people will make upward comparisons to‘‘close’’ rather than ‘‘distant’’ others to avoid the starting problem. Thus,the value function parsimoniously links cognitive and motivational phenom-ena in the social comparison literature as it does in the goal literature. Wepropose that it can provide a similar link for other non-status quo referencepoints.
Of course, other considerations affect how outcomes are valued besidesmere direction and distance from a reference point. As an example,Loewenstein et al. (1989) studied the utilities associated with different two-party allocations. They found that when people experience a comparativeloss relative to the outcome of another party, they exhibited both loss aver-sion and diminishing sensitivity. When people experienced comparativegains, however, their responses were not consistent with the value function—satisfaction decreased when the comparison was inequitable but in their fa-vor (at least for positive and neutral relationships). This suggests that wemight distinguish two effects in the case of social comparisons: (1) a purevalue function effect that exhibits loss aversion and diminishing sensitivityand (2) a fairness effect that reflects a disutility for unfairness (or inequality).To illustrate, consider how people would assess their salary relative to amarket mean. Here, satisfaction is likely to exhibit all of the features of thevalue function, not only the loss aversion and convexity found byLoewenstein et al. (1989), but also concavity in gains (Larrick et al., 1999b).By using the value function as a baseline for non-status quo comparisons,researchers may be in a better position to point out what is truly uniqueabout a particular comparison or context. In the case of two-party allocations,adjusting for a basic value function would accentuate the role that fairnessplays in this context.
In sum, we are proposing that whenever a specific point of comparison is

106 HEATH, LARRICK, AND WU
psychologically salient, it will serve as a reference point. Although additionalnuances may need to be considered—as when there is utility for fairness orwhen there are multiple, conflicting reference points—we propose that anyanalysis of a comparative judgment should begin with the assumption thatcomparisons inherit the properties of the value function.
Conclusion
Decision researchers have traditionally been primarily concerned with rel-atively cold, cognitive phenomena, while motivational researchers have tra-ditionally been interested in warmer issues. If we accept that goals are refer-ence points, and thereby understand how values are altered by goals, we mayreunite phenomena that have been misleadingly classified as solely cognitiveor solely motivational.
REFERENCES
Atkinson, J. W. (1957). Motivational determinants of risk-taking behavior. Psychological Re-view, 64, 359–372.
Bandura, A. (1986). Social foundations of thought and action: A social cognitive theory. Engle-wood Cliffs, NJ: Prentice Hall International.
Benartzi, S., & Thaler, R. H. (1995). Myopic loss-aversion and the equity premium puzzle.Quarterly Journal of Economics, 110, 75–92.
Boles, T. L., & Messick, D. M. (1995). A reverse outcome bias: The influence of multiplereference points on the evaluation of outcomes and decisions. Organizational Behaviorand Human Decision Processes, 61, 262–275.
Campbell, D. J., & Ilgen, D. R. (1976). Additive effects of task difficulty and goal setting onsubsequent task performance. Journal of Applied Psychology, 61, 319–324.
Campion, M. A., & Lord, R. G. (1982). A control systems conceptualization of the goal-setting and changing process. Organizational Behavior and Human Performance, 30,265–287.
Cantor, N., & Zirkel, S. (1990). Personality, cognition, and purposive behavior. In L. A. Pervin(Ed.), Handbook of personality (pp. 135–164). New York: Guilford Press.
Cantor, N., & Kihlstrom, J. F. (1987). Personality and social intelligence. Englewood Cliffs,NJ: Prentice Hall International.
Collins, R. L. (1996). For better or worse: The impact of upward social comparison on self-evaluations. Psychological Bulletin, 119, 51–69.
Earley, P. C., & Lituchy, T. R. (1991). Delineating goal and efficacy effect: A test of threemodels. Journal of Applied Psychology, 76, 81–98.
Erez, M., & Zidon, I. (1984). Effect of goal acceptance on the relationship of goal difficultyto performance. Journal of Applied Psychology, 72, 387–392.
Fajans, S. (1933). Erfolg, Ausdauer, und Aktivitat beim Saugling und Kleinkind. Psycholog-ische Forschung, 17, 268–305.
Feather, N. T. (1959). Subjective probability and decision under uncertainty. PsychologicalReview, 66, 150–164.
Feather, N. T. (1982). Introduction and overview. In N. T. Feather (Ed.), Expectations andactions: Expectancy–value models in psychology (pp. 1–16). Hillsdale, NJ: Erlbaum.

GOALS AS REFERENCE POINTS 107
Fishburn, P. C., & Kochenberger, G. A. (1979). Two-piece Von Neumann–Morgenstern utilityfunctions. Decision Sciences, 10, 503–518.
Fischhoff, B., Goitein, B., & Shapira, Z. (1981). The experienced utility of expected utilityapproaches. In N. Feather (Ed.), Expectancy, incentive, and action (pp. 315–339). Hills-dale, NJ: Erlbaum.
Frost, P. J., & Mahoney, T. A. (1976). Goal setting and task process: An interactive influenceon individual performance. Organizational Behavior and Human Performance, 17, 328–350.
Galanter, E., & Pliner, P. (1974). Cross-modality matching of money against other continua.In H. R. Moskowitz et al. (Eds.), Sensation and measurement (pp. 65–76). Dordrecht,Holland: Reidel.
Garland, H. (1984). Relation of effort–performance expectancy to performance in goal-settingexperiments. Journal of Applied Psychology, 69, 79–84.
Garland, H. (1985). A cognitive mediation theory of task goals and human performance. Moti-vation and Emotion, 9, 345–367.
Gonzalez, R., & Wu, G. (1999). On the shape of the probability weighting function. CognitivePsychology, 38, 129–166.
Hull, C. L. (1931). Goal attraction and directing ideas conceived as habit phenomena. Psycho-logical Review, 38, 487–506.
Hull, C. L. (1932). The goal gradient hypothesis and maze learning. Psychological Review,39, 25–43.
Hull, C. L. (1938). The goal-gradient hypothesis applied to some ‘force-field’ problems inthe behavior of young children. Psychological Review, 45, 271–299.
Hull, C. L. (1952). A behavior system: An introduction to behavior theory concerning theindividual organism. New Haven: Yale University.
Kahneman, D., Knetsch, J. L., & Thaler, R. (1990). Experimental tests of the endowmenteffect and the Coase Theorem. Journal of Political Economy, 98, 1325–48.
Kahneman, D., & Miller, D. T. (1986). Norm theory: Comparing reality to its alternatives.Psychological Review, 93, 136–153.
Kahneman, D., & Tversky, A. (1979). Prospect theory: An analysis of decision under risk.Econometrica, 47, 263–291.
Kernan, M. G., & Lord, R. G. (1989). The effects of explicit goals and specific feedback onescalation processes. Journal of Applied Social Psychology, 19, 1125–1143.
Klein, H. J. (1991). Further evidence on the relationship between goal setting and expectancytheory. Organizational Behavior and Human Decision Processes, 49, 230–257.
Kramer, R. M. (1989). Windows of vulnerability or cognitive illusions? Cognitive processesand the nuclear arms race. Journal of Experimental Social Psychology, 25, 79–100.
Larrick, R. P. (1993). Motivational factors in decision theories—The role of self-protection.Psychological Bulletin, 113, 440–450.
Larrick, R. P., & Boles, T. L. (1995). Avoiding regret in decisions with feedback—A negotia-tion example. Organizational Behavior and Human Decision Processes, 63, 87–97.
Larrick, R. P., Heath, C., & Wu, G. (1999a). Goal-induced risk taking in strategy selection:A reference point prediction. University of Chicago Graduate School of Business work-ing paper.
Larrick, R. P., Heath, C., & Wu, G. (1999b). Multiple reference points: Choice, affect, andmotivation. University of Chicago Graduate School of Business working paper.
Lewin, K. (1931). Environmental forces in child behavior and development. In C. Murchison(Ed.), A handbook of child psychology. Worcester, MA: Clark University.
108 HEATH, LARRICK, AND WU
Lewin, K. (1935). A dynamic theory of personality. New York: McGraw–Hill.
Lewin, K. (1951). Field theory in social science. New York: Harper & Brothers.
Lewin, K., Dembo, T., Festinger, L., & Sears, P. S. (1944). Level of aspiration. In J. McV.Hunt (Ed.), Personality and the behavior disorders (Vol. 1, pp. 333–378). New York:Ronald.
Locke, E. A. (1968). Toward a theory of task performance and incentives. OrganizationalBehavior and Human Performance, 3, 157–189.
Locke, E. A., Frederick, E., Lee, C., & Bobko, P. (1984). Effects of self-efficacy, goals, andtask strategies on task performance. Journal of Applied Psychology, 69, 241–251.
Locke, E. A., & Latham, G. P. (1990). A theory of goal setting and task performance. Engle-wood Cliffs, NJ: Prentice Hall International.
Locke, E. A., & Latham, G. P. (1991). Self-regulation through goal setting. OrganizationalBehavior and Human Decision Processes, 50, 212–247.
Loewenstein, G. F., Thompson, L., & Bazerman, M. H. (1989). Social utility and decision-making in interpersonal contexts. Journal of Personality and Social Psychology, 57, 426–441.
Mace, C. A. (1935). Incentives: Some experimental studies. Industrial Health Research Board(Great Britain) Report No. 72. (Cited in Locke & Latham, 1990.)
Markowitz, H. (1952). The utility of wealth. Journal of Political Economy, 60, 151–158.
Markus, H., & Ruvolo, A. (1989). Possible selves: Personalized representations of goals. InL. A. Pervin (Ed.), Goal concepts in personality and social psychology (pp. 211-242).Hillsdale, NJ: Erlbaum.
McNeil, B. J., Pauker, S. G., & Tversky, A. (1988). On the framing of medical decisions. InD. E. Bell, H. Raiffa, & A. Tversky (Eds.), Decision making: Descriptive, normative,and prescriptive interactions (pp. 562–568). Cambridge: Cambridge Univ. Press.
Mento, A. J., Locke, E. A., & Klein, H. J. (1992). The relation of goal levels to valence andinstrumentality. Journal of Applied Psychology, 77, 395–405.
Mento, A. J., Steel, R. P., & Karren, R. J. (1987). A meta-analytic study of the effects of goalsetting on task performance: 1966–1984. Organizational Behavior and Human DecisionProcesses, 39, 52–83.
Meyer, J. P., Schact-Cole, B., & Gellatly, I. R. (1988). An examination of the cognitive mecha-nisms by which assigned goals affect task performance and reactions to performance.Journal of Applied Social Psychology, 18, 390–408.
Miller, N. E. (1944). Experimental studies of conflict. In J. McV. Hunt (Ed.), Personality andthe behavior disorders (pp. 431–465). New York: Ronald Press.
Mossholder, K. W. (1980). Effects of externally mediated goal setting on intrinsic motivation:A laboratory experiment. Journal of Applied Psychology, 65, 202–210.
Odean, T. (1998). Are investors reluctant to realize their losses? Journal of Finance, 53, 1775–1798.
Payne, J. W., Laughhunn, D. J., & Crum, R. L. (1980). Translation of gambles and aspirationeffects in risky choice behavior. Management Science, 26, 1039–1060.
Payne, J. W., Laughhunn, D. J., & Crum, R. L. (1981). Further tests of aspiration level effectsin risky choice behavior. Management Science, 27, 953–958.
Pervin, L. A. (1989). Goal concepts in personality and social psychology: A historical perspec-tive. In L. A. Pervin (Ed.), Goal concepts in personality and social psychology (pp. 1–17). Hillsdale, NJ: Erlbaum.
Quattrone, G. A., & Tversky, A. (1988). Contrasting rational and psychological analyses ofpolitical choice. American Political Science Review, 82, 719–736.

GOALS AS REFERENCE POINTS 109
Roese, N. J., & Olson, J. M. (Eds.). (1995). What might have been: The social psychologyof counterfactual thinking. Hillsdale, NJ: Erlbaum.
Roese, N. J. (1997). Counterfactual thinking. Psychological Bulletin, 121, 133–148.
Siegel, S. (1957). Level of aspiration and decision making. Psychological Review, 64, 253–262.
Spence, K. W. (1956). Behavior theory and conditioning. New Haven: Yale University.
Spence, K. W., Bergmann, G., & Lippitt, R. (1950). A study of simple learning under irrelevantmotivational-reward conditions. Journal of Experimental Psychology, 40, 539–551.
Taylor, S. E., & Lobel, M. (1989). Social comparison activity under threats: Downward evalua-tion and upward contacts. Psychological Review, 96, 569–575.
Tesser, A. (1988). Toward a self-evaluation maintenance model of social behavior. In L. Ber-kowitz (Ed.), Advances in experimental social psychology (Vol. 20, pp. 181–227). NewYork: Academic Press.
Thaler, R. H. (1985). Mental accounting and consumer choice. Marketing Science, 4, 199–214.
Tolman, E. C. (1932). Purposive behavior in animals and men. New York: Century.Tolman, E. C. (1959). Principles of purposive behavior. In S. Koch (Ed.), Psychology: A study
of science (pp. 92–157). New York: McGraw–Hill.Tubbs, M. (1986). Goal setting: A meta-analytic examination of the empirical evidence. Jour-
nal of Applied Psychology, 71, 474–483.
Tversky, A., & Kahneman, D. (1981). The framing of decisions and the rationality of choice.Science, 221, 453–458.
Tversky, A., & Kahneman, D. (1991). Loss aversion in riskless choice: A reference-dependentmodel. Quarterly Journal of Economics, November 1991, 1039–1061.
Tversky, A., & Kahneman, D. (1992). Advances in prospect theory: Cumulative representa-tions of uncertainty. Journal of Risk and Uncertainty, 5, 297–323.
Webster’s New Universal Dictionary (1994). New York: Barnes & Noble Books.
Wills, T. A. (1981). Downward comparison principles in social psychology. PsychologicalBulletin, 90, 245–271.
Wu, G., Heath, C., & Larrick, R. P. (1999). A value function-based model of goal behavior.University of Chicago Graduate School of Business working paper.
Accepted November 18, 1998