goat case study - meat & livestock australia · 2017-02-09 · goat case study mla cost of...
TRANSCRIPT

Goat case study MLA Cost of Production
MLA Cost of Production case study 1
This case study outlines how a goat producer would calculate their cost of production using the MLA Cost of Production calculator.
The goat herd used in this case study is a harvesting operation, meaning that goats are not run in place of other stock on the property. Instead, they are opportunistically harvested and sent directly to abattoirs or goat depots.
This case study business also has a prime lamb flock and a beef herd, comprising 45% and 55% of the business’s total dry sheep equivalents (DSEs), respectively (refer to the case studies of prime lamb and southern beef for trading details and expenses). This enables users to see how the Cost of Production tool and resulting reports will look for a multi-enterprise business. Businesses with one enterprise or wishing to use the tool with only one enterprise are able to tick which enterprise before starting in the tool, and the tool’s functionality will be adjusted for the enterprise nominated.
However, note that if a business does have multiple enterprises and chooses to calculate the cost of production of only one, they must be careful not to over-allocate expenses, such as overhead and labour expenses, to that enterprise. This will generate an inflated cost of production estimate.
Trading details
When in the ‘Trading details’ tab you will need to navigate your way to the ‘Goat’ section if you are calculating the cost of production of multiple livestock enterprises at once. In this section, you will need to choose whether to use the ‘Managed goat herd’ or ‘Harvesting operation’ section.
Both the ‘Managed goat herd’ and ‘Harvesting operation’ sections capture any production and income associated with your business’s goat herd. However, the ‘Managed goat herd’ is suited to goat production systems in which goat numbers, sales, purchases and reproduction are actively managed. Alternatively, ‘Harvesting operation’ is better suited to goat production systems in which these aspects are unmanaged and numbers are largely unknown, and the collection and sale of goats is opportunistic.
Managed goat herd
The case study example used is a harvesting goat operation, but this ‘Managed goat herd’ section has been included for the benefit of businesses with a managed goat herd.
If you are using the ‘Managed goat herd’ section, it is important to pay close attention to livestock classes when conducting a livestock inventory.

Goat case study
MLA Cost of Production case study 2
To do this, ensure that inventory numbers contain only the livestock groups they represent. This ensures that the value of stock held within the herd is captured as the animals get older. Table 1 provides the AUS-MEAT definitions and indicative age brackets associated with each stock class.
Table 1: It is important to adhere to the definitions for the different stock classes
Stock class AUS-MEAT definitions, indicative age brackets* Does Female
Up to 8 permanent incisor teeth > 1 year
Kids Female or male 0 permanent incisor teeth < 12 months
Capretto Kid goat Refer to AUS-MEAT handbook* 0–3 months
Chevon Kid goat or Capra Refer to AUS-MEAT handbook* 4–12 months
Wethers Castrate or entire male Up to 8 permanent incisor teeth > 1 year
Bucks Male Up to 8 incisor teeth > 1 year Shows secondary sexual characteristics
* AUS-MEAT Handbook of Australian Meat, 7th edition, 2005.
If kidding occurs close to the end of the year and numbers are not yet known, it is recommended that they are left out of the closing numbers. Once kid numbers are known, they can be included in inventory values.
Table 2 shows the livestock flow for a managed goat herd producing Capretto and Chevon. This table contains the opening and closing livestock inventories (as in the goat Cost of Production tool) plus four additional sections that producers may use to help reconcile their own livestock flow. The four additional sections are:
1. Purchases and transfers (internal transfers between enterprises) 2. Natural increase (kids marked) 3. Sales and transfers (internal transfers between enterprises) 4. Deaths.
Goat case study
MLA Cost of Production case study 3
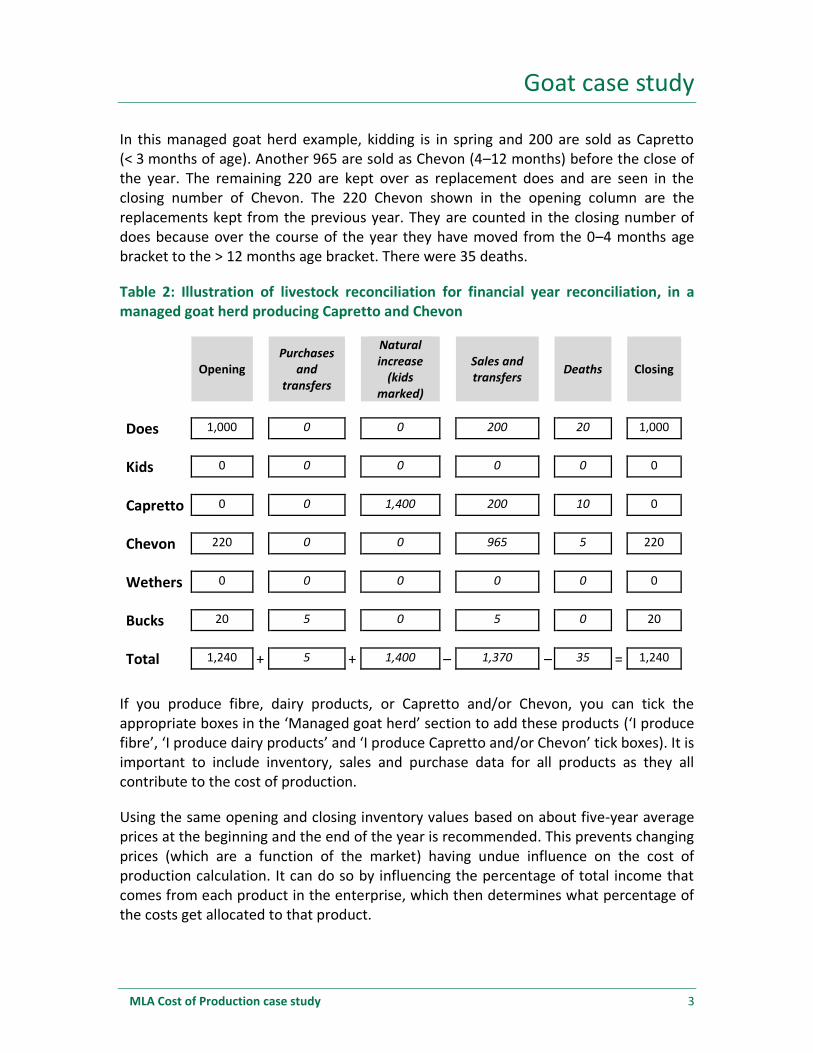
In this managed goat herd example, kidding is in spring and 200 are sold as Capretto (< 3 months of age). Another 965 are sold as Chevon (4–12 months) before the close of the year. The remaining 220 are kept over as replacement does and are seen in the closing number of Chevon. The 220 Chevon shown in the opening column are the replacements kept from the previous year. They are counted in the closing number of does because over the course of the year they have moved from the 0–4 months age bracket to the > 12 months age bracket. There were 35 deaths.
Table 2: Illustration of livestock reconciliation for financial year reconciliation, in a managed goat herd producing Capretto and Chevon
Opening
Purchases and
transfers
Natural increase
(kids marked)
Sales and transfers
Deaths
Closing
Does 1,000 0 0 200 20 1,000
Kids 0 0 0 0 0 0
Capretto 0 0 1,400 200 10 0
Chevon 220 0 0 965 5 220
Wethers 0 0 0 0 0 0
Bucks 20 5 0 5 0 20
Total 1,240 + 5 + 1,400 – 1,370 – 35 = 1,240
If you produce fibre, dairy products, or Capretto and/or Chevon, you can tick the appropriate boxes in the ‘Managed goat herd’ section to add these products (‘I produce fibre’, ‘I produce dairy products’ and ‘I produce Capretto and/or Chevon’ tick boxes). It is important to include inventory, sales and purchase data for all products as they all contribute to the cost of production.
Using the same opening and closing inventory values based on about five-year average prices at the beginning and the end of the year is recommended. This prevents changing prices (which are a function of the market) having undue influence on the cost of production calculation. It can do so by influencing the percentage of total income that comes from each product in the enterprise, which then determines what percentage of the costs get allocated to that product.

Goat case study
MLA Cost of Production case study 4
Harvesting operation
If the opening and closing inventory of a harvested goat herd is not known, then do not include these figures. This will make completing the ‘Trading details’ of a harvested goat herd simple, as users need only to provide the total kilograms and income sold in the year in question. If there have been purchases, such as bucks of genetic merit to improve the harvested herd, then these are to be included.
However, if opening and closing figures are known, including them will increase the accuracy of the cost of production calculation. If the ‘Harvested operation’ tab has insufficient detail to value the different categories of goats, it is recommended that the ‘Managed goat herd’ tab is used.
Figure 1 shows the ‘Trading details’ tab for the goat harvesting case study. Since the numbers of goats at the beginning and end of the year are unknown, there have been no inventory values entered. Throughout the year, 500 goats are collected and sold. Total liveweight sold is 20,000kg and total income is $35,000. Livestock sales receipts including sales values and weights will help complete this section.
Figure 1: Example of how to complete the goat ‘Trading details’ section
Expenses
Direct goat expenses
When in the ‘Expenses’ tab, users with multiple livestock enterprises will need to navigate their way to the ‘Goat’ section. Once here, users can enter the expenses that

Goat case study
MLA Cost of Production case study 5
are directly attributable to the goat herd. The process of entering direct expenses is the same for managed and harvested herds. All expenses should be GST free.
If the Cost of Production tool does not have a particular expense category you need, you can click ‘+ Add expense’ and enter it yourself.
In this case study, direct expenses attributable to the goat herd totalled $2,689 (
Figure 2). As it was a harvested goat herd, $2,500 was the direct cost of the contractor who collected and transported the goats to sale, and $188.50 were goat meat levies.
Purchase receipts and the tax chart from the business’s accounts can be used to help complete this section. When the tax records do not allow for expenses to be apportioned easily, then use common sense to arrive at the appropriate numbers, but aim to create more categories for the subsequent years to allow more accurate allocation. Bookkeepers and accountants should be able to do this easily.
Note that when there are multiple enterprises, and records do not allow expenses to be allocated easily between enterprises, using the tool for all enterprises helps users to be confident that allocations are sensible. If one enterprise is allocated a disproportionate amount of the expenses it will look wrong in the cost of production outcome, and the user can go back and reallocate expenses until the outcomes make sense.
Figure 2: Example of how to enter direct goat expenses
Goat case study
MLA Cost of Production case study 6
Supplement expenses
When in the ‘Expenses’ tab, users need to click ‘Expand’ on the ‘Supplement expenses’ section to enter the cost of any supplements fed to the goat herd. The process of entering supplement expenses is the same for managed and harvested herds. All expenses should be GST free.
Supplementary feeding for maintenance can be divided among all livestock enterprises, even if it was only used in one enterprise on the basis that feeding that enterprise meant the others did not have to be fed. This removes bias that occurs if one enterprise is preferentially fed over another. For example, if you had a managed goat herd that represented 50% of the farm’s DSEs, then 50% of the supplementary feeding expense for the managed goat herd would go to the other livestock enterprise. This is because feeding of the goat herd has made more pasture resources available to the other enterprise.
When production feeding is occurring (i.e. over and above maintenance) then the cost is allocated directly to the goat herd.
Supplementary feed costs should reflect market values of the supplement at the time it was fed out, whether it is purchased off farm or grown on farm. Supplementary feed purchase receipts should be used to help complete this section.
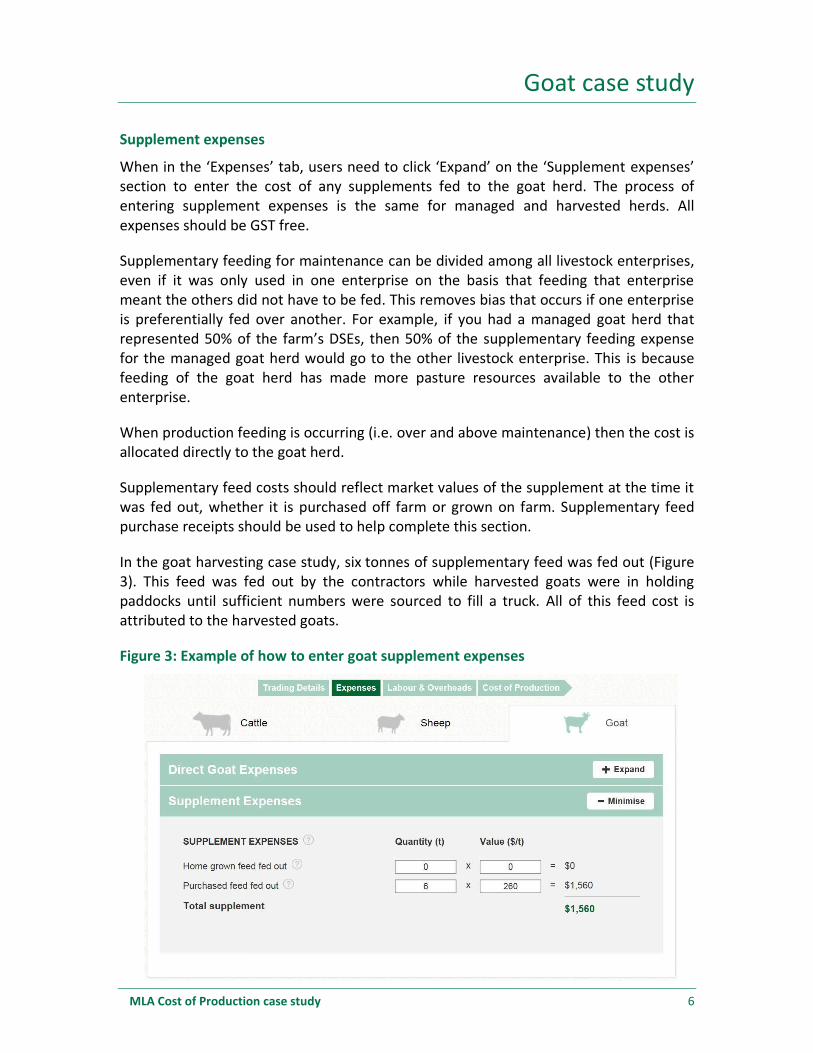
In the goat harvesting case study, six tonnes of supplementary feed was fed out (Figure 3). This feed was fed out by the contractors while harvested goats were in holding paddocks until sufficient numbers were sourced to fill a truck. All of this feed cost is attributed to the harvested goats.
Figure 3: Example of how to enter goat supplement expenses

Goat case study
MLA Cost of Production case study 7
Labour and overheads
Labour
In the ‘Labour’ section of the ‘Labour and overheads’ tab, users can allocate labour expenses to the various livestock enterprises. The process of entering labour expenses is the same for managed and harvested herds. All expenses should be GST free.
Capital labour should not be included in the cost of production calculation. Significant capital labour is usually associated with infrastructure improvements.
Of the non-capital labour, some will be attributable directly to enterprise-related activities, such as mustering goats or weaning kids. The amount used is easy to establish by estimating the number of labour days associated with each of these activities and adding them together.
The remaining labour will be spent in general adminstration, pasture maintenance, general monitoring, and repairs and maintenance. As it is harder to clearly distinguish what enterprise this labour is servicing, it is sufficient to simply pro-rate this remaining labour across the enterprises, based on their relative DSE contribution.
The labour of owner/operators and additional family members needs to be assigned a value in the Cost of Production tool, net of non-cash benefits. Although there is a range of suitable salaries for both roles, values of $70,000 and $50,000 are recommended for owner/operators and family members, respectively.
A full labour unit constitutes five labour days per week for 48 weeks, totalling 240 labour days per year. Any less than this is considered part-time labour, and would be expressed as a proportion of a full-time unit. For example, if the owner/operator works for three days per week, this constitutes 0.6 labour units.
To calculate the cost of this labour unit to the enterprise, the value of the labour unit is multiplied by the number of labour units it represents. For example, if labour of the owner/operator in this scenario is valued at $70,000, the cost to the enterprise would be $70,000 multiplied by 0.6 labour units, which equals $42,000.
The Cost of Production tool allows users to add permanent and casual labour units by clicking the ‘+’. It also allows users to alter the distribution of each labour unit among the enterprises.
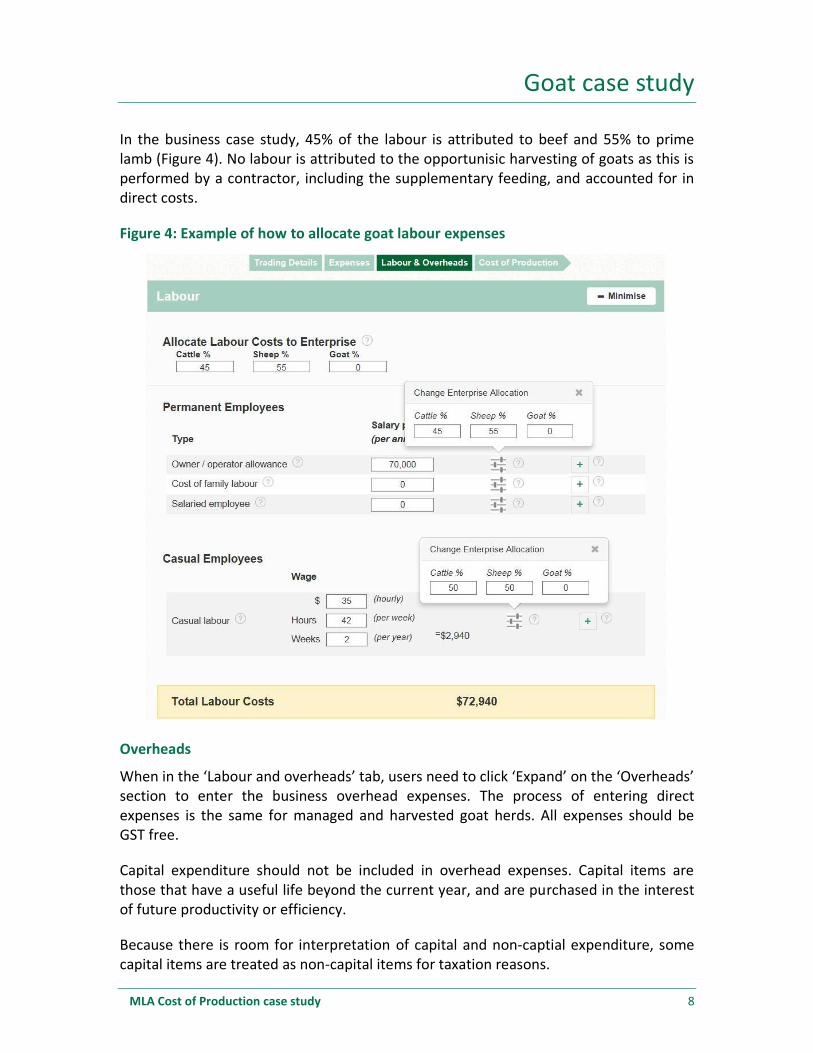
There is only one full-time owner/operator in this case study, whose labour is valued at $70,000. There are no family members or permanent employees working in the business.
There is a casual employee who assists with calf marking (one week) and lamb marking (one week), costing $2,940. This brings total labour costs to $72,940.
Goat case study
MLA Cost of Production case study 8
In the business case study, 45% of the labour is attributed to beef and 55% to prime lamb (Figure 4). No labour is attributed to the opportunisic harvesting of goats as this is performed by a contractor, including the supplementary feeding, and accounted for in direct costs.
Figure 4: Example of how to allocate goat labour expenses
Overheads
When in the ‘Labour and overheads’ tab, users need to click ‘Expand’ on the ‘Overheads’ section to enter the business overhead expenses. The process of entering direct expenses is the same for managed and harvested goat herds. All expenses should be GST free.
Capital expenditure should not be included in overhead expenses. Capital items are those that have a useful life beyond the current year, and are purchased in the interest of future productivity or efficiency.
Because there is room for interpretation of capital and non-captial expenditure, some capital items are treated as non-capital items for taxation reasons.

Goat case study
MLA Cost of Production case study 9
It is recommended that true capital expenditure is extracted from financial records to provide a better indication of the cost of production. Capital expenditure may include that used for new fencing, road building, installing new water systems or raising soil fertility levels.
Overhead expenses are those that are difficult to attribute to any one enterprise, and generally don’t correspond as closely with the number of livestock run as direct expenses. The overhead expense categories provide an indication of what these expenses will be, and users can add their own overhead expense categories by clicking on the ‘Add overhead’ box.
Users can allocate overhead expenses to the enterprises either as a whole, or individually by ticking the ‘Edit individual overhead allocations’ tick box.
To allocate overhead expenses as a whole, they may be pro-rated to enterprises based on their contribution to annual average DSEs. For a managed goat herd, you may wish to allocate overheads differently between all enterprises.
To allocate overhead expenses individually, other measures such as the enterprise’s contribution to total income or relative use of labour resources will also work.
Table 3 shows a suggestion of how best to allocate overheads individually.
Table 3: Overhead cost categories and suggested allocations
Overhead cost categories Allocation basis Repairs and maintenance (sheds, yards, fences, land) Dry sheep equivalents Repairs and maintenance (plant and equipment) Labour Depreciation Labour Admin expenses Income Electricity and gas Labour Insurance Income Pasture costs Dry sheep equivalents Rates and rents Dry sheep equivalents Fuel and oil Labour
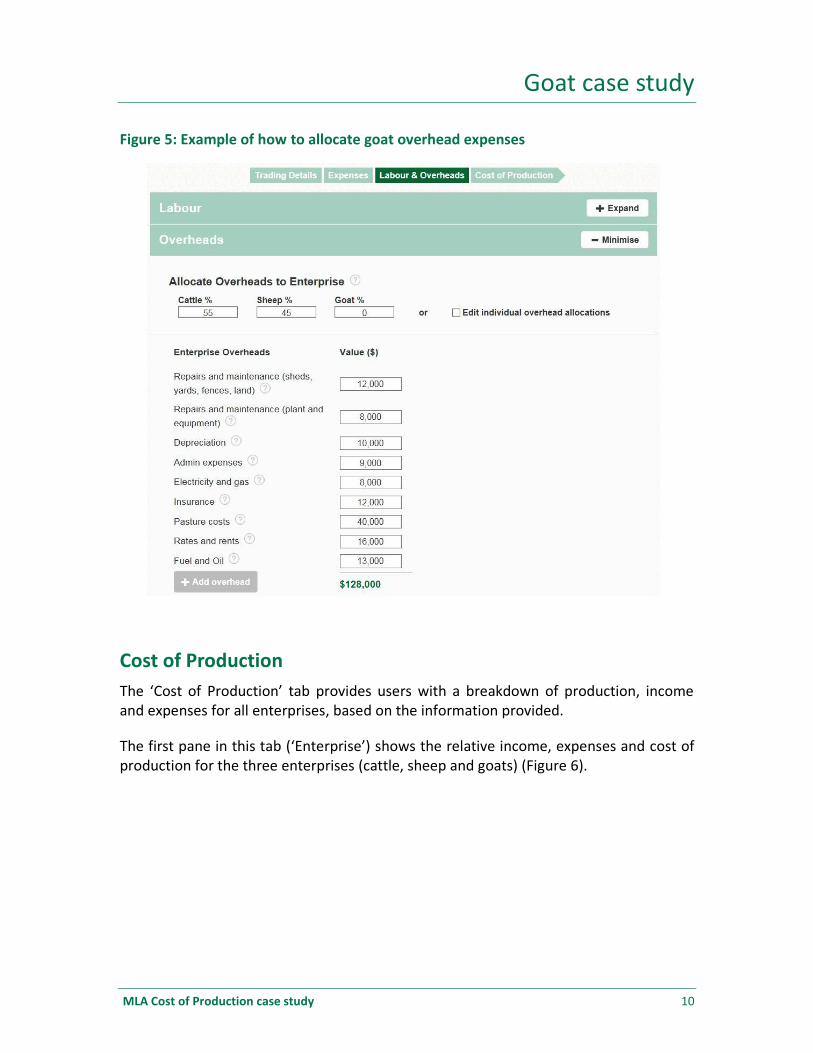
In the case study, no overheads have been allocated to the goat enterprise, because the only cost associate with it is the cost of collection and transport to sale, which is accounted for in direct costs, and supplementary feeding.
Total overhead expenses for the business are $128,000 (Figure 5).
Goat case study
MLA Cost of Production case study 10
Figure 5: Example of how to allocate goat overhead expenses
Cost of Production
The ‘Cost of Production’ tab provides users with a breakdown of production, income and expenses for all enterprises, based on the information provided.
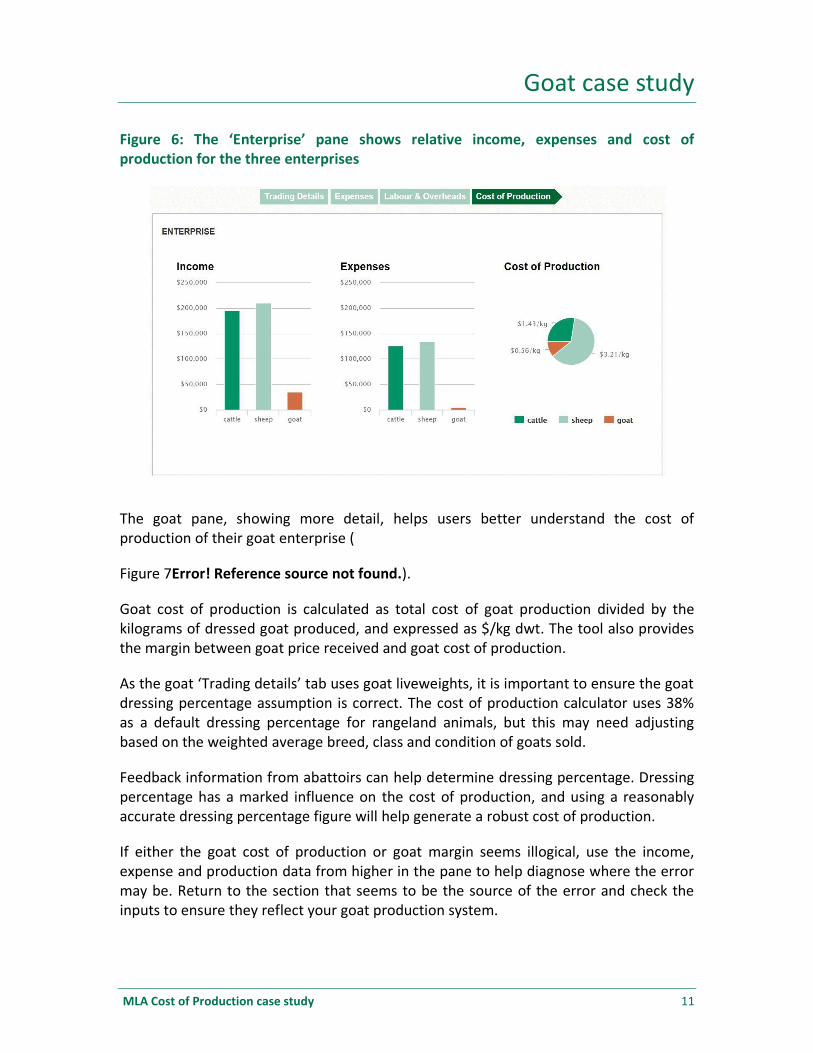
The first pane in this tab (‘Enterprise’) shows the relative income, expenses and cost of production for the three enterprises (cattle, sheep and goats) (Figure 6).
Goat case study
MLA Cost of Production case study 11
Figure 6: The ‘Enterprise’ pane shows relative income, expenses and cost of production for the three enterprises
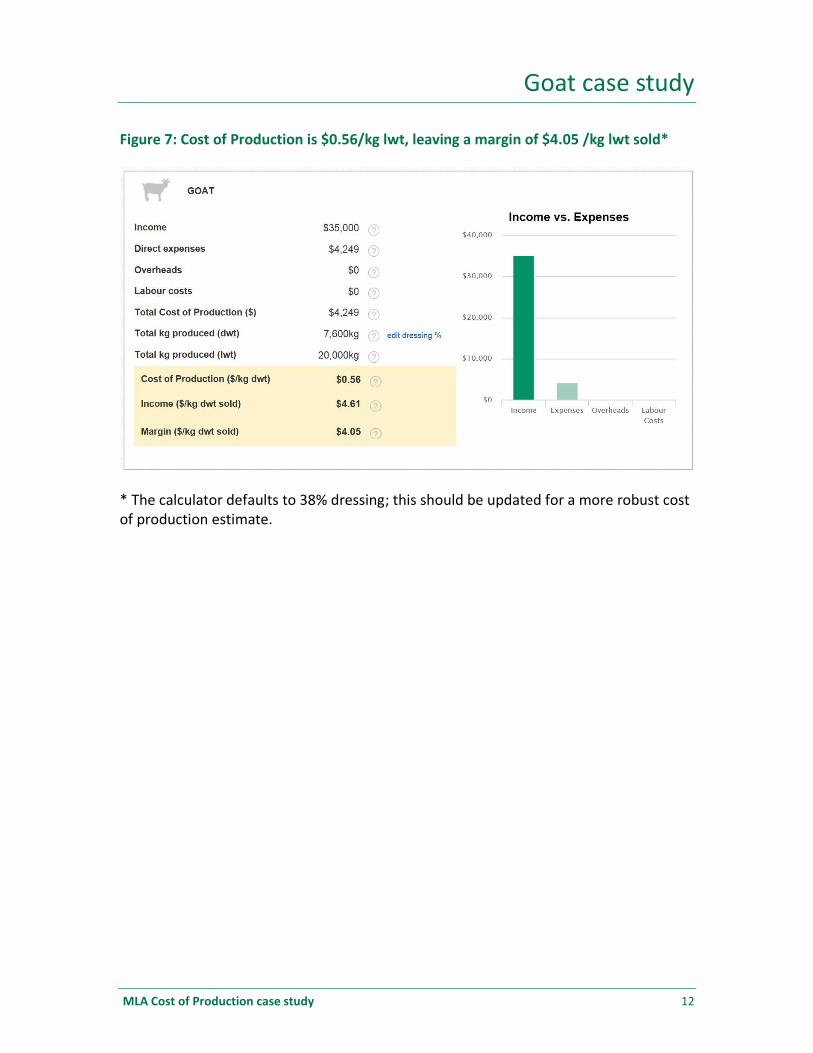
The goat pane, showing more detail, helps users better understand the cost of production of their goat enterprise (
Figure 7Error! Reference source not found.).
Goat cost of production is calculated as total cost of goat production divided by the kilograms of dressed goat produced, and expressed as $/kg dwt. The tool also provides the margin between goat price received and goat cost of production.
As the goat ‘Trading details’ tab uses goat liveweights, it is important to ensure the goat dressing percentage assumption is correct. The cost of production calculator uses 38% as a default dressing percentage for rangeland animals, but this may need adjusting based on the weighted average breed, class and condition of goats sold.
Feedback information from abattoirs can help determine dressing percentage. Dressing percentage has a marked influence on the cost of production, and using a reasonably accurate dressing percentage figure will help generate a robust cost of production.
If either the goat cost of production or goat margin seems illogical, use the income, expense and production data from higher in the pane to help diagnose where the error may be. Return to the section that seems to be the source of the error and check the inputs to ensure they reflect your goat production system.
Goat case study
MLA Cost of Production case study 12
Figure 7: Cost of Production is $0.56/kg lwt, leaving a margin of $4.05 /kg lwt sold*
* The calculator defaults to 38% dressing; this should be updated for a more robust cost of production estimate.