goat-rearing practices and the limited effects of the shg
TRANSCRIPT
Southeast Asian Studies, Vol. 49, No. 1, June 2011
52
Goat-Rearing Practices and the Limited Effectsof the SHG Program in India:
Evidence from a Tamil Nadu Village
SATO Keiko*
Abstract
Livestock rearing has been promoted in India by government-sponsored micro-finance schemes such as
the IRDP and the “SHG-Bank Linkage Program,” providing rural poor with small loans to augment their
non-land assets and thereby alleviate poverty. However, even in the case of small livestock such as sheep
and goats, although at a glance it seems easy for poor people to rear them by using their only asset, unskilled
labor, the reality is contrary and thereby the effect of the micro-finance programs is questionable. Based
on intensive field surveys in a village in Tamil Nadu, India, the author sheds light on goat rearing practices
among different economic classes and finds that the poor face difficulties in rearing goats. The article tries
to analyze why the rural poor cannot rear goats in the way that policy-makers expected and thereby ques-
tions the effectiveness of government-sponsored micro-finance schemes in India.
Keywords: goat rearing, economic class, SHG-Bank Linkage Program, India
I Introduction
Goat rearing has been promoted by various governmental and non-governmental organizations all over
the world to mitigate rural poverty, especially in unfavorable arid/semi-arid tropical environments [Vries
2008]. Goats are a drought-tolerant animal, eating mainly wild grasses, tree buds and leaves. They
require less care, and reproduce quickly as they start to bear kids from the age of one year old. They
also provide small farmers and landless laborers with precious employment opportunities in agricul-
tural lean seasons and play an important role as “livestock” since they can be sold when most needed,
for instance, during a severe drought [Shankarnarayan et al. 1985].
According to recent data, there are more than 190 million sheep and goats being reared all over
India [FAO 2009]. With India achieving rapid economic growth after economic liberalization since the
* 佐藤慶子,Ph.D. candidate, Graduate School of Asian and African Area Studies, Kyoto University, 46 Shimoadachi-cho, Yoshida, Sakyo-ku,Kyoto 606-8501, Japane-mail: [email protected]

53
Sato K. : Goat-Rearing Practices and the Limited Effects of the SHG Program in India
early 1990s, demand for protein-rich food such as goat meat is rapidly increasing in the country, espe-
cially in urban areas. Therefore, goat rearing is a growing sector in India, including in Tamil Nadu.1)
Also, the Indian government has been promoting livestock rearing among the rural poor through
micro-finance programs. Since 1978, the Integrated Rural Development Program (IRDP), a micro -credit
program of the central government providing rural poor with small loans (with a subsidy), was pro-
moted throughout India until the end of the 1990s.2) Through the IRDP the rural poor were provided
with livestock such as cows and goats. But, mainly because of the low repayment rate, the scheme was
replaced by the Swarnjayanti Gram Swarozgar Yojana (SGSY) in the late 1990s and since then has lost
importance. On the other hand, the Self-Help Group (SHG), which started in the early 1990s, has been
successful and is still being promoted today. An SHG consists of 10–20 women3) who gather once a
month and save small amounts of money, which is lent back to some members. The activity of the SHG
is supported and monitored by NGOs, indicating that an SHG is an informal organization. However, if
the performance of the SHG concerned is favorable (usually during a monitoring period of the first 6
months), the responsible NGO recommends that local national commercial banks (including cooperative
banks) provide them with bank loans without collateral. In this way, rural poor women can obtain access
to bank loans. Such a system is called the “SHG-Bank Linkage Program.”4)
The SHG-Bank Linkage Program is also used by the government to provide rural poor women
with livestock. For example, in Madurai District, Tamil Nadu, where the present study was conducted,
first-time loans from banks must be used to purchase livestock, such as goats. Veterinarians visit a
beneficiary’s house to check the health conditions of the purchased goats and tag the ear of each goat.
It is obvious from such a practice that the Indian government intends to alleviate poverty by encourag-
ing the rural poor to possess livestock, an important non-land asset. The basic idea of the government-
sponsored micro-finance schemes for rural poverty reduction seems to have remained unchanged since
the IRDP was started in the late 1970s.
However, according to the author’s survey at a selected study village in Madurai District, Tamil
Nadu, the percentage of households that reared goats was less than 50% among the poor, compared to
more than 80% among the “middle” class (categorized by using the wealth-ranking method to be
described later). Although it seems that the rural poor can easily rear goats, especially compared to
large livestock, such as cows, the reality shows otherwise. Why is this so? If the major reason were to
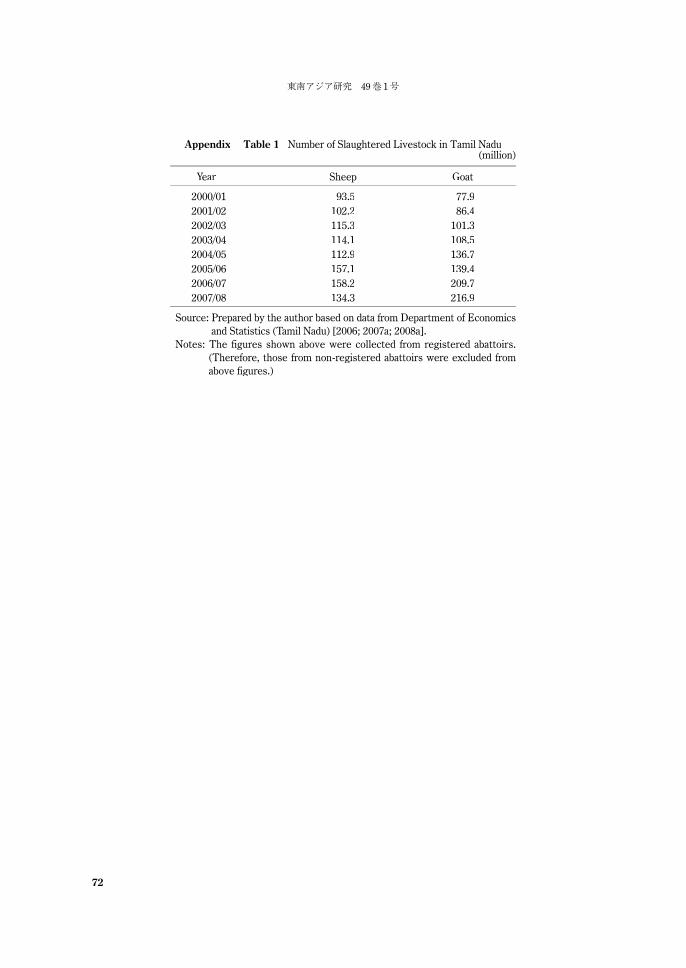
1) Goat meat is exported from Tamil Nadu to Kerala and the Gulf countries, besides being consumed locally. SeeAppendix Table 1, which shows the number of sheep and goats slaughtered in Tamil Nadu after 2000.
2) See Dreze [1990], Kondo [1998a; 1998b] and Tsujita [2006], for instance, on the IRDP.3) Eighty five percent of the participants in SHGs were women [NABARD 2000].4) See Suda [2006] on SHGs in India and their functioning.

東南アジア研究 49巻 1号
54
be found, this might have implications for government policies attempting to alleviate rural poverty.
Based on recent fieldwork in a village in Tamil Nadu, India, this paper, through close examination
of actual goat-rearing practices and conditions in the study village, sheds light on this important issue,
and tries to answer the question of why goat rearing is difficult for the rural poor.
The paper is organized as follows. Chapter II provides basic information on the natural environment
and socio-economic conditions of the study area and the village. The basic characteristics of the eco-
nomic structure in the village (in particular, differences in land holdings, occupations and incomes in
five economic classes) are shown, based on data collected by the author in 2008. Then, in Chapter III,
information on goat-rearing practices in the village is provided. The important finding is that goat rearing
is not so popular among the poor. Chapter IV discusses the introduction and progress of the micro-
finance program, especially the SHG program, in the village. Particular focus is placed on the different
participation rate among the economic classes. Chapter V explores why the rural poor are reluctant to
rear goats, especially compared to the “middle” class households, by examining the availability of
workers and their labor utilization. Cases of some poor households who engaged in goat rearing but
had difficulties are also examined. Finally, a conclusion and some suggestions will be provided for
government schemes for alleviating rural poverty.
II The Study Area and the Village
A series of intensive field surveys was conducted by the author during 2007–10 at a selected village in
Sowdarpatti Gram Panchayat (S GP), which is named after Sowdarpatti tank, Thirumangalam t Taluk,
Madurai District, Tamil Nadu (the same village as analyzed in the preceded paper, Sato [2011] in this
special issue). The topography of the area is basically flat with a slight slope from the northwest to the
southeast, but we can also observe some granite hills that have almost no trees.5) About 83% of the
area is covered by red soil [GOI 2001]. The climate is semi-arid, receiving only 900 mm of rainfall on
average and this fluctuates greatly year by year.6) The area mainly benefits from the northeast monsoon
rainfall from October to December, since the southwest monsoon (June–September) is largely inter-
rupted by the Western Ghats Mountains between the states of Kerala and Tamil Nadu. Many water
reservoirs (tanks) were constructed centuries ago and by using them paddy cultivation has been carried
5) See also Fig. 1 in Sato [2011] in this special issue.6) According to the rainfall data in Thirumangalam Town, the average rainfall over 27 years from 1980 to 2006 was
906 mm. For reference, the rainfall (normal year) in Madurai District, which is a mixture of the rainfall data invarious meteorological stations in the district, is 840 mm [Department of Economics and Statistics (Tamil Nadu)2007b].
55
Sato K. : Goat-Rearing Practices and the Limited Effects of the SHG Program in India
out in the tank command area (nañcai), followed by millets, pulses and cotton. In addition, there are
extensive areas of dry land (puñcai(( ) where millets, pulses and cotton have also been grown. After the
harvest of non-rice crops between February and March, there is basically no agricultural work in the
area until August.7)
The major industry of the study area has been agriculture (including livestock), but with rapidly
growing non-agricultural industries and service sectors in the urban centers as well as in some parts of
sub-urban rural areas, more and more villagers depend on non-agricultural jobs, especially the younger
generation [Sato 2011]. Because of accelerating migration from rural to urban areas, the population of
S GP has decreased by 10% during 1981–2001 [GOI 1981; 1991; 2001]. Such an outflow of workforces
has caused an increase in the amount of fallow land,8) which occupied nearly 30% of the total farmland
in S GP in recent years [GOI 2001].
The study village (hereinafter, Si Village) had a total of 134 households when the author conducted
a household census in 2008. The residents of the village were mostly Telgu-speaking Reddiyar caste
people, whose ancestors had migrated from Andra Pradesh.9) At the time of the survey they occupied
87% of total households and 92% of farmland,10) while small numbers of people from other castes such
as Chettiyar (1 household),r Asari (8 households), Wannar (5 households) andr Ampattar (1 household)r 11)
owned very small amounts of land.12) Si Village has been characterized as a Reddiyar-dominant single
caste village. The total population of the village was 421, with an average of 3.14 persons per household.
The number of people in the labor force was 290 (the labor force participation rate was 66.7% on aver-
age), out of which 230 were living in the village. The other 60 usually stayed and worked in urban areas.
The percentage of the workforce whose major occupation was in agriculture (both farmers and
7) March–July is basically an agricultural lean season, except for small areas of land with wells, an assured sourcefor irrigation, where cotton, sugarcane, vegetables, etc. are grown.
8) The official definition in land statistics is: land left fallow for more than one year.9) According to Mosse [2003], “The successes of the invading Muslim troops after 1565 resulted in mass migration
into the southern Tamil country including Ramnad, bringing low caste (Pallar(( ) agricultural laborers and peasantcultivators, Utaiyar farmers from the northern Tamil regions, pastoralists, shepherds, accountants, tank diggers,rweavers, and other artisans, as well as non-Tamil speakers from Andra” [ibid.: 61]. He also mentioned that theymigrated mostly in the 17th and 18th century, which brought new pressure on the land and finally caused theconstruction of many tanks in the area [loc. cit.].
10) Note, however, that after Reddiyar people flowed into the area they worked for a long time as attached laborersrand tenants for Brahmins, who at that time occupied most of the land. From the 1920s or 1930s, however, theBrahmins gradually sold their land to Reddiyar and other castes and migrated to urban areas [Sato 2011].r
11) Reddiyar: one of the dominant agricultural castes in South India, characterized by their active acquisition of farmland [Srinivas 1989]. Chettiyar: a merchant caste. Asari: there were two types found in Si Village, black-smiths (also money lenders) and carpenters. Wannar and Ampattar: untouchable castes, but now classified asMost Backward Castes (MBC) in Tamil Nadu. Traditionally, they were engaged as washermen and barbers, respec-tively. See Sato [2011] for details.
12) Also, there was a Naidu caste household which had a large area of farmland. They were also Telgu-speakingpeople from Andra Pradesh with a custom of mixed marriage with Reddiyar caste people.r
東南アジア研究 49巻 1号
56
agricultural laborers) was 78% among the residents, whereas most of the “temporary migrant workers”
(as defined in Sato [2010]) were engaged in non-agricultural jobs, except one person who worked as an
agricultural laborer.
The total farmland owned by the villagers was 421 acres, of which tank-irrigated field (nañcai)
amounted to 32 acres and dry land (puñcai(( ) 389 acres. Of a total of 134 households, 29 (22%) were
totally landless and the average landholding size of the remaining 105 households was 4 acres,13) but the
distribution of farmland was skewed. Although the study village was a Reddiyar-dominant single caste
village, land distribution among the Reddiyar was also quite unequal.r
In order to grasp the class structure of Si Village all the households were classified, by using the
wealth ranking method, into five classes; “upper” (15 households), “upper middle” (17), “middle” (37),
“lower middle” (39) and “lower” (26).14) Table 1 summarizes the major characteristics of each class in
terms of landholdings, livelihoods and educational background.
Many “upper” class people, after getting a higher education, stayed in urban areas to work as
white-collar workers, but they came back to the village after retirement and engaged in agriculture
(using laborers or tenants), because they had a large farmland. They also played a role as informal village
leaders. The “upper-middle” and the “middle” class people were the most active farmers, often with
rented-in/mortgaged-in land in addition to their own land. The younger generation people, however,
tended to work outside the village as white-collar or blue-collar workers. The “lower middle” and
13) Only 58 households had nañcai while most of the land-owning households (103 households) had puñcai.14) The classification was reasonable in view of both asset holdings (land and durable goods) and income level. See
Sato [2011] for details.
Table 1 General Characteristics of Households Divided by Economic Class in Si Village
Class Landholding Livelihoods Education
Upper Large Stay outside the village and workas white-collar workers, but after retirement come back to the village and get pension and engage in farming by using agricultural laborers/tenants. Informal village leaders.
More than 10 years forboth parents and children.
Upper middle and Middle
Small to medium Most active farmers among all,with owned and rented land. Also work as white-collarworkers and blue-collar workers.
Less than 10 years forparents, but more than 10years for children.
Lower middleand Lower
Zero or marginal Work as unskilled laborers orservice workers. Work atfactories or restaurants in townin the lean season.
About 6 years for parentsand less than 10 years forchildren.
Source: Fieldwork by the author in 2007–09.
57
Sato K. : Goat-Rearing Practices and the Limited Effects of the SHG Program in India
“lower” class people owned no or only marginal amounts of land. They worked as either service caste
workers or unskilled laborers in agriculture, construction and factories. However, some of them have
recently started to obtain relatively stable blue-collar jobs. It is also important to note that more than
half of the “lower” class households were female-headed households (FHH). During March to July (the
major agricultural lean season) many people, especially the poor, sought temporary jobs as unskilled
laborers at some textile factories and construction sites near the village or at some restaurants and
other shops in urban areas such as Thirumangalam Town. Also, goat rearing provided another valuable
source of income for some villagers.
Table 2 shows the number of livestock reared in several major villages in S GP. The table reveals
that in Si Village more goats are reared relative to the number of households. Many people in Si Village
did not own nañcai land, and, even if they did, many of them leased it out to farmers from other villages,
because their nañcai land was located in marginal areas with respect to the tank so that not enough
water was available to them. This explains at least partly why relatively more people were engaged in
goat rearing in the study village.
III Goat Rearing Practices in the Study Village
According to my survey in 2008, there were a total of 722 goats reared by 84 households (63%) in the
study village, with an average of 8.6 heads per household.15) Both the local breed (either kanni adu or
Table 2 Livestock Holding at the Major Villages in S Gram Panchayat
Name ofVillage
No. ofHH
Types of Livestock
HybridCow
LocalCow Sheep Goat Poultry
M 148 190 4 113 355 198S 140 51 2 50 103 282V 427 34 34 1,500 727 200Si 229 74 12 0 622 216P 199 22 22 0 253 90
Total 1,143 371 74 1,663 2,060 986
Source: Fieldwork by the author in 2007–10.Notes: The number of households is obtained from the gram panchayat office in 2007.t
But the number of households in Si Village above (229) was totally different from the number (134) that the author got from the census survey conducted in 2008. Data on livestock holding were obtained from the most recent “livestock census” data (obtained from a veterinary doctor in charge of S Gram Panchayat).
15) Compared to goats, the ratio of households keeping cows (16%) and bullocks (7%) was small. Most of the farmhouseholds in the study village hired a power tiller to plow farmland. Only land-leveling after plowing wasconducted by bullocks.
東南アジア研究 49巻 1号
58
tellicherry adu) and their cross-breeds were reared in the village.16) Note that kanni adu were dominant
and reared only for their meat, whereas there were fewer tellicherry adu, but these were reared for both
their meat and their milk.
The major concern with rearing goats is what and how to feed them. In the study village, goat feed
can be broadly classified into three types; green feed (leaves, grasses and fodder crops), concentrates
(oil cakes and coarse grains17)), and crop residues. Details are shown in Appendix Table 2. Crop residues
include the straws and husks of various kinds of harvested crops.
Green leaves and grasses, the major feed, are primarily found by taking goats to the nearby fields
for grazing, but (stems and leaves of) fodder crops, mainly maize, sorghum (cholam) and pearl millet
(cumbu), can sometimes substitute for green leaves and grasses.
Grazing is undertaken either on village common land along public roads or on private harvested/
fallow land. The care takers,18) mainly self-employed young women19) or elderly women, or sometimes
hired elderly men/women or school children, take a herd of goats grazing twice a day, from 9:00 to 12:00
and 15:00 to 18:00.20)
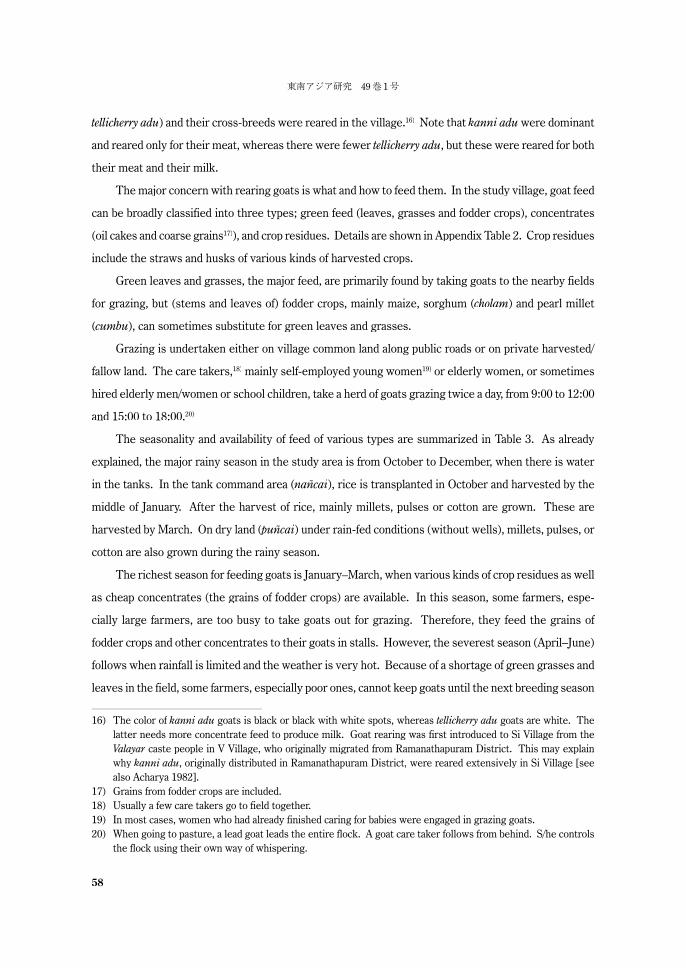
The seasonality and availability of feed of various types are summarized in Table 3. As already
explained, the major rainy season in the study area is from October to December, when there is water
in the tanks. In the tank command area (nañcai), rice is transplanted in October and harvested by the
middle of January. After the harvest of rice, mainly millets, pulses or cotton are grown. These are
harvested by March. On dry land (puñcai(( ) under rain-fed conditions (without wells), millets, pulses, or
cotton are also grown during the rainy season.
The richest season for feeding goats is January–March, when various kinds of crop residues as well
as cheap concentrates (the grains of fodder crops) are available. In this season, some farmers, espe-
cially large farmers, are too busy to take goats out for grazing. Therefore, they feed the grains of
fodder crops and other concentrates to their goats in stalls. However, the severest season (April–June)
follows when rainfall is limited and the weather is very hot. Because of a shortage of green grasses and
leaves in the field, some farmers, especially poor ones, cannot keep goats until the next breeding season
16) The color of kanni adu goats is black or black with white spots, whereas tellicherry adu goats are white. Thelatter needs more concentrate feed to produce milk. Goat rearing was first introduced to Si Village from theValayar caste people in V Village, who originally migrated from Ramanathapuram District. This may explainrwhy kanni adu, originally distributed in Ramanathapuram District, were reared extensively in Si Village [seealso Acharya 1982].
17) Grains from fodder crops are included.18) Usually a few care takers go to field together.19) In most cases, women who had already finished caring for babies were engaged in grazing goats.20) When going to pasture, a lead goat leads the entire flock. A goat care taker follows from behind. S/he controls
the flock using their own way of whispering.
59
Sato K. : Goat-Rearing Practices and the Limited Effects of the SHG Program in India
(August), so they are obliged to sell them in the market. On the other hand, from July to August when
the southwest monsoon brings a limited but some amount of rainfall, the green grasses and leaves in
the fields revive to some extent.
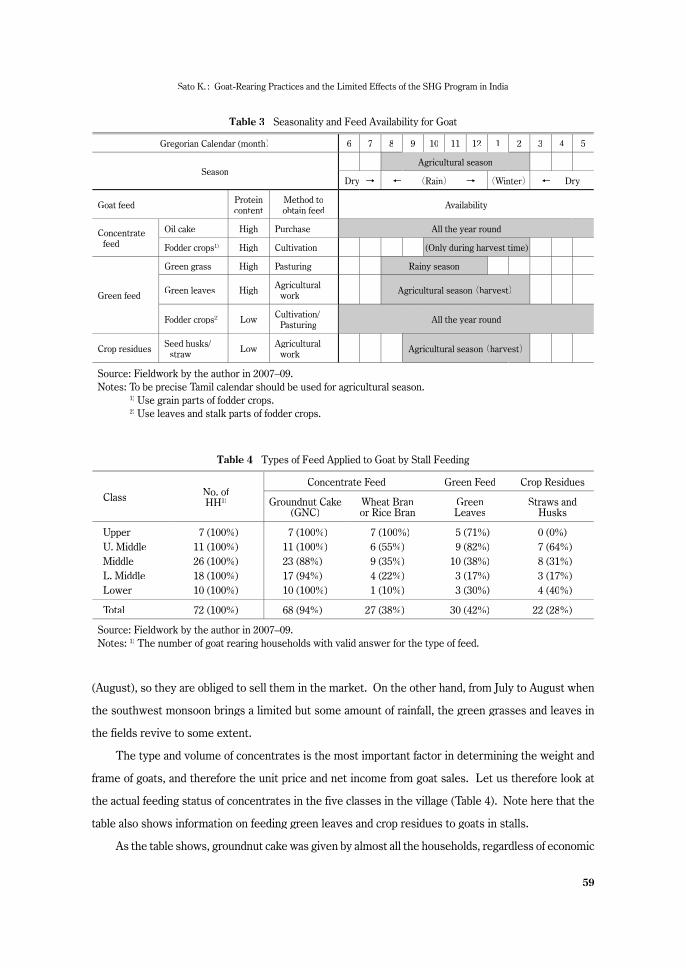
The type and volume of concentrates is the most important factor in determining the weight and
frame of goats, and therefore the unit price and net income from goat sales. Let us therefore look at
the actual feeding status of concentrates in the five classes in the village (Table 4). Note here that the
table also shows information on feeding green leaves and crop residues to goats in stalls.
As the table shows, groundnut cake was given by almost all the households, regardless of economic
Table 3 Seasonality and Feed Availability for Goat
Gregorian Calendar (month) 6 7 8 9 10 11 12 1 2 3 4 5
SeasonAgricultural season
Dry → ← (Rain) → (Winter) ← Dry
Goat feed Proteincontent
Method toobtain feed Availability
Concentratefeed
Oil cake High Purchase All the year round
Fodder crops1) High Cultivation (Only during harvest time)
Green feed
Green grass High Pasturing Rainy season
Green leaves High Agriculturalwork Agricultural season (harvest)
Fodder crops2) Low Cultivation/Pasturing All the year round
Crop residues Seed husks/straw Low Agricultural
work Agricultural season (harvest)
Source: Fieldwork by the author in 2007–09.Notes: To be precise Tamil calendar should be used for agricultural season.
1) Use grain parts of fodder crops.2) Use leaves and stalk parts of fodder crops.
Table 4 Types of Feed Applied to Goat by Stall Feeding
Class No. ofHH1)
Concentrate Feed Green Feed Crop Residues
Groundnut Cake (GNC)
Wheat Branor Rice Bran
GreenLeaves
Straws andHusks
Upper 7 (100%) 7 (100%) 7 (100%) 5 (71%) 0 (0%)U. Middle 11 (100%) 11 (100%) 6 (55%) 9 (82%) 7 (64%)Middle 26 (100%) 23 (88%) 9 (35%) 10 (38%) 8 (31%)L. Middle 18 (100%) 17 (94%) 4 (22%) 3 (17%) 3 (17%)Lower 10 (100%) 10 (100%) 1 (10%) 3 (30%) 4 (40%)
Total 72 (100%) 68 (94%) 27 (38%) 30 (42%) 22 (28%)
Source: Fieldwork by the author in 2007–09.Notes: 1) The number of goat rearing households with valid answer for the type of feed.

東南アジア研究 49巻 1号
60
class, but wheat/rice bran were given mainly by “wealthy” households. As already explained, concen-
trates are more important for goats during the dry season when green feed becomes scarce. However,
poor households cannot afford them and instead rely on pasturing in barren fields or are obliged to reduce
their number of goats by selling them in the market. Increasing their goats is therefore difficult for
poor villagers.
Concentrates are especially important for mother goats in the latter stages of pregnancy and for
several weeks after delivery. They are separated from the flock (for grazing) and are given protein-rich
concentrates21) in stalls, especially by “wealthy” farm households. This feeding practice is also extended
to selected superior male goats which are reared for breeding [ICAR 2008; Uttarakrishiprabha 2010].
In practice, some wealthy farmers even buy ration rice22) in order to give rice bran water as a concentrate
to goats (as well as to cows and bullocks), instead of consuming the rice themselves.
In India, the average life expectancy for goats is reported to be 12 years [Shankarnarayan et al.
1985]. One-year-old female goats can start bearing 2–3 kids at a time after about a 150-day gestation
period. They are very prolific and can deliver kids three times in two years. In the study village, since
goats reproduce very quickly, farmers often have to sell their goats because they do not have enough
space to keep them all.23) Villagers usually sell young goats when they are 1 to 2 years old, mostly to
goat merchants who regularly visit the village. Goat merchants24) are registered at either of the two
public goat markets in a small town nearby. They visit the surrounding villages every morning to buy
goats. In the study village, direct sale of goats at the public goat markets by the villagers themselves
was rare.25)
Depending upon the weight, a mature goat is sold at a price of Rs.3,500–4,000 per head. As the
bearing cost is Rs.30–60 per month per head (according to my interview with farmers), this cost reaches
Rs.800–1,600 in two years. Therefore, if villagers sell a goat at two years old, it can provide them with
a net income of Rs.2,000–3,000. If a female goat bears 4–6 kids a year, the annual income is Rs.10,000–
21) According to an agribusiness company, Uttrakrishiprabha, the most highly recommended concentrate is a com-bination of ground maize, groundnut cake, bran water (rice bran or wheat bran), pellets (fish meal), salt, and amineral mixture [Uttrakrishiprabha 2010]. Also see ICAR [2008]. The ingredients of this concentrate are mixedin starch water and prepared in a plastic bucket.
22) Ration rice at fair price shops under the Public Distribution System (PDS) is also available for wealthy house-holds in Tamil Nadu. They can purchase a maximum of 12–20 kg of rice per month at a rate of Rs.1 per kilogram.See Fujita [2011].
23) In India, approximately 36% of the total goat population is slaughtered every year [Acharya 1982].24) According to the villagers, there used to be about 10 merchants who regularly came to the village to purchase
goats, but by the time of my survey, this number had fallen to 3–5 persons.25) By contrast, in V Village in the same S GP there is a commuting truck joinly operated by the farmers to trans-
port goats to a goat market on a regular basis.
61
Sato K. : Goat-Rearing Practices and the Limited Effects of the SHG Program in India
20,000, which is equivalent to 70–140 days’ wages for a male unskilled laborer.
Although the price of goat meat has soared in recent years, the number of goat rearing households
in the study village was on the decrease, mainly because of: 1) the decrease in green grasses due to less
rainfall in recent years, and 2) the lower profitability of goat rearing compared to wage labors due to the
recent rise in the wages of unskilled laborers. Given a wage rate of Rs.150 (men for wood chopping)
and Rs.60 (women for cotton picking), if we assume 25 days’ work per month for 8 months a year, the
annual income for an unskilled laborer reaches Rs.30,000 (men) or Rs.12,000 (women) at maximum.
In addition, there is a risk in rearing goats. Goats are easily infected by some bacterial and viral
diseases such as Peste des Petits Ruminants (PPR),26) which causes pneumonia and clostridia, especially
if goats are kept under non-roof conditions during the rainy season (September–December). At night
and during the rainy season goats are usually kept either in an animal shed with a tin roof (up to 10
heads) or at the owner’s house if the number is small (up to 4–5 heads), but many poor villagers are
obliged to keep their goats under non-roof conditions due to shortage of space.
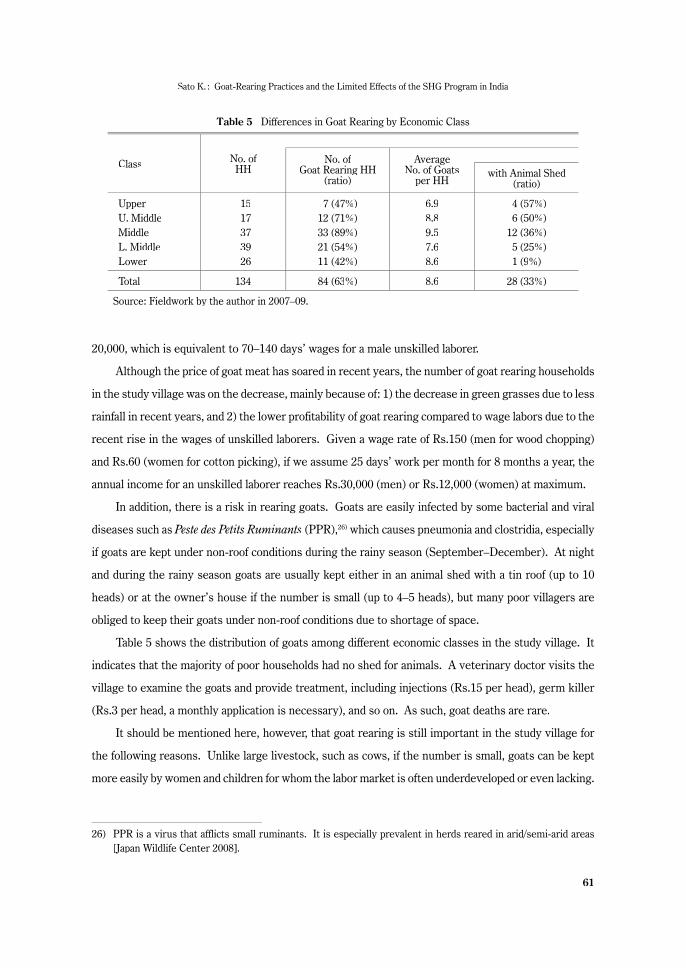
Table 5 shows the distribution of goats among different economic classes in the study village. It
indicates that the majority of poor households had no shed for animals. A veterinary doctor visits the
village to examine the goats and provide treatment, including injections (Rs.15 per head), germ killer
(Rs.3 per head, a monthly application is necessary), and so on. As such, goat deaths are rare.
It should be mentioned here, however, that goat rearing is still important in the study village for
the following reasons. Unlike large livestock, such as cows, if the number is small, goats can be kept
more easily by women and children for whom the labor market is often underdeveloped or even lacking.
26) PPR is a virus that afflicts small ruminants. It is especially prevalent in herds reared in arid/semi-arid areas[Japan Wildlife Center 2008].
Table 5 Differences in Goat Rearing by Economic Class
Class No. ofHH
No. ofGoat Rearing HH
(ratio)
AverageNo. of Goats
per HHwith Animal Shed
(ratio)
Upper 15 7 (47%) 6.9 4 (57%)U. Middle 17 12 (71%) 8.8 6 (50%)Middle 37 33 (89%) 9.5 12 (36%)L. Middle 39 21 (54%) 7.6 5 (25%)Lower 26 11 (42%) 8.6 1 (9%)
Total 134 84 (63%) 8.6 28 (33%)
Source: Fieldwork by the author in 2007–09.
東南アジア研究 49巻 1号
62
This is especially so when the main male workforce is absent due to their work in non-agricultural jobs
as migrant workers. Goat rearing is also important since goats can be sold at times of financial need,
such as drought or family crisis (such as the death of husband) or special events (such as a
marriage).27)
However, as Table 5 clearly indicates, goat rearing is actually not so popular among the poor in the
study village. A rather sharp difference among the five economic classes is observed. The “middle”
and “upper middle” households recorded the highest figures both in the ratio of households engaged in
goat rearing (89% and 71% respectively) and in the average number of goats (9.5 heads and 8.8 heads).
By contrast, although the average number of goats was not so small among the “upper,” “lower middle”
and “lower” classes (6.9, 7.6 and 8.6 heads respectively), only around 50% of these households kept
goats (47%, 54% and 42% respectively).
The major question now is why poor households are relatively reluctant to rear goats. Before
exploring this question, however, let us examine how the SHG program was introduced to the village
and how it functioned there, because this must have had an effect on the villagers’ goat rearing, since
they were obliged, as SHG members, to buy goats when they obtained their first bank loan through the
program.
IV The Self-Help Group Program in the Study Village
The largest micro-finance program in India, at present, is a program through the Self-Help Group
(SHG).28) As mentioned earlier, an SHG consists of 10–20 women who gather regularly and save a small
amount of money, which is lent back to some members. In this sense, the SHG program is literally
“self-help” among rural women. However, if the SHG performs well, members can get bank loans
without collateral through responsible NGOs (the “SHG-Bank Linkage Program”). In addition, they
can enjoy a government subsidy; 50% of the principal is reimbursed when fully repaid.
At the time of the survey, there were 7 women’s SHGs in the study village, organized and monitored
by 2 NGOs and 1 semi-governmental organization: 5 groups (79 households) by the People’s Association
of Rural Development (PARD),29) 1 group (18 households) by the Association for Sarva Seva Farms
27) Sacrificing goats as a special meal for functional purposes at home is also important.28) It is called Sangam in Tamil.29) PARD is a Madurai-based NGO for rural development. A micro-finance program is one of their activities, through
which they support 263 SHGs with total savings of Rs.6.5 million. They also manage a training center for ruralwomen to promote their livelihoods [Squido 2010].
63
Sato K. : Goat-Rearing Practices and the Limited Effects of the SHG Program in India
(ASSEFA),30) and 1 group (15 households) by the Tamil Nadu Corporation for Development of Women
Ltd. (TNCDW).31)
ASSEFA was the first NGO to organize SHGs in the study village. They organized 2 SHGs in July
1992.32) In 1999 PARD started to organize SHGs and 6 groups were established by 2004. Finally,
TNCDW organized an SHG in February 2006. In 2007, however, one of the two SHGs under ASSEFA
and one under PARD stopped due to internal troubles. In 2009, PARD announced that it would withdraw
from the SHG program. Then the members of 5 SHGs held a meeting and consulted one of the SHG
federations.33) Finally, they were able to change their NGO from PARD to the Dhan Foundation,34) which
accepted all of them. The details of the process of the introduction and development of the SHGs in the
study village are described in Fujita and Sato [2011] in this issue.
Monthly savings per member amounted to Rs.50–60. The savings were lent back to some members
at an interest rate of 2% per month. When they received a bank loan under the “SHG-Bank Linkage
Program” from various national banks such as the State Bank of India, the Canara Bank and the Indian
Bank, the interest rate was 1% per month, and they were instructed that the first loan should be used
to buy goats. In fact, a veterinary doctor in charge of the region visited the village and tagged the ear
of each goat to certify that the goat had been purchased through the program.35) The SHG is instructed
to terminate itself 5 years after its establishment (accumulated savings and interest are then distrib-
uted equally among the members), but if they want to continue, they can start a new SHG. It should
be noted here that all the members of the 5 SHGs under PARD had already received bank loans and
30) ASSEFA was established in 1969 by a disciple of Gandhi as an executive body for a land-distribution programfor outcaste people called the “Bhoodan“ Movement.” Since the 1980s, it has started to focus on supportingsaving group activities in rural areas [GDRC 2010]. However, it restructured its organization in 2000, and partof it became an independent institution called the Sarvodaya Mutual Benefit Trust (SMBT), which receives financial assistance from the Small Industries Development Bank of India (SIDBI) to promote SHG pro-grams.
31) TNCDW had a SHG program called Mahalir Thittam [TNCDW 2010].32) The IRDP was introduced to the village in the 1980s, and 167 people received bank loans with a government
subsidy (the rate of the subsidy differed from one caste category to another). Most of the loans were used topurchase cows to sell milk through a milk cooperative that was established in the village at that time [Fujita andSato 2011].
33) The SHG federations were formed in order to reduce any regional imbalance in the formation of SHGs (therewere fewer SHGs in north and northeast India) and also to assist SHGs which have no support from an appro-priate NGO. There is an association of powerful NGOs in the SHG program in India. It is a certified body ac-credited by important financial institutions such as the Reserve Bank of India, the National Bank for Agricultureand Rural Development (NABARD), and the state and federal governments [APMAS 2007].
34) Dhan Foundation, whose head office is located in Madurai City, has a program called “Kalanjiam“ Development Financial Services” to assist SHG activities in rural areas [Dhan Foundation 2010].
35) According to villagers, some SHG members showed the veterinarian goats that they had already reared. Insuch cases, the bank loan might have been used for other purposes.
東南アジア研究 49巻 1号
64
repayments had been completed by the time of the survey in January 2010. Note here that all the
members of the 7 SHGs had already received bank loan at least once, so that they must have experienced
goat rearing, at least temporarily.
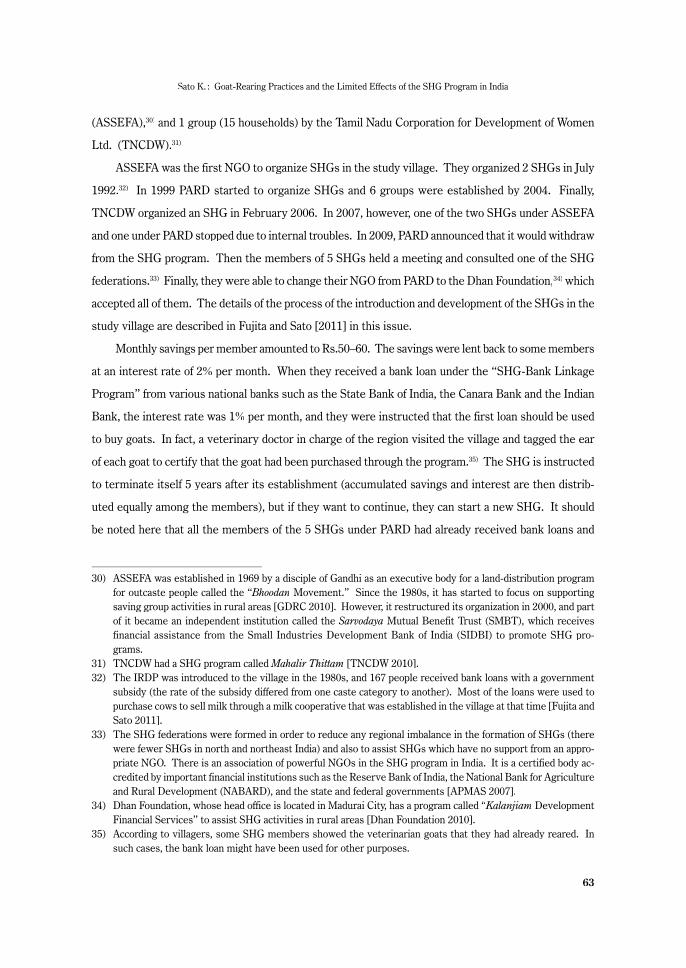
Table 6 shows the number and share of participating households in the 7 SHGs by the five economic
classes in the village. The number and share of the participating households in two or more SHGs are
also shown in the table. The average participation rate for all the households was nearly 60%, but it was
low among the poor and the wealthy (47%, 54% and 42% for “upper,” “lower middle” and “lower,”
respectively). Especially notable here is the fact that the poorest class (“lower”) recorded the lowest
participation rate, which is an unexpected result from the viewpoint of government policy.36)
V Why Is There Relatively Less Participation
among the Rural Poor in Goat Rearing?
Chapter III showed that goat rearing was relatively unpopular among the poor. Although the average
number of goats reared by goat rearing households was not small, only around 50% of poor households
kept goats. Chapter IV revealed that participation rate in the SHGs was also low among the poor.
Table 7 shows the relationship between goat rearing and SHG participation in the five economic
classes. The table indicates that the ratio of households that neither reared goats nor participated in an
SHG was highest among the “lower” class (42%), followed by the “upper” (33%) and the “lower middle”
classes (26%). Also notable is the fact that the number of households that participated in an SHG but
Table 6 Households Participating in SHGs in Si Village
Class No. ofHH
No. of HHParticipating in One
or More SHGs
No. of HHParticipating in Two
or More SHGs
No. of HHParticipating in Three
or More SHGs
Upper 15 7 (47%) 3 (20%) 1 (7%)U. Middle 17 13 (76%) 7 (41%) 1 (6%)Middle 37 27 (73%) 11 (30%) 6 (16%)L. Middle 39 21 (54%) 6 (15%) 1 (3%)Lower 26 11 (42%) 4 (15%) 0 (0%)
Total 134 79 (59%) 31 (23%) 9 (7%)
Source: Fieldwork by the author in 2007–09.
36) According to Ghatak [1999], the reason for the weak involvement of poor households in SHG activities can beattributed to the barrier arising from being monitored by one’s peers when members are selected. Since SHGmembers have to bear joint liability, households with a low and unstable income may be denied membership.See also Suda [2006] and Dreze [1990] for the same argument.
65
Sato K. : Goat-Rearing Practices and the Limited Effects of the SHG Program in India
did not rear goats (indicating that they once reared goats but later stopped for some reason) was also
not small. Such households were especially common among the “lower middle” (21%) and “upper”
classes (20%). This indicates that non-participation in SHGs can only partly explain why the poor do
not rear goats. There must be some other strong reasons.
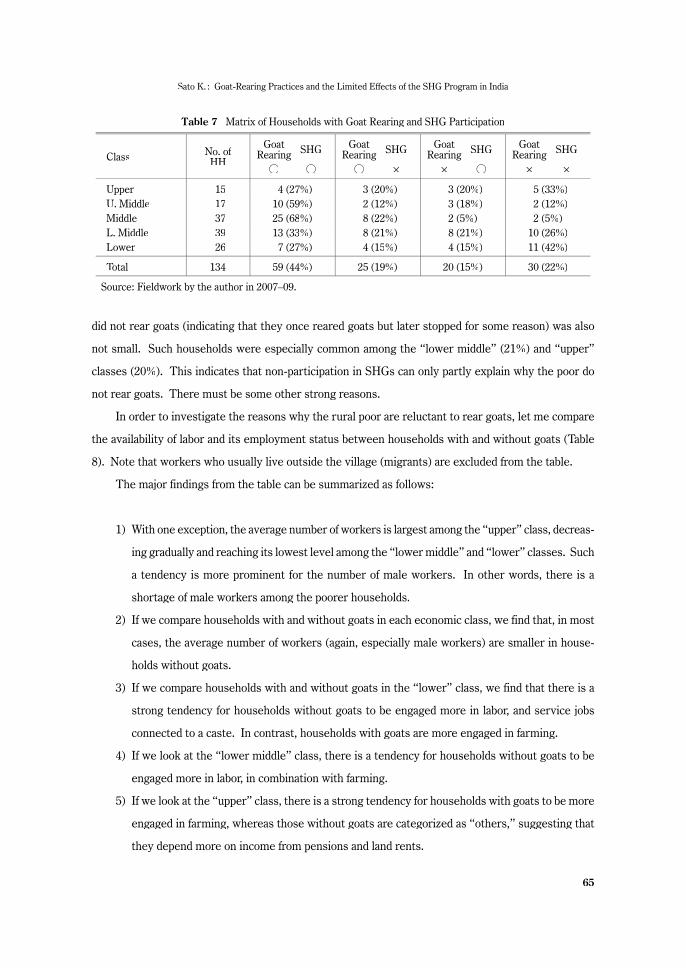
In order to investigate the reasons why the rural poor are reluctant to rear goats, let me compare
the availability of labor and its employment status between households with and without goats (Table
8). Note that workers who usually live outside the village (migrants) are excluded from the table.
The major findings from the table can be summarized as follows:
1) With one exception, the average number of workers is largest among the “upper” class, decreas-
ing gradually and reaching its lowest level among the “lower middle” and “lower” classes. Such
a tendency is more prominent for the number of male workers. In other words, there is a
shortage of male workers among the poorer households.
2) If we compare households with and without goats in each economic class, we find that, in most
cases, the average number of workers (again, especially male workers) are smaller in house-
holds without goats.
3) If we compare households with and without goats in the “lower” class, we find that there is a
strong tendency for households without goats to be engaged more in labor, and service jobs
connected to a caste. In contrast, households with goats are more engaged in farming.
4) If we look at the “lower middle” class, there is a tendency for households without goats to be
engaged more in labor, in combination with farming.
5) If we look at the “upper” class, there is a strong tendency for households with goats to be more
engaged in farming, whereas those without goats are categorized as “others,” suggesting that
they depend more on income from pensions and land rents.
Table 7 Matrix of Households with Goat Rearing and SHG Participation
Class No. ofHH
Goat Rearing SHG Goat
Rearing SHG GoatRearing SHG Goat
Rearing SHG
○ ○ ○ × × ○ × ×
Upper 15 4 (27%) 3 (20%) 3 (20%) 5 (33%)U. Middle 17 10 (59%) 2 (12%) 3 (18%) 2 (12%)Middle 37 25 (68%) 8 (22%) 2 (5%) 2 (5%)L. Middle 39 13 (33%) 8 (21%) 8 (21%) 10 (26%)Lower 26 7 (27%) 4 (15%) 4 (15%) 11 (42%)
Total 134 59 (44%) 25 (19%) 20 (15%) 30 (22%)
Source: Fieldwork by the author in 2007–09.
東南アジア研究 49巻 1号
66
Tab
le 8
Diff
eren
ces
in A
vaila
bilit
y of
Wor
kers
and
The
ir Jo
bs a
mon
g H
ouse
hold
s w
ith/w
ithou
t Goa
t Rea
ring
Cla
ssN
o. o
fH
H
No.
of H
Hw
ith o
r w
ithou
tG
oat R
eari
ng
Aver
age
No.
of W
ork
Forc
epe
r H
H1)
Patt
ern
of E
mpl
oym
ent
Cas
e of
One
Wor
ker
per
HH
Cas
e of
Tw
o W
orke
rs p
er H
H
Mal
eFe
mal
eTo
tal
Farm
ing
Off-
farm Job
Onl
y
Lab
orO
nly
Serv
ice
Job
Lin
ked
to C
ast e
Farm
ing
Off-
farm Job
Onl
y
Lab
or
Oth
er2)
Onl
yw
ithO
ff-fa
rmJo
b
with
La b
orO
nly
with
Off-
farm
Job
Onl
yw
ithO
ff-fa
rmJo
b
with
Lab
or
with
Serv
ice
Job
Lin
ked
toC
aste
Onl
yw
ithO
ff-fa
rmJo
b
with
Serv
ice
Job
Lin
ked
toC
aste
Upp
er15
with
goa
t 7
1.0
1.0
2.0
64%
7%14%
14%
with
out g
oat
80.
80.
91.
623%
8%
15%
54%
U. M
iddl
e17
with
goa
t12
0.8
0.8
1.6
5%
32%
21%
37%
with
out g
oat
50.
80.
61.
414%
57%
29%
Mid
dle
37w
ith g
oat
330.
80.
91.
7 2%
12%
25%
2%58%
2%w
ithou
t goa
t4
0.8
1.0
1.8
14%
29%
57%
L. M
iddl
e39
with
goa
t21
0.6
0.9
1.5
3%
13%
3%
23%
10%
32%
10%
6%15%
with
out g
oat
180.
40.
71.
110%
25%
5%
5%40%
20%
10%
Low
er26
with
goa
t11
0.5
1.1
1.5
6%
6%12%
6% 6%
6%
6%12%
12%
6%
12%
6%6%
with
out g
oat
150.
40.
71.
147%
6%12%
18%
18%
Sour
ce: F
ield
wor
k by
the
auth
or in
200
8.N
otes
: 1) O
nly
wor
kers
sta
ying
in th
e vi
llage
. M
igra
nts
wer
e ex
clud
ed.
2) In
clud
es p
ensi
on-r
ecip
ient
s, p
ure
land
ren
t-re
cipi
ents
, etc
.
67
Sato K. : Goat-Rearing Practices and the Limited Effects of the SHG Program in India
In sum, it can be hypothesized that the major reason why many of the poor do not rear goats is,
paradoxically, a lack of labor. Apparently, goat rearing does not require a full-time workforce, but it does
require several (fragmented) hours of work every day, especially for pasturing goats in the field twice
a day. This characteristic of goat rearing is suited to part-time work, in combination with farming more
than hired labor or non-agricultural jobs (especially hired non-agricultural jobs in factories near the
village). In other words, the rural poor had to allocate their limited amount of labor to full-time hired
labor/off-farm jobs in order to earn a higher income, thereby sacrificing goat rearing.37)
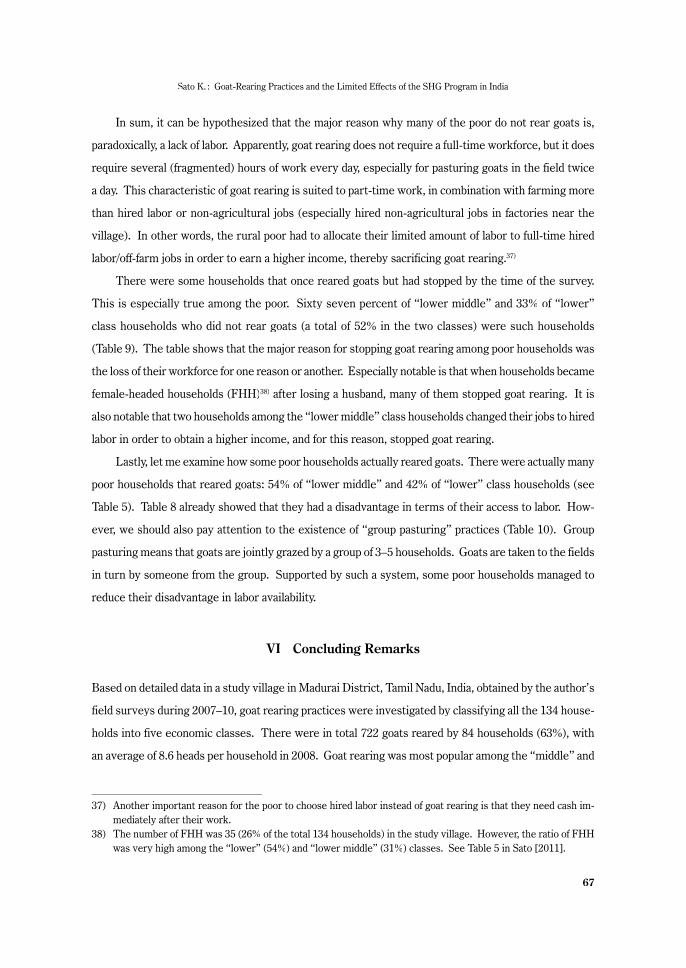
There were some households that once reared goats but had stopped by the time of the survey.
This is especially true among the poor. Sixty seven percent of “lower middle” and 33% of “lower”
class households who did not rear goats (a total of 52% in the two classes) were such households
(Table 9). The table shows that the major reason for stopping goat rearing among poor households was
the loss of their workforce for one reason or another. Especially notable is that when households became
female-headed households (FHH)38) after losing a husband, many of them stopped goat rearing. It is
also notable that two households among the “lower middle” class households changed their jobs to hired
labor in order to obtain a higher income, and for this reason, stopped goat rearing.
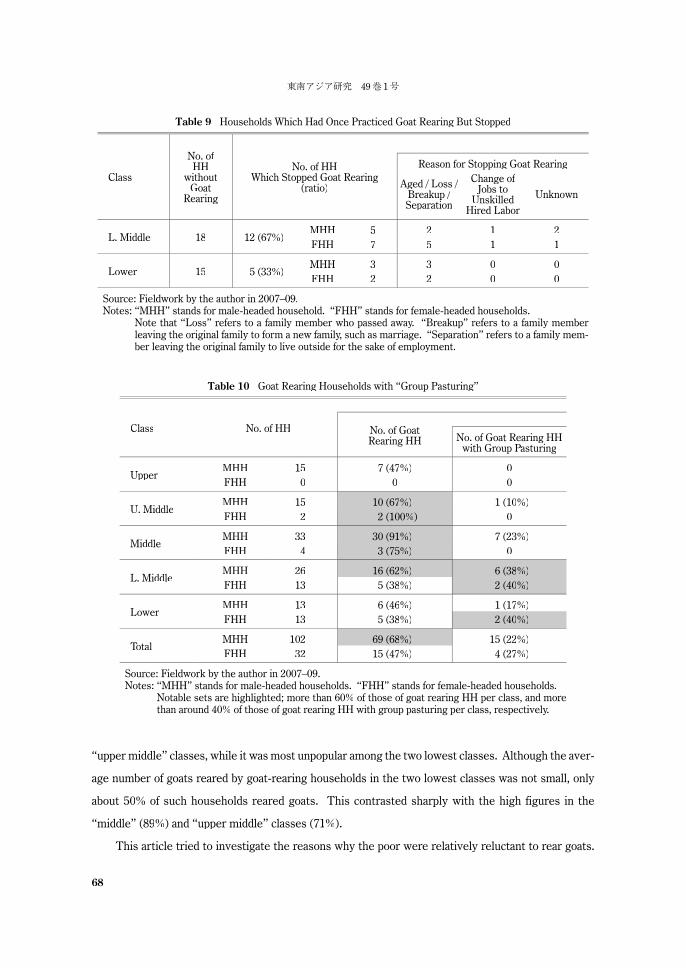
Lastly, let me examine how some poor households actually reared goats. There were actually many
poor households that reared goats: 54% of “lower middle” and 42% of “lower” class households (see
Table 5). Table 8 already showed that they had a disadvantage in terms of their access to labor. How-
ever, we should also pay attention to the existence of “group pasturing” practices (Table 10). Group
pasturing means that goats are jointly grazed by a group of 3–5 households. Goats are taken to the fields
in turn by someone from the group. Supported by such a system, some poor households managed to
reduce their disadvantage in labor availability.
VI Concluding Remarks
Based on detailed data in a study village in Madurai District, Tamil Nadu, India, obtained by the author’s
field surveys during 2007–10, goat rearing practices were investigated by classifying all the 134 house-
holds into five economic classes. There were in total 722 goats reared by 84 households (63%), with
an average of 8.6 heads per household in 2008. Goat rearing was most popular among the “middle” and
37) Another important reason for the poor to choose hired labor instead of goat rearing is that they need cash im-mediately after their work.
38) The number of FHH was 35 (26% of the total 134 households) in the study village. However, the ratio of FHHwas very high among the “lower” (54%) and “lower middle” (31%) classes. See Table 5 in Sato [2011].
東南アジア研究 49巻 1号
68
“upper middle” classes, while it was most unpopular among the two lowest classes. Although the aver-
age number of goats reared by goat-rearing households in the two lowest classes was not small, only
about 50% of such households reared goats. This contrasted sharply with the high figures in the
“middle” (89%) and “upper middle” classes (71%).
This article tried to investigate the reasons why the poor were relatively reluctant to rear goats.
Table 9 Households Which Had Once Practiced Goat Rearing But Stopped
Class
No. ofHH
withoutGoat
Rearing
No. of HHWhich Stopped Goat Rearing
(ratio)
Reason for Stopping Goat Rearing
Aged / Loss /Breakup /Separation
Change of Jobs to
Unskilled Hired Labor
Unknown
L. Middle 18 12 (67%)MHH 5 2 1 2FHH 7 5 1 1
Lower 15 5 (33%)MHH 3 3 0 0FHH 2 2 0 0
Source: Fieldwork by the author in 2007–09.Notes: “MHH” stands for male-headed household. “FHH” stands for female-headed households.
Note that “Loss” refers to a family member who passed away. “Breakup” refers to a family memberleaving the original family to form a new family, such as marriage. “Separation” refers to a family mem-ber leaving the original family to live outside for the sake of employment.
Table 10 Goat Rearing Households with “Group Pasturing”
Class No. of HH No. of GoatRearing HH No. of Goat Rearing HH
with Group Pasturing
UpperMHH 15 7 (47%) 0FHH 0 0 0
U. MiddleMHH 15 10 (67%) 1 (10%)FHH 2 2 (100%) 0
MiddleMHH 33 30 (91%) 7 (23%)FHH 4 3 (75%) 0
L. MiddleMHH 26 16 (62%) 6 (38%)FHH 13 5 (38%) 2 (40%)
LowerMHH 13 6 (46%) 1 (17%)FHH 13 5 (38%) 2 (40%)
TotalMHH 102 69 (68%) 15 (22%)FHH 32 15 (47%) 4 (27%)
Source: Fieldwork by the author in 2007–09.Notes: “MHH” stands for male-headed households. “FHH” stands for female-headed households.
Notable sets are highlighted; more than 60% of those of goat rearing HH per class, and morethan around 40% of those of goat rearing HH with group pasturing per class, respectively.
69
Sato K. : Goat-Rearing Practices and the Limited Effects of the SHG Program in India
It found that, paradoxically, a lack of labor in poor households was the major reason. First, the average
number of workers in the two lowest classes was less than 1.5 persons. Moreover, the ratio of female
workforce was 60–70% or even more. Actually, female-headed households occupied more than 50% of
the “lower” class (33% in the “lower-middle” class). Second, a comparison between households with
and without goats in the “lower” class showed that 1) the average number of workers was much
smaller in the latter (1.1 persons) than in the former (1.5 persons); 2) there was a sharp contrast in that
the latter were more engaged in labor, and service jobs connected to caste, whereas the former were
more engaged in farming. Another comparison between households with and without goats in the
“lower middle” class also showed that the latter were more engaged in labor, in combination with
farming. In sum, it was found that poor households who did not rear goats allocated their limited number
of workers (mainly female labor) to full-time hired labor, including agriculture and non-agriculture, so
that there was no time to take care of goats.
Government-sponsored micro-finance schemes have been undertaken in India since the late 1970s,
when the IRDP started throughout the country. Since the 1990s, the “SHG-Bank Linkage Program”
has become the major policy tool for providing small bank loans to the rural poor, especially women.
The basic idea of the micro-finance schemes; i.e. providing rural poor women with livestock such as
cows and goats, seems to have remained unchanged until today. In other words, the accumulation of
non-land assets (livestock) in poor households has been the major strategy to alleviate rural poverty in
India.
It may seem reasonable at a glance to think that the rural poor can easily rear small animals such
as goats efficiently by relying on their sole resource, unskilled labor (especially female labor), but this,
unex pectedly does not actually seem to have been the case. Furthermore, the major reason why the
poor were reluctant to rear goats is mainly attributable to the lack of (unskilled) labor among the rural
poor. In this sense, other kinds of programs should effectively target the poorest, such as pension
schemes for elderly people.39) Of course, we should pay attention to the fact that the data for this article
was collected in south India, where the labor market for women is relatively developed in comparison
with the rest of the country. In other words, there is a possibility that the poorest female-headed house-
holds are also engaged more in goat rearing in rural areas where availability of hired labor jobs is scarce
for them.
At the same time, however, it should be remembered that nearly half the rural poor households
— although they were not the poorest — could rear goats in the study area. Therefore, it can be claimed
39) Regarding the Old Age Pension scheme, see Fujita [2011] in this special issue.
東南アジア研究 49巻 1号
70
that they benefit from livestock-oriented micro-finance programs such as the SHG-Bank Linkage
Program.
Finally, one more important point should be mentioned. The study village of this paper was char-
acterized by the absence of scheduled castes (SC) people, so that the problems related to goat rearing
could be dealt with as a purely economic issue of poorer sectors in a village. However, in many “typical”
villages with a substantial number of SC people and where goat rearing has been carried out by them,
the problems may not be purely economic but also social, such as those pertaining to access to village
common land for pasturing goats [Yanagisawa 2002]. In this sense, the general validity of this paper
should not be taken for granted. Further research is necessary in this regard.
Acknowledgements
I am grateful to many people who accepted me as a Ph.D. student conducting fieldwork in the study area, espe-cially to the villagers in Si Village and those who helped me in various ways during the fieldwork. I would also liketo extend my gratitude to the funding agencies which made this fieldwork possible for six times during 2007–10; theKyoto University Miryoku Program, the Kyoto University Global COE Program on “In Search of SustainableHumanosphere in Asia and Africa,” the Mishima Kaiun Memorial Foundation and the Suntory Foundation. Valuableinformation was provided by the following people; Mr. Alagarsamy, Mr. Kumar, Dr. Subramaniyan, and Ms. Iwasaki.Thanks are also extended to Raj, Periyar, Prethi, and Sahaya Rani for their help during the interviews. Valuablecomments were provided by an anonymous referee. Special thanks to Professor Fujita, CSEAS, Kyoto University,for supervising my research.
References
Acharya, R. M. 1982. Sheep and Goat Breeds in India. FAO Animal Production and Health Paper 30. Accessed on1 June 2010 at http://www.fao.org/DOCREP/004/X6532E/X6532E00.htm.
APMAS. 2007. SHG Federations in India, 2007. Accessed on 24 August 2010 at http://www.apmas.org/pdf/ SHGfinalbook.pdf.
Department of Economics and Statistics (Tamil Nadu). 2006. Statistical Handbook of Tamil Nadu 2005.―. 2007a. Statistical Handbook of Tamil Nadu 2006.―. 2007b. Season and Crop Report of Tamil Nadu 2005–06.―. 2008a. Statistical Handbook of Tamil Nadu 2008.―. 2008b. Season and Crop Report of Tamil Nadu 2006–07.―. 2009. Season and Crop Report of Tamil Nadu 2007–08.Dhan Foundation. 2010. Kalanjiam Development Financial Services. Accessed on 24 August 2010 at http://www.
dhan.org/peopleinstitutions/kdfs.php.Dreze, J. 1990. Poverty in India and the IRDP Delusion. Economic and Political Weekly 25(39): A95–A104.Food and Agriculture Organization (FAO). 2009. Statistical Year Book 2009. Accessed on 1 June 2010 at http://www.
fao.org/economic/ess/publications-studies/statistical-yearbook/fao-statistical-yearbook-2009/b-agricultural-production/en/.
Fujita, K. 2011. Introduction: Socio-Economic Dynamics in a Tank-Irrigated Rural Area in Contemporary TamilNadu, India. Southeast Asian Studies 49(1): 3–21.
Fujita, K.; and Sato, K. 2011. Self-Help Groups and the Rural Financial Market in South India: A Case of a TamilNadu Village. Southeast Asian Studies 49(1): 74–92.
Gardin, B. E. 1988. Wealth Ranking in Smallholder Communities: A Field Manual. Intermediate TechnologiesPublication Ltd.

71
Sato K. : Goat-Rearing Practices and the Limited Effects of the SHG Program in India
Ghatak, M. 1999. Group Lending, Local Information and Peer Selection and Peer-monitored Lending. Journal of Development Economics 69(1): 27–50.
Global Development Research Centre (GDRC). 2010. Credit Assessment–the ASSEFA Way. Accessed on 5 September2010 at http://www.gdrc.org/icm/assefa.html.
Government of India (GOI). 1981. Census of India 1981, Series 33: Tamil Nadu, District Census Handbook, Part-BMadurai District, Village and Town-wise Primary Census Abstract.―. 1991. Census of India 1991, Series 33: Tamil Nadu, District Census Handbook, Part-B Madurai District,
Village and Town-wise Primary Census Abstract.―. 2001. Census of India 2001, Series 33: Tamil Nadu, District Census Handbook, Part-B Madurai District,
Village and Town-wise Primary Census Abstract.Japan Wildlife Center. 2008. Keniya de Kachiku no Densenbyo [Infection of Livestock in Kenya]. In Dobutsu Kankyo
Nyusu [News on the Animal Environment] (in Japanese). Accessed on 23 April 2010 at http://jwc-web.org/news_world/topics.cgi?page=40.
Indian Council of Agricultural Research (ICAR). 2008. Handbook of Animal Husbandry. New Delhi.Kondo, N. 1998a. Indo niokeru Sogo Noson Kaihatsu Jigyo no Tenkai (I): Sogoteki Chiiki Kaihatsu kara Hinkon
Kanwa Jigyo e [Progress of the Integrated Rural Development Program in India (I): From Integrated AreaDevelopment Program to Poverty Alleviation Program] (in Japanese). Ajia Keizai 39(6): 2–22.―. 1998b. Indo niokeru Sogo Noson Kaihatsu Jigyo no Tenkai (II): Sogoteki Chiiki Kaihatsu kara Hinkon
Kanwa Jigyo e [Progress of the Integrated Rural Development Program in India (II): From Integrated AreaDevelopment Program to Poverty Alleviation Program] (in Japanese). Ajia Keizai 39(7): 22–52.
Mosse, D. 2003. The Rule of Water: Statecraft, Ecology, and Collective Action in South India. Oxford: Oxford UniversityPress.
National Bank for Agriculture and Rural Development (NABARD). 2000. Annual Report 1999–2000– . Accessed on14 June 2010 at http://www.nabard.org.
Reddy, C. S. 2009. SHG Federations in India. Accessed on 14 June 2010 at http://www.nird.org.in/Prof_RadhakrishnaReportonSGSY30Apr2009.pdf.
Sato, K. 2011. Employment Structure and Rural-Urban Migration in a Tamil Nadu Village: Focusing on Differencesby Economic Class. Southeast Asian Studies 49(1): 22–51.
Shankarnarayan, K. A.; Bohra, H. C.; and Ghosh, P. K. 1985. The Goat: An Appropriate Animal for Arid and Semi-Arid Regions. Economic and Political Weekly 20(45–47), Special Edition: 1965–1972.
Squido. 2010. Madurai India on PARD Project Details. Accessed on 24 August 2010 at http://squido.com/madurai_india.Srinivas, M. S. 1989. The Cohesive Role of Sanskritization and Other Essays. Oxford: Oxford University Press.Suda, T. 2006. Indo Noson Kinyu Ron [Rural Finance in India] (in Japanese). Nihon Hyoron Sha.Tamil Nadu Corporation for Development of Women Ltd. (TNCDW). 2010. Tamil Nadu Corporation for Development
of Women Ltd., Rural Development and Panchayat Raj Department. Accessed on 14 June 2010 at http://www.tamilnaduwomen.org/home.php?page=SHGs.
Tsujita, Y. 2006. Hinkon Sakugen Puroguramu no Genjyo to Kadai [The Current Situation and Issues of PovertyReduction Programs]. In Ajiken Sensho 2: Yakudo suru Indo Keizai: Hikari to Kage [Book series selected byIDE-JETRO No. 2: Indian Economy at a Breakthrough: Light and Shade] (in Japanese), edited by S. Uchiyama.IDE-JETRO.
Uttarakrishiprabha. 2010. Feeding of Goats. Accessed on 7 June 2010 at http://uttrakrishiprabha.com/.Vries, J. D. 2008. Goats for the Poor: Some Keys to the Successful Promotion of Goat Production among the Poor.
Small Ruminant Research 77: 221–224.Yanagisawa, H. 2002. Sonraku Kyodo Riyochi no Gensho to Sonraku Shakai no Henyo [Declining Village Common
Land and Changes in Rural Society]. In Gendai Minami Ajia No. 4: Kaihatsu to Kankyo [Contemporary SouthAsia, Book Series No. 4: Development and Environment] (in Japanese), edited by H. Yanagisawa. Universityof Tokyo Press.
東南アジア研究 49巻 1号
72
Appendix Table 1 Number of Slaughtered Livestock in Tamil Nadu(million)
Year Sheep Goat
2000/01 93.5 77.92001/02 102.2 86.42002/03 115.3 101.32003/04 114.1 108.52004/05 112.9 136.72005/06 157.1 139.42006/07 158.2 209.72007/08 134.3 216.9
Source: Prepared by the author based on data from Department of Economics and Statistics (Tamil Nadu) [2006; 2007a; 2008a].
Notes: The figures shown above were collected from registered abattoirs. (Therefore, those from non-registered abattoirs were excluded from above figures.)

73
Sato K. : Goat-Rearing Practices and the Limited Effects of the SHG Program in India
App
endi
xT
able
2T
ypes
of F
eed
App
lied
to G
oat i
n Si
Vill
age
Gen
eral
Nam
esTa
mil
Nam
eN
omen
clat
ure
Seas
on A
vaila
ble
and/
or M
etho
dU
sed
to O
btai
n Fe
edM
etho
d of
Fe
edin
gN
utri
tiona
l Val
ueP
rice
(Tam
il A
lpha
bet)
(Pro
noun
ciat
ion)
Con
cent
rate
feed
Gro
undn
ut c
akes
(GN
C)Gz;zhf; F
puna
kku
Ara
chis
hyp
ogae
a
Avai
labl
e al
l the
yea
r ro
und
atm
arke
t.
stal
l fee
din g
Pro
tein
ric
h an
d a
sour
ce o
f ene
rgy.
T
he b
est s
uppl
emen
tary
feed
for
goat
s.
Rs.
35/
kg
Star
ch w
ater
fQ;rp
kanj
i(g
ener
al n
ames
)
(gro
und)
mai
zekf;fhNrhsk
mak
kaso
lam
Zea
May
sR
s. 1
5/kg
(gro
und)
pea
rl m
illet
fk;G
kam
bhu
Penn
iset
um g
lauc
umR
s. 1
0/kg
(gro
und)
whe
atNfhJik
godh
unai
Triti
cum
Rs.
35/
kg
Fodd
er C
rops
(gen
eral
nam
es)
Frui
ts o
f eac
h cr
op a
re u
sed
duri
ngth
e ha
rves
t. L
ess
cost
ly th
an th
e fe
eds
liste
d ab
ove .
Nut
ritio
us a
nd u
sed
as a
sub
stitu
te
for
conc
entr
ates
dur
ing
the
harv
est
seas
on.
Mai
zekf;fhNrhsk
mak
kaso
lam
Zea
May
sFe
brua
ry–M
arch
Sorg
hum
Nrhsk
chol
amC
hola
Nat
vJa
nuar
y–M
arch
Pear
l mill
etfk;G
Kam
bhu
Penn
iset
um g
lauc
umN
ovem
ber–
Febr
uary
Gre
en fe
ed
Gre
en g
rass
esNfhiuaGy
kora
ipul
(gen
eral
nam
es)
July
–Sep
tem
ber,
Oct
ober
–D
ecem
ber,
and
afte
r ra
in.
past
urin
gN
utri
tious
onl
y w
hen
flow
erin
g af
ter
rain
.
Fodd
er c
rops
(gen
eral
nam
es)
Stem
s an
d le
aves
of a
ll fo
dder
cro
ps
are
used
as
feed
.
stal
l fee
ding
Avai
labl
e w
hen
each
cro
p is
bei
ngcu
ltiva
ted.
The
ma j
or fe
ed fo
r go
ats.
Mai
zekf;fh Nrhsk
mak
kaso
lam
Zea
May
sA
ugus
t–M
arch
Sorg
hum
Nrhsk
chol
amC
hola
Nat
vJa
nuar
y–M
arch
Pear
l mill
etfk;G
kam
bhu
Penn
iset
um g
lauc
umA
ugus
t–Fe
brua
ry
Gre
en le
aves
(e.g
. nee
m)
Ntg;gq;Fis
vepa
ngul
aiA
zadi
rach
ta in
dica
Avai
labl
e al
l the
yea
r ro
und.
Aca
cia
and
Pro
soph
is.
Col
lect
ed th
roug
h ag
ricu
ltura
l wor
k.
stal
l fee
d ing
and
past
urin
gO
nly
feed
in d
ry s
easo
n, a
vaila
ble
from
fiel
d s.
Cro
p re
sidu
es
Stra
ws
or h
usks
nghl;L
pott
u(g
ener
al n
ames
)H
usks
of s
eed
colle
cted
dur
ing
the
harv
est f
rom
fiel
ds.
Lea
stex
pens
ive
feed
.
stal
l fee
d ing
Ric
h in
fibe
r bu
t poo
r in
pro
tein
.
Cas
tor
seed
hus
kstl;lkzpf;Fio
vatt
aman
ikul
aiR
icin
us c
omm
unis
Sept
embe
rM
aize
see
d hu
sks
kf;fhNrhsk
mak
kaso
lam
Zea
May
sFe
brua
ry–M
arch
Padd
y st
raw
Ney;
n el
Ory
za S
ativ
aJa
nuar
yG
ram
/ B
lack
gra
m
husk
sJtiu
thuv
arai
Vign
a m
ungo
and
/or
vign
a ra
diat
eN
ovem
ber–
Febr
uary
Cot
ton
seed
hus
ksgUj;j
paru
thi
Gos
sypi
umN
ovem
ber–
Febr
uary
and
June
–Jul
y
Sour
ce: F
ield
wor
k by
the
auth
or in
200
7–09
, and
ICA
R [2
008]
.N
otes
: Inf
orm
atio
n w
as c
olle
cted
by
the
auth
or fr
om fa
rmer
s in
the
stud
y vi
llage
and
con
firm
ed b
y ve
teri
nary
doc
tors
at t
he tw
o ve
teri
nary
sta
tions
nea
r Si
Vill
age.