gobi bear abundance and inter-oases movements, gobi desert ... · gobi bear hair. mccarthy et al....
TRANSCRIPT

Gobi bear abundance and inter-oases movements, Gobi Desert,Mongolia
Odbayar Tumendemberel1, Michael Proctor2,9, Harry Reynolds3, John Boulanger4,Amgalan Luvsamjamba1, Tuya Tserenbataa5, Mijiddorj Batmunkh6, Derek Craighead7,
Nyambayar Yanjin6, and David Paetkau8
1 Institute of General and Experimental Biology, Mongolian Academy of Sciences, Jukov Avenue, Ulaanbaatar 51,Mongolia
2Birchdale Ecological, P.O. Box 606, Kaslo, BC V0G 1M0, Canada3Gobi Bear Fund, Gobi Bear Project, P.O. Box 80843, Fairbanks, AK 99708, USA
4 Integrated Ecological Research, 924 Innes, Nelson, BC V1L 5T2, Canada5United Nations Development Program, 202 ESC Center, 2B Building, Zaluuchuud Avenue, 6th Khoroo, Sukbaatar
District, Ulaanbaatar, Mongolia6Great Gobi Strictly Protected Area, Bayantoorai, Mongolia
7Craighead Beringia South, P.O. Box 147, Kelly, WY 83011, USA8Wildlife Genetics International, 200-182 Baker Street, P.O. Box 274, Nelson BC V1L 5P9, Canada
Abstract: Brown bears (Ursus arctos) inhabit much of the northern hemisphere, includingportions of North America, Europe, and Asia. Whereas northern populations generally arehealthy, their distribution becomes fragmented and conservation status more tenuous in theirsouthern range. Many fragmented populations across southern Asia are poorly understood,and abundance and distribution data are minimal. One such population contains the Gobibear, a brown bear surviving in the Great Gobi Strictly Protected Area of southwesternMongolia. The number of bears in this area was assumed to be low, without data-basedabundance estimates. Whereas bears frequent 3 oases complexes, it was not known to whatextent bears moved or bred among these complexes, which span approximately 300 km. Aspart of a larger science-based conservation effort, we conducted a DNA-based mark–recapturepopulation survey in 2009 to estimate abundance, inter-oases movements of individual bearsand geneflow, and genetic variability. We placed barb-wire hair-collection sites surrounding 13supplemental feeders at most water sources within the 3 oases complexes: Atas–Inges, SharKhuls, and Tsagaan Bogd. During 5 sessions throughout spring and summer, we collected 600bear hair samples and genotyped 205 samples at 12 variable microsatellite loci (from 24). Weidentified 21 individual bears (14 M and 7 F) 48 times and developed a mark–recapturepopulation estimate of 22 bears (95% CI 5 21–29). Estimates of mean detection probabilitywere 0.27 (SE 5 0.09, CI 5 0.13–0.49) and 0.51 (SE 5 0.063, CI 5 0.39–0.64) for female andmale bears, respectively. One female and 4 males were sampled at 2 oases complexes and 3males were sampled at all 3 oases complexes. The genetic variability (heterozygosity) was lowcompared with other brown bear populations. We suggest this population is isolated fromother bear populations and is likely critically endangered with fewer than 40 individuals.
Key words: brown bear, DNA, Gobi bear, Gobi desert, mark–recapture, microsatellite genotyping, Mongolia,Ursus arctos
DOI: 10.2192/URSUS-D-15-00001.1 Ursus 26(2):129–142 (2015)
South of the contiguous Eurasian brown bear (Ursusarctos) population that spans northern Europe andRussia, there are several isolated populations (Fig. 1).Whereas the status of the continuous population
across northern Eurasia is reasonably good (LeastConcern, International Union for Conservation ofNature [IUCN] 2015 [The World ConservationUnion] Red List website: http://www.iucnredlist.org/details/41688/0), in the southern portions of the spe-cies’ range a number of small fragmented populations9email: [email protected]
129

have either an unknown or a suspected threatened orendangered conservation status where they persist.Research focusing on several of these populations islimited but growing, (Pakistan: Bellemain et al. 2007,Newaz 2007; Turkey: Can and Togan 2004, Ambarlı2012; India: Sathyakumar 2006; Nepal: Aryal et al.2010; Japan: Sato et al. 2004, Sato and Endo 2006),although few data-based abundance estimates exist(Bellemain et al. 2007, Ambarlı 2012).
One isolated brown bear population exists in theGobi desert of southwestern Mongolia. The Great
Gobi Strictly Protected Area (GGSPA; Fig. 1), cov-ers 45,918 km2 and is home to a small remnant popu-lation of brown bears, referred to as “mazaalai” orGobi bears, by Mongolians. Based on track surveys,that population has been anecdotally estimated atbetween 15 and 30 individuals by several authorsbetween the 1960s and 1990s (see reviews within Bat-saikhan et al. 2004, McCarthy et al. 2009). They areisolated to the north, east, and west by a low-densityherder-based population with scattered villages orsmall towns. The closest bears to the north extend
Fig. 1. Eurasian brown bear distribution with fragmented populations across the southern distribution and theGobi population. Inset is our study area within the Great Gobi Strictly Protected Area in southwestern Mongolia,including the oases complexes (ovals) and springs (stars).
130 GOBI BEAR POPULATION SURVEY N Tumendemberel et al.
Ursus 26(2):129–142 (2015)

into northern Mongolia from Russia in a few loca-tions and are 500–800 km away. Also, the Russianbrown bear population extends into western Mongo-lia through eastern Kazakhstan approximately500 km away. South into China, the proximity ofbrown bears is less certain. As recently as the 1970s,a now-extirpated population of Gobi bears may haveexisted adjacent to, and within 100 km of, the currentpopulation (Batsaikhan et al. 2004, McCarthy et al.2009). Because of the present suspected low popula-tion size, restricted range, and limited availablehabitat of Gobi bears, long-term persistence of thespecies will be a challenge that will likely require effec-tive conservation efforts.
Gobi bears are confined to 3 oasis complexes in theGGSPA of southwestern Mongolia and use approxi-mately 15,500 km2 within the area. They are rarelyobserved and data about their biology, ecology, andbehavior are sparse. There is little available informa-tion regarding factors that limit their numbers; andefforts to promote their recovery, including re-popu-lation of any part of their former range, are prob‐lematic. Research to provide a better understandingof Gobi bears is crucial to devising appropriate andtimely conservation measures.
Most, or all, bears in the GGSPA likely frequent$1of the supplemental feeding stations positioned at theinfrequent water sources that occur in each of the 3oases complexes: Atas–Inges, Shar Khuls, and TsagaanBogd (M. Batmunkh, personal communication; Fig. 1).Each oasis complex consists of multiple springs wheresurface water exists and feeder stations have beenplaced to supplement bear forage. These feeder stationspresent an excellent opportunity to collect DNA fromGobi bear hair. McCarthy et al. (2009) collected hairsfrom Gobi bears and used 3-locus microsatellite geno-types and sex to identify 8 individuals in 2 oasescomplexes.
As part of a larger cooperative internationalresearch effort to understand Gobi bear ecology andassess and improve the species’ conservation status,we conducted a DNA-based population survey toestimate population size, movement patterns, geneticdiversity, and isolation status. Our objective was tocollect DNA samples from hair to identify individualsand estimate their numbers using mark–recaptureestimation methods (Woods et al. 1999, Proctor et al.2010). Further objectives were to use capture historiesto identify movements between springs and oasiscomplexes, assess inter-oases geneflow, and estimate
genetic diversity relative to other brown bear popula-tions in the world.
The Gobi bear is listed in the Mongolian Red Bookof Endangered Species; this categorization wasvalidated by the bear’s designation as CriticallyEndangered (C2a(i)&D1) in the November 2005Mongolian Biodiversity Databank AssessmentWork-shop (Clark et al. 2006). The results from this surveywill be the basis for status assessment within theIUCNRegional Level Red List process (IUCN 2012).
MethodsField methods
This survey was based on amark–recapture methodusing hair sampling and DNA genotyping of indivi-dual bears and their capture histories over several cap-ture sessions (Woods et al. 1999, Proctor et al. 2010).We defined our study area as the portions of theGGSPA that contained oases complexes (i.e., watersources). Because these are the places where GGSPArangers and managers observe bear tracks regularly,we thought all (or almost all) bears frequent theseoases at some point during the non-denning seasonbecause they are the only reliable water sources avail-able in the GGSPA. We varied our sampling designfrom the usual systematic grid of sampling cells(Woods et al. 1999) because of logistical constraintsand because these isolated water sources attractmost, if not all, large mammals living in the area.We therefore used the oases as locations for hair sam-pling sites. We constructed hair-snare DNA sites at13 springs that exist within the 3 oases complexes(Fig. 1). Hair-snare sites consisted of a single strandof barbed-wire placed 50 cm above the ground sur-rounding a feeder station. Before our effort, feederstations had been present for $10 years as part of agovernment program to supplement bear foragingresources. Supplemental feed was composed of live-stock pellets and distributed once in April–May andmore rarely in September. Feed at the stations wasusually depleted within 3 weeks of distribution; how-ever, bears continued to occasionally visit feeder sta-tions throughout the remainder of their activeseason. The supplemental food had similar nutritionaland energy content to that of the wild foods thesebears eat (H. Reynolds, unpublished data). As bearsentered the wire enclosure, they left a hair sample onthe wire. In addition, it is well-known that bears inother areas use tree rubs (Kendall et al. 2009); there-fore, we also placed barbed wire on several trees at a
GOBI BEAR POPULATION SURVEY N Tumendemberel et al. 131
Ursus 26(2):129–142 (2015)

few springs to collect additional hair samples. Severalof these trees had evidence of previous rubbing activ-ity by bears. We set up hair collection sites in 2008and collected hairs throughout the spring and summeras a pilot survey and to allow cautious bears to getused to the wire. In 2009 we carried out a formalmark–recapture population estimate by collectinghair during each of 5 collections sessions: 28–30March, 17–20 April, 25 April–3 May, 4–8 June, and12–14 July. Sampling session length varied (x̄ 5 24days) from consistent intervals because we usedGGSPA rangers to collect samples in several sessionsduring their regular park-monitoring rounds. Hairsamples were placed in paper envelopes and air-driedat room temperatures until analysis. Relative locationof samples and their proximity to one another alongthe barbed wire were noted to allow for sub-samplingin the lab.
Laboratory methodsGenetic analyses were carried out at the Wildlife
Genetics International laboratory in Nelson, BritishColumbia, Canada, by O. Tumendemberel. WildlifeGenetics International has extensive experience inanalyzing bear hair samples of low DNA quantityand quality from barbed-wire sampling techniquesand follows protocols outlined in Woods et al.(1999) and Paetkau (2003). Samples were transportedto Wildlife Genetics International with appropriateConvention on International Trade in EndangeredSpecies permits from Mongolia and Canada.
Samples were sub-sampled to reduce lab costsbecause individual bears often leave multiple hairsamples at a site per visit. We used 2 criteria toexclude samples prior to extraction. First, sampleswith no guard-hair roots and ,5 underfur hairswere set aside on the basis of quality. Only 6 samplescontaining,10 underfur hairs were analyzed, and thesuccess rate for these was 0%. The second criterionfor exclusion was to limit the number of samples tobe analyzed from a given collection site-session. Themaximum was 4 extractions for sites with ,8 sam-ples, 5 extractions for sites with 8–10 samples, and$50% with .10 samples.
We extracted DNA using QIAGEN’s DNeasy Tis-sue kits following the manufacturer’s instructions(QIAGEN, Venlo, Netherlands; http://www.qiagen.com/). We used 10 guard-hair roots where available.When underfur was used, we extracted DNA fromclumps of whole underfur rather than from clippedindividual roots. We expected low marker variability
because of suspected low genetic diversity. We there-fore put considerable effort into marker selectionbefore starting the analysis of individual identity.For this purpose we selected higher quality samples(generally extracted from $10 guard-hair roots) thatwere collected at different times and places, andscreened them with 25 microsatellite markers. Fromthis effort we identified 12 markers that were suffi-ciently variable for use (G1A, G10B, G1D, G10L,G10M, G10P, G10U, MU23, MU51, MU59, P07,and CXX110; Ostrander et al. 1993, Taberlet et al.1997, Paetkau et al. 1998a, Breen et al. 2001, Proctoret al. 2002, Bellemain and Taberlet 2004), resulting in13 total usable markers when we added the amelo-genin gender marker (Ennis and Gallagher 1994;Table 1).
The 13 markers were completed in 2 single sequen-cer lanes, so the first and second pass involved 6 and 7microsatellite markers respectively. After the firstpass, we removed samples with high confidencescores for ,3 of 6 markers. This cull was necessary
Table 1. Measures of marker variability, including theobserved frequency of the most common allele (Maxf, A 5 no. of alleles) for Gobi bears of Mongolia,2009. Sample sizes are as per the final results (markerselection was done with smaller sample sizes). Differ-ences between expected heterozygosity (HE) andobserved heterozygosity (HO) were not significant atany marker.
Marker N HE HO A Max f
G10B 22 0.54 0.59 3 0.64G1D 22 0.75 0.82 4 0.32D1a 22 0.62 0.68 3 0.52I45P07 22 0.61 0.64 3 0.50MU51 22 0.51 0.50 3 0.64MU23 22 0.60 0.68 3 0.50MU59 22 0.51 0.55 2 0.50G10L 22 0.38 0.41 2 0.75G10M 22 0.46 0.41 2 0.66G10P 22 0.46 0.32 2 0.66G10U 22 0.51 0.55 3 0.59CXX110 22 0.51 0.64 2 0.55G10O 16 0.51 0.44 2 0.53Msut-6 20 0 0 1 1G1A 21 0 0 1 1G10H 19 0 0 1 1G10C 19 0 0 1 1CPH9 19 0 0 1 1MU50 18 0.26 0.28 3 0.86G10X 19 0 0 1 1144A06 16 0 0 1 1D123 16 0 0 1 1Msut-2 16 0.18 0.19 2 0.91MU26 16 0 0 1 1CXX20 20 0 0 1 1x̄ 0.29 0.30 1.92 0.77
132 GOBI BEAR POPULATION SURVEY N Tumendemberel et al.
Ursus 26(2):129–142 (2015)

to the efficiency and accuracy of our process; it elimi-nated the samples with the lowest success likelihoodand highest potential of genotyping error. All remain-ing samples with incomplete genotypes went on toone or more rounds of re-analysis.
Error-checking involved replication of one mis-match (MM), 2MM, 3MM, and 4MM pairs asdetailed in Paetkau (2003) and replication of any gen-otypes represented by only one sample. Mismatchesare pairs of genotypes that are identical except for 1allele (1MM), 2 alleles (2MM), or more. These pairedsamples are potentially from the same bear and oftenonly differ because of an error in the genotyping pro-cess. Replicating these close genotypes allows them tobe verified and errors eliminated (Paetkau 2003). Thisprocess is an excellent and resource-efficient methodfor minimizing or eliminating genotyping errors thatwould result in “false” identification of individualbears (see Kendall et al. 2009). The probability that2 individuals had identical genotypes at our 13 mar-kers was best considered by looking at potential sib-lings (Woods et al. 1999, Paetkau 2003). Wetherefore calculated this probability (Psib) for eachindividual in the population after removing each indi-vidual’s genotype being calculated for their Psib cal-culation to remove bias in the generated allelefrequencies. At the end of the error checking andthe individual identification processes, one samplefrom each identified individual was rerun at the 7most variable loci to verify there were no bears cre-ated through genotyping error.
Population estimationPopulation estimates were generated assuming
population closure during the survey. Closure viola-tion occurs when bears leave or enter the study areaduring the sampling process and tends to positivelybias population estimates because some bears maynot be available for capture and therefore might becaptured only once. Given the Gobi bear distribution,movement pattern data collected from Global Posi-tioning System (GPS) collars, and the fact that norecords of Gobi bear sightings or sign have been ver-ified outside of their present distribution since the1970s in either China or regionally in Mongolia, wehad strong evidence that the population was closed.Our population estimate represents the number ofbears using the oases and springs of the presentlyknown distribution of Gobi bears.
We used the Huggins closed-capture model (Hug-gins 1991) and heterogeneity mixture models (Pledger
2000) in Program MARK (White and Burnham1999; MARK Version 7.1, www.phidot.org/software/mark/, accessed 19 Nov 2013). Examination of ourcapture and recapture patterns suggested that we con-sider capture probability variation due to time and sexas covariates in our suite of competing models. Wetherefore developed and tested models assuming nocovariates, sex alone, time alone, and sex and timetogether, additively and as interactions. We also devel-oped 2 heterogeneity mixture models (Pledger 2000).We comparedmodels using the small-sample-size–cor-rected Akaike’s Information Criteria (AICc; Burnhamand Anderson 2002). We considered models to be sup-ported by the data if their Delta AICc scores were,2.0. To account for model uncertainly, we model-averaged our population estimates based on AICc
weights relative to support for the best model withthe lowest AICc score. We calculated log-based confi-dence intervals (White et al. 2002) on model-averagedestimates. Estimates of variances for combined-sexestimates were obtained from the variance–covariancematrix of model-averaged estimates.
We did not use the recently developed SpatiallyExplicit Capture Recapture models (Efford 2004)that are designed to estimate density because all evi-dence suggested that we sampled the full extent ofthe inhabited area of bears, and therefore there wasminimal chance of movement to or from or focalstudy area during the period in which samplingoccurred. Furthermore, our sampling strategy waslinked to the unusual study area; we sampled allknown water springs in a desert with vast areas ofunsuitable habitat where these oases likely attract alllarge mammals.
Spatial analysisWe used capture histories combined with spatial
sampling locations to map the extent of individualbear movements within a Geographic InformationSystem. This information allowed us to exploreinter-oases movements of individual male and femalebears. We also used the software program Genetix(Belkhir 1999) to explore genetic clustering due tofidelity to any one oasis complex. Genetix is a power-ful clustering algorithm that does not rely on popula-tion-specific allele frequencies and thus does not relyon large sample sizes to detect genetic similarities.Genetix uses allele sharing and multidimensionalFactorial Correspondence Analysis (Benzecri 1973,She et al. 1987, Proctor et al. 2012) and provides anobjective exploration into groupings of similar
GOBI BEAR POPULATION SURVEY N Tumendemberel et al. 133
Ursus 26(2):129–142 (2015)

genotypes without a priori assumptions of groupmembership.
ResultsSample collection and genotyping
In 2009 we collected 600 hair samples of sufficientquality for attempted analysis; 308 were extractedafter sub-selection and rejection for having too fewhairs. Ninety-nine yielded poor results on the firstpass and were discarded as were 4 mixed samples(.1 bear). Ultimately, 205 were successfully geno-typed. After re-analyzing all paired genotypes thathad 1MM, 2MM, 3MM, and 4MM, our final dataset contained no pairs of genotypes with fewer than4MM, indicating that we likely had no “false” bearsdue to genotyping error (Fig. 2). Between scoringerrors, loading errors, and amplification errors asso-ciated with remotely collected hair samples, 24 alleleswere changed after reanalysis during the error check-ing process resulting in a per locus error rate of 0.09%.
We identified 21 individuals in 2009 (7 F and 14M). One female that was not identified in 2009, wasidentified in our 2008 pilot study. The mean numberof samples per individual male bear was 14.1 (SE 52.98) and 4.8 (SE 5 1.36) per individual femalebear, and 1 individual was represented by only 1
sample. The highest individual probability of 2 sib-lings having an identical genotype at our 13 markers(including sex) was 0.00087 (Appendix SI), whichtranslates into a 1 in 1,153 chance of 2 siblings havingidentical genotypes and thus going undetected as 1bear. The expected heterozygosity of the Gobi bearwas 0.29, and this is close to the lowest valuesrecorded for any population of U. arctos in the world(Table 2).
Population estimateIn 2009, we captured 21 bears 48 total times (Table
3) and captured bears in all 5 sessions. The pattern ofnewly identified individuals by session was 3, 9, 2, 5,and 2 bears in sessions 1–5 respectively. The spreadof bear captures (least andmost) was 3 bears in session1 and 17 in session 4, suggesting the presence of varia-tion of the probability of detection across sessions.
The most supported Huggins closed model con-tained sex and session as additive covariates and wasthe only model with a ΔAICc ,2.0 (Table 4). Thismodel indicated sex-specific detection probabilitiesbut similar temporal patterns of capture probabilityacross sessions. There was minimal evidence of het-erogeneity variation as modelled by heterogeneitymixture models. Behavioral response models did notconverge, presumably because of sparse data. Ourmodel-averaged abundance estimate was 22 bears (8F and 14 M) with a 95% confidence interval of 21–29 (Table 5). Estimates of mean detection probabilitywere 0.27 (SE5 0.09, CI5 0.13–0.49) and 0.51 (SE5
0.063, CI 5 0.39–0.64) for female and male bears,respectively.
Fig. 2. Plot of mismatching genotypes betweenpaired individuals of sampled Gobi bears after theerror-checking process, Gobi Desert, Mongolia, 2009.The graph indicates that the closest 2 individualbears’ genotypes differ at 4 alleles, suggesting avery low probability of our data set containing a bearcreated through genotyping error.
Table 2. Genetic variability of Gobi bears relative toother Ursus arctos bears.
Study area HeterozygosityNo. of
alleles/locus
Pyrenees Mountains, Spaina 0.25 1.7Gobi 0.29 1.9Kodiak Island, Alaskab 0.30 2.1Pakistanc 0.49 3.3Yellowstone, USAd 0.56 4.9S Selkirks, Canadae 0.54 4.3Scandinavia, Europef 0.66 5.8Southern Canadab 0.68 6.4Northern Canadab 0.78 7.4aTaberlet et al. (1997).bPaetkau et al. (1998b).cBellemain et al. (2007).dProctor et al. (2005).eMiller and Waits (2003).fWaits et al. (2000).
134 GOBI BEAR POPULATION SURVEY N Tumendemberel et al.
Ursus 26(2):129–142 (2015)

Spatial capture resultsDNA from hair samples of Gobi bears was col-
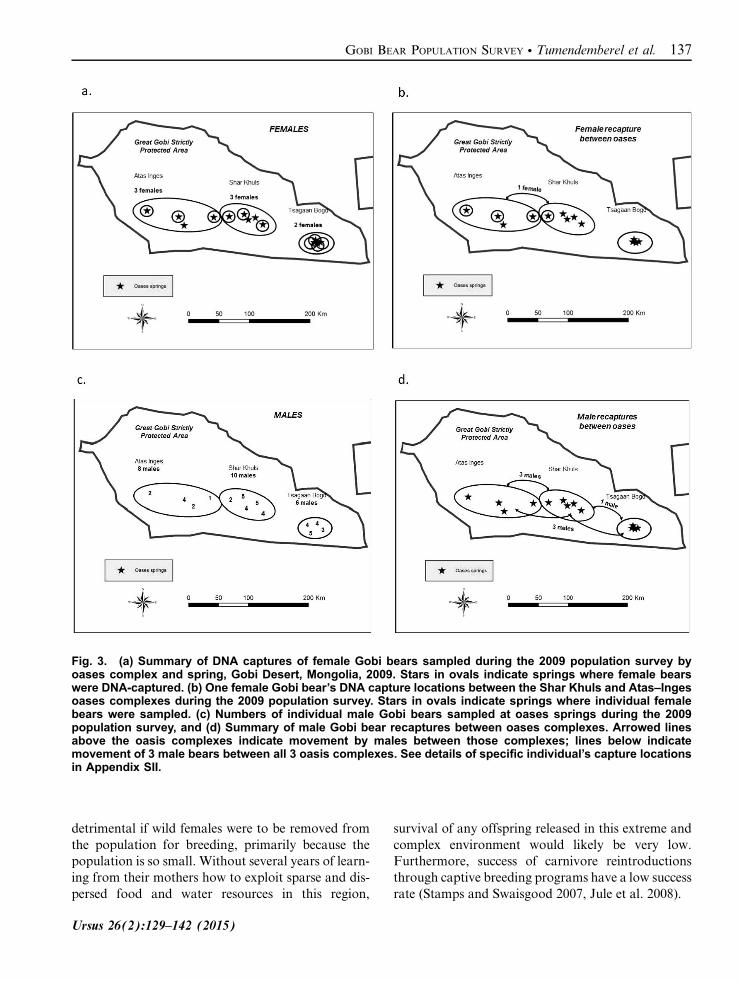
lected at all sampled springs within the 3 oases com-plexes. Eight males and 3 females were sampled at4 springs within the Atas–Inges oasis complex. Tenmales and 3 females were sampled within 5 springswithin the Shar Khuls oasis complex and 6 malesand 2 females were sampled at 4 springs within theTsagaan Bogd complex (Fig. 3). Females weresampled from 10 of 13 springs and at all 3 oases com-plexes (Fig. 3a). DNA from a single individual femalewas captured at springs within both the Atas–Ingesand Shar Khuls complexes, confirming female move-ment between the complexes (Fig. 3b). Multiple maleswere captured at all sampling sites except one springwith only one capture (Fig. 3c). Three males were cap-tured at both Atas–Inges and Shar Khuls oases com-plexes (Fig. 3d). One male was captured at SharKhuls and Tsagaan Bogd complexes (Fig. 3d). Threemales were captured at all 3 oases complexes (Fig.3d). We found no clustering using the Genetix Pro-gram of individuals based on capture location withinoases complexes (Fig. 4), which indicates little breed-ing fidelity within any one oasis complex.
DiscussionThis survey is the first rigorous data-based popula-
tion estimate of the Gobi bear. Our estimate of 21–29bears makes the Gobi bears of Mongolia one of thesmallest isolated U. arctos populations in the world.The low genetic diversity corroborates observationsby GGSPA personnel that this population is totallyisolated from other U. arctos bears. The combinationof very low numbers and the population’s isolationconfirm that this population is at risk of extirpation.These results informed a recommendation that thispopulation be considered Critically Endangered by arecent assessment using the IUCN Red List Criteriaat Regional and National Levels (IUCN 2012).
Gobi bears may live in one of the most extremedesert environments of any U. arctos population onearth (Schaller et al. 1993). This northern (43u lati-tude), high-elevation (800–2,700 m) desert experiencesextreme heat (+45uC), cold (−35uC), and dryness with,100–200 mm of precipitation annually. As such,Gobi bears may retain important genetic variation(from a global perspective) related to their ability tosurvive in the harsh environmental conditions pres‐ently existing in the Gobi Desert. Also, they haveone of the lowest recorded levels of genetic diversityin bear populations in the world. However, actualissues related to inbreeding depression in wild bearpopulations have been rare. On-site examinations byexperienced veterinarian specialists from Mongoliaand North America are planned in the near future toassess the potential of reproductive issues that mightcontribute to any inbreeding depression.
Population size is one of the most powerful predic-tors of persistence (Berger 1990, Shaffer et al. 2000,Reed et al. 2003). Populations with fewer than 50–100 adults are at high risk of extirpation (IUCN
Table 3. Recapture summary for males (M), females(F), and both sexes of Gobi bears sampled in 2009 inthe Gobi Desert of Mongolia. 16 indicates the num-ber of bears captured 1 time, 26 indicates the num-ber of bears identified 2 times, etc.
M F Both sexes
Bears identified 14 7 21Captures 37 12 4816 2 3 526 4 3 836 6 1 646 1 0 156 1 0 1
Table 4. Model-selection results of Huggins closed models to estimate population size of Gobi bears, GobiDesert, Mongolia, 2009. Small-sample-size–corrected Akaike Information Criteria (AICc), the difference in AICc
values between the ith model and the model with the lowest AICc value (ΔAICc), Akaike weights (wi), and numberof parameters (K) are presented.
Model AICc ΔAICc wi K Deviance Model likelihood
p(sexa + bsession) 128.95 0.00 0.76 6 93.48 1p(session) 131.61 2.66 0.20 5 98.39 0.2642p(sex * bsession) 134.80 5.85 0.04 10 89.85 0.0535p(sex) 142.87 13.92 0.00 2 116.14 0.0009p(.) 145.05 16.11 0.00 1 120.40 0.0003Πc
i(.) ⊖c1&⊖2(.) 148.35 19.40 0.00 3 119.50 0.0001
πi(sex) ⊖1&⊖2 (sex) 151.12 22.17 0.00 6 115.65 0a“Sex” indicates sex-specific detection probability.b“*” indicates an interaction effect and a + denotes an additive effect.c“π” and “⊖1&⊖2” indicate heterogeneity mixture models.
GOBI BEAR POPULATION SURVEY N Tumendemberel et al. 135
Ursus 26(2):129–142 (2015)

2012); therefore, the Gobi bear’s long-term prospectsrepresent a challenge and are likely dependent oninformed and effective management. U. arctos is aspecies characterized by long lives (20–30 yr) andslow reproductive rates (Miller 1990); therefore, thereis time to implement management to avoid extirpa-tion. Several management strategies are already inplace, including the supplemental feeding program.We do not review a comprehensive list of manage-ment recommendations here, except to mention theneed for a long-term strategy to increase the numberof bears. In that regard, we have no evidence that cur-rent bear numbers represent the ecological carryingcapacity for the occupied habitat. However, in theabsence of evidence for excessive human-caused mor-tality, it is possible these bears are near or at carryingcapacity in their occupied range. Therefore, we do notknow whether efforts to increase bear numbers withinthe existing occupied habitat would be successful. Wesuggest that consideration be given to the idea thatbear numbers be increased through expanding theircurrent range, either by extending their current occu-pied habitat or by establishment of a second nearbypopulation (possibly to the pre-1970 distribution)that might be connected through occasional move-ments, or both. We have a limited understanding ofthe history of the isolation of this population (Batsai-khan et al. 2004) except from reports by GGSPA ran-gers that bears occupied potentially 2 adjacentmountain ranges (within 100 km) as late as the1960–1970s (McCarthy et al. 2009). The persistenceof this small isolated population would be enhancedby the presence of a second, nearby population, simi-lar to the small Deosai populations in the HimalayanMountains of Pakistan, where inter-area movementsenhance their genetic and demographic health(Nawaz et al. 2008). In the case of the Gobi bear, nat-ural connectivity with current populations in north-ern and western Mongolia is highly unlikely because
of the great distances involved (hundreds of km).Efforts to establish a second adjacent populationwould have to overcome several obstacles. A secondnearby population may have the potential to bestarted through natural dispersal, or even populationaugmentation or re-colonization from an outsidesource. Because local habitats are extreme, augmen-tation from another source population raises thequestion of potential negative effects of outbreeding(Tallman et al. 2004). To avoid that issue, we recom-mend that priority consideration be given to man‐aging for increased bear numbers within the GGSPAby expanding their occupied range and studying thepotential for the establishment of a movement corri-dor to adjacent suitable habitat to encourage naturalor assisted dispersal for establishment of a secondpopulation. We also recommend that the Gobi bearsbe assessed for evidence of inbreeding depression (asmentioned previously), and if it is found, some formof genetic augmentation be considered (Hogg et al.2006). The trade-offs between inbreeding and out-breeding effects would need to be weighed (Tallmanet al. 2004).
Whereas we likely captured almost the entire popu-lation that uses the sampled oases complexes, ourbest-supported model suggested that there was a dif-ference in the capture probabilities between the sexes.This pattern was also evident in the difference in thenumber of samples per individual, on average,between males and females. Less encouraging wasthe fact that in 2008 and 2009 we captured only 8females, which suggests there may be fewer than 10females in the population. Populations with this fewnumber of females likely face threats from stochastic(chance) demographic events (e.g., disease, low pro-ductivity) and the potential effects of inbreeding.However, observations from remote cameras and cap-ture efforts for radiocollaring from our larger projecton these bears indicate that reproduction is occurring.Direct observation of successful reproduction wasobserved within the population by research personnel(12 observed offspring over 10 yr; O. Tumendemberel,personal observation). Furthermore, we surmise thatsurvival in this extreme environment is complex andchallenging. Captive breeding efforts to augment thispopulation likely will not be effective because bearsoften spend 2–4 years with their mothers learninghabitat necessities (including locations of importantfood patches and water sources, and survival mechan-isms in human encounters), particularly in less pro-ductive ecosystems (Nawaz et al. 2008). It would be
Table 5. Model-averaged abundance estimates(weighted by Akaike wt) for the Gobi bear, Gobi Desert,Mongolia, 2009. Estimates are based on models listedin Table 4.
Sex Estimate SEa mt + 1b CIc low CI high CVd
F 8 1.41 7 7 15 17.8%M 14 0.53 14 14 17 3.7%Total 22 1.50 21 21 29 6.8%aSE is standard error.bmt + 1 is the no. of animals sampled.cCI is confidence interval.dCV is coefficient of variation.
136 GOBI BEAR POPULATION SURVEY N Tumendemberel et al.
Ursus 26(2):129–142 (2015)
detrimental if wild females were to be removed fromthe population for breeding, primarily because thepopulation is so small. Without several years of learn-ing from their mothers how to exploit sparse and dis-persed food and water resources in this region,
survival of any offspring released in this extreme andcomplex environment would likely be very low.Furthermore, success of carnivore reintroductionsthrough captive breeding programs have a low successrate (Stamps and Swaisgood 2007, Jule et al. 2008).
Fig. 3. (a) Summary of DNA captures of female Gobi bears sampled during the 2009 population survey byoases complex and spring, Gobi Desert, Mongolia, 2009. Stars in ovals indicate springs where female bearswere DNA-captured. (b) One female Gobi bear’s DNA capture locations between the Shar Khuls and Atas–Ingesoases complexes during the 2009 population survey. Stars in ovals indicate springs where individual femalebears were sampled. (c) Numbers of individual male Gobi bears sampled at oases springs during the 2009population survey, and (d) Summary of male Gobi bear recaptures between oases complexes. Arrowed linesabove the oasis complexes indicate movement by males between those complexes; lines below indicatemovement of 3 male bears between all 3 oasis complexes. See details of specific individual’s capture locationsin Appendix SII.
GOBI BEAR POPULATION SURVEY N Tumendemberel et al. 137
Ursus 26(2):129–142 (2015)

Our capture probability and recapture rate wasrelatively high for a DNA-based mark–recapturestudy on bears (Boulanger et al. 2002, Mowat et al.2005, Proctor et al. 2010), despite substantial varia-tion in capture probability across sessions andbetween the sexes. Our support-weighted model-aver-aged abundance estimate alleviates potential issuesconcerned with model selection bias, providing confi-dence that our estimate likely is an accurate reflectionof the number of Gobi bears using the oases.
There are several potential scenarios that may havecontributed to a negative bias (low estimate) in ourpopulation estimate. First, the possibility exists thatwe did have 2 bears (potential siblings) with identicalgenotypes that we considered as 1 bear. If this werethe case, it would mean our estimate was biased low,by$1 bear. However, the highest Psib value indicatesthis probability was very small at 1 in 1,157 indivi-duals. Second, males may have a higher capture prob-ability for various reasons, including that they mayexclude females from using the supplemental feeders(Nevin and Gilbert 2005); thus, there may be morefemales in the population than we sampled. Our esti-mate of detection probabilities for females was 0.27compared with 0.51 for males, potentially suggestingthat exclusion or potential differences in movementsof males and females created lower detection ratesfor females. Our GPS telemetry data, however, donot support this hypothesis because we have no evi-dence of males spending long periods of time at thefeeder-sampling sites (H. Reynolds, unpublisheddata). Males, on average, left more samples than did
females across 18 DNA surveys reported in Proctoret al. (2012), but the average mean difference wasnot as extreme as we found in this project. To furthertest whether males were excluding females from feed-ing sites (and thus, sampling sites), we recommendthat future surveys provide secondary supplementalfeeders with DNA sampling stations at several feed‐ers, to reduce the possibility of female exclusion bymales. By modelling sex-specific detection rates, wereduced heterogeneity bias in our population estimatedue to differential detection rates, particularly giventhat heterogeneity bias is minimal when detectionrates are high (Pollock et al. 1990). Third, a positivebehavioral response could result in an overestimateof detection probabilities and a resulting negativebias in estimates. This scenario is unlikely becausethe feeders were in place long before our studyoccurred and therefore any change in detection prob-ability after initial detection would have occurredwhen the feeders first were in place. The main sourceof variation in this case would be heterogeneity varia-tion as previously discussed. Finally, it is possible thata few bears did not visit the water sources we sampled.Our study area is large and complex, and the possibi-lity exists that an unsampled small spring exists thatpotentially could support a small number of bears.
Regarding a potential positive bias of our estimate,the 2 closest genotypes between individuals had 4 mis-matches (genotypes were similar except at 4 alleles),providing evidence that we likely had no false indivi-duals in our final data set. The other potential influ-ence of male dominance at feeder stations is thatsome females may have been recaptured less becauseof exclusion (also discussed above as a negative biasif any females were excluded totally). However, wesampled 21 individuals and our estimate was 22bears, which did not leave much room for our esti-mate to be positively biased. Although these smallbiases are certainly possibilities, they do not changeour overall conclusion that there are likely fewerthan 40 bears in the GGSPA using these oases com-plexes, rather than 60 or 100 bears.
There are several methods available for error-checking genotyping results (multiple tubes, Taberletet al. [1997]: or systems combining multiple tubesand methods of Paetkau [2003], e.g., Schwartz et al.[2006]) and all are aimed at reducing biases in popula-tion estimates (Roon et al. 2005). The method weused, as detailed in Paetkau (2003), has been shownto be very effective in reducing errors to a trivial level(Kendall et al. 2009), while being very cost-effective.
Fig. 4. Genetix plot demonstrating the lack ofclustering of individual Gobi bear genotypes betweenany oases complex, Gobi Desert, Mongolia, 2009.These results indicate no breeding fidelity with anyone oases complex. Plot is based on 22 individualsand 12 microsatellites.
138 GOBI BEAR POPULATION SURVEY N Tumendemberel et al.
Ursus 26(2):129–142 (2015)

This final point is particularly important for projectsconducted in areas of the world where resources forwildlife research are scarce and efficient methods area necessity.
We captured females and males at multiple springsand across oases complexes within the GGSPA. Ourrelatively high recapture rate allowed us to gaininsights into the spatial use of the study area by bothsexes, particularly the use of springs across severaloases complexes by several individuals. This inter-oases use provides solid support to explain our resultof no internal genetic structure within the Gobi bearsbetween oases complexes. We conclude that inter-oases breeding was very likely occurring. These resultssuggest that management efforts to move bearsbetween oases to enhance inter-oases geneflow wouldbe unnecessary. Furthermore, 2 males were capturedat oases that were approximately 280 km apart. OurGPS radiocollar data will provide a more detailedexamination of home range size, but based on the pat-tern of DNA captures, the home ranges of severalmales will likely be in the range of 3,000–6,000 km2.Home ranges of this size are consistent with ecosys-tems of low productivity (McLoughlin et al. 2000).
This project was designed to be integral to theongoing Gobi Bear Project efforts to assess factorsthat may limit population size and distribution ofGobi bears. Included in these efforts are data col-lected by GPS telemetry, capture and examinationof bears, diet analyses using scat to identify thebreadth of forage items and identify key foods, asses-sing habitat use, mapping of important habitat areasincluding foraging areas and movement corridors,and determining other critical habitat requirements.Also, the GPS information can provide informationon the relative time spent by individual bears at sup-plemental feeding stations, their frequency of use ofsprings and the habitat at oases complexes, and theamount of time bears go between spring visits forwater intake.
Conservation implicationsWe also recommend that continued population
monitoring be implemented. DNA-based monitoringefforts have been applied to brown bears in otherstudies (Boulanger et al. 2004) and are underway onother small threatened populations in other locationsaround the world (DeBarba et al. 2010). This effortmay take 1 of 2 forms. The first is annual samplingwith relatively low effort—because the DNA sites
are somewhat permanent fixtures around feeding sitesat oases springs, and rangers visit regularly, collectingsamples would be relatively efficient. Combined withthe use of remote cameras (also already deployed),additions of new individuals to the populationcould be monitored. A database of all genotypes ofindividual bears would allow documentation of newadditions to the population (births) through identifi-cation of new genotypes. The disadvantage of thisoption is that it may be expensive to run many geno-types annually, to detect only a few new individuals.If the genotyping were done within a lab in Mongolia,that cost would be reduced. The second approachwould entail a repetition of the full survey every 5–10 years. The disadvantage of this approach is thatdetecting a trend would be challenging because confi-dence intervals tend to overlap unless there are dra-matic declines or increases in population size(Boulanger et al. 2003). However, in the absence ofsignificant trend results, periodic abundance estimatescan be informative, new individuals can be discov-ered, and lab costs could be amortized over the inter-val between surveys.
The conservation issues facing the Gobi bear popu-lation may be similar to other small, South Asian, iso-lated bear populations, including other species. Issuesconcerning establishment of a second nearby popula-tion will be ecologically, socially, and politically chal-lenging to overcome in the Gobi and in otherlocations where such action may be relevant. In somecases, establishing inter-population connectivity to aneighboring population to promote demographic andgenetic exchange may be possible where recent frag-mentation might be reversed through management.However, in some cases, distances separating popula-tionsmay be too far for this option towork. In additionto targeted management to reduce human-caused mor-tality, efforts tomaintain or enhance food supplies mayalso be beneficial and establishment of a second nearbypopulation may provide the best complementaryoption for long-term persistence. Different spatial con-figurations of isolated populations will likely requiresituation-specific solutions, including considerationfor factors such as genetic and ecological similaritiesof source populations, the presence of available andsuitable habitat to contain an additional population,social and political will for such endeavors, and thepracticality of potentially moving bears between coun-tries if required. Our study inferences cannot provideanswers to all these questions, but highlight the needfor their consideration in cases of small isolated
GOBI BEAR POPULATION SURVEY N Tumendemberel et al. 139
Ursus 26(2):129–142 (2015)

populations with little hope of natural connectivitywith an adjacent population. The first step in assessingthe need for any conservation actions is to determinepopulation status (i.e., abundance, distribution, con-nectivity) as this project has done. Of course, an ecolo-gical and demographic understanding (diet, habitatuse, mortality patterns) of any population under con-sideration will also be very useful, and our largerresearch effort is designed to gather that information.
AcknowledgmentsWe would like to thank the Mongolian Ministry of
Environment, Green Development and Tourism fortheir cooperation and support in this project. Wealso thank the Mongolian Academy of Science Insti-tute of General and Experimental Biology and theUnited Nations Development Program for theirfinancial, personnel, and logistical support. Weappreciate and would like to acknowledge the partici-pants’ field work (site set-up and hair collection),including B. Mijiddorj, E. Erdenekhuu, A. Buysentse-teg, B. Maamba, S-O. Shar, H. Tsagdar, and the lateD. Sharav. In addition to the substantial financialand in-kind project support provided by Gobi BearProject team members and the Institute for Conserva-tion Research of the San Diego Zoo, we receivedfinancial support from The Charles Engelhard Foun-dation, the International Association for BearResearch and Management, the Calgary Zoo, andWildlife Genetics International. We also thank theUrsus Associate Editor, F. van Manen, and themanuscript reviewers for their suggestions, whichimproved this manuscript.
Literature citedAMBARLI, H. 2012. Population status and conservation of
brown bears in Turkey. Presentation in the Session ofAsian Bears, 21st IBA Conference, New Delhi, India,2012.
ARYAL, A., S. SATHYAKUMAR, AND C.C. SCHWARTZ. 2010.Current status of brown bears in the Manasalu Conser-vation Area, Nepal. Ursus 21:109–114.
BATSAIKHAN, N., B. MIJIDDORJ, S. BOLDBAATAR, AND T.AMGALAN. 2004. Survey of Gobi bear (Ursus arctosgobiensis) in Great Gobi ‘A’ Strictly Protected Area in2004. Mongolian Journal of Biological Sciences 2:55-60.
BELKHIR, K. 1999. GENETIX, v.4. 0. Laboratoire génome,populations, interactions. Centre National de laRecherche Scientifique (National Center for ScientificResearch) unités propres de recherche, UniversitéMontpelier, France.
BELLEMAIN, E., M.A. NAWAZ, A. VALENTINI, J.E. SWENSON,AND P. TABERLET. 2007. Genetic tracking of the brownbear in northern Pakistan and implications for conserva-tion. Biological Conservation 134:537–547.
———, AND P. TABERLET. 2004. Improved noninvasivegenotyping method: Application to brown bear (Ursusarctos) faeces. Molecular Ecology 4:519–522.
BENZECRI, J.P. 1973. L’analysis des donnees, tome II l’anal-sye des correspondences. Dunod, Paris, France. [InFrench.]
BERGER, J. 1990. Persistence of different-sized populations:An empirical assessment of rapid extinctions in bighornsheep. Conservation Biology 4:91–98.
BOULANGER, J., C. APPS, B. MCLELLAN, AND A.N. HAMIL-
TON. 2003. Development of quantitative tools to predictand monitor grizzly bear population response to land-scape change. (FII Project R02-36). Annual operationreport for 2002–2003. British Columbia Ministry ofEnvironment, Victoria, British Columbia, Canada.http://www.for.gov.bc.ca/hfd/library/FIA/2003/FSP_R02-36.pdf. Accessed 13 Sep 2005.
———, S. HIMMER, AND C. SWAN. 2004. Monitoring ofgrizzly bear population trend and demography usingDNA mark–recapture methods in the Owikeno Lakearea of British Columbia. Canadian Journal of Zoology82:1267–1277.
———, G.C. WHITE, B.N. MCLELLAN, J. WOODS, M. PROC-
TOR, AND S. HIMMER. 2002. A meta-analysis of grizzlybear DNA mark–recapture projects in British Colum-bia, Canada. Ursus 13:137–152.
BREEN, M., S. JOUQUAND, C. RENIER, C.S. MELLERSH, C.HITTE, N.G. HOLMES, A. CHERON, N. SUTER, F. VIGNAUX,A.E. BRISTOW, C. PRIAT, E. MCCANN, C. ANDRE, S.BOUNDY, P. GITSHAM, R. THOMAS, W.L. BRIDGE, H.F.SPRIGGS, E.J. RYDER, A. CURSON, J. SAMPSON, E.A.OSTRANDER, M.M. BINNS, AND F. GALIBERT. 2001. Chro-mosome-specific single locus FISHprobes allow anchorageof an 1,800 marker integrated radiation-hybrid/linkagemap of the domestic dog (Canis familiaris) genome to allchromosomes. Genome Research 11:1784–1796.
BURNHAM, K.P., ANDD.R. ANDERSON. 1998.Model selectionand inference: A practical information- theoreticapproach. Springer-Verlag, New York, NewYork, USA.
CAN, Ö.E., AND İ. TOGAN. 2004. Status and management ofbrown bears in Turkey. Ursus 15:48–53.
CLARK, E.L., J. MUNKHBAT, S. DULAMTSEREN, J.E.M. BAIL-
LIE, N. BATSAIKHAN, S.R.B. KING, R. SAMIYA, AND M.STUBBE, compilers and editors. 2006. Summary conser-vation action plans for Mongolian mammals. Regionalred list series. Volume 2. Zoological Society of London,London, England, UK. [In English and Mongolian.]http://static.zsl.org/files/mongolianactionplan-mammals-699.pdf. Accessed 12 Jan 2010.
DEBARBA, M., L.P. WAITS, E.O. GARTON, P. GENOVESI, E.RANDI, A. MUSTONI, AND C. GROFF. 2010. The powerof genetic monitoring for studying demography, ecology
140 GOBI BEAR POPULATION SURVEY N Tumendemberel et al.
Ursus 26(2):129–142 (2015)

and genetics of a reintroduced brown bear population.Molecular Ecology 19:3938–3951.
EFFORD, M. 2004. Density estimation in live-trappingstudies. Oikos 106:598–610.
ENNIS, S., AND T.F. GALLAGHER. 1994. PCR based sex-determination assay in cattle based on the bovine amelo-genin locus. Animal Genetics 25:425–427.
HOGG, J.T., S.H. FORBES, B.M. STEELE, AND G. LUIKART.2006. Genetic rescue of an insular population of largemammals. Proceeding of the Royal Society of London,Series B: Biological Sciences 273:1491–1499.
HUGGINS, R.M. 1991. Some practical aspects of a condi-tional likelihood approach to capture experiments. Bio-metrics 47:725–732.
INTERNATIONAL UNION FOR CONSERVATION OF NATURE
[IUCN]. 2012. Guidelines for application of IUCN redlist criteria at regional and national levels: Version 4.0.IUCN Species Survival Commission—The World Con-servation Union, Gland, Switzerland; and Cambridge,England, UK.
———, 2015. Red list of threatened species. InternationalUnion for Conservation of Nature, The World Conser-vation Union, Gland, Switzerland. http://www.iucnredlist.org/details/41688/0. Accessed 1 Jan 2015.
JULE, K.R., L.A. LEAVER, AND S.E.G. LEA. 2008. Theeffects of captive experience on reintroduction survivalin carnivores: A review and synthesis. Biological Conser-vation 141:355–363.
KENDALL, K.C., J.B. STETZ, J.B. BOULANGER, A.C.MACLEOD, D. PAETKAU, AND G.C. WHITE. 2009. Demo-graphy and genetic structure of a recovering grizzly bearpopulation. Journal of Wildlife Management 73:3–17.
MCCARTHY, T.M., L.P. WAITS, AND B. MIJIDDORJ. 2009.Status of the Gobi bear in Mongolia as determined bynoninvasive methods. Ursus 20:30–38.
MCLOUGHLIN, P.D., S.H. FERGUSON, AND F.O. MESSIER.2000. Interspecific variation in home range overlapwith habitat quality: A comparison among brown bearpopulations. Evolutionary Ecology 14:39–60.
MILLER, C.R., AND L.P. WAITS. 2003. The history of effectivepopulation size and genetic diversity in the Yellowstonegrizzly (Ursus arctos): Implication for conservation. Pro-ceedings of the National Academy of Sciences 100:4334–4339.
MILLER, S. 1990. Population management of bears in NorthAmerica. International Conference on Bear Researchand Management 8:357–373.
MOWAT, G., D.C. HEARD, D.R. SEIP, K.G. POOLE, G. STEN-
HOUSE, AND D.W. PAETKAU. 2005. Grizzly Ursus arctosand black bear U. americanus densities in the interiormountains of North America. Wildlife Biology 11:31–48.
NAWAZ, M.A., J.E. SWENON, AND V. ZAKARIA 2008. Prag-matic management increases a flagship species, theHimalayan brown bears, in Pakistan’s Deosia NationalPark. Biological Conservation 141:2230–2241.
NEVIN, O.T., AND B.K. GILBERT. 2005. Measuring the costof risk avoidance in brown bears: Further evidence ofpositive impacts of ecotourism. Biological Conservation123:452–460.
OSTRANDER, E.A., G.F. SPRAGUE, AND J. RHINE. 1993. Iden-tification and characterization of dinucleotide repeat(CA)n markers for genetic mapping in dog. Genomics16:207–213.
PAETKAU, D. 2003. An empirical exploration of data qualityin DNA-based population inventories. Molecular Ecol-ogy 12:1375–1387.
———, G.F. SHIELDS, AND C. STROBECK. 1998a. Gene flowbetween insular, coastal and interior populationsof brown bears in Alaska. Molecular Ecology 7:1283–1292.
———, L.P. WAITS, P.L. CLARKSON, L. CRAIGHEAD, E.VYSE, R. WARD, AND C. STROBECK. 1998b. Variation ingenetic diversity across the range of North Americanbrown bears. Conservation Biology 12:418–429.
PLEDGER, S. 2000. Unified maximum likelihood estimatesfor closed capture–recapture models using mixtures.Biometrics 56:463–442.
POLLOCK, K.H., J.D. NICHOLS, C. BROWNIE, AND J.E. HINES.1990. Statistical inference for capture–recapture experi-ments. Wildlife Monographs 107.
PROCTOR, M., B. MCLELLAN, J. BOULANGER, C. APPS, G.MOWAT, D. PAETKAU, AND G. STENHOUSE. 2010. Ecologi-cal investigations of Canadian grizzly bears using hair-snagged DNA, 1995–2005. Ursus 21:169–188.
———,———, AND C. STROBECK. 2002. Population frag-mentation of grizzly bears in southeastern BritishColumbia, Canada. Ursus 15:153–160.
———,———,———, AND R.M.R. BARCLAY. 2005.Genetic analysis reveals demographic fragmentation ofgrizzly bears yielding vulnerably small populations. Pro-ceedings of the Royal Society, London 272:2409–2416.
———, D. PAETKAU, B.N. MCLELLAN, G.B. STENHOUSE, K.C. KENDALL, R.D. MACE, W.F. KASWORM, C. SERVH-
EEN, C.L. LAUSEN, M.L. GIBEAU, W.L. WAKKINEN, M.A. HAROLDSON, G.D. MOWAT, C.D. APPS, L.M. CIAR-
NIELLO, R.M.R. BARCLAY, M. BOYCE, C. STROBECK,AND C.C. SCHWARTZ. 2012. Population fragmentationand inter-ecosystem movements of grizzly bears inwestern Canada and the northern United States. Wild-life Monographs 180.
REED, D.H., J.J. O’GRADY, W. BROOK, J.D. BALLOU, AND
R. FRANKHAM. 2003. Estimates of minimum viablepopulation sizes for vertebrates and factors influencingthose estimates. Biological Conservation 113:23–34.
ROON, D.A., L.P. WAITS, AND K.C. KENDALL. 2005. Asimulation test of the effectiveness of several methodsfor error-checking non-invasive genetic data. AnimalConservation 8:203–215.
SATHYAKUMAR, S. 2006. The status of brown bears in India.Pages 7–11 in Understanding Asian bears to secure theirfuture. Japan Bear Network, Ibaraki, Japan.
GOBI BEAR POPULATION SURVEY N Tumendemberel et al. 141
Ursus 26(2):129–142 (2015)

SATO, Y., A.T. AOI, K.KAJI, AND S. TAATSUKI. 2004. Temporalchanges in population density and diet of brown bears ineastern Hokkaiko, Japan. Mammal Study 29:47–53.
———, AND M. ENDO. 2006. Relationship between crop useby brown bears and Quercus crispula acorn productionin Furano, central Hokkaido, Japan. Mammal Study31:93–104.
SCHALLER, G.B., R. TULGAT, AND B. NARANSTATSVALT. 1993.Observations of the Gobi bear in Mongolia. Pages 110–125 in I.E. Chestin and S.M. Uspensky, editors. Bears ofRussia and adjacent countries—State of populations. Pro-ceedings of the sixth conference of specialists studying bears.Volume 2. Central Forest Reserve, Tver Oblast, Russia.
SCHWARTZ, M.K., S.A. CUSHMAN, K.S. MCKELVEY, J. HAY-
DEN, AND C. ENGKJER. 2006. Detecting genotyping errorsand describing American black bear movement in north-ern Idaho. Ursus 17:138–148.
SHAFFER, M.L., L. HOOD, W.J.I. SNAPE, AND I. LATCHIS.2000. Population viability analysis and conservationpolicy. Pages 123-142 in S.R. Bessinger and D.R.McCullough, editors. Population viability analysis. Uni-versity of Chicago Press, Chicago, Illinois, USA.
SHE, J.E., M. AUTEM, G. KOTOULAS, N. PASTEUR, AND F.BONHOMME. 1987. Multivariate analysis of geneticexchanges between Solea aegyptiaca and Solea senega-lensis (Teleosts, Soleidae). Biological Journal of the Lin-nean Society 32:357–371.
STAMPS, J.A., AND R.R. SWAISGOOD. 2007. Someplace likehome: Experience, habitat selection and conservationbiology. Applied Animal Behavior Science 102:392–409.
TABERLET, P., J. CAMARRA, AND S. GRIFFIN. 1997. Noninva-sive genetic tracking of the endangered Pyrenean brownbear population. Molecular Ecology 6:869–876.
TALLMAN, D.A., G. LUIKART, AND R.S. WALPES. 2004. Thealluring simplicity and complex reality of genetic rescue.Trends in Ecology and Evolution 19:489–496.
WAITS, L., P. TABERLET, J.E. SWENSON, S.F. SANDEGREN,AND R. FRANZEN. 2000. Nuclear DNA microsatelliteanalysis of genetic diversity and gene flow in the Scandi-navian brown bear (Ursus arctos). Molecular Ecology9:421–431.
WHITE, G.C., AND K.P. BURNHAM. 1999. Program MARK:Survival estimation from populations of marked ani-mals. Bird Study Supplement 47:120–138.
———, ———, AND D.R. ANDERSEN. 2001. Advanced fea-tures of Program MARK. Pages 368–377 in R. Field, R.J. Warren, H. Okarma, and P.R. Seivert, editors. Wild-life, land, and people: Priorities for the 21st century.Proceedings of the second international wildlife manage-ment congress. The Wildlife Society, Bethesda, Mary-land, USA.
WOODS, J.G., D. PAETKAU, D. LEWIS, B.N. MCLELLAN, M.PROCTOR, AND C. STROBECK. 1999. Genetic tagging offree-ranging black and brown bears. Wildlife SocietyBulletin 27:616–627.
Received: 30 December 2014Accepted: 11 July 2015Associate Editor: van Manen
Supplemental material
Appendix I. Microsatellite genotype data for 22Gobi bears of Mongolia.
Appendix II. Summary of the number of maleGobi bears sampled during the 2009 populationsurvey, by oases complex and spring.
142 GOBI BEAR POPULATION SURVEY N Tumendemberel et al.
Ursus 26(2):129–142 (2015)