goffa: gene ontology for functional analysis – a fda gene ontology tool for analysis of genomic...
TRANSCRIPT

BioMed CentralBMC Bioinformatics
ss
Open AcceProceedingsGOFFA: Gene Ontology For Functional Analysis – A FDA Gene Ontology Tool for Analysis of Genomic and Proteomic DataHongmei Sun1, Hong Fang1, Tao Chen2, Roger Perkins1 and Weida Tong*2Address: 1Z-tech Corporation, 3900 NCTR Road, Jefferson, Arkansas, 72079 USA and 2National Center for Toxicological Research, Food and Drug Administration, 3900 NCTR Road, Jefferson, Arkansas, 72079 USA
Email: Hongmei Sun - [email protected]; Hong Fang - [email protected]; Tao Chen - [email protected] ; Roger Perkins - [email protected]; Weida Tong* - [email protected]
* Corresponding author
AbstractBackground: Gene Ontology (GO) characterizes and categorizes the functions of genes and theirproducts according to biological processes, molecular functions and cellular components,facilitating interpretation of data from high-throughput genomics and proteomics technologies. Themost effective use of GO information is achieved when its rich and hierarchical complexity isretained and the information is distilled to the biological functions that are most germane to thephenomenon being investigated.
Results: Here we present a FDA GO tool named Gene Ontology for Functional Analysis(GOFFA). GOFFA first ranks GO terms in the order of prevalence for a list of selected genes orproteins, and then it allows the user to interactively select GO terms according to their significanceand specific biological complexity within the hierarchical structure. GOFFA provides fiveinteractive functions (Tree view, Terms View, Genes View, GO Path and GO TreePrune) toanalyze the GO data. Among the five functions, GO Path and GO TreePrune are unique. The GOPath simultaneously displays the ranks that order GOFFA Tree Paths based on statistical analysis.The GO TreePrune provides a visual display of a reduced GO term set based on a user's statisticalcut-offs. Therefore, the GOFFA visual display can provide an intuitive depiction of the most likelyrelevant biological functions.
Conclusion: With GOFFA, the user can dynamically interact with the GO data to interpret geneexpression results in the context of biological plausibility, which can lead to new discoveries oridentify new hypotheses.
Availability: GOFFA is available through ArrayTrack software
http://edkb.fda.gov/webstart/arraytrack/.
BackgroundDNA microarray technology is a key application in phar-
maco- and toxicogenomics, a field identified in the U.S.Food and Drug Administration (FDA) Critical Path Initia-
from The Third Annual Conference of the MidSouth Computational Biology and Bioinformatics SocietyBaton Rouge, Louisiana. 2–4 March, 2006
Published: 26 September 2006
BMC Bioinformatics 2006, 7(Suppl 2):S23 doi:10.1186/1471-2105-7-S2-S23<supplement> <title> <p>3rd Annual MCBIOS Conference – Bioinformatics: A Calculated Discovery</p> </title> <editor>Jonathan D Wren (Senior Editor), Stephen Winters-Hilt, Yuriy Gusev, Andrey Ptitsyn</editor> <note>Proceedings</note> <url>http://www.mcbios.org</url> </supplement>
© 2006 Sun et al; licensee BioMed Central Ltd. This is an open access article distributed under the terms of the Creative Commons Attribution License (http://creativecommons.org/licenses/by/2.0), which permits unrestricted use, distribution, and reproduction in any medium, provided the original work is properly cited.
Page 1 of 11(page number not for citation purposes)

BMC Bioinformatics 2006, 7(Suppl 2):S23
tive http://www.fda.gov/oc/initiatives/criticalpath/ as amajor opportunity for advancing medical product devel-opment and personalized medicine. It is expected that thereview of microarray-based medical devices and micro-array data will become an essential regulatory responsibil-ity for the FDA. A single microarray experiment generatesa large volume of data and the management, analysis andinterpretation of this data challenge both sponsors and reg-ulatory reviewers. Realizing that the integration of thesethree essential components into one single applicationwill help to realize the full value of this exciting technol-ogy, FDA's National Center for ToxicologicalResearch(NCTR/FDA) developed ArrayTrack[1,2], a FDAfree bioinformatics resource providing an integrated solu-tion to manage, analyze, and interpret microarray dataand the extension to systems biology data. ArrayTrack hasbeen utilized by FDA for the review of genomic data sub-missions http://www.fda.gov/cder/guidance/6400fnl.pdf.
The primary emphasis of ArrayTrack is the direct linkingof analysis results with functional information for facili-tating the interaction between the choice of analysis meth-ods and the biological relevance of analysis results. Byselecting one of the analysis methods, the ArrayTrack usercan directly link analysis results with functional informa-tion such as biological pathways and gene ontology.GOFFA (Gene Ontology For Functional Analysis) is theprimary biological interpretation tool using Gene Ontol-ogy (GO) [3,4] in ArrayTrack.
GO contains a complex and rich information, posing achallenge in developing statistical and visualization toolsto effectively/efficiently utilize and present the informa-tion. Many approaches have been investigated to facilitateinterpretation of gene expression data using the GOresource [5-18]. Most freely available GO tools are docu-mented on the GO website http://www.geneontology.org/GO.tools.microarray. These tools are useful tobrowse and view the GO context when interpretinggenomic and proteomic data. However, some do not pro-vide text-annotated GO tree structures (e.g., GoSurfer1.1),or do not retain the fundamental GO hierarchical treestructure (e.g., GoStat, EASE, Onto-Express), or are onlymicroarray specific (e.g., Ontology Traverser), or has oper-ating system dependency limitation (e.g., GOSurfer1.1).Khatri et al [19], Zeeberg et al [3] and Zhang et al [10] didextensive comparisons of various GO-based tools.
Statistical analysis and visualization capabilities are themost important components of any GO tool. Statisticalanalysis is focused on determining the significant orenriched GO terms. The hypergeometric distribution[20,21], chi-square [22] and Fisher's exact test [5] are threemost commonly used enrichment methods. Recently, theRelative Enrichment Factor is also introduced by Zeeberg
et al [5]. Reducing GO information to a comprehendiblesubset based only on statistics alone is unsatisfactorywithout the aid of visualization. Thus, visualization of theGO hierarchy becomes another important part of thefunctionality for a useful GO tool. It is highly desirablethat a complex query can be directly made to the visuallydisplayed tree to fully integrate statistics and visualizationfor efficiently mining the GO data.
Here we report the GOFFA software that is designed to fur-ther the ability of utilizing GO for interpreting microarraydata. GOFFA provides most commonly used statisticalfunctions in an interactive and user-friendly environment.Two effective functions in particular, GO Path and GOTreePrune, were implemented in GOFFA. Unlike otherstatistical methods that consider each GO term separatelyby ignoring the hierarchical nature of GO in the enrich-ment analysis, GO Path identifies the significant termsbased on the GO hierarchical tree path using the Fisher'sinverse Chi-Squared method [23,24]. GO TreePrune is aninteractive tool providing statistical means to adjust andreduce the complexity of GO hierarchical tree informationin the form of the node-like visualization. As an integratedcomponent of ArrayTrack, GOFFA has been used in theFDA to interpret both genomic and proteomic data sub-mitted by the sponsors through the Voluntary GenomicsData Submission (VGDS) mechanism http://www.fda.gov/cder/genomics/VGDS.htm.
MethodsGOFFA's core programming is based on the client-servermodel. The client is written in JAVA, runs on platformswith the Java run-time environment 1.4 or higher. Theserver is ORACLE. GOFFA is an integrated component ofArrayTrack, but also can be operated as an independenttool. Figure 1 shows the program logical structure.
GOFFA DatabaseGOFFA uses an ORACLE database containing the GOproject data together with gene identifiers for human,mouse and rat from the NCBI Entrez gene database http://www.ncbi.nlm.nih.gov/entrez/query.fcgi?db=gene. Thedatabase currently contains 16,389 mouse, 11,934human and 11,599 rat genes. The genes from these threespecies can also be combined in analyses using the "cross-products" feature, where the same gene symbols fromhuman, mouse and rat (regardless of case) are consideredto share the same functional annotation in GO; in thiscase, the GOFFA database contains 26,564 unique genesymbols for cross species annotation.
GOFFA TreeData from the GO website are downloaded in a structurecalled a directed acyclic graph (DAG), a name that denotesan unclosed structure where a particular child node asso-
Page 2 of 11(page number not for citation purposes)

BMC Bioinformatics 2006, 7(Suppl 2):S23
ciated with a GO term can have multiple parent nodes.GOFFA converts the DAG structure to a tree structure byconstructing distinct paths from the highest parent node(least specific), successively down through progeny to thelowest (most specific) child node. In converting the data,GOFFA maintains the GO database's so-called true pathrule by assuring that a gene product GO term applicableto a child node also applies to all parent terms. Thus, dur-ing the conversion to a tree structure, the DAG structurefor each GO term can become many separate traversalsfrom highest parent to lowest child. Each such traversal inGOFFA is called a GOFFA Tree Path, and each node alonga GOFFA Tree Path is assigned a unique identificationcalled a GOFFA ID. Consequently, the same GO termoccurring in different GOFFA Tree Paths has a distinctGOFFA ID in each path. The restructuring of GO informa-tion in the GOFFA Tree Path format not only markedlyspeed up database queries but, most importantly, enabledeveloping two unique utilities, GO Path and GO TreeP-rune (more in Results).
Statistical AnalysisA fundamental step in analyzing DNA microarray data isto determine the differentially expressed genes (DEGs) forsubsequent biological interpretation. GOFFA appliesthree statistical approaches to determine the significantGO terms for a given list of DEGs, two previously reportedmethods and one novel approach:
• Fisher's Exact Test – A right-sided Fisher's Exact Testhttp://www.matforsk.no/ola/fisher.htm is used to esti-mate the statistical significance of GO term i. Four lists ofgenes are needed to calculate the significance (i.e., p-value): The number of inputted genes (M) [25], the subsetof M genes that belong to GO term i (mi), the set of refer-ence genes (N) and the subset of N genes that belong toGO term i (ni). The accuracy of p-value is largely depend-ent on the choice of the set of reference genes. There aretwo options in GOFFA to determine N, depending onwhether the genes derived from a known gene or not. Fora known microarray chip, N is the total number of genes
Schematic overview of GOFFA's data flowFigure 1Schematic overview of GOFFA's data flow. GO terms from the Gene Ontology project and gene identifiers from the Entrez Gene databases are combined and linked in the GOFFA database. Lists of genes or proteins from an experiment are analyzed by five functional modules, Tree View, Terms View, Genes View, GO Path and GO TreePrune.
Gene Ontology terms Entrez gene database
GOFFA
Tree View Terms View Genes View GO Path
A gene or protein list
GO TreePrune
GOFFA Database
Page 3 of 11(page number not for citation purposes)

BMC Bioinformatics 2006, 7(Suppl 2):S23
on the chip; in this case, p-value less than 0.01 normallyis indicative of a statistically significant finding. GOFFAprovides information associated with most commercialarray platforms, including most GeneChip platformsfrom Affymetrix, most one- and two-channel array plat-forms from Agilent, as well as numerous other array plat-forms such as those from GE HealthCare CodeLink,Illumina BeadArray, and Applied Biosystems arrays, etc. Ifthe microarray chip's genes are unknown, the totalnumber of genes in the GOFFA database is assigned as N.In this case, the choice of N is dependent on the selectedspecies, currently, 16,389 genes for mouse, 11,934 forhuman, 11,599 for rat, and 26,564 if combining all threespecies. Thus, the selection of N is an important factor tointerpret p-value.
• Relative Enrichment Factor – GOFFA also calculates theRelative Enrichment Factor (E) for assessing the signifi-cance of GO term i for a given list of DEGs [5]. The E-valueis calculated as:
E = (mi/M)/(ni/N) (1)
where mi, M, ni and N are defined the same as for Fisher'sExact Test described in the preceding paragraph. E pro-vides a direct measure of the prevalence of a GO term iamong the M significant genes compared to the preva-lence of the same GO term i among N total genes. Accord-ingly, E = 1.0 corresponds to GO term i occurring amongthe DEGs at the same prevalence as among the N totalgenes. E = 2.0 indicates that GO term i occurring in theDEGs two times more than occurring in the N total genes,indicating significant findings.
• GOFFA Tree Path Ranking – Criteria based on Fisher'sExact Test and/or Relative Enrichment Factor sometimesfail to sufficiently condense and clarify results for effectiveinterpretation, especially for large lists of significantgenes. This provided the motivation of developing thisunique function in GOFFA. The method applied theFisher's inverse Chi-Squared method [23,24] to sortGOFFA Tree Paths in accordance with their likely signifi-cance, and then renders an interactive graphic display forvisualization and interpretation. The Fisher's inverse Chi-Square method uses the fact that given a uniform distrib-uted p-value, -2log(p) has a chi-square distribution withtwo degrees of freedom, and hence the statistic
follows a chi-square distribution with 2K degrees of free-dom when the joint null is true. In our case, pk is theFisher's Exact Test probability value of GO term k and K isa total number of GO terms within the traverse of the
GOFFA Tree Path from the upper level of the tree down toGO term i. Thus, Ri is a relative metric of the prevalence ofa GOFFA Tree Path from the upper level to the level GOterm i belongs, given that the pk values are known for eachGO term on the path. The greater the value of Ri, the lesslikely it is that the significance of a GOFFA Tree Path is achance occurrence.
AvailabilityGOFFA is available through ArrayTrack software http://edkb.fda.gov/webstart/arraytrack/.
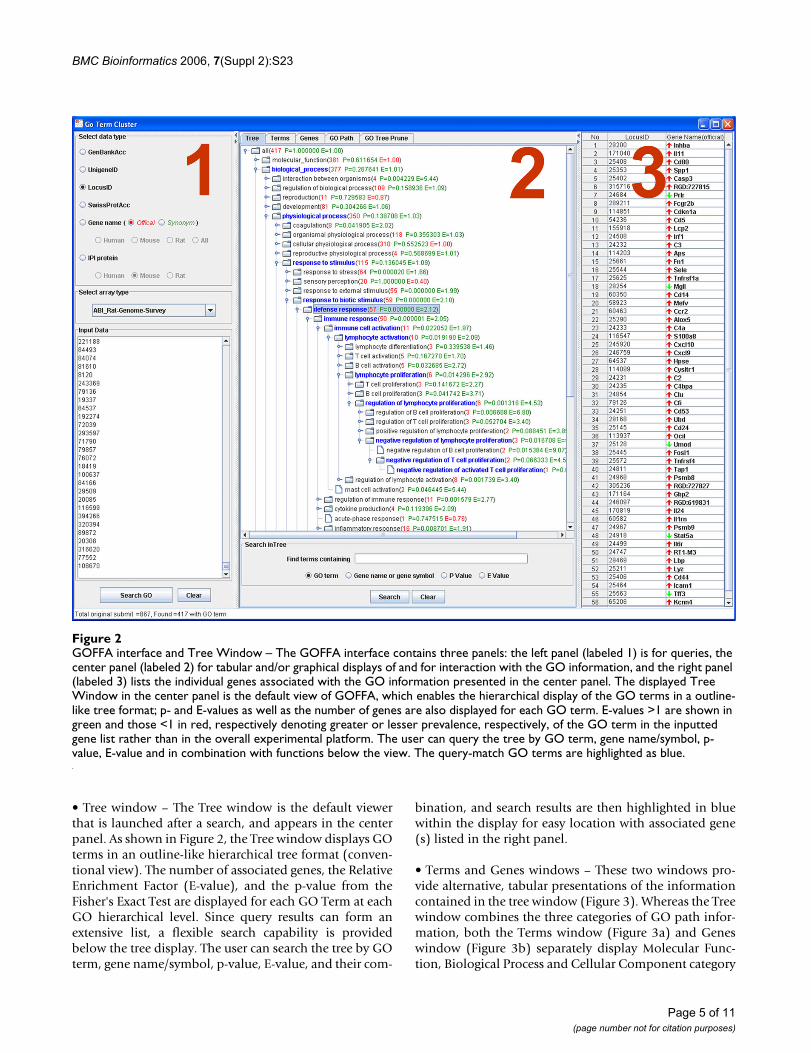
ResultsGOFFA FeaturesThe GOFFA's software GUI, shown in Figure 2, has threepanels with different functions that are designed for intu-itive and interactive use. The left panel (labeled 1) is forqueries, the center panel (labeled 2) for tabular and/orgraphical displays of and for interaction with the GOinformation, and the right panel (labeled 3) lists the indi-vidual genes associated with the GO information pre-sented in the center panel.
Queries are initiated in the left panel by pasting DEG ID'sinto the query window, one gene per line. The input geneID's must correspond to the "Select data type" option cho-sen by the user. Currently, GOFFA supports four types ofgene identifiers: (1) GenBank Accession number, (2) Uni-gene ID, (3) LocusLink ID (or Entrez Gene ID) and (4)Gene Name. In addition, GOFFA supports two proteinidentifiers, IPI ID (EBI International Protein Index data-base) and Swiss-Prot accession number for proteomicsdata analysis. The GOFFA database currently contains GOannotation data for 105 microarray platforms that, withthe "Select array type" option, is coupled with the GOanalysis and available for display. Query results are dis-played in the center panel in five interactive viewing win-dows, Tree, Terms, Genes, GO Path and GO TreePrune,that are activated with tabs at the top of the panel. Thesefive windows provide the means for applying and itera-tively re-applying statistical operators to the inputted(DEG) gene list, viewing statistical results, and viewingthe results of GOFFA's Tree, GO Path, and GO PruneTreeanalysis. The data and results within both tables and plotsare synchronized components, enabling mouse-click tog-gling between window views. For example, genes associ-ated with GO terms that are selected through mouse clicksin the GOFFA Tree (panel 2, Figure 2) are displayed as alist in the right panel (panel 3, Figure 2).
The user can toggle between the center panel's five win-dows (panel 2, Figure 2), providing another level of itera-tive interactivity. Each window either displaysinformation differently, or displays different informationrelated to the inputted genes:
R pi kk
K= − ( ) ( )
=∑ 2 2
1
log
Page 4 of 11(page number not for citation purposes)
BMC Bioinformatics 2006, 7(Suppl 2):S23
• Tree window – The Tree window is the default viewerthat is launched after a search, and appears in the centerpanel. As shown in Figure 2, the Tree window displays GOterms in an outline-like hierarchical tree format (conven-tional view). The number of associated genes, the RelativeEnrichment Factor (E-value), and the p-value from theFisher's Exact Test are displayed for each GO Term at eachGO hierarchical level. Since query results can form anextensive list, a flexible search capability is providedbelow the tree display. The user can search the tree by GOterm, gene name/symbol, p-value, E-value, and their com-
bination, and search results are then highlighted in bluewithin the display for easy location with associated gene(s) listed in the right panel.
• Terms and Genes windows – These two windows pro-vide alternative, tabular presentations of the informationcontained in the tree window (Figure 3). Whereas the Treewindow combines the three categories of GO path infor-mation, both the Terms window (Figure 3a) and Geneswindow (Figure 3b) separately display Molecular Func-tion, Biological Process and Cellular Component category
GOFFA interface and Tree Window – The GOFFA interface contains three panels: the left panel (labeled 1) is for queries, the center panel (labeled 2) for tabular and/or graphical displays of and for interaction with the GO information, and the right panel (labeled 3) lists the individual genes associated with the GO information presented in the center panelFigure 2GOFFA interface and Tree Window – The GOFFA interface contains three panels: the left panel (labeled 1) is for queries, the center panel (labeled 2) for tabular and/or graphical displays of and for interaction with the GO information, and the right panel (labeled 3) lists the individual genes associated with the GO information presented in the center panel. The displayed Tree Window in the center panel is the default view of GOFFA, which enables the hierarchical display of the GO terms in a outline-like tree format; p- and E-values as well as the number of genes are also displayed for each GO term. E-values >1 are shown in green and those <1 in red, respectively denoting greater or lesser prevalence, respectively, of the GO term in the inputted gene list rather than in the overall experimental platform. The user can query the tree by GO term, gene name/symbol, p-value, E-value and in combination with functions below the view. The query-match GO terms are highlighted as blue.
Page 5 of 11(page number not for citation purposes)

BMC Bioinformatics 2006, 7(Suppl 2):S23
information, as chosen with a tab, and presents it in anexcel-like spreadsheet format. As indicated by theirnames, the Terms window aggregates information by indi-vidual GO term, whereas the Genes window aggregatesinformation by individual gene. Both windows displayresults of statistical operators (p-value and E-value). TheTerms window displays the number of significant genesassociated with each GO term, as well as the average hier-archical level at which the gene appears in the GO term.Tables in both windows can be sorted in either ascendingor descending order of any column, and can be cut andpasted or exported to external software for further analy-sis.
• GO Path window – The GOFFA GO Path plot (Figure 4)visually presents the GOFFA Tree Paths estimated as themost relevant by equation 2. The GOFFA algorithm firstrank-orders all GOFFA Tree Paths using equation 2 values,and then plots the 10 paths with the highest values, withthe X-axis corresponding to descending hierarchical treelevel, and the Y-axis corresponding to the log p value ateach hierarchical level (Figure 4). Double clicking anyGOFFA Tree Path in the graph or its color key locatedbelow the graph will launch a Tree window view (Figure2, panel 2) with the GO terms corresponding to theGOFFA Tree Path highlighted in blue for easy recognition.The GO Path visualization could be considered as a con-densed rendering of the most salient GO informationassociated with the DEG's data.
• GO TreePrune – This visualization tool display the GOterms in a node-like hierarchical tree structure, as shownin the Figure 5 example. Note that the plot is annotatedwith the p-value, E-value, and number of associated genesat each node of the tree. The number of genes associatedwith each node is also depicted in the pie chart as a frac-tion of the genes associated with the root node. The GOTreePrune plots can be very large and complex; as a result,GOFFA provides a tool for pruning the tree by assigningarbitrary and simultaneous cutoffs for p-value, E-value,and number of genes. Nodes below the cutoff values spec-ified by the user are removed from the plot.
GOFFA ApplicationA dataset from a toxicogenomics study was used to dem-onstrate the utility of GOFFA. In this study, the renal tox-icity and carcinogenicity associated with the treatment ofaristolochic acid (AA) in rats was studied using DNAmicroarray. AA is an active component of herbal drugsderived from some plants that has been used for medici-nal purposes since ancient time [26]. The compound is anephrotoxin and carcinogen in human and rodents. Toinvestigate the effect of AA exposure on gene expression inrat kidney, a toxicogenomics study is conducted; theexperimental protocol is described by Chen et al. in an
accompanying paper of the same issue. Briefly, six-weekold Big Blue rats were treated with AA and control vehiclefor 3 month. One day after the last treatment, the animalswere sacrificed and the kidneys were removed for micro-array analysis using the Applied Biosystems Rat GenomeSurvey Microarray. Both treated and control samples hadsix biological replicates (rats). The data normalizationand analysis were conducted using ArrayTrack. The DEGlist was determined based on p < 0.01 and Fold Change >2. Since GOFFA is fully integrated with ArrayTrack, theDEGs from ArrayTrack were directly passed to GOFFA forfunctional analysis. Of 1176 identified genes, 417 geneshad GO information for analysis [25]. The GOFFA resultsare summarized in Figures 2, 3, 4, 5.
The statistics based on a combination of Fisher's Exact Test(p < 0.05) and Relevant Enrichment Factor (E > 2) identi-fied 52 enriched GO terms in the GO biological process.The majority of the terms are related to four functionalcategories, induction of apoptosis, defense response,response to stress, and amino acid metabolism. These fourfunctional categories reflect the known biological andpharmacological responses of kidney to the AA treatment[26]. Out of these four functional categories, GO Pathranked "defense response" as an important mechanismassociated with the AA treatment (Figure 4), and similarresults were obtained from GO TreePrune as well (Figure5). This finding is consistent with the general understand-ing that defense response, which includes immuneresponse, is a complex network response of a tissue to tox-ins and carcinogens (such as AA) for defending the body.Figure 2 gives the GO Path results in the Tree window,where the majority of genes involved in the defenseresponse are up-regulated to oppose damage by AA. Forexample, the inhba gene (first gene in the right panel) is agrowth factor with 4.1-fold increase in expression in kid-ney. This is a tumor-suppressor gene and it produces pro-tein that increases arrest in the G1 phase of tumor cells[27]. Therefore, its induction inhibits tumorigenesis inkidney treated with AA.
DiscussionA fundamental step in analyzing DNA microarray data isto determine the differentially expressed genes (DEGs)that are presumably relevant to the biological phenomenaunder study. However, in microarray experiments usingchips with thousands of genes where a small subset ofDEGs is determined for a disease or toxicity, the potentialfor both type 1 and type 2 errors could be large. Both typesof errors suggest the need for the biologists to intervene inthe data reduction and analysis process beyond the appli-cation of statistics. The GOFFA software was designedwith the biologist in mind. The platform provides a meansto analyze and scrutinize the complex data from genomicsand proteomics experiments in the context of the existing
Page 6 of 11(page number not for citation purposes)

BMC Bioinformatics 2006, 7(Suppl 2):S23
Page 7 of 11(page number not for citation purposes)
Terms and Genes Windows – The Terms Window (A) and Genes Window (B) summarize the findings associated with GO terms and genes respectively in the tabular format along with various statistical parameters (e.g., p- and E-values)Figure 3Terms and Genes Windows – The Terms Window (A) and Genes Window (B) summarize the findings associated with GO terms and genes respectively in the tabular format along with various statistical parameters (e.g., p- and E-values). Each View contains three tables corresponding to three categories of GO (molecular functions, biological processes and cellular compo-nents). The table can be sorted in every column by clicking on the column header. Sorting on multiple columns is also sup-ported (pressing Ctrl key while clicking on the second column header for sorting). Both copy/paste and export functions are available to transfer data to external software.

BMC Bioinformatics 2006, 7(Suppl 2):S23
knowledge of gene function as embodied by the GO data-base. It provides the biologist alternate ways to summa-rize data, statistically select the most relevant data, orexamine in fine detail the biological phenomena associ-ated with selected data.
GOFFA is a client-server application, written in JAVA lan-guage for portability, and has a GUI designed with theassistance of biologists for their own intuitive ease of use.The GUI is logically divided into three panels (Figure 2),for queries (panel 1), analysis and results (panel 2), andgene lists (panel 3), respectively. The GO analysis, results
tables, graphs, and visualization tools are accessed fromthe analysis and results panel (Figure 2, panel 2) thatmaintains data linkage assuring ease in examiningselected data in different ways.
GOFFA's efficiency and effectiveness for data interpreta-tion results from treating GO data as a set of distinct hier-archical GOFFA Tree Paths. Application of statistical teststo the GOFFA Tree Paths enables two unique interpretivefunctions, GO Path and GO TreePrune. GO Path providesthe rank ordered estimates of the statistically importantGOFFA Tree Paths. GO TreePrune provides the ability to
GO Path – GO Path sorts, by descending statistical significance based on an inverse Chi-Squared test, the GOFFA Tree Paths (i.e., linked GO terms) and graphically displays them from high to low at each hierarchical levelFigure 4GO Path – GO Path sorts, by descending statistical significance based on an inverse Chi-Squared test, the GOFFA Tree Paths (i.e., linked GO terms) and graphically displays them from high to low at each hierarchical level. GO Path plots the top ten paths with solid circles representing the GO terms on the path. The X-axis has the hierarchical level to which the GO term belongs and the Y-axis (log p) indicates the statistical significance of the term. A color key for the top 10 paths (as determined by equation 2) is located beneath the plot. Clicking either a circle in a path in the plot or its corresponding color key launches a Tree View (Figure 2) with the selected path highlighted in blue. Other features are also available from a popup menu obtained by right clicking the plot, including zoom in/out, export figure, etc.
Page 8 of 11(page number not for citation purposes)

BMC Bioinformatics 2006, 7(Suppl 2):S23
prune GO trees by removing the GO terms according totheir p- and E-values in conjunction of the user-definednumber of genes the terms contain. These two functionsapply the different statistical approaches to rank and/ornarrow down the GO terms for further analysis/interpre-tation. When used together, the functions enable the biol-ogist to reduce complexity of data to that which is mostrelevant, select that information, and then drill down toexamine it further at a more refined level of detail.
The statistical estimators used in GOFFA (as well as othersimilar GO tools) should be interpreted as heuristic met-
rics of the potential biological significance of GO terms,rather than formal inferences of biological relevance. Theyare most reliable for problem solving when all genes froman experiment are known, since the prevalent GO terms inDEG's are compared to the prevalent GO terms in the setof reference genes. For example, the absolute p-value fromthe Fisher's Exact Test has little value unless the totalnumber of genes on the chip is used as the set of referencegenes. This is equally applied to the E-value. GOFFA cur-rently provides gene lists for over 100 commercial arraytypes (e.g., most GeneChip and Agilent's arrays), forwhich the GO terms are pre-mapped and stored in the
GO TreePrune – This node-like tree display allows the user to filter out nodes and thus reduce the complexity of a tree by specifying the p- and E-value as well as the user-defined number of genes in the end nodeFigure 5GO TreePrune – This node-like tree display allows the user to filter out nodes and thus reduce the complexity of a tree by specifying the p- and E-value as well as the user-defined number of genes in the end node. A GO term is represented by a sec-tored pie, where the red sector shows the percentage of the inputted genes associated with the term. The individual genes associated with each term are displayed in the right panel by single clicking the term. The annotation of a term can be turned on or off by double clicking the term. Each term is movable with mouse drag, which is convenient when working on a dense tree or with many annotations. The tree diagram can be zoomed and moved by holding down the right or left button of the mouse, respectively.
Page 9 of 11(page number not for citation purposes)

BMC Bioinformatics 2006, 7(Suppl 2):S23
database for quick retrieval and analysis. With this infor-mation, GOFFA's statistical estimators can provide moremeaningful significance assessment for interpretation ofthe GO results. If the inputted gene list is not associatedwith an array type, the total numbers of genes in theGOFFA database is for statistical estimates; while this will,for example, unrealistically skew p-values, p-values acrossthe GO terms will still retain meaning in a relative sense.
While GOFFA itself is a powerful analysis tool, its full util-ity derives from its integration as a module of theArrayTrack software. ArrayTrack is a comprehensive soft-ware platform for microarray data management, analysisand interpretation [1,2]. The integration of GOFFA withArrayTrack enables the microarray data to be easily proc-essed in the ArrayTrack environment and the resultantDEG list immediately interpret with GOFFA. Importantly,ArrayTrack has been interfaced with various commercialpathway software, providing an additional means toinvestigate the validity of GOFFA findings with respect torelevant gene ontologies.
ConclusionA common characteristic of high-throughput omics tech-nologies, such as DNA microarray, is the generation ofhuge datasets that provide the ability to examine differen-tial expression between corresponding genes in treatmentand control groups. GOFFA enhances the capability tointerpret data generated from these technologies. GOFFAapplies statistical analysis in conjunction with intuitivevisual display to present GO terms, trees and paths in amanner to facilitate biological interpretation. There aretwo unique tools available in GOFFA, GO Path and GOTreePrune, both enabling fast and interactive interroga-tion of significant gene and protein lists through statisticalassessment and visual inspection. GOFFA is a module ofArrayTrack that is FDA's microarray data management,analysis and interpretation software.
Authors' contributionsHS has developed GOFFA and finished the first draft ofthe manuscript. WT conceived the concept of the GO Pathfunction and finalized the manuscript. HF was involved inthe GOFFA interface design and testing and contributedsignificantly on finishing the first draft of the manuscript.TC helped preparing the section for the real-world appli-cation of GOFFA. All authors were involved with thedesign of the GOFFA functions and user interface. Allauthors participated in preparation of the manuscript,and approved its final form.
AcknowledgementsThe authors express gratitude to Steve Harris and Xiaoxi Cao, the devel-opers of ArrayTrack, for advising on many aspects of the software and data-base programming, and in particular for assistance with interfacing GOFFA and ArrayTrack.
References1. Tong W, Harris S, Cao X, Fang H, Shi L, Sun H, Fuscoe J, Harris A,
Hong H, Xie Q, et al.: Development of public toxicogenomicssoftware for microarray data management and analysis.Mutat Res 2004, 549(1–2):241-253.
2. Tong W, Cao X, Harris S, Sun H, Fang H, Fuscoe J, Harris A, Hong H,Xie Q, Perkins R, et al.: ArrayTrack – supporting toxicogenomicresearch at the U.S. Food and Drug Administration NationalCenter for Toxicological Research. Environ Health Perspect 2003,111(15):1819-1826.
3. Ashburner M, Ball CA, Blake JA, Botstein D, Butler H, Cherry JM,Davis AP, Dolinski K, Dwight SS, Eppig JT, et al.: Gene ontology:tool for the unification of biology. The Gene Ontology Con-sortium. Nat Genet 2000, 25(1):25-29.
4. Lewis SE: Gene Ontology: looking backwards and forwards.Genome Biol 2005, 6(1):103.
5. Zeeberg BR, Feng W, Wang G, Wang MD, Fojo AT, Sunshine M, Nar-asimhan S, Kane DW, Reinhold WC, Lababidi S, et al.: GoMiner: are-source for biological interpretation of genomic andproteomic data. Genome Biol 2003, 4(4):R28.
6. Lee JS, Katari G, Sachidanandam R: GObar: a gene ontology basedanalysis and visualization tool for gene sets. BMC Bioinformatics2005, 6:189.
7. Zhong S, Storch KF, Lipan O, Kao MC, Weitz CJ, Wong WH: GoS-urfer: a graphical interactive tool for comparative analysis oflarge gene sets in Gene Ontology space. Appl Bioinformatics2004, 3(4):261-264.
8. Liu H, Hu ZZ, Wu CH: DynGO: a tool for visualizing and miningofGene Ontology and its associations. BMC Bioinformatics 2005,6:201.
9. Zhong S, Tian L, Li C, Storch KF, Wong WH: Comparative analy-sis of gene sets in the Gene Ontology space under the multi-ple hypothesis testing framework. Proc IEEE Comput SystBioinform Conf 2004:425-435.
10. Maere S, Heymans K, Kuiper M: BiNGO: a Cytoscape plugin toassess overrepresentation of gene ontology categories inbiological networks. Bioinformatics 2005, 21(16):3448-3449.
11. Lee SG, Hur JU, Kim YS: A graph-theoretic modeling on GOspace for biological interpretation of gene clusters. Bioinfor-matics 2004, 20(3):381-388.
12. Zhang B, Schmoyer D, Kirov S, Snoddy J: GOTreeMachine(GOTM): a web-based platform for interpreting setsof interestinggenes using Gene Ontology hierarchies. BMCBioinformatics 2004, 5:16.
13. Khatri P, Bhavsar P, Bawa G, Draghici S: Onto-Tools: an ensembleof web-accessible, ontology-based tools for the functionaldesign and interpretation of high-throughput gene expres-sion experiments. Nucleic Acids Res 2004, 32(WebServer):W449-456.
14. Khatri P, Sellamuthu S, Malhotra P, Amin K, Done A, Draghici S:Recent additions and improvements to the Onto-Tools.Nucleic Acids Res 2005, 33(Web Server):W762-765.
15. Boyle EI, Weng S, Gollub J, Jin H, Botstein D, Cherry JM, Sherlock G:GO::TermFinder – open source software for accessing GeneOntology information and finding significantly enrichedGene Ontology terms associated with a list of genes. Bioinfor-matics 2004, 20(18):3710-3715.
16. Beissbarth T, Speed TP: GOstat: find statistically overrepre-sented Gene Ontologies within a group of genes. Bioinformatics2004, 20(9):1464-1465.
17. Shegogue D, Zheng WJ: Integration of the Gene Ontology intoan object-oriented architecture. BMC Bioinformatics 2005,6(1):113.
18. Zeeberg BR, Qin H, Narasimhan S, Sunshine M, Cao H, Kane DW,Reimers M, Stephens RM, Bryant D, Burt SK, et al.: High-Through-put GoMiner, an 'industrial-strength' integrative gene ontol-ogy tool for interpretation of multiple-microarrayexperiments, with application to studies of Common Varia-ble Immune Deficiency (CVID). BMC Bioinformatics 2005, 6:168.
19. Khatri P, Draghici S: Ontological analysis of gene expressiondata: current tools, limitations, and open problems. Bioinfor-matics 2005, 21(18):3587-3595.
20. Spellman PT, Rubin GM: Evidence for large domains of similarlyexpressed genes in the Drosophila genome. J Biol 2002, 1(1):5.
21. Cho RJ, Huang M, Campbell MJ, Dong H, Steinmetz L, Sapinoso L,Hampton G, Elledge SJ, Davis RW, Lockhart DJ: Transcriptional
Page 10 of 11(page number not for citation purposes)

BMC Bioinformatics 2006, 7(Suppl 2):S23
Publish with BioMed Central and every scientist can read your work free of charge
"BioMed Central will be the most significant development for disseminating the results of biomedical research in our lifetime."
Sir Paul Nurse, Cancer Research UK
Your research papers will be:
available free of charge to the entire biomedical community
peer reviewed and published immediately upon acceptance
cited in PubMed and archived on PubMed Central
yours — you keep the copyright
Submit your manuscript here:http://www.biomedcentral.com/info/publishing_adv.asp
BioMedcentral
regulation and function during the human cell cycle. NatGenet 2001, 27(1):48-54.
22. Fisher LD, Bell Gv: Biostatistics: A methodology for health sci-ences. Mew York: John Wiley and Sons;; 1993.
23. Fisher RA: Statistical Methods For Research Workers. London:Oliver and Boyd;; 1932.
24. Hedges LV, Olkin I: Statistical Method for Meta-Analysis. Aca-demic Press;; 1985.
25. Note: Calculation is based on only these genes that are iden-tifiable in the GOFFA database. .
26. Arlt VM, Stiborova M, Schmeiser HH: Aristolochic acid as a prob-able human cancer hazard in herbal remedies: a review.Mutagenesis 2002, 17(4):265-277.
27. Shav-Tal Y, Zipori D: The role of activin a in regulation ofhemopoiesis. Stem Cells 2002, 20(6):493-500.
Page 11 of 11(page number not for citation purposes)