going forw rd - john keells holdings plc...management discussion and analysis group consolidated...
TRANSCRIPT

G O I N GF O R W R D
JOHN KEELLS HOLDINGS PLC | ANNUAL REPORT 2018/19

JOHN KEELLS HOLDINGS PLC
For over 149 years, John Keells has built and managed a diverse industry portfolio including several industry sectors strategically selected to represent key growth areas of the economy.
We are known as an entrepreneurial company constantly seeking new business opportunities to explore, innovate and make our own. That is how we have maintained an
even trajectory of expansion and growth throughout every decade of our long history.
Over the past few years, we have been investing in several enterprises that we identified as potentially value enhancing, such as the "Cinnamon Life" project, which will be an iconic landmark transforming the city of Colombo. Today, the Group moves into the next phase
as our major investments begin to yield results.
Yet the road has not always been an easy one and there were times when we had to dig deep, leveraging on our financial strength, operational expertise, business leadership
and corporate resilience to withstand the challenges we have had to face. The Easter Sunday attacks of April 2019 will be long remembered for the tragedy and turmoil we all experienced. Yet, we have every confidence in our nation’s proven resilience and capacity
to move ahead and prosper, united as one.
Going forward, we will continue to harness the value created by our investment strategies; evolving our standards of governance while ensuring that our digital capabilities and
innovative approach will drive your Company’s progress to the next level.
G O I N GF O R W R D

2 JOHN KEELLS HOLDINGS PLC | ANNUAL REPORT 2018/19
NAVIGATING THIS REPORT
Financial and Manufactured Capital
Intellectual Capital
Natural Capital
Social and Relationship Capital
Human Capital
Capital Guides
This Annual Report is also available on our website:
www.keells.com/resource/annual-report/John_Keells_Holdings_PLC_AR_2018_19_CSE.pdf
Reading Guides
Reference to other pages within the Report
Reference to further reading online
Details of CSR projects available on www.johnkeellsfoundation.com/
Reference to a specific GRI Standard
CONTENTS
4 Introduction to the Report6 Our Business Model8 Organisational Structure9 Chairman’s Message17 Investor Relations
17 Group Highlights27 Sustainable Development Goals
and Impacts28 Economic Value Added Statement 28 Financial Highlights - Fourth
Quarter 2018/19
Management Discussion and Analysis Group Consolidated Review
31 External Environment34 Capital Management Review
34 Financial and Manufactured Capital
43 Natural Capital48 Human Capital52 Social and Relationship Capital58 Intellectual Capital
60 Outlook63 Strategy, Resource Allocation and
Portfolio Management70 Share Information
Industry Group Review
78 Transportation88 Consumer Foods98 Retail108 Leisure124 Property134 Financial Services146 Other, including Information
Technology and Plantation Services
78 Transportation 88 Consumer Foods 98 Retail
9Chairman’s Message
17Investor Relations
34Capital Management Review
63Strategy, Resource Allocation and Portfolio Management
70Share Information
164Corporate Governance Commentary
201Risks, Opportunities and Internal Controls
3
ABOUT USJohn Keells Holdings PLC (JKH) is the largest listed company on the Colombo Stock Exchange, with business interests primarily in Transportation, Consumer Foods, Retail, Leisure, Property and Financial Services. Started in the early 1870s as a produce and exchange broking business by two Englishmen, Edwin and George John, the Group has been known to constantly re-align, re-position and re-invent itself in pursuing growth sectors of the time.
JKH was incorporated as a public limited liability company in 1979 and obtained a listing on the Colombo Stock Exchange in 1986. Having issued Global Depository Receipts (GDRs) which were listed on the Luxembourg Stock Exchange, JKH became the first Sri Lankan company to be listed overseas.
The Group’s investment philosophy is based on a positive outlook, bold approach, commitment to delivery and flexibility to change. JKH is also committed to maintaining integrity, ethical dealings, sustainable development and greater social responsibility in a multi-stakeholder context. JKH is a full member of the World Economic Forum and a member of the UN Global Compact.
The Holding Company of the Group, John Keells Holdings PLC, is based at 117, Sir Chittampalam A. Gardiner Mawatha, Colombo 2 and has offices and businesses located across Sri Lanka and the Maldives.
Governance
158 Board of Directors 160 Group Executive Committee 161 Group Operating Committee 164 Corporate Governance Commentary 194 Materiality, Sustainability Integration
and Stakeholder Engagement201 Risks, Opportunities and Internal
Controls
Financial Statements
207 Annual Report of the Board of Directors
212 The Statement of Directors’ Responsibility
213 Independent Auditors’ Report216 Income Statement217 Statement of Comprehensive Income218 Statement of Financial Position219 Statement of Cash Flows220 Statement of Changes in Equity224 Notes to the Financial Statements
Supplementary Information
304 History of the John Keells Group305 Decade at a Glance306 Economic Value Statement308 Indicative US Dollar Financial
Statements310 Group Real Estate Portfolio312 Sri Lankan Economy314 Glossary315 Independent Assurance Statement
on Non-Financial Reporting318 Group Directory323 GRI Content Index331 Notice of Meeting332 Corporate Information333 Form of Proxy
108 Leisure 124 Property 134 Financial Services 146 Other, including Information Technology and Plantation Services
4 JOHN KEELLS HOLDINGS PLC | ANNUAL REPORT 2018/19
INTRODUCTION TO THE REPORT
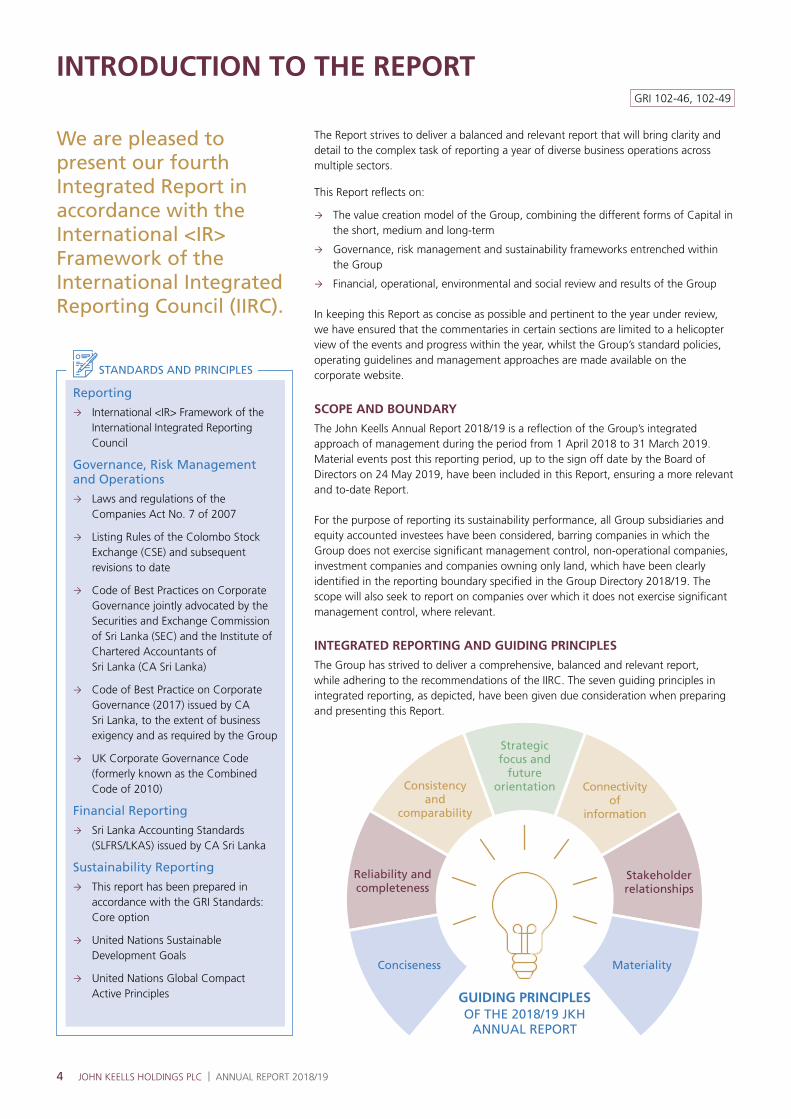
GUIDING PRINCIPLES OF THE 2018/19 JKH
ANNUAL REPORT
Conciseness Materiality
Reliability and completeness
Stakeholder relationships
Consistency and
comparability
Connectivity of
information
Strategic focus and
future orientation
We are pleased to present our fourth Integrated Report in accordance with the International <IR> Framework of the International Integrated Reporting Council (IIRC).
Reporting
International <IR> Framework of the International Integrated Reporting Council
Governance, Risk Management and Operations
Laws and regulations of the Companies Act No. 7 of 2007
Listing Rules of the Colombo Stock Exchange (CSE) and subsequent revisions to date
Code of Best Practices on Corporate Governance jointly advocated by the Securities and Exchange Commission of Sri Lanka (SEC) and the Institute of Chartered Accountants of Sri Lanka (CA Sri Lanka)
Code of Best Practice on Corporate Governance (2017) issued by CA Sri Lanka, to the extent of business exigency and as required by the Group
UK Corporate Governance Code (formerly known as the Combined Code of 2010)
Financial Reporting
Sri Lanka Accounting Standards (SLFRS/LKAS) issued by CA Sri Lanka
Sustainability Reporting
This report has been prepared in accordance with the GRI Standards: Core option
United Nations Sustainable Development Goals
United Nations Global Compact Active Principles
The Report strives to deliver a balanced and relevant report that will bring clarity and detail to the complex task of reporting a year of diverse business operations across multiple sectors.
This Report reflects on:
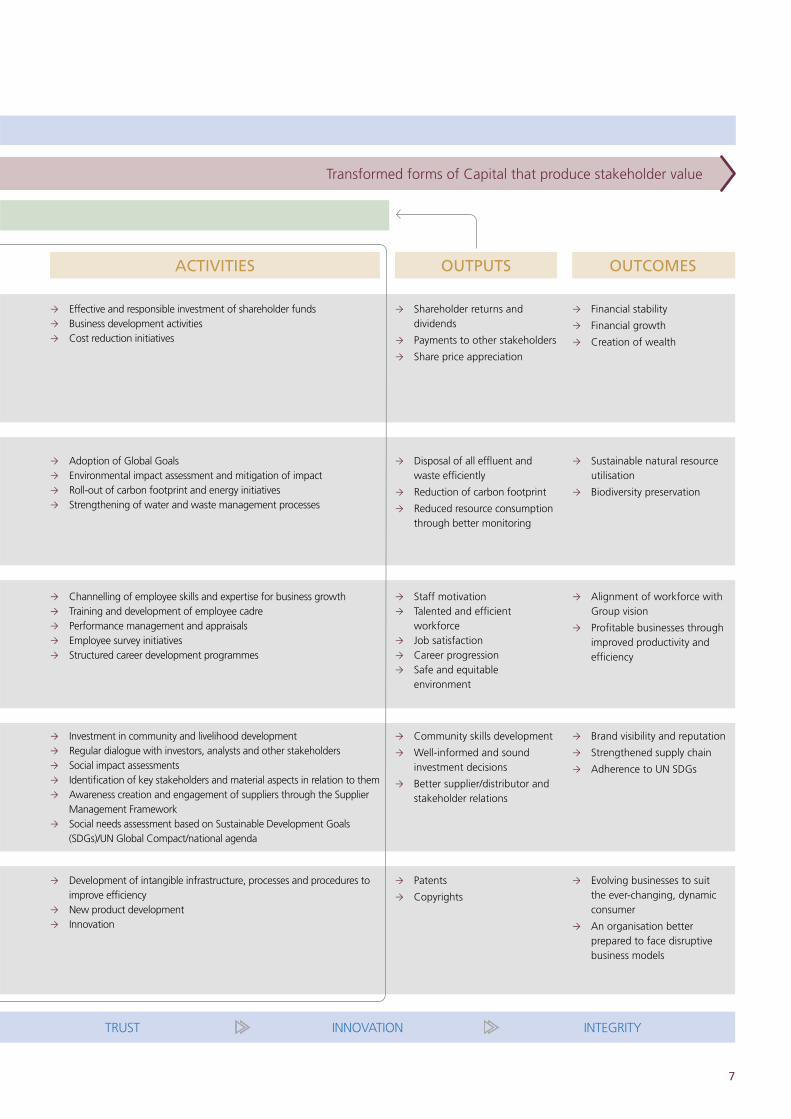
The value creation model of the Group, combining the different forms of Capital in the short, medium and long-term
Governance, risk management and sustainability frameworks entrenched within the Group
Financial, operational, environmental and social review and results of the Group
In keeping this Report as concise as possible and pertinent to the year under review, we have ensured that the commentaries in certain sections are limited to a helicopter view of the events and progress within the year, whilst the Group’s standard policies, operating guidelines and management approaches are made available on the corporate website.
SCOPE AND BOUNDARY
The John Keells Annual Report 2018/19 is a reflection of the Group’s integrated approach of management during the period from 1 April 2018 to 31 March 2019. Material events post this reporting period, up to the sign off date by the Board of Directors on 24 May 2019, have been included in this Report, ensuring a more relevant and to-date Report.
For the purpose of reporting its sustainability performance, all Group subsidiaries and equity accounted investees have been considered, barring companies in which the Group does not exercise significant management control, non-operational companies, investment companies and companies owning only land, which have been clearly identified in the reporting boundary specified in the Group Directory 2018/19. The scope will also seek to report on companies over which it does not exercise significant management control, where relevant.
INTEGRATED REPORTING AND GUIDING PRINCIPLES
The Group has strived to deliver a comprehensive, balanced and relevant report, while adhering to the recommendations of the IIRC. The seven guiding principles in integrated reporting, as depicted, have been given due consideration when preparing and presenting this Report.
STANDARDS AND PRINCIPLES
GRI 102-46, 102-49

5
DETERMINING MATERIALITY
Materiality analysis is a key process that enables the Group to define key triple bottom line issues that are of significance for businesses and stakeholders, both internal and external, in the short, medium and long-term. Our focus on materiality, through emphasis on 11 material aspects, recognised by both internal and external stakeholders, is vital as we seek to drive performance, improve our sustainability framework and institutionalise the Group’s corporate governance philosophy at all levels.
The Group conducts an independent external stakeholder engagement every three to four years in ascertaining material aspects to its significant stakeholders. In addition, materiality is also assessed internally in ascertaining the aspects material to the Group and fine-tuning and streamlining its strategy and processes to manage these material issues. The outcomes of these studies are prioritised using a materiality matrix, representing their level of significance to the Group and its external stakeholders, and are then disclosed as per clearly defined topics under the GRI Standards.
While the matrix, as illustrated, indicates the prioritisation of these material topics, the Group continues to assess its internal and external materiality and disclose the performance of such topics. Its reporting scope will be expanded as and when a topic becomes material to the Group and its stakeholders.
DISCLAIMER FOR THE PUBLICATION OF FORECAST DATA
The Report contains information about the plans and strategies of the Group for the medium and long-term and represents the management’s view. The plans are forward-looking in nature and their feasibility depends on a number of economic, political and legal factors which are outside the influence of the Group and Company, including the situation of key markets, changes in tax, customs and environmental legislation and so forth. Given this, the actual performance of indicators in future years may differ from the forward-looking statements published in this Report. The reader is advised to seek expert professional advice in all such respects.
As you flip through the pages of this Report, you will find a relevant, transparent and noteworthy value proposition entrenched within the John Keells Group where we strive to achieve the highest form of stakeholder satisfaction through sustainable value creation.
INFORMATION VERIFICATION AND QUALITY ASSURANCE
The information contained in this Report has been reviewed as applicable, by:
The Board of Directors
The Group Executive Committee
Audit Committee of the Company
An independent auditor confirming the accuracy of the annual financial statements
An independent auditor confirming the accuracy of the non-financial statements in this Report, and, that it has been prepared in accordance with the GRI Standards: Core option and International <IR> Framework
HIGH
LOW
Minimal reporting/ Not reported
Impo
rtan
ce t
o ex
tern
al s
take
hold
ers
Importance to internal stakeholders
Included in this Report and/or Company website
A detailed discussion on determining materiality is available on the Corporate website.
Contact with Stakeholders
The preparation of the Report took place in cooperation with stakeholders in order to improve transparency and accountability. Feedback is gathered through questionnaires, a dedicated mail-box, one-on-one meetings and stakeholder engagement fora.
6 JOHN KEELLS HOLDINGS PLC | ANNUAL REPORT 2018/19
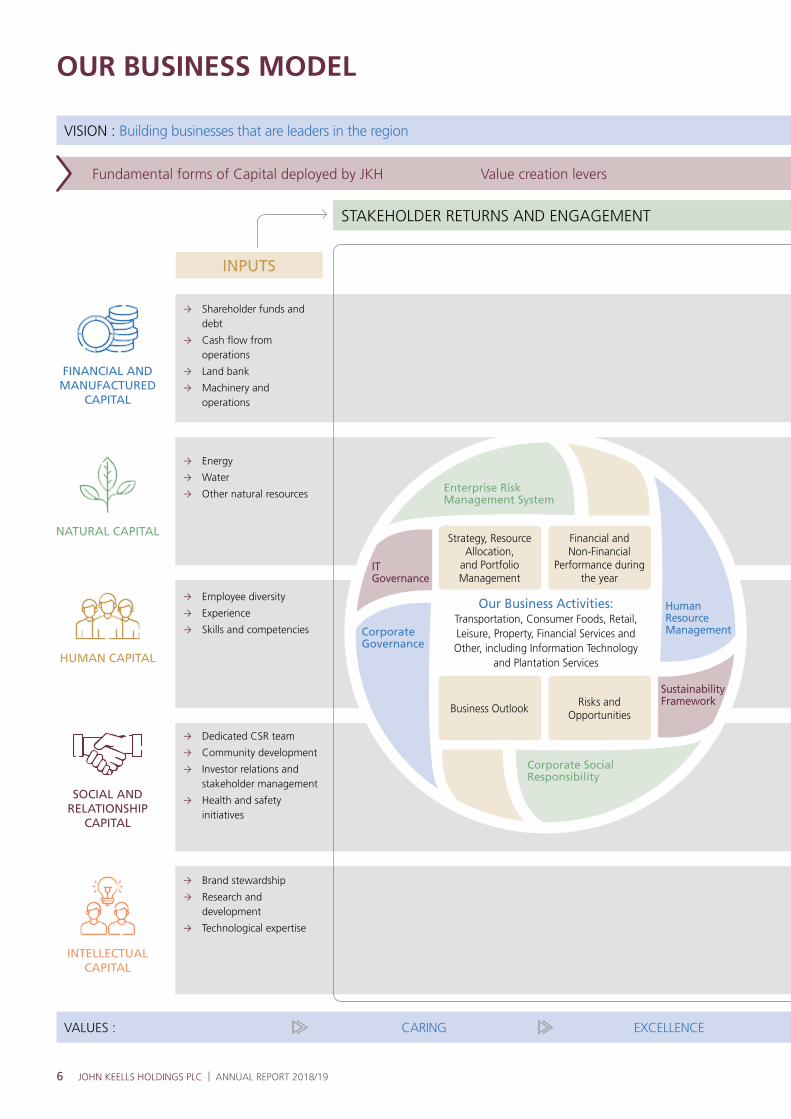
OUR BUSINESS MODEL
VALUES : CARING EXCELLENCE
VISION : Building businesses that are leaders in the region
STAKEHOLDER RETURNS AND ENGAGEMENT
INPUTS
FINANCIAL AND MANUFACTURED
CAPITAL
Shareholder funds and debt
Cash flow from operations
Land bank
Machinery and operations
NATURAL CAPITAL
Energy
Water
Other natural resources
HUMAN CAPITAL
Employee diversity
Experience
Skills and competencies
SOCIAL AND RELATIONSHIP
CAPITAL
Dedicated CSR team
Community development
Investor relations and stakeholder management
Health and safety initiatives
INTELLECTUAL CAPITAL
Brand stewardship
Research and development
Technological expertise
Our Business Activities: Transportation, Consumer Foods, Retail, Leisure, Property, Financial Services and Other, including Information Technology
and Plantation Services
Business OutlookRisks and
Opportunities
Strategy, Resource Allocation,
and Portfolio Management
Financial and Non-Financial
Performance during the year
Fundamental forms of Capital deployed by JKH Value creation levers
Sustainability Framework
Human Resource Management
Enterprise Risk Management System
Corporate Social Responsibility
Corporate Governance
IT Governance
7
TRUST INNOVATION INTEGRITY
Transformed forms of Capital that produce stakeholder value
ACTIVITIES OUTPUTS OUTCOMES
Effective and responsible investment of shareholder funds Business development activities Cost reduction initiatives
Shareholder returns and dividends
Payments to other stakeholders
Share price appreciation
Financial stability
Financial growth
Creation of wealth
Adoption of Global Goals Environmental impact assessment and mitigation of impact Roll-out of carbon footprint and energy initiatives Strengthening of water and waste management processes
Disposal of all effluent and waste efficiently
Reduction of carbon footprint
Reduced resource consumption through better monitoring
Sustainable natural resource utilisation
Biodiversity preservation
Channelling of employee skills and expertise for business growth Training and development of employee cadre Performance management and appraisals Employee survey initiatives Structured career development programmes
Staff motivation Talented and efficient
workforce Job satisfaction Career progression Safe and equitable
environment
Alignment of workforce with Group vision
Profitable businesses through improved productivity and efficiency
Investment in community and livelihood development Regular dialogue with investors, analysts and other stakeholders Social impact assessments Identification of key stakeholders and material aspects in relation to them Awareness creation and engagement of suppliers through the Supplier
Management Framework Social needs assessment based on Sustainable Development Goals
(SDGs)/UN Global Compact/national agenda
Community skills development
Well-informed and sound investment decisions
Better supplier/distributor and stakeholder relations
Brand visibility and reputation
Strengthened supply chain
Adherence to UN SDGs
Development of intangible infrastructure, processes and procedures to improve efficiency
New product development Innovation
Patents
Copyrights
Evolving businesses to suit the ever-changing, dynamic consumer
An organisation better prepared to face disruptive business models

8 JOHN KEELLS HOLDINGS PLC | ANNUAL REPORT 2018/19
ORGANISATIONAL STRUCTURE
Corporate Communications
Corporate Finance and Strategy
Group Business Process Review
Group Finance and Group Insurance
Group Human Resources
Group Tax
Group Treasury
John Keells Research
Legal and Secretarial
New Business Development
Strategic Group Information Technology
Sustainability, Enterprise Risk Management and Group Initiatives John Keells Foundation
CENTRE FUNCTIONS
CONSUMER FOODS Beverages Frozen Confectionery Convenience Foods
TRANSPORTATION Transportation Ports and Shipping
RETAIL Supermarkets Office Automation
LEISURE City Hotels Resorts Destination Management Hotel Management
PROPERTY Property Development Real Estate
FINANCIAL SERVICES Insurance Banking Stock Broking
OTHER, INCLUDING INFORMATION TECHNOLOGY AND PLANTATION SERVICES
Information Technology Plantation Services Other
9
CHAIRMAN'S MESSAGE
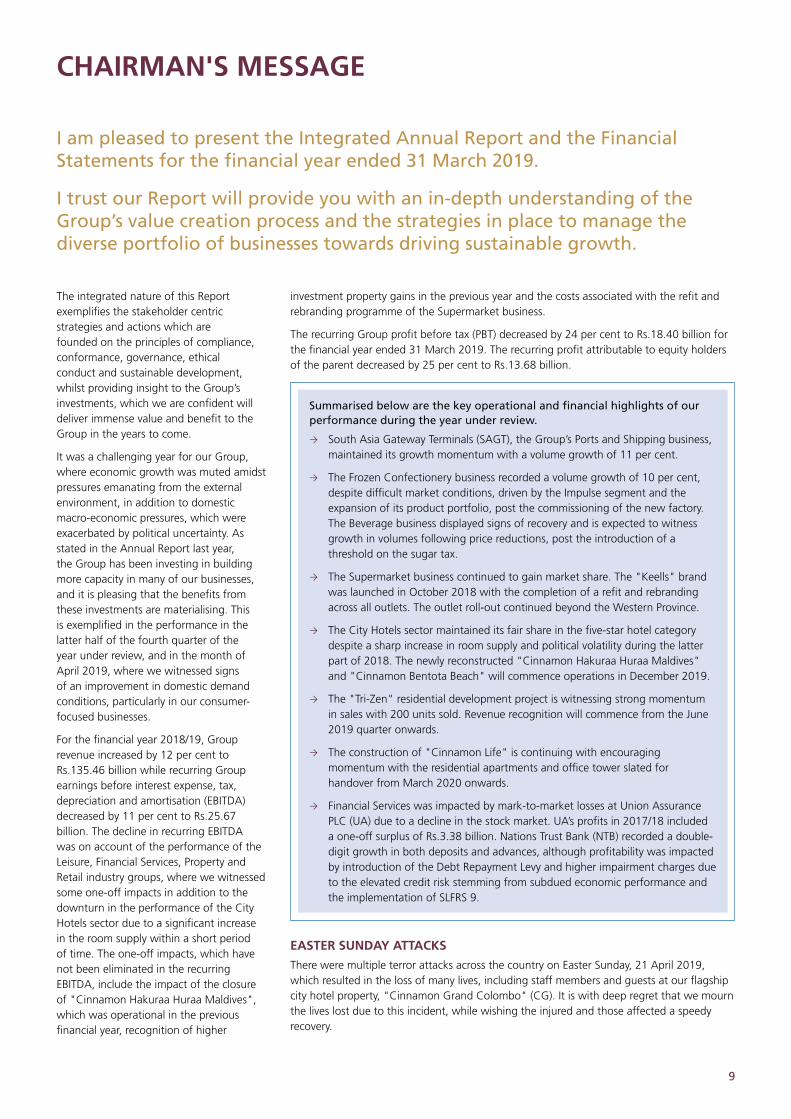
The integrated nature of this Report exemplifies the stakeholder centric strategies and actions which are founded on the principles of compliance, conformance, governance, ethical conduct and sustainable development, whilst providing insight to the Group’s investments, which we are confident will deliver immense value and benefit to the Group in the years to come.
It was a challenging year for our Group, where economic growth was muted amidst pressures emanating from the external environment, in addition to domestic macro-economic pressures, which were exacerbated by political uncertainty. As stated in the Annual Report last year, the Group has been investing in building more capacity in many of our businesses, and it is pleasing that the benefits from these investments are materialising. This is exemplified in the performance in the latter half of the fourth quarter of the year under review, and in the month of April 2019, where we witnessed signs of an improvement in domestic demand conditions, particularly in our consumer-focused businesses.
For the financial year 2018/19, Group revenue increased by 12 per cent to Rs.135.46 billion while recurring Group earnings before interest expense, tax, depreciation and amortisation (EBITDA) decreased by 11 per cent to Rs.25.67 billion. The decline in recurring EBITDA was on account of the performance of the Leisure, Financial Services, Property and Retail industry groups, where we witnessed some one-off impacts in addition to the downturn in the performance of the City Hotels sector due to a significant increase in the room supply within a short period of time. The one-off impacts, which have not been eliminated in the recurring EBITDA, include the impact of the closure of "Cinnamon Hakuraa Huraa Maldives", which was operational in the previous financial year, recognition of higher
I am pleased to present the Integrated Annual Report and the Financial Statements for the financial year ended 31 March 2019.
I trust our Report will provide you with an in-depth understanding of the Group’s value creation process and the strategies in place to manage the diverse portfolio of businesses towards driving sustainable growth.
investment property gains in the previous year and the costs associated with the refit and rebranding programme of the Supermarket business.
The recurring Group profit before tax (PBT) decreased by 24 per cent to Rs.18.40 billion for the financial year ended 31 March 2019. The recurring profit attributable to equity holders of the parent decreased by 25 per cent to Rs.13.68 billion.
Summarised below are the key operational and financial highlights of our performance during the year under review.
South Asia Gateway Terminals (SAGT), the Group’s Ports and Shipping business, maintained its growth momentum with a volume growth of 11 per cent.
The Frozen Confectionery business recorded a volume growth of 10 per cent, despite difficult market conditions, driven by the Impulse segment and the expansion of its product portfolio, post the commissioning of the new factory. The Beverage business displayed signs of recovery and is expected to witness growth in volumes following price reductions, post the introduction of a threshold on the sugar tax.
The Supermarket business continued to gain market share. The "Keells" brand was launched in October 2018 with the completion of a refit and rebranding across all outlets. The outlet roll-out continued beyond the Western Province.
The City Hotels sector maintained its fair share in the five-star hotel category despite a sharp increase in room supply and political volatility during the latter part of 2018. The newly reconstructed "Cinnamon Hakuraa Huraa Maldives" and "Cinnamon Bentota Beach" will commence operations in December 2019.
The "Tri-Zen" residential development project is witnessing strong momentum in sales with 200 units sold. Revenue recognition will commence from the June 2019 quarter onwards.
The construction of "Cinnamon Life" is continuing with encouraging momentum with the residential apartments and office tower slated for handover from March 2020 onwards.
Financial Services was impacted by mark-to-market losses at Union Assurance PLC (UA) due to a decline in the stock market. UA’s profits in 2017/18 included a one-off surplus of Rs.3.38 billion. Nations Trust Bank (NTB) recorded a double-digit growth in both deposits and advances, although profitability was impacted by introduction of the Debt Repayment Levy and higher impairment charges due to the elevated credit risk stemming from subdued economic performance and the implementation of SLFRS 9.
EASTER SUNDAY ATTACKS
There were multiple terror attacks across the country on Easter Sunday, 21 April 2019, which resulted in the loss of many lives, including staff members and guests at our flagship city hotel property, "Cinnamon Grand Colombo" (CG). It is with deep regret that we mourn the lives lost due to this incident, while wishing the injured and those affected a speedy recovery.

10 JOHN KEELLS HOLDINGS PLC | ANNUAL REPORT 2018/19
CHAIRMAN'S MESSAGE
In the immediate aftermath of this horrific incident, the Group witnessed disruptions across most of our businesses on the back of heightened security measures and dampened sentiment. Against this backdrop, particularly given adverse travel advisories from key source markets within a few days of the incident, the tourism industry witnessed cancellations.
However, we note that the safety and security measures are confirmed to be in place by the authorities. It is important that the country deals with this situation with resilience as we move forward to restore stability and growth.
The Government has also initiated plans to implement a public relations campaign to curtail the negative global media coverage whilst also working towards the removal of adverse travel advisories from key tourist markets. The Government, commendably, has also announced a range of concessions to help the revival of the leisure industry, including a moratorium on loans taken by tourism related businesses and proposed amendments to the Value Added Tax (VAT) for hotel and tour operators. Whilst these measures will provide relief to the industry in the short-term, the industry is expected to witness a challenging period until arrivals rebound to pre-incident levels.
As discussed in detail in the Leisure Industry Group Review section of this Report, it is pertinent to note that studies of other travel destinations that were impacted by similar terrorism incidents indicate that destinations require 12 to 18 months to revert to pre-incident levels. Popular destinations which were affected by acts of terrorism such as Bali, Mumbai, Paris and Brussels have seen a recovery in arrivals in less than 18 months.
Whilst it is premature to assess the medium to long-term impacts on the economy, we believe that the macro-economic fundamentals will be able to withstand and overcome these incidents, and as such we do not expect a negative impact on the medium-term outlook of our businesses. While the Group will play its part in helping the tourism industry and the country achieve a speedy recovery, we have, together with the relevant chambers of commerce, been in engagement with
the authorities to urge them to take immediate steps to prevent a recurrence of such heinous acts and ensure regular and consistent dissemination of information only from designated spokespersons of the Government and military.
While the Government has initiated many measures to revive the tourism industry, the Group has also re-evaluated its short-term plans for recovery of the Leisure businesses, particularly in the city hotels. Given the anticipated reduction in arrivals, particularly in the next 3 months, which is a relatively lower occupancy period, the Group will look at managing its fixed and variable cost structures while ensuring operations are not hampered. The Group will initiate its own marketing and outreach efforts once the travel advisories are revised which is expected in the next few months. The industry group is also devising strategies to engage the domestic market in order to boost occupancy in the short-term. The operating model of each of the hotel properties has been critically evaluated to ensure the most optimum operating costs, whilst ensuring sustenance of the brand and service standards. The Group maintains a positive view of the outlook on arrivals, in line with other destinations that were similarly impacted in the past, and will pursue its recovery strategies accordingly.
As discussed previously, whilst it may be premature to assess the full impact arising from the Easter Sunday attacks, with the exception of the short-term impact on Leisure, the outlook for the other businesses are positive, where the core earnings from operations are expected to increase as we start to realise the benefits of many of the investments undertaken throughout the last two years. Details are described further in the Industry Group Review section, and, Strategy, Resource Allocation and Portfolio Management sections of this Report.
The Annual Report contains discussions on the macro-economic factors and its impact on our businesses as well as a detailed discussion and analysis of each of the industry groups. As such, I will focus on a high-level summation of the performance of each industry group during the financial year 2018/19.
TRANSPORTATION
The Transportation industry group reported revenue, including the share of revenue from equity accounted investees, of Rs.33.73 billion and EBITDA of Rs.4.56 billion, contributing 22 per cent and 18 per cent to Group revenue and EBITDA respectively. The recurring EBITDA for 2018/19 increased by 6 per cent over the previous year. It should be noted that the financial statements for 2017/18 included an impairment provision for doubtful debt and a cumulative deferred tax charge at South Asia Gateway Terminals (SAGT).
During the financial year, both the Port of Colombo (POC) and SAGT recorded a year on year volume growth of 11 per cent. The calendar year 2018 marked a significant milestone for both the POC and SAGT, with throughput recording an all-time high of over 7 million TEUs and 2 million TEUs, respectively. Despite the expansion of capacity with the commissioning of the South Container Terminal, the overall capacity utilisation of the POC is now approximately 85 per cent, demonstrating the strong potential for capacity led growth. In this context, timely development of the deep-draft East Container Terminal is critical to ensure that capacity continues to be enhanced towards attracting further volumes and sustain continued growth at the Port.
You will be pleased to note that the POC was ranked amongst the "World’s 30 Best Ports", as per Alphaliner Rankings 2018 while SAGT was recognised as the "Best Terminal in the Indian Sub-Continent Region" by the Global Ports Forum, in February 2019, for the third consecutive year.
Revenue and profitability of the Group’s Bunkering business improved as a result of a 6 per cent growth in volumes and an increase in base fuel prices during the year. The Hambantota Port presents opportunities for expansion of the business which can have a positive impact on overall bunkering volumes of the Group. The Logistics business recorded a strong performance due to an increase in throughput in its warehouse facilities while DHL Keells maintained its market leadership position in the year under review.
11
CONSUMER FOODS
The Consumer Foods industry group recorded revenue of Rs.16.21 billion and EBITDA of Rs.2.91 billion, contributing 11 per cent each to Group revenue and EBITDA. The recurring EBITDA for 2018/19 decreased by 9 per cent over the previous year.
The decline in EBITDA is on account of a volume decline of 25 per cent in the carbonated soft drinks (CSD) range of the Beverage business due to the introduction of the sugar tax in November 2017 which resulted in substantial price increases across the industry and the resultant decline in scale efficiencies. However, it is encouraging that the growth in monthly volumes within the second half of 2018/19 has consistently witnessed an upward trend.
On a positive note, the 2019 Budget introduced a threshold-based tax for sugar content for both carbonated and fruit-based beverages. Following the implementation of the threshold-based tax, the selling prices of large PET packs of the CSD portfolio were reduced by approximately 20 per cent from February 2019, whilst the selling prices of selected SKUs will be revised in the first quarter of 2019/20. The revisions in prices are expected to have a positive impact on the volumes, which were in any case seeing a positive momentum.
In furtherance of the Beverage business’ strategy to diversify its portfolio to create a more balanced mix of CSD and non-CSD variants, the business launched dairy and water products in April and June 2018, respectively. Both the dairy and water ranges, launched under the "Elephant House" brand, have been very well received by consumers.
The Frozen Confectionery business recorded an encouraging volume growth of 10 per cent during the year under review, driven by growth in the Impulse segment. Whilst the business recorded volume growth, profits were impacted, as anticipated, by plant commissioning and start-up costs due to the gradual ramp-up of production at the new ice cream plant in Seethawaka and the depreciation and finance expense relating to the investment. The new facility will be pivotal to the long-term growth prospects of the business,
given the scalability of its product range and volumes, and higher operational efficiencies. During the year, six new impulse varieties were launched.
Keells Food Products PLC (KFP) recorded a 7 per cent growth in volumes and a more profitable sales mix. Given evolving consumer trends and lifestyles, and the envisaged growth trajectory of convenience meal options in Sri Lanka, KFP is finalising the development of new products to diversify its product portfolio in this category.
RETAIL
The Retail industry group recorded revenue of Rs.55.75 billion and EBITDA of Rs.2.15 billion, contributing 36 per cent and 8 per cent to Group revenue and EBITDA respectively. The recurring EBITDA for 2018/19 decreased by 15 per cent over the previous year. The Supermarket business recorded EBITDA of Rs.1.62 billion in 2018/19, an 18 per cent decrease against the previous financial year. This decline in EBITDA is primarily on account of the one-off charges for the refitting and rebranding of outlets as well as the time taken for certain new outlets opened during the year to ramp-up their scale of operations.
As planned, the refit and rebranding of all outlets was completed by November 2018 and the new "Keells" brand was formally launched during the year under review. The new brand has been very well received by our customers in addition to being recognised as the most valuable supermarket brand by Brand Finance in April 2019. We are confident that the new brand proposition and offering will continue to help drive footfall in line with our expectations.
The Supermarket business recorded a growth of 4.5 per cent in customer footfall which contributed towards a modest growth of 2.3 per cent in same store sales, despite the subdued macro conditions which resulted in a contraction in average basket values. Same store sales growth was also impacted by the disruption due to the rebranding and refit of outlets that was executed during the year. During the year under review, 18 new outlets were opened, bringing the total outlet count to 96 as at 31 March 2019.
The penetration of modern fast moving consumer goods (FMCG) retail in the country remains low, compared to more developed regional countries, and continues to present a significant opportunity for growth. The business will continue to strategically expand its outlet network and distribution capabilities in gaining market share. The state-of-the-art centralised distribution centre is expected to be operational by the second half of 2020/21, further enhancing operational processes, and in particular, strengthening the "fresh" supply chain of the business.
The Nexus Mobile loyalty programme, which enables the business to identify key trends in customers and shopping lifestyles using data analytics, will be a key tool in retaining and attracting customers and in enhancing customer experience. During the year under review, the loyalty programme membership exceeded 1.2 million unique customers.
Profitability of the Office Automation business was impacted by significant exchange losses arising from the steep depreciation of the Rupee which impacted margins during the year under review.
LEISURE
The Leisure industry group reported revenue, including share of revenue from equity accounted investees, of Rs.24.11 billion and EBITDA of Rs.5.02 billion, contributing 16 per cent and 19 per cent to Group revenue and EBITDA respectively. The recurring EBITDA for 2018/19 decreased by 22 per cent over the previous year. The recurring EBITDA was impacted due to the lacklustre performance of the City Hotels which were impacted by a significant increase in the number of rooms within a short period of time and the impact of the closure of "Cinnamon Hakuraa Huraa Maldives" which was operational in the previous financial year.
During the calendar year 2018, arrivals to Sri Lanka reached 2.3 million, representing a year-on-year growth of 10 per cent, despite the slowdown in growth of business traffic primarily as a result of the political uncertainty which prevailed in the third quarter of the financial year. Whilst the prospect of achieving the target of 4.5 million arrivals for CY2020 set by the Sri Lanka Tourism Development Authority (SLTDA) will have to be revised based on
12 JOHN KEELLS HOLDINGS PLC | ANNUAL REPORT 2018/19
CHAIRMAN'S MESSAGE
the revival momentum of arrivals in light of the Easter Sunday attacks, the growth momentum of arrivals is expected to recover in the medium-term similar to other countries that have experienced terrorist attacks.
The City Hotels sector witnessed a lacklustre year of operations, despite the improvement of overall room nights in the city by 4 per cent. This was predominantly due to the increase in room inventory within Colombo and the aforementioned political developments within the country which impacted MICE and corporate travel during the reporting period. However, it is encouraging that the combined MICE arrivals to the Group’s 5-star properties increased by 13 per cent. Despite the increasingly competitive operating environment, the City Hotels sector maintained its fair share of available rooms in the 5-star category in the year under review. We are confident that the demand for rooms in the city will grow in the medium-term despite the recent setback and the new inventory will be absorbed. The shopping and entertainment offered by some of the new integrated developments like our "Cinnamon Life" project, will further drive demand for city hotels.
The Easter Sunday attacks across the country, one of which was at the "Taprobane" restaurant of "Cinnamon Grand Colombo", claimed the lives of 15 guests and 5 staff members of the hotel. We especially recognise our Cinnamon Grand staff, who, in the most tragic circumstances, displayed true resilience and positivity to serve our valued guests while continuing operations for them and working towards reopening the remaining unaffected areas of the hotel. The hotel commenced accepting new bookings soon after the incident, while its restaurants were opened to the public on 30 April 2019. In the aftermath of this tragedy, security measures have been enhanced and additional safety measures introduced, in consultation with the authorities and security experts, to ensure the safety of guests and staff.
The Sri Lankan Resorts segment maintained average room rates and occupancies in the year, despite the political volatility
that affected the country and the intense competition from both graded and informal sectors, particularly in the coastal areas of the island. The portfolio of the Sri Lankan Resorts segment will be further strengthened post the completion of its flagship property "Cinnamon Bentota Beach" which will be operational by end 2019. "Cinnamon Bentota Beach", which will be positioned as a premium offering, will be developed as an inspiring space combining both luxury and Sri Lankan heritage.
Tourist arrivals to the Maldives displayed signs of a continued recovery with an increase of 7 per cent for the calendar year 2018, on the back of a stable political landscape since the Presidential elections in September 2018. Despite increased activity in the informal sector, the Maldivian Resorts segment maintained its average room rates and occupancies well above the industry average.
The water bungalows of "Ellaidhoo Maldives by Cinnamon" were refurbished during the year, resulting in a partial closure of the property from May to October 2018, whilst "Cinnamon Hakuraa Huraa Maldives" was closed in May 2018 for the reconstruction of a new hotel. "Cinnamon Hakuraa Huraa Maldives" is expected to be operational in December 2019 and will be positioned as a premium luxury beach resort thereby commanding a higher average room rate going forward. It is encouraging that the average room rates recorded by "Cinnamon Dhonveli Maldives", subsequent to the refurbishment undertaken in 2017/18, are above expectations.
Whilst the Group is confident that it can leverage on its investments to drive the next phase of growth in its Maldivian properties given the significant opportunity, the Group has entered in to a Memorandum of Understanding (MoU) and is currently in the process of finalising a sublease agreement for a new property under the "Cinnamon" umbrella. In line with the Group’s asset light strategy for the expansion of rooms under management, the property will be subleased for a period of 10 years with the option for further extensions.
PROPERTY
The Property industry group reported revenue of Rs.711 million and EBITDA of Rs.323 million, contributing 1 per cent to Group EBITDA. The recurring EBITDA for 2018/19 decreased significantly mainly on account of 2017/18 including the one-off recognition of deferred revenue arising from the re-assessment of the revenue recognition policy at Rajawella Holdings (Private) Limited on the sale of leasehold rights and the lower fair value gains on investment property recorded in 2018/19 in comparison to 2017/18.
During the year under review, the Property industry group commenced the construction of its latest residential development, "Tri-Zen", an 891-apartment joint venture residential development project. "Tri-Zen" apartments are based on smart design principles of maximising space, comfort and efficient living, with a number of integrated innovative features to redefine city living. Construction is well underway, with expected completion in the first half of the calendar year 2023. The project has recorded encouraging pre-sales in the year under review, with 200 apartments sold as at 31 March 2019. Unlike most other developments in the city, the selling price of the apartments at "Tri-Zen" are denominated in Sri Lankan Rupees, providing the buyers with an opportunity to purchase housing at affordable price points within Colombo without taking a risk on the currency. It is heartening to note that a majority of the current customers are first-time home buyers, a segment of the market targeted by the Property industry group. Revenue emanating from the sale of apartments of "Tri-Zen" will be recognised from the first quarter of 2019/20 onwards till project completion.
The Group is cognizant that revenue recognition in the Property Development sector has demonstrated a cyclical trend based on projects completed, and given this, the business has taken proactive steps to develop a more robust pipeline of projects. Whilst the Group is of the view that the existing land bank is adequate to sustain a pipeline of projects over the next 8-10 years, the planned pipeline of projects will ensure that some of these lands are monetised over a period of time, ensuring the generation of a consistent cashflow and revenue recognition for the industry
13
group. To this end, master planning is currently underway for the 18-acre land in Thudella and 9.38-acre land in Vauxhall Street, Colombo. These projects will be finalised and launched based on market demand.
The construction of the "Cinnamon Life" project is progressing with encouraging momentum, where the structural work of all buildings is now complete, and the installation of the mechanical and electrical services and the external facades are currently underway. The date for project completion now takes into account the staggered opening of some elements of the project and completion of all works including the detailed interior design work. Accordingly, the completion dates of the residential and office towers will be March 2020, whilst the operations of the hotel and retail mall are expected to commence in March 2021.
The project cost, as estimated in 2013, was approximately USD 805 million, excluding interest during construction and applicable taxes and customs duties. Based on the finalised design concepts and increases in cost since 2013, the project cost is now estimated to be approximately 10 per cent higher.
The pre-sales of the residential towers; "The Suites of Cinnamon Life" and "The Residencies at Cinnamon Life" is currently at 65 per cent of total area available for sale, despite the general slowdown in the residential market. Given the steep depreciation of the Rupee and the political disruption in the country during the last quarter of 2018, traction on apartment and office sales has been subdued. The momentum is expected to improve as completion draws nearer. The total revenue from the sale of the residential apartments and 10 floors of the commercial office space of the "Cinnamon Life" project is estimated to be USD 250 million, which will be recognised post the handover of the sold units.
The equity and debt financing requirement for the "Cinnamon Life" project remains secured with the conclusion of the required debt financing for the project in December 2014 and availability of cash reserves to meet equity commitments through the capital raised, and internally generated cash. The relevant sections of the
USD 395 million syndicated project loan agreement will be amended to reflect the revised timelines of the project.
FINANCIAL SERVICES
The Financial Services industry group recorded revenue, including the share of revenue from equity accounted investees, of Rs.18.93 billion and EBITDA of Rs.4.55 billion, contributing 12 per cent and 18 per cent to Group revenue and EBITDA respectively. The recurring EBITDA for 2018/19 decreased by 17 per cent over the previous year.
As elaborated in the 2017/18 Annual Report, UA’s profits for 2017/18 included a one-off surplus of Rs.3.38 billion which was transferred from the life policyholder fund to the life shareholder fund based on the directive issued by the Insurance Regulatory Commission of Sri Lanka (IRCSL) to the entire insurance industry in March 2018. Further, as communicated in the 2017/18 Annual Report, the life insurance surplus of Rs.3.64 billion was the optimum value transfer for 2017 as indicated by the independent actuary. Given the normalisation in line with usual course of operations, UA recorded an annual life insurance surplus of Rs.1.10 billion in 2018/19. In addition to the lower life insurance surplus, profits of UA were also impacted by mark-to-market losses amounting to Rs.1.17 billion on its equity investment portfolio.
During the year under review, UA recognised a deferred tax asset of Rs.1.57 billion, arising from brought forward tax losses. In this light, the net income tax charge for 2018/19 of Rs.528 million was offset by the one-off recognition of the deferred tax asset of Rs.1.57 billion in the Income Statement, which resulted in a net income tax reversal of Rs.1.04 billion.
The Banking industry recorded healthy growth driven mainly by the strong credit demand stemming from both the private and public sectors. Whilst net interest margins were maintained, Nations Trust Bank (NTB) recorded a double-digit growth in both deposits and advances. The growth in loans and advances was primarily driven by the corporate banking, credit cards and leasing segments. However, profitability during the year under review was impacted by the introduction of the Debt Repayment
Levy in October 2018 and higher impairment charges due to the heightened credit risk from subdued macro-economic conditions and the implementation of SLFRS 9. You will be pleased to note that the Bank was recognised as one of the top five SME Banks of the Year in Asia at the Global SME Finance Awards conducted by the International Finance Corporation. NTB is the only Sri Lankan bank to achieve this recognition.
The Bank’s digital banking platform "FriMi", which was launched in 2017, continued its positive growth trajectory, reaching Rs.1.00 billion in transactions during December 2018. "FriMi" was also recognised as one of the top 30 digital banks in the Asia Pacific region by the Asian Banker.
OTHER, INCLUDING INFORMATION TECHNOLOGY AND PLANTATION SERVICES
The Information Technology sector recorded revenue of Rs.851 million and EBITDA of Rs.192 million. The recurring EBITDA for 2018/19 increased significantly over the previous year. The Information Technology sector recorded an increase in profitability on account of onboarding new clients and higher interest income on the back of cash and cash equivalents held by companies in the BPO business.
The Plantation Services sector recorded revenue of Rs.2.80 billion and EBITDA of Rs.495 million. The recurring EBITDA for 2018/19 decreased by 29 per cent over the previous year. The performance of the Plantation Services sector was impacted by a decrease in tea prices and crops during the year under review.
Other, comprising of the Holding Company and other investments, and the Information Technology and Plantation Services sectors, together, recorded revenue of Rs.3.75 billion and EBITDA of Rs.6.39 billion for 2018/19, contributing 3 per cent and 25 per cent to Group revenue and EBITDA, respectively. The recurring EBITDA for 2018/19 increased by 1 per cent over the previous year. Although the Company recorded higher exchange gains on the Company’s foreign currency denominated cash holdings, EBITDA was impacted by lower interest income on account of lower cash and cash equivalents at the Company.
14 JOHN KEELLS HOLDINGS PLC | ANNUAL REPORT 2018/19
CHAIRMAN'S MESSAGE
RESEARCH AND INNOVATION
John Keells Research (JKR), the research and development arm of the Group, following the patenting of a novel energy storage material in 2016/17, filed a Patent Corporation Treaty (PCT) application and a patent application in Taiwan in 2017/18. During the year under review, the PCT application was published by the World Intellectual Property Office (WIPO), allowing JKR to commence the process of marketing the technology to potential licensees.
JKR concluded a collaborative research project which entailed a novel technology to convert waste to energy, with a university in the United States. JKR is currently seeking potential buyers for this technology, to be used on a commercial scale in Sri Lanka. JKR continues to work on numerous other research projects with a view to creating intellectual property.
The year under review marked a significant milestone as JKR was selected to participate in a project titled "Enabling IP Environment" conducted by WIPO; the only private sector-based research group that has been selected to participate in this programme, globally.
During the year under review, the Group continued its concerted effort to drive a culture of disruptive innovation amongst our employees and businesses. An award on Disruptive Innovation was presented for the third time at the JKH Chairman’s Awards 2018, to recognise businesses which have made disruptive innovation an integral part of their operating culture and have formulated successful responses to address current, and emerging, disruptions to business. The third phase of "John Keells X: An Open Innovation Challenge" was launched in December 2018. Post rigorous evaluation, 15 applicants were shortlisted for the pre-accelerator programme. The shortlisted applicants will be provided with training and development, including workshops on various aspects of entrepreneurship and valuing start-ups. Winners of the challenge will advance to a six-month accelerator programme, which will link them to a channel of resources, both within and outside the Group.
ADVANCED ANALYTICS
During the year under review, the Group, in consultation with a leading global management consulting firm, embarked on an initial phase of an advanced analytics transformation journey. The Group will leverage on the diversity of industries the Group operates in, and the unparalleled access to a comprehensive data ecosystem, to capitalise on this unique opportunity. The Group will pursue the roll-out of a road map of well-defined advanced analytics Use Cases, which aim to unlock significant value and address key business challenges across value chains in the industry groups we operate in. To this end, a well-defined data governance framework entailing the overall management of the availability, usability, integrity and security of data used will be implemented, thereby ensuring accountability, efficient monitoring and quality control. The Group is of the view that the advanced analytics programme will be pivotal to stay abreast of changing business landscapes while driving businesses towards a greater degree of data driven decision making.
EMPLOYEES
The value creation process of the Group has been built around our loyal and committed employees, and I wish to pay tribute to them for their contribution in what has been a challenging year. Over the years, we have attracted the best and the brightest talent towards building a strong team that reflects the diversity of the customers we serve. We continue to engage and encourage our employees to perform to the best of their ability through a performance-oriented culture founded on ethical and transparent behaviour which, in turn, promotes sustainable and profitable growth. The Corporate Governance Commentary and the Group Consolidated Review sections of this Report explain in further detail the best practices, policies and procedures that are in place to ensure that John Keells is "More Than Just a Work Place".
During the year under review, the Group launched a state-of-the-art human resource information platform. Against the backdrop of a constantly changing human resource landscape and diverse workforce, this platform will further empower evolving
employee-centric practices. It is expected to bring about a multitude of benefits, including, but not limited to, business efficiency, analytics and employee engagement.
CORPORATE GOVERNANCE
I am pleased to state that there were no departures from any of the provisions of the Code of Business Conduct and Ethics of the Code of Best Practice of Corporate Governance, jointly advocated by the Securities and Exchange Commission of Sri Lanka and the Institute of Chartered Accountants of Sri Lanka.
During the year under review, several initiatives were undertaken to strengthen the Group’s governance framework and controls. These include strengthening and streamlining the Group’s cyber security resilience through device management, user access and data protection to cater to the evolving hybrid cloud environment and digitisation requirements of the Group. Other initiatives also included the data classification and rights managements initiatives for data and two-factor authentication for employee accounts. Further details on compliance can be found in the Corporate Governance Commentary of this Report.
SUSTAINABILITY
This Report has been prepared in accordance with the GRI Standards: Core option. The Report contains the overall sustainability strategy, framework and performance of the Group.
As a constituent of its sustainability strategy, and alongside its comprehensive risk management process, the Group continuously seeks to conserve energy and water, reduce carbon emissions, dispose of waste responsibly, provide training and development to employees, maintain a safe working environment and ensure the highest standards of product stewardship. The Group has further extended this to its value chain over time through ongoing engagements and awareness creation with key suppliers through regular fora, encouraging the sharing of supplier best practices, the supplier code of conduct and onsite assessments.

15
As stated in the Annual Report 2016/17, the Group established energy and water reduction goals, to achieve a 12 per cent reduction in its energy usage and a 6 per cent reduction in its water usage by the year 2020, against its 2015/16 baseline figures. I am pleased to state that for the first time this year, despite lower levels of operational activity in the Consumer Foods industry group contributing to a higher per operating factor energy usage, the Group experienced a reduction in energy usage against its baseline. The Group reported a 2 per cent reduction in energy usage and achieved an 8 per cent reduction in water usage against the aforesaid baseline, thus progressing beyond the stated water goal. The Group continues to strive to achieve the energy goal through initiatives, whilst also focusing on the use of more renewable energy in the Retail and Leisure industry groups.
I am pleased to announce that we made significant progress this year as well on the agenda items reported in last year’s Integrated Annual Report. Although the Group’s carbon footprint increased by 3 per cent to 98,695 MT, in absolute terms, as a result of higher levels of operational activity in the Retail and Transportation industry groups, key industry groups such as Leisure, Consumer Foods and Retail experienced a combined reduction of 10 per cent in carbon footprint per million rupees of revenue, thus reflecting the positive results of the initiatives embarked upon in these areas. Similarly, during the year under review, water withdrawal reduced by 3 per cent to 1,796,120 cubic meters, whilst Leisure, Consumer Foods and Retail reported a combined reduction of 15 per cent in water withdrawal per million rupees of revenue. Waste generated reduced by 10 per cent to 8,307 MT due to lower volumes of waste generated by the Consumer Foods industry group.
From an employee perspective, 204 incidents of occupational injuries were recorded this year, whilst Group employees received 45 hours of training per person, on average. It should be noted that the training hours for employees are determined on a needs basis, where business specific training gaps are identified in respect of both operating and roof competencies in keeping with the Group Learning and Development policy guidelines.
Plasticcyle
During the year under review, the Group continued its social entrepreneurship initiative "Plasticcycle", which was launched in 2017/18 with the aim of significantly reducing plastic pollution in Sri Lanka. Plasticcycle completed the first phase of its Southern Expressway Project with the placement of 48 specially designed bins at all exits points and the service area of the Southern Expressway. The plastic waste collected through this project is recycled into value-added products that are sold in both local and international markets by the recycling partner. Bins were also placed at "Keells" outlets across Colombo and Kalutara districts, schools in Gampaha and several tourist attractions across the country.
CORPORATE SOCIAL RESPONSIBILITY
The John Keells Group is fully committed to our responsibility to make a positive difference in the communities we operate in, and its contribution towards "People, Planet, Partnership, Prosperity and Peace" in terms of the Sustainable Development Goals. Corporate Social Responsibility (CSR) is an integral part of our business ethos that permeates naturally throughout the organisation while staff volunteerism is a key component enabling our staff to enrich their personal experiences through community engagement and service.
Our CSR activities continue to focus on six verticals, namely, Education, Health, Environment, Livelihood Development, Arts & Culture and Disaster Relief. All projects undertaken are inspired and sustained by our CSR vision of "Empowering the Nation for Tomorrow". The CSR initiatives of the Group are centrally planned and implemented by John Keells Foundation (Foundation), a company limited by guarantee and registered as a "Voluntary Social Service Organisation" with the Ministry of Social Welfare. JKH is a participant of the United Nations Global Compact and ensures that its activities are aligned to the Sustainable Development Goals and national priorities. Whilst further details are available under the Group Consolidated Review and Industry Group Review sections of this Report, following are some of the highlights of the Foundation’s work during the year.
English Language Scholarship Programme
A total of 648 school children registered for "English for Teens" courses.
Neighbourhood Schools Development Project
The annual career guidance programme benefited 85 Ordinary Level students of five underserved Government schools in Colombo.
Soft Skills for University Undergraduates
The Foundation conducted a full-day soft skills workshop at the Sabaragamuwa University in collaboration with the Alumni Association of the Faculty of Management, benefiting 525 students.
Project WAVE (Working Against Violence through Education)
The following key initiatives were conducted towards addressing gender based violence and child abuse:
A public transport campaign coinciding with the International Day for the Elimination of Violence Against Women was conducted for the third successive year, under the theme "See it, Report it, Prevent it". The campaign targeted commuters at four main public and private bus terminals of the city through awareness stickers pasted inside buses and information cards distributed to commuters resulting in an estimated cumulative reach of 100,000 commuters.
Completion of 11 awareness sessions on preventing and addressing sexual harassment in the workplace, impacting a total of 432 staff.
A police training programme in partnership with The Asia Foundation where 41 police officers from 8 police stations of the Colombo Central Police Division were trained on responding effectively, and appropriately, to instances of violence against women.
A pilot 2-day teacher training workshop was conducted in collaboration with the Western Province Department of Education for 55 Health and Physical Education (H&PE) teachers of the Colombo zone towards empowering them to communicate the H&PE syllabus effectively, including awareness on Child Protection.

16 JOHN KEELLS HOLDINGS PLC | ANNUAL REPORT 2018/19
CHAIRMAN'S MESSAGE
John Keells Vision Project
A total of 5 eye camps were conducted resulting in the identification of 384 cataract patients and completion of 324 cataract surgeries. Under the School Screening Programme in the Colombo district, a collaboration with the Ministry of Health, vision screening was conducted in 117 schools where over 27,500 school children were tested and 1,547 spectacles donated.
Village Adoption
The year in review witnessed the closure of the development programme in Morawewa (Trincomalee district) following completion of the Foundation’s 5-year engagement.
In Mullaitivu, a community centre was constructed for the fisheries society of Puthumathalan, while an impact and gap assessment was undertaken in the two villages following the completion of the Foundation’s 5-year engagement towards identifying and executing key activities prior to project closure.
In Nithulemada, the Foundation spearheaded the establishment of a women’s society to support gender participation, capacity building and communal harmony. A workshop on mosquito net making was conducted for 24 members of the society.
Praja Shakthi Community Awareness
The Foundation launched its Praja Shakthi (community empowerment) initiative with a community awareness programme held in Colombo with the participation of 75 persons. The objective of the programme is to empower participants through awareness on expanding career opportunities in the country, the skills and mindsets that are required to benefit from such opportunities, and the importance of safeguarding community health, safety and security through awareness creation on gender and child protection as well as prevention of substance abuse.
Kala Pola
Kala Pola, Sri Lanka’s popular annual open-air art fair - conceptualised by The George Keyt Foundation and funded and organised by the John Keells Group for 25 successive years - was successfully held with the participation of 357 artists and sculptors from various parts of Sri Lanka, attracting over 31,800 visitors.
Guru Gedara Festival
"Cinnamon Life", together with the Foundation, were the title sponsors of "The Guru Gedara Festival" organised by the Chitrasena Vajira Dance Foundation which showcased 59 local traditional artistes and one foreign panelist providing an immersive experience to over 1,000 visitors and a unique learning opportunity for over 250 dance teachers and University students.
Beach cleaning initiative
The Foundation, together with Cinnamon Hotels & Resorts, commemorated National Coastal and Marine Resource Conservation Week by organising beach clean-ups in Beruwela, Hikkaduwa, Trincomalee and Yala in collaboration with the Marine Environment Protection Authority with the participation of approximately 200 volunteers.
Our Volunteers
During the year in review, the Foundation launched its "Volunteer Connect" App, a one-stop-shop for volunteer engagement. A total of 4,652 hours of CSR volunteerism by 786 staff volunteers was recorded across the John Keells Group in respect of activities conducted by the Foundation. This number excludes the substantial volunteer activities undertaken at the business or sector level.
Share Repurchase
As announced to the Colombo Stock Exchange, the repurchase offer for 69,376,433 ordinary shares, (being 5 per cent of its issued shares) concluded in January 2019, with acceptance of 46 per cent of the offer (32,189,118 ordinary shares) and the balance (37,187,315 ordinary shares) being accepted proportionately based on applications for additional shares to be repurchased. Accordingly, a total amounting to Rs.11.10 billion was paid out on 25 January 2019.
DIVIDENDS
Your Board declared a third and final dividend of Rs.1.00 per share to be paid on 14 June 2019. The first and second interim dividends for the year of Rs.2.00 per share, each, were paid in November 2018 and February 2019, respectively. In addition, the share repurchase, as discussed above, resulted in an outlay of Rs.11.10 billion which effectively amounted to a distribution of Rs.8.00 per share.
The total dividend payout for 2018/19 including the share repurchase amounted to Rs.17.83 billion. The Group will follow its dividend policy which corresponds with growth in profits, whilst ensuring that the Company maintains adequate funds to support its investment pipeline and optimise its capital structure.
RETIREMENTS AND APPOINTMENTS
I would like to place on record our deep appreciation for the invaluable contribution made by Mr. Susantha Ratnayake, who retired with effect from 31 December 2018, for his 4 decades of dedicated service to the Group, and astute leadership as Chairman in the last 13 years. I wish him the very best in his future endeavours.
I welcome Dr. Radhika Coomaraswamy who was appointed to the Board with effect from 1 October 2018 as an Independent Non-Executive Director.
CONCLUSION
In conclusion, on behalf of the Board of Directors and all employees of the John Keells Group, I thank all our stakeholders for the support extended to the Group during the year. I also wish to thank all staff of the John Keells Group for their unstinted commitment and cooperation throughout the year, and, in particular, during this challenging period.
Finally, I thank my colleagues on the Board and the Group Executive Committee for their guidance and support extended to me during the year.
Krishan Balendra Chairman
24 May 2019
17
INVESTOR RELATIONSGROUP HIGHLIGHTS
The JKH Investor Presentations, which include an update on the latest financial results, are available on the corporate website to provide easier access and in-depth detail of the operational performance of the Group.
https://www.keells.com/resource/investor-presentation.pdf
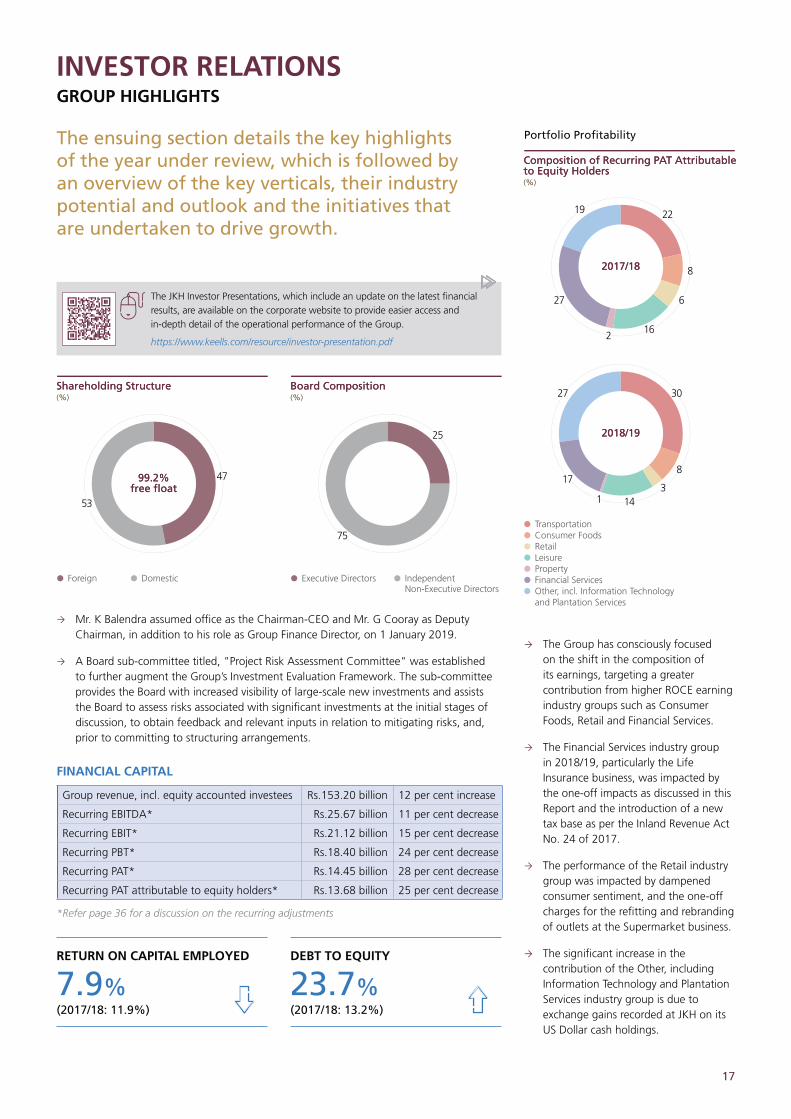
The ensuing section details the key highlights of the year under review, which is followed by an overview of the key verticals, their industry potential and outlook and the initiatives that are undertaken to drive growth.
47
53
(%)(%)
Foreign Domestic
Shareholding StructureShareholding Structure
99.2%free float
99.2%free float
25
75
(%)(%)
Executive Directors IndependentNon-Executive Directors
Board CompositionBoard Composition
Mr. K Balendra assumed office as the Chairman-CEO and Mr. G Cooray as Deputy Chairman, in addition to his role as Group Finance Director, on 1 January 2019.
A Board sub-committee titled, "Project Risk Assessment Committee" was established to further augment the Group’s Investment Evaluation Framework. The sub-committee provides the Board with increased visibility of large-scale new investments and assists the Board to assess risks associated with significant investments at the initial stages of discussion, to obtain feedback and relevant inputs in relation to mitigating risks, and, prior to committing to structuring arrangements.
FINANCIAL CAPITAL
Group revenue, incl. equity accounted investees Rs.153.20 billion 12 per cent increase
Recurring EBITDA* Rs.25.67 billion 11 per cent decrease
Recurring EBIT* Rs.21.12 billion 15 per cent decrease
Recurring PBT* Rs.18.40 billion 24 per cent decrease
Recurring PAT* Rs.14.45 billion 28 per cent decrease
Recurring PAT attributable to equity holders* Rs.13.68 billion 25 per cent decrease
*Refer page 36 for a discussion on the recurring adjustments
Portfolio Profitability
2219
27
2
8
6
16
(%)(%)
TransportationConsumer FoodsRetailLeisurePropertyFinancial ServicesOther, incl. Information Technologyand Plantation Services
3027
17
1
8
143
Composition of Recurring PAT Attributableto Equity HoldersComposition of Recurring PAT Attributableto Equity Holders
2017/182017/18
2018/192018/19
The Group has consciously focused on the shift in the composition of its earnings, targeting a greater contribution from higher ROCE earning industry groups such as Consumer Foods, Retail and Financial Services.
The Financial Services industry group in 2018/19, particularly the Life Insurance business, was impacted by the one-off impacts as discussed in this Report and the introduction of a new tax base as per the Inland Revenue Act No. 24 of 2017.
The performance of the Retail industry group was impacted by dampened consumer sentiment, and the one-off charges for the refitting and rebranding of outlets at the Supermarket business.
The significant increase in the contribution of the Other, including Information Technology and Plantation Services industry group is due to exchange gains recorded at JKH on its US Dollar cash holdings.
RETURN ON CAPITAL EMPLOYED
(2017/18: 11.9%)
7.9%DEBT TO EQUITY
(2017/18: 13.2%)
23.7%

18 JOHN KEELLS HOLDINGS PLC | ANNUAL REPORT 2018/19
INVESTOR RELATIONSGROUP HIGHLIGHTS
0
1
2
3
4
5
6
7
8(Rs.bn)(Rs.bn) (%)(%)
2014/15
8 8784
40
54
4547
34
2015/16 2016/17 2017/18 2018/19
Dividend paid Dividend pay-out
0
10
20
30
40
50
60
JKH Equity Market Trading Statistics
2018/19 2017/18
Average daily turnover (Rs.million) 211 177 Percentage of total market turnover (%) 30 17 Market capitalisation (Rs.million) 205,635 221,450 Percentage of total market capitalisation (%) 7.9 7.3
JKH concluded the offer to repurchase a maximum of 69,376,433 Ordinary Shares (being 5 per cent of its issued shares), at a price of Rs.160.00 per share, on a pro rata basis of 1 share for every 20 shares held, in January 2019, which resulted in a payment of Rs.11.10 billion to equity holders.
SHARE REPURCHASE
The sensational and popular musical "Mamma Mia", produced by Judy Craymer, Richard East and Björn Ulvaeus, was brought to Colombo for an eight-day run in December 2018, as a part of an international tour; the first ever performance in South Asia. Some other events organised by "Cinnamon" include "The Clairvoyants", "Cinnamon TBCasia", and "Nigella Lawson in Sri Lanka".
NATURAL CAPITAL
The Group commissioned an independent benchmarking organisation to validate the existing benchmarks and establish new benchmarks for companies operating in selected industry groups.
2019/20 energy reduction goal status
REDUCTION ON AN ABSOLUTE BASIS, MATCHED AGAINST A BASELINE ACTIVITY LEVEL
Status as at 2018/19
2%vs. 2015/16 Baseline
Goal for 2019/20
12%vs. 2015/16 Baseline
2019/20 water reduction goal status
REDUCTION ON AN ABSOLUTE BASIS, MATCHED AGAINST A BASELINE ACTIVITY LEVEL
Status as at 2018/19
8%vs. 2015/16 Baseline
Goal for 2019/20
6%vs. 2015/16 Baseline
HUMAN CAPITAL The Group migrated to a state-of-the-art
cloud-based human resource information platform from the on-premise system used by the Group during the previous ten years.
The Group’s Compensation Policy was revised based on feedback obtained from employees through surveys and also based on a detailed study conducted by an internationally-renowned HR consulting firm on behalf of the Group. In order to further align the interests of Group employees in the capacity of Vice President and above levels, existing short-term incentive plans were revised and a long-term cash-based incentive plan, linked to the 5-year strategic plans, was also announced.
Workforce as at 31 March 2019 20,713
Employees 13,923
Outsourced personnel 6,790
The multiple terror attacks across the country on Easter Sunday, 21 April 2019, resulted in the loss of many lives, including staff members and guests at "Cinnamon Grand Colombo" and "John Keells Logistics". In the aftermath of this tragedy, the Group undertook necessary steps to ensure that employees have access to resources to come to terms with this terrible tragedy. Additionally, security measures were also enhanced, and
additional safety measures introduced, in consultation with authorities and security experts, across our hotels and resorts, and Group companies.
SOCIAL AND RELATIONSHIP CAPITAL Community services and infrastructure
project spend - Rs.115 million.
Sri Lanka’s annual open-air art fair "Kala Pola", which promotes visual art, showcased 357 artists and sculptors and attracted a record 31,847 visitors, both local and foreign.
Contributed towards the sponsorship of the construction of AYATI’s Supported Employment Unit focused on steering the employment/vocation related goals of children with disabilities.
Project WAVE (Working Against Violence through Education)
Employee awareness - cumulative impact to-date: 323,687 persons
Awareness campaign targeting commuters of public transport at four bus depots in Colombo, under the theme "See it, Report it, Prevent it"; estimated reach of 100,000 commuters.
INTELLECTUAL CAPITAL The Group, in consultation with a leading
global management consulting firm, embarked on phase 1 of an advanced analytics transformation journey.
"John Keells X - Open Innovation Challenge 2017": An investment of Rs.2 million for each of the 6 winners of the challenge was made available during the year under review. A winner of the "John Keells X - Open Innovation Challenge 2017", "Helios", a peer-to-peer lending platform which leverages on blockchain technology, secured approval for further investment through the JKX accelerator programme.
JKX 3.0: JKX launched its third open innovation challenge in December 2018.
The Company’s dividend policy seeks to ensure a dividend payout that corresponds with growth in profits, whilst ensuring that the Company maintains adequate funds to support its investment pipeline and optimise its capital structure.

19
PERFORMANCE HIGHLIGHTS
Indicator Unit 2018/19 2017/18 2016/17
Financial Capital
Group revenue - consolidated Rs.million 135,456 121,215 106,273
Group earnings before interest expense and tax (EBIT) Rs.million 21,338 28,155 23,324
Group earnings before interest expense, tax, depreciation and amortisation (EBITDA) Rs.million 25,890 32,174 27,222
Group profit before tax (PBT) Rs.million 18,616 27,634 22,888
Group profit after tax (PAT) Rs.million 16,237 23,120 18,117
Group profit attributable to shareholders Rs.million 15,254 21,021 16,275
Diluted earnings per share Rs. 11.1 15.1 11.8
Return on equity (ROE) % 7.5 11.1 9.8
Return on capital employed (ROCE) % 7.9 11.9 11.5
Total assets Rs.million 363,797 322,448 277,272
Net debt (cash)* Rs.million 4,385 (33,519) (55,309)
Total shareholders' funds Rs.million 204,287 199,920 178,635
Economic value retained Rs.million 11,620 16,716 12,796
Dividend paid per share Rs. 6.0 6.0 5.5
Market capitalisation Rs.million 205,635 221,445 191,332
Natural Capital
Energy consumption - non-renewable resources per Rs.million of revenue GJ 2.68 3.02 3.19
Energy consumption - renewable resources per Rs.million of revenue GJ 0.77 0.91 0.94
Purchased energy - national grid per Rs.million of revenue GJ 2.75 3.01 3.25
Direct greenhouse gas emissions - scope 1 MT 27,507 27,532 25,727
Indirect greenhouse gas emissions - scope 2 MT 71,188 68,534 66,384
Total carbon footprint per Rs.million of revenue MT 0.72 0.8 0.85
Water withdrawal per Rs.million of revenue m3 13.13 15.42 18.74
Water discharge m3 1,191,031 1,414,546 1,460,799
Volume of hazardous waste generated MT 382 439 329
Waste recycled/reused by Group companies and through third party contractors % 46 41 42
Human Capital
Total workforce (employees and contract staff) Persons 20,713 20,361 20,100
Employee benefit liability as of 31 March Rs.million 2,085 1,971 1,880
Total attrition % 24 26 24
Injuries Number 204 209 213
Average hours of training per employee Hours 45 47 41
Employee receiving performance reviews % 100 100 100
Social and Relationship Capital
Proportion of purchases from suppliers within Sri Lanka % 78 72 83
Community engagement Number of persons impacted 946,082 1,455,814 1,010,200
Proportion of labels carrying ingredients used % 80 80 80
Proportion of labels carrying information on disposal % 93 92 93
Proportion of labels carrying sourcing of components % 1 1 1
* Net cash or net debt, as applicable, excludes short-term investments of the life fund of UA, restricted regulatory fund at UA and customer advances in the Property Development sector.

20 JOHN KEELLS HOLDINGS PLC | ANNUAL REPORT 2018/19
INVESTOR RELATIONSGROUP HIGHLIGHTS
The following section details the key industry verticals in which the Group operates in, the industry potential, outlook and the initiatives that are undertaken to drive growth. Whilst this summation of the key investment considerations of our industry groups are meant to provide a snapshot for ease of understanding, this section should be read in conjunction with the Industry Group Review section of this Report to obtain a more comprehensive insight of the drivers and strategy of our businesses.
While it may be premature to assess the medium to long-term impacts on the economy as a result of the Easter Sunday attacks, we believe that the macro-economic fundamentals will be able to withstand and overcome these incidents, and as such we have not revised the outlook of our business, with the exception of the short-term impact on Leisure, at this juncture of time. In any event, it should be noted that the Strategy and Outlook section of the ensuing write-up reflects strategic priorities, including, and beyond, the short-term horizon.
Refer the Industry Group Review section - page 77
TRANSPORTATION
The Port of Colombo (POC) is strategically positioned on the main East-West shipping routes.
Current capacity utilisation of the POC is approximately 85 per cent, demonstrating strong potential for capacity led growth.
Prospects for private sector participation, particularly in the ports and bunkering industries.
Expected increase in bunkering market driven by increased storage and infrastructure.
Growing demand for logistics services through growth in inbound project cargo and other major industries.
Explore overall opportunities arising from the Port of Colombo and Port of Hambantota, particularly in relation to bunkering and storage.
Focus on a better mix of Transshipment:Domestic TEUs to optimise profitability.
Evaluate the potential for purpose built and anchored facilities.
Increase warehousing footprint and expansion of portfolio.
Airline business to strengthen its network of airlines and expand selling to long-haul sectors.
42 per cent stake in SAGT – container terminal (capacity of approximately 2 million TEUs).
Leading bunkering services provider.
One of the largest cargo and logistics service providers in the country.
JV with Deutsche post for DHL air express and AP Moller for Maersk Lanka.
GSA for Air Asia, KLM, Gulf Air and Jet Airways.
Warehousing and supply chain management.
Domestic scheduled and charter air taxi operations.
Industry Potential
Our Business
Strategy and Outlook
PORTS AND SHIPPING, AND BUNKERING LOGISTICS AND TRANSPORTATION
Key Financial Indicators 2018/19 % 2017/18 %
SAGT volumes (TEU) 2,073,661 11 1,871,011 10
Transshipment:Domestic mix 81:19 80:20
Port of Colombo volumes (TEU) 7,131,821 11 6,446,223 11
Bunkering volume growth (%) 6 24
Warehouse space under management (CBM) 315,000 27 248,986 30
Dar-es-Salam
Mombasa
Lamu
Aden
BahlGwadar
Karachi KolkataChittagong
Yangon
Chennai
Vishakhapatnam
Mumbai
Kochi
The strategic location of the Port of Colombo linking key shipping routes
CICT
CICT - Colombo International Container TerminalECT - East Container TerminalSAGT - South Asia Gateway TerminalJCT - Jaya Container Terminal
ECT
SAG
T JCT
The Port of Colombo
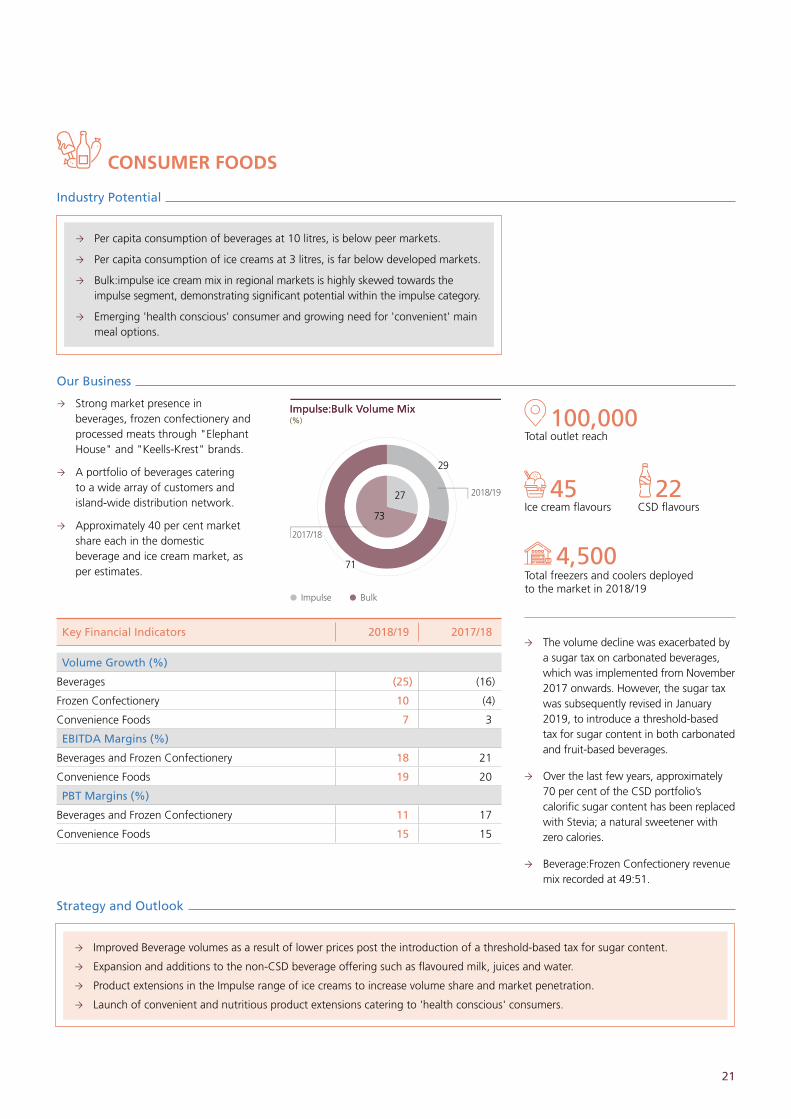
21
CONSUMER FOODS
Per capita consumption of beverages at 10 litres, is below peer markets.
Per capita consumption of ice creams at 3 litres, is far below developed markets.
Bulk:impulse ice cream mix in regional markets is highly skewed towards the impulse segment, demonstrating significant potential within the impulse category.
Emerging 'health conscious' consumer and growing need for 'convenient' main meal options.
Improved Beverage volumes as a result of lower prices post the introduction of a threshold-based tax for sugar content.
Expansion and additions to the non-CSD beverage offering such as flavoured milk, juices and water.
Product extensions in the Impulse range of ice creams to increase volume share and market penetration.
Launch of convenient and nutritious product extensions catering to 'health conscious' consumers.
Strong market presence in beverages, frozen confectionery and processed meats through "Elephant House" and "Keells-Krest" brands.
A portfolio of beverages catering to a wide array of customers and island-wide distribution network.
Approximately 40 per cent market share each in the domestic beverage and ice cream market, as per estimates.
Industry Potential
Our Business
Strategy and Outlook
Key Financial Indicators 2018/19 2017/18
Volume Growth (%)
Beverages (25) (16)
Frozen Confectionery 10 (4)
Convenience Foods 7 3
EBITDA Margins (%)
Beverages and Frozen Confectionery 18 21
Convenience Foods 19 20
PBT Margins (%)
Beverages and Frozen Confectionery 11 17
Convenience Foods 15 15
29
2018/19
2017/18
71
(%)(%)
Impulse Bulk
Impulse:Bulk Volume MixImpulse:Bulk Volume Mix
27
73
100,000Total outlet reach
4,500Total freezers and coolers deployed to the market in 2018/19
The volume decline was exacerbated by a sugar tax on carbonated beverages, which was implemented from November 2017 onwards. However, the sugar tax was subsequently revised in January 2019, to introduce a threshold-based tax for sugar content in both carbonated and fruit-based beverages.
Over the last few years, approximately 70 per cent of the CSD portfolio’s calorific sugar content has been replaced with Stevia; a natural sweetener with zero calories.
Beverage:Frozen Confectionery revenue mix recorded at 49:51.
45 22Ice cream flavours CSD flavours
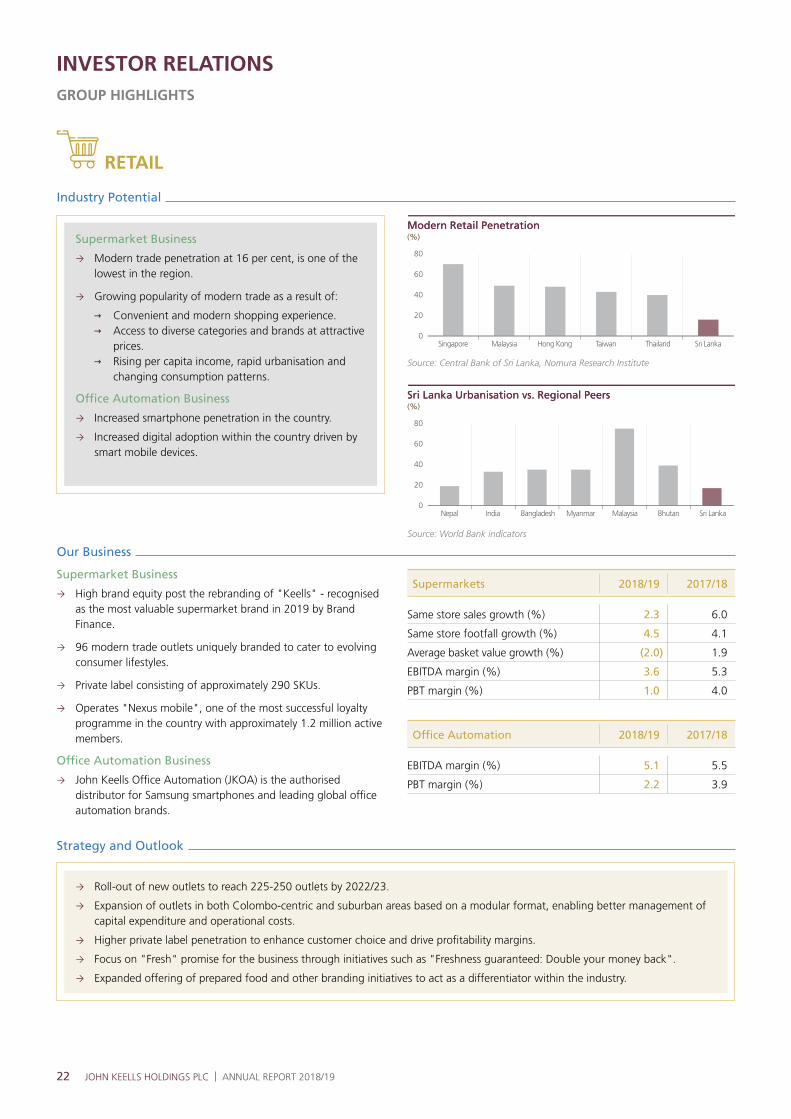
22 JOHN KEELLS HOLDINGS PLC | ANNUAL REPORT 2018/19
INVESTOR RELATIONSGROUP HIGHLIGHTS
RETAIL
Supermarket Business
Modern trade penetration at 16 per cent, is one of the lowest in the region.
Growing popularity of modern trade as a result of:
Convenient and modern shopping experience. Access to diverse categories and brands at attractive
prices. Rising per capita income, rapid urbanisation and
changing consumption patterns.
Office Automation Business
Increased smartphone penetration in the country.
Increased digital adoption within the country driven by smart mobile devices.
Industry Potential
0
20
40
60
80
Modern Retail PenetrationModern Retail Penetration(%)(%)
Singapore Malaysia Hong Kong Taiwan Thailand Sri Lanka
0
20
40
60
80
Sri Lanka Urbanisation vs. Regional PeersSri Lanka Urbanisation vs. Regional Peers(%)(%)
Nepal India Bangladesh Myanmar Malaysia Bhutan Sri Lanka
Supermarket Business
High brand equity post the rebranding of "Keells" - recognised as the most valuable supermarket brand in 2019 by Brand Finance.
96 modern trade outlets uniquely branded to cater to evolving consumer lifestyles.
Private label consisting of approximately 290 SKUs.
Operates "Nexus mobile", one of the most successful loyalty programme in the country with approximately 1.2 million active members.
Office Automation Business
John Keells Office Automation (JKOA) is the authorised distributor for Samsung smartphones and leading global office automation brands.
Our Business
Supermarkets 2018/19 2017/18
Same store sales growth (%) 2.3 6.0
Same store footfall growth (%) 4.5 4.1
Average basket value growth (%) (2.0) 1.9
EBITDA margin (%) 3.6 5.3
PBT margin (%) 1.0 4.0
Office Automation 2018/19 2017/18
EBITDA margin (%) 5.1 5.5
PBT margin (%) 2.2 3.9
Strategy and Outlook
Roll-out of new outlets to reach 225-250 outlets by 2022/23.
Expansion of outlets in both Colombo-centric and suburban areas based on a modular format, enabling better management of capital expenditure and operational costs.
Higher private label penetration to enhance customer choice and drive profitability margins.
Focus on "Fresh" promise for the business through initiatives such as "Freshness guaranteed: Double your money back".
Expanded offering of prepared food and other branding initiatives to act as a differentiator within the industry.
Source: World Bank indicators
Source: Central Bank of Sri Lanka, Nomura Research Institute

23
LEISURE
Encouraging growth momentum of tourist arrivals to Sri Lanka (5-year CAGR of 13 per cent - CY2018).
Proximity to India and increased flight connectivity.
Infrastructure led growth driving MICE and corporate tourists.
Sought after tourist destination in the region, with increased popularity and recognition – centered around its natural diversity and cultural heritage.
Industry Potential
0
500
1,000
1,500
2,000
2,500
(’000)(’000)
1985 1996 2007 2018
Annual Tourist Arrivals toSri Lanka Annual Tourist Arrivals toSri Lanka
0.0
0.5
1.0
1.5
2.0
2.5
(mn. arrivals)(mn. arrivals)
2017 2018 2019 2020 2021
Indian Outbound MICE Indian Outbound MICE
"Cinnamon", a well-established hospitality brand in Sri Lanka and the Maldives.
Diverse product offering based on "Inspired living". Combined room inventory of 2,427 rooms under management in both
Sri Lanka and the Maldives. Land bank of 125 acres of freehold and 111 acres of leasehold land in
key tourism locations. Leading inbound tour operator.
Our Business
2018/19 2017/18
City Hotels*Occupancy (%) 48 64ARR (USD) 128 127EBITDA margin (%) 22 27Sri Lankan Resorts
Occupancy (%) 80 81ARR (USD) 90 91EBITDA margin (%) 28 28Maldivian Resorts
Occupancy (%) 84 82ARR (USD)** 320 309EBITDA margin (%) 23 24
*Excludes "Cinnamon red Colombo" **The increase in ARR is mainly as a result of the higher ARR from the refurbished suites at "Cinnamon Dhonveli Maldives"
Strategy and Outlook
Although it is premature to assess or quantify the impact to the industry, tourist arrivals to Sri Lanka will be impacted in the short-term by the terror attacks which took place on Easter Sunday, 21 April 2019. In light of the resultant impact to the industry, the Group’s Leisure vertical revised its plans for the immediate short-term, with greater focus on the domestic markets to revive the industry.
Some of the short to medium strategies include:
Initiate marketing and outreach efforts once adverse travel advisories from key tourist markets are removed.
Implement a volume-based strategy via online marketing campaigns and other promotional activities.
Develop agile cost structures within the hotel properties to remain flexible in managing short-term operational costs.
Long-term strategies:
Greater focus on asset light investment models as a part of the strategy to enhance the "Cinnamon" footprint:
Monetise the land bank available through joint ventures.
Increase exposure in lucrative regional markets.
Investments to enhance the "Cinnamon" brand value and develop digital channels.
Focus on corporate and MICE tourist segments.
Current investments:
"Cinnamon Hakuraa Huraa Maldives" and "Cinnamon Bentota Beach Bentota": reconstruction of new hotels with expected completion in December 2019.
"Cinnamon red Kandy": 40 per cent equity stake at an investment of Rs.1.00 billion and management contract with expected completion in the second half of 2020/21.
Increasing rooms under management via leased hotel properties in the Maldives.
3 City Hotels
11 Resort Hotelsin Sri Lanka and the Maldives
2,427rooms under management: Sri Lanka : 2,087 rooms Maldives : 340 rooms
1new property under development in Sri Lanka
Source: Sri Lanka Tourism Development Authority
Source: MasterCard
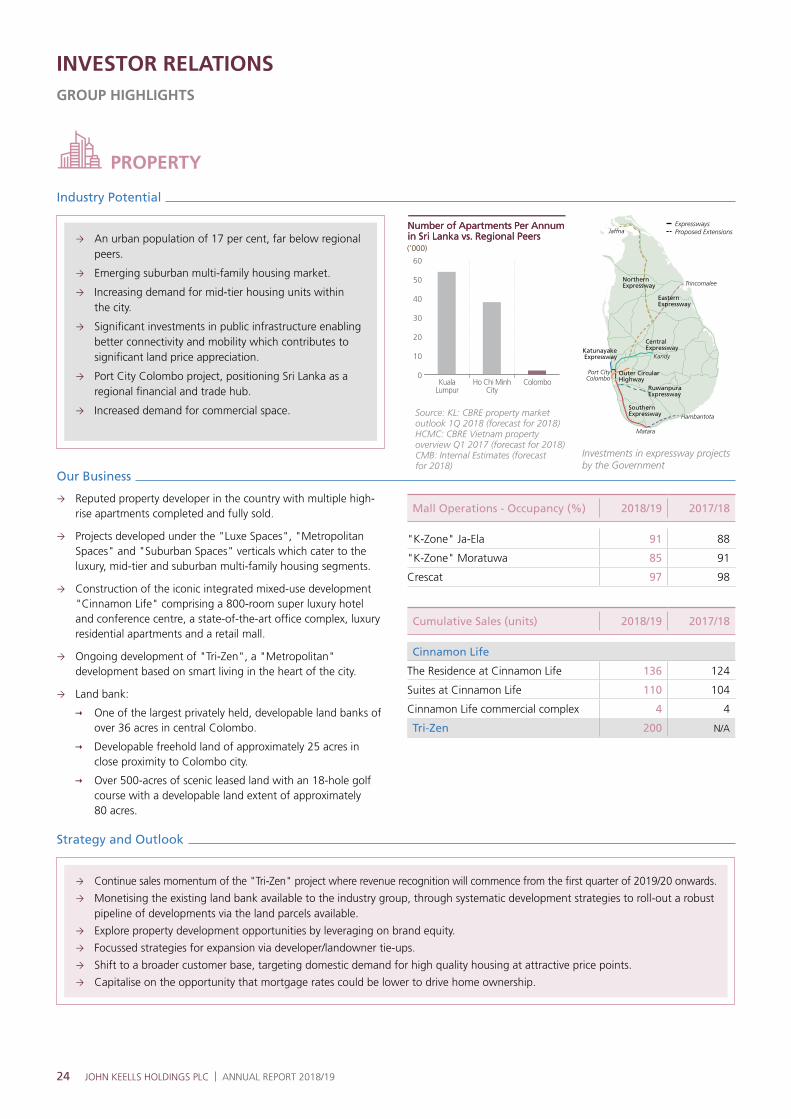
24 JOHN KEELLS HOLDINGS PLC | ANNUAL REPORT 2018/19
PROPERTY
INVESTOR RELATIONSGROUP HIGHLIGHTS
An urban population of 17 per cent, far below regional peers.
Emerging suburban multi-family housing market.
Increasing demand for mid-tier housing units within the city.
Significant investments in public infrastructure enabling better connectivity and mobility which contributes to significant land price appreciation.
Port City Colombo project, positioning Sri Lanka as a regional financial and trade hub.
Increased demand for commercial space.
Industry Potential
Reputed property developer in the country with multiple high-rise apartments completed and fully sold.
Projects developed under the "Luxe Spaces", "Metropolitan Spaces" and "Suburban Spaces" verticals which cater to the luxury, mid-tier and suburban multi-family housing segments.
Construction of the iconic integrated mixed-use development "Cinnamon Life" comprising a 800-room super luxury hotel and conference centre, a state-of-the-art office complex, luxury residential apartments and a retail mall.
Ongoing development of "Tri-Zen", a "Metropolitan" development based on smart living in the heart of the city.
Land bank:
One of the largest privately held, developable land banks of over 36 acres in central Colombo.
Developable freehold land of approximately 25 acres in close proximity to Colombo city.
Over 500-acres of scenic leased land with an 18-hole golf course with a developable land extent of approximately 80 acres.
Our Business
0
10
20
30
40
50
60
Number of Apartments Per Annumin Sri Lanka vs. Regional PeersNumber of Apartments Per Annumin Sri Lanka vs. Regional Peers(’000)(’000)
KualaLumpur
Ho Chi MinhCity
Colombo
Mall Operations - Occupancy (%) 2018/19 2017/18
"K-Zone" Ja-Ela 91 88
"K-Zone" Moratuwa 85 91
Crescat 97 98
Cumulative Sales (units) 2018/19 2017/18
Cinnamon Life
The Residence at Cinnamon Life 136 124
Suites at Cinnamon Life 110 104
Cinnamon Life commercial complex 4 4
Tri-Zen 200 N/A
Strategy and Outlook
Continue sales momentum of the "Tri-Zen" project where revenue recognition will commence from the first quarter of 2019/20 onwards.
Monetising the existing land bank available to the industry group, through systematic development strategies to roll-out a robust pipeline of developments via the land parcels available.
Explore property development opportunities by leveraging on brand equity.
Focussed strategies for expansion via developer/landowner tie-ups.
Shift to a broader customer base, targeting domestic demand for high quality housing at attractive price points.
Capitalise on the opportunity that mortgage rates could be lower to drive home ownership.
Central Expressway
Northern Expressway
Eastern Expressway
Kandy
Jaffna
Trincomalee
Hambantota
Matara
Port CityColombo
Southern Expressway
Katunayake Expressway
Outer Circular Highway
ExpresswaysProposed Extensions
Ruwanpura Expressway
Source: KL: CBRE property market outlook 1Q 2018 (forecast for 2018) HCMC: CBRE Vietnam property overview Q1 2017 (forecast for 2018) CMB: Internal Estimates (forecast for 2018)
Investments in expressway projects by the Government

25
FINANCIAL SERVICES
Life Insurance Industry
Life Insurance penetration at 0.54 per cent of GDP, one of the lowest penetrated markets in the South Asian region.
Ageing population and rising per capita income.
Under-utilised bancassurance and digital distribution channels, despite high bank branch density.
Banking Industry
Industry loans and advances growth of 19 per cent in calendar year 2018.
Industry ROE of 13.2 per cent.
Growing popularity of digital banking.
Industry Potential
Our Business
Strategy and Outlook
0.0
1.0
2.0
3.0
4.0
Insurance Penetration and DensityInsurance Penetration and Density(%)(%)
Sri L
anka
Viet
nam
Indo
nesia
Philip
pine
s
Indi
a
Mala
ysia
Asia
AVG
Thail
and
Euro
pe A
VG
North
Amer
ica A
VG
0
5
10
15
20
25
Insurance Industry Performance vs. GDPInsurance Industry Performance vs. GDP(%)(%)
2013
GDP growth
2014 2015 2016 2017
Life GWP growth Life insurance assets growth
Key Financial Indicators CY2018 CY2017
Life Insurance
Premium growth (%) 11 22
Market share (%) 14 14
Life fund (Rs.billion) 30.6 29.1
Capital adequacy ratio (%) 262 352
Banking
Growth in loans and advances (%) 19 25
Return on equity (%) 15.3 17.4
Net interest margin (%) 4.6 4.5
NPL ratio (%) 4.6 2.3
Capital adequacy ratio - total capital (%) 15.6 13.9
GWP growth of 11 per cent in CY2018 versus industry GWP growth of 13 per cent.
Operating footprint of 88 branches, excluding virtual locations.
Agency force of over 4,000.
Third largest producer of new business.
Market share of 14 per cent.
Focus on bancassurance through the development of differentiated, customer-oriented lifestyle products.
Focus on innovation and data analytics for higher operational efficiencies and better insight.
Drive growth via digital channels and straight through processing.
Loan growth of 19 per cent.
Branch network of 94 outlets and 127 ATMs.
Strong online presence.
Sri Lanka’s first digital bank, "FriMi".
Largest issuer of credit cards in Sri Lanka.
Focus on mobile and digital solutions, and innovative products.
Leverage on IT platforms and related investments to drive growth.
Drive asset growth through cross-selling, relationship driven portfolio management and growth of savings base.
Focus on increasing the offering to the mass affluent segment for Consumer Banking and Corporate and SME segments.
Portfolio management and preserving credit quality.
LIFE INSURANCE
LIFE INSURANCE
BANKING
BANKING

26 JOHN KEELLS HOLDINGS PLC | ANNUAL REPORT 2018/19
OTHER, INCLUDING INFORMATION TECHNOLOGY AND PLANTATION SERVICES
INVESTOR RELATIONSGROUP HIGHLIGHTS
Increased digital adoption within the country and growing digital literacy.
Investment in futuristic technology infrastructure.
Businesses and operations increasingly adopting digital practices.
Competitive labour force and high-quality services to drive the BPO industry.
Software solutions and consultation services based on Internet of Things (IoT), Robotic Process Automation (RPA) and other digital stack solutions.
Brand presence in MENA and APAC regions as a leading digital solutions provider.
Strategic partnerships with SAP, Microsoft, UiPath and Deloitte.
Strengthen brand presence in the MENA and APAC regions.
Product innovation through cloud computing, IoT and RPA.
Explore scalability of successfully rolled out solutions.
Leverage on strategic partnerships with SAP, Microsoft, and IBM, among others, to expand its client and partner footprint, whilst placing emphasis on reviewing and rationalising product and service portfolios.
Sustained growth in global tea consumption with growing demand for value-added tea.
Anticipated growth in demand from Middle Eastern countries.
Increased focus on existing as well as new markets, whilst capitalising on the unique flavour, quality and brand presence of "Ceylon Tea".
Leading tea and rubber broker.
Operates 7 tea factories producing both CTC and orthodox tea.
Manufacturer of low grown teas.
Automation of manufacturing processes to yield higher production efficiency and improved quality.
Diversify manufacturing mix to meet market trends and mitigate risk.
Industry Potential
INFORMATION TECHNOLOGY
INFORMATION TECHNOLOGY
INFORMATION TECHNOLOGY
PLANTATION SERVICES
PLANTATION SERVICES
PLANTATION SERVICES
Our Business
Strategy and Outlook

27
SUSTAINABLE DEVELOPMENT GOALS AND IMPACTS
EDUCATION
ARTS & CULTURE
HEALTH
ENVIRONMENT
LIVELIHOOD DEVELOPMENT
DISASTER RELIEF
9,251 YOUTH SKILLED
502 ARTISTS
206,710 PERSONS IMPACTED
3,621 TREES
10,633 BENEFICIARIES
23,018 BENEFICIARIES
To provide better access to educational opportunities for those in need towards enhancing their employability and entrepreneurship.
To nurture the livelihoods of artists and preserve our cultural heritage towards safeguarding and promoting Sri Lankan arts and culture.
To foster healthy communities towards enhancing well-being and productivity of Sri Lanka and Sri Lankans.
To minimise the impact of our operations and promote conservation and sustainability towards enhancing environmental and natural capital.
To foster sustainable livelihoods through relevant skills, capacity and infrastructure enhancement towards building empowered and sustainable communities.
To come to the aid of Sri Lankans and global communities in times of adversity and disaster towards enabling them to rebuild their lives and livelihoods.
In executing operational decisions, the Group strives to align its strategies, initiatives, and targets with the Sustainable Development Goals (SDGs) of the United Nations to address and action initiatives aimed at alleviating poverty, protecting the planet and ensuring that all people enjoy peace and prosperity. Given the conglomerate nature of the Group, the ensuing section illustrates the key pillars of John Keells Foundation and the Group's focus on the SDGs through various projects and initiatives. In addition to the below, the Group through its businesses and other initiatives, impacts and contributes to all 17 SDGs.

28 JOHN KEELLS HOLDINGS PLC | ANNUAL REPORT 2018/19
INVESTOR RELATIONS
As a leader in diverse industries, the Group's impact spans far and wide, generating and distributing considerable economic value to the nation and all areas within the Group’s sphere of operations.
ECONOMIC VALUE ADDED STATEMENT
FINANCIAL HIGHLIGHTS – FOURTH QUARTER 2018/19
Summarised below are some of the key highlights for the quarter ended 31 March 2019.
The underlying recurring operating performance of all industry groups, with the exception of Leisure and Financial Services, improved against the previous year. The Consumer Foods and Retail industry groups witnessed growth in profits on the back of improved consumer demand.
Consumer Foods witnessed growth on account of a better performance in the Frozen Confectionery business driven by a 21 per cent growth in volumes, and improved profitability in the Beverage business on account of higher margins.
Retail performance was driven by strong revenue growth in the Supermarket business, supported by new outlets and a reasonable pick up in same store sales to 4.5 per cent.
The decline in Group PBT by 58 per cent to Rs.5.38 billion was mainly due to the one-off surplus and optimal surplus transfer recorded in 2017/18 by the Life Insurance business, Union Assurance PLC (UA), which cumulatively amounted to Rs.7.02 billion. The annual life insurance surplus recorded
by UA amounted to Rs.1.10 billion in 2018/19. Profits of UA were further impacted by mark-to-market losses on its equity investment portfolio due to a decline in the stock market.
Leisure was impacted by lower occupancies in the City Hotels sector due to the increase in room inventory within Colombo and the closure of "Cinnamon Hakuraa Huraa Maldives" for the reconstruction of a new hotel.
Performance of Property was impacted due to 2017/18 including a one-off revenue recognition at Rajawella Holdings Limited on the sale of leasehold rights and lower fair value gains on investment property in 2018/19 in comparison to 2017/18.
The performance for the quarter also included an exchange loss at the Holding Company as a result of the appreciation of the Rupee, in comparison to an exchange gain recorded in the fourth quarter of 2017/18.
INSIGHTS
Direct economic value generated
Rs.154,486mn(2017/18: Rs.139,059 mn)
Economic value retained
Rs.11,620mn(2017/18: Rs.16,716 mn)
Economic value distributed
Rs.142,866mn(2017/18: Rs.122,343 mn)
OPERATING COSTS
Rs.111,019mn(2017/18: Rs.91,349 mn)
EMPLOYEE WAGES & BENEFITS
Rs.14,316mn(2017/18: Rs.13,276 mn)
PAYMENTS TO PROVIDERS OF FUNDS
Rs.11,795mn(2017/18: Rs.10,946 mn)
PAYMENTS TO GOVERNMENT
Rs.5,641mn(2017/18: Rs.6,647 mn)
COMMUNITY INVESTMENTS
Rs.95mn(2017/18: Rs.125 mn)
REVENUE
Rs.135,456mn(2017/18: Rs.121,215 mn)
FINANCE INCOME*
Rs.12,052mn(2017/18: Rs.11,268 mn)
SHARE OF RESULTS OF EQUITY ACCOUNTED INVESTEES
Rs.4,727mn(2017/18: Rs.3,596 mn)
PROFIT ON SALE OF ASSETS & OTHER INCOME
Rs.1,926mn(2017/18: Rs.2,084 mn)
VALUATION GAIN ON INVESTMENT PROPERTY
Rs.325mn(2017/18: Rs.896 mn)
DEPRECIATION
Rs.3,658mn(2017/18: Rs.3,236 mn)
AMORTISATION
Rs.894mn(2017/18: Rs.784 mn)
PROFIT AFTER DIVIDENDS
Rs.7,068mn(2017/18: Rs.12,696 mn)
*Includes interest income from life insurance policy holder funds at Union Assurance PLC
MANAGEMENT DISCUSSION & ANALYSIS
GROUP CONSOLIDATED REVIEW 31 External Environment | 34 Capital Management Review | 60 Outlook
63 Strategy, Resource Allocation and Portfolio Management | 70 Share Information
SCALING
INVESTMENTS

30 JOHN KEELLS HOLDINGS PLC | ANNUAL REPORT 2018/19
As a responsible corporate entity, the John Keells Group focuses on presenting concise, accurate and structured information relevant to our stakeholders’ evolving needs. In our journey forward as a progressive, dynamic conglomerate, we continue to enrich and expand upon best practice in reporting while adhering to globally recognised standards.
This Report is the fourth integrated report of JKH, prepared in accordance with the Integrated Reporting Framework of the International Integrated Reporting Council.
In order to provide our stakeholders an insightful view of the Group’s operations, the Management Discussion and Analysis (MD&A) section of this Report consists of the following:
Group Consolidated Review
Industry Group Review
Whilst the Group Consolidated Review provides the reader a helicopter view of the Group’s performance, the Industry Group Review provides detailed insights to the value creation process of each industry group, including its performance in 2018/19.
The Group Consolidated Review consists of the ensuing sections:
External Environment
Entails a discussion of key macro fundamentals, which impacted favourably or unfavourably, the Group’s ability to create value.
Capital Management Review
Discusses the forms of Capital available for deployment and how such Capital created value to stakeholders at a Group level. It also reviews the performance of each form of Capital and the value enhancement/deterioration during the year under review.
Outlook
Provides a discussion on the economic outlook for Sri Lanka in the short to medium-term, the high-level impacts to the businesses and the overall business strategy of the Group.
Strategy, Resource Allocation and Portfolio Management
Analyses the performance of the overall portfolio, the overall strategy and means by which capital is allocated for investments. The performance of the Group is also measured against the long-term strategic financial objectives of the Group.
Share Information
Entails a discussion on the performance of equities, both globally and regionally, which is followed by a discussion of the JKH share performance. Key disclosures pertaining to shareholders of JKH, as required by relevant regulators, is also included in this section.
31
GROUP CONSOLIDATED REVIEWEXTERNAL ENVIRONMENT
The ensuing section discusses in detail macro-economic conditions, and the political and legal landscape the Group operated in, and the corresponding impacts during the year under review.
The Sri Lankan economy, in real GDP terms, grew by 3.2 per cent during the calendar year 2018, a marginal slowdown in comparison to the growth of 3.4 per cent recorded in CY2017, primarily as a result of a contraction in mining and construction activity. Both headline and core inflation remained subdued during the calendar year 2018, despite the sharp depreciation of the Rupee against most major currencies, transitory price pressures stemming from the upward revisions of petroleum prices and volatile food prices.
Global volatility, particularly pressures stemming from the US Fed’s unprecedented interest rate hiking cycle during 2018, resulted in funds moving away from emerging markets, to which Sri Lanka was not an exception. Although increased foreign exchange outflows, particularly due to higher import expenditure and capital outflows exerted pressure on external sector performance, the country proved resilient, aided by policy measures to curtail non-essential imports by way of increasing tariffs and margin requirements, among others, and a certain degree of political stability towards the end of the financial year.
Delayed implementation of structural reforms and policy uncertainty continued to prevail during the calendar year 2018, dampening business and investor confidence. Confidence was also impacted by the constitutional crisis, though temporary, which transpired towards the end of the calendar year 2018. In this light, both Standard & Poor’s (S&P) and Fitch Ratings downgraded Sri Lanka’s sovereign rating to "B" from "B+", while maintaining a "Stable" outlook on the economy.
Against this macro-economic backdrop, the Sri Lankan Rupee depreciated by 19 per cent against the US Dollar during the calendar year 2018. It is noted that the Central Bank of Sri Lanka (CBSL) pursued a market based exchange rate policy by allowing greater flexibility in the determination of exchange rates, with
minimal intervention to curb unwarranted excessive volatility. The depreciation of the Rupee was exacerbated by the aforementioned political uncertainty, as the depreciation was in line with other currencies till such time the political crisis erupted.
The financial account recorded notable inflows during the year mainly on account of issuance of International Sovereign Bonds (ISBs), the receipt of the fifth tranche of the International Monetary Fund - Extended Fund Facility (IMF-EFF), foreign currency term financing facility and foreign direct investment (FDI) inflows, including receipts from the long lease of the Hambantota Port. Gross official reserves at USD 6.9 billion (~3.7 months of imports) at the end of 2018, is estimated to have improved to USD 7.6 billion as at March 2019 post the successful issuance of ISBs of USD 2.4 billion in March 2019.
In March 2019, the IMF provided assurance that the EFF, originally envisaged to end mid-2019, will be extended by an additional year to support the Government’s fiscal consolidation efforts, external financing conditions and the economic reform agenda of the Government. The bilateral trade agreement with Singapore which came into effect in May 2018 is envisaged to link Sri Lanka with Asia through the creation of inward investment flows and linking of global value chains while also benefiting infrastructure development. Aided by the Generalised System of Preferences by the United States and the Generalised System of Preferences Plus by the European Union, export earnings increased by 4.7 per cent to USD 11.9 billion in 2018 [CY2017: USD 11.4 billion].
It is pertinent to note that Government debt as at the end of the calendar year 2018 stood at Rs.11,978 billion [CY2017: Rs.10,313 billion], which is a debt-to-GDP ratio of 82.9 per cent [CY2017: 76.9 per cent].
The Government’s efforts towards improving economic and social infrastructure continued during 2018. Some efforts in this regard are the commissioning of the Moragahakanda hydropower project, continued construction of the Outer Circular Highway and the Central Expressway, conclusion of the feasibility study of the Ruwanpura Expressway, and the completion of the land reclamation work of the Colombo Port City Project. However, although the Government has recognised the need to enhance the power generation capacity of the country, developments in this regard have not been forthcoming.
The series of coordinated attacks on Easter Sunday, which resulted in a death toll of over 250 people and injured over 500 individuals, is expected to have a negative impact on the tourism industry and related sectors of the economy, in the immediate short-term. In the immediate aftermath of this horrific incident, the Group witnessed disruptions across most of its businesses on the back of heightened security measures and dampened sentiment. Against this backdrop, particularly given adverse travel advisories from key source markets within a few days of the incident, the tourism industry witnessed cancellations. While the Group will play its part in helping the tourism industry and country achieve a speedy recovery, the Group, together with the relevant chambers of commerce, has been in engagement with the relevant authorities to urge them to take immediate steps to prevent a recurrence of such heinous acts and ensure regular and consistent dissemination of information only from designated spokespersons of the Government and military.
Whilst the Outlook section of this review details the impact of Easter Sunday attacks on the future direction of the economy (page 60), the Leisure Industry Group Review entails a discussion on the short-term impacts to the tourism industry and our Leisure businesses - page 108
A detailed discussion on the performance of the Sri Lankan economy is found under the Supplementary Information section (page 314). A more comprehensive discussion of the external environment relevant to the businesses is found in the Industry Group Review section - page 77
MANAGEMENT DISCUSSION AND ANALYSIS
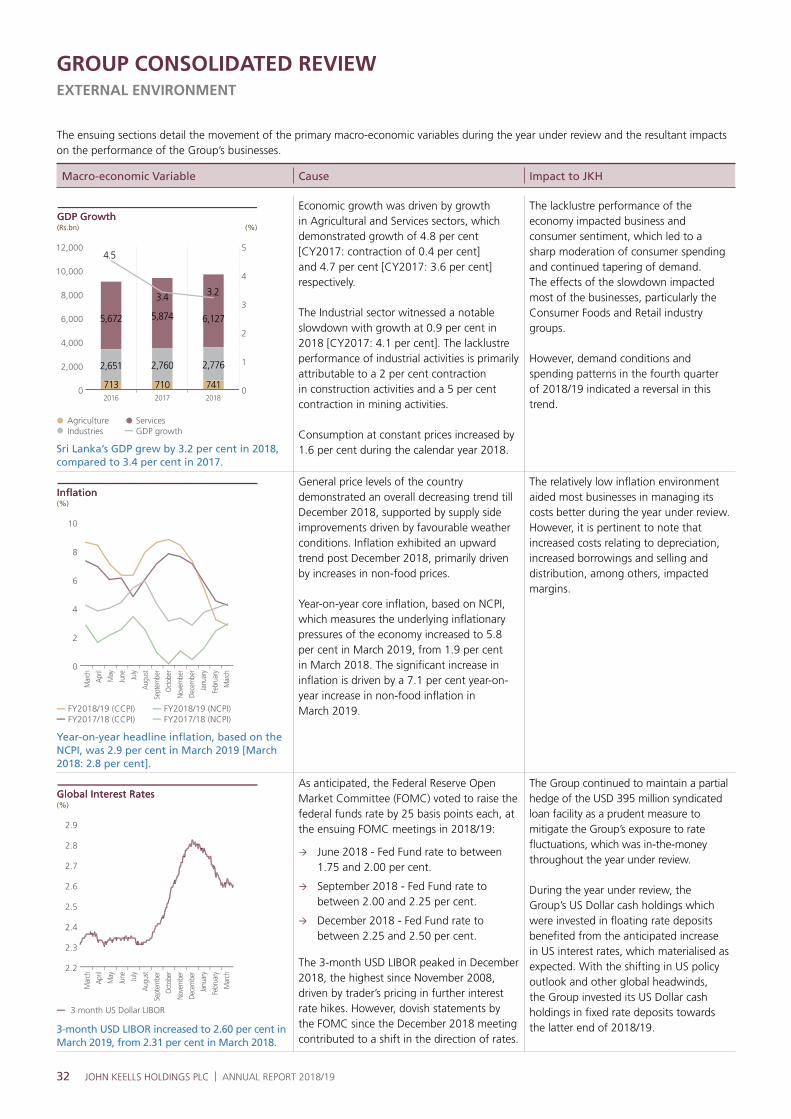
32 JOHN KEELLS HOLDINGS PLC | ANNUAL REPORT 2018/19
GROUP CONSOLIDATED REVIEWEXTERNAL ENVIRONMENT
The ensuing sections detail the movement of the primary macro-economic variables during the year under review and the resultant impacts on the performance of the Group’s businesses.
Macro-economic Variable Cause Impact to JKH
0
2,000
4,000
6,000
8,000
10,000
12,000
(Rs.bn)(Rs.bn) (%)(%)
710 741
2,776
6,127
2,760
5,874
713
2,651
5,672
3.23.4
4.5
2016 2017 2018
AgricultureIndustries
ServicesGDP growth
0
1
2
3
4
5
GDP GrowthGDP Growth
Sri Lanka’s GDP grew by 3.2 per cent in 2018, compared to 3.4 per cent in 2017.
Economic growth was driven by growth in Agricultural and Services sectors, which demonstrated growth of 4.8 per cent [CY2017: contraction of 0.4 per cent] and 4.7 per cent [CY2017: 3.6 per cent] respectively.
The Industrial sector witnessed a notable slowdown with growth at 0.9 per cent in 2018 [CY2017: 4.1 per cent]. The lacklustre performance of industrial activities is primarily attributable to a 2 per cent contraction in construction activities and a 5 per cent contraction in mining activities.
Consumption at constant prices increased by 1.6 per cent during the calendar year 2018.
The lacklustre performance of the economy impacted business and consumer sentiment, which led to a sharp moderation of consumer spending and continued tapering of demand. The effects of the slowdown impacted most of the businesses, particularly the Consumer Foods and Retail industry groups.
However, demand conditions and spending patterns in the fourth quarter of 2018/19 indicated a reversal in this trend.
0
2
4
6
8
10
(%)(%)
Mar
ch
April
May
June July
Augu
st
Sept
embe
r
Oct
ober
Nove
mbe
r
Dece
mbe
r
Janu
ary
Febr
uary
Mar
ch
FY2018/19 (CCPI)FY2017/18 (CCPI)
FY2018/19 (NCPI)FY2017/18 (NCPI)
InflationInflation
Year-on-year headline inflation, based on the NCPI, was 2.9 per cent in March 2019 [March 2018: 2.8 per cent].
General price levels of the country demonstrated an overall decreasing trend till December 2018, supported by supply side improvements driven by favourable weather conditions. Inflation exhibited an upward trend post December 2018, primarily driven by increases in non-food prices.
Year-on-year core inflation, based on NCPI, which measures the underlying inflationary pressures of the economy increased to 5.8 per cent in March 2019, from 1.9 per cent in March 2018. The significant increase in inflation is driven by a 7.1 per cent year-on-year increase in non-food inflation in March 2019.
The relatively low inflation environment aided most businesses in managing its costs better during the year under review. However, it is pertinent to note that increased costs relating to depreciation, increased borrowings and selling and distribution, among others, impacted margins.
2.2
2.3
2.4
2.5
2.6
2.7
2.8
2.9
(%)(%)
3 month US Dollar LIBOR
Global Interest RatesGlobal Interest Rates
Mar
ch
April
May
June July
Augu
st
Sept
embe
r
Oct
ober
Nove
mbe
r
Dece
mbe
r
Janu
ary
Febr
uary
Mar
ch
3-month USD LIBOR increased to 2.60 per cent in March 2019, from 2.31 per cent in March 2018.
As anticipated, the Federal Reserve Open Market Committee (FOMC) voted to raise the federal funds rate by 25 basis points each, at the ensuing FOMC meetings in 2018/19:
June 2018 - Fed Fund rate to between 1.75 and 2.00 per cent.
September 2018 - Fed Fund rate to between 2.00 and 2.25 per cent.
December 2018 - Fed Fund rate to between 2.25 and 2.50 per cent.
The 3-month USD LIBOR peaked in December 2018, the highest since November 2008, driven by trader’s pricing in further interest rate hikes. However, dovish statements by the FOMC since the December 2018 meeting contributed to a shift in the direction of rates.
The Group continued to maintain a partial hedge of the USD 395 million syndicated loan facility as a prudent measure to mitigate the Group’s exposure to rate fluctuations, which was in-the-money throughout the year under review.
During the year under review, the Group’s US Dollar cash holdings which were invested in floating rate deposits benefited from the anticipated increase in US interest rates, which materialised as expected. With the shifting in US policy outlook and other global headwinds, the Group invested its US Dollar cash holdings in fixed rate deposits towards the latter end of 2018/19.
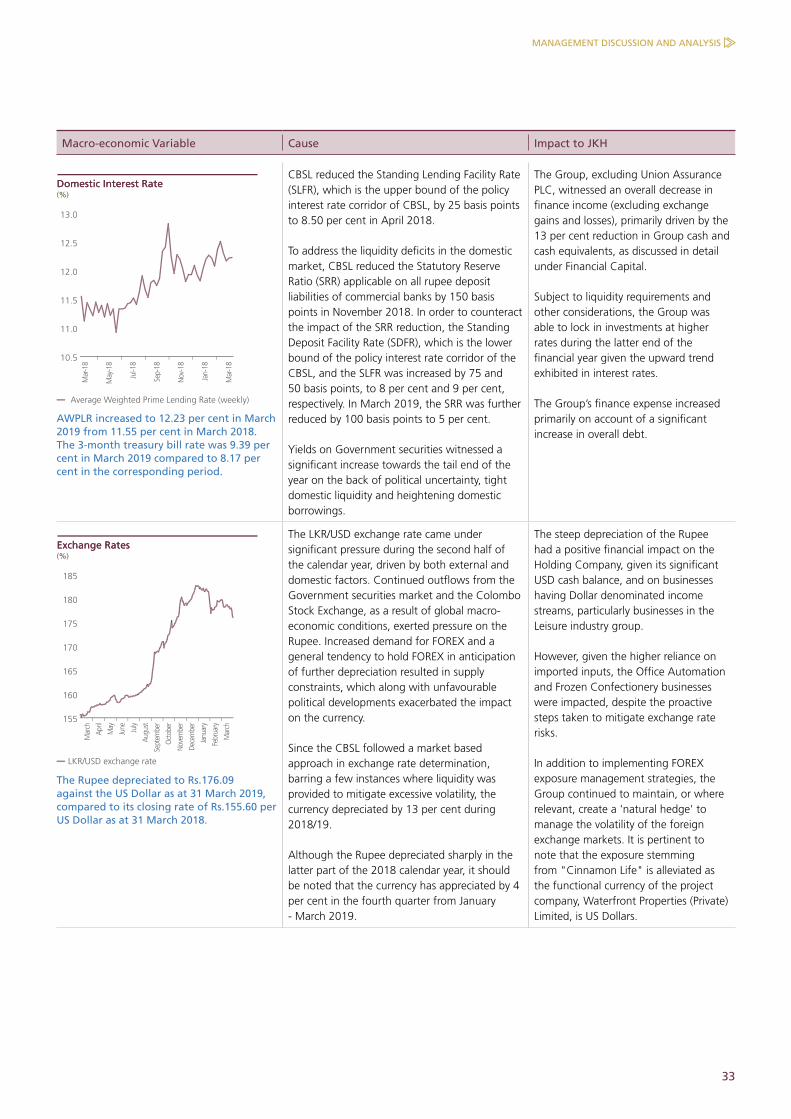
33
Macro-economic Variable Cause Impact to JKH
10.5
11.0
11.5
12.0
12.5
13.0
(%)(%)
Average Weighted Prime Lending Rate (weekly)
Mar
-18
May
-18
Jul-1
8
Sep-
18
Nov
-18
Jan-
18
Mar
-18
Domestic Interest RateDomestic Interest Rate
AWPLR increased to 12.23 per cent in March 2019 from 11.55 per cent in March 2018. The 3-month treasury bill rate was 9.39 per cent in March 2019 compared to 8.17 per cent in the corresponding period.
CBSL reduced the Standing Lending Facility Rate (SLFR), which is the upper bound of the policy interest rate corridor of CBSL, by 25 basis points to 8.50 per cent in April 2018.
To address the liquidity deficits in the domestic market, CBSL reduced the Statutory Reserve Ratio (SRR) applicable on all rupee deposit liabilities of commercial banks by 150 basis points in November 2018. In order to counteract the impact of the SRR reduction, the Standing Deposit Facility Rate (SDFR), which is the lower bound of the policy interest rate corridor of the CBSL, and the SLFR was increased by 75 and 50 basis points, to 8 per cent and 9 per cent, respectively. In March 2019, the SRR was further reduced by 100 basis points to 5 per cent.
Yields on Government securities witnessed a significant increase towards the tail end of the year on the back of political uncertainty, tight domestic liquidity and heightening domestic borrowings.
The Group, excluding Union Assurance PLC, witnessed an overall decrease in finance income (excluding exchange gains and losses), primarily driven by the 13 per cent reduction in Group cash and cash equivalents, as discussed in detail under Financial Capital.
Subject to liquidity requirements and other considerations, the Group was able to lock in investments at higher rates during the latter end of the financial year given the upward trend exhibited in interest rates.
The Group’s finance expense increased primarily on account of a significant increase in overall debt.
155
160
165
170
175
180
185
(%)(%)
LKR/USD exchange rate
Exchange RatesExchange Rates
Mar
ch
April
May
June July
Augu
st
Sept
embe
r
Oct
ober
Nove
mbe
r
Dece
mbe
r
Janu
ary
Febr
uary
Mar
ch
The Rupee depreciated to Rs.176.09 against the US Dollar as at 31 March 2019, compared to its closing rate of Rs.155.60 per US Dollar as at 31 March 2018.
The LKR/USD exchange rate came under significant pressure during the second half of the calendar year, driven by both external and domestic factors. Continued outflows from the Government securities market and the Colombo Stock Exchange, as a result of global macro-economic conditions, exerted pressure on the Rupee. Increased demand for FOREX and a general tendency to hold FOREX in anticipation of further depreciation resulted in supply constraints, which along with unfavourable political developments exacerbated the impact on the currency.
Since the CBSL followed a market based approach in exchange rate determination, barring a few instances where liquidity was provided to mitigate excessive volatility, the currency depreciated by 13 per cent during 2018/19.
Although the Rupee depreciated sharply in the latter part of the 2018 calendar year, it should be noted that the currency has appreciated by 4 per cent in the fourth quarter from January - March 2019.
The steep depreciation of the Rupee had a positive financial impact on the Holding Company, given its significant USD cash balance, and on businesses having Dollar denominated income streams, particularly businesses in the Leisure industry group.
However, given the higher reliance on imported inputs, the Office Automation and Frozen Confectionery businesses were impacted, despite the proactive steps taken to mitigate exchange rate risks.
In addition to implementing FOREX exposure management strategies, the Group continued to maintain, or where relevant, create a 'natural hedge' to manage the volatility of the foreign exchange markets. It is pertinent to note that the exposure stemming from "Cinnamon Life" is alleviated as the functional currency of the project company, Waterfront Properties (Private) Limited, is US Dollars.
MANAGEMENT DISCUSSION AND ANALYSIS

34 JOHN KEELLS HOLDINGS PLC | ANNUAL REPORT 2018/19
GROUP CONSOLIDATED REVIEWCAPITAL MANAGEMENT REVIEW
The key inputs of our value creation model are;
Key inputs of our value
creation model
Financial and Manufactured
Capital
Social and Relationship
Capital
Natural Capital
Intellectual Capital
Human Capital
In addition to the core operations of each of the business units, the Group makes a conscious and collective effort to cater to wider societal needs, meaningfully enriching and empowering the lives of the surrounding communities, via its corporate social responsibility (CSR) arm, John Keells Foundation ("Foundation"). The Group’s CSR initiatives are intrinsically intertwined and connected to social, economic and environment concerns and aligned with the 5Ps of the Sustainable Development Goals (SDGs) - People, Planet, Partnerships, Prosperity and Peace. All initiatives carried out by the Foundation are medium to long-term strategic and sustainable projects inspired by the vision "Empowering the Nation for Tomorrow" within a framework of six focus areas – namely, Education, Health, Livelihood Development, Environment, Arts & Culture and Disaster Relief. Given the integrated nature of this Report, the Group’s CSR initiatives are discussed under the relevant Capital.
Further business specific initiatives of the CSR arm are found in the Industry Group Review section of this Report (page 77) and the John Keells Foundation website (www.johnkeellsfoundation.com).
FINANCIAL AND MANUFACTURED CAPITAL
Sustainable value creation is at the core of all Group activities, and is the fundamental essence of our business model and business framework.
Revenue
Group revenue increased by 12 per cent to Rs.135.46 billion during the year under review [2017/18: Rs.121.22 billion], with the Retail and Transportation industry groups being the primary contributors to revenue growth. The top two businesses that contributed to revenue growth were:
Supermarket business - driven by revenue generated from 18 new outlets opened during the year and steady growth in same store footfall, and;
Bunkering business - driven by a double-digit increase in the base price of bunker fuels and volume growth.
Revenue emanating from domestic sources was Rs.96.97 billion [2017/18: Rs.92.13 billion].
Group revenue, inclusive of equity accounted investees, increased by 12 per cent to
Rs.153.20 billion [2017/18: Rs.137.09 billion]. Revenue from equity accounted investees increased by 12 per cent to Rs.17.74 billion, compared to Rs.15.87 billion in 2017/18. The increases primarily stemmed from:
Nations Trust Bank (NTB), which recorded a 19 per cent growth in loans and advances, and;
South Asia Gateway Terminal (SAGT) on the back of higher volume growth of 11 per cent.
Revenue breakdown across the industry groups, including share of associate revenue, is as follows:
Revenue incl. Equity Accounted Investees (Rs.million) 2018/19 2017/18 %
Transportation 33,729 25,619 32
Consumer Foods 16,208 15,621 4
Retail 55,750 47,441 18
Leisure 24,113 25,298 (5)
Property 711 1,231 (42)
Financial Services 18,931 17,221 10
Other, incl. Information Technology and Plantation Services 3,754 4,658 (19)
Group 153,196 137,089 12
The sections that follow detail the means by which each form of Capital is utilised for the execution of the businesses’ near, medium and long-term strategies in generating sustainable value to all stakeholders concerned. The sections also detail the performance of the Group, under each form of Capital.

35
GROUP REVENUE, INCLUSIVE OF EQUITY ACCOUNTED INVESTEES
EBITDA
GROUP REVENUE
RECURRING EBITDA
(2017/18: Rs.137.09 bn)
(2017/18: Rs.32.17 bn)
(2017/18: Rs.121.22 bn)
(2017/18: Rs.28.80 bn)
Rs.153.20bn
Rs.25.89bn
Rs.135.46bn
Rs.25.67bn
12%
20%
12%
11%
Whilst the reasons for the movements in Transportation and Retail industry group revenue are highlighted previously, revenue of the Property industry group entailed a one-off gain of Rs.547 million in 2017/18 due to the recognition of deferred revenue arising from the re-assessment of the revenue recognition policy at Rajawella Holdings Limited (RHL) on the sale of leasehold rights. For a detailed industry group-wise analysis refer the Industry Group Reviews.
0
5
10
15
20
25
30
35
40
Composition of Revenue incl. Equity Accounted InvesteesComposition of Revenue incl. Equity Accounted Investees(%)(%)
2017/18 2018/19
Transportation LeisureRetailConsumer Foods Property Financial Services Other, incl.InformationTechnology
& Plantation Services
18.7 22
.0
11.4
10.6
34.6
36.4
18.5
15.7
0.9
12.6
12.4
3.4
2.5
0.5
Earnings Before Interest Expense, Tax, Depreciation and Amortisation
During the year under review, earnings before interest expense, tax, depreciation and amortisation (EBITDA) decreased by 20 per cent to Rs.25.89 billion [2017/18: Rs.32.17 billion], with Financial Services, Leisure and Property industry groups being the primary contributors to the EBITDA decline.
Rs.million 2018/19 2017/18 %
Group revenue excl. equity accounted investees 135,456 121,215 12
(-) Cost of sales 107,669 91,932 17
(+) Other operating income 1,926 2,084 (8)
(-) Selling and distribution expenses 5,939 4,227 41
(-) Administration expenses 12,411 12,488 (1)
(-) Other operating expenses 3,705 3,190 16
(+) Finance income 12,052 11,268 7
(+/-) Change in insurance contract liabilities (3,423) (2,449) 40
(+/-) Change in contract liability due to transfer of one off surplus - 3,382 N/A
(+/-) Change in fair value of investment property 325 896 (64)
(+) Share of results of equity accounted investees 4,727 3,596 31
(+) Depreciation and amortisation 4,552 4,018 13
Group EBITDA 25,890 32,174 (20)
In terms of the composition of EBITDA, Other, including Information Technology and Plantation Services was the primary contributor with a 25 per cent contribution, followed by Leisure with a 19 per contribution, Transportation with an 18 per cent contribution and Financial Services with a contribution of 18 per cent.
Since Group EBITDA is affected by one-off impacts, the ensuing section discusses EBITDA on a recurring basis, excluding the one-off impacts outlined below.
0
5
10
15
20
25
30
EBITDA CompositionEBITDA Composition(%)(%)
2017/18 2018/19
Transportation LeisureRetailConsumer Foods Property Financial Services Other, incl.InformationTechnology
& Plantation Services
10.7
17.6
9.9 11
.2
7.8
8.3
19.7
19.4
4.3
27.6
17.6 20
.0
24.7
1.2
"Earnings before interest expense, tax, depreciation and amortisation (EBITDA) decreased by 20 per cent to Rs.25.89 billion [2017/18: Rs.32.17 billion], with Financial Services, Leisure and Property industry groups being the primary contributors to the EBITDA decline."
MANAGEMENT DISCUSSION AND ANALYSIS
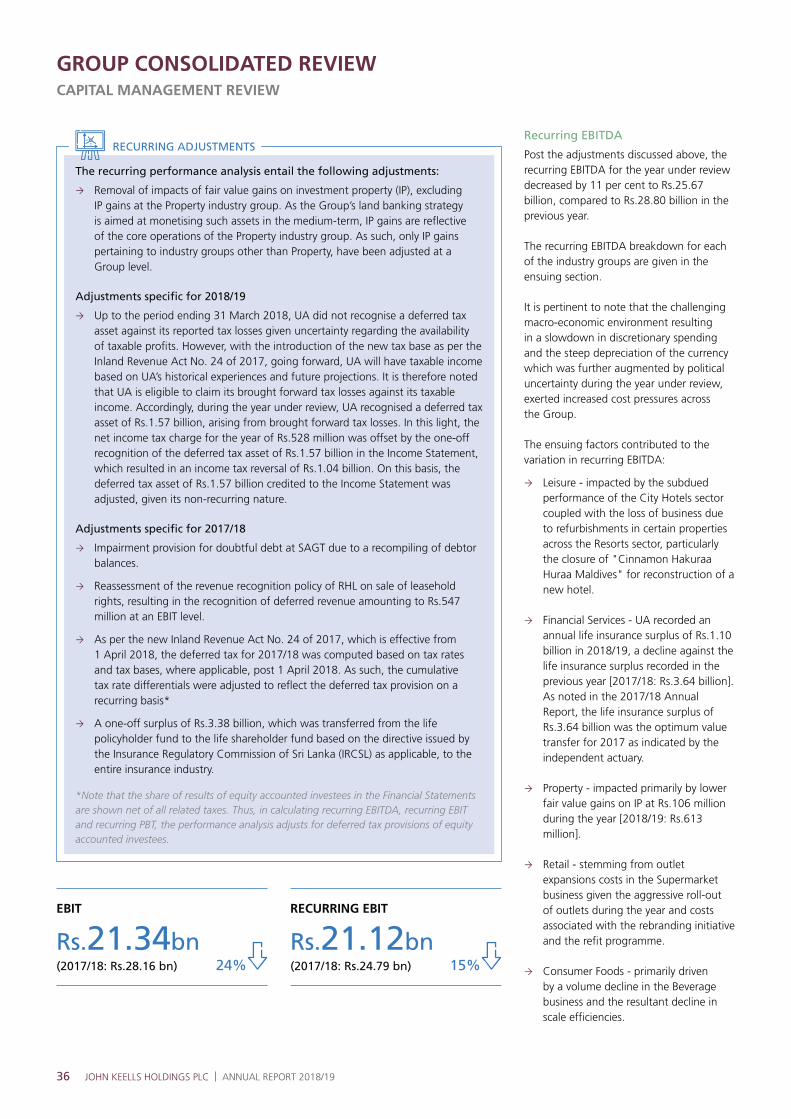
36 JOHN KEELLS HOLDINGS PLC | ANNUAL REPORT 2018/19
GROUP CONSOLIDATED REVIEWCAPITAL MANAGEMENT REVIEW
The recurring performance analysis entail the following adjustments:
Removal of impacts of fair value gains on investment property (IP), excluding IP gains at the Property industry group. As the Group’s land banking strategy is aimed at monetising such assets in the medium-term, IP gains are reflective of the core operations of the Property industry group. As such, only IP gains pertaining to industry groups other than Property, have been adjusted at a Group level.
Adjustments specific for 2018/19
Up to the period ending 31 March 2018, UA did not recognise a deferred tax asset against its reported tax losses given uncertainty regarding the availability of taxable profits. However, with the introduction of the new tax base as per the Inland Revenue Act No. 24 of 2017, going forward, UA will have taxable income based on UA’s historical experiences and future projections. It is therefore noted that UA is eligible to claim its brought forward tax losses against its taxable income. Accordingly, during the year under review, UA recognised a deferred tax asset of Rs.1.57 billion, arising from brought forward tax losses. In this light, the net income tax charge for the year of Rs.528 million was offset by the one-off recognition of the deferred tax asset of Rs.1.57 billion in the Income Statement, which resulted in an income tax reversal of Rs.1.04 billion. On this basis, the deferred tax asset of Rs.1.57 billion credited to the Income Statement was adjusted, given its non-recurring nature.
Adjustments specific for 2017/18
Impairment provision for doubtful debt at SAGT due to a recompiling of debtor balances.
Reassessment of the revenue recognition policy of RHL on sale of leasehold rights, resulting in the recognition of deferred revenue amounting to Rs.547 million at an EBIT level.
As per the new Inland Revenue Act No. 24 of 2017, which is effective from 1 April 2018, the deferred tax for 2017/18 was computed based on tax rates and tax bases, where applicable, post 1 April 2018. As such, the cumulative tax rate differentials were adjusted to reflect the deferred tax provision on a recurring basis*
A one-off surplus of Rs.3.38 billion, which was transferred from the life policyholder fund to the life shareholder fund based on the directive issued by the Insurance Regulatory Commission of Sri Lanka (IRCSL) as applicable, to the entire insurance industry.
*Note that the share of results of equity accounted investees in the Financial Statements are shown net of all related taxes. Thus, in calculating recurring EBITDA, recurring EBIT and recurring PBT, the performance analysis adjusts for deferred tax provisions of equity accounted investees.
Recurring EBITDA
Post the adjustments discussed above, the recurring EBITDA for the year under review decreased by 11 per cent to Rs.25.67 billion, compared to Rs.28.80 billion in the previous year.
The recurring EBITDA breakdown for each of the industry groups are given in the ensuing section.
It is pertinent to note that the challenging macro-economic environment resulting in a slowdown in discretionary spending and the steep depreciation of the currency which was further augmented by political uncertainty during the year under review, exerted increased cost pressures across the Group.
The ensuing factors contributed to the variation in recurring EBITDA:
Leisure - impacted by the subdued performance of the City Hotels sector coupled with the loss of business due to refurbishments in certain properties across the Resorts sector, particularly the closure of "Cinnamon Hakuraa Huraa Maldives" for reconstruction of a new hotel.
Financial Services - UA recorded an annual life insurance surplus of Rs.1.10 billion in 2018/19, a decline against the life insurance surplus recorded in the previous year [2017/18: Rs.3.64 billion]. As noted in the 2017/18 Annual Report, the life insurance surplus of Rs.3.64 billion was the optimum value transfer for 2017 as indicated by the independent actuary.
Property - impacted primarily by lower fair value gains on IP at Rs.106 million during the year [2018/19: Rs.613 million].
Retail - stemming from outlet expansions costs in the Supermarket business given the aggressive roll-out of outlets during the year and costs associated with the rebranding initiative and the refit programme.
Consumer Foods - primarily driven by a volume decline in the Beverage business and the resultant decline in scale efficiencies.
RECURRING EBIT
(2017/18: Rs.24.79 bn)
Rs.21.12bn15%
RECURRING ADJUSTMENTS
EBIT
(2017/18: Rs.28.16 bn)
Rs.21.34bn24%

37
Recurring EBITDA (Rs.million) 2018/19 2017/18 %
Transportation 4,555 4,281 6 Consumer Foods 2,887 3,171 (9)Retail 2,146 2,520 (15)Leisure 4,964 6,330 (22)Property 323 835 (61)Financial Services 4,548 5,491 (17)Other, incl. Information Technology and Plantation Services 6,248 6,177 1 Group 25,672 28,805 (11)
Fair Value Gains on Investment Property
Fair value gains on investment property (IP) were recorded at Rs.325 million in 2018/19 [2017/18: Rs.896 million], comprising gains of Rs.106 million at Property, Rs.140 million in the Other, including Information Technology and Plantation Services industry group, Rs.52 million at Leisure and Rs.25 million in the Consumer Foods industry group.
"It is pertinent to note that the challenging macro-economic environment resulting in a slowdown in discretionary spending, the steep depreciation of the currency which was further augmented by political uncertainty during the year under review exerted increased cost pressures across the Group."
Recurring EBITDA Margins
The recurring EBITDA margins of the Group decreased to 16.8 per cent, from 21.0 per cent in the previous year. The reported and recurring EBITDA margins for each of the industry groups are given below.
EBITDA Margins (%) Reported Recurring
2018/19 2017/18 2018/19 2017/18
Transportation 13.5 13.4 13.5 16.7 Consumer Foods 18.0 20.4 17.8 20.3 Retail 3.8 5.3 3.8 5.3 Leisure 20.8 25.0 20.6 25.0 Property 45.4 112.3 45.4 67.9Financial Services 24.0 51.5 24.0 31.9 Other, incl. Information Technology and Plantation Services 170.2 138.2 166.5 132.6Group 16.9 23.5 16.8 21.0
PBT
(2017/18: Rs.27.63 bn)
Rs.18.62bn33%
RECURRING PBT
(2017/18: Rs.24.27 bn)
Rs.18.40bn24%
The increase in the depreciation and amortisation expense primarily stems from:
the Supermarket business driven by an increase in assets on account of the aggressive roll-out of outlets in the recent years,
the Frozen Confectionery business given higher depreciation costs associated with the new ice cream factory in Seethawaka,
the Maldivian Resorts segment driven by increased depreciation expenses stemming from the refurbishment of "Ellaidhoo Maldives by Cinnamon" and "Cinnamon Dhonveli Maldives" in 2017/18, and
to a lesser extent, the Insurance and Logistics businesses.
As discussed in the 2017/18 Annual Report, the Group has identified investments across its portfolio of businesses which will result in the deployment of a significant quantum of cash in the short to medium-term. These investments, aimed at building capacity and creating avenues for future growth, will result in an increase in the depreciation and amortisation charge of the Group, in the short to medium-term.
INSIGHTS
Depreciation and Amortisation
The depreciation and amortisation expense for the year stood at Rs.4.55 billion, an increase of 13 per cent against the previous year [2017/18: Rs.4.02 billion].
MANAGEMENT DISCUSSION AND ANALYSIS

38 JOHN KEELLS HOLDINGS PLC | ANNUAL REPORT 2018/19
Finance Income
Group finance income stood at Rs.12.05 billion during the year under review, an increase of 7 per cent [2017/18: Rs.11.27 billion], the composition of which is given in the table below.
Finance Income (Rs.000) 2018/19 2017/18
Interest income from life insurance policy holder funds at UA 4,669,211 3,655,295
Interest income of Group excluding UA 5,112,752 6,623,094
Net realised gain on financial assets 6,745 10,602
Other finance income 2,262,893 979,150
Total 12,051,601 11,268,141
Interest income associated with UA of Rs.4.67 billion [2017/18: Rs.3.66 billion], net of related costs, is classified under operating segment results on the basis that the interest income from life insurance funds is considered operational income.
The interest income of the Group, excluding UA, decreased to Rs.5.11 billion [2017/18: Rs.6.62 billion], mainly on account of lower cash and cash equivalents at the Holding Company as equity is progressively infused to fund the equity commitments of "Cinnamon Life".
The increase in other finance income to Rs.2.26 billion is mainly attributable to the increase in exchange rate gains on the Company’s foreign currency denominated cash holdings to Rs.2.13 billion [2017/18: Rs.508 million].
Further details on finance income can be found in the Notes to the Financial Statements section of this Report.
Finance Expense
The finance expense, which includes interest expense, of the Group increased by 423 per cent to Rs.2.72 billion, compared to Rs.521 million recorded in 2017/18. The increase in total debt level of the Group by Rs.24.79 billion to Rs.54.51 billion [2017/18: Rs.29.72 billion] contributed to the increase in finance expense.
The key businesses that contributed to the increase in finance expense are listed below.
UA’s quoted equity securities reported a fair value loss of Rs.1.17 billion during the year under review, given the decline in the value of UA’s equity portfolio due to the performance of the CSE. This is captured under finance expenses.
Funding costs associated with the newly-commissioned ice cream factory which commenced operations during the year.
Finance expenses incurred by the Supermarket business on the back of its aggressive outlet expansion strategy and associated funding.
Funding costs at the Holding Company, primarily as a result of temporary funding to maximise yield on the Company’s short-term investments.
GROUP CONSOLIDATED REVIEWCAPITAL MANAGEMENT REVIEW
0
10
20
30
40
50
Composition of Finance Expense Composition of Finance Expense (%)(%)
2017/18 2018/19
Transportation LeisureRetailConsumer Foods Property Financial Services Other, incl.InformationTechnology
& Plantation Services
11.0
4.6
0.3
7.9 12
.4
21.3
41.5
9.8
6.5
0.1
43.1
28.3
12.0
1.4
Increases in overdraft facilities and import demand loans at the Office Automation business undertaken to manage working capital requirements, particularly in light of the margin requirements imposed on the business by the CBSL which have now been removed.
In terms of composition, the largest contributor to finance expense was the Financial Services industry group accounting for 43 per cent of total finance expense, followed by Retail (21 per cent) and Other, including Information Technology and Plantation Services (12 per cent).
It is highlighted that finance expense incurred under the syndicated project development facility of "Cinnamon Life" is capitalised as work-in-progress under other non-current assets, in accordance with the Group accounting policy, and in keeping with accounting standards.
The interest cover of the Group, excluding mark-to-market investments, stood at 7.8 times in comparison to 53.4 times in 2017/18. The movement in the interest coverage stems primarily from the 423 per cent increase in finance expenditure, as outlined in the preceding section.
0
500
1,000
1,500
2,000
2,500
3,000
(Rs.mn)(Rs.mn) (times)(times)
2014/15
521 2,722436994668
53.452.851.5
27.7
2015/16 2016/17 2017/18 2018/19
Finance expense Interest cover
0
10
20
30
40
50
60
Finance Expense and Interest CoverageFinance Expense and Interest Coverage
7.8
Taxation
The Group tax expense decreased by 47 per cent to Rs.2.38 billion during the year under review [2017/18: Rs.4.51 billion]. The Group tax expense comprised of Rs.1.55 billion from income tax on Group profits [2017/18: Rs.3.66 billion] and Rs.831 million from withholding tax from inter-company dividends [2017/18: Rs.852 million].

39
The effective tax rate (ETR) on Group profits decreased to 12.8 per cent, against 16.3 per cent recorded in 2017/18. The movements in taxation and ETR are attributed to the following:
Up to the period ending 31 March 2018, UA did not recognise a deferred tax asset against its reported tax losses given uncertainty regarding the availability and quantum of taxable profits. However, with the introduction of the new tax base as per the Inland Revenue Act No. 24 of 2017, going forward, UA will have taxable income based on UA’s historical experiences and future projections. It is therefore noted that UA is eligible to claim its brought forward tax losses against its taxable income. Accordingly, during the year under review, UA recognised a deferred tax asset of Rs.1.57 billion, arising from brought forward tax losses. In this light, the net income tax charge for the year of Rs.528 million was offset by the one-off recognition of the deferred tax asset of Rs.1.57 billion in the Income Statement, which resulted in an income tax reversal of Rs.1.04 billion.
Refer Note 20.2 and 27 of the Notes to the Financial Statements for a detailed explanation.
Subdued financial performance of certain businesses taxed at a higher effective tax rate resulted in lower profitability, and lower taxation. As a result, the contribution of such business to Group PBT and Group tax expense has declined, impacting the ETR of the Group.
Other, including Information Technology and Plantation Services, Consumer Foods and Leisure were the highest contributors to the Group tax expense with Rs.2.05 billion, Rs.585 million and Rs.396 million respectively.
For further details on tax impacts, refer the Notes to the Financial Statements section of this Report.
Profit After Tax
The Group profit after taxation (PAT) stood at Rs.16.24 billion for the year under review, a decrease of 30 per cent [2017/18: Rs.23.12 billion]. As indicated in the graph below, the highest contributors to Group PAT were the Transportation, Financial Services, and Other, including Information Technology and Plantation Services industry groups, with contributions of Rs.4.17 billion [2017/18: Rs.3.08 billion], Rs.4.05 billion [2017/18: Rs.8.57 billion] and Rs.3.86 billion [2017/18: Rs.3.90 billion], respectively. Excluding the gains on investment property and the one-off impacts discussed previously, the recurring Group PAT decreased by 28 per cent to Rs.14.45 billion [2017/18: Rs.19.96 billion].
0
5
10
15
20
25
30
35
40
Profit After Tax CompositionProfit After Tax Composition(%)(%)
2017/18 2018/19
Transportation LeisureRetailConsumer Foods Property Financial Services Other, incl.InformationTechnology
& Plantation Services
13.3
25.7
8.0
8.4
5.8
2.9
14.5
13.8
4.5
37.1
24.9
16.8
23.8
0.5
The breakdown of Group PAT, between PAT attributable to equity holders and non-controlling interest (NCI) are as follows:
Rs.000 2018/19 2017/18 %
PAT attributable to equity holders 15,254,126 21,021,031 (27)Non-controlling interest (NCI) 983,270 2,098,774 (53)Group PAT 16,237,396 23,119,805 (30)
Non-Controlling Interests
PAT attributable to shareholders with NCI stood at Rs.983 million in 2018/19, a decrease of 53 per cent, mainly due to a decline in profits of JayKay Marketing Services Limited (JMSL), the Supermarket business of the Group. JMSL is a 100 per cent owned subsidiary of Ceylon Cold Stores PLC (CCS), which is a listed company with a relatively higher NCI. The Group consolidates 81.36 per cent of JMSL’s profits under PAT attributable to equity holders. The NCI share of PAT at 6 per cent for 2018/19 is a decrease in comparison to 9 per cent recorded in 2017/18.
PAT Attributable to Equity Holders of the Parent (Net Profit)
PAT attributable to equity holders of the Parent decreased by 27 per cent to Rs.15.25 billion [2017/18: 21.02 billion]. The net profit margin of the Group decreased to 10.0 per cent from 15.3 per cent in the previous year. The recurring net profit attributable to equity holders decreased by 25 per cent to Rs.13.68 billion [2017/18: Rs.18.32 billion], whilst the recurring net profit margin of the Group decreased to 8.9 per cent, against 13.4 per cent in 2017/18.
0
5,000
10,000
15,000
20,000
25,000
(Rs.mn)(Rs.mn) (%)(%)
2014/15
21,0
21
15,254
16,2
75
14,0
70
14,3
48
15.3
10.0
13.6 13.414.0
2015/16 2016/17 2017/18 2018/19
Net profit Net profit margin
0
2
4
6
8
10
12
14
16
18
Net Profit and Net Profit MarginNet Profit and Net Profit Margin
PAT ATTRIBUTABLE TO EQUITY HOLDERS OF THE PARENT
(2017/18: Rs.21.02 bn)
Rs.15.25bn27%
MANAGEMENT DISCUSSION AND ANALYSIS
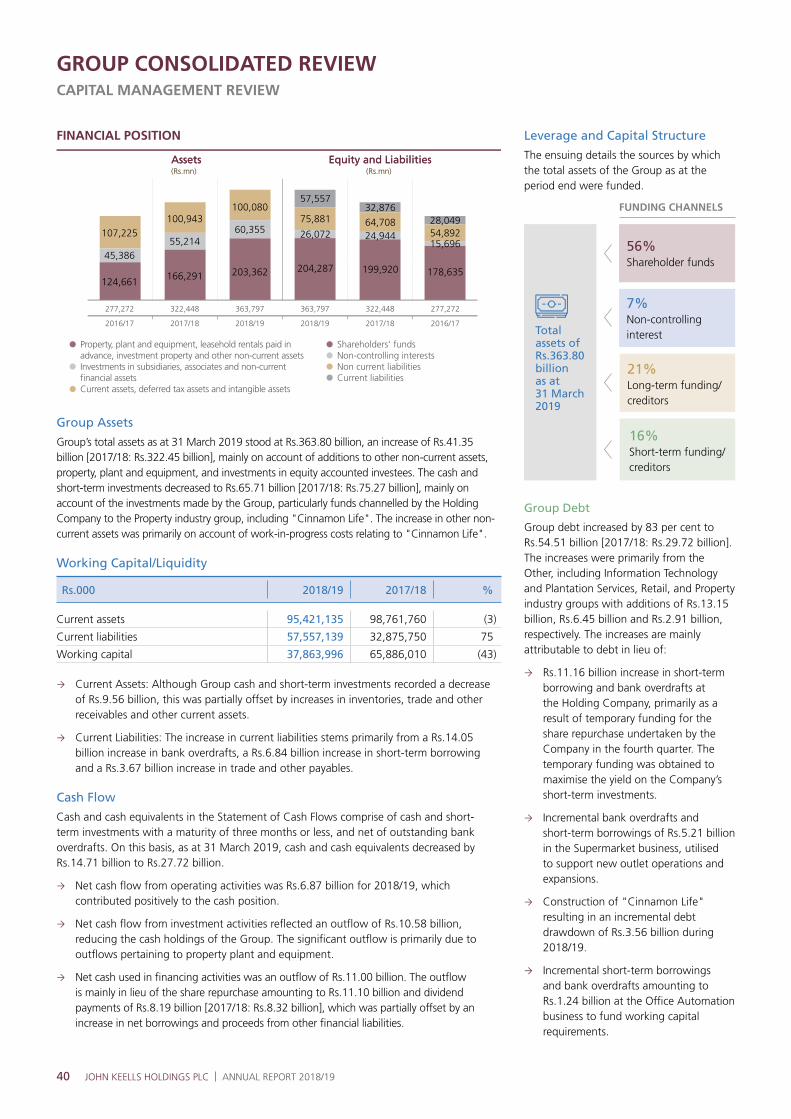
40 JOHN KEELLS HOLDINGS PLC | ANNUAL REPORT 2018/19
AssetsAssets Equity and LiabilitiesEquity and Liabilities(Rs.mn)(Rs.mn) (Rs.mn)(Rs.mn)
Property, plant and equipment, leasehold rentals paid inadvance, investment property and other non-current assetsInvestments in subsidiaries, associates and non-currentfinancial assetsCurrent assets, deferred tax assets and intangible assets
Shareholders' fundsNon-controlling interestsNon current liabilitiesCurrent liabilities
2016/17 2017/18 2018/19 2018/19 2017/18 2016/17
277,272 322,448 363,797 363,797 322,448 277,272
124,661
45,386
107,225100,943
55,214
166,291 203,362 204,287 199,920 178,635
15,69654,89228,049
24,94464,708
32,876
26,072
75,881
57,557
60,355
100,080
FINANCIAL POSITION
GROUP CONSOLIDATED REVIEWCAPITAL MANAGEMENT REVIEW
Group Assets
Group’s total assets as at 31 March 2019 stood at Rs.363.80 billion, an increase of Rs.41.35 billion [2017/18: Rs.322.45 billion], mainly on account of additions to other non-current assets, property, plant and equipment, and investments in equity accounted investees. The cash and short-term investments decreased to Rs.65.71 billion [2017/18: Rs.75.27 billion], mainly on account of the investments made by the Group, particularly funds channelled by the Holding Company to the Property industry group, including "Cinnamon Life". The increase in other non-current assets was primarily on account of work-in-progress costs relating to "Cinnamon Life".
Working Capital/Liquidity
Rs.000 2018/19 2017/18 %
Current assets 95,421,135 98,761,760 (3)
Current liabilities 57,557,139 32,875,750 75
Working capital 37,863,996 65,886,010 (43)
Current Assets: Although Group cash and short-term investments recorded a decrease of Rs.9.56 billion, this was partially offset by increases in inventories, trade and other receivables and other current assets.
Current Liabilities: The increase in current liabilities stems primarily from a Rs.14.05 billion increase in bank overdrafts, a Rs.6.84 billion increase in short-term borrowing and a Rs.3.67 billion increase in trade and other payables.
Cash Flow
Cash and cash equivalents in the Statement of Cash Flows comprise of cash and short-term investments with a maturity of three months or less, and net of outstanding bank overdrafts. On this basis, as at 31 March 2019, cash and cash equivalents decreased by Rs.14.71 billion to Rs.27.72 billion.
Net cash flow from operating activities was Rs.6.87 billion for 2018/19, which contributed positively to the cash position.
Net cash flow from investment activities reflected an outflow of Rs.10.58 billion, reducing the cash holdings of the Group. The significant outflow is primarily due to outflows pertaining to property plant and equipment.
Net cash used in financing activities was an outflow of Rs.11.00 billion. The outflow is mainly in lieu of the share repurchase amounting to Rs.11.10 billion and dividend payments of Rs.8.19 billion [2017/18: Rs.8.32 billion], which was partially offset by an increase in net borrowings and proceeds from other financial liabilities.
Leverage and Capital Structure
The ensuing details the sources by which the total assets of the Group as at the period end were funded.
Total assets of Rs.363.80 billion as at 31 March 2019
FUNDING CHANNELS
56% Shareholder funds
7% Non-controlling interest
21% Long-term funding/creditors
16% Short-term funding/creditors
Group Debt
Group debt increased by 83 per cent to Rs.54.51 billion [2017/18: Rs.29.72 billion]. The increases were primarily from the Other, including Information Technology and Plantation Services, Retail, and Property industry groups with additions of Rs.13.15 billion, Rs.6.45 billion and Rs.2.91 billion, respectively. The increases are mainly attributable to debt in lieu of:
Rs.11.16 billion increase in short-term borrowing and bank overdrafts at the Holding Company, primarily as a result of temporary funding for the share repurchase undertaken by the Company in the fourth quarter. The temporary funding was obtained to maximise the yield on the Company’s short-term investments.
Incremental bank overdrafts and short-term borrowings of Rs.5.21 billion in the Supermarket business, utilised to support new outlet operations and expansions.
Construction of "Cinnamon Life" resulting in an incremental debt drawdown of Rs.3.56 billion during 2018/19.
Incremental short-term borrowings and bank overdrafts amounting to Rs.1.24 billion at the Office Automation business to fund working capital requirements.

41
Property, Other, including Information Technology and Plantation Services, Retail and Leisure account for 86 per cent of Group debt with the industry groups contributing Rs.17.50 billion, Rs.13.22 billion, Rs.10.14 billion and Rs.6.09 billion to Group debt, respectively.
Where businesses have foreign currency denominated income, borrowings in foreign currency are effected to take advantage of the comparatively lower cost of foreign currency debt. This strategy has been practiced in the Leisure industry group, in particular, where foreign currency receipts are regularly monitored to proactively evaluate the borrowing capacity of the business. Currently, approximately Rs.21.90 billion of overall debt is denominated in foreign currency, which translates to approximately 40 per cent of total debt [2017/18: 59 per cent]. It is pertinent to note that the exchange rate exposure arising from the "Cinnamon Life" project is mitigated to an extent as the functional currency of the project company, Waterfront Properties (Private) Limited, is US Dollars.
Cash and Cash Equivalents
Group cash and cash equivalents as at 31 March 2019 stood at Rs.65.71 billion against Rs.75.27 billion in 2018/19; the decrease is on account of the reasons outlined under "Group Assets". This comprises Rs.12.96 billion as cash in hand and at bank and Rs.52.76 billion under short-term investments. It is pertinent to note that, of this figure, the life fund at UA amounts to Rs.2.80 billion whilst the restricted regulatory fund at UA amounts to Rs.3.38 billion. Customer advances from "Cinnamon Life" as at 31 March 2019, considered under Group cash, was Rs.9.41 billion.
The increase in debt, coupled with the reduction in cash holdings of the Group, resulted in the net cash position of the Group decreasing from Rs.33.52 billion as at end 2017/18 to a net debt position of Rs.4.38 billion as at end 2018/19. Net cash or net debt, as applicable, excludes short-term investments of the life fund of UA, restricted regulatory fund at UA and customer advances from the Property Development sector.
Considering its strong financial position, the Group is confident of its ability to meet its short and medium-term funding and debt repayment obligations while pursuing organic and acquisitive growth opportunities. In terms of the composition of the liquid assets of the Group, Other, including Plantation Services accounted for 72 per cent of cash and cash equivalents, of which a majority of assets are in the Holding Company, followed by the Financial Services industry group.
2018/19 2017/18
Current ratio (times) 1.7 3.0
Quick ratio (times) 1.5 2.8
Working capital (Rs.million) 37,864 65,886
Asset turnover (times) 0.4 0.5
Capital employed (Rs.million) 284,871 254,587
Total debt (Rs.million) 54,513 29,722
Net debt/(cash) (Rs.million) 4,385 (33,519)
Debt/equity ratio (%) 23.7 13.2
Net debt/(cash) to equity ratio (%) 1.9 (14.9)
Long-term debt to total debt (%) 39.0 62.3
Debt/total assets (%) 15.0 9.2
Liabilities to tangible net worth (times) 0.6 0.4
Debt/EBITDA (times) 2.1 0.9
Net debt/EBITDA (times) 0.2 (1.0)
Favourable indicators such as a comparatively lower debt/equity ratio, indicates the Group’s ability to increase its leverage to fund its investment pipeline, as and when required. To this end, the cash reserves of the Group, are earmarked for equity commitments of the "Cinnamon Life" project and other investments. Notwithstanding this, the Group is confident of its ability to fund projects, if feasible and as required, thereby optimising equity returns.
Statement of Changes in Equity
Total equity of the Group as at 31 March 2019 stood at Rs.230.36 billion, a Rs.5.49 billion increase from the previous year [2017/18: Rs.224.86 billion]. The main increases were on account of profit after tax of Rs.16.24 billion, other comprehensive income of Rs.8.81 billion, which was partially offset by the share repurchase concluded in January 2019 amounting to Rs.11.10 billion and dividends of Rs.8.19 billion paid during the year.
Return on Capital Employed
Reported ROCE (%)
= EBIT Margin (%)
x Asset Turnover
x Capital Structure Leverage
2018/19 7.9 = 15.6 x 0.40 x 1.27
2017/18 11.9 = 20.5 x 0.46 x 1.27
The Group return on capital employed (ROCE) decreased to 7.9 per cent in comparison to 11.9 per cent recorded in 2017/18. The decrease is a result of a deterioration in EBIT margins and lower asset turnover. The average asset base at Rs.343.12 billion is a 14 per cent growth against the last year’s asset base of Rs.299.86 billion.
For a detailed discussion on the ROCE of each industry group, refer Strategy, Resource Allocation and Portfolio Management - page 63
The ensuing graph analyses the industry group ROCE performance, against the capital employed by the industry group and its contribution to EBIT.
MANAGEMENT DISCUSSION AND ANALYSIS
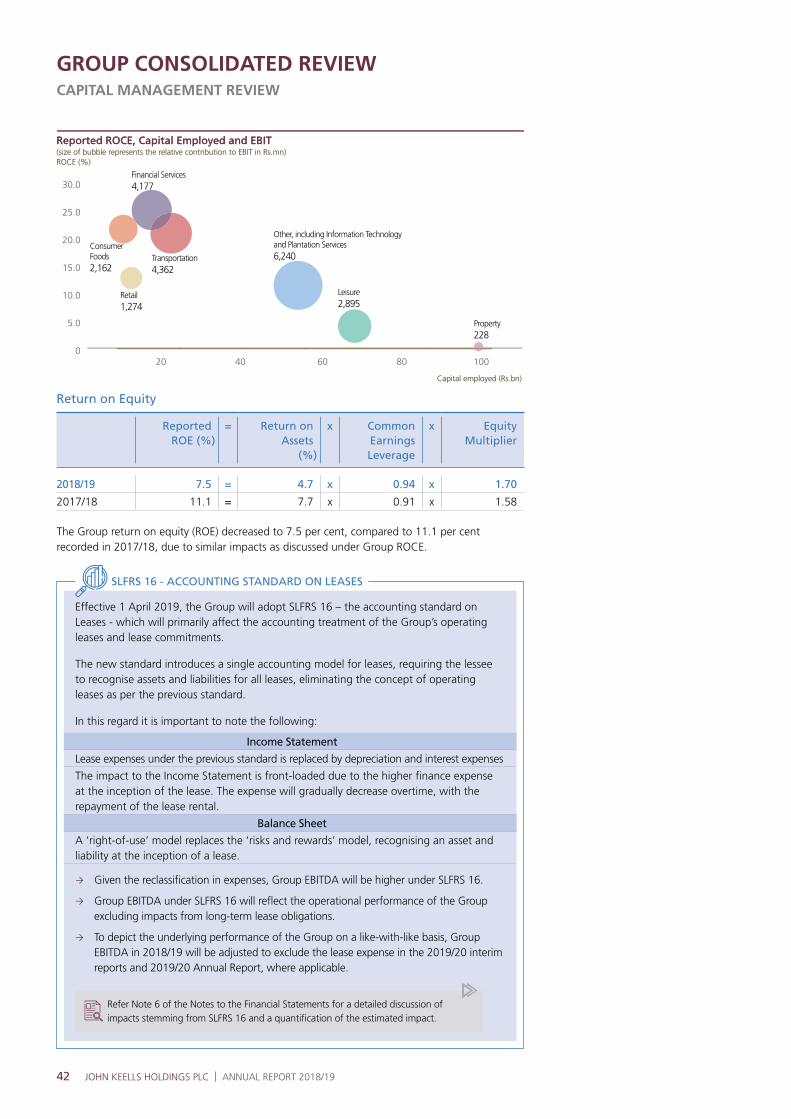
42 JOHN KEELLS HOLDINGS PLC | ANNUAL REPORT 2018/19
GROUP CONSOLIDATED REVIEWCAPITAL MANAGEMENT REVIEW
0
5.0
10.0
15.0
20.0
25.0
30.0
Reported ROCE, Capital Employed and EBITReported ROCE, Capital Employed and EBIT(size of bubble represents the relative contribution to EBIT in Rs.mn)(size of bubble represents the relative contribution to EBIT in Rs.mn)ROCE (%)ROCE (%)
Capital employed (Rs.bn)Capital employed (Rs.bn)
20 40 60 80 100
Financial Services4,177
Transportation4,362
Leisure2,895
Property228
Other, including Information Technologyand Plantation Services6,240
ConsumerFoods2,162
Retail1,274
Return on Equity
Reported ROE (%)
= Return on Assets
(%)
x Common Earnings Leverage
x Equity Multiplier
2018/19 7.5 = 4.7 x 0.94 x 1.70
2017/18 11.1 = 7.7 x 0.91 x 1.58
The Group return on equity (ROE) decreased to 7.5 per cent, compared to 11.1 per cent recorded in 2017/18, due to similar impacts as discussed under Group ROCE.
Effective 1 April 2019, the Group will adopt SLFRS 16 – the accounting standard on Leases - which will primarily affect the accounting treatment of the Group’s operating leases and lease commitments.
The new standard introduces a single accounting model for leases, requiring the lessee to recognise assets and liabilities for all leases, eliminating the concept of operating leases as per the previous standard.
In this regard it is important to note the following:
Given the reclassification in expenses, Group EBITDA will be higher under SLFRS 16.
Group EBITDA under SLFRS 16 will reflect the operational performance of the Group excluding impacts from long-term lease obligations.
To depict the underlying performance of the Group on a like-with-like basis, Group EBITDA in 2018/19 will be adjusted to exclude the lease expense in the 2019/20 interim reports and 2019/20 Annual Report, where applicable.
Refer Note 6 of the Notes to the Financial Statements for a detailed discussion of impacts stemming from SLFRS 16 and a quantification of the estimated impact.
Income Statement
Lease expenses under the previous standard is replaced by depreciation and interest expenses
The impact to the Income Statement is front-loaded due to the higher finance expense at the inception of the lease. The expense will gradually decrease overtime, with the repayment of the lease rental.
Balance Sheet
A ‘right-of-use’ model replaces the ‘risks and rewards’ model, recognising an asset and liability at the inception of a lease.
SLFRS 16 - ACCOUNTING STANDARD ON LEASES

43
NATURAL CAPITAL
The Group has in place a comprehensive environmental management system through which policies and procedures ensure sustainable and efficient operation of businesses whilst improving the bottom line. Maintenance of a sound Natural Capital management strategy has proven to be of vital importance, to enable long-term sustainable value creation to the Group. The Group is committed to efficiently managing inputs such as energy, water and conservation of biodiversity, while responsibly managing outputs such as emissions, waste and effluents.
Three-year performance indicators:
Standard 2018/19 2017/18* 2016/17
302-1 Energy consumption: non-renewable sources (GJ) 366,979 368,333 343,739
Energy consumption: non-renewable sources (GJ) per Rs.million of revenue 2.68 3.02 3.19
Energy consumption - renewable sources (GJ) 105,952 109,506 101,112
Energy consumption - renewable sources (GJ) per Rs.million of revenue 0.77 0.91 0.94
Purchased energy - national grid 375,991 362,298 350,486
Purchased energy - national grid (GJ) per Rs.million of revenue 2.75 3.01 3.25
305-1 Direct greenhouse gas emissions - Scope 1 (MT) 27,507 27,532 25,727
Greenhouse gas emissions from combustion of biomass 10,107 12,187 11,181
305-2 Indirect greenhouse gas emissions - Scope 2 (MT) 71,188 68,595 66,384
Total carbon footprint (MT) 98,695 96,127 92,111
Total carbon footprint (MT) per Rs.million of revenue 0.72 0.80 0.85
303-1 Water withdrawal (m3) 1,796,120 1,857,371 2,021,739
Water withdrawal (m3) per Rs.million of revenue 13.13 15.42 18.74
306-1 Water discharge (m3) 1,191,031 1,414,546 1,460,799
306-2 Volume of hazardous waste generated (MT) 382 439 329
Volume of non-hazardous waste generated (MT) 7,925 8,828 8,517
Waste recycled/reused by Group companies and through 3rd party contractors (%) 46 41 42
307-1 Significant environmental fines Nil Nil Nil
* 2017/18 has been restated
During the year under review, the Group commissioned an independent benchmarking organisation to validate the existing benchmarks for companies operating in Consumer Foods, Retail and Leisure industry groups, which were established in 2011 and establish new benchmarks for the companies in the Transportation industry group.
The benchmarks were derived through research and analysis of both local and international sustainability performance indicators of companies.
The performance of Group companies is tracked against the benchmarks set, each quarter and disclosed internally to ensure that performance of companies is continuously in line with industry best practice.
As discussed in the Annual Report 2016/17, the Group published its energy and water reduction goals to be achieved by 2019/20, which are tracked against a baseline year of 2015/16. The goals focus on the areas of conserving energy and optimising water usage, with the aim of further strengthening its commitment to managing the impacts on Natural Capital. The Group tracked its performance against the aforementioned goals and the progress made during the year under review is presented in the ensuing sections, as relevant.
Energy and Carbon Footprint
During the year under review, the total energy consumption of the Group was 848,922 GJ [2017/18: 840,137 GJ], which was derived from non-renewable and renewable energy sources, and the national grid.
Total Energy Consumed (GJ) 2018/19 2017/18 2016/17
Diesel 131,911 146,413 135,227
Petrol 21,097 24,096 16,861
Furnace oil 42,251 34,034 40,405
LPG 28,112 28,011 28,418
Jet fuel 143,608 135,779 122,828
Energy consumption from non-renewable sources (1) 366,979 368,333 343,739
Energy consumption from renewable sources (2) 105,952 109,506 101,112
Purchased energy - national grid (3) 375,991 362,298 350,486
Total energy consumption (1) + (2) + (3) 848,922 840,137 795,337
SUSTAINABILITY BENCHMARKING INITIATIVE
MANAGEMENT DISCUSSION AND ANALYSIS

44 JOHN KEELLS HOLDINGS PLC | ANNUAL REPORT 2018/19
The Group continued to make steady progress towards utilising more renewable energy during the year under review, thereby reducing the unsustainable strain on the national grid and reducing the carbon footprint of the Group. The renewable energy sources used by the Group primarily consist of biomass and solar power usage. At a business level, the ensuing is noted:
Significant investments were made by the Supermarket business with 33 outlets installing solar panels during the year and both Maldivian Resorts and Sri Lankan Resorts segments also undertaking investments in solar power
Though Tea Smallholder Factories PLC (TSF) was the highest consumer of energy in the Plantation Services sector, 65 per cent of its energy requirement was met through renewable energy sources such as biomass purchased from the surrounding communities, thereby contributing to only 3 per cent of the Group’s carbon footprint
Whilst such practices have enabled the Group to reduce its environmental impact and operational costs, it has also provided means of livelihood for surrounding communities. The Group generated 9.9 million kWh of power from solar power and firewood, constituting 8 per cent of the Group’s total energy requirement. Additionally, Group companies saved approximately 2,468 GJ, through various energy conservation initiatives.
Further details on these initiatives are found in the Industry Group Review section of the Report - page 77
GROUP CONSOLIDATED REVIEWCAPITAL MANAGEMENT REVIEW
0
50
100
150
200
250
300
350
Energy Consumption by Industry Group/Sector Energy Consumption by Industry Group/Sector (GJ ’000)(GJ ’000)
Transportation
2016/17
LeisureRetailConsumer Foods Property Financial Services
2017/18 2018/19
Other, incl.InformationTechnology
& Plantation Services
The main contributor to the Group’s carbon footprint was electricity from the national grid, followed by jet fuel, diesel, furnace oil, LPG and petrol. Given that Sri Lanka’s national grid is hydro power based, the resultant carbon footprint is lower in comparison to countries producing power exclusively through fossil fuels.
11
72
2 1 310
(%)(%)
LPG Petrol Furnace oil
Diesel Jet fuel Electricity
Carbon Footprint by Energy TypeCarbon Footprint by Energy Type
The movement in carbon efficiency is heartening, as the Group recorded an increase of only 3 per cent in its carbon footprint to 98,695 MT [2017/18: 96,127 MT], despite the increased operational activity within the Group; with the opening of 18 new "Keells" outlets resulting in a significant increase in the square footage of the Supermarket business and the inclusion of Colombo Ice Company (CICL) to the Group’s sustainability reporting scope. It is noted that initiatives such as the adoption of solar panels by retail outlets and the resorts, assisted the Group in managing its carbon footprint. Scope 1, direct energy carbon footprint, amounted to 27,507 MT, while Scope 2, indirect energy carbon footprint amounted to 71,188 MT.
The carbon footprint per Rs.million of revenue is on a declining trend signifying the Group’s commitment towards reducing its carbon footprint.
0.0
0.2
0.4
0.6
0.8
1.0
(MT CO2 eq)(MT CO2 eq)
2014/15 2015/16 2016/17 2017/18 2018/19
The Leisure, Consumer Foods and Retail industry groups were the largest consumers of energy, accounting for over 88 per cent of the energy consumed and 80 per cent of the carbon footprint of the Group.
2019/20 Energy Reduction Goal Status
Status as at 2017/18
4% Vs. 2015/16 Baseline
Status as at 2018/19
2% Vs. 2015/16 Baseline
Goal for 2019/20
12% Vs. 2015/16 Baseline
REDUCTION ON AN ABSOLUTE BASIS, MATCHED AGAINST A BASELINE ACTIVITY LEVEL
During the year under review the Group made significant progress towards the energy goal set for the end of financial year 2019/20. However, efforts were impacted to an extent by the lower levels of operational activity in the Consumer Foods industry group contributing towards a reduction in relative energy efficiency, resulting in a higher per operating factor energy usage. It is further noted that benefits of certain business level initiatives implemented will accrue over time, while certain other initiatives are currently in the process of being rolled out. The Group will continue to strive to achieve its energy reduction goal by end of 2019/20.
2018/19
7,419 MT
CARBON FOOTPRINT REDUCTION FROM RENEWABLE ENERGY AND INITIATIVES
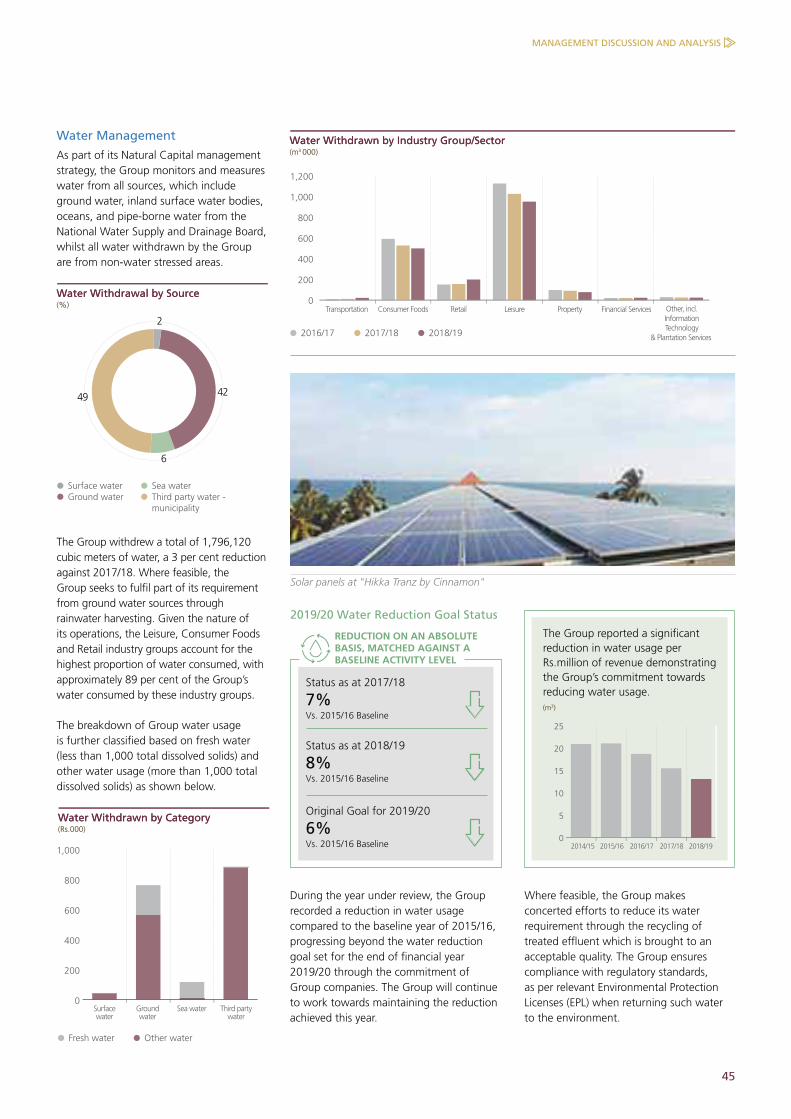
45
0
200
400
600
800
1,000
1,200
Water Withdrawn by Industry Group/SectorWater Withdrawn by Industry Group/Sector(m3 000)(m3 000)
Transportation
2016/17
LeisureRetailConsumer Foods Property Financial Services
2017/18 2018/19
Other, incl.InformationTechnology
& Plantation Services
Water Management
As part of its Natural Capital management strategy, the Group monitors and measures water from all sources, which include ground water, inland surface water bodies, oceans, and pipe-borne water from the National Water Supply and Drainage Board, whilst all water withdrawn by the Group are from non-water stressed areas.
42
2
49
6
(%)(%)
Surface water Ground water
Sea water Third party water -municipality
Water Withdrawal by SourceWater Withdrawal by Source
The Group withdrew a total of 1,796,120 cubic meters of water, a 3 per cent reduction against 2017/18. Where feasible, the Group seeks to fulfil part of its requirement from ground water sources through rainwater harvesting. Given the nature of its operations, the Leisure, Consumer Foods and Retail industry groups account for the highest proportion of water consumed, with approximately 89 per cent of the Group’s water consumed by these industry groups.
The breakdown of Group water usage is further classified based on fresh water (less than 1,000 total dissolved solids) and other water usage (more than 1,000 total dissolved solids) as shown below.
0
200
400
600
800
1,000
Surfacewater
Groundwater
Sea water Third partywater
Water Withdrawn by CategoryWater Withdrawn by Category(Rs.000)(Rs.000)
Fresh water Other water
2019/20 Water Reduction Goal Status
Status as at 2017/18
7%Vs. 2015/16 Baseline
Status as at 2018/19
8%Vs. 2015/16 Baseline
Original Goal for 2019/20
6%Vs. 2015/16 Baseline
REDUCTION ON AN ABSOLUTE BASIS, MATCHED AGAINST A BASELINE ACTIVITY LEVEL
During the year under review, the Group recorded a reduction in water usage compared to the baseline year of 2015/16, progressing beyond the water reduction goal set for the end of financial year 2019/20 through the commitment of Group companies. The Group will continue to work towards maintaining the reduction achieved this year.
The Group reported a significant reduction in water usage per Rs.million of revenue demonstrating the Group’s commitment towards reducing water usage.
0
5
10
15
20
25
(m3)(m3)
2014/15 2015/16 2016/17 2017/18 2018/19
Solar panels at "Hikka Tranz by Cinnamon"
Where feasible, the Group makes concerted efforts to reduce its water requirement through the recycling of treated effluent which is brought to an acceptable quality. The Group ensures compliance with regulatory standards, as per relevant Environmental Protection Licenses (EPL) when returning such water to the environment.
MANAGEMENT DISCUSSION AND ANALYSIS

46 JOHN KEELLS HOLDINGS PLC | ANNUAL REPORT 2018/19
GROUP CONSOLIDATED REVIEWCAPITAL MANAGEMENT REVIEW
0
500
1,000
1,500
2,000
2,500
3,000
3,500
4,000
Waste Generated by Industry Group/Sector Waste Generated by Industry Group/Sector (MT ‘000)(MT ‘000)
Transportation
2016/17
LeisureRetailConsumer Foods Property Financial Services
2017/18 2018/19
Other, incl.InformationTechnology
& Plantation Services
15.2
0.51.1
26.9
40.5
11.24.6
(%)(%)
ReuseRecyclingCompostingRecovery
IncinerationDeep well injectionLandfill
0
Non-hazardous Waste Disposal by MethodNon-hazardous Waste Disposal by Method
21.3
0.5
50.5 19.8
7.8
(%)(%)
Discharged to surface waterDischarged to ground waterDischarged to seaDischarged to third party: municipalityDischarged to third party: provided toanother organisation
1
Water Discharge by MethodWater Discharge by Method
During the reporting period, the Group discharged 1,191,031 cubic metres of effluent, all of which was discharged to non-water stressed areas. Of the total discharge, 94 per cent was fresh water discharged, whilst 6 per cent was other water discharged. 51 per cent of the water was treated through onsite sewage treatment plants at various operational locations prior to being discharged whilst 36 per cent of water withdrawn was completely recycled. Such water was utilised for general cleaning, gardening and flushing mechanisms.
Group water discharge is further classified as total discharge of freshwater (less than 1,000 total dissolved solids) and discharge of other water (more than 1,000 total dissolved solids) as shown in the diagram below.
6
94
(%)(%)
Discharge of fresh water Discharge of other water
Water Discharge by CategoryWater Discharge by Category
Business units carry out a range of initiatives such as awareness campaigns and installation of water saving fixtures and equipment.
A detailed discussion of water withdrawal and discharge by industry group, as well as water saving initiatives, can be found in the Industry Group Review section of the Report - page 77
Waste Management
Waste generated by the Group decreased to 8,307 MT from 9,260 MT in 2017/18, despite increased operational activity. Of this, 382 MT was classified as hazardous waste and disposed through specialised third-party contractors. Of the total waste produced, 46 per cent was recycled or reused by the Group’s business units and/or through selected third-party contractors. The Leisure, Consumer Foods and Retail industry groups contributed to over 95 per cent of the waste generated by the Group.
Further details of how such waste was generated, reused and recycled are available in the Industry Group Review section of the Report - page 77
Continued efforts towards waste reduction proved fruitful, with waste generated per Rs.million of revenue declining by 20 per cent compared to the previous year
0.00
0.02
0.04
0.06
0.08
0.10
(MT)(MT)
2014/15 2015/16 2016/17 2017/18 2018/19
100%of hazardous waste was disposed of through recycling
HAZARDOUS WASTE DISPOSAL BY METHOD
47
Plasticcycle was launched in July 2017, with the vision of being the catalyst for significantly reducing plastic pollution in Sri Lanka. Plasticcycle seeks to drive change through three key areas of focus - creating awareness, supporting responsible disposal and promoting recycling.
Awareness initiatives undertaken:
Awareness though social media platforms including a trilingual campaign against the burning of plastic.
Installation of banners at the exit points of the Southern Expressway and an awareness campaign covering 10,000 commuters.
Handing out reusable bags to over 3,000 children of Group employees with the message "I reduced my plastic footprint".
Continuous advocacy with regulatory bodies to develop a governing framework geared towards changing consumer preference and reducing reliance on free polythene bags.
Actions to support responsible disposal:
Completing phase 1 of the Southern Expressway Project with the placement of 48 specially designed bins at all the exits points and the Service Area to collect plastic waste which will subsequently be recycled into value-added products that are sold in both the local and international markets.
Piloting a bin placement project at the Board of Investment Export Processing Zone (EPZ) in Biyagama.
Targeting different demographics in terms of promoting responsible disposal by entering into collaborations with ten schools in the Gampaha District and two universities.
130 collection bins have been placed across the Western and Southern Provinces in collaboration with certain Group companies enabling the recycling of over 20 metric tonnes of plastic waste through recyclers registered with the Sri Lanka Recycling Association, in addition to the 123 metric tonnes of plastic waste recycled by Group companies during the year under review.
Promoting recycling Initiatives:
Pilot project by the Sri Lanka Navy which aims to address non-recyclable plastics.
"PLASTICCYCLE" SOCIAL ENTREPRENEURSHIP INITIATIVE
CSR Initiatives
Recognising the importance of conserving our environment for future generations as well as business sustainability, the Group makes a conscious and collective effort to protect and promote the environmental and biodiversity conservation through the Foundation. Key initiatives aligned with creating value under Natural Capital are as follows:
CSR FOCUS AREA - ENVIRONMENT
www.johnkeellsfoundation.com
Nature Field Centre, Rumassala
The Nature Field Centre in Rumassala - established in 2008 by the Central Environmental Authority (CEA) in collaboration with the Foundation as a platform to facilitate experiential learning on the environment and biodiversity conservation particularly among school
children continued to attract a steady number of visitors particularly school children. As per the CEA’s report, a total of 3,057 visitors, of whom 2,324 were school children, participated in CEA’s awareness programmes during the year in review.
Paper Conservation
The impact of continued collection of waste paper from Group business locations for shredding and recycling is summarised as follows:
36,444 kg of waste paper collected
Indirect savings:
621 trees
1,158,191 water litres
145,776 kWh of electricity
63,959 litres of oil
110 m3 of landfill
IMPACT DURING THE YEAR:
Fauna and Flora Conservation
The Foundation continued its long-term collaborations on the following initiatives during the reporting year:
"Elephant Research" - with Cinnamon Hotels & Resorts for the 4th consecutive year
"Forestry Project" - with Tea Smallholder Factories PLC and Carbon Consulting Company (Private) Limited for the fifth and final year
Beach Cleaning Initiative
The Foundation together with Cinnamon Hotels & Resorts, and the Marine Environment Protection Authority commemorated National Coastal and Marine Resource Conservation Week by organising beach cleaning initiatives at 4 beach resorts with the participation of ~ 200 volunteers including hotel staff, guests and community members. An art competition under the theme "Let's keep our beaches clean" was also organised in schools surrounding these areas to enhance awareness and environmental stewardship.
Further details are found in the Industry Group Review section of the Report - page 77
MANAGEMENT DISCUSSION AND ANALYSIS
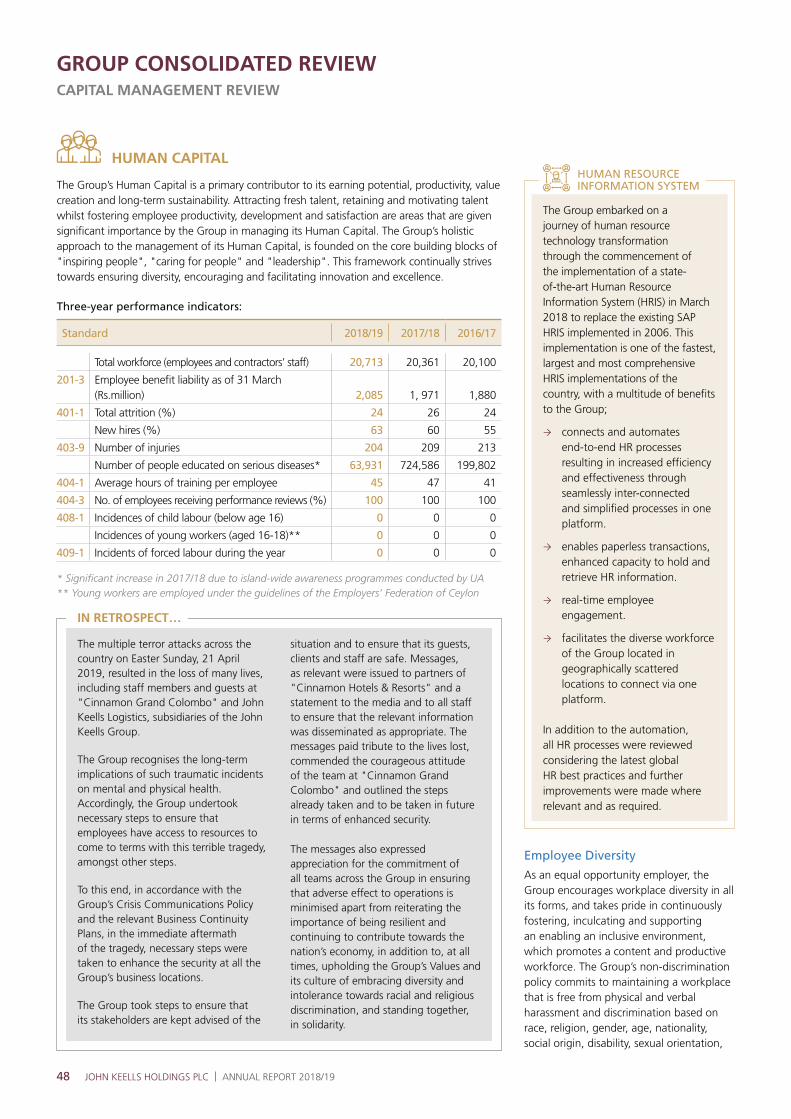
48 JOHN KEELLS HOLDINGS PLC | ANNUAL REPORT 2018/19
GROUP CONSOLIDATED REVIEWCAPITAL MANAGEMENT REVIEW
The Group’s Human Capital is a primary contributor to its earning potential, productivity, value creation and long-term sustainability. Attracting fresh talent, retaining and motivating talent whilst fostering employee productivity, development and satisfaction are areas that are given significant importance by the Group in managing its Human Capital. The Group’s holistic approach to the management of its Human Capital, is founded on the core building blocks of "inspiring people", "caring for people" and "leadership". This framework continually strives towards ensuring diversity, encouraging and facilitating innovation and excellence.
Three-year performance indicators:
Standard 2018/19 2017/18 2016/17
Total workforce (employees and contractors’ staff) 20,713 20,361 20,100
201-3 Employee benefit liability as of 31 March (Rs.million) 2,085 1, 971 1,880
401-1 Total attrition (%) 24 26 24
New hires (%) 63 60 55
403-9 Number of injuries 204 209 213
Number of people educated on serious diseases* 63,931 724,586 199,802
404-1 Average hours of training per employee 45 47 41
404-3 No. of employees receiving performance reviews (%) 100 100 100
408-1 Incidences of child labour (below age 16) 0 0 0
Incidences of young workers (aged 16-18)** 0 0 0
409-1 Incidents of forced labour during the year 0 0 0
* Significant increase in 2017/18 due to island-wide awareness programmes conducted by UA** Young workers are employed under the guidelines of the Employers’ Federation of Ceylon
HUMAN CAPITAL
The Group embarked on a journey of human resource technology transformation through the commencement of the implementation of a state-of-the-art Human Resource Information System (HRIS) in March 2018 to replace the existing SAP HRIS implemented in 2006. This implementation is one of the fastest, largest and most comprehensive HRIS implementations of the country, with a multitude of benefits to the Group;
connects and automates end-to-end HR processes resulting in increased efficiency and effectiveness through seamlessly inter-connected and simplified processes in one platform.
enables paperless transactions, enhanced capacity to hold and retrieve HR information.
real-time employee engagement.
facilitates the diverse workforce of the Group located in geographically scattered locations to connect via one platform.
In addition to the automation, all HR processes were reviewed considering the latest global HR best practices and further improvements were made where relevant and as required.
Employee Diversity
As an equal opportunity employer, the Group encourages workplace diversity in all its forms, and takes pride in continuously fostering, inculcating and supporting an enabling an inclusive environment, which promotes a content and productive workforce. The Group’s non-discrimination policy commits to maintaining a workplace that is free from physical and verbal harassment and discrimination based on race, religion, gender, age, nationality, social origin, disability, sexual orientation,
The multiple terror attacks across the country on Easter Sunday, 21 April 2019, resulted in the loss of many lives, including staff members and guests at "Cinnamon Grand Colombo" and John Keells Logistics, subsidiaries of the John Keells Group.
The Group recognises the long-term implications of such traumatic incidents on mental and physical health. Accordingly, the Group undertook necessary steps to ensure that employees have access to resources to come to terms with this terrible tragedy, amongst other steps.
To this end, in accordance with the Group’s Crisis Communications Policy and the relevant Business Continuity Plans, in the immediate aftermath of the tragedy, necessary steps were taken to enhance the security at all the Group’s business locations.
The Group took steps to ensure that its stakeholders are kept advised of the
situation and to ensure that its guests, clients and staff are safe. Messages, as relevant were issued to partners of "Cinnamon Hotels & Resorts" and a statement to the media and to all staff to ensure that the relevant information was disseminated as appropriate. The messages paid tribute to the lives lost, commended the courageous attitude of the team at "Cinnamon Grand Colombo" and outlined the steps already taken and to be taken in future in terms of enhanced security.
The messages also expressed appreciation for the commitment of all teams across the Group in ensuring that adverse effect to operations is minimised apart from reiterating the importance of being resilient and continuing to contribute towards the nation’s economy, in addition to, at all times, upholding the Group’s Values and its culture of embracing diversity and intolerance towards racial and religious discrimination, and standing together, in solidarity.
IN RETROSPECT…
HUMAN RESOURCE INFORMATION SYSTEM

49
gender identity, political affiliation or opinion, among others. The Group believes in communal kinship and advocates that it is every person’s duty to protect and foster cross-culture acceptability, regardless of race, religion or ethnic group.
Workforce as at 31 March 2019 20,713 %
Employees* 13,923 67
Outsourced personnel (neither staff employees nor seasonal workers) 6,790 33
*Of the Group’s total employees, 404 employees are placed in the Maldives, with the remainder domiciled in Sri Lanka.
The Group monitors the diversity of its workforce based on age and gender, as illustrated by the following diagrams. In businesses such as the Leisure industry group, active steps have been taken to enhance female participation to better meet business needs. The Group has seen a positive demographic breakdown within the workforce with 51 per cent of its employees being less than 30 years [2017/18: 53 per cent]. The Group has also seen a positive increase in the female population with 42 per cent of employees under the age of 25 being female [2017/18: 36 per cent].
0 20 40 60 80 100
Contract personnel by gender
Workforce by gender
Workforce by type of employment
Total employees by gender
Total employees by age
Male - 67
Male - 69 Female - 31
Male - 68 Female - 32
>50-7Below 30 - 51 Between 30 & 50 - 42
Contract Employees - 27Permanent Employees - 40 Contract Personnel - 33
Female - 33
(%)(%)
8 member Board of Directors
2 members are between the ages of 30-50 whilst 6 members are over the age of 50
2 female Directors
6 Group Executive Committee (GEC) members
3 members are over 50 years whilst 3 members are between the ages of 30-50 years
1 female member
16 Group Operating Committee (GOC) members (excluding the GEC members)
11 members are between the ages of 30-50 whilst 5 members are over the age of 50
3 female members
COMPOSITION OF KEY MANAGEMENT COMMITTEES
Talent Management
The Group continuously monitors its employee retention, and in particular, seeks to address staff attrition in typically high attrition-prone industry groups, by implementing proactive initiatives that engage employees.
The Group’s total attrition (for executives and non-executives) and new hire attrition rate, excluding the Information Technology sector and the Supermarket business, where staff turnover is expected to be high and is an industry norm, was 24 per cent and 8 per cent
respectively. With the increased supply of hotel rooms in the country, some pressure on staff retention was faced by the Sri Lankan Resorts segment and City Hotels sector, which contributed to the attrition rate.
During the year under review, the Group adopted diverse approaches to attract and retain employees. Implementation of the HRIS platform for employee recruitment has further strengthened attracting potential employees given its many features available to potential recruits. Further, the robust Internal Job Posting Programme, which allows employee mobility across the Group, is a unique selling proposition the Group leverages on to attract and retain high calibre motivated employees. The Group continues to have its partnerships with universities, higher education institutions and vocational training institutions. The annual JKH Management Trainee Programme entered its twelfth year and continues to yield the desired benefits to the Group.
Detailed discussions of business-specific initiatives aimed at attracting and retaining employees is found in the Industry Group Review section of the Report - page 77
During the year under review, the Group initiated the process of revamping the summer internship programme "Fast Track" with new industry partners. The programme is aimed at brand building amongst targeted undergraduates who are in their second and final year of study, to allow students to work and gain experience in the corporate industry within a short period of time. This will be re-launched in April 2019.
The new HRIS platform also launched a module focused on talent management, which will enable the Group to identify critical roles, create talent pools and strengthen succession planning. With respect to staff identified as 'Key Talent', the attrition has been negligible with senior management continuing to place extra emphasis on developing and nurturing them. The executive level attrition continues to be relatively lower than attrition at non-executive levels. Further, recruitment based on profile mapping was continued in certain businesses, to ensure a better fit with the needs of the organisation and thereby ensuring longer retention.
MANAGEMENT DISCUSSION AND ANALYSIS

50 JOHN KEELLS HOLDINGS PLC | ANNUAL REPORT 2018/19
GROUP CONSOLIDATED REVIEWCAPITAL MANAGEMENT REVIEW
Performance Appraisals
The Group’s performance management cycle ensures that all employees of the Group undergo regular appraisals. Formal feedback is provided on a bi-annual basis to the executive cadre and once a year to all others, whilst continuous feedback is encouraged. The process, which is underpinned by the need to firstly live the Values of the Group, enables identification of high potentials and successors, and also helps identify and enhance required skills of individuals needing support to achieve business outcomes. It is also noteworthy that the appraisal process encourages employees to contribute to the Group at large, as opposed to the business unit or functional unit they belong to.
The Group’s performance management was further enhanced during the year through the launch of the robust performance management module of the new HRIS platform. This will enable value additions such as goal cascading and continuous performance management through on going conversations on performance throughout the year.
Recognition
Recognition of employees is actively encouraged, and special budgetary allocations are made available for this purpose. Several employee recognition schemes are in place at a Group level and at business unit level, reflecting business specific requirements. Awards that encourage, foster and recognise innovation, support the digitisation movement of the Group, sustainability and volunteerism in CSR activities have contributed to the strides the Group has made in these areas.
0 20 40 60 80 100
Attrition by age
Attrition by region
Attrition by gender
Below 30 - 88
Local - 98
Male - 57
Between 30-50 - 11
New HiresNew Hires
> 50 - 1
Foreign - 2
Female - 43
(%)(%)
Learning and Development
Stemming from organisational capability and employee needs based assessments, learning and development initiatives were identified, and customised trainings relating to competencies and skills were deployed across the Group. A total of 632,357 training hours [2017/18: 627,849 hours] were recorded and on average, 45 hours of training were provided per employee per annum amounting to an average of 45 hours for males and 46 hours for females. The Group identifies that such learning and development programmes are pivotal for talent retention and ensuring a sustainable competitive advantage.
Addressing the need for a more learner-centric and intuitive learning engagement, the Group embarked on the implementation of a robust Learning Management System through the new HRIS implementation, for all executive and above staff, and continued to offer blended, bite-sized trainings, and self-paced learning solutions through offerings such as Coursera. This was further aided by the strategic partnership with YouLead! where a selected number of internal trainers across the Group were trained on creating video-based learning content using expertise of the faculty from Arizona State University, USA.
INSIGHTS
Efforts to inculcate a more introspective outlook to development continued with a further number of "People Coaches" trained on the fundamentals and advanced aspects of coaching. Quarterly meetings of these Coaches were held to create opportunity for experience sharing and collaborative learning. The year under review also saw an increase in the number of internal trainers and assessors, showcasing the Group’s efforts to sustain a healthy ecosystem of learning.
Executive Coaching for senior management, and the deployment of leadership and management development programmes in partnership with reputed executive education institutes and business schools such as the National University of Singapore (NUS), Harvard Business Publishing (HBP) and the Postgraduate Institute of Management (PIM) were also conducted during the year. Quarterly Development Centres were conducted as a part of the Group’s career development strategy. 30 senior employees attended the leadership programme conducted by Prof. Boris Groysberg programme of the Harvard Business School. Initiatives such as "The Forum" which provide opportunity for dialogue between senior management and representatives of all levels were also continued on a quarterly basis.
Detailed discussions of business-specific training initiatives for employees is found in the Industry Group Review section of the Report - page 77
0
100,000
200,000
300,000
400,000
500,000
600,000
(Hours)(Hours)
32,3
17
577,
268
12,0
31
7,74
9
2,99
2
Total Training HoursTotal Training Hours
AVP &above
Managers Asst.managers
Executives Nonexecutives
Collective Bargaining
The Group engages with trade unions on an ongoing basis through joint consultative committees and other mechanisms. Formal agreements are found in the Consumer
0 20 40 60 80 100
Attrition by age
Attrition by region
Attrition by gender
Below 30 - 85
Local - 98
Male - 59
Between 30-50 - 14
AttritionAttrition
> 50 - 1
Foreign - 2
Female - 41
(%)(%)
GRI 102-41
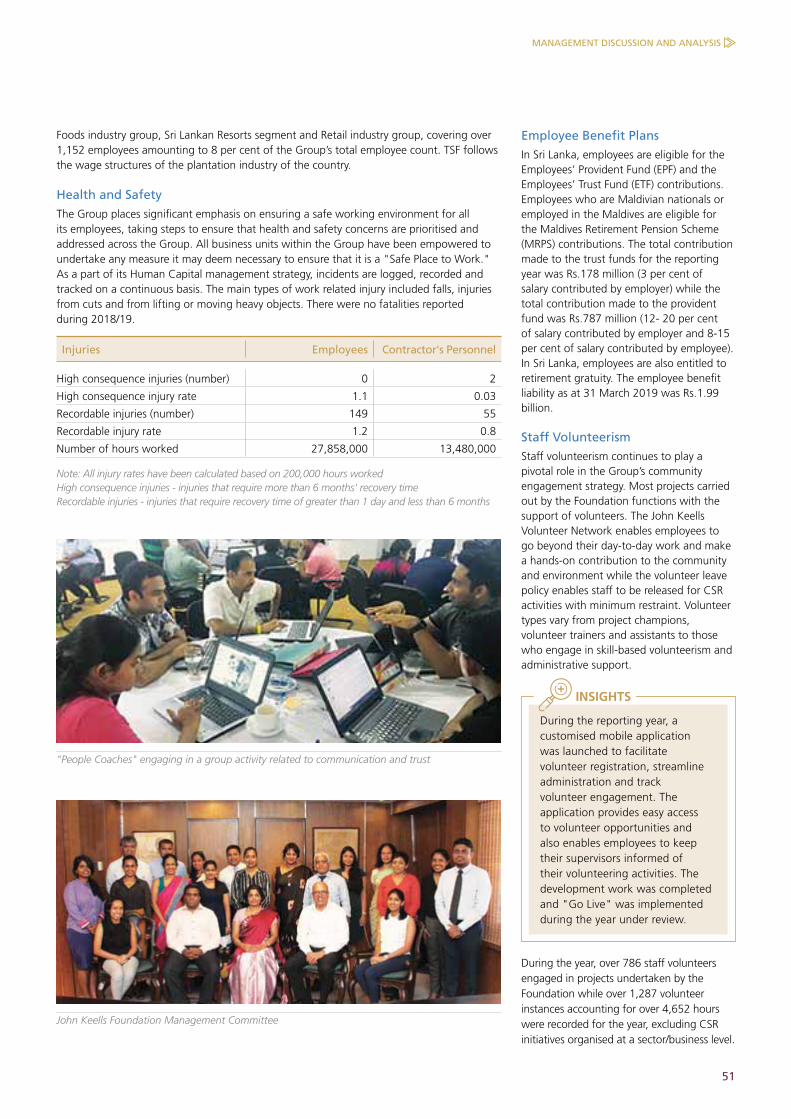
51
Foods industry group, Sri Lankan Resorts segment and Retail industry group, covering over 1,152 employees amounting to 8 per cent of the Group’s total employee count. TSF follows the wage structures of the plantation industry of the country.
Health and Safety
The Group places significant emphasis on ensuring a safe working environment for all its employees, taking steps to ensure that health and safety concerns are prioritised and addressed across the Group. All business units within the Group have been empowered to undertake any measure it may deem necessary to ensure that it is a "Safe Place to Work." As a part of its Human Capital management strategy, incidents are logged, recorded and tracked on a continuous basis. The main types of work related injury included falls, injuries from cuts and from lifting or moving heavy objects. There were no fatalities reported during 2018/19.
Injuries Employees Contractor's Personnel
High consequence injuries (number) 0 2
High consequence injury rate 1.1 0.03
Recordable injuries (number) 149 55
Recordable injury rate 1.2 0.8
Number of hours worked 27,858,000 13,480,000
Note: All injury rates have been calculated based on 200,000 hours worked High consequence injuries - injuries that require more than 6 months' recovery timeRecordable injuries - injuries that require recovery time of greater than 1 day and less than 6 months
"People Coaches" engaging in a group activity related to communication and trust
John Keells Foundation Management Committee
Employee Benefit Plans In Sri Lanka, employees are eligible for the Employees’ Provident Fund (EPF) and the Employees’ Trust Fund (ETF) contributions. Employees who are Maldivian nationals or employed in the Maldives are eligible for the Maldives Retirement Pension Scheme (MRPS) contributions. The total contribution made to the trust funds for the reporting year was Rs.178 million (3 per cent of salary contributed by employer) while the total contribution made to the provident fund was Rs.787 million (12- 20 per cent of salary contributed by employer and 8-15 per cent of salary contributed by employee). In Sri Lanka, employees are also entitled to retirement gratuity. The employee benefit liability as at 31 March 2019 was Rs.1.99 billion.
Staff Volunteerism Staff volunteerism continues to play a pivotal role in the Group’s community engagement strategy. Most projects carried out by the Foundation functions with the support of volunteers. The John Keells Volunteer Network enables employees to go beyond their day-to-day work and make a hands-on contribution to the community and environment while the volunteer leave policy enables staff to be released for CSR activities with minimum restraint. Volunteer types vary from project champions, volunteer trainers and assistants to those who engage in skill-based volunteerism and administrative support.
During the reporting year, a customised mobile application was launched to facilitate volunteer registration, streamline administration and track volunteer engagement. The application provides easy access to volunteer opportunities and also enables employees to keep their supervisors informed of their volunteering activities. The development work was completed and "Go Live" was implemented during the year under review.
INSIGHTS
During the year, over 786 staff volunteers engaged in projects undertaken by the Foundation while over 1,287 volunteer instances accounting for over 4,652 hours were recorded for the year, excluding CSR initiatives organised at a sector/business level.
MANAGEMENT DISCUSSION AND ANALYSIS

52 JOHN KEELLS HOLDINGS PLC | ANNUAL REPORT 2018/19
GROUP CONSOLIDATED REVIEWCAPITAL MANAGEMENT REVIEW
SOCIAL AND RELATIONSHIP CAPITAL
Building Social and Relationship Capital is of vital importance for the sustainable value creation of the Group. Given this significance, the Group strives to create and uphold trust and reciprocity among its key stakeholders. The feedback from stakeholders on perception and impact of Group operations obtained through the stakeholder engagement survey conducted in the previous year enabled the Group to further reinforce the emphasis placed on social responsibility.
78 per cent of the Group’s economic value distributed was spent on goods, services and utilities locally, with Sri Lanka being defined as local. This definition is based on the number of operations, location of revenue generation and the significant location of operations. Mutually beneficial relationships are sought in relevant industries through sustainable sourcing, with Rs.4.64 billion spent on purchases, mainly fresh produce, by the Consumer Foods and Retail industry groups and the Sri Lankan Resorts segment. Such initiatives stimulate local economies and encourage small businesses to help fulfil the supply chain requirements of the Group.
As a testament to its commitment to conducting operations in a responsible manner, the Group had no environmental, product related or any other significant fines during the reporting year and did not have any non-compliance with regard to marketing communications.
Three-year performance indicators:
Standard 2018/19 2017/18 2016/17
203-1 Community services and infrastructure projects (Rs.million) 115 125 150
204-1 Proportion of purchases from suppliers within Sri Lanka (%) 78 72 83
413-1 Community engagement (no. of persons impacted) 946,082 1,455,814 1,010,200
Sustainability integration awareness (no. of business partners) 80 80 80
Business partners screened for labour, environment and human rights 90 90 90
417-1 Proportion of labels carrying ingredients used (%) 80 80 81
Proportion of labels carrying information on disposal (%) 93 92 93
Proportion of labels carrying sourcing of components (%) 1 1 1
417-3 Voluntary standards relating to advertising Group policy based on ICC Code
419-1 Significant monetary fines* Nil Nil Nil
205-1 Proportion of businesses analysed for risk of corruption (%) 100 100 100
*Significant fines are defined as fines over Rs.1 million
Product Responsibility
The Group strives to ensure and maintain the highest standards for its products and services by adhering to all statutory and regulatory requirements, local and international, as well as global best practice. Group companies ensure the highest quality in processes, responsible marketing and communications, as well as consumer and employee health and safety through robust quality management processes and quality assurance. The ongoing ISO 9001, ISO 22000, ISO 14000 and OHSAS 18001 certifications by the relevant Group companies are testimony to the Group’s commitment in this regard.
Supply Chain Management
The Group strongly believes that striving to entrench sustainability in its supply chain helps create value through building mutually-beneficial, long-lasting relationships. The Group works closely with its key suppliers to create awareness and disseminate knowledge on sustainability best practices, with supplier fora being carried out for over 80 Group sourced suppliers in Sri Lanka as well as significant suppliers in the Maldives.
Approximately 90 existing suppliers were assessed during the year, while all new suppliers are assessed, prior to being contracted as a pre-requisite to carrying out business. The Group’s significant suppliers are assessed in terms of labour practices, upholding human rights and environmental impacts and are additionally assessed for key sustainability impacts based on the Group's supplier Code of Conduct, legal and other requirements.
The "Group Initiatives" function also ensures further integration of sustainability within the value chain. Tenders and online bids received for high value items sourced by the Group are assessed not only for quality and price but also for social and environmental aspects and impacts. Suppliers are encouraged to actively track and measure sustainability related aspects.
Social Responsibility
The John Keells Group’s corporate responsibility projects are firmly rooted in the Group’s belief that social development is an integral part of sustainable growth and impacts holistic development of the nation and its people as well as promoting basic human rights of people. During the year in review, JKH was awarded the Community Development Award at the Sri Lanka CSR Leadership awards 2018.
"Group companies ensure the highest quality in processes, responsible marketing and communications, as well as consumer and employee health and safety"
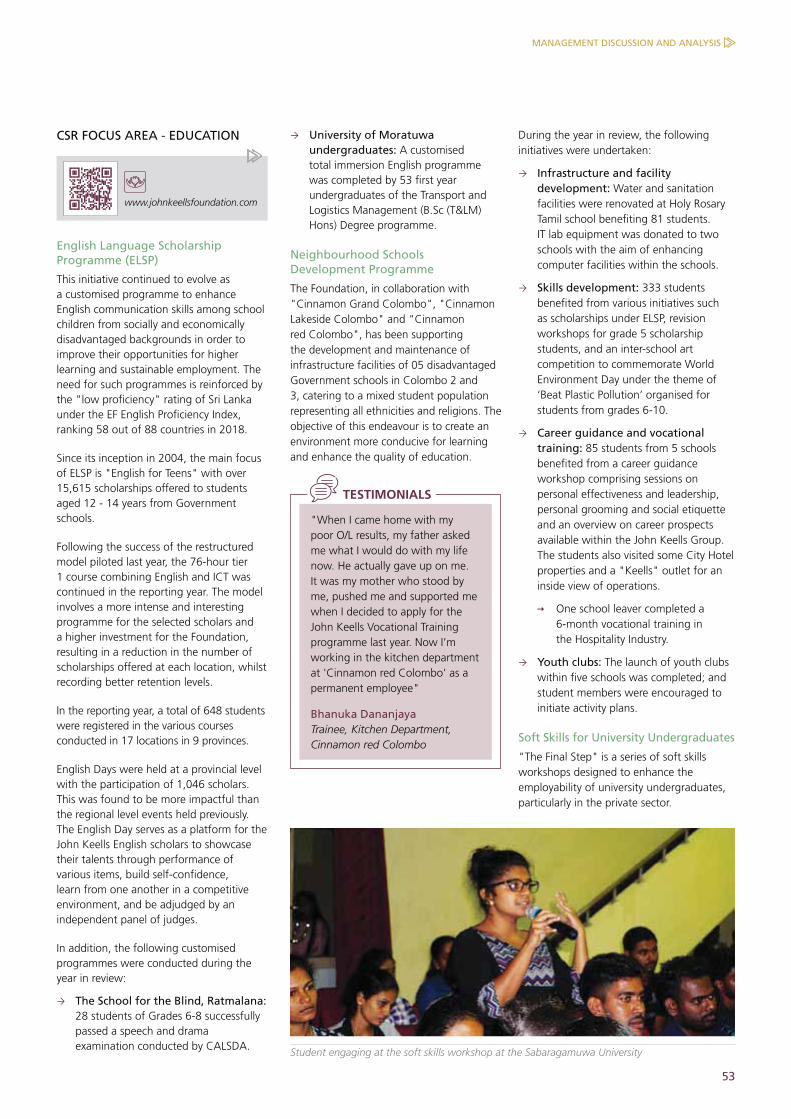
53
CSR FOCUS AREA - EDUCATION
www.johnkeellsfoundation.com
English Language Scholarship Programme (ELSP)
This initiative continued to evolve as a customised programme to enhance English communication skills among school children from socially and economically disadvantaged backgrounds in order to improve their opportunities for higher learning and sustainable employment. The need for such programmes is reinforced by the "low proficiency" rating of Sri Lanka under the EF English Proficiency Index, ranking 58 out of 88 countries in 2018.
Since its inception in 2004, the main focus of ELSP is "English for Teens" with over 15,615 scholarships offered to students aged 12 - 14 years from Government schools.
Following the success of the restructured model piloted last year, the 76-hour tier 1 course combining English and ICT was continued in the reporting year. The model involves a more intense and interesting programme for the selected scholars and a higher investment for the Foundation, resulting in a reduction in the number of scholarships offered at each location, whilst recording better retention levels.
In the reporting year, a total of 648 students were registered in the various courses conducted in 17 locations in 9 provinces.
English Days were held at a provincial level with the participation of 1,046 scholars. This was found to be more impactful than the regional level events held previously. The English Day serves as a platform for the John Keells English scholars to showcase their talents through performance of various items, build self-confidence, learn from one another in a competitive environment, and be adjudged by an independent panel of judges.
In addition, the following customised programmes were conducted during the year in review:
The School for the Blind, Ratmalana: 28 students of Grades 6-8 successfully passed a speech and drama examination conducted by CALSDA.
University of Moratuwa undergraduates: A customised total immersion English programme was completed by 53 first year undergraduates of the Transport and Logistics Management (B.Sc (T&LM) Hons) Degree programme.
Neighbourhood Schools Development Programme
The Foundation, in collaboration with "Cinnamon Grand Colombo", "Cinnamon Lakeside Colombo" and "Cinnamon red Colombo", has been supporting the development and maintenance of infrastructure facilities of 05 disadvantaged Government schools in Colombo 2 and 3, catering to a mixed student population representing all ethnicities and religions. The objective of this endeavour is to create an environment more conducive for learning and enhance the quality of education.
"When I came home with my poor O/L results, my father asked me what I would do with my life now. He actually gave up on me. It was my mother who stood by me, pushed me and supported me when I decided to apply for the John Keells Vocational Training programme last year. Now I’m working in the kitchen department at 'Cinnamon red Colombo' as a permanent employee"
Bhanuka DananjayaTrainee, Kitchen Department, Cinnamon red Colombo
TESTIMONIALS
Student engaging at the soft skills workshop at the Sabaragamuwa University
During the year in review, the following initiatives were undertaken:
Infrastructure and facility development: Water and sanitation facilities were renovated at Holy Rosary Tamil school benefiting 81 students. IT lab equipment was donated to two schools with the aim of enhancing computer facilities within the schools.
Skills development: 333 students benefited from various initiatives such as scholarships under ELSP, revision workshops for grade 5 scholarship students, and an inter-school art competition to commemorate World Environment Day under the theme of ‘Beat Plastic Pollution’ organised for students from grades 6-10.
Career guidance and vocational training: 85 students from 5 schools benefited from a career guidance workshop comprising sessions on personal effectiveness and leadership, personal grooming and social etiquette and an overview on career prospects available within the John Keells Group. The students also visited some City Hotel properties and a "Keells" outlet for an inside view of operations.
One school leaver completed a 6-month vocational training in the Hospitality Industry.
Youth clubs: The launch of youth clubs within five schools was completed; and student members were encouraged to initiate activity plans.
Soft Skills for University Undergraduates
"The Final Step" is a series of soft skills workshops designed to enhance the employability of university undergraduates, particularly in the private sector.
MANAGEMENT DISCUSSION AND ANALYSIS
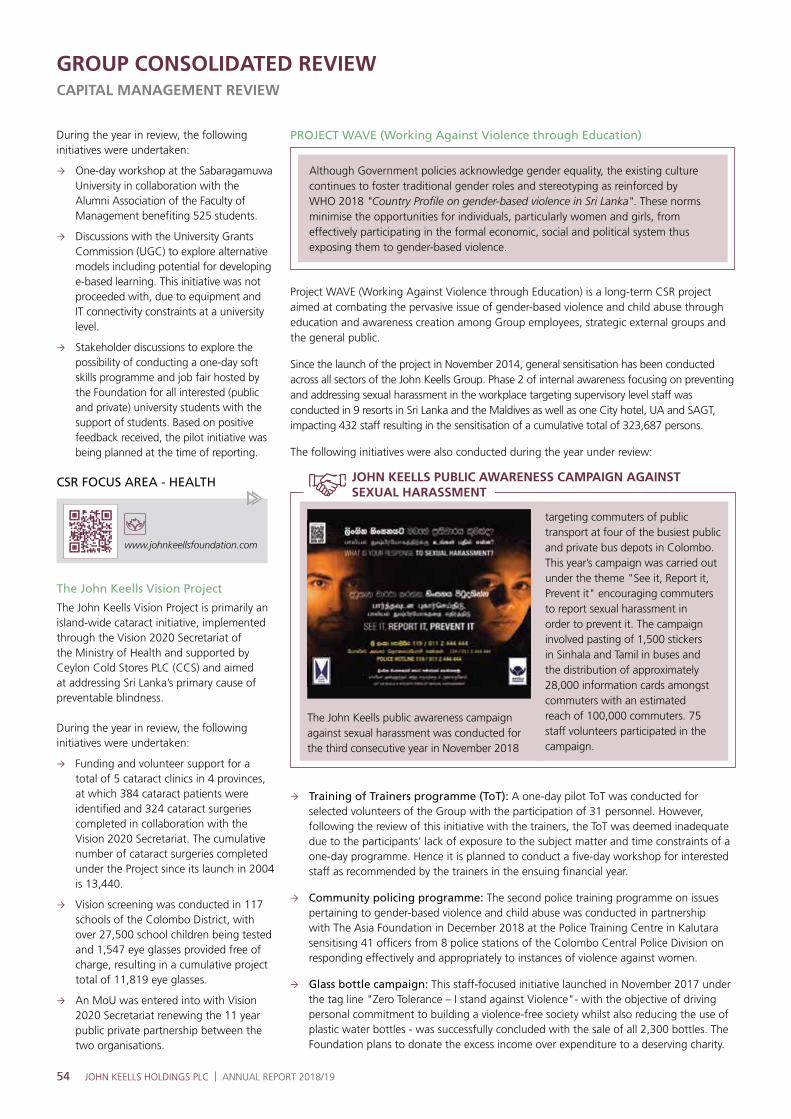
54 JOHN KEELLS HOLDINGS PLC | ANNUAL REPORT 2018/19
GROUP CONSOLIDATED REVIEWCAPITAL MANAGEMENT REVIEW
The John Keells public awareness campaign against sexual harassment was conducted for the third consecutive year in November 2018
targeting commuters of public transport at four of the busiest public and private bus depots in Colombo. This year’s campaign was carried out under the theme "See it, Report it, Prevent it" encouraging commuters to report sexual harassment in order to prevent it. The campaign involved pasting of 1,500 stickers in Sinhala and Tamil in buses and the distribution of approximately 28,000 information cards amongst commuters with an estimated reach of 100,000 commuters. 75 staff volunteers participated in the campaign.
JOHN KEELLS PUBLIC AWARENESS CAMPAIGN AGAINST SEXUAL HARASSMENT
Training of Trainers programme (ToT): A one-day pilot ToT was conducted for selected volunteers of the Group with the participation of 31 personnel. However, following the review of this initiative with the trainers, the ToT was deemed inadequate due to the participants’ lack of exposure to the subject matter and time constraints of a one-day programme. Hence it is planned to conduct a five-day workshop for interested staff as recommended by the trainers in the ensuing financial year.
Community policing programme: The second police training programme on issues pertaining to gender-based violence and child abuse was conducted in partnership with The Asia Foundation in December 2018 at the Police Training Centre in Kalutara sensitising 41 officers from 8 police stations of the Colombo Central Police Division on responding effectively and appropriately to instances of violence against women.
Glass bottle campaign: This staff-focused initiative launched in November 2017 under the tag line "Zero Tolerance – I stand against Violence"- with the objective of driving personal commitment to building a violence-free society whilst also reducing the use of plastic water bottles - was successfully concluded with the sale of all 2,300 bottles. The Foundation plans to donate the excess income over expenditure to a deserving charity.
During the year in review, the following initiatives were undertaken:
One-day workshop at the Sabaragamuwa University in collaboration with the Alumni Association of the Faculty of Management benefiting 525 students.
Discussions with the University Grants Commission (UGC) to explore alternative models including potential for developing e-based learning. This initiative was not proceeded with, due to equipment and IT connectivity constraints at a university level.
Stakeholder discussions to explore the possibility of conducting a one-day soft skills programme and job fair hosted by the Foundation for all interested (public and private) university students with the support of students. Based on positive feedback received, the pilot initiative was being planned at the time of reporting.
CSR FOCUS AREA - HEALTH
www.johnkeellsfoundation.com
The John Keells Vision Project
The John Keells Vision Project is primarily an island-wide cataract initiative, implemented through the Vision 2020 Secretariat of the Ministry of Health and supported by Ceylon Cold Stores PLC (CCS) and aimed at addressing Sri Lanka’s primary cause of preventable blindness.
During the year in review, the following initiatives were undertaken:
Funding and volunteer support for a total of 5 cataract clinics in 4 provinces, at which 384 cataract patients were identified and 324 cataract surgeries completed in collaboration with the Vision 2020 Secretariat. The cumulative number of cataract surgeries completed under the Project since its launch in 2004 is 13,440.
Vision screening was conducted in 117 schools of the Colombo District, with over 27,500 school children being tested and 1,547 eye glasses provided free of charge, resulting in a cumulative project total of 11,819 eye glasses.
An MoU was entered into with Vision 2020 Secretariat renewing the 11 year public private partnership between the two organisations.
PROJECT WAVE (Working Against Violence through Education)
Although Government policies acknowledge gender equality, the existing culture continues to foster traditional gender roles and stereotyping as reinforced by WHO 2018 "Country Profile on gender-based violence in Sri Lanka". These norms minimise the opportunities for individuals, particularly women and girls, from effectively participating in the formal economic, social and political system thus exposing them to gender-based violence.
Project WAVE (Working Against Violence through Education) is a long-term CSR project aimed at combating the pervasive issue of gender-based violence and child abuse through education and awareness creation among Group employees, strategic external groups and the general public.
Since the launch of the project in November 2014, general sensitisation has been conducted across all sectors of the John Keells Group. Phase 2 of internal awareness focusing on preventing and addressing sexual harassment in the workplace targeting supervisory level staff was conducted in 9 resorts in Sri Lanka and the Maldives as well as one City hotel, UA and SAGT, impacting 432 staff resulting in the sensitisation of a cumulative total of 323,687 persons.
The following initiatives were also conducted during the year under review:

55
The following initiatives focused on Child Abuse Prevention under Project WAVE, were implemented during the year under review:
Awareness for school children: Awareness programmes were conducted for primary school, grades 6, 8, 9 and 10 students of the neighbourhood schools sensitising a total of 350 school children.
Awareness for staff: An interactive awareness session on Cyber Exploitation and Violence Prevention was conducted for City Hotel-based Group staff sensitising a total of 12 staff.
Teacher training workshop: A pilot 2-day teacher training workshop was conducted in collaboration with the Western Province Department of Education for 55 Health and Physical Education (H&PE) teachers of the Colombo Zone towards empowering them to communicate the H&PE syllabus effectively, including awareness on child protection.
John Keells HIV & AIDS Awareness Campaign
HIV & AIDS awareness sessions have been conducted for varied segments of the population, since project inception in 2005. Sessions are conducted by John Keells volunteer trainers, with some of the sessions featuring testimonies by HIV positive persons as a means of effectively addressing aspects of stigma and discrimination while enabling such persons to develop economic independence.
During the year under review:
A total of 6,307 persons were sensitised on HIV & AIDS including 5,994 army personnel, resulting in a cumulative total of 130,637 persons.
World AIDS Day 2018 was commemorated with pinning of the red ribbon on staff. Several businesses of the Group organised staff awareness sessions while external sessions were also organised by "Cinnamon Lodge Habarana" and "Trinco Blu by Cinnamon".
The Foundation continued to host an e-learning platform on its website as an interactive learning tool that covers critical information on HIV & AIDS
and is accessible free of charge by any member of the public over the age of 18 years. During the reporting year, 3 persons completed the e-module while a total of 177 persons visited the platform, spending an average time of 2.5 minutes.
Positive Women’s Network (an NGO that takes care of people with HIV/AIDS) was provided funding support through the mobilisation of its members as resource persons at awareness sessions and commissioning of over 11,000 red ribbons for World AIDS Day commemorations of the Group.
CSR FOCUS AREA - LIVELIHOOD DEVELOPMENT
www.johnkeellsfoundation.com
Village Adoption
Initiated in 2005, the Village Adoption Project drives poverty alleviation at the grassroot level through an integrated and sustainable development programme including essential infrastructure development, education and skills development, livelihoods and market access, youth and gender empowerment towards enhancing income generation and living standards of disadvantaged rural communities. Its scope covers a wide range of development activities over 5–10 year periods. Initiatives are identified through constructive dialogue with multiple stakeholders, translating into a range of development activities that foster a spirit of independence, self-reliance and entrepreneurship.
During the reporting year, four villages were in development under this project, namely,
Iranaipalai (Puthukkudiyiruppu DS) in Mullaitivu District
Puthumathalan (Maritimepattu DS) in Mullaitivu District
Morawewa North (Morawewa DS) in Trincomalee District and
Nithulemada (Madadumbara DS), Kandy District
Below are some of the key activities carried out by the Foundation during the reporting year:
Education: Revision classes in preparation for public examinations were conducted for Grade 5 and Advanced Level students benefiting a total of 211 students in Mullaitivu and Morawewa.
Career guidance and youth empowerment: A career guidance workshop was conducted for school leavers benefiting 53 youth from Morawewa and Trincomalee. 6 participants were employed by Union Assurance following the career guidance workshop.
Infrastructure development: A community centre was constructed for the fisheries society of Puthumathalan in Mullaitivu and the renovation of the ceiling of the Nithulemada medical centre was funded.
Gender empowerment: The establishment of a women’s society was facilitated to support gender participation, capacity building and
A farmer interacting at the farmer - buyer forum in Morawewa
MANAGEMENT DISCUSSION AND ANALYSIS

56 JOHN KEELLS HOLDINGS PLC | ANNUAL REPORT 2018/19
GROUP CONSOLIDATED REVIEWCAPITAL MANAGEMENT REVIEW
communal harmony in Nithulemada. A workshop on mosquito net making was conducted for 24 members of the society.
Market access: A farmer buyer forum was held in Morawewa North towards encouraging paddy farmers to explore crop diversification given the water scarcity in the area. The programme was attended by 72 farmers from 11 farmer organisations and representatives from JMSL, CCS, CIC Holdings PLC, Ceylon Biscuits Limited and Prima Ceylon (Private) Limited. Following the workshop, farmers have supplied JMSL with 40 kg of pumpkin and been provided ginger seeds by CCS to be cultivated on a trial basis.
Impact assessment: An impact and gap assessment was conducted and detailed project proposals obtained via World Vision Lanka on the two villages in Mullaitivu following the completion of the Foundation’s 5-year engagement towards identifying and initiating key activities prior to project closure.
Needs assessment: A needs assessment was conducted in Nithulemada where four key areas - namely, pre-school development, water security, youth development and peace building – were identified for potential intervention and deep-level assessments initiated.
Project closure: A closure programme for Morawewa was held in July 2018 following the Foundation’s completion of its 5-year engagement and planned initiatives.
Water and Sanitation Initiatives
Collaboration with the National Water Supply and Drainage Board (NWSDB) to address chronic kidney disease (CKD) – The installation of the two Reverse Osmosis (RO) Filtration systems were funded and commissioned in the Anuradhapura District in collaboration with the National Water Supply and Drainage Board (NWSDB). This is as part of a master plan of NWSDB to provide access to good quality water for drinking and cooking purposes in areas known to be at risk of chronic kidney disease (CKD).
Collaboration with the Prisoners’ Welfare Association of Sri Lanka on a water and sanitation initiative at the Welikada Prison – The renovation work of the water and sanitation facilities of the `L Hall’ of the Welikada Prison, which was originally built in 1848 with a capacity for about 1,200 and currently housing approximately 3,000 inmates sentenced to lifetime imprisonment, was completed. The Foundation provided additional support towards the completion of certain civil repairs. The Foundation funded the building material while unskilled labour was provided by the prison inmates under the supervision of Prison officials.
Other Community Service Initiatives
Praja Shakthi community awareness: The Foundation launched the Praja Shakthi initiative with the objective of empowering adults and youth through awareness on expanding career opportunities in the context of vast development within Colombo and Sri Lanka, the skills and mindsets needed to capitalise on such opportunities, and the importance of safeguarding community health, safety and security. The programme which was attended by 75 participants included company presentations by the Property, Retail and Leisure industry groups of JKH highlighting the opportunities for youth within these industry groups followed by a segment on child protection and substance abuse.
No-Kunu campaign: The Foundation also supported a mass citizen initiative to clean up the streets of Colombo 2 by deploying a total of 60 volunteers. In addition to the assistance extended, the volunteers also engaged with the
community to better address household waste management, thus ensuring that the benefits of this initiative can be sustained over the long-term.
Contribution - AYATI Supported Employment Unit
The Foundation contributed towards the sponsorship of the construction of AYATI’s Supported Employment Unit focused on steering the social and economic integration goals of children with disabilities. AYATI is a national centre of excellence for children with disabilities located at the Faculty of Medicine of the University of Kelaniya based in Ragama.
CSR FOCUS AREA - ARTS & CULTURE
www.johnkeellsfoundation.com
Kala Pola
Kala Pola, Sri Lanka’s highly popular open-air art fair, is an annual event which attracts numerous visual artists from across the island. Conceptualised by The George Keyt Foundation, the year in review marked the 25th anniversary of unbroken patronage of Kala Pola by the John Keells Group.
The art fair held in February 2019 showcased 357 artists and sculptors from various parts of Sri Lanka and attracted a record 31,847 visitors, both local and foreign, generating over Rs.17.5 million in estimated sales revenue on the day (excluding commissioned work). The Children’s Art Corner organised by CCS, attracted 235 children who revelled in painting, drawing and experimenting with
Volunteers at the ‘beach clean-up’

57
clay work aided by teachers of the Cora Abraham Art School. A variety of entertainment was provided in the event by famed dance and drum ensembles while 47 young musicians performed orchestral pieces during the morning.
Whilst the artist catalogue accompanying the event publicises artists exhibiting at Kala Pola, online platforms such as www.kalapola.lk and www.srilankanartgallery.com hosted by the Foundation enable Sri Lankan artists to access markets throughout the year.
John Keells Digital Art Gallery
The Foundation continued to maintain and enhance its digital art gallery which serves as an online platform for local artists to showcase their work all year-round while sustaining and enhancing the interest of art patrons. As at 31 March 2019, 1,009 artists were registered with the Sri Lankan Art Gallery (SLAG) while the work of 250 artists selected by a team of curators was on view at the curated site. 26 new artists were registered on SLAG at Kala Pola 2019. During the year in review, approximately 21,248 persons visited the site.
The following initiatives were also undertaken in the reporting year:
Guru Gedera Festival – The Foundation was associated with Cinnamon Hotels & Resorts as the title sponsor of this first immersive traditional arts experience in Sri Lanka presented by the Chitrasena Vajira Dance Foundation.
Sunera Foundation – The Foundation continued to sponsor the Sunera workshop in Katugasthota benefiting 29 differently-abled children and youth.
Promoting showcasing of local artist’s work on a global platform – The Foundation supported by "Cinnamon Life" co-sponsored local artist Anoma Wijewardene who was invited to exhibit her art installation at the European Cultural Centre exhibition during the Venice Biennale 2019. The installation is a combination of panels by Ms. Wijewardene, poetry from Romesh Gunesekera and music from Sharon Smith.
CSR FOCUS AREA - DISASTER RELIEF
www.johnkeellsfoundation.com
Providing strategic support to fellow citizens in their time of need has been a vital aspect of the John Keells Group’s culture.
Disaster preparedness – The Foundation supported the Asia Pacific Alliance for Disaster Management (A-PAD) in creating community awareness via Gammada through 12 workshops in 4 districts - Kalutara, Matara, Ratnapura and Galle - impacting over 5,000 families. The Foundation also supported the National Disaster Relief Services Center (NDRSC) by undertaking data entry of their island-wide contingency planning mechanism onto their website with the support of 19 Group volunteers.
Flood relief – Towards facilitating the resettlement of affected persons, the Foundation in collaboration with Sri Lanka Red Cross Society cleaned 201 wells in the Colombo District benefiting 804 people, and also distributed 50 school stationery kits to affected school children in the Mullaitivu District. In addition to efforts by the Foundation, TSF and JMSL engaged in relief activities in their respective business areas. Collection points were set up at supermarket outlets in Madampe for the public to donate dry rations and sanitary items, with JMSL matching the contribution on a 1 to1 basis.
For further details on these projects, refer the John Keells Foundation website and the Sustainable Development Goals and Impacts section of this Report - page 27
Art buyers at Kala Pola 2019
Well cleaning after floods, undertaken by the Foundation, SLRC and Group companies
MANAGEMENT DISCUSSION AND ANALYSIS
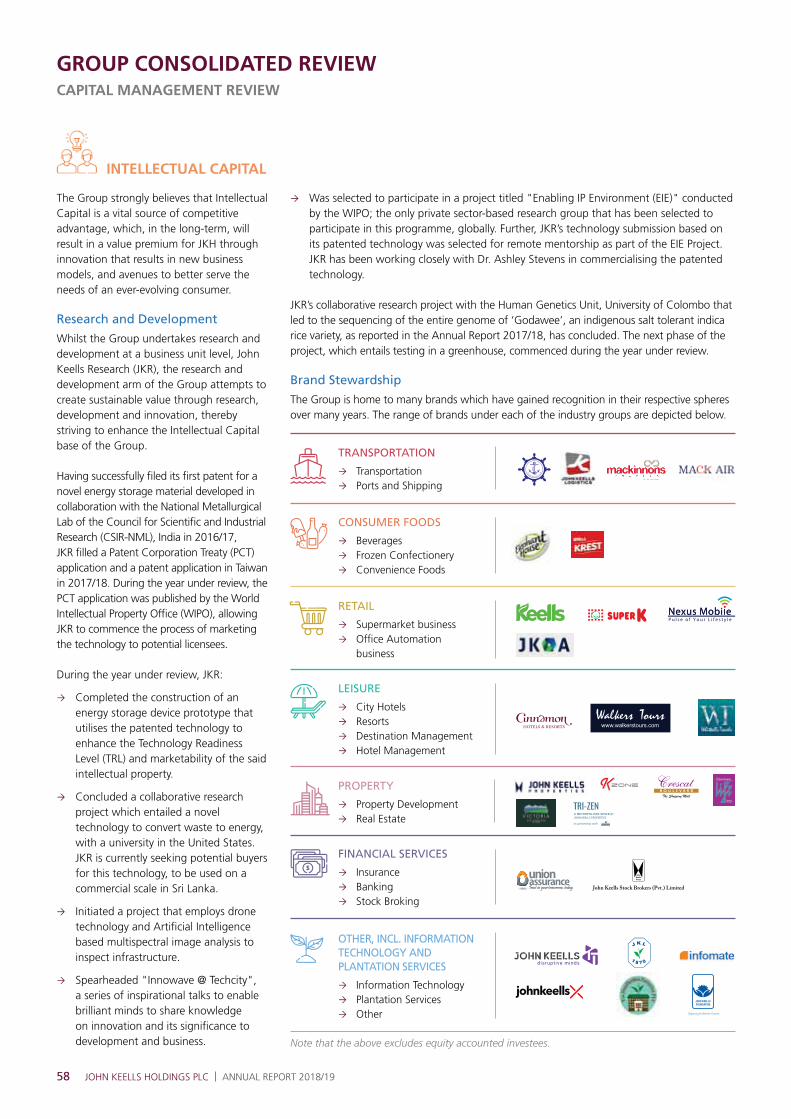
58 JOHN KEELLS HOLDINGS PLC | ANNUAL REPORT 2018/19
GROUP CONSOLIDATED REVIEWCAPITAL MANAGEMENT REVIEW
INTELLECTUAL CAPITAL
The Group strongly believes that Intellectual Capital is a vital source of competitive advantage, which, in the long-term, will result in a value premium for JKH through innovation that results in new business models, and avenues to better serve the needs of an ever-evolving consumer.
Research and Development
Whilst the Group undertakes research and development at a business unit level, John Keells Research (JKR), the research and development arm of the Group attempts to create sustainable value through research, development and innovation, thereby striving to enhance the Intellectual Capital base of the Group.
Having successfully filed its first patent for a novel energy storage material developed in collaboration with the National Metallurgical Lab of the Council for Scientific and Industrial Research (CSIR-NML), India in 2016/17, JKR filled a Patent Corporation Treaty (PCT) application and a patent application in Taiwan in 2017/18. During the year under review, the PCT application was published by the World Intellectual Property Office (WIPO), allowing JKR to commence the process of marketing the technology to potential licensees.
During the year under review, JKR:
Completed the construction of an energy storage device prototype that utilises the patented technology to enhance the Technology Readiness Level (TRL) and marketability of the said intellectual property.
Concluded a collaborative research project which entailed a novel technology to convert waste to energy, with a university in the United States. JKR is currently seeking potential buyers for this technology, to be used on a commercial scale in Sri Lanka.
Initiated a project that employs drone technology and Artificial Intelligence based multispectral image analysis to inspect infrastructure.
Spearheaded "Innowave @ Techcity", a series of inspirational talks to enable brilliant minds to share knowledge on innovation and its significance to development and business.
Was selected to participate in a project titled "Enabling IP Environment (EIE)" conducted by the WIPO; the only private sector-based research group that has been selected to participate in this programme, globally. Further, JKR’s technology submission based on its patented technology was selected for remote mentorship as part of the EIE Project. JKR has been working closely with Dr. Ashley Stevens in commercialising the patented technology.
JKR’s collaborative research project with the Human Genetics Unit, University of Colombo that led to the sequencing of the entire genome of ‘Godawee’, an indigenous salt tolerant indica rice variety, as reported in the Annual Report 2017/18, has concluded. The next phase of the project, which entails testing in a greenhouse, commenced during the year under review.
Brand Stewardship
The Group is home to many brands which have gained recognition in their respective spheres over many years. The range of brands under each of the industry groups are depicted below.
TRANSPORTATION
Transportation Ports and Shipping
RETAIL
Supermarket business Office Automation
business
CONSUMER FOODS
Beverages Frozen Confectionery Convenience Foods
FINANCIAL SERVICES
Insurance Banking Stock Broking
OTHER, INCL. INFORMATION TECHNOLOGY AND PLANTATION SERVICES
Information Technology Plantation Services Other
LEISURE
City Hotels Resorts Destination Management Hotel Management
PROPERTY
Property Development Real Estate
Note that the above excludes equity accounted investees.
59
Given the changing dynamics and continually-evolving business trends, several brand development initiatives were pioneered during the year under review. In addition to the routine brand building initiatives undertaken by each of the businesses, the ensuing section discusses the key brand building initiatives undertaken by the Group in 2018/19.
The Leisure industry group placed significant emphasis on systematically executing the "Cinnamon" brand strategy, by spearheading several lifestyle-centric initiatives. To this end, the sensational and popular musical "Mamma Mia" produced by Judy Craymer, Richard East and Björn Ulvaeus, was brought to Colombo for an eight-day run in December 2018, as a part of the international tour; the first-ever performance in South Asia. Some other events organised include "Cinnamon Music Festival", "The Clairvoyants", "Cinnamon TBCasia" and "Nigella Lawson in Sri Lanka".
Market research and independent reports suggest that the new "Keells" modern trade brand which was developed with the aim of epitomising JMSL’s "fresh" promise, service excellence and quality within 5 activity pillars; product, price, place, people and the customer, thereby improving the quality of life for the nation, has been well received by the market. To this end, the brand equity based on a store equity index maintained by AC Nielsen has improved during the year while the brand also moved 2-points to 12th place (against 14th in the prior year) on the top 100 Most Valuable Brands in Sri Lanka as compiled by Brand Finance 2019.
The brand value of Union Assurance (UA) increased by 39 per cent to Rs.2.50 billion during the calendar year 2018 (CY2017: Rs.1.80 billion). This is as per the value derived from the valuation conducted by Brand Finance (UK) in association with Sting Consultants using the "relief of royalty approach", which assumes the company does not own the brand and calculates how much it would cost to license it from a third party. During the said period, UA was also recognised as one of Forbes Asia’s Best Under a Billion 200 – the only Sri Lankan company to receive this honour during the year. UA was also able to secure the title of "Most Trusted Life Insurance Company in Asia" at the Asia’s Trusted Brand Awards 2018.
Digitisation, Disruption and Open Innovation
The Group continues to place emphasis on staying abreast of emerging and current disruptive innovation trends, while developing the digital quotient (DQ) of businesses and individuals. Investments in digital infrastructure is expected to increase productivity and efficiency of businesses, through the use of digital technologies and disruptive business models, thereby driving sustainable growth. User education and awareness of potential implications from the use of such infrastructure remains a key challenge under this form of Capital for the Group. To this end, the Group strives to build employee DQ through training and development, implementation of user-friendly systems and procedures and automation of process with minimal human interaction.
John Keells X (JKX) creates a unique platform for disruptive and innovative solutions and provides initial investments required for start-up businesses and technologies. Key highlights for JKX are as follows:
John Keells X - Open Innovation Challenge 2017: An investment of Rs.2 million for each of the 6 winners of the challenge were made available during the year under review. The accelerator programme continued for the selected teams, which linked them to a channel of resources, including office space, access to support services, mentoring and coaching, among others.
JKX 3.0: JKX launched its third open innovation challenge in December 2018. As a part of this application process, an "Early Applicant Meet-up" was organised in January 2018, following which applications closed in February 2018. Post rigorous evaluation, 15 applicants were shortlisted for the pre-accelerator programme. The shortlisted applicants will be provided with rigorous training and development, including workshops on legal aspects of entrepreneurship and valuing start-ups. Winners of the challenge will advance to a six-month accelerator programme, which will link them to a channel of resources, both within and outside the Group.
A winner of the "John Keells X - Open Innovation Challenge 2017", "Helios", a peer-to-peer lending platform which leverages on blockchain technology, secured approval for further investment through the JKX accelerator programme.
The current information and digitisation age has accelerated the discovery of new technology and ways for improving business operations and maintaining competitive advantages. Presence of big-data technology enables cost-effective storage, processing and analysis of large amounts of data, allows for users to draw meaningful insights and make informed decisions and enables better analysis, among others. In this light, during the year under review, the Group, in consultation with a leading global management consulting firm, embarked on an advanced analytics transformation journey. The Group will leverage on the diversity of industries the Group operates in and the unparalleled access to a comprehensive data ecosystem, to capitalise on this unique opportunity.
The Group will pursue the roll-out of a road map of well-defined advanced analytics Use Cases, which aim to
unlock significant value and address key business challenges across value chains in four industry groups – Retail, Financial Services, Leisure and Consumer Foods, in the short to medium-term.
To this end, a well-defined Data Governance Framework entailing the overall management of the availability, usability, integrity and security of data used will be implemented, thereby ensuring accountability, efficient monitoring and quality control. This effort will be further augmented by investment, particularly channelled towards Human Capital, to develop capabilities to ensure that a lasting and sustainable advanced analytics capability is built within the Group. The Group is of the view that the advanced analytics programme will be pivotal to stay abreast of changing business landscapes while driving businesses towards a greater degree of data-driven decision making.
Business-specific details pertaining to the value creation under Intellectual Capital is found in the Industry Group Review section of this Report - page 77
ADVANCED ANALYTICS TRANSFORMATION JOURNEY
MANAGEMENT DISCUSSION AND ANALYSIS
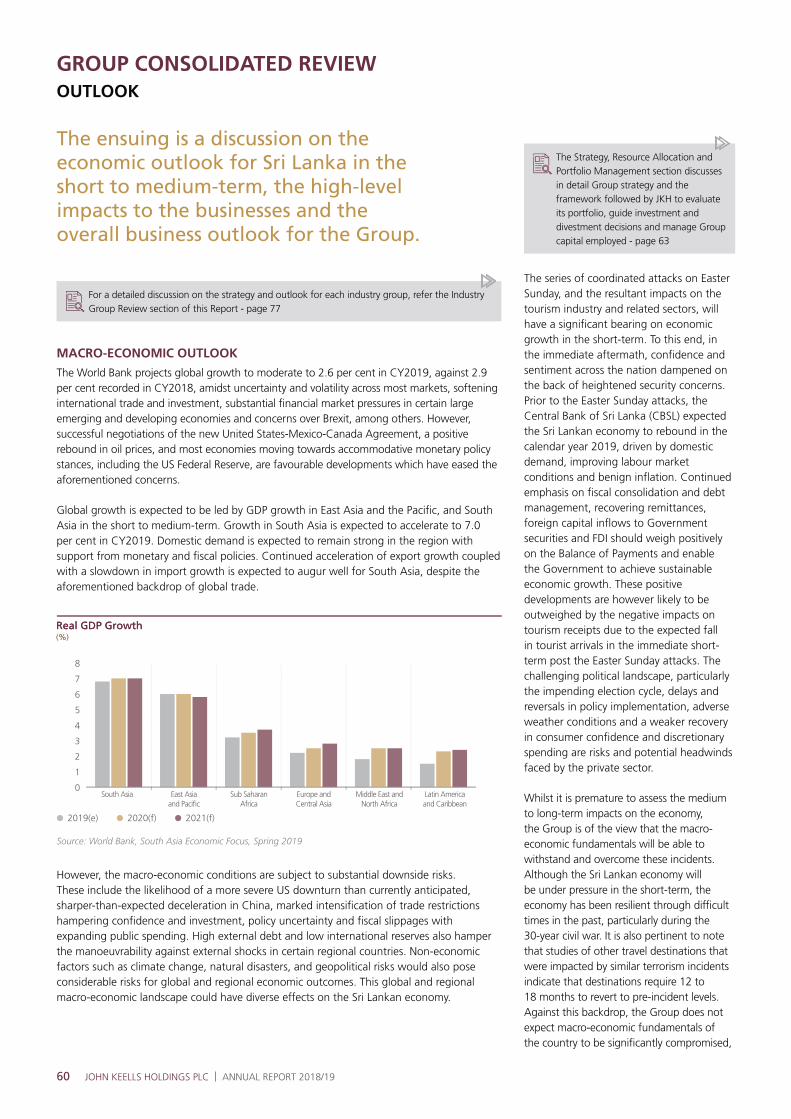
60 JOHN KEELLS HOLDINGS PLC | ANNUAL REPORT 2018/19
GROUP CONSOLIDATED REVIEWOUTLOOK
The ensuing is a discussion on the economic outlook for Sri Lanka in the short to medium-term, the high-level impacts to the businesses and the overall business outlook for the Group.
For a detailed discussion on the strategy and outlook for each industry group, refer the Industry Group Review section of this Report - page 77
MACRO-ECONOMIC OUTLOOK
The World Bank projects global growth to moderate to 2.6 per cent in CY2019, against 2.9 per cent recorded in CY2018, amidst uncertainty and volatility across most markets, softening international trade and investment, substantial financial market pressures in certain large emerging and developing economies and concerns over Brexit, among others. However, successful negotiations of the new United States-Mexico-Canada Agreement, a positive rebound in oil prices, and most economies moving towards accommodative monetary policy stances, including the US Federal Reserve, are favourable developments which have eased the aforementioned concerns.
Global growth is expected to be led by GDP growth in East Asia and the Pacific, and South Asia in the short to medium-term. Growth in South Asia is expected to accelerate to 7.0 per cent in CY2019. Domestic demand is expected to remain strong in the region with support from monetary and fiscal policies. Continued acceleration of export growth coupled with a slowdown in import growth is expected to augur well for South Asia, despite the aforementioned backdrop of global trade.
0
1
2
3
4
5
6
7
8
Real GDP GrowthReal GDP Growth(%)(%)
South Asia
2019(e)
Europe andCentral Asia
Sub SaharanAfrica
East Asiaand Pacific
Middle East andNorth Africa
Latin Americaand Caribbean
2020(f) 2021(f)
Source: World Bank, South Asia Economic Focus, Spring 2019
The series of coordinated attacks on Easter Sunday, and the resultant impacts on the tourism industry and related sectors, will have a significant bearing on economic growth in the short-term. To this end, in the immediate aftermath, confidence and sentiment across the nation dampened on the back of heightened security concerns. Prior to the Easter Sunday attacks, the Central Bank of Sri Lanka (CBSL) expected the Sri Lankan economy to rebound in the calendar year 2019, driven by domestic demand, improving labour market conditions and benign inflation. Continued emphasis on fiscal consolidation and debt management, recovering remittances, foreign capital inflows to Government securities and FDI should weigh positively on the Balance of Payments and enable the Government to achieve sustainable economic growth. These positive developments are however likely to be outweighed by the negative impacts on tourism receipts due to the expected fall in tourist arrivals in the immediate short-term post the Easter Sunday attacks. The challenging political landscape, particularly the impending election cycle, delays and reversals in policy implementation, adverse weather conditions and a weaker recovery in consumer confidence and discretionary spending are risks and potential headwinds faced by the private sector.
Whilst it is premature to assess the medium to long-term impacts on the economy, the Group is of the view that the macro-economic fundamentals will be able to withstand and overcome these incidents. Although the Sri Lankan economy will be under pressure in the short-term, the economy has been resilient through difficult times in the past, particularly during the 30-year civil war. It is also pertinent to note that studies of other travel destinations that were impacted by similar terrorism incidents indicate that destinations require 12 to 18 months to revert to pre-incident levels. Against this backdrop, the Group does not expect macro-economic fundamentals of the country to be significantly compromised,
However, the macro-economic conditions are subject to substantial downside risks. These include the likelihood of a more severe US downturn than currently anticipated, sharper-than-expected deceleration in China, marked intensification of trade restrictions hampering confidence and investment, policy uncertainty and fiscal slippages with expanding public spending. High external debt and low international reserves also hamper the manoeuvrability against external shocks in certain regional countries. Non-economic factors such as climate change, natural disasters, and geopolitical risks would also pose considerable risks for global and regional economic outcomes. This global and regional macro-economic landscape could have diverse effects on the Sri Lankan economy.
The Strategy, Resource Allocation and Portfolio Management section discusses in detail Group strategy and the framework followed by JKH to evaluate its portfolio, guide investment and divestment decisions and manage Group capital employed - page 63
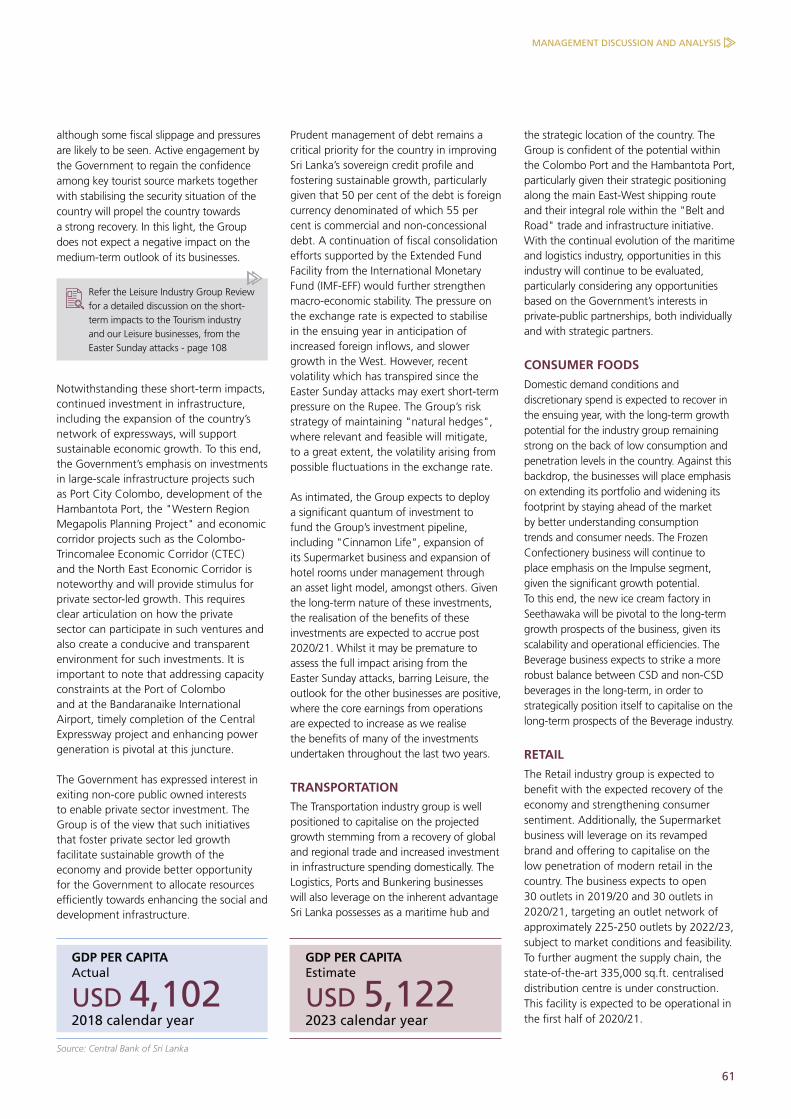
61
although some fiscal slippage and pressures are likely to be seen. Active engagement by the Government to regain the confidence among key tourist source markets together with stabilising the security situation of the country will propel the country towards a strong recovery. In this light, the Group does not expect a negative impact on the medium-term outlook of its businesses.
Refer the Leisure Industry Group Review for a detailed discussion on the short-term impacts to the Tourism industry and our Leisure businesses, from the Easter Sunday attacks - page 108
Notwithstanding these short-term impacts, continued investment in infrastructure, including the expansion of the country’s network of expressways, will support sustainable economic growth. To this end, the Government’s emphasis on investments in large-scale infrastructure projects such as Port City Colombo, development of the Hambantota Port, the "Western Region Megapolis Planning Project" and economic corridor projects such as the Colombo-Trincomalee Economic Corridor (CTEC) and the North East Economic Corridor is noteworthy and will provide stimulus for private sector-led growth. This requires clear articulation on how the private sector can participate in such ventures and also create a conducive and transparent environment for such investments. It is important to note that addressing capacity constraints at the Port of Colombo and at the Bandaranaike International Airport, timely completion of the Central Expressway project and enhancing power generation is pivotal at this juncture.
The Government has expressed interest in exiting non-core public owned interests to enable private sector investment. The Group is of the view that such initiatives that foster private sector led growth facilitate sustainable growth of the economy and provide better opportunity for the Government to allocate resources efficiently towards enhancing the social and development infrastructure.
Prudent management of debt remains a critical priority for the country in improving Sri Lanka’s sovereign credit profile and fostering sustainable growth, particularly given that 50 per cent of the debt is foreign currency denominated of which 55 per cent is commercial and non-concessional debt. A continuation of fiscal consolidation efforts supported by the Extended Fund Facility from the International Monetary Fund (IMF-EFF) would further strengthen macro-economic stability. The pressure on the exchange rate is expected to stabilise in the ensuing year in anticipation of increased foreign inflows, and slower growth in the West. However, recent volatility which has transpired since the Easter Sunday attacks may exert short-term pressure on the Rupee. The Group’s risk strategy of maintaining "natural hedges", where relevant and feasible will mitigate, to a great extent, the volatility arising from possible fluctuations in the exchange rate.
As intimated, the Group expects to deploy a significant quantum of investment to fund the Group’s investment pipeline, including "Cinnamon Life", expansion of its Supermarket business and expansion of hotel rooms under management through an asset light model, amongst others. Given the long-term nature of these investments, the realisation of the benefits of these investments are expected to accrue post 2020/21. Whilst it may be premature to assess the full impact arising from the Easter Sunday attacks, barring Leisure, the outlook for the other businesses are positive, where the core earnings from operations are expected to increase as we realise the benefits of many of the investments undertaken throughout the last two years.
TRANSPORTATION
The Transportation industry group is well positioned to capitalise on the projected growth stemming from a recovery of global and regional trade and increased investment in infrastructure spending domestically. The Logistics, Ports and Bunkering businesses will also leverage on the inherent advantage Sri Lanka possesses as a maritime hub and
the strategic location of the country. The Group is confident of the potential within the Colombo Port and the Hambantota Port, particularly given their strategic positioning along the main East-West shipping route and their integral role within the "Belt and Road" trade and infrastructure initiative. With the continual evolution of the maritime and logistics industry, opportunities in this industry will continue to be evaluated, particularly considering any opportunities based on the Government’s interests in private-public partnerships, both individually and with strategic partners.
CONSUMER FOODS
Domestic demand conditions and discretionary spend is expected to recover in the ensuing year, with the long-term growth potential for the industry group remaining strong on the back of low consumption and penetration levels in the country. Against this backdrop, the businesses will place emphasis on extending its portfolio and widening its footprint by staying ahead of the market by better understanding consumption trends and consumer needs. The Frozen Confectionery business will continue to place emphasis on the Impulse segment, given the significant growth potential. To this end, the new ice cream factory in Seethawaka will be pivotal to the long-term growth prospects of the business, given its scalability and operational efficiencies. The Beverage business expects to strike a more robust balance between CSD and non-CSD beverages in the long-term, in order to strategically position itself to capitalise on the long-term prospects of the Beverage industry.
RETAIL
The Retail industry group is expected to benefit with the expected recovery of the economy and strengthening consumer sentiment. Additionally, the Supermarket business will leverage on its revamped brand and offering to capitalise on the low penetration of modern retail in the country. The business expects to open 30 outlets in 2019/20 and 30 outlets in 2020/21, targeting an outlet network of approximately 225-250 outlets by 2022/23, subject to market conditions and feasibility. To further augment the supply chain, the state-of-the-art 335,000 sq.ft. centralised distribution centre is under construction. This facility is expected to be operational in the first half of 2020/21.
MANAGEMENT DISCUSSION AND ANALYSIS
Source: Central Bank of Sri Lanka
GDP PER CAPITA Actual
2018 calendar yearUSD 4,102
GDP PER CAPITA Estimate
2023 calendar yearUSD 5,122
62 JOHN KEELLS HOLDINGS PLC | ANNUAL REPORT 2018/19
GROUP CONSOLIDATED REVIEWOUTLOOK
LEISURE
The Leisure industry group is well positioned to capitalise on the projected growth of tourist arrivals to the country in the medium to long-term. A multitude of propositions the destination is able to offer to tourists, from a rich cultural heritage, geological diversity, to unique wildlife experiences, is further augmented by increasing awareness of the destination and recent investments in infrastructure which has made the country more accessible. In order to capitalise on such prospects, the Group is proactively pursuing opportunities for expansion and strategic partners to widen the "Cinnamon" footprint. The Group is aware of the asset heavy nature of the industry group and the resultant impact to the returns of the Group portfolio. Given this, the Group will consciously expand via an asset light investment model, reducing its exposure to brick-and-mortar while increasing its rooms under management and improving return on capital employed. Businesses will continue to streamline standards and processes, contributing to a more efficient management of room inventory, yield management and enhanced guest experience, while deriving synergies on common costs which lend itself to centralisation.
Lack of alternate locations from traditional meetings, incentives, conferences and exhibitions (MICE) destinations, close proximity and flight connectivity to key source markets such as India and China also present a significant opportunity to position Sri Lanka as a hub for MICE events and destination weddings. Although Sri Lanka has witnessed noteworthy growth in MICE travel over the years, albeit off a low base, the current infrastructure gap restricts the destination in realising its full potential, given its inability to cater to large events. Additionally, although the tourism industry will experience a short-term impact following the recent Easter Sunday attacks, the Group expects a rebound in arrivals; which coincides with commencement of operations at "Cinnamon Life". Against this backdrop, "Cinnamon Life" is ideally positioned to bridge this gap and cater towards the emerging requirements of the contemporary tourist and increasing MICE traffic, positioning Colombo as a hub for business and leisure travel.
Refer the Leisure Industry Group Review for a detailed discussion on the short-term impacts to the tourism industry and our Leisure businesses from the Easter Sunday attacks - page 108
PROPERTY
Driven by the increased demand for housing and commercial spaces in Colombo and the suburbs given increased connectivity, investment in infrastructure, an emerging upper middle class consumer base coupled with growing urbanisation rates, the Property industry group will continue to identify unique product propositions within the residential and commercial property markets, leveraging on the Group’s sizeable land bank and its reputation as a leading developer. In order to address the volatile trend of revenue recognition, the industry group will develop a more robust and sustainable pipeline of projects under three product verticals; "Luxe", "Metropolitan" and "Suburban".
FINANCIAL SERVICES
The Insurance business will continue to capitalise on the opportunities made available by the low life insurance penetration within the country, ageing population and rising consumer wealth, leveraging on the business’s strong brand presence and cost-efficient processes. The agency channel is expected to be a key driver of performance, while bancassurance is expected to be a key driver of premium growth in the long-term. The business will also place emphasis on its digital strategy as it ventures to establish itself as the leading life insurer in Sri Lanka.
Despite the challenging external environment stemming from increased regulation, Nations Trust Bank will leverage on its customer service, brand promise, and branch network to drive growth across its business segments. The Bank will continue its focus on delivering novel digital banking solutions through the expansion of "FriMi" – Sri Lanka’s first digital bank, migrating customers to digital platforms and further streamlining processes through better automation. It is noted that given changing regulations, managing impairments though prudent monitoring and recovery processes will be a key priority for the Bank as well as the industry.
SUSTAINABILITY AND RISK MANAGEMENT
The Group’s 2020 water and energy reduction targets, based on systematic audits, assessments and benchmarking carried out for industry groups such as Leisure, Consumer Foods and Retail which
contribute significantly to the Group’s total energy and water usage, will continue to be monitored, with initiatives undertaken, to ensure target achievement. The Group will also continue its stride towards outperforming selected international benchmarks for carbon footprint, energy consumption and water usage, while also seeking to improve its own performance on the said aspects.
Focus will continue to be placed on integrating the Group’s risk management process with its sustainability strategy through consistent tracking and reporting of key risk indicators on areas such as green-house gas emissions, talent attrition, third party claims, non-compliance and stakeholder concerns with regards to the Group’s operations. While maintaining the robust Sustainability Performance Management Framework, the Group will also work to ensure that sustainability and risk management practices are further entrenched across its significant value chain partners through the implementation of responsible sourcing practices, where practical and relevant.
GOVERNANCE
Given global volatility and the dynamic world of corporate governance, the Group is well aware of the need to remain vigilant and geared through its level of preparedness and its capability in meeting external challenges. Concurrently, corporate disintegrations, the pursuit of continuous improvement in governance and a call for increased accountability and transparency continue to influence and shape selected governance aspects. The ensuing matters are the more significant focus areas and challenges, amongst many others, being recurrently addressed by JKH.
Ensuring a balance between Board diversity, skills and experience
Managing shareholder activism
Continual strengthening of Internal Controls
Digital oversight and cyber security
Data protection, information management and adoption
Board refreshment and independence
Greater employee involvement in governance
Refer Corporate Governance Commentary for further details - page 164
63
GROUP CONSOLIDATED REVIEWSTRATEGY, RESOURCE ALLOCATION AND PORTFOLIO MANAGEMENT
The Strategy, Resource Allocation and Portfolio Management section aims to provide detailed insights to the manner in which investment decisions of the Group are made by analysing the performance of the overall portfolio, the overall strategic direction of the Group and the means by which capital is allocated for investments.
In managing the Group’s portfolio, the Group places emphasis on identifying and pursuing growth prospects that would help achieve the Group’s vision of "Building businesses that are leaders in the region" and its medium to long-term objectives. In this light, businesses adopt a systematic approach to resource allocation and strategy formulation that is aligned with the core Values, overall direction and strategies of the Group.
It is pertinent to note, as evident from the past, that the Group strives to constantly align its portfolio of businesses with the growth sectors of the economy, both current and futuristic, and continuously endeavours to ensure that capital resources are efficiently employed in a manner that will expand the reach of the portfolio, ensure relevance, and give the ability to compete at the relevant levels, both locally and internationally.
To this end, the following are some key strategic initiatives pursued across Group businesses in furtherance of achieving its short, medium and long-term objectives.
Creation of sustainable value is at the forefront when making operational decisions. An aspect of Group-wide strategy focuses on driving growth and value that is consistent, competitive, profitable and responsible. In this regard, businesses place emphasis on maximising value by augmenting revenue channels, increasing market share and exploring opportunities by fostering a culture of disruptive innovation and digitisation.
Focus is placed on maintaining flexible cost structures to ensure optimisation of costs and thereby
profit maximisation. During the year under review, businesses underwent an additional planning cycle aimed at reducing costs, without hampering its long-term strategic plans, which were monitored on a periodic basis.
Given that brand development is essential in fostering customer loyalty, enhancing business image and establishing a more customer-centric identity, Group strategy also entails a plan to increase brand equity through a comprehensive understanding of its target market, value proposition, internal alignment to the brand promise and vision. During the year under review, as discussed in detail under Intellectual Capital, continued emphasis was placed on enhancing visibility of the Group brands, particularly the hotel’s "Cinnamon" brand, the Supermarket business’ "Keells" brand and the Insurance business’ "Union Assurance" brand.
Group strategy also revolves around recruiting, developing and retaining a talented pool of employees. Over the years, the Group has attracted the best and the brightest talent towards building a strong team that reflects the diversity of the customers we serve. The Group engages and encourages employees to perform to the best of their ability through a performance-oriented culture founded on ethical and transparent behaviour, which, in turn, promotes sustainable and profitable growth. In executing all plans and strategies of the business units, talent management is scrutinised closely and given significant prominence.
Another aspect of Group strategy focuses on re-engineering, process improvement, enterprise risk management and quality management in ensuring that business processes and governance checks across the Group are efficient, agile, robust and in line with international best practice. The Group’s digitisation drive aimed at identifying emerging and current disruptive business trends and developing the digital quotient (DQ) of individuals and businesses is also believed to increase the productivity and efficiency through the employment of digital technologies and disruptive business models.
Group strategy places significant emphasis on minimising environmental impacts through impact analysis and stakeholder engagement. Strategies are governed by a comprehensive environmental management system and Group-wide sustainability goals. All operational decisions factor the impact of the decision on the Group’s sustainability goals and ensure that all possible actions are being taken towards reducing waste and adverse environmental impacts.
Focus is also placed on developing life skills of communities and empowering them in overcoming social, economic and environmental challenges. The CSR initiatives of the Group are centrally planned and implemented by the John Keells Foundation.
Group businesses continue to adopt a "Steering Wheel" tool that measures progress on a series of internal business Promises that cater to the needs of the Customer, Community, People, Operations and Finance, which feeds into a multi-dimensional approach to strategy formulation.
Given the Holding Company’s diversified interests, resource allocation and portfolio management is imperative in creating value to all stakeholders through evaluation of the Group’s fundamentals which are centered on the forms of Capital. Whilst the Group is presented with opportunities in diverse industries, it continues to follow its four-step, structured methodology indicated in the ensuing section, in evaluating its portfolio and thereby guiding investment and divestment decisions.
MANAGEMENT DISCUSSION AND ANALYSIS
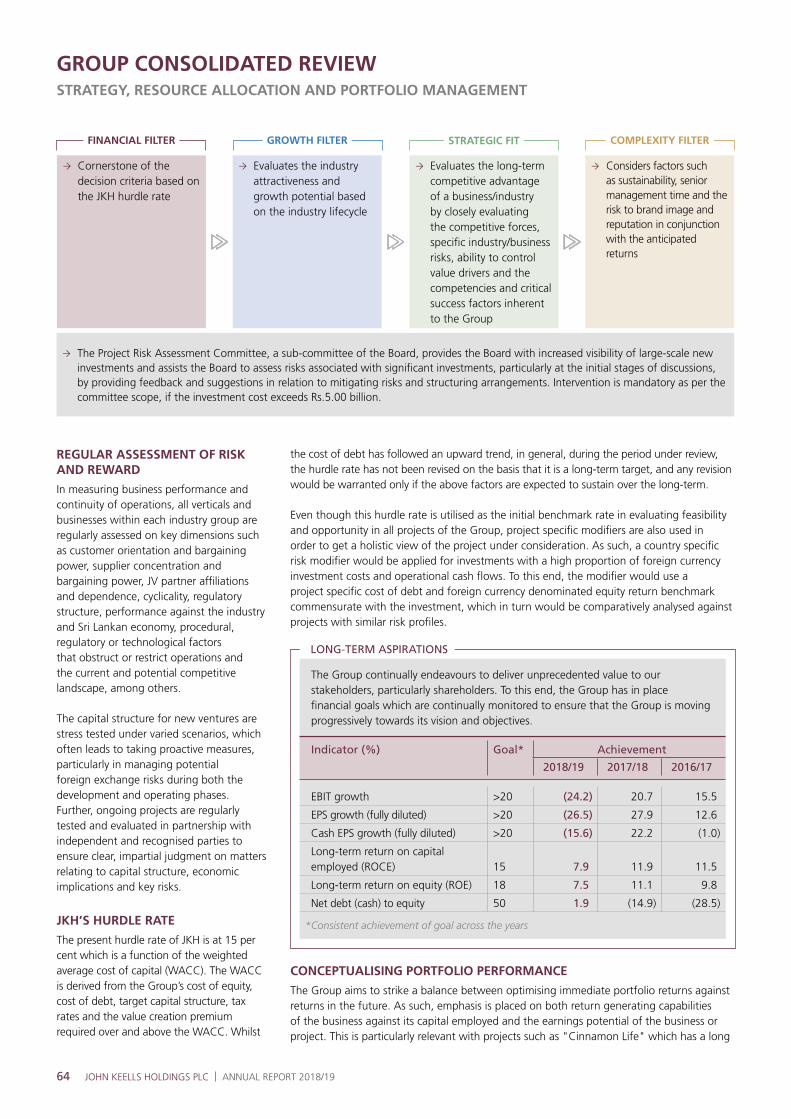
64 JOHN KEELLS HOLDINGS PLC | ANNUAL REPORT 2018/19
GROUP CONSOLIDATED REVIEWSTRATEGY, RESOURCE ALLOCATION AND PORTFOLIO MANAGEMENT
Cornerstone of the decision criteria based on the JKH hurdle rate
FINANCIAL FILTER
Evaluates the industry attractiveness and growth potential based on the industry lifecycle
GROWTH FILTER
Evaluates the long-term competitive advantage of a business/industry by closely evaluating the competitive forces, specific industry/business risks, ability to control value drivers and the competencies and critical success factors inherent to the Group
STRATEGIC FIT
Considers factors such as sustainability, senior management time and the risk to brand image and reputation in conjunction with the anticipated returns
The Project Risk Assessment Committee, a sub-committee of the Board, provides the Board with increased visibility of large-scale new investments and assists the Board to assess risks associated with significant investments, particularly at the initial stages of discussions, by providing feedback and suggestions in relation to mitigating risks and structuring arrangements. Intervention is mandatory as per the committee scope, if the investment cost exceeds Rs.5.00 billion.
COMPLEXITY FILTER
REGULAR ASSESSMENT OF RISK AND REWARD
In measuring business performance and continuity of operations, all verticals and businesses within each industry group are regularly assessed on key dimensions such as customer orientation and bargaining power, supplier concentration and bargaining power, JV partner affiliations and dependence, cyclicality, regulatory structure, performance against the industry and Sri Lankan economy, procedural, regulatory or technological factors that obstruct or restrict operations and the current and potential competitive landscape, among others.
The capital structure for new ventures are stress tested under varied scenarios, which often leads to taking proactive measures, particularly in managing potential foreign exchange risks during both the development and operating phases. Further, ongoing projects are regularly tested and evaluated in partnership with independent and recognised parties to ensure clear, impartial judgment on matters relating to capital structure, economic implications and key risks.
JKH’S HURDLE RATE
The present hurdle rate of JKH is at 15 per cent which is a function of the weighted average cost of capital (WACC). The WACC is derived from the Group’s cost of equity, cost of debt, target capital structure, tax rates and the value creation premium required over and above the WACC. Whilst
the cost of debt has followed an upward trend, in general, during the period under review, the hurdle rate has not been revised on the basis that it is a long-term target, and any revision would be warranted only if the above factors are expected to sustain over the long-term.
Even though this hurdle rate is utilised as the initial benchmark rate in evaluating feasibility and opportunity in all projects of the Group, project specific modifiers are also used in order to get a holistic view of the project under consideration. As such, a country specific risk modifier would be applied for investments with a high proportion of foreign currency investment costs and operational cash flows. To this end, the modifier would use a project specific cost of debt and foreign currency denominated equity return benchmark commensurate with the investment, which in turn would be comparatively analysed against projects with similar risk profiles.
CONCEPTUALISING PORTFOLIO PERFORMANCE
The Group aims to strike a balance between optimising immediate portfolio returns against returns in the future. As such, emphasis is placed on both return generating capabilities of the business against its capital employed and the earnings potential of the business or project. This is particularly relevant with projects such as "Cinnamon Life" which has a long
The Group continually endeavours to deliver unprecedented value to our stakeholders, particularly shareholders. To this end, the Group has in place financial goals which are continually monitored to ensure that the Group is moving progressively towards its vision and objectives.
Indicator (%) Goal* Achievement
2018/19 2017/18 2016/17
EBIT growth >20 (24.2) 20.7 15.5
EPS growth (fully diluted) >20 (26.5) 27.9 12.6
Cash EPS growth (fully diluted) >20 (15.6) 22.2 (1.0)
Long-term return on capital employed (ROCE) 15 7.9 11.9 11.5
Long-term return on equity (ROE) 18 7.5 11.1 9.8
Net debt (cash) to equity 50 1.9 (14.9) (28.5)
*Consistent achievement of goal across the years
LONG-TERM ASPIRATIONS

65
gestation period which impacts the short-term portfolio returns during the development phase of the project. The Group is conscious of the quantum of capital deployed to businesses, and to this end, places a strong emphasis on evaluating projects in a manner which optimises capital efficiency, especially in capital intensive businesses such as Leisure. In order to manage the effective quantum of capital deployed, the Group will continue to explore investment structuring options such as asset light investment models for future hotel projects and monetise the land bank of the Group in such a manner that generates a return from the strategic parcels of land held.
Being a portfolio of businesses, the Group has benefited from contributions from different businesses at varying points of time based on their growth cycle and correlation with overall economic growth in the country. Over the last few years, the Group has witnessed a shift in the composition of its earnings with a greater contribution from higher ROCE earning industry groups such as Consumer Foods, Retail, and Financial Services. The conscious and planned strategies of driving growth in these industry groups will, all things being equal, contribute towards an improvement in the ROCE for the Group, whilst concurrently driving absolute earnings growth.
An industry group and sector-wise breakdown of return on capital employed (ROCE) is as follows:
Industry Group/Sector 2018/19 2017/18
Capital Employed(Rs.million)
EffectiveCapital
Employed(Rs.million)
ROCE(%)
ROCE(%)
City Hotels 33,032 26,293 3.1 5.1Sri Lankan Resorts 15,642 12,449 6.3 5.7Maldivian Resorts 18,051 14,499 2.2 4.7Destination Management 1,197 1,182 28.3 34.7Hotel Management 372 372 53.2 96.3Transportation 22,434 21,719 20.9 18.5Consumer Foods 10,483 8,655 21.5 32.0Retail 12,512 10,620 13.2 37.5Financial Services 17,653 16,369 24.7 71.9Property (excl. Cinnamon Life) 35,053 33,018 0.9 7.1Cinnamon Life 64,224 62,021 (0.1) (0.1)Information Technology 1,268 1,268 14.8. 3.4Plantation Services 3,533 2,433 14.5 24.3Core-operational industry groups/sectors 235,454 210,898 7.2 12.9Holding Company, including Centre Functions* 49,417 49,410 11.1 9.2Group 284,871 260,308 7.9 11.9
*Primarily encompasses interest income, including exchange gains on US Dollar cash holdings, on the Holding Company’s cash and cash equivalents.
It is pertinent to note that the capital employed base of the Group is deployed in assets of various forms which generate returns based on the nature of the assets and risk profile. To this end, the ensuing is noted:
Cash and cash equivalents – The significant cash reserves of the Group, are earmarked for equity commitments of the "Cinnamon Life" project and other investments in the pipeline. The cash balance of the Group is currently generating returns below the Group’s hurdle rate, exerting pressure on Group ROCE. The Group is mindful of the need to optimise its cash holdings and strike a balance between having adequate resources to fund its pipeline of projects while ensuring returns are not negatively impacted. Considering the significant capital expenditure pipeline over the next 18 months, including "Cinnamon Life", and the possible uncertainty surrounding prospects for the economy post the Easter Sunday attacks, the Group will ensure adequate cash reserves are maintained, although this will be continuously assessed over the ensuing financial years. Group cash and cash equivalents stood at Rs.65.71 billion as at 31 March 2019, whilst Company cash and cash equivalents stood at Rs.45.96 billion.
Extensive land bank – The Group has an extensive land bank which are non-return generating assets at this juncture of time. In order to capitalise on opportunities arising in the real estate and property development industry, the Group will primarily focus on monetising its extensive land bank and will look to, if at all, expand its land bank very selectively as the Group is of the view that the existing land bank is adequate to sustain a pipeline of projects over the next 8-10 years. Any acquisitions which may be considered in future will mirror the planned infrastructure roll-out in the country, where land value appreciation is anticipated and monetising of the potential development is expected within a short time span so as not have a significant holding cost.
The Group is currently in the process of deploying a significant quantum of cash to fund the Group’s investment pipeline. Given the gestation period of these investments, the realisation of benefits from these are expected to accrue from beyond the next 12-18 months, particularly with completion of "Cinnamon Life".
Whilst it may be premature to assess the full impact arising from the Easter Sunday attacks, with the exception Leisure, the outlook for the other businesses is positive, where the core earnings from operations are expected to increase as the Group realises the benefits of many of the investments undertaken throughout the last two years.
The Group’s real estate portfolio will continue to exert some pressure on ROCE in the short-term, until such time these assets are monetised. The planned pipeline of projects over the next 2-3 years will ensure that some of these lands are utilised while generating returns, since revenue recognition can commence once the projects are launched.
INSIGHTS
MANAGEMENT DISCUSSION AND ANALYSIS

66 JOHN KEELLS HOLDINGS PLC | ANNUAL REPORT 2018/19
GROUP CONSOLIDATED REVIEWSTRATEGY, RESOURCE ALLOCATION AND PORTFOLIO MANAGEMENT
00%
10%
20%
30%
40%
50%
60%
10 20 30 40 50 60 70 80 90 100 110 120 130 140 150 160 170 180 190 200
ROCE (%)Hotel Management - 53.2
Destination Management - 28.3
Financial Services - 24.7
Consumer Foods - 21.5
Transportation - 20.9Information Technology - 14.8
Plantation Services - 14.5Retail - 13.2
Sri Lankan Resorts - 6.3City Hotels - 3.1
Maldivian Resorts - 2.2Property (excluding Cinnamon Life) - 0.9
Cinnamon Life - (0.1)
Average effective capital employeed (Rs.bn)
Hurdle Rate - 15.0
Transportation
ROCE(%)
= EBIT Margin
(%)
x AssetTurnover
x CapitalStructure Leverage
2018/19 20.9 = 12.9 x 1.46 x 1.11
2017/18 18.5 = 13.0 x 1.30 x 1.09
The ROCE of the Transportation industry group increased to 20.9 per cent from 18.5 per cent in 2017/18. The increase in ROCE, primarily driven by improved asset turnover, stemmed from the encouraging performance of the Group’s Ports and Shipping business, South Asia Gateway Terminals (SAGT), which handled a record 2 million twenty-foot equivalent units (TEUs) during the year under review.
Consumer Foods
ROCE(%)
= EBIT Margin
(%)
x AssetTurnover
x CapitalStructure Leverage
2018/19 21.5 = 13.3 x 1.13 x 1.43
2017/18 32.0 = 16.6 x 1.28 x 1.50
The Consumer Foods industry group recorded a decrease in ROCE to 21.5 per cent from 32.0 per cent in the previous year, mainly as a result of lower volumes in the Beverage business and an increase in the capital base arising from the completion of the new ice cream factory in Seethawaka in June 2018.
Retail
ROCE(%)
= EBIT Margin
(%)
x AssetTurnover
x CapitalStructure Leverage
2018/19 13.2 = 2.3 x 3.03 x 1.91
2017/18 37.5 = 4.1 x 3.72 x 2.46
The ROCE of the Retail industry group decreased to 13.2 per cent from 37.5 per cent in 2017/18 on the back of a significant increase in the capital base stemming from the opening of 18 new "Keells" outlets during the year and due to the investments carried out towards refitting the existing outlets to align with the rebranding initiatives of "Keells". The costs associated with the operating of the expected pipeline of new outlets is expected to exert pressure on ROCE in the short-term as margins tend to ramp-up within the first 12-24 months of operations. As such, the performance is expected to normalise in the medium-term as the performance of new outlets ramp-up to its potential. The performance was impacted by tougher trading conditions due to dampened consumer sentiment throughout most of the financial year and the disruption to operations due to the rebranding initiatives, all of which exerted pressure on margins, and therefore, ROCE. The Supermarket business’ investment in the state-of-the-art 335,000 square foot distribution centre (DC) to cater to the expansion of its outlet network and further enhance and improve operational processes, will exert pressure on ROCE in the short-term.
PERFORMANCE OF THE CORE-OPERATIONAL PORTFOLIO
The ensuing discussion is limited to the revenue generating entities of the Group, as this is more reflective of the Group’s performance, given its conglomerate setting.
Whilst the ensuing section details the high-level impacts to ROCE, for a detailed discussion on the impacts to EBIT and capital employed, as applicable, refer the Industry Group Review section - page 77
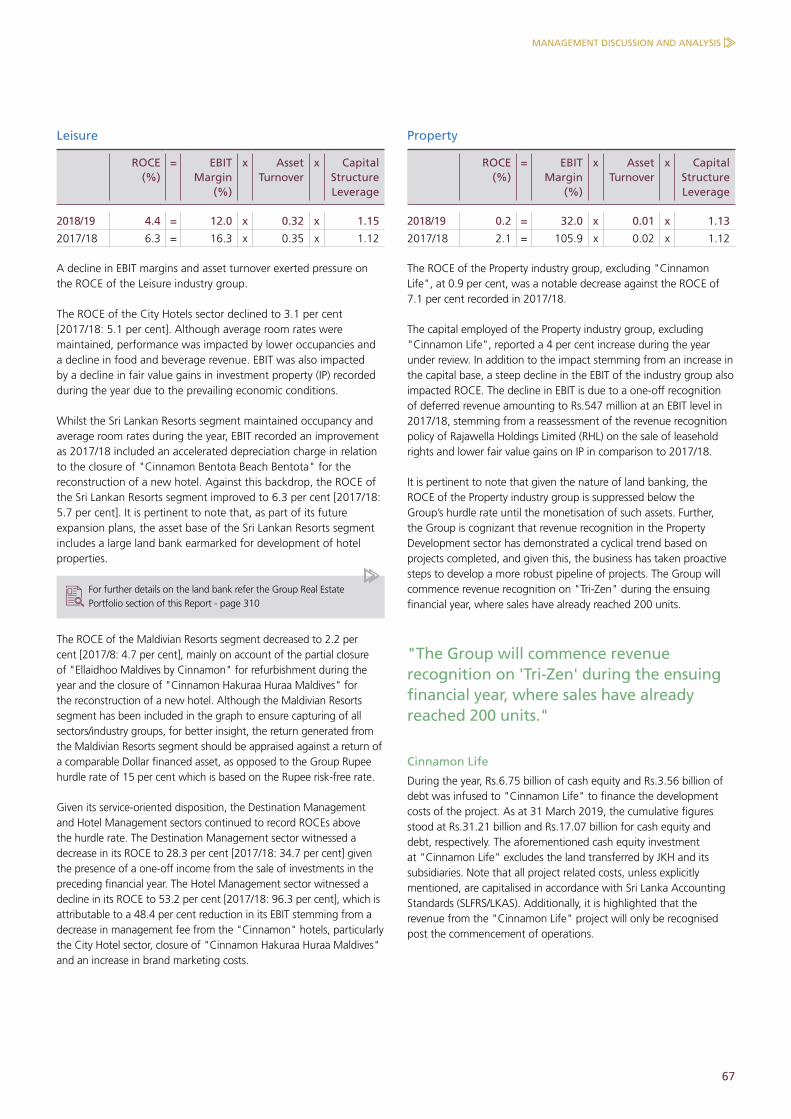
67
Leisure
ROCE(%)
= EBIT Margin
(%)
x AssetTurnover
x CapitalStructure Leverage
2018/19 4.4 = 12.0 x 0.32 x 1.15
2017/18 6.3 = 16.3 x 0.35 x 1.12
A decline in EBIT margins and asset turnover exerted pressure on the ROCE of the Leisure industry group.
The ROCE of the City Hotels sector declined to 3.1 per cent [2017/18: 5.1 per cent]. Although average room rates were maintained, performance was impacted by lower occupancies and a decline in food and beverage revenue. EBIT was also impacted by a decline in fair value gains in investment property (IP) recorded during the year due to the prevailing economic conditions.
Whilst the Sri Lankan Resorts segment maintained occupancy and average room rates during the year, EBIT recorded an improvement as 2017/18 included an accelerated depreciation charge in relation to the closure of "Cinnamon Bentota Beach Bentota" for the reconstruction of a new hotel. Against this backdrop, the ROCE of the Sri Lankan Resorts segment improved to 6.3 per cent [2017/18: 5.7 per cent]. It is pertinent to note that, as part of its future expansion plans, the asset base of the Sri Lankan Resorts segment includes a large land bank earmarked for development of hotel properties.
For further details on the land bank refer the Group Real Estate Portfolio section of this Report - page 310
The ROCE of the Maldivian Resorts segment decreased to 2.2 per cent [2017/8: 4.7 per cent], mainly on account of the partial closure of "Ellaidhoo Maldives by Cinnamon" for refurbishment during the year and the closure of "Cinnamon Hakuraa Huraa Maldives" for the reconstruction of a new hotel. Although the Maldivian Resorts segment has been included in the graph to ensure capturing of all sectors/industry groups, for better insight, the return generated from the Maldivian Resorts segment should be appraised against a return of a comparable Dollar financed asset, as opposed to the Group Rupee hurdle rate of 15 per cent which is based on the Rupee risk-free rate.
Given its service-oriented disposition, the Destination Management and Hotel Management sectors continued to record ROCEs above the hurdle rate. The Destination Management sector witnessed a decrease in its ROCE to 28.3 per cent [2017/18: 34.7 per cent] given the presence of a one-off income from the sale of investments in the preceding financial year. The Hotel Management sector witnessed a decline in its ROCE to 53.2 per cent [2017/18: 96.3 per cent], which is attributable to a 48.4 per cent reduction in its EBIT stemming from a decrease in management fee from the "Cinnamon" hotels, particularly the City Hotel sector, closure of "Cinnamon Hakuraa Huraa Maldives" and an increase in brand marketing costs.
Property
ROCE(%)
= EBIT Margin
(%)
x AssetTurnover
x CapitalStructure Leverage
2018/19 0.2 = 32.0 x 0.01 x 1.13
2017/18 2.1 = 105.9 x 0.02 x 1.12
The ROCE of the Property industry group, excluding "Cinnamon Life", at 0.9 per cent, was a notable decrease against the ROCE of 7.1 per cent recorded in 2017/18.
The capital employed of the Property industry group, excluding "Cinnamon Life", reported a 4 per cent increase during the year under review. In addition to the impact stemming from an increase in the capital base, a steep decline in the EBIT of the industry group also impacted ROCE. The decline in EBIT is due to a one-off recognition of deferred revenue amounting to Rs.547 million at an EBIT level in 2017/18, stemming from a reassessment of the revenue recognition policy of Rajawella Holdings Limited (RHL) on the sale of leasehold rights and lower fair value gains on IP in comparison to 2017/18.
It is pertinent to note that given the nature of land banking, the ROCE of the Property industry group is suppressed below the Group’s hurdle rate until the monetisation of such assets. Further, the Group is cognizant that revenue recognition in the Property Development sector has demonstrated a cyclical trend based on projects completed, and given this, the business has taken proactive steps to develop a more robust pipeline of projects. The Group will commence revenue recognition on "Tri-Zen" during the ensuing financial year, where sales have already reached 200 units.
"The Group will commence revenue recognition on 'Tri-Zen' during the ensuing financial year, where sales have already reached 200 units."
Cinnamon Life
During the year, Rs.6.75 billion of cash equity and Rs.3.56 billion of debt was infused to "Cinnamon Life" to finance the development costs of the project. As at 31 March 2019, the cumulative figures stood at Rs.31.21 billion and Rs.17.07 billion for cash equity and debt, respectively. The aforementioned cash equity investment at "Cinnamon Life" excludes the land transferred by JKH and its subsidiaries. Note that all project related costs, unless explicitly mentioned, are capitalised in accordance with Sri Lanka Accounting Standards (SLFRS/LKAS). Additionally, it is highlighted that the revenue from the "Cinnamon Life" project will only be recognised post the commencement of operations.
MANAGEMENT DISCUSSION AND ANALYSIS
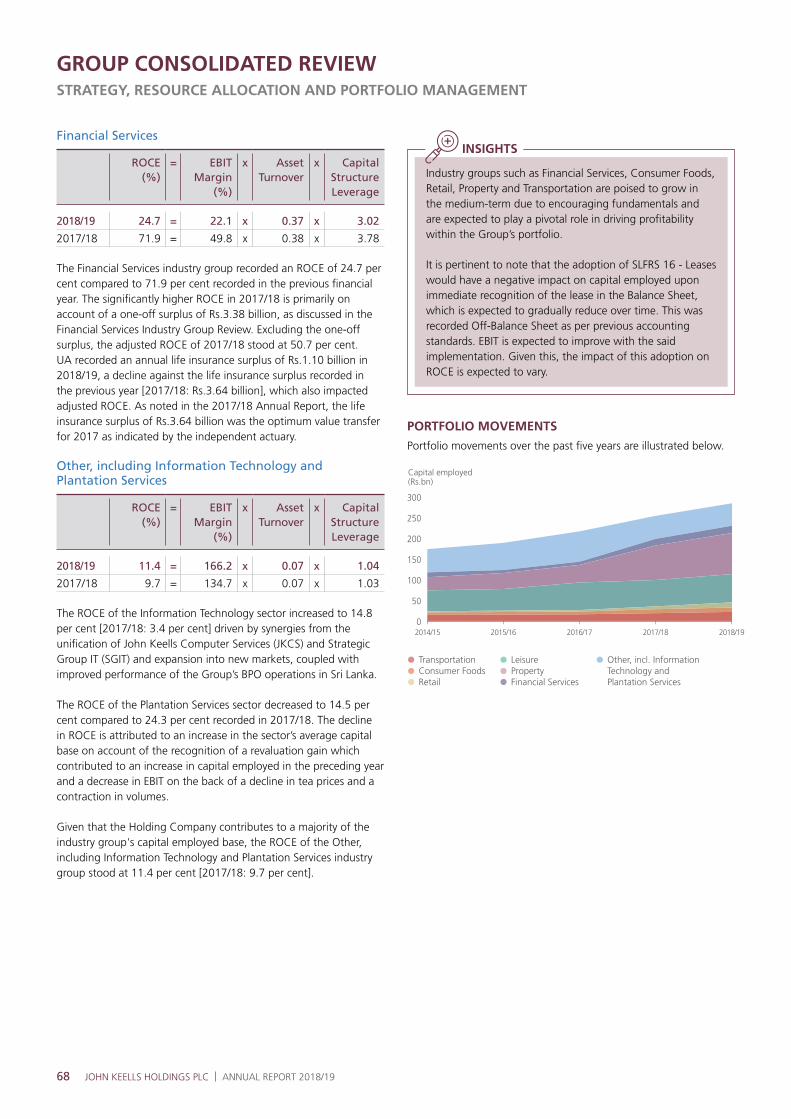
68 JOHN KEELLS HOLDINGS PLC | ANNUAL REPORT 2018/19
GROUP CONSOLIDATED REVIEWSTRATEGY, RESOURCE ALLOCATION AND PORTFOLIO MANAGEMENT
Financial Services
ROCE(%)
= EBIT Margin
(%)
x AssetTurnover
x CapitalStructure Leverage
2018/19 24.7 = 22.1 x 0.37 x 3.02
2017/18 71.9 = 49.8 x 0.38 x 3.78
The Financial Services industry group recorded an ROCE of 24.7 per cent compared to 71.9 per cent recorded in the previous financial year. The significantly higher ROCE in 2017/18 is primarily on account of a one-off surplus of Rs.3.38 billion, as discussed in the Financial Services Industry Group Review. Excluding the one-off surplus, the adjusted ROCE of 2017/18 stood at 50.7 per cent. UA recorded an annual life insurance surplus of Rs.1.10 billion in 2018/19, a decline against the life insurance surplus recorded in the previous year [2017/18: Rs.3.64 billion], which also impacted adjusted ROCE. As noted in the 2017/18 Annual Report, the life insurance surplus of Rs.3.64 billion was the optimum value transfer for 2017 as indicated by the independent actuary.
Other, including Information Technology and Plantation Services
ROCE(%)
= EBIT Margin
(%)
x AssetTurnover
x CapitalStructure Leverage
2018/19 11.4 = 166.2 x 0.07 x 1.04
2017/18 9.7 = 134.7 x 0.07 x 1.03
The ROCE of the Information Technology sector increased to 14.8 per cent [2017/18: 3.4 per cent] driven by synergies from the unification of John Keells Computer Services (JKCS) and Strategic Group IT (SGIT) and expansion into new markets, coupled with improved performance of the Group’s BPO operations in Sri Lanka.
The ROCE of the Plantation Services sector decreased to 14.5 per cent compared to 24.3 per cent recorded in 2017/18. The decline in ROCE is attributed to an increase in the sector’s average capital base on account of the recognition of a revaluation gain which contributed to an increase in capital employed in the preceding year and a decrease in EBIT on the back of a decline in tea prices and a contraction in volumes.
Given that the Holding Company contributes to a majority of the industry group's capital employed base, the ROCE of the Other, including Information Technology and Plantation Services industry group stood at 11.4 per cent [2017/18: 9.7 per cent].
2014/15 2015/16 2016/17 2017/18 2018/190
50
100
150
200
250
300
TransportationConsumer FoodsRetail
LeisurePropertyFinancial Services
Other, incl. InformationTechnology andPlantation Services
Capital employed(Rs.bn)
Industry groups such as Financial Services, Consumer Foods, Retail, Property and Transportation are poised to grow in the medium-term due to encouraging fundamentals and are expected to play a pivotal role in driving profitability within the Group’s portfolio.
It is pertinent to note that the adoption of SLFRS 16 - Leases would have a negative impact on capital employed upon immediate recognition of the lease in the Balance Sheet, which is expected to gradually reduce over time. This was recorded Off-Balance Sheet as per previous accounting standards. EBIT is expected to improve with the said implementation. Given this, the impact of this adoption on ROCE is expected to vary.
INSIGHTS
PORTFOLIO MOVEMENTS
Portfolio movements over the past five years are illustrated below.
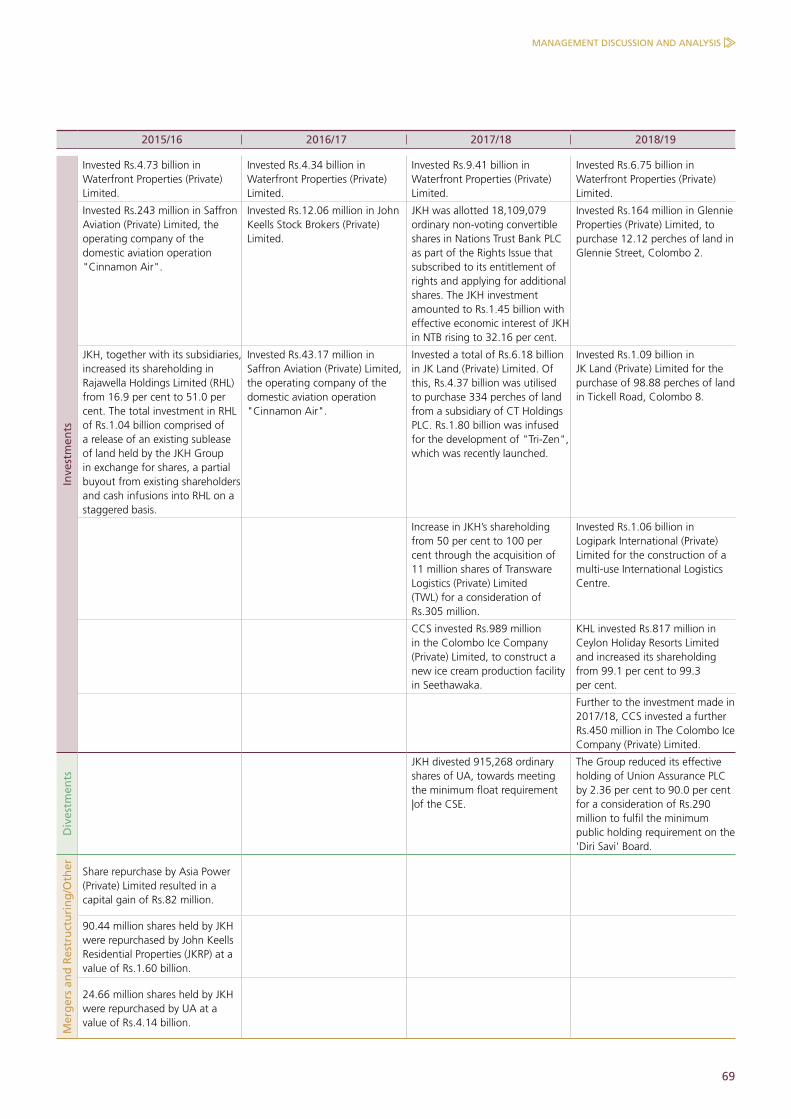
69
2015/16 2016/17 2017/18 2018/19
Inve
stm
ents
Invested Rs.4.73 billion in Waterfront Properties (Private) Limited.
Invested Rs.4.34 billion in Waterfront Properties (Private) Limited.
Invested Rs.9.41 billion in Waterfront Properties (Private) Limited.
Invested Rs.6.75 billion in Waterfront Properties (Private) Limited.
Invested Rs.243 million in Saffron Aviation (Private) Limited, the operating company of the domestic aviation operation "Cinnamon Air".
Invested Rs.12.06 million in John Keells Stock Brokers (Private) Limited.
JKH was allotted 18,109,079 ordinary non-voting convertible shares in Nations Trust Bank PLC as part of the Rights Issue that subscribed to its entitlement of rights and applying for additional shares. The JKH investment amounted to Rs.1.45 billion with effective economic interest of JKH in NTB rising to 32.16 per cent.
Invested Rs.164 million in Glennie Properties (Private) Limited, to purchase 12.12 perches of land in Glennie Street, Colombo 2.
JKH, together with its subsidiaries, increased its shareholding in Rajawella Holdings Limited (RHL) from 16.9 per cent to 51.0 per cent. The total investment in RHL of Rs.1.04 billion comprised of a release of an existing sublease of land held by the JKH Group in exchange for shares, a partial buyout from existing shareholders and cash infusions into RHL on a staggered basis.
Invested Rs.43.17 million in Saffron Aviation (Private) Limited, the operating company of the domestic aviation operation "Cinnamon Air".
Invested a total of Rs.6.18 billion in JK Land (Private) Limited. Of this, Rs.4.37 billion was utilised to purchase 334 perches of land from a subsidiary of CT Holdings PLC. Rs.1.80 billion was infused for the development of "Tri-Zen", which was recently launched.
Invested Rs.1.09 billion in JK Land (Private) Limited for the purchase of 98.88 perches of land in Tickell Road, Colombo 8.
Increase in JKH’s shareholding from 50 per cent to 100 per cent through the acquisition of 11 million shares of Transware Logistics (Private) Limited (TWL) for a consideration of Rs.305 million.
Invested Rs.1.06 billion in Logipark International (Private) Limited for the construction of a multi-use International Logistics Centre.
CCS invested Rs.989 million in the Colombo Ice Company (Private) Limited, to construct a new ice cream production facility in Seethawaka.
KHL invested Rs.817 million in Ceylon Holiday Resorts Limited and increased its shareholding from 99.1 per cent to 99.3 per cent.
Further to the investment made in 2017/18, CCS invested a further Rs.450 million in The Colombo Ice Company (Private) Limited.
Div
estm
ents
JKH divested 915,268 ordinary shares of UA, towards meeting the minimum float requirement |of the CSE.
The Group reduced its effective holding of Union Assurance PLC by 2.36 per cent to 90.0 per cent for a consideration of Rs.290 million to fulfil the minimum public holding requirement on the 'Diri Savi' Board.
Mer
ger
s an
d R
estr
uct
uri
ng
/Oth
er Share repurchase by Asia Power (Private) Limited resulted in a capital gain of Rs.82 million.
90.44 million shares held by JKH were repurchased by John Keells Residential Properties (JKRP) at a value of Rs.1.60 billion.
24.66 million shares held by JKH were repurchased by UA at a value of Rs.4.14 billion.
MANAGEMENT DISCUSSION AND ANALYSIS

70 JOHN KEELLS HOLDINGS PLC | ANNUAL REPORT 2018/19
GROUP CONSOLIDATED REVIEWSHARE INFORMATION
The following is an overview of the market conditions which prevailed during the year under review, both globally and locally. The section concludes with a discussion on JKH share-related information.
GLOBAL AND LOCAL MARKET REVIEW
The 2018 calendar year was characterised by volatility with most global market indices recording weak performances. Gains in the first three quarters of CY2018, as measured by the MSCI World Index, were negated by the fourth quarter of CY2018, when global stocks fell by over 12 per cent. The losses were due to a confluence of factors, including trade tensions between the US and China, uncertainty surrounding Brexit and signs that the US Federal Reserve will continue to hike interest rates, at the time, with potential dampening effects on stock markets. Against this uncertain environment, widespread nervous sentiment hindered US, London and European indices. A strong US Dollar coupled with pressures stemming from the US Federal Reserve’s unprecedented interest rate hiking cycle also resulted in a pronounced sell-off in emerging economies, with a flight of funds from riskier economies. Within Asia, China was the most affected, particularly given its trade outlook and rising debt levels. Financial markets displayed an uptick in the first quarter of CY2019, owing to stabilising growth in China, signs of easing trade tension between China and the US at the time, and dovish statements by the Federal Reserve.
Both the All Share Price Index (ASPI) and the Standard and Poor’s Sri Lanka 20 (S&P SL20) Index of the Colombo Stock Exchange (CSE) declined, vis-à-vis the gains recorded in CY2017, as evident from the ensuing table. The downturn was on the back of high interest rates, inconsistency in policy and global economic factors, as described above, which dampened investor sentiment. The political environment from late October 2018 onwards resulted in uncertainty in the country, thereby undermining investor confidence and raising risk premia at the time. This, coupled with a strengthening Dollar, led to significant foreign outflows during the second half of the year. Total net foreign outflows were recorded at Rs.23.25 billion during the year. A decline in investor participation led to the average daily turnover declining by 9 per cent in CY2018 to Rs.834 million [CY2017: Rs.915 million]. Market PER decreased to 9.7 times as at December 2018 [CY2017: 10.6 times].
Refer the Group Consolidated Review and Sri Lankan Economy sections of the Report for a detailed discussion of the local economy.
Indices
Value %
31 March 2019
31 March 2018
MSCI
All Country World Index 508.55 505.81 1
All Country World Index excluding USA 279.79 300.29 (7)
World (23 Developed markets) 2,107.74 2,066.85 2
USA 2,701.54 2,516.93 7
Europe 1,635.23 1,750.54 (7)
Europe, Australasia and Far East 1,875.43 2,005.67 (7)
Emerging markets 1,058.13 1,170.88 (10)
Frontier markets 548.19 665.42 (18)
Peer
SENSEX 38,672.91 32,968.68 17
JKSE 6,485.96 6,188.99 5
STI 3,212.88 3,427.97 (6)
KLSE 1,643.63 1,863.46 (12)
Local
ASPI 5,557.24 6,476.78 (14)
S&P SL20 2,738.95 3,650.10 (25)
Key Market Indicators
2018/19 2017/18 %
Overall CSE market capitalisation (Rs.billion) 2,605.90 3,032.71 (14)
Net foreign inflows/(outflows) (Rs.billion) (26.27) 10.80 (141)
Average daily turnover (Rs.million) 697 1,036 49
Amount raised through debentures (Rs.billion) 23.95 19.50 (19)
Number of IPOs - 5 N/A
Amount raised through IPOs (Rs.million) - 19,843 N/A
Total number of shares in issue as at 31/03/2019 1,318,173,279
Public shareholding as 31/03/2019 99.16%
Stock symbol JKH.N0000
Newswire Codes of the JKH Share
Bloomberg JKH.SL
Dow Jones JKHN.LK
Reuters JKEHY.PK
Global Depositary Receipts (GDR) balance 1,320,942

71
JKH SHARE
Post adjustment for the share repurchase, which was negligible, the JKH share declined by 2.3 per cent to Rs.156.00 as at 31 March 2019 from Rs.159.64 on 31 March 2018. The performance of the JKH share remained largely correlated with movements of the ASPI, as exhibited in the graph adjacent, whilst exceeding the performance of the ASPI from October 2018 onwards.
0
500
100
150
200
250
JKH Share Performance vs ASPI (Indexed)JKH Share Performance vs ASPI (Indexed)IndexIndex No. of shares (mn)No. of shares (mn)
Mar-18
JKH shares traded
Jun-18May-18Apr-18 Jul-18 Aug-18 Sep-18 Oct-18 Nov-18 Jan-19 Feb-19 Mar-19
ASPI (indexed) JKH (indexed)
0
20
40
60
80
100
120
100
125
150
175
200
JKH High/Low Share Prices per MonthJKH High/Low Share Prices per MonthNo. of shares (mn)No. of shares (mn)
Apr-18
High
Jul-18Jun-18May-18 Aug-18 Sep-18 Oct-18 Nov-18 Dec-18 Feb-19 Mar-19
Low JKH 30 day moving average
Market Information of the Ordinary Shares of the Company
2018/19 Q4 Q3 Q2 Q1 2017/18
High (Rs.) 164.80 159.60 161.90 149.80 164.80 180.00
Low (Rs.) 126.00 148.30 126.00 127.00 135.00 138.00
Close (Rs.) 156.00 156.00 159.70 131.50 147.50 159.60
Dividends paid per share (Rs.) 6.00 2.00 2.00 - 2.00 6.00
Trading Statistics
Number of transactions 24,782 2,877 8,799 8,387 4,719 25,302
Number of shares traded ('000) 341,191 72,717 150,292 63,037 55,145 260,088
Value of all shares traded (Rs.million) 50,630 11,264 22,141 8,676 8,549 42,049
Average daily turnover (Rs.million) 211 194 363 140 145 177
Percentage of total market turnover (%) 30 30 37 27 22 17
Market capitalisation (Rs.million) 205,635 205,635 221,588 182,460 204,660 221,450
Percentage of total market capitalisation (%) 7.9 7.9 7.8 6.6 7.1 7.3
The beta of the JKH share as of 31 March 2019 stood at 1.44. The beta is calculated on the daily JKH share movements against movements of the ASPI for the five-year period commencing 1 April 2014 to 31 March 2019. The compounded annual growth rate (CAGR) of the JKH share over the 5-year period stood at a negative 2.1 per cent, compared to that of the market which stood at a negative 1.4 per cent for the same period.
ISSUED SHARE CAPITAL
The number of shares in issue of the Company decreased to 1,318,173,279 as at 31 March 2019 from 1,387,528,658 as at 31 March 2018 as result of the share repurchase carried out during the financial year as discussed in the ensuing section. The Global Depository Receipts (GDRs) balance in ordinary share equivalent remained at 1,320,942.
SHARE REPURCHASE
On 12 November 2018, the Company announced an offer to repurchase a maximum of 69,376,433 of its ordinary shares, at a price of Rs.160.00 per share, on a pro rata basis of 1 share for every 20 shares held (5 per cent of the total number of shares issued by the Company as at the date).
The Offer concluded in January 2019 with the acceptance of 46 per cent of the offer (32,189,118 ordinary shares), and the balance (37,187,315 ordinary shares) being accepted proportionately based on applications for additional shares to be repurchased. Accordingly, a total of Rs.11.10 billion was paid in January 2019.
DIVIDEND
The Company’s dividend policy seeks to ensure a dividend payout that corresponds with growth in profits, whilst ensuring that the Company maintains adequate funds to support its investment pipeline and optimise its capital structure, thus ensuring the creation of sustainable shareholder wealth in the short, medium and long-term.
MANAGEMENT DISCUSSION AND ANALYSIS

72 JOHN KEELLS HOLDINGS PLC | ANNUAL REPORT 2018/19
0
2
4
6
8
10
(Rs.bn)(Rs.bn) (%)(%)
2014/15
8.3 8.27.38.03.5
40
54
4547
34
2015/16 2016/17 2017/18 2018/19
Distributions to Shareholders andPayout RatioDistributions to Shareholders andPayout Ratio
Dividend paid Dividend payout
0
10
20
30
40
50
60
It is pertinent to note that, the share repurchase, as discussed, effectively amounted to a distribution of Rs.8.00 per share. The Company declared a dividend per share of Rs.5.00 for the financial year 2018/19, compared to the Rs.6.00 per share declared for the financial year 2017/18, taking into consideration the distribution on account of the repurchase.
The total dividend paid for the financial year was Rs.8.19 billion [2017/18: Rs.8.32 billion]. The Group payout ratio was at 54 per cent during the year in comparison to the payout ratio of 40 per cent in 2017/18.
The total distribution for 2018/19, including the share repurchase, collectively amounts to Rs.13.00 per share, amounting to a total outlay of Rs.17.83 billion, which corresponds to a Group payout ratio of 117 per cent.
EARNINGS PER SHARE
The fully diluted earnings per share (EPS) for the financial year decreased by 27 per cent to Rs.11.13 per share [2017/18: Rs.15.15] due to a decrease in total profit attributable to equity holders. On a recurring earnings basis, the diluted EPS decreased to Rs.9.98 in the current financial year from Rs.13.25 recorded in the previous financial year, thus representing a decrease of 25 per cent.
The items affecting profitability are discussed, in depth, in the Group Consolidated Review and Industry Group Review sections of this Report.
GROUP CONSOLIDATED REVIEWSHARE INFORMATION
TOTAL SHAREHOLDER RETURN
The total shareholder return (TSR) of the JKH share stood at 1.5 per cent for the period under review. Inclusive of the share repurchase, TSR for 2018/19 stood at 6.5 per cent with JKH outperforming the market, where the total return index of the S&P SL 20 recorded a negative return of 22.1 per cent. On a cumulative basis, over a five-year holding period, the share inclusive of dividends and warrants issued, posted an annualised total return of 0.6 per cent.
-25
-20
-15
-10
-5
0
5
10
15
20
(%)(%)
2014/15
19.7
1.5
(15.0)
(22.7)
(12.0)
1.7 3.3
10.0
(12.2)
2015/16 2016/17 2017/18 2018/19
Annual TSR Cumulative TSR
Total Shareholder Return Total Shareholder Return
Note: Includes the proportionate impact arising from the ownership of Warrants
Price to Earnings Ratio
Index 2018/19 2017/18
JKH 14.0 10.5CSE 8.7 11.4SENSEX 28.9 23.2KLSE 20.4 16.9JCI 20.9 22.1STI 13.9 11.1
The enterprise value of the Group increased by 12 per cent to Rs.210.02 billion as at 31 March 2019 [2017/18: Rs.187.93 billion].
As at 31 March 2019, JKH had a float adjusted market capitalisation of Rs.203.91 billion and 11,026 public shareholders. Thus, the Company is compliant under option 1 of the minimum threshold requirements for the Main Board of the CSE, as per the directive issued in terms of section 13 (c) and 13 (cc) of the Securities and Exchange Commission of Sri Lanka Act No.36 of 1987, circulated on 16 November 2016.
0
50
100
150
200
250
(Rs.bn)(Rs.bn)
2014/1519
915
5 176
124
191
136
221
188 20
621
0
2015/16 2016/17 2017/18 2018/19
Market Capitalisation and EnterpriseValueMarket Capitalisation and EnterpriseValue
Market capitalisation Enterprise value
MARKET CAPITALISATION AND ENTERPRISE VALUE
The market capitalisation of the Company decreased by 7 per cent to Rs.205.64 billion as at 31 March 2019 [2017/18: Rs.221.45 billion]. At the financial year end, JKH represented 7.9 per cent of the total market capitalisation of the CSE [2017/18: 7.3 per cent].
Summary Indicators
2018/19 2017/18 2016/17
Market capitalisation (Rs.billion) 205.6 221.4 191.3
Enterprise value (Rs.billion) 210.0 187.9 136.0
EV/EBITDA (times) 8.1 5.8 5.0
Diluted EPS (Rs.) 11.1 15.2 11.8
PER (diluted) 14.0 10.5 11.6
Price to book (times) 1.0 1.0 1.0
Price/cash earnings (times) 10.88 9.3 9.9
Dividend yield (%) 3.8 3.8 4.0
Group dividend payout ratio (%) 53.7 39.6 44.7
Net assets per share (Rs.) 155.0 151.7 135.5
TSR (%) 1.5 19.7 10.0
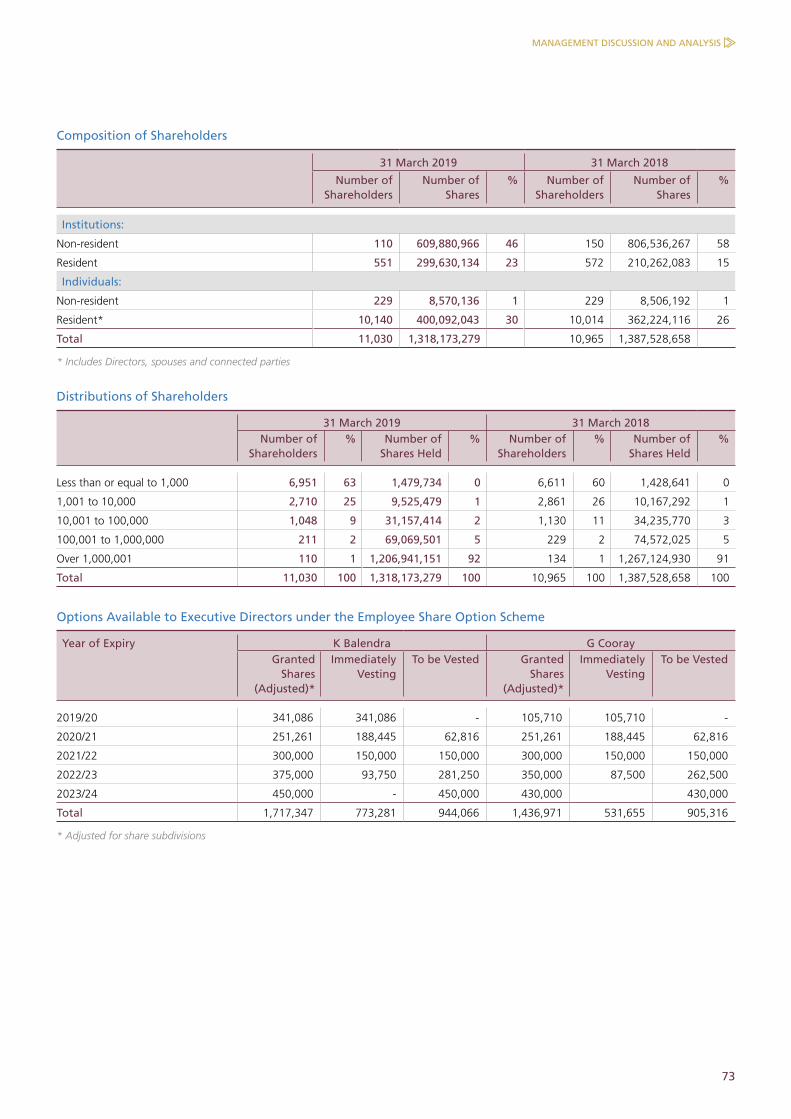
73
Composition of Shareholders
31 March 2019 31 March 2018
Number of Shareholders
Number of Shares
% Number of Shareholders
Number of Shares
%
Institutions:
Non-resident 110 609,880,966 46 150 806,536,267 58
Resident 551 299,630,134 23 572 210,262,083 15
Individuals:
Non-resident 229 8,570,136 1 229 8,506,192 1
Resident* 10,140 400,092,043 30 10,014 362,224,116 26
Total 11,030 1,318,173,279 10,965 1,387,528,658
* Includes Directors, spouses and connected parties
Distributions of Shareholders
31 March 2019 31 March 2018Number of
Shareholders% Number of
Shares Held% Number of
Shareholders% Number of
Shares Held%
Less than or equal to 1,000 6,951 63 1,479,734 0 6,611 60 1,428,641 0
1,001 to 10,000 2,710 25 9,525,479 1 2,861 26 10,167,292 1
10,001 to 100,000 1,048 9 31,157,414 2 1,130 11 34,235,770 3
100,001 to 1,000,000 211 2 69,069,501 5 229 2 74,572,025 5
Over 1,000,001 110 1 1,206,941,151 92 134 1 1,267,124,930 91
Total 11,030 100 1,318,173,279 100 10,965 100 1,387,528,658 100
Options Available to Executive Directors under the Employee Share Option Scheme
Year of Expiry K Balendra G CoorayGranted
Shares (Adjusted)*
Immediately Vesting
To be Vested Granted Shares
(Adjusted)*
Immediately Vesting
To be Vested
2019/20 341,086 341,086 - 105,710 105,710 -
2020/21 251,261 188,445 62,816 251,261 188,445 62,816
2021/22 300,000 150,000 150,000 300,000 150,000 150,000
2022/23 375,000 93,750 281,250 350,000 87,500 262,500
2023/24 450,000 - 450,000 430,000 430,000
Total 1,717,347 773,281 944,066 1,436,971 531,655 905,316
* Adjusted for share subdivisions
MANAGEMENT DISCUSSION AND ANALYSIS
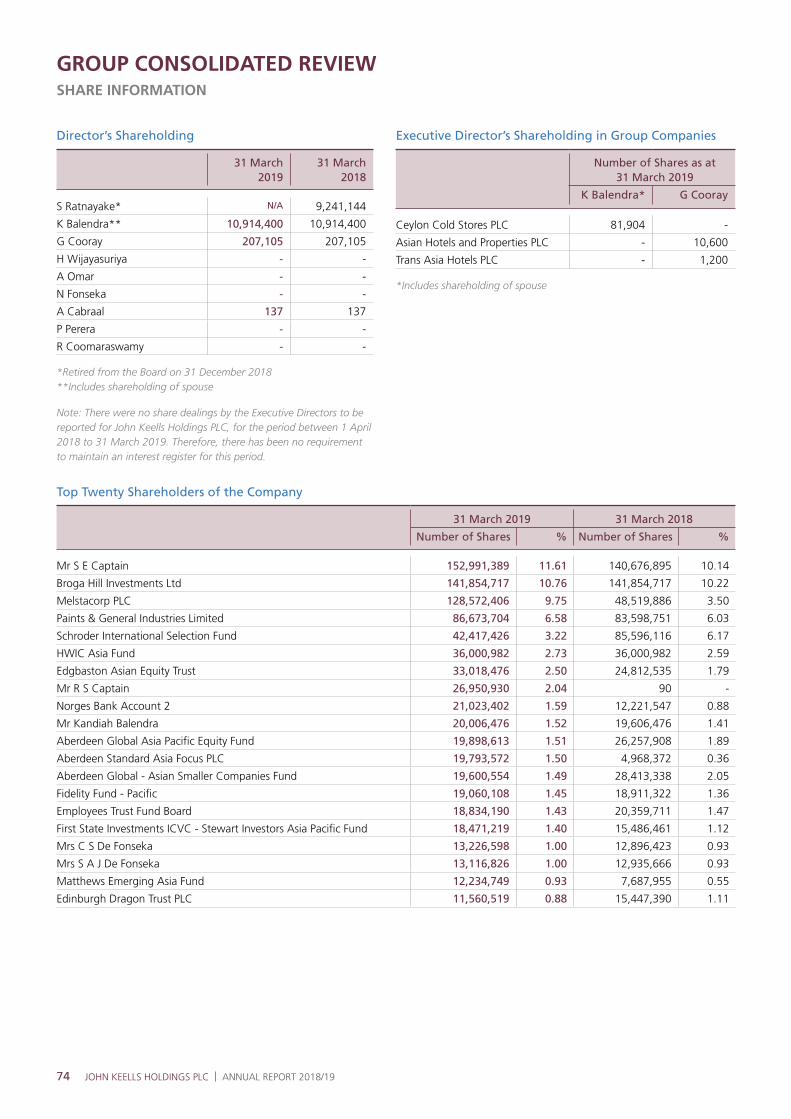
74 JOHN KEELLS HOLDINGS PLC | ANNUAL REPORT 2018/19
GROUP CONSOLIDATED REVIEWSHARE INFORMATION
Director’s Shareholding
31 March2019
31 March2018
S Ratnayake* N/A 9,241,144
K Balendra** 10,914,400 10,914,400
G Cooray 207,105 207,105
H Wijayasuriya - -
A Omar - -
N Fonseka - -
A Cabraal 137 137
P Perera - -
R Coomaraswamy - -
*Retired from the Board on 31 December 2018**Includes shareholding of spouse
Note: There were no share dealings by the Executive Directors to be reported for John Keells Holdings PLC, for the period between 1 April 2018 to 31 March 2019. Therefore, there has been no requirement to maintain an interest register for this period.
Executive Director’s Shareholding in Group Companies
Number of Shares as at 31 March 2019
K Balendra* G Cooray
Ceylon Cold Stores PLC 81,904 -
Asian Hotels and Properties PLC - 10,600
Trans Asia Hotels PLC - 1,200
*Includes shareholding of spouse
Top Twenty Shareholders of the Company
31 March 2019 31 March 2018
Number of Shares % Number of Shares %
Mr S E Captain 152,991,389 11.61 140,676,895 10.14
Broga Hill Investments Ltd 141,854,717 10.76 141,854,717 10.22
Melstacorp PLC 128,572,406 9.75 48,519,886 3.50
Paints & General Industries Limited 86,673,704 6.58 83,598,751 6.03
Schroder International Selection Fund 42,417,426 3.22 85,596,116 6.17
HWIC Asia Fund 36,000,982 2.73 36,000,982 2.59
Edgbaston Asian Equity Trust 33,018,476 2.50 24,812,535 1.79
Mr R S Captain 26,950,930 2.04 90 -
Norges Bank Account 2 21,023,402 1.59 12,221,547 0.88
Mr Kandiah Balendra 20,006,476 1.52 19,606,476 1.41
Aberdeen Global Asia Pacific Equity Fund 19,898,613 1.51 26,257,908 1.89
Aberdeen Standard Asia Focus PLC 19,793,572 1.50 4,968,372 0.36
Aberdeen Global - Asian Smaller Companies Fund 19,600,554 1.49 28,413,338 2.05
Fidelity Fund - Pacific 19,060,108 1.45 18,911,322 1.36
Employees Trust Fund Board 18,834,190 1.43 20,359,711 1.47
First State Investments ICVC - Stewart Investors Asia Pacific Fund 18,471,219 1.40 15,486,461 1.12
Mrs C S De Fonseka 13,226,598 1.00 12,896,423 0.93
Mrs S A J De Fonseka 13,116,826 1.00 12,935,666 0.93
Matthews Emerging Asia Fund 12,234,749 0.93 7,687,955 0.55
Edinburgh Dragon Trust PLC 11,560,519 0.88 15,447,390 1.11
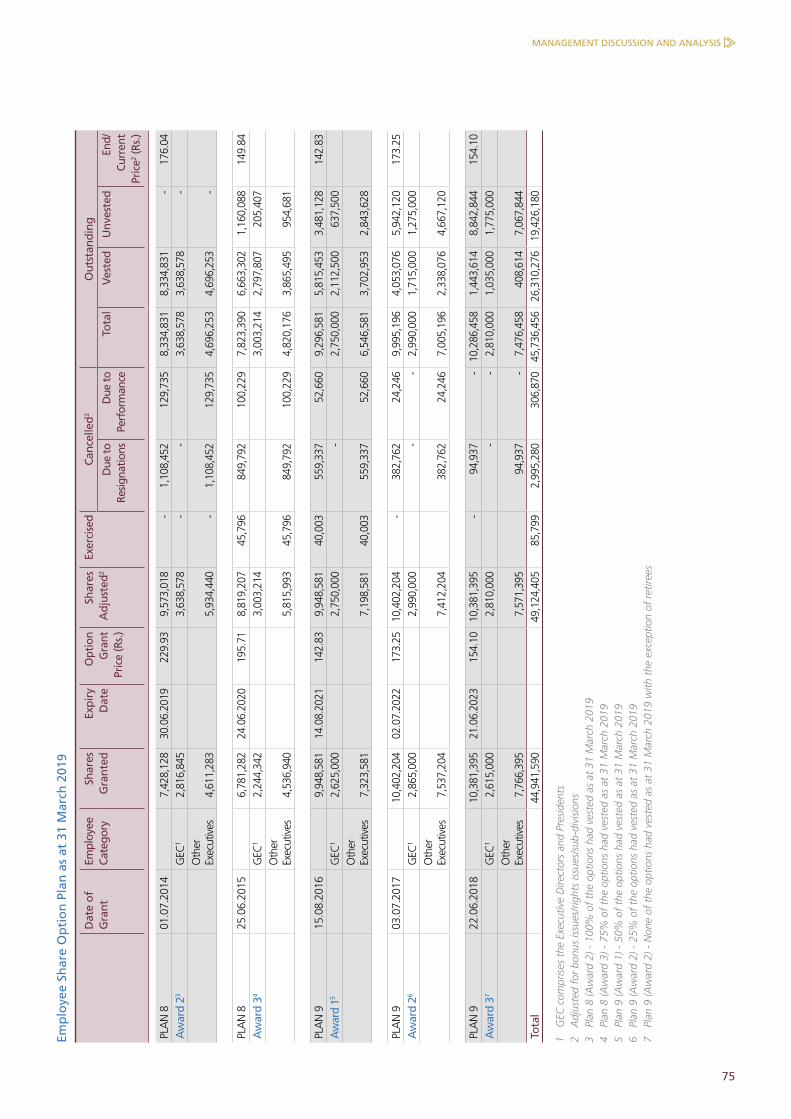
75
Emp
loye
e Sh
are
Op
tio
n P
lan
as
at 3
1 M
arch
201
9
Dat
e of
G
rant
Empl
oyee
Ca
tego
rySh
ares
G
rant
edEx
piry
D
ate
Opt
ion
Gra
nt
Pric
e (R
s.)
Shar
es
Adj
uste
d2
Exer
cise
dCa
ncel
led2
Out
stan
ding
Due
to
Resig
natio
nsD
ue to
Pe
rfor
man
ceTo
tal
Ves
ted
Unv
este
dEn
d/Cu
rren
tPr
ice2 (
Rs.)
PLA
N 8
01.0
7.20
14
7,42
8,12
830
.06.
2019
229
.93
9,57
3,01
8 -
1,10
8,45
212
9,73
58,
334,
831
8,33
4,83
1-
176
.04
Aw
ard
23
GEC
12,
816,
845
3,63
8,57
8 -
- 3,
638,
578
3,63
8,57
8-
O
ther
Ex
ecut
ives
4,61
1,28
3
5,
934,
440
- 1,
108,
452
129,
735
4,69
6,25
34,
696,
253
-
PLA
N 8
25.0
6.20
156,
781,
282
24.0
6.20
20 1
95.7
1 8,
819,
207
45,7
9684
9,79
210
0,22
97,
823,
390
6,66
3,30
21,
160,
088
149
.84
Aw
ard
34G
EC1
2,24
4,34
23,
003,
214
3,00
3,21
42,
797,
807
205,
407
Oth
er
Exec
utiv
es4,
536,
940
5,81
5,99
345
,796
849,
792
100,
229
4,82
0,17
63,
865,
495
954,
681
PLA
N 9
15.0
8.20
169,
948,
581
14.0
8.20
2114
2.83
9,94
8,58
140
,003
559,
337
52,6
609,
296,
581
5,81
5,45
33,
481,
128
142.
83A
war
d 15
GEC
12,
625,
000
2,75
0,00
0-
2,75
0,00
02,
112,
500
637,
500
Oth
er
Exec
utiv
es7,
323,
581
7,19
8,58
140
,003
559,
337
52,6
606,
546,
581
3,70
2,95
32,
843,
628
PLA
N 9
03.0
7.20
1710
,402
,204
02.0
7.20
2217
3.25
10,4
02,2
04-
382,
762
24,2
469,
995,
196
4,05
3,07
65,
942,
120
173.
25A
war
d 26
GEC
12,
865,
000
2,99
0,00
0-
-2,
990,
000
1,71
5,00
01,
275,
000
Oth
er
Exec
utiv
es7,
537,
204
7,41
2,20
438
2,76
224
,246
7,00
5,19
62,
338,
076
4,66
7,12
0
PLA
N 9
22.0
6.20
1810
,381
,395
21.0
6.20
23 1
54.1
0 10
,381
,395
-94
,937
-10
,286
,458
1,44
3,61
48,
842,
844
154
.10
Aw
ard
37G
EC1
2,61
5,00
02,
810,
000
--
2,81
0,00
01,
035,
000
1,77
5,00
0O
ther
Ex
ecut
ives
7,76
6,39
57,
571,
395
94,9
37-
7,47
6,45
840
8,61
47,
067,
844
Tota
l44
,941
,590
49,1
24,4
0585
,799
2,99
5,28
030
6,87
045
,736
,456
26,3
10,2
7619
,426
,180
1 G
EC c
ompr
ises
the
Exe
cutiv
e D
irect
ors
and
Pres
iden
ts2
Adj
uste
d fo
r bo
nus
issu
es/r
ight
s is
sues
/sub
-div
isio
ns3
Pla
n 8
(Aw
ard
2) -
100
% o
f th
e op
tions
had
ves
ted
as a
t 31
Mar
ch 2
019
4 P
lan
8 (A
war
d 3)
- 7
5% o
f th
e op
tions
had
ves
ted
as a
t 31
Mar
ch 2
019
5 P
lan
9 (A
war
d 1)
- 5
0% o
f th
e op
tions
had
ves
ted
as a
t 31
Mar
ch 2
019
6 P
lan
9 (A
war
d 2)
- 2
5% o
f th
e op
tions
had
ves
ted
as a
t 31
Mar
ch 2
019
7 P
lan
9 (A
war
d 2)
- N
one
of t
he o
ptio
ns h
ad v
este
d as
at
31 M
arch
201
9 w
ith t
he e
xcep
tion
of r
etire
es
MANAGEMENT DISCUSSION AND ANALYSIS

76 JOHN KEELLS HOLDINGS PLC | ANNUAL REPORT 2018/19
GROUP CONSOLIDATED REVIEWSHARE INFORMATION
Share Capital
Year ended 31 March Number of Shares in Issue (million)
2006 400.00
2007 552.94
2008 635.99
2009 611.35
2010 619.47
2011 629.69
2012 844.12
2013 857.24
2014 990.29
2015 997.49
2016 1,189.40
2017 1,387.47
2018 1,387.53
2019 1,318.17
Dividends
Year ended 31 March DPS (Rs.) Dividends (Rs.000)
2006 3.00 1,199,460
2007 3.00 1,412,306
2008 5.00 3,176,302
2009 3.00 1,883,442
2010 3.00 1,843,642
2011 3.00 1,868,707
2012 3.00 2,313,519
2013 3.50 2,982,421
2014 3.50 3,266,718
2015 3.50 3,475,947
2016 7.00 8,037,790
2017 5.50 7,280,497
2018 6.00 8,324,983
2019 5.00 8,186,450
2018/19 Financial Calendar
Date
Three months ended 30 June 2018 26-Jul-2018
Six months ended 30 September 2018 6-Nov-2018
Nine months ended 31 December 2018 31-Jan-2019
Annual Report 2018/19 24-May-2019
40th Annual General Meeting 28-Jun-2019
First interim dividend paid on 19-Nov-2018
Second interim dividend paid on 22-Feb-2019
Final dividend proposed to be paid on 14-Jun-2019
2019/20 Financial Calendar
Date
Three months ended 30 June 2019 On or before 25 July 2019
Six months ended 30 September 2019 On or before 1 November 2019
Nine months ended 31 December 2019 On or before 30 January 2020
Annual Report 2019/20 On or before 22 May 2020
41st Annual General Meeting On or before 26 June 2020
GDR History (in terms of ordinary shares, million)
Year ended 31 March
Opening Balance
Issued* Converted/ Repurchased
Closing Balance
2006 0.71 0.14 - 0.85
2007 0.85 0.12 - 0.97
2008 0.97 0.14 - 1.11
2009 1.11 - 0.12 0.99
2010 0.99 - 0.01 0.98
2011 0.98 - 0.03 0.95
2012 0.95 0.32 0.08 1.19
2013 1.19 - 0.06 1.13
2014 1.13 - 0.01 1.12
2015 1.12 - - 1.12
2016 1.12 - - 1.12
2017 1.12 0.20 - 1.32
2018 1.32 - - 1.32
2019 1.32 - - 1.32
1 GDR is equivalent to 2 ordinary shares* First issued in 1994/95 and subsequently increased along with bonus issues and subdivision of shares
History of Scrip Issues, Rights and Repurchases
Year ended 31 March
Issue Basis Number of
Shares (million)
Ex-date Cash Inflow/
(Outflow) (Rs.billion)
2006 Bonus 1:5 66 11-May-2005 N/A
2007 Bonus 1:7 57 13-Jun-2006 N/A
2007 Rights @ Rs.140* 1:5 92 23-Jan-2007 13.0
2007 Bonus 1:7 79 13-Mar-2007 N/A
2009 Repurchase @ Rs.90 1:25 26 11-Oct-2008 (2.3)
2012 Subdivision 4:3 210 30-Jun-2011 N/A
2013 Rights @ Rs.175* 2:13 132 3-Oct-2013 23.1
2016 Subdivision 7:8 143 30-Jun-2015 N/A
2017 Subdivision 7:8 170 30-Jun-2016 N/A
2018 Repurchase @ Rs.160 1:20 69 11-Jan-2019 (11.1)
* Unadjusted prices

MANAGEMENT DISCUSSION & ANALYSIS
INDUSTRY GROUP REVIEW
78 Transportation | 88 Consumer Foods | 98 Retail | 108 Leisure | 124 Property | 134 Financial Services
146 Other, including Information Technology and Plantation Services
SEIZ ING
OPPORTUNIT IES

78 JOHN KEELLS HOLDINGS PLC | ANNUAL REPORT 2018/19
INDUSTRY GROUP REVIEW
TRANSPORTATION
SAGT was recognised as the "Best Terminal in the Indian Subcontinent Region" for the third consecutive year by the Singapore based Global Ports Forum
Operation of a container terminal in the Port of Colombo as a public-private partnership on a build, operate and transfer (BOT) basis through South Asia Gateway Terminals (SAGT).
Associate stake in Maersk Lanka, agents in Sri Lanka and the Maldives for Maersk Line and Safmarine.
Port Agency and husbandry services through Mackinnon Mackenzie and Company (Shipping) Limited (MMS).
Logistics services include the operation of:
Marine bunkering and related services under Lanka Marine Services (LMS).
Third party logistics (3PL), warehousing, trucking and freight forwarding solutions under the John Keells Logistics brand.
DHL air express in Sri Lanka, a joint venture with Deutsche Post.
Representation of multiple on-line and off-line airlines as general sales agents through Mack Air in Sri Lanka and its subsidiary in the Maldives.
Domestic scheduled and charter air taxi operations under the brand name "Cinnamon Air".
Freight forwarding under Mack International Freight (MIF).
Industry Group StructureVision and Scope
The vision of the Transportation industry group is to be recognised as a leading provider of transportation solutions, related services and infrastructure through a diversified portfolio of businesses in selected markets. These operations comprise a container terminal in the Port of Colombo, a marine bunkering business, domestic airline, joint venture/associations with leading shipping, logistics and air transportation multinationals as well as travel and airlines services in Sri Lanka and the Maldives.
PORTS AND SHIPPING TRANSPORTATION
Contribution to JKH Group
Revenue22%
20%
8%
14%
EBIT
Capital Employed
Carbon Footprint

79
Key Indicators
Inputs (Rs.million) 2018/19 2017/18 % 2016/17
Total assets 24,938 21,305 17 18,065 Total equity 18,262 16,110 13 14,841 Total debt 4,172 3,267 28 1,754 Capital employed 1 22,434 19,377 16 16,595 Employees (number) 2 698 486 44 385
Outputs (Rs.million) 2018/19 2017/18 % 2016/17
Revenue 3 33,729 25,619 32 18,438 EBIT 4,362 3,326 31 3,124 PBT 4,237 3,269 30 3,098 PAT 4,174 3,084 35 2,979 EBIT per employee 4 6 7 (9) 8 Carbon footprint (MT) 2 13,808 12,714 9 11,309
1. For equity accounted investees, capital employed is representative of the Group’s equity investment in these companies
2. Excludes SAGT, DHL, Maersk Lanka, MIF (formerly known as NDO) 3. Revenue is inclusive of the Group’s share of equity accounted investees4. As per the sustainability reporting boundary
EXTERNAL ENVIRONMENT AND OPERATIONAL REVIEW
Global trade recorded a slowdown in growth to 3.3 per cent in CY2018 [CY2017: 4.7 per cent]. The implementation of steep tariffs on goods between the US, China, EU, Canada and Mexico, and uncertainty surrounding the UK’s exit from the EU which impacted the British economy, hampered global trade during the year.
The shipping industry was affected by subdued economic sentiment. Freight rates for dry-bulk and container ships declined in the second half of 2018, underscoring weakened manufacturing in Asia, North America and Europe.
Despite a drop in throughput in certain global container hubs, the Port of Colombo (POC) recorded steady growth, handling a record high of over seven million TEUs in 2018 (11 per cent growth against CY2017). The growth was driven by a combination of organic growth, rising regional transshipment volumes and increased volumes handled by Colombo International Container Terminals (CICT) on larger vessels.
Changing market dynamics continued to impact the POC. The consolidation of global shipping lines has led to increased bargaining power for consortia, with added pressure on ports to handle larger shipping volumes.
Transshipment volumes grew by 15 per cent in CY2018, with India and Bangladesh being Sri Lanka’s primary transshipment markets.
The POC was ranked as the world’s fastest growing port among the top 30 container ports in September 2018 by Alphaliner, while the Drewry Port Connectivity Index recognised it as having the best connectivity in South Asia and as the 11th best connected port in the world.
There was volatility in bunker prices during the second half of the financial year driven by factors such as OPEC production fluctuations, growing output of American crude oil and sanctions on Iran. The volatility impacted bunker margins in Sri Lanka.
Goods and Services Tax (GST) imposed on bunker sales in India in November 2017 remained at 5 per cent during the year, which contributed to a general shift in volumes from certain key Indian ports to Sri Lanka.
MACRO-ECONOMIC UPDATE
Ports and Shipping
During the year under review, the Group’s Ports and Shipping business, SAGT, recorded an encouraging volume growth of 11 per cent, handling 2.1 million twenty-foot equivalent units (TEUs) [2017/18: 1.90 million TEUs]. Transshipment volumes grew by 11 per cent in 2018/19, contributing approximately 80 per cent of total volume. The increased activity within the POC, as discussed in the Macro-economic Update, was a key factor underpinning the higher volume growth at SAGT. The calendar year 2018 marked a significant milestone for both the POC and SAGT, with POC and SAGT recording an all-time high of over 7 million TEUs and 2 million TEUs, respectively.
Volume Growth (%)
2018/19 2017/18
Domestic 3 12 Transshipment 11 9 Total 11 10
SAGT continued to focus on increasing productivity through various yield and efficiency management initiatives during 2018/19. The business introduced 10 inter-terminal trucks in the first quarter of 2018/19, whilst Rs.1.60 billion was invested in 6 rubber tyred gantry (RTG) cranes in order to boost gate and yard productivity.
SAGT received the following awards and accolades during 2018/19:
Global Ports Forum - 'Best Terminal in the Indian Subcontinent Region' for the third consecutive year.
Global Ports Forum - 'Best Transshipment Hub Port Terminal of the Year'
National Logistics and Transport Awards - Platinum Award
AWARDS
Bunkering
Lanka Marine Services (LMS), the Bunkering business of the Group, maintained its market share during the year under review, recording an encouraging volume growth of 6 per cent in 2018/19. The growth in
MANAGEMENT DISCUSSION AND ANALYSIS
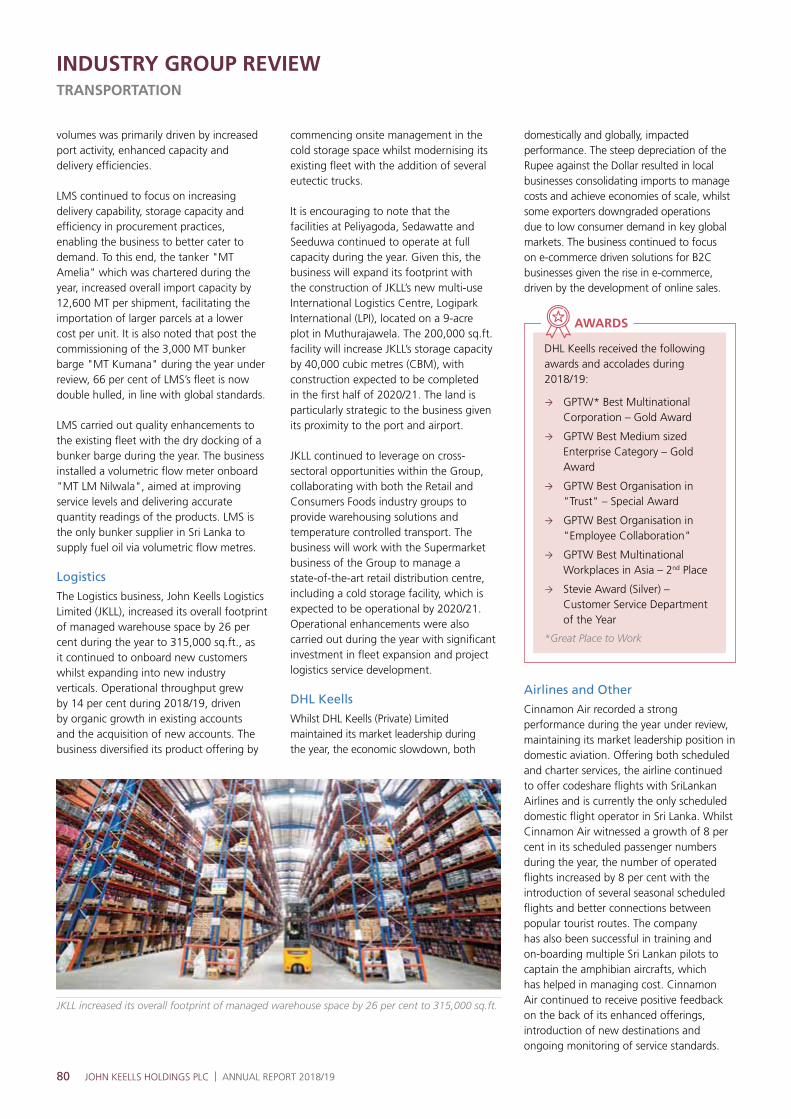
80 JOHN KEELLS HOLDINGS PLC | ANNUAL REPORT 2018/19
INDUSTRY GROUP REVIEWTRANSPORTATION
volumes was primarily driven by increased port activity, enhanced capacity and delivery efficiencies.
LMS continued to focus on increasing delivery capability, storage capacity and efficiency in procurement practices, enabling the business to better cater to demand. To this end, the tanker "MT Amelia" which was chartered during the year, increased overall import capacity by 12,600 MT per shipment, facilitating the importation of larger parcels at a lower cost per unit. It is also noted that post the commissioning of the 3,000 MT bunker barge "MT Kumana" during the year under review, 66 per cent of LMS’s fleet is now double hulled, in line with global standards.
LMS carried out quality enhancements to the existing fleet with the dry docking of a bunker barge during the year. The business installed a volumetric flow meter onboard "MT LM Nilwala", aimed at improving service levels and delivering accurate quantity readings of the products. LMS is the only bunker supplier in Sri Lanka to supply fuel oil via volumetric flow metres.
Logistics
The Logistics business, John Keells Logistics Limited (JKLL), increased its overall footprint of managed warehouse space by 26 per cent during the year to 315,000 sq.ft., as it continued to onboard new customers whilst expanding into new industry verticals. Operational throughput grew by 14 per cent during 2018/19, driven by organic growth in existing accounts and the acquisition of new accounts. The business diversified its product offering by
commencing onsite management in the cold storage space whilst modernising its existing fleet with the addition of several eutectic trucks.
It is encouraging to note that the facilities at Peliyagoda, Sedawatte and Seeduwa continued to operate at full capacity during the year. Given this, the business will expand its footprint with the construction of JKLL’s new multi-use International Logistics Centre, Logipark International (LPI), located on a 9-acre plot in Muthurajawela. The 200,000 sq.ft. facility will increase JKLL’s storage capacity by 40,000 cubic metres (CBM), with construction expected to be completed in the first half of 2020/21. The land is particularly strategic to the business given its proximity to the port and airport.
JKLL continued to leverage on cross-sectoral opportunities within the Group, collaborating with both the Retail and Consumers Foods industry groups to provide warehousing solutions and temperature controlled transport. The business will work with the Supermarket business of the Group to manage a state-of-the-art retail distribution centre, including a cold storage facility, which is expected to be operational by 2020/21. Operational enhancements were also carried out during the year with significant investment in fleet expansion and project logistics service development.
DHL Keells
Whilst DHL Keells (Private) Limited maintained its market leadership during the year, the economic slowdown, both
JKLL increased its overall footprint of managed warehouse space by 26 per cent to 315,000 sq.ft.
DHL Keells received the following awards and accolades during 2018/19:
GPTW* Best Multinational Corporation – Gold Award
GPTW Best Medium sized Enterprise Category – Gold Award
GPTW Best Organisation in "Trust" – Special Award
GPTW Best Organisation in "Employee Collaboration"
GPTW Best Multinational Workplaces in Asia – 2nd Place
Stevie Award (Silver) – Customer Service Department of the Year
*Great Place to Work
AWARDS
domestically and globally, impacted performance. The steep depreciation of the Rupee against the Dollar resulted in local businesses consolidating imports to manage costs and achieve economies of scale, whilst some exporters downgraded operations due to low consumer demand in key global markets. The business continued to focus on e-commerce driven solutions for B2C businesses given the rise in e-commerce, driven by the development of online sales.
Airlines and Other
Cinnamon Air recorded a strong performance during the year under review, maintaining its market leadership position in domestic aviation. Offering both scheduled and charter services, the airline continued to offer codeshare flights with SriLankan Airlines and is currently the only scheduled domestic flight operator in Sri Lanka. Whilst Cinnamon Air witnessed a growth of 8 per cent in its scheduled passenger numbers during the year, the number of operated flights increased by 8 per cent with the introduction of several seasonal scheduled flights and better connections between popular tourist routes. The company has also been successful in training and on-boarding multiple Sri Lankan pilots to captain the amphibian aircrafts, which has helped in managing cost. Cinnamon Air continued to receive positive feedback on the back of its enhanced offerings, introduction of new destinations and ongoing monitoring of service standards.

81
"MT Kumana", the new double-hulled bunker barge commissioned by LMS
Seasonal scheduled and charter flights offered by "Cinnamon Air"
The Airline Representation business, Mack Air Limited (MAL), recorded encouraging growth in both the air passenger and cargo segments during the year under review, with passenger growth outpacing industry growth. MAL was appointed the general sales agent for AirAsia and Thai AirAsia, bringing its total airline representations to 16. MAL continued to represent Jet Airways, KLM and Gulf Air, which displayed promising growth, driven by increases in long-haul frequency. During 2018/19, the business introduced a new customer relationship management (CRM) platform which was beneficial in streamlining its operations.
Mackinnons Travels Limited (MTL) continued to benefit from the growing outbound travel market whilst actively engaging in business promotion. During the year under review, MTL increased its focus on the leisure segment to diversify its portfolio and to capitalise on emerging market trends.
Mackinnon Mackenzie & Co. (Shipping) Limited (MMS), the Group’s shipping agency representative, recorded an encouraging year, with the number of vessels handled increasing by 16 per cent against 2017/18. The business signed two new agency agreements in 2018/19, including Waypoint Port Services, a joint venture with Bernhard Schulte Shipmanagement, the second largest global ship management company.
STRATEGY AND OUTLOOK
The revival of regional and global trade growth, on the back of an improvement in domestic consumption and investments in infrastructure, globally and regionally, is expected to bode well for Sri Lanka.
The increased flow of transshipment volumes will facilitate Sri Lanka’s positioning as a logistics and maritime hub in the region. Given its strategic location on major shipping routes, the country is well placed to transform itself from a regional transshipment hub to a global maritime hub. This has been identified as a vision in the National Policy for Maritime and Logistics Sectors, which is currently in its final draft stage, and once implemented will spearhead long-term sustainable growth for the sector.
Ports and Shipping
The Sri Lanka Ports Authority (SLPA) forecasts double digit growth in volumes for the POC in 2019, underpinned by Sri Lanka’s key transshipment markets, India and Bangladesh.
While the Port has reaped the benefits of the surge in volumes during 2018, there is a pressing need for an increase in capacity given the steady increase in volumes and the Port nearing capacity. Sri Lanka’s only deep water terminal, CICT is reaching capacity for mega carriers whilst competition from India is also growing steadily. The deep-water terminal in Vizhinjam, which is expected to be operational by late 2020, and various tariff concessions and relief measures granted as a part of the "SagarMala" development initiative in India, aimed at making India
a global maritime hub, may impact Sri Lanka’s transshipment volumes. Given the above, the need for development of the East Container Terminal (ECT) is more pronounced and critical to drive volume led growth.
The Ministry of Ports and Shipping has taken steps to invest USD 5.2 million in order to transform the POC into a 'Smart Port' with many functions automated to increase efficiency. Investments are also underway to extend the physical facilities within the POC, given the envisaged increase in volumes in the near-term.
The Ports and Shipping business of the Group will continue to explore its options in line with overall prospects for the POC, whilst working to boost terminal efficiency and productivity on the back of investments made during 2018/19. The business will also evaluate investments to enhance capacity through yield management initiatives. SAGT will work towards consolidating its operations, given the envisaged trade flow to the country, to provide high value-added and integrated services, whilst focusing on a better mix of Transshipment:Domestic containers to optimise profitability.
Bunkering
The demand for bunkering services is expected to rise, driven by growing activity in the region, and demand generated by ongoing large-scale investments in the Southern and Eastern Ports.
Further to the Port of Hambantota being leased to China Merchant Port Holdings during 2017/18, Sinopec Fuel Oil Sales Co. Ltd. was appointed to operate the bunker
MANAGEMENT DISCUSSION AND ANALYSIS
Jaffna
Vavuniya
Trincomalee
Ampara
Hambantota
DickwellaKoggala
Bentota
Colombo City (Waters Edge)
Bandaranaike International
Airport (Colombo)
Sigiriya
Kandy
Nuwara Eliya
Castlereagh
Batticaloa / Pasikudah
Anuradhapura
Scheduled flightsCharter flights

82 JOHN KEELLS HOLDINGS PLC | ANNUAL REPORT 2018/19
terminal during the year under review. The terminal will have a capacity of 74,000 CBM and is expected to commence operations during 2019/20. Whilst this would lead to a shift in volumes, to an extent, from Colombo to Hambantota, the total bunker market in the country is expected to witness a growth in volumes on account of increased storage and infrastructure.
The bunker market in Sri Lanka is currently curtailed due to the limited availability of bonded tank space, which has significantly impacted the regional competitiveness of the industry. This, together with the proposed "Global Sulphur Cap" (a regulatory requirement for a significant reduction in the sulphur content of the fuel oil used by ships, initiated by the International Maritime Organisation, which is expected to be implemented in January 2020), exacerbates the need for capacity enhancement in terms of fuel oil storage. To this end, LMS will adopt the necessary infrastructure changes required to effectively meet the demands of the Sulphur Cap implementation. LMS, together with other players in the industry, will continue to engage with relevant Government entities to enhance storage capacity in Colombo.
INDUSTRY GROUP REVIEWTRANSPORTATION
The Global Sulphur Cap mandates that the sulphur content in fuel oil should be reduced to 0.5 per cent from the current 3.5 per cent from January 2020. This will be a significant challenge to both global shipping and bunker industries. The current facility at the Jaya Container Terminals Oil Bank in Colombo poses significant challenges in terms of storing both compliant and non-complaint fuel post January 2020.
INSIGHTS
LMS will leverage on its strong brand and existing relationships to strengthen its position as the supplier of choice in Sri Lanka, whilst committing to improve customer experience through digital initiatives and other related processes. The business will work together with the Group’s Logistics business to provide more efficient services to customers through the relocation of its marine lubricants bonded warehouse whilst continuing to explore additional opportunities within the Ports of Hambantota and Trincomalee.
Logistics
Market demand for palletised third party logistics (3PL) is expected to grow significantly in the medium-term, driven by growth in inbound project cargo, FMCG and export industries. This has led to ongoing capacity enhancements by key industry players. Additionally, in the event the Government eases the current zoning restrictions under the Commercial Hub Regulations, large-scale investments such as the LPI facility will be able to offer entrepot and multi country consolidation services to global supply chains. As such, this will significantly expand the potential market size for 3PL players.
The Group’s Logistics business will capitalise on these opportunities with the construction of two facilities, which will increase JKLL’s footprint to 600,000 sq.ft. progressively within the short to medium-term. The new LPI facility is equipped to cater to multiple industry verticals and product categories. This will enable JKLL to continue its growth trajectory through diversification into other sectors, an expansion of its service portfolio and continuance of healthy fulfilment rates. As such, the business will further penetrate into the project cargo vertical through expanding its specialised transport fleet whilst also increasing its footprint in temperature controlled logistics.
In line with the Group’s digitisation drive, JKLL will invest in augmenting its end-to-end customer experience through various initiatives such as enhancing the functionality of its current business intelligence (BI) application.
Airlines and Other
The Airlines business of the Group will leverage on the existing portfolio of airlines represented by the company to improve overall market share in both passenger and cargo travel. The convenience of faster connectivity between cities and Sri Lanka’s growing popularity as a destination for short stays are expected to contribute towards improved performance of the Airline segment. Against this backdrop, MAL will focus on strengthening its network of airlines and expand selling to long-haul sectors whilst Cinnamon Air will focus on potential expansion opportunities arising from the growth in tourist arrivals to the country.
As the country’s maritime and logistics industry evolves, we expect opportunities to materialise, in particular through the development of the Hambantota Port. The Transportation industry group will continue to actively evaluate potential projects, individually, and with strategic partners, where beneficial. The significance of both the Hambantota and Colombo Ports, particularly given the positioning of the former within the "Belt and Road" trade and infrastructure initiative, will offer opportunities for private investment which the Group will look to participate in.
"The demand for bunkering services is expected to rise, driven by growing activity in the region, and demand generated by ongoing large-scale investments in the Southern and Eastern Ports."
"As the country’s maritime and logistics industry evolves, we expect opportunities to materialise, in particular through the development of the Hambantota Port. The Transportation industry group will continue to actively evaluate potential projects, individually, and with strategic partners, where beneficial."
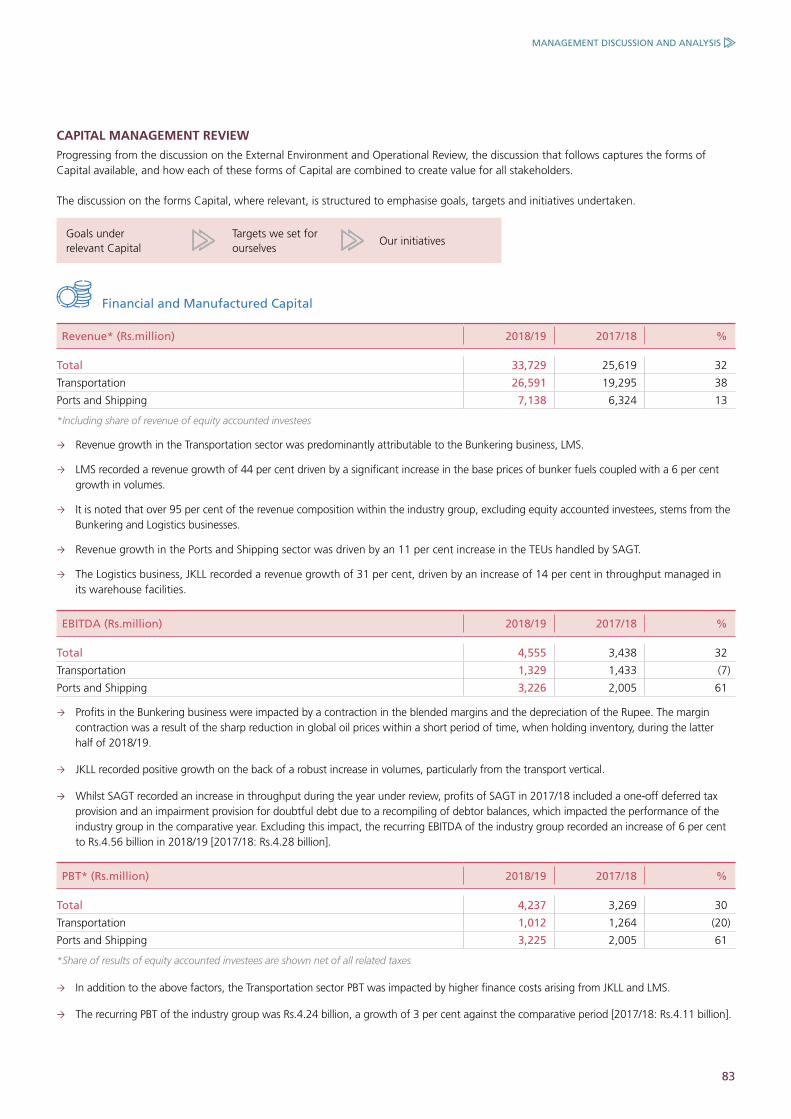
83
Goals under relevant Capital
Targets we set for ourselves
Our initiatives
Financial and Manufactured Capital
Revenue* (Rs.million) 2018/19 2017/18 %
Total 33,729 25,619 32
Transportation 26,591 19,295 38
Ports and Shipping 7,138 6,324 13
*Including share of revenue of equity accounted investees
Revenue growth in the Transportation sector was predominantly attributable to the Bunkering business, LMS.
LMS recorded a revenue growth of 44 per cent driven by a significant increase in the base prices of bunker fuels coupled with a 6 per cent growth in volumes.
It is noted that over 95 per cent of the revenue composition within the industry group, excluding equity accounted investees, stems from the Bunkering and Logistics businesses.
Revenue growth in the Ports and Shipping sector was driven by an 11 per cent increase in the TEUs handled by SAGT.
The Logistics business, JKLL recorded a revenue growth of 31 per cent, driven by an increase of 14 per cent in throughput managed in its warehouse facilities.
EBITDA (Rs.million) 2018/19 2017/18 %
Total 4,555 3,438 32
Transportation 1,329 1,433 (7)
Ports and Shipping 3,226 2,005 61
Profits in the Bunkering business were impacted by a contraction in the blended margins and the depreciation of the Rupee. The margin contraction was a result of the sharp reduction in global oil prices within a short period of time, when holding inventory, during the latter half of 2018/19.
JKLL recorded positive growth on the back of a robust increase in volumes, particularly from the transport vertical.
Whilst SAGT recorded an increase in throughput during the year under review, profits of SAGT in 2017/18 included a one-off deferred tax provision and an impairment provision for doubtful debt due to a recompiling of debtor balances, which impacted the performance of the industry group in the comparative year. Excluding this impact, the recurring EBITDA of the industry group recorded an increase of 6 per cent to Rs.4.56 billion in 2018/19 [2017/18: Rs.4.28 billion].
PBT* (Rs.million) 2018/19 2017/18 %
Total 4,237 3,269 30
Transportation 1,012 1,264 (20)
Ports and Shipping 3,225 2,005 61
*Share of results of equity accounted investees are shown net of all related taxes
In addition to the above factors, the Transportation sector PBT was impacted by higher finance costs arising from JKLL and LMS.
The recurring PBT of the industry group was Rs.4.24 billion, a growth of 3 per cent against the comparative period [2017/18: Rs.4.11 billion].
CAPITAL MANAGEMENT REVIEW
Progressing from the discussion on the External Environment and Operational Review, the discussion that follows captures the forms of Capital available, and how each of these forms of Capital are combined to create value for all stakeholders.
The discussion on the forms Capital, where relevant, is structured to emphasise goals, targets and initiatives undertaken.
MANAGEMENT DISCUSSION AND ANALYSIS
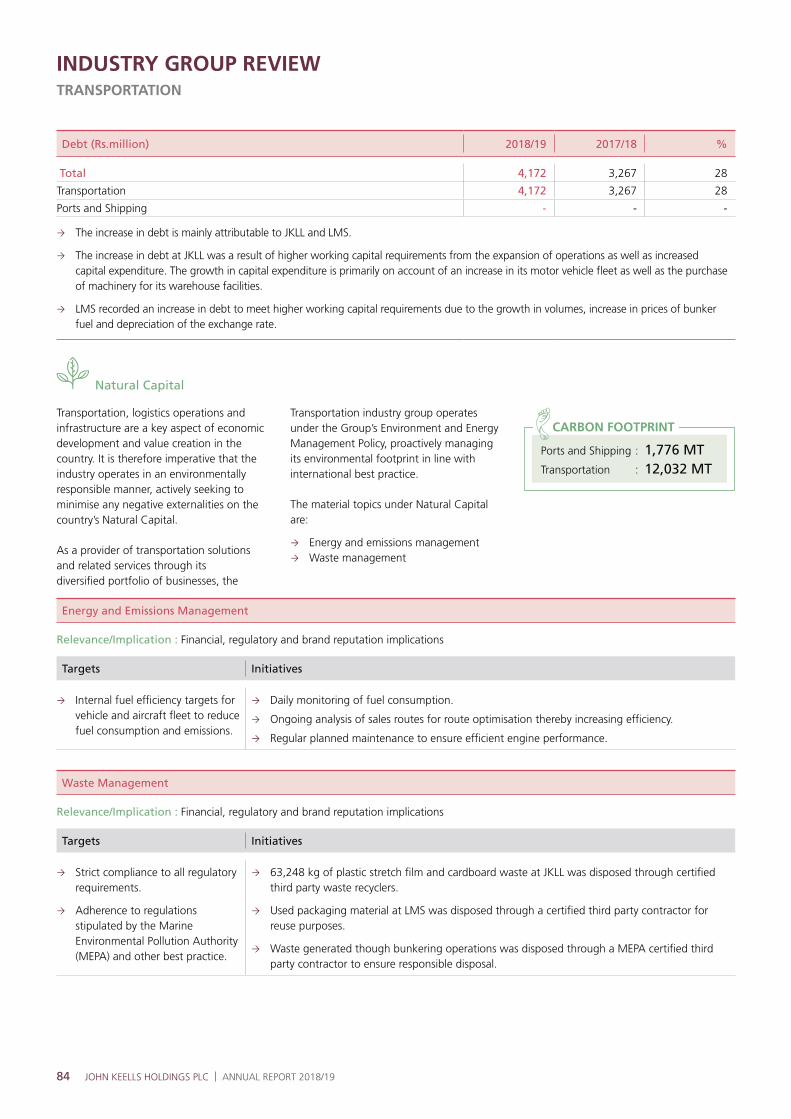
84 JOHN KEELLS HOLDINGS PLC | ANNUAL REPORT 2018/19
INDUSTRY GROUP REVIEWTRANSPORTATION
Debt (Rs.million) 2018/19 2017/18 %
Total 4,172 3,267 28
Transportation 4,172 3,267 28
Ports and Shipping - - -
The increase in debt is mainly attributable to JKLL and LMS.
The increase in debt at JKLL was a result of higher working capital requirements from the expansion of operations as well as increased capital expenditure. The growth in capital expenditure is primarily on account of an increase in its motor vehicle fleet as well as the purchase of machinery for its warehouse facilities.
LMS recorded an increase in debt to meet higher working capital requirements due to the growth in volumes, increase in prices of bunker fuel and depreciation of the exchange rate.
Natural Capital
Transportation, logistics operations and infrastructure are a key aspect of economic development and value creation in the country. It is therefore imperative that the industry operates in an environmentally responsible manner, actively seeking to minimise any negative externalities on the country’s Natural Capital.
As a provider of transportation solutions and related services through its diversified portfolio of businesses, the
Transportation industry group operates under the Group’s Environment and Energy Management Policy, proactively managing its environmental footprint in line with international best practice.
The material topics under Natural Capital are:
Energy and emissions management Waste management
Ports and Shipping : 1,776 MTTransportation : 12,032 MT
CARBON FOOTPRINT
Energy and Emissions Management
Relevance/Implication : Financial, regulatory and brand reputation implications
Targets Initiatives
Internal fuel efficiency targets for vehicle and aircraft fleet to reduce fuel consumption and emissions.
Daily monitoring of fuel consumption.
Ongoing analysis of sales routes for route optimisation thereby increasing efficiency.
Regular planned maintenance to ensure efficient engine performance.
Waste Management
Relevance/Implication : Financial, regulatory and brand reputation implications
Targets Initiatives
Strict compliance to all regulatory requirements.
Adherence to regulations stipulated by the Marine Environmental Pollution Authority (MEPA) and other best practice.
63,248 kg of plastic stretch film and cardboard waste at JKLL was disposed through certified third party waste recyclers.
Used packaging material at LMS was disposed through a certified third party contractor for reuse purposes.
Waste generated though bunkering operations was disposed through a MEPA certified third party contractor to ensure responsible disposal.
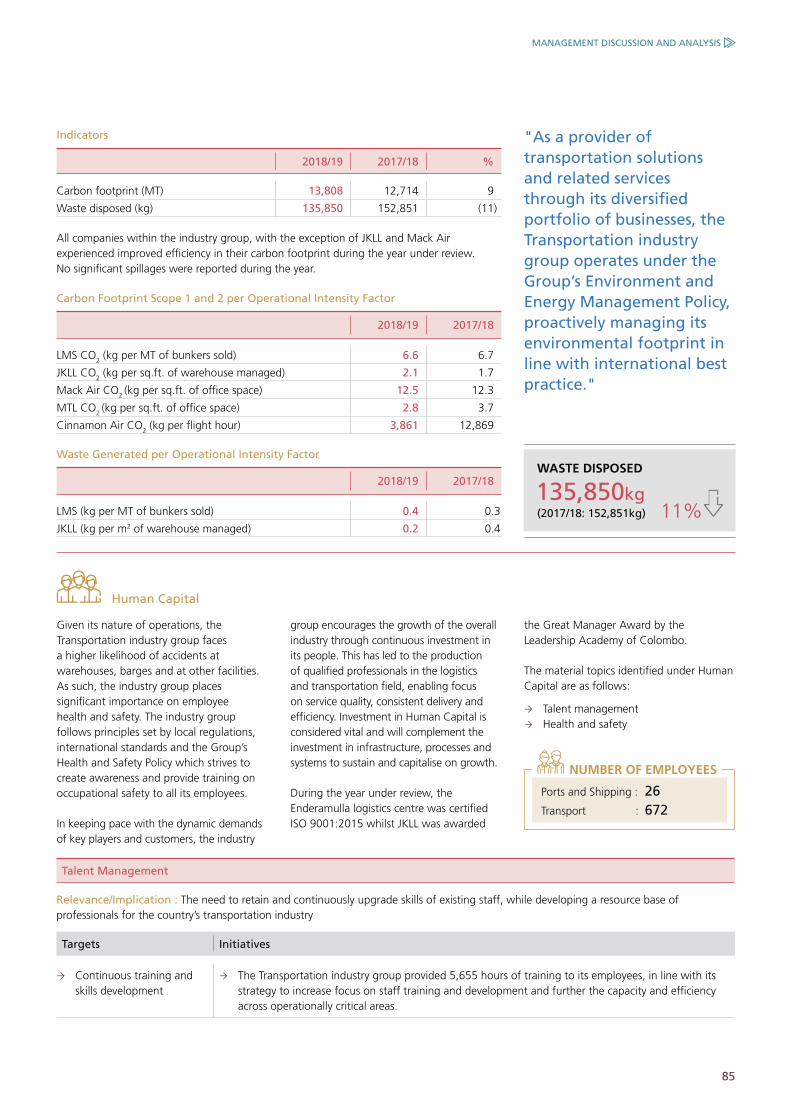
85
Indicators
2018/19 2017/18 %
Carbon footprint (MT) 13,808 12,714 9
Waste disposed (kg) 135,850 152,851 (11)
All companies within the industry group, with the exception of JKLL and Mack Air experienced improved efficiency in their carbon footprint during the year under review. No significant spillages were reported during the year.
Carbon Footprint Scope 1 and 2 per Operational Intensity Factor
2018/19 2017/18
LMS CO2 (kg per MT of bunkers sold) 6.6 6.7
JKLL CO2 (kg per sq.ft. of warehouse managed) 2.1 1.7
Mack Air CO2 (kg per sq.ft. of office space) 12.5 12.3
MTL CO2 (kg per sq.ft. of office space) 2.8 3.7
Cinnamon Air CO2 (kg per flight hour) 3,861 12,869
Waste Generated per Operational Intensity Factor
2018/19 2017/18
LMS (kg per MT of bunkers sold) 0.4 0.3
JKLL (kg per m2 of warehouse managed) 0.2 0.4
Given its nature of operations, the Transportation industry group faces a higher likelihood of accidents at warehouses, barges and at other facilities. As such, the industry group places significant importance on employee health and safety. The industry group follows principles set by local regulations, international standards and the Group’s Health and Safety Policy which strives to create awareness and provide training on occupational safety to all its employees.
In keeping pace with the dynamic demands of key players and customers, the industry
Human Capital
group encourages the growth of the overall industry through continuous investment in its people. This has led to the production of qualified professionals in the logistics and transportation field, enabling focus on service quality, consistent delivery and efficiency. Investment in Human Capital is considered vital and will complement the investment in infrastructure, processes and systems to sustain and capitalise on growth.
During the year under review, the Enderamulla logistics centre was certified ISO 9001:2015 whilst JKLL was awarded
"As a provider of transportation solutions and related services through its diversified portfolio of businesses, the Transportation industry group operates under the Group’s Environment and Energy Management Policy, proactively managing its environmental footprint in line with international best practice."
the Great Manager Award by the Leadership Academy of Colombo.
The material topics identified under Human Capital are as follows:
Talent management Health and safety
Ports and Shipping : 26Transport : 672
NUMBER OF EMPLOYEES
Talent Management
Relevance/Implication : The need to retain and continuously upgrade skills of existing staff, while developing a resource base of professionals for the country’s transportation industry
Targets Initiatives
Continuous training and skills development
The Transportation industry group provided 5,655 hours of training to its employees, in line with its strategy to increase focus on staff training and development and further the capacity and efficiency across operationally critical areas.
11%
WASTE DISPOSED
(2017/18: 152,851kg)
135,850kg
MANAGEMENT DISCUSSION AND ANALYSIS

86 JOHN KEELLS HOLDINGS PLC | ANNUAL REPORT 2018/19
INDUSTRY GROUP REVIEWTRANSPORTATION
Performance
The industry group provided 8 hours of training per employee.
2018/19 2017/18 %
Injuries (number) 6 0 -
Training (hours) 5,655 3,436 65
Targets Initiatives
Establishment of a resource base of qualified transportation and logistics professionals.
CSR Initiatives:
The Transportation industry group continued its long-term strategic CSR collaboration with the University of Moratuwa. The initiative involves the funding and implementation of a scholarship scheme for the students of the University’s Department of Transport and Logistics Management of the Engineering Faculty aimed at addressing the skills mismatch within the industry. The programme targets the development of knowledge, skills and competencies of undergraduates in the fields of aviation, shipping, logistics and supply chain management or public transport, thereby improving their employability which in turn facilitates economic growth (SDG 8).
During the year:
20 scholarships were awarded on a need and merit basis.
53 students benefited from an 'Immersion' based customised English language training offered to all the first-year students.
A recruitment campaign at the NSBM Green University was undertaken in the reporting year creating job opportunities for 80 students.
Occupational Health and Safety
Relevance/Implication : Labour and productivity concerns
Targets Initiatives
Zero major accidents within logistic centres and to address 100 per cent of all reported near misses.
Zero road accidents, traffic violations and customer complaints.
LMS and JKLL continued to maintain the OHSAS 18001-2007 certification for bunkering and warehousing operations ensuring globally recognised health and safety standards are maintained. In addition, MARPOL compliant oil spill drills were conducted to minimise impact in case of an incident.
Fire drills were conducted on board barges, warehouses and at the head office, which houses multiple business entities.
First aid trainings for staff were conducted by Red Cross certified trainers.
Diverse workforce at JKLL
"LMS and JKLL continued to maintain the OHSAS 18001-2007 certification for bunkering and warehousing operations ensuring globally recognised health and safety standards are maintained. In addition, MARPOL compliant oil spill drills were conducted to minimise impact in case of an incident."
87
Social and Relationship Capital
Through its diverse product and service offerings, the Transportation industry group connects multiple entities across and within the borders of the country. Its business operations from ports and shipping to warehousing and aviation connections focuses on delivering a seamless value-added service to customers and other stakeholders.
The Group’s Ports and Shipping business, SAGT, operates in the Port of Colombo which provides ideal trade connections for the development of trading and infrastructure networks given its strategic positioning.
The Bunkering business continued to enhance its procurement contract by working with a leading petroleum company in India, while the Logistics business
SIGNIFICANT SUPPLIERS
Outsourced vehicle fleets Warehouse operationsMaintenance, support services
and outsourced employeesCapital equipment
expanded its service offering to a multitude of industries within the local market thereby diversifying and further strengthening its portfolio of services offered.
In order to maintain mutually-beneficial relationships with stakeholders and to mitigate any negative sustainability impacts, businesses continually assessed, as necessary, all significant suppliers, including suppliers providing janitorial and other outsourced services.
MANAGEMENT DISCUSSION AND ANALYSIS
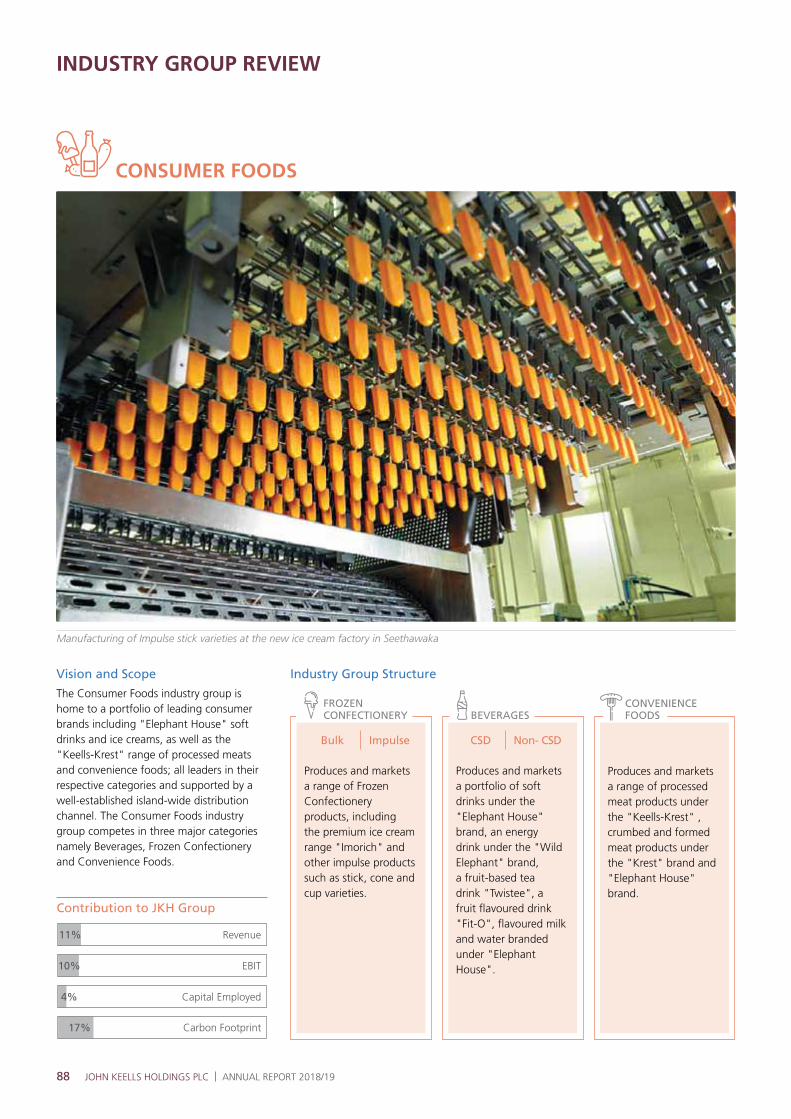
88 JOHN KEELLS HOLDINGS PLC | ANNUAL REPORT 2018/19
CONSUMER FOODS
Manufacturing of Impulse stick varieties at the new ice cream factory in Seethawaka
INDUSTRY GROUP REVIEW
Vision and Scope
The Consumer Foods industry group is home to a portfolio of leading consumer brands including "Elephant House" soft drinks and ice creams, as well as the "Keells-Krest" range of processed meats and convenience foods; all leaders in their respective categories and supported by a well-established island-wide distribution channel. The Consumer Foods industry group competes in three major categories namely Beverages, Frozen Confectionery and Convenience Foods.
Contribution to JKH Group
Revenue
17%
EBIT
Capital Employed
Carbon Footprint
11%
10%
4%
Bulk Impulse
Produces and markets a range of Frozen Confectionery products, including the premium ice cream range "Imorich" and other impulse products such as stick, cone and cup varieties.
CSD Non- CSD
Produces and markets a portfolio of soft drinks under the "Elephant House" brand, an energy drink under the "Wild Elephant" brand, a fruit-based tea drink "Twistee", a fruit flavoured drink "Fit-O", flavoured milk and water branded under "Elephant House".
Produces and markets a range of processed meat products under the "Keells-Krest" , crumbed and formed meat products under the "Krest" brand and "Elephant House" brand.
Industry Group Structure
FROZEN CONFECTIONERY BEVERAGES
CONVENIENCE FOODS
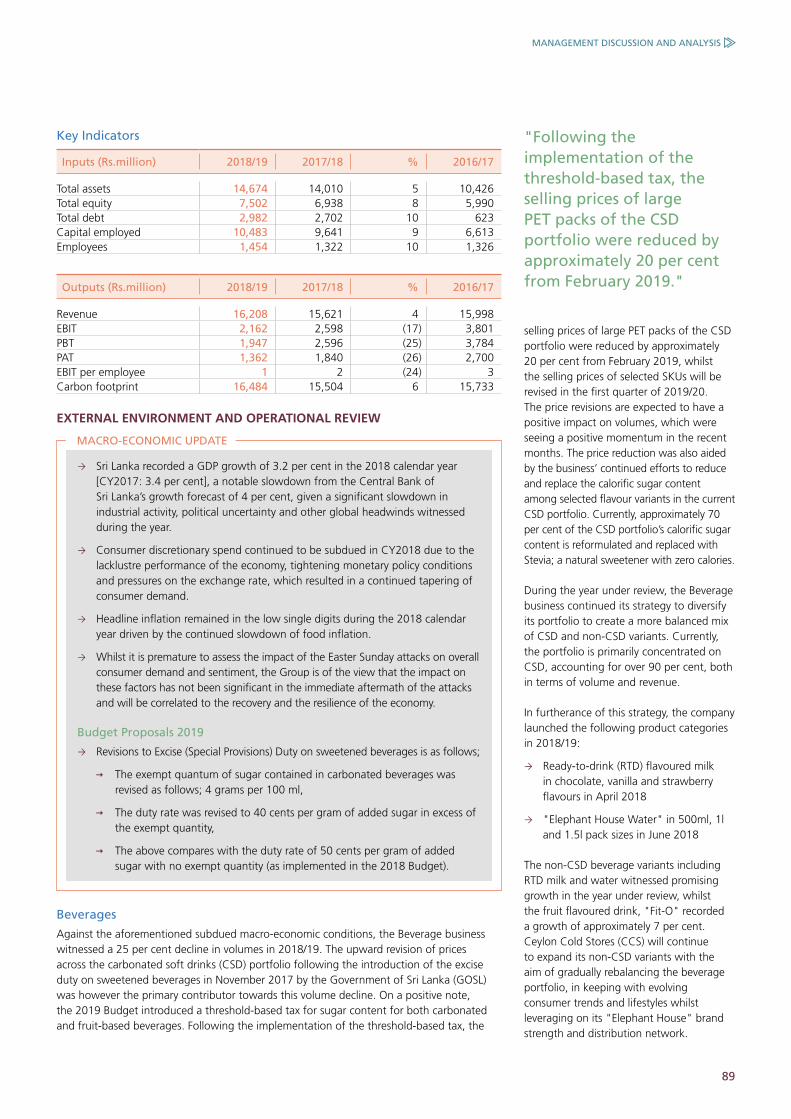
89
Key Indicators
Inputs (Rs.million) 2018/19 2017/18 % 2016/17
Total assets 14,674 14,010 5 10,426 Total equity 7,502 6,938 8 5,990 Total debt 2,982 2,702 10 623 Capital employed 10,483 9,641 9 6,613 Employees 1,454 1,322 10 1,326
Outputs (Rs.million) 2018/19 2017/18 % 2016/17
Revenue 16,208 15,621 4 15,998 EBIT 2,162 2,598 (17) 3,801 PBT 1,947 2,596 (25) 3,784 PAT 1,362 1,840 (26) 2,700 EBIT per employee 1 2 (24) 3 Carbon footprint 16,484 15,504 6 15,733
EXTERNAL ENVIRONMENT AND OPERATIONAL REVIEW
Sri Lanka recorded a GDP growth of 3.2 per cent in the 2018 calendar year [CY2017: 3.4 per cent], a notable slowdown from the Central Bank of Sri Lanka’s growth forecast of 4 per cent, given a significant slowdown in industrial activity, political uncertainty and other global headwinds witnessed during the year.
Consumer discretionary spend continued to be subdued in CY2018 due to the lacklustre performance of the economy, tightening monetary policy conditions and pressures on the exchange rate, which resulted in a continued tapering of consumer demand.
Headline inflation remained in the low single digits during the 2018 calendar year driven by the continued slowdown of food inflation.
Whilst it is premature to assess the impact of the Easter Sunday attacks on overall consumer demand and sentiment, the Group is of the view that the impact on these factors has not been significant in the immediate aftermath of the attacks and will be correlated to the recovery and the resilience of the economy.
Budget Proposals 2019
Revisions to Excise (Special Provisions) Duty on sweetened beverages is as follows;
The exempt quantum of sugar contained in carbonated beverages was revised as follows; 4 grams per 100 ml,
The duty rate was revised to 40 cents per gram of added sugar in excess of the exempt quantity,
The above compares with the duty rate of 50 cents per gram of added sugar with no exempt quantity (as implemented in the 2018 Budget).
selling prices of large PET packs of the CSD portfolio were reduced by approximately 20 per cent from February 2019, whilst the selling prices of selected SKUs will be revised in the first quarter of 2019/20. The price revisions are expected to have a positive impact on volumes, which were seeing a positive momentum in the recent months. The price reduction was also aided by the business’ continued efforts to reduce and replace the calorific sugar content among selected flavour variants in the current CSD portfolio. Currently, approximately 70 per cent of the CSD portfolio’s calorific sugar content is reformulated and replaced with Stevia; a natural sweetener with zero calories.
During the year under review, the Beverage business continued its strategy to diversify its portfolio to create a more balanced mix of CSD and non-CSD variants. Currently, the portfolio is primarily concentrated on CSD, accounting for over 90 per cent, both in terms of volume and revenue.
In furtherance of this strategy, the company launched the following product categories in 2018/19:
Ready-to-drink (RTD) flavoured milk in chocolate, vanilla and strawberry flavours in April 2018
"Elephant House Water" in 500ml, 1l and 1.5l pack sizes in June 2018
The non-CSD beverage variants including RTD milk and water witnessed promising growth in the year under review, whilst the fruit flavoured drink, "Fit-O" recorded a growth of approximately 7 per cent. Ceylon Cold Stores (CCS) will continue to expand its non-CSD variants with the aim of gradually rebalancing the beverage portfolio, in keeping with evolving consumer trends and lifestyles whilst leveraging on its "Elephant House" brand strength and distribution network.
"Following the implementation of the threshold-based tax, the selling prices of large PET packs of the CSD portfolio were reduced by approximately 20 per cent from February 2019."
MACRO-ECONOMIC UPDATE
Beverages
Against the aforementioned subdued macro-economic conditions, the Beverage business witnessed a 25 per cent decline in volumes in 2018/19. The upward revision of prices across the carbonated soft drinks (CSD) portfolio following the introduction of the excise duty on sweetened beverages in November 2017 by the Government of Sri Lanka (GOSL) was however the primary contributor towards this volume decline. On a positive note, the 2019 Budget introduced a threshold-based tax for sugar content for both carbonated and fruit-based beverages. Following the implementation of the threshold-based tax, the
MANAGEMENT DISCUSSION AND ANALYSIS
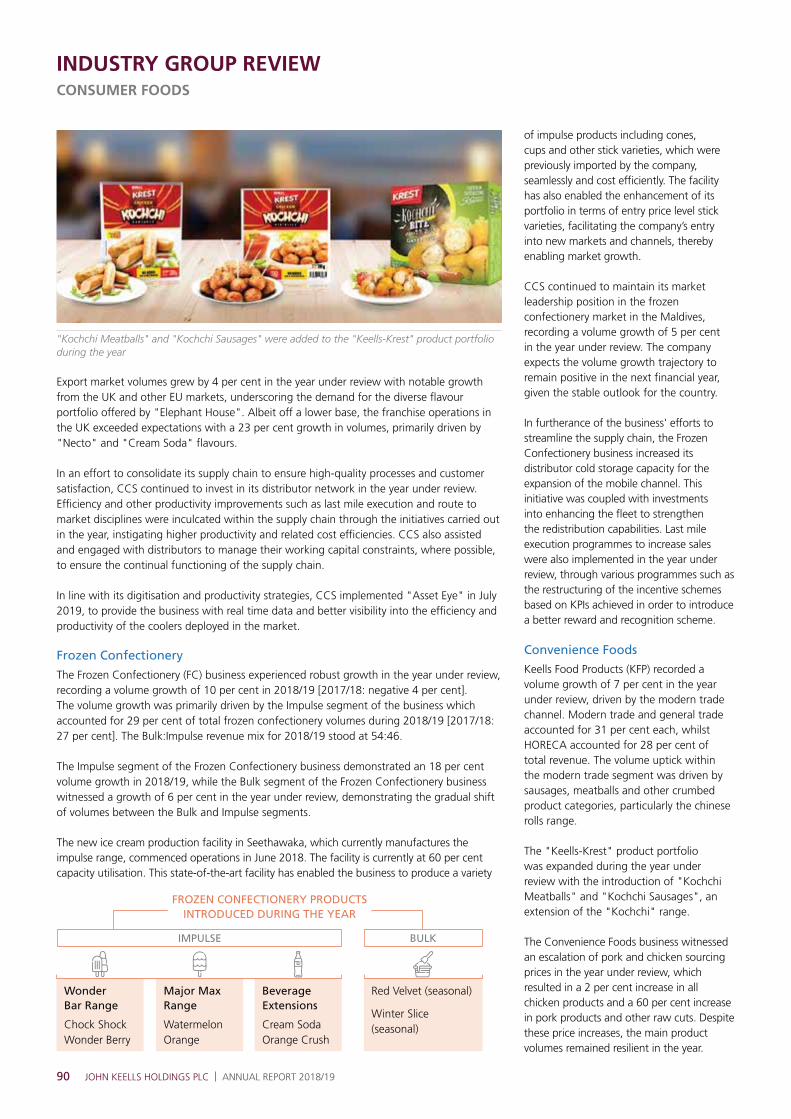
90 JOHN KEELLS HOLDINGS PLC | ANNUAL REPORT 2018/19
INDUSTRY GROUP REVIEWCONSUMER FOODS
Export market volumes grew by 4 per cent in the year under review with notable growth from the UK and other EU markets, underscoring the demand for the diverse flavour portfolio offered by "Elephant House". Albeit off a lower base, the franchise operations in the UK exceeded expectations with a 23 per cent growth in volumes, primarily driven by "Necto" and "Cream Soda" flavours.
In an effort to consolidate its supply chain to ensure high-quality processes and customer satisfaction, CCS continued to invest in its distributor network in the year under review. Efficiency and other productivity improvements such as last mile execution and route to market disciplines were inculcated within the supply chain through the initiatives carried out in the year, instigating higher productivity and related cost efficiencies. CCS also assisted and engaged with distributors to manage their working capital constraints, where possible, to ensure the continual functioning of the supply chain.
In line with its digitisation and productivity strategies, CCS implemented "Asset Eye" in July 2019, to provide the business with real time data and better visibility into the efficiency and productivity of the coolers deployed in the market.
Frozen Confectionery
The Frozen Confectionery (FC) business experienced robust growth in the year under review, recording a volume growth of 10 per cent in 2018/19 [2017/18: negative 4 per cent]. The volume growth was primarily driven by the Impulse segment of the business which accounted for 29 per cent of total frozen confectionery volumes during 2018/19 [2017/18: 27 per cent]. The Bulk:Impulse revenue mix for 2018/19 stood at 54:46.
The Impulse segment of the Frozen Confectionery business demonstrated an 18 per cent volume growth in 2018/19, while the Bulk segment of the Frozen Confectionery business witnessed a growth of 6 per cent in the year under review, demonstrating the gradual shift of volumes between the Bulk and Impulse segments.
The new ice cream production facility in Seethawaka, which currently manufactures the impulse range, commenced operations in June 2018. The facility is currently at 60 per cent capacity utilisation. This state-of-the-art facility has enabled the business to produce a variety
Wonder Bar Range
Chock ShockWonder Berry
Major Max Range
WatermelonOrange
Beverage Extensions
Cream SodaOrange Crush
Red Velvet (seasonal)
Winter Slice (seasonal)
FROZEN CONFECTIONERY PRODUCTS INTRODUCED DURING THE YEAR
"Kochchi Meatballs" and "Kochchi Sausages" were added to the "Keells-Krest" product portfolio during the year
of impulse products including cones, cups and other stick varieties, which were previously imported by the company, seamlessly and cost efficiently. The facility has also enabled the enhancement of its portfolio in terms of entry price level stick varieties, facilitating the company’s entry into new markets and channels, thereby enabling market growth.
CCS continued to maintain its market leadership position in the frozen confectionery market in the Maldives, recording a volume growth of 5 per cent in the year under review. The company expects the volume growth trajectory to remain positive in the next financial year, given the stable outlook for the country.
In furtherance of the business' efforts to streamline the supply chain, the Frozen Confectionery business increased its distributor cold storage capacity for the expansion of the mobile channel. This initiative was coupled with investments into enhancing the fleet to strengthen the redistribution capabilities. Last mile execution programmes to increase sales were also implemented in the year under review, through various programmes such as the restructuring of the incentive schemes based on KPIs achieved in order to introduce a better reward and recognition scheme.
Convenience Foods
Keells Food Products (KFP) recorded a volume growth of 7 per cent in the year under review, driven by the modern trade channel. Modern trade and general trade accounted for 31 per cent each, whilst HORECA accounted for 28 per cent of total revenue. The volume uptick within the modern trade segment was driven by sausages, meatballs and other crumbed product categories, particularly the chinese rolls range.
The "Keells-Krest" product portfolio was expanded during the year under review with the introduction of "Kochchi Meatballs" and "Kochchi Sausages", an extension of the "Kochchi" range.
The Convenience Foods business witnessed an escalation of pork and chicken sourcing prices in the year under review, which resulted in a 2 per cent increase in all chicken products and a 60 per cent increase in pork products and other raw cuts. Despite these price increases, the main product volumes remained resilient in the year.
IMPULSE BULK
91
Evolving consumer trends, lifestyles and the pronounced emphasis on nutrition and convenience has driven both global and domestic consumer foods industries towards innovative solutions which amalgamate quality, nourishment and convenience. As such, affordable, easy-to-prepare and ready-to-eat single serve products are on a growth trajectory. Given these recent developments within local and foreign markets, KFP is in the process of finalising new products to diversify its portfolio in the convenience foods category.
KFP witnessed a muted year in terms of export market performance with exports to the Maldives maintaining steady volume growth in the year under review and exports to India recording a slowdown on the back of regulatory challenges and distribution issues.
As outlined in the Natural Capital section of this report, KFP also engaged in various energy saving initiatives within the production facilities in Pannala and Ekala.
STRATEGY AND OUTLOOK
Domestic demand conditions are expected to improve in the ensuing year after a prolonged period of subdued consumer demand and consumer confidence. The economy showed signs of recovery towards the latter part of the financial year, demonstrating a slight uptick in consumer and business confidence; this positive sentiment is expected to continue to the ensuing year to create a conducive environment for growth.
Reiterating the potential for growth in the medium-term, the Nielsen Country Report for Sri Lanka cite a growth in consumption in the fourth quarter of CY2018.
Additionally, as outlined at the outset, the penetration of consumer food products continues to be significantly below global averages, highlighting the potential for continued long-term growth in these industries. Although off a relatively lower base, the Group expects growth from the outskirts of Colombo to be significantly higher than growth stemming from urban markets. Against this backdrop, the businesses within the Consumer Foods industry group will continue to explore options to venture into different verticals within the consumer foods industry thereby broadening its scope and portfolio, whilst leveraging on the "Elephant House" brand presence and its established distribution network.
Beverages
The long-term growth opportunity for the CSD market maybe tempered, to an extent, given the emergence of a health-conscious consumer although it should be noted that per capita consumption in Sri Lanka is well below peers. Although global beverage markets have been witnessing a challenging period on the back of increased regulations, calorific sugar restrictions, and the increasing significance of the health-conscious consumer, the prospects for the beverage industry continue to be encouraging as these health-conscious consumers seek alternate beverage options.
Stemming from these developments, global beverage manufacturers engage in reformulation exercises to reduce the sugar content of CSD ranges, while extending the beverage portfolios to include non-CSD varieties, particularly healthier and more nutritious alternatives.
As mentioned previously, the Sri Lanka per capita beverage consumption at 7 litres, continues to be well below its regional average. CCS will capitalise on this opportunity through a strong pipeline of products catered to the ever-evolving lifestyles of consumers.
The Beverage business will continue in its research and development efforts to reduce the calorific sugar content in the CSD range while preserving the original flavour portfolio. The company will also continue extending its current beverage portfolio through additions to the non CSD range. As mentioned in the JKH Annual Report 2017/18, the Group continues to be confident that the return profiles of products such as dairy, juices and water, which are already well established in the market, are lucrative and will generate promising growth for the Beverage business in the long-term.
MANAGEMENT DISCUSSION AND ANALYSIS
Strategic priorities of the Beverage business for the ensuing year are as follows;
Portfolio extension within the dairy vertical to introduce fresh milk in a 1 litre pack size.
Capacity enhancement to increase "Elephant House" water volumes.
Flavour extensions within the existing non-CSD ranges.
Frozen Confectionery
Global frozen confectionery markets have been on a positive growth trend in the recent past, gaining popularity as an "on-the-go" convenience snack. As such, single-serve ice creams have garnered popularity in global markets as a "permissible indulgence" resulting in a shift in the bulk:impulse mix towards impulse production.
Going forward, similar to the healthy growth witnessed by the Impulse segment in 2018/19, and the resultant shift in the Bulk:Impulse mix, CCS projects a similar shift in the ensuing years. Per capita consumption of ice cream in Sri Lanka (currently 3 litres) is expected to increase in line with the growth momentum of the "single serve" ice cream in the domestic market, creating further scope for growth within the market. As indicated by the graphs overleaf, the bulk:impulse mix of regional markets are highly skewed towards the impulse markets, demonstrating the significant potential for the impulse category in the overall ice creams market. To this end, CCS projects a similar shift in the mix over a period of time and has taken a multitude of steps towards enhancing capacity and expanding the range to cater to such envisaged demand.
"The Beverage business will continue in its research and development efforts to reduce the calorific sugar content in the CSD range while preserving the original flavour portfolio."
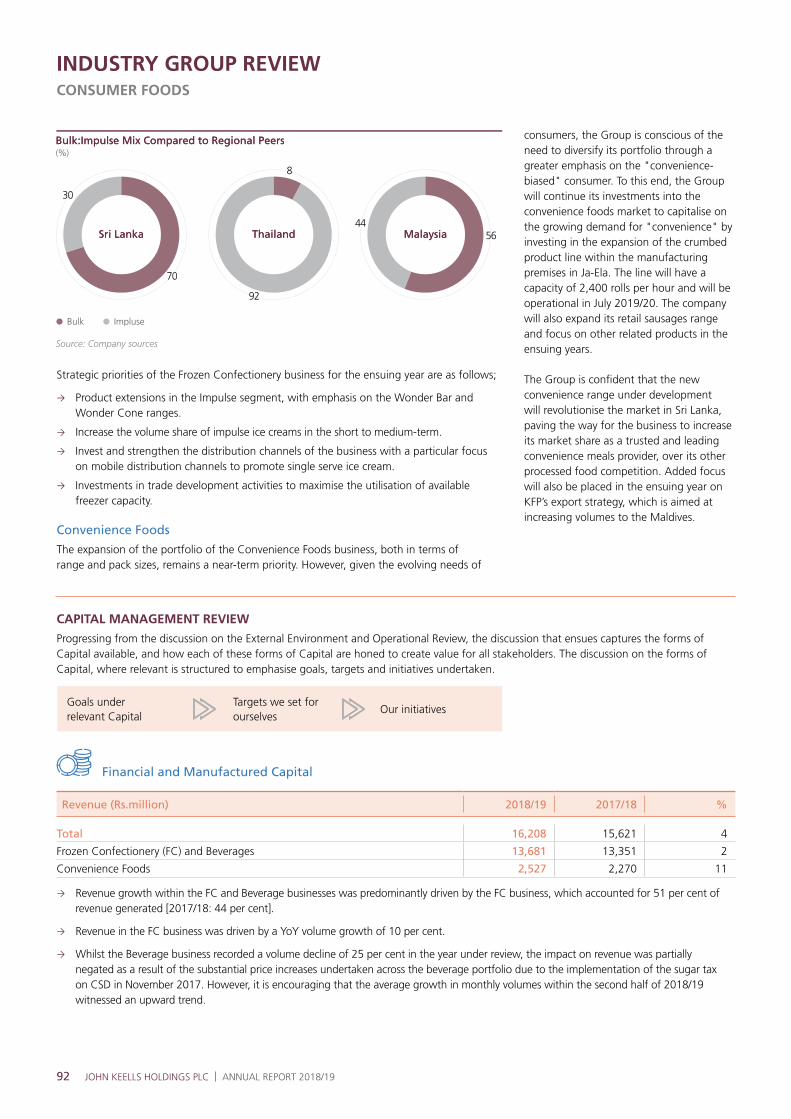
92 JOHN KEELLS HOLDINGS PLC | ANNUAL REPORT 2018/19
INDUSTRY GROUP REVIEWCONSUMER FOODS
Source: Company sources
Strategic priorities of the Frozen Confectionery business for the ensuing year are as follows;
Product extensions in the Impulse segment, with emphasis on the Wonder Bar and Wonder Cone ranges.
Increase the volume share of impulse ice creams in the short to medium-term.
Invest and strengthen the distribution channels of the business with a particular focus on mobile distribution channels to promote single serve ice cream.
Investments in trade development activities to maximise the utilisation of available freezer capacity.
Convenience Foods
The expansion of the portfolio of the Convenience Foods business, both in terms of range and pack sizes, remains a near-term priority. However, given the evolving needs of
Goals under relevant Capital
Targets we set for ourselves
Our initiatives
70
30
(%)
Bulk Impluse
92
8
5644
Bulk:Impulse Mix Compared to Regional PeersBulk:Impulse Mix Compared to Regional Peers
Sri LankaSri Lanka ThailandThailand MalaysiaMalaysia
Financial and Manufactured Capital
Revenue (Rs.million) 2018/19 2017/18 %
Total 16,208 15,621 4
Frozen Confectionery (FC) and Beverages 13,681 13,351 2
Convenience Foods 2,527 2,270 11
Revenue growth within the FC and Beverage businesses was predominantly driven by the FC business, which accounted for 51 per cent of revenue generated [2017/18: 44 per cent].
Revenue in the FC business was driven by a YoY volume growth of 10 per cent.
Whilst the Beverage business recorded a volume decline of 25 per cent in the year under review, the impact on revenue was partially negated as a result of the substantial price increases undertaken across the beverage portfolio due to the implementation of the sugar tax on CSD in November 2017. However, it is encouraging that the average growth in monthly volumes within the second half of 2018/19 witnessed an upward trend.
CAPITAL MANAGEMENT REVIEW
Progressing from the discussion on the External Environment and Operational Review, the discussion that ensues captures the forms of Capital available, and how each of these forms of Capital are honed to create value for all stakeholders. The discussion on the forms of Capital, where relevant is structured to emphasise goals, targets and initiatives undertaken.
consumers, the Group is conscious of the need to diversify its portfolio through a greater emphasis on the "convenience- biased" consumer. To this end, the Group will continue its investments into the convenience foods market to capitalise on the growing demand for "convenience" by investing in the expansion of the crumbed product line within the manufacturing premises in Ja-Ela. The line will have a capacity of 2,400 rolls per hour and will be operational in July 2019/20. The company will also expand its retail sausages range and focus on other related products in the ensuing years.
The Group is confident that the new convenience range under development will revolutionise the market in Sri Lanka, paving the way for the business to increase its market share as a trusted and leading convenience meals provider, over its other processed food competition. Added focus will also be placed in the ensuing year on KFP’s export strategy, which is aimed at increasing volumes to the Maldives.

93
The volume growth in the FC business was driven by the Impulse segment, which recorded an 18 per cent growth in the year under review.
Following the commencement of operations at the new ice cream factory in June 2018, the Bulk:Impulse volume mix has improved in the year emphasising the consumer inclination towards the impulse products in the medium-term. The mix was recorded at 71:29 in 2018/19 against 73:27 in 2017/18.
Revenue growth in the Convenience Foods business was driven by a YoY volume growth of 7 per cent, coupled with a more profitable sales mix. The business undertook price increases in selected products in the year under review as a result of higher raw material prices.
The sausage and crumbed foods categories accounted for 60 per cent of total revenue within this segment.
EBITDA (Rs.million) 2018/19 2017/18 %
Total 2,913 3,192 (9)
Frozen Confectionery and Beverages 2,425 2,733 (11)
Convenience Foods 488 459 6
The decrease in EBITDA in the FC and the Beverage businesses primarily stemmed from the aforementioned volume decline in the Beverage business and the resultant decline in scale efficiencies.
EBITDA was also impacted by the plant commissioning and start-up costs associated with the gradual ramp-up of production at the new ice cream factory in Seethawaka.
It should be noted that the selling and distribution costs pertaining to the FC business increased due to the branding and marketing activities carried out in relation to the launch of new Impulse products.
The recurring EBITDA for the industry group which excludes the fair value gains on investment property pertaining to CCS, was recorded at Rs.2.89 billion, a 9 per cent decrease against 2017/18.
PBT (Rs.million) 2018/19 2017/18 %
Total 1,947 2,596 (25)
Frozen Confectionery and Beverages 1,572 2,250 (30)
Convenience Foods 375 346 8
Although the FC business recorded a growth in volumes, in addition to the factors discussed under EBITDA, profits were impacted by depreciation and finance expenses relating to the funding of the new ice cream factory in Seethawaka.
The PBT for the industry group, excluding the fair value gains on investment property pertaining to CCS, was recorded at Rs.1.92 billion, a 25 per cent decrease against 2017/18.
Assets (Rs.million) 2018/19 2017/18 %
Total 14,674 14,010 5
Frozen Confectionery and Beverages 12,272 11,717 5
Convenience Foods 2,402 2,293 5
The increase in assets in the industry group is mainly attributable to the FC business as a result of investments in the ice cream factory and freezers and coolers in 2018/19. The capital expenditure for the investment in freezers and coolers was recorded at Rs.400 million and was funded via internally generated funds.
Debt (Rs.million) 2018/19 2017/18 %
Total 2,982 2,702 10
Frozen Confectionery and Beverages 2,943 2,668 10
Convenience Foods 39 35 11
The movement in debt is primarily due to the short-term debt facilities of the FC business facilities for working capital management.
The 11 per cent increase in KFP is also due to the short-term facilities under taken by the business to fund working capital requirements. It should be noted that the business has made a capital commitment of Rs.250 million for the expansion of its manufacturing facility.
MANAGEMENT DISCUSSION AND ANALYSIS

94 JOHN KEELLS HOLDINGS PLC | ANNUAL REPORT 2018/19
Energy and Emissions Management
Relevance/Implication : Financial, regulatory and brand reputation Implications
Targets Initiatives
Reduction of energy consumption and the resultant reduction in carbon footprint through various initiatives and better management of infrastructure.
Automated Dissolved Oxygen level controller fixed at the CCS Ranala factory effluent treatment plant (ETP) to enhance decomposition of waste, resulted in 40,730 kWh energy savings per annum.
CICL invested in a Building Management System (BMS) to monitor energy usage throughout the factory. The data will be analysed to optimise energy consumption within the factory.
CCS continued to sustainably source its carbon dioxide requirement from overseas, which is purified from a by-product of a fertiliser manufacturing plant, thereby offsetting the need for combustion of fossil fuel.
Water and Effluent Management
Relevance/Implication : Regulatory and brand reputation implications
Targets Initiatives
Reduce the industry group’s withdrawal of water.
Alignment with international benchmarks.
Ensure all effluents meet the requisite water quality standards.
Continuous improvement through initiatives such as sludge dewatering and renewal of pipelines were carried out for the ETP at the CCS Ranala factory resulting in further water savings.
CCS and KFP continued the reuse of waste water for gardening and general cleaning purposes within its premises.
The automation of the pH dosing system of the ETP at the CCS Ranala factory resulted in a reduction of 32,847 kg of caustic soda during the year.
Indicators
2018/19 2017/18 %
Carbon footprint (MT) 16,484 15,504 6
Water withdrawn (m3) 500,275 527,677 (5)
Waste disposed (kg) 2,253,612 3,136,765 (28)
INDUSTRY GROUP REVIEWCONSUMER FOODS
Natural Capital
The Consumer Foods industry group is one of the largest contributors to the Group’s energy and water footprint given the nature of its operations. Therefore, its impact on natural capital is closely monitored and evaluated against industry-wide best practices and benchmarks. The industry group made continuous improvements to its operations leading to savings in energy, water and other material consumption.
All operations of the businesses, including supply chain management, are carried out as per the Group’s Environmental and Energy Management policy, whilst adhering to, and going beyond, all required environmental laws and regulations through continuous monitoring and testing.
Consumer Foods : 16,484 MT
CARBON FOOTPRINT
The material topics relevant to the Consumer Foods industry group, identified under Natural Capital are as follows:
Energy and emissions management
Water and effluent management
The ensuing section discusses key targets under the aforementioned material topics and its corresponding impacts. The section also entails the various initiatives undertaken with a view to achieving relevant targets.
28%
WASTE DISPOSED
(2017/18: 3,136,765kg)
2,253,612kg

95
Carbon Footprint Scope 1 and 2 per Operational Intensity Factor
2018/19 2017/18
CCS CO2 kg per litre produced 0.1 0.1
KFP CO2 kg per kg of processed meat produced 0.8 0.9
CICL CO2 kg per litre produced 0.5 -
Water Withdrawal per Operational Intensity Factor
2018/19 2017/18
CCS water withdrawn - litres per litre produced 4.9 4.5
KFP water withdrawn - litres per kg of processed meat produced 13.7 17.9
CICL water withdrawn - litres per litre produced 7.1
Waste Generated per Operational Intensity Factor
2018/19 2017/18
CCS waste generated - kg per litre produced 0.02 0.02
KFP waste generated - kg per kg of processed meat produced 0.16 0.18
CICL waste generated - kg per litre produced 0.01
Given the human centric nature of the Consumer Food industry group’s manufacturing operations, significant efforts are made to ensure a safe and healthy environment to all its employees.
Training and development programmes are carried out throughout the industry group to establish workplace health and safety
Human Capital
practices as well as to develop skills and productivity of the employees.
The material topics relevant to the Consumer Foods industry group identified under Human Capital are
Health and safety Training and talent retention
Health and Safety, Training and Talent Retention
Relevance/Implication : Retaining talent and upgrading skills of existing staff towards delivering superior customer service and quality
Targets Initiatives
Provide regular feedback and necessary training and development.
Maintain and encourage healthy working relationship with employee unions through constant dialogue and joint consultative committees.
Minimise occupational health and safety incidents.
Identify and meet the training needs of staff and reduce employee attrition.
Over 700 hours of emergency response training were provided for all factory workers including specific training in case of accidental ammonia or toxic gas releases at CCS Ranala factory.
The industry group continued to provide regular health and safety trainings to its employees, including fire safety and first aid training.
CCS and KFP continued to maintain OHSAS certification and streamlined its organisational processes through continuous monitoring and process improvements to ensure a safe working environment.
The relevance of such material aspects, including initiatives undertaken to meet internal targets are as follows:
Consumer Foods : 1,454
NUMBER OF EMPLOYEES
Impacts through other initiatives:
Changes made to the design of PET bottles resulted in a 25 per cent and 13 per cent reduction of plastic consumption at bottle neck and closure areas as indicated below;
5.10g
3.80g
17.0
0mm
21.0
0mm
MANAGEMENT DISCUSSION AND ANALYSIS
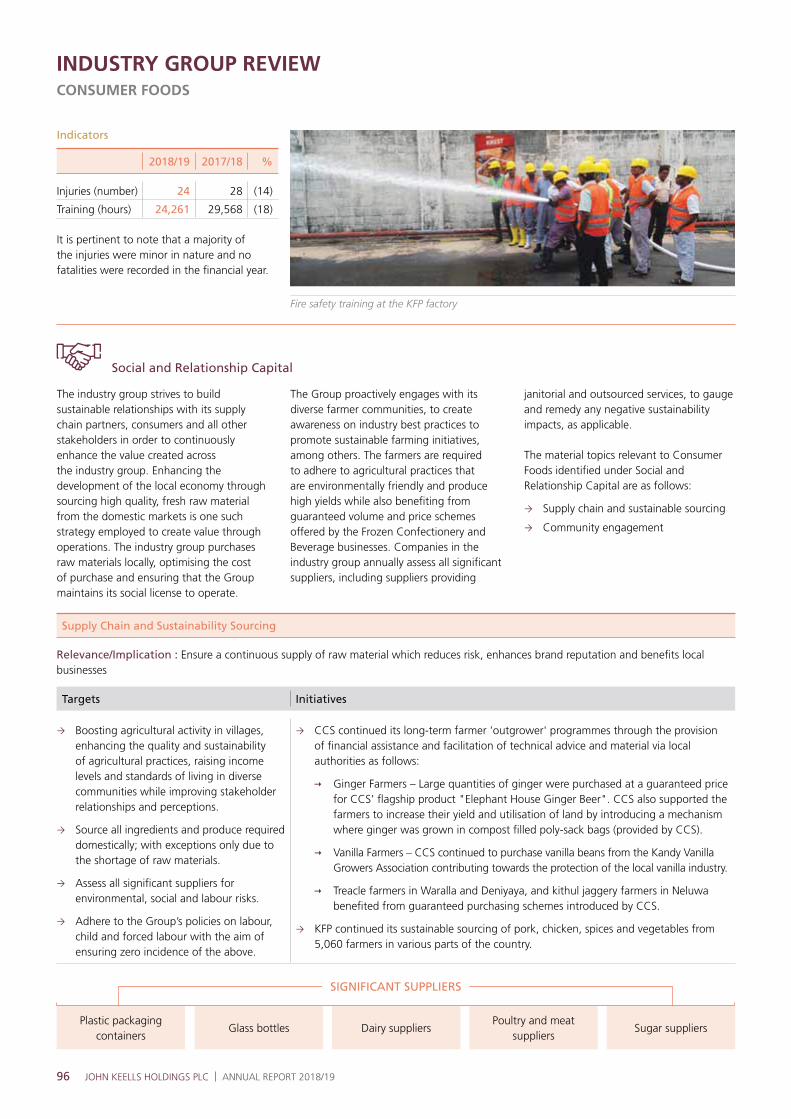
96 JOHN KEELLS HOLDINGS PLC | ANNUAL REPORT 2018/19
INDUSTRY GROUP REVIEWCONSUMER FOODS
Indicators
2018/19 2017/18 %
Injuries (number) 24 28 (14)
Training (hours) 24,261 29,568 (18)
It is pertinent to note that a majority of the injuries were minor in nature and no fatalities were recorded in the financial year.
Social and Relationship Capital
The industry group strives to build sustainable relationships with its supply chain partners, consumers and all other stakeholders in order to continuously enhance the value created across the industry group. Enhancing the development of the local economy through sourcing high quality, fresh raw material from the domestic markets is one such strategy employed to create value through operations. The industry group purchases raw materials locally, optimising the cost of purchase and ensuring that the Group maintains its social license to operate.
The Group proactively engages with its diverse farmer communities, to create awareness on industry best practices to promote sustainable farming initiatives, among others. The farmers are required to adhere to agricultural practices that are environmentally friendly and produce high yields while also benefiting from guaranteed volume and price schemes offered by the Frozen Confectionery and Beverage businesses. Companies in the industry group annually assess all significant suppliers, including suppliers providing
janitorial and outsourced services, to gauge and remedy any negative sustainability impacts, as applicable.
The material topics relevant to Consumer Foods identified under Social and Relationship Capital are as follows:
Supply chain and sustainable sourcing
Community engagement
Supply Chain and Sustainability Sourcing
Relevance/Implication : Ensure a continuous supply of raw material which reduces risk, enhances brand reputation and benefits local businesses
Targets Initiatives
Boosting agricultural activity in villages, enhancing the quality and sustainability of agricultural practices, raising income levels and standards of living in diverse communities while improving stakeholder relationships and perceptions.
Source all ingredients and produce required domestically; with exceptions only due to the shortage of raw materials.
Assess all significant suppliers for environmental, social and labour risks.
Adhere to the Group’s policies on labour, child and forced labour with the aim of ensuring zero incidence of the above.
CCS continued its long-term farmer 'outgrower' programmes through the provision of financial assistance and facilitation of technical advice and material via local authorities as follows:
Ginger Farmers – Large quantities of ginger were purchased at a guaranteed price for CCS’ flagship product "Elephant House Ginger Beer". CCS also supported the farmers to increase their yield and utilisation of land by introducing a mechanism where ginger was grown in compost filled poly-sack bags (provided by CCS).
Vanilla Farmers – CCS continued to purchase vanilla beans from the Kandy Vanilla Growers Association contributing towards the protection of the local vanilla industry.
Treacle farmers in Waralla and Deniyaya, and kithul jaggery farmers in Neluwa benefited from guaranteed purchasing schemes introduced by CCS.
KFP continued its sustainable sourcing of pork, chicken, spices and vegetables from 5,060 farmers in various parts of the country.
SIGNIFICANT SUPPLIERS
Plastic packaging containers
Glass bottlesPoultry and meat
suppliersDairy suppliers Sugar suppliers
Fire safety training at the KFP factory

97
Key impacts from these initiatives are summarised below.
Company Number of Farmers
Total Annual Supply
(Kg’000)
Total Annual Payment
(Rs.million)
KFP 5,060 3,153 952
CCS 2,974 131 205
Product Total Annual Supply (Kg) No. of Farmers
Meat 2,747,572 2,530
Spices 94,928 2,500
Cashew nuts 43,160 1,400
Vanilla 411 1,100
Ginger 23,200 245
Kithul jaggery 29,864 209
Vegetables 310,125 30
Treacle 34,550 20
Community Engagement
Relevance/Implication : Community focus and brand reputation
Targets Initiatives
Build ongoing and sustainable relationships in order to promote social responsibility and integration within the community.
In keeping with the industry group’s strategic focus of promoting health and wellness, CCS continued to support John Keells Foundation’s Vision Project - an island-wide cataract initiative - and the School Vision Screening Programme in the Colombo District implemented in collaboration with the Ministry of Health.
Please refer the Group Consolidated Review for further details - page 54
CCS and KFP launched their respective strategic CSR initiatives in the reporting year as follows:
CCS: An initiative on creating awareness on Sports Medicine among school sportsmen/women towards optimising performance and preventing injury with the objective of improving their overall health and well-being. Conducted in collaboration with the Sri Lanka Sports Medicine Association (affiliated to International Federation of sports medicine), the pilot will involve 6 schools.
KFP: Promoting environment stewardship among school children commencing with the implementation of a waste management system at two schools in proximity to the KFP factory.
Intellectual Capital
Relevance/Implication : Financial, regulatory, brand reputation and business continuity implications
Targets Initiatives
Responsible reformulation of recipes to ensure the highest standard of nutrition and adherence to health regulations and guidelines.
Formulation of new products and portfolio extensions to create value-for-money products.
Ensuring effective and responsible communication of nutrition facts and raw materials used.
Of the 590 SKUs which are manufactured by the industry group:
80 per cent carried information of the ingredients used.
1 per cent carried information on raw material sourcing.
43 per cent and 92 per cent carried information on safe use, and responsible disposal of products, respectively.
The material topics identified under Intellectual Capital are as follows:
Product and service quality Responsible labelling and marketing
communications
Technological enhancements towards enhancing process excellence
The identified targets and initiatives under the identified material topics are summarised as follows;
MANAGEMENT DISCUSSION AND ANALYSIS

98 JOHN KEELLS HOLDINGS PLC | ANNUAL REPORT 2018/19
RETAIL
Fresh produce at the newly-branded "Keells" outlet at Union Place
INDUSTRY GROUP REVIEW
Vision and Scope
The Supermarket business focuses on modern organised retailing through the "Keells" chain of supermarkets and also operates Nexus Mobile, a successful loyalty programme in the country. The Office Automation business comprises of John Keells Office Automation (JKOA), a leading distributor of printers, copiers, smartphones and other office automation equipment.
Contribution to JKH Group
Revenue36%
6%
4%
28%
EBIT
Capital Employed
Carbon Footprint
JayKay Marketing Services (Private) Limited (JMSL) operates the "Keells" chain of modern retail outlets and the Nexus Mobile loyalty programme.
The core purpose of the business is to "Improve the quality of life for the nation".
Operates in 96 locations across the island as at 31 March 2019.
Nexus Mobile loyalty card membership at approximately 1.2 million.
7 collection centres across the island working directly with approximately 2,000 active farmers.
Provides employment to 4,900 Sri Lankans.
Provides a marketplace for approximately 1,000 large and small-scale suppliers.
John Keells Office Automation (JKOA) is the authorised distributor for the following office automation brands:
Sole distributor for Toshiba B&W and colour digital multi-function printers (MFPs), offering managed print solutions and Print-Now-Pay-Later (PNPL) digital copier rental solutions.
National distributor for Samsung smartphones. Authorised distributor for Asus commercial series notebooks.
Samsung laser printers, large format displays (LFD), RISO digital duplicators, RISO Comcolor printers, full colour inkjet printer Posiflex and FEC POS systems, Bixolon receipt and label printers, tabs, accessories, Lava mobiles and Hitachi projectors.
Industry Group Structure
SUPERMARKET BUSINESS OFFICE AUTOMATION BUSINESS
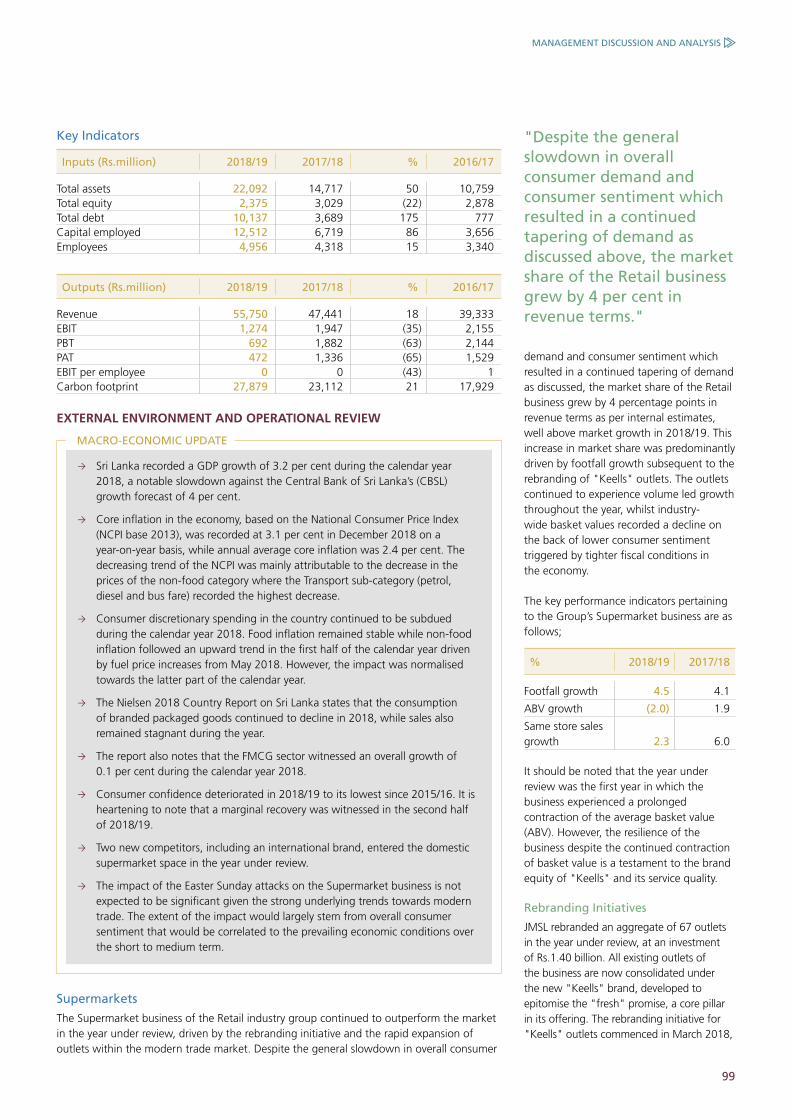
99
Key Indicators
Inputs (Rs.million) 2018/19 2017/18 % 2016/17
Total assets 22,092 14,717 50 10,759 Total equity 2,375 3,029 (22) 2,878 Total debt 10,137 3,689 175 777 Capital employed 12,512 6,719 86 3,656 Employees 4,956 4,318 15 3,340
Outputs (Rs.million) 2018/19 2017/18 % 2016/17
Revenue 55,750 47,441 18 39,333 EBIT 1,274 1,947 (35) 2,155 PBT 692 1,882 (63) 2,144 PAT 472 1,336 (65) 1,529 EBIT per employee 0 0 (43) 1 Carbon footprint 27,879 23,112 21 17,929
EXTERNAL ENVIRONMENT AND OPERATIONAL REVIEW
"Despite the general slowdown in overall consumer demand and consumer sentiment which resulted in a continued tapering of demand as discussed above, the market share of the Retail business grew by 4 per cent in revenue terms."
Sri Lanka recorded a GDP growth of 3.2 per cent during the calendar year 2018, a notable slowdown against the Central Bank of Sri Lanka’s (CBSL) growth forecast of 4 per cent.
Core inflation in the economy, based on the National Consumer Price Index (NCPI base 2013), was recorded at 3.1 per cent in December 2018 on a year-on-year basis, while annual average core inflation was 2.4 per cent. The decreasing trend of the NCPI was mainly attributable to the decrease in the prices of the non-food category where the Transport sub-category (petrol, diesel and bus fare) recorded the highest decrease.
Consumer discretionary spending in the country continued to be subdued during the calendar year 2018. Food inflation remained stable while non-food inflation followed an upward trend in the first half of the calendar year driven by fuel price increases from May 2018. However, the impact was normalised towards the latter part of the calendar year.
The Nielsen 2018 Country Report on Sri Lanka states that the consumption of branded packaged goods continued to decline in 2018, while sales also remained stagnant during the year.
The report also notes that the FMCG sector witnessed an overall growth of 0.1 per cent during the calendar year 2018.
Consumer confidence deteriorated in 2018/19 to its lowest since 2015/16. It is heartening to note that a marginal recovery was witnessed in the second half of 2018/19.
Two new competitors, including an international brand, entered the domestic supermarket space in the year under review.
The impact of the Easter Sunday attacks on the Supermarket business is not expected to be significant given the strong underlying trends towards modern trade. The extent of the impact would largely stem from overall consumer sentiment that would be correlated to the prevailing economic conditions over the short to medium term.
MACRO-ECONOMIC UPDATE
Supermarkets
The Supermarket business of the Retail industry group continued to outperform the market in the year under review, driven by the rebranding initiative and the rapid expansion of outlets within the modern trade market. Despite the general slowdown in overall consumer
demand and consumer sentiment which resulted in a continued tapering of demand as discussed, the market share of the Retail business grew by 4 percentage points in revenue terms as per internal estimates, well above market growth in 2018/19. This increase in market share was predominantly driven by footfall growth subsequent to the rebranding of "Keells" outlets. The outlets continued to experience volume led growth throughout the year, whilst industry-wide basket values recorded a decline on the back of lower consumer sentiment triggered by tighter fiscal conditions in the economy.
The key performance indicators pertaining to the Group’s Supermarket business are as follows;
% 2018/19 2017/18
Footfall growth 4.5 4.1
ABV growth (2.0) 1.9
Same store sales growth 2.3 6.0
It should be noted that the year under review was the first year in which the business experienced a prolonged contraction of the average basket value (ABV). However, the resilience of the business despite the continued contraction of basket value is a testament to the brand equity of "Keells" and its service quality.
Rebranding Initiatives
JMSL rebranded an aggregate of 67 outlets in the year under review, at an investment of Rs.1.40 billion. All existing outlets of the business are now consolidated under the new "Keells" brand, developed to epitomise the "fresh" promise, a core pillar in its offering. The rebranding initiative for "Keells" outlets commenced in March 2018,
MANAGEMENT DISCUSSION AND ANALYSIS
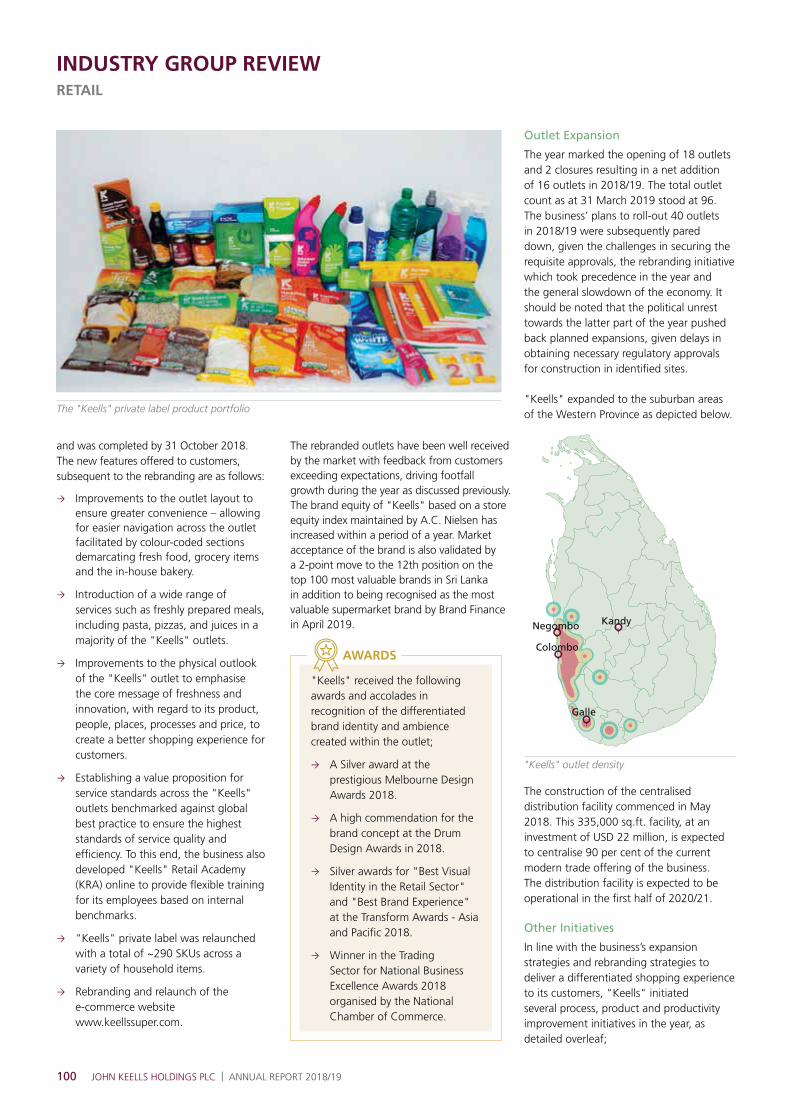
100 JOHN KEELLS HOLDINGS PLC | ANNUAL REPORT 2018/19
INDUSTRY GROUP REVIEWRETAIL
Outlet Expansion
The year marked the opening of 18 outlets and 2 closures resulting in a net addition of 16 outlets in 2018/19. The total outlet count as at 31 March 2019 stood at 96. The business’ plans to roll-out 40 outlets in 2018/19 were subsequently pared down, given the challenges in securing the requisite approvals, the rebranding initiative which took precedence in the year and the general slowdown of the economy. It should be noted that the political unrest towards the latter part of the year pushed back planned expansions, given delays in obtaining necessary regulatory approvals for construction in identified sites.
"Keells" expanded to the suburban areas of the Western Province as depicted below.
The construction of the centralised distribution facility commenced in May 2018. This 335,000 sq.ft. facility, at an investment of USD 22 million, is expected to centralise 90 per cent of the current modern trade offering of the business. The distribution facility is expected to be operational in the first half of 2020/21.
Other Initiatives
In line with the business’s expansion strategies and rebranding strategies to deliver a differentiated shopping experience to its customers, "Keells" initiated several process, product and productivity improvement initiatives in the year, as detailed overleaf;
and was completed by 31 October 2018. The new features offered to customers, subsequent to the rebranding are as follows:
Improvements to the outlet layout to ensure greater convenience – allowing for easier navigation across the outlet facilitated by colour-coded sections demarcating fresh food, grocery items and the in-house bakery.
Introduction of a wide range of services such as freshly prepared meals, including pasta, pizzas, and juices in a majority of the "Keells" outlets.
Improvements to the physical outlook of the "Keells" outlet to emphasise the core message of freshness and innovation, with regard to its product, people, places, processes and price, to create a better shopping experience for customers.
Establishing a value proposition for service standards across the "Keells" outlets benchmarked against global best practice to ensure the highest standards of service quality and efficiency. To this end, the business also developed "Keells" Retail Academy (KRA) online to provide flexible training for its employees based on internal benchmarks.
"Keells" private label was relaunched with a total of ~290 SKUs across a variety of household items.
Rebranding and relaunch of the e-commerce website www.keellssuper.com.
The "Keells" private label product portfolio
"Keells" outlet density
The rebranded outlets have been well received by the market with feedback from customers exceeding expectations, driving footfall growth during the year as discussed previously. The brand equity of "Keells" based on a store equity index maintained by A.C. Nielsen has increased within a period of a year. Market acceptance of the brand is also validated by a 2-point move to the 12th position on the top 100 most valuable brands in Sri Lanka in addition to being recognised as the most valuable supermarket brand by Brand Finance in April 2019.
"Keells" received the following awards and accolades in recognition of the differentiated brand identity and ambience created within the outlet;
A Silver award at the prestigious Melbourne Design Awards 2018.
A high commendation for the brand concept at the Drum Design Awards in 2018.
Silver awards for "Best Visual Identity in the Retail Sector" and "Best Brand Experience" at the Transform Awards - Asia and Pacific 2018.
Winner in the Trading Sector for National Business Excellence Awards 2018 organised by the National Chamber of Commerce.
AWARDS
Negombo Kandy
Colombo
Galle

101
Markforged printers are the only suite of printers in the world which leverage a composite technology to create parts far stronger than other printed plastics. The 3D printer product line – Mark X, Mark Two, Onyx Series, Metal X, and Eiger Software – promises a system which is integrated across hardware, software, and material to produce a dependable, tough, and perceptive experience. The Metal X is the company’s first metal 3D printer which employs Markforged’s atomic diffusion additive manufacturing (ADAM) process.
INSIGHTS
Product Initiatives
"Keells" relaunched its private label products across several segments of the modern trade offering in line with the rebranding initiative. The private label product range now includes FMCG products such as water, condiments, tea and household items such as detergent, paper goods and stationery. It should be noted that subsequent to the relaunch, private label sales account for 7 per cent of total revenue.
The business also launched its "Freshness guaranteed: Double your money back" initiative, reflecting the brand’s commitment towards providing good quality fresh produce.
Process and Productivity Initiatives
The Supermarket business consolidated its supply chain with its investment in a state-of-the-art Enterprise Warehouse Management System (EMS) in January 2019. The new system, which is the first implementation of this nature in South Asia, is expected to improve productivity in the logistics operation whilst providing the capacity and expertise to handle higher volumes for the planned expansions.
During the year under review, "Keells" also installed solar panel systems in 33 outlets as a part of an ongoing Group Sustainability initiative to generate energy through renewable resources.
Refer the Natural Capital section of this Review - page 104
Office Automation
The slowdown in general consumer sentiment and continued tapering of consumer demand in the market impacted the performance of JKOA in the year under review. JKOA was also significantly impacted by the steep depreciation of the Rupee against the Dollar.
Against this backdrop, JKOA recorded a volume decline in its mobile phone category, compounded by the low money circulation in the economy which led to lower secondary sales. The impact on the mobile phone volumes were partially negated by the introduction of Samsung "M series" and "A series" phones, at an attractive price
range. Samsung premium models "Note 9" and "Galaxy S10" were also launched during the year and were well received.
The copier and printer verticals also recorded a reduction in volumes in the year under review as a result of the general slowdown of the economy. However, it should be noted that JKOA continued to maintain its market leadership position within the verticals in the year under review. JKOA launched the Markforged range of 3D printers in 2018/19. As the authorised reseller of Markforged 3D printers in Sri Lanka, JKOA provides sales, service maintenance, and support for its line of technologically-advanced 3D printers.
JKOA showroom
across key stakeholders. This system will ensure the elimination of inefficient paper trails whilst mobile applications will be the key focus in order to better after sales services and improve customer satisfaction.
Mobile application – provides online information to field engineers and reduces paper trail.
Customer portal – customers can create accounts to view the status of their repair history and registered products.
Automatic ticket assignment to engineers – requests created by consumers via the portal are assigned to engineers based on skill level.
STRATEGY AND OUTLOOKSupermarkets
The outlook for the modern trade industry retains promise of sustained growth from a steady migration from general trade driven by demand for convenience, quality and value for money and the growth expectations for domestic consumer demand and GDP growth. Growth forecasts for consumer demand and consumer sentiment for 2019/20 has been on an upward trend on the back of strengthening domestic macro-economic conditions, and modest budgetary concessions.
The Supermarket business maintains a positive outlook for the ensuing year, driven by improving sales and footfall growth at "Keells" outlets, coupled with high brand equity.
Given the wide offering in a modern trade outlet and the average basket of the modern trade consumer consisting of household necessities, namely food
In line with the Group’s value proposition to improve customer service, convenience and efficiency, JKOA deployed a cloud based SAP Hybris system to facilitate faster and efficient customer engagement by enabling visibility into online real time information
MANAGEMENT DISCUSSION AND ANALYSIS
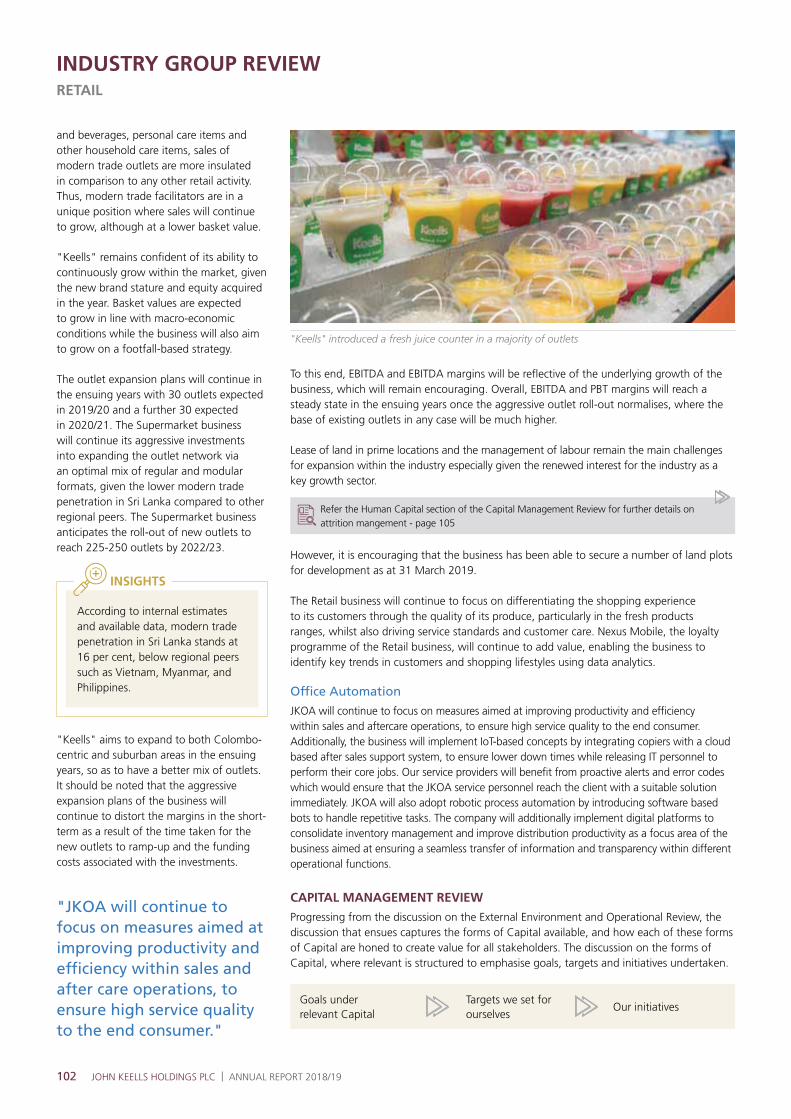
102 JOHN KEELLS HOLDINGS PLC | ANNUAL REPORT 2018/19
INDUSTRY GROUP REVIEWRETAIL
To this end, EBITDA and EBITDA margins will be reflective of the underlying growth of the business, which will remain encouraging. Overall, EBITDA and PBT margins will reach a steady state in the ensuing years once the aggressive outlet roll-out normalises, where the base of existing outlets in any case will be much higher.
Lease of land in prime locations and the management of labour remain the main challenges for expansion within the industry especially given the renewed interest for the industry as a key growth sector.
Refer the Human Capital section of the Capital Management Review for further details on attrition mangement - page 105
However, it is encouraging that the business has been able to secure a number of land plots for development as at 31 March 2019.
The Retail business will continue to focus on differentiating the shopping experience to its customers through the quality of its produce, particularly in the fresh products ranges, whilst also driving service standards and customer care. Nexus Mobile, the loyalty programme of the Retail business, will continue to add value, enabling the business to identify key trends in customers and shopping lifestyles using data analytics.
Office Automation
JKOA will continue to focus on measures aimed at improving productivity and efficiency within sales and aftercare operations, to ensure high service quality to the end consumer. Additionally, the business will implement IoT-based concepts by integrating copiers with a cloud based after sales support system, to ensure lower down times while releasing IT personnel to perform their core jobs. Our service providers will benefit from proactive alerts and error codes which would ensure that the JKOA service personnel reach the client with a suitable solution immediately. JKOA will also adopt robotic process automation by introducing software based bots to handle repetitive tasks. The company will additionally implement digital platforms to consolidate inventory management and improve distribution productivity as a focus area of the business aimed at ensuring a seamless transfer of information and transparency within different operational functions.
CAPITAL MANAGEMENT REVIEW
Progressing from the discussion on the External Environment and Operational Review, the discussion that ensues captures the forms of Capital available, and how each of these forms of Capital are honed to create value for all stakeholders. The discussion on the forms of Capital, where relevant is structured to emphasise goals, targets and initiatives undertaken.
Goals under relevant Capital
Targets we set for ourselves
Our initiatives
"JKOA will continue to focus on measures aimed at improving productivity and efficiency within sales and after care operations, to ensure high service quality to the end consumer."
and beverages, personal care items and other household care items, sales of modern trade outlets are more insulated in comparison to any other retail activity. Thus, modern trade facilitators are in a unique position where sales will continue to grow, although at a lower basket value.
"Keells" remains confident of its ability to continuously grow within the market, given the new brand stature and equity acquired in the year. Basket values are expected to grow in line with macro-economic conditions while the business will also aim to grow on a footfall-based strategy.
The outlet expansion plans will continue in the ensuing years with 30 outlets expected in 2019/20 and a further 30 expected in 2020/21. The Supermarket business will continue its aggressive investments into expanding the outlet network via an optimal mix of regular and modular formats, given the lower modern trade penetration in Sri Lanka compared to other regional peers. The Supermarket business anticipates the roll-out of new outlets to reach 225-250 outlets by 2022/23.
According to internal estimates and available data, modern trade penetration in Sri Lanka stands at 16 per cent, below regional peers such as Vietnam, Myanmar, and Philippines.
INSIGHTS
"Keells" aims to expand to both Colombo-centric and suburban areas in the ensuing years, so as to have a better mix of outlets. It should be noted that the aggressive expansion plans of the business will continue to distort the margins in the short-term as a result of the time taken for the new outlets to ramp-up and the funding costs associated with the investments.
"Keells" introduced a fresh juice counter in a majority of outlets

103
Financial and Manufactured Capital
Revenue (Rs.million) 2018/19 2017/18 %
Total 55,750 47,441 18
Supermarket business (JMSL) 45,538 37,590 21
Office Automation business (JKOA) 10,212 9,851 4
Revenue growth of the Supermarket business was driven by the incremental revenue generated from newly opened outlets and growth in same store footfall.
Revenue growth in JKOA was driven by the higher selling prices in the Mobile Phone category as a result of the depreciation of the Rupee against the Dollar.
EBITDA (Rs.million) 2018/19 2017/18 %
Total 2,146 2,520 (15)
Supermarket business (JMSL) 1,623 1,975 (18)
Office Automation business (JKOA) 523 545 (4)
The decrease in EBITDA of the industry group was driven by the Supermarket business as a result of the one-off refit and rebranding costs, the capacity building in preparation for the outlet roll-out and the higher cost base as a result of the new outlets where revenue is yet to ramp-up to its potential.
The blended margins in the ensuing year are expected to improve as a result of the benefit of a larger base of existing outlets showing an improvement in the performance. However, there may be a certain dilutive effect on margins due to the opening of new outlets, where margins are typically lower in the first 12 months of operations, increasing thereafter, as sales ramp-up in the second and third years’ of operations.
Although, the Supermarket business is a low margin business in nature, the margins for the year under review were further eroded as a result of the one-off costs related to the rebranding and refit amounting to Rs.275 million.
It should be noted that the total capitalised cost pertaining to the rebranding initiative amounted to Rs.1.35 billion in 2018/19 and was funded by short-term borrowing facilities.
The EBITDA of the Office Automation business was impacted by exchange losses recorded on its inventory during the year as a result of the depreciation of the Rupee against the Dollar.
PBT (Rs.million) 2018/19 2017/18 %
Total 692 1,882 (63)
Supermarket business (JMSL) 472 1,497 (68)
Office Automation business (JKOA) 220 385 (43)
In addition to the factors impacting EBITDA as discussed above, PBT was further impacted by significantly higher interest expenses based on the planned funding strategy of the outlet expansion, and higher depreciation as a result of the higher outlet count both of which collectively accounted for Rs.1.15 billion compared to Rs.478 million incurred in 2017/18.
Depreciation in the Office Automation business increased 23 per cent as a result of the higher Print Now Pay Later (PNPL) machine base, while finance costs increased as a result of increased debt, as discussed below.
Assets (Rs.million) 2018/19 2017/18 %
Total 22,092 14,717 50
Supermarket business (JMSL) 17,863 12,057 48
Office Automation business (JKOA) 4,229 2,660 59
Total assets of the Supermarket business increased by 48 per cent whilst total debt increased by 181 per cent in 2018/19. The increase in the assets was driven by the outlet expansions and the refit programme which took place in the year under review.
Assets pertaining to the Office Automation business increased as a result of an increase in inventory and the increase in the PNPL machinery base.
MANAGEMENT DISCUSSION AND ANALYSIS
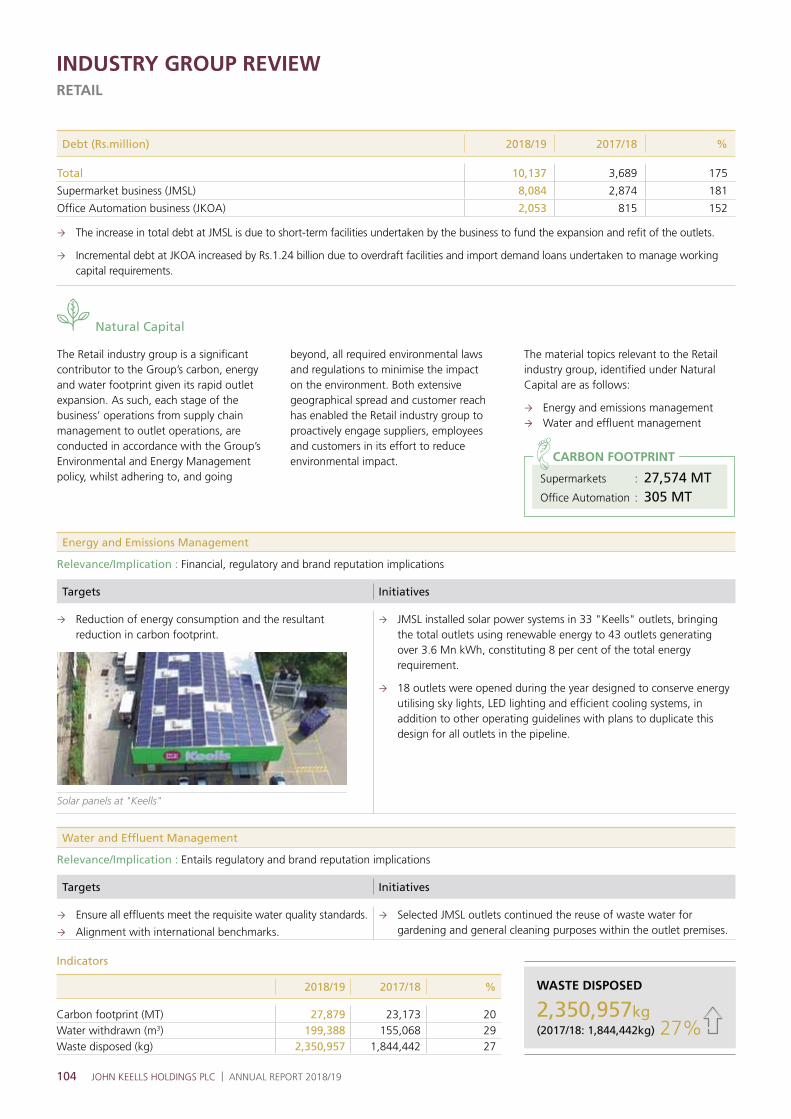
104 JOHN KEELLS HOLDINGS PLC | ANNUAL REPORT 2018/19
Natural Capital
The Retail industry group is a significant contributor to the Group’s carbon, energy and water footprint given its rapid outlet expansion. As such, each stage of the business’ operations from supply chain management to outlet operations, are conducted in accordance with the Group’s Environmental and Energy Management policy, whilst adhering to, and going
beyond, all required environmental laws and regulations to minimise the impact on the environment. Both extensive geographical spread and customer reach has enabled the Retail industry group to proactively engage suppliers, employees and customers in its effort to reduce environmental impact.
Supermarkets : 27,574 MTOffice Automation : 305 MT
CARBON FOOTPRINT
INDUSTRY GROUP REVIEWRETAIL
Indicators
2018/19 2017/18 %
Carbon footprint (MT) 27,879 23,173 20Water withdrawn (m3) 199,388 155,068 29Waste disposed (kg) 2,350,957 1,844,442 27
Energy and Emissions Management
Relevance/Implication : Financial, regulatory and brand reputation implications
Targets Initiatives
Reduction of energy consumption and the resultant reduction in carbon footprint.
Solar panels at "Keells"
JMSL installed solar power systems in 33 "Keells" outlets, bringing the total outlets using renewable energy to 43 outlets generating over 3.6 Mn kWh, constituting 8 per cent of the total energy requirement.
18 outlets were opened during the year designed to conserve energy utilising sky lights, LED lighting and efficient cooling systems, in addition to other operating guidelines with plans to duplicate this design for all outlets in the pipeline.
Water and Effluent Management
Relevance/Implication : Entails regulatory and brand reputation implications
Targets Initiatives
Ensure all effluents meet the requisite water quality standards.
Alignment with international benchmarks.
Selected JMSL outlets continued the reuse of waste water for gardening and general cleaning purposes within the outlet premises.
Debt (Rs.million) 2018/19 2017/18 %
Total 10,137 3,689 175
Supermarket business (JMSL) 8,084 2,874 181
Office Automation business (JKOA) 2,053 815 152
The increase in total debt at JMSL is due to short-term facilities undertaken by the business to fund the expansion and refit of the outlets.
Incremental debt at JKOA increased by Rs.1.24 billion due to overdraft facilities and import demand loans undertaken to manage working capital requirements.
The material topics relevant to the Retail industry group, identified under Natural Capital are as follows:
Energy and emissions management Water and effluent management
27%
WASTE DISPOSED
(2017/18: 1,844,442kg)
2,350,957kg
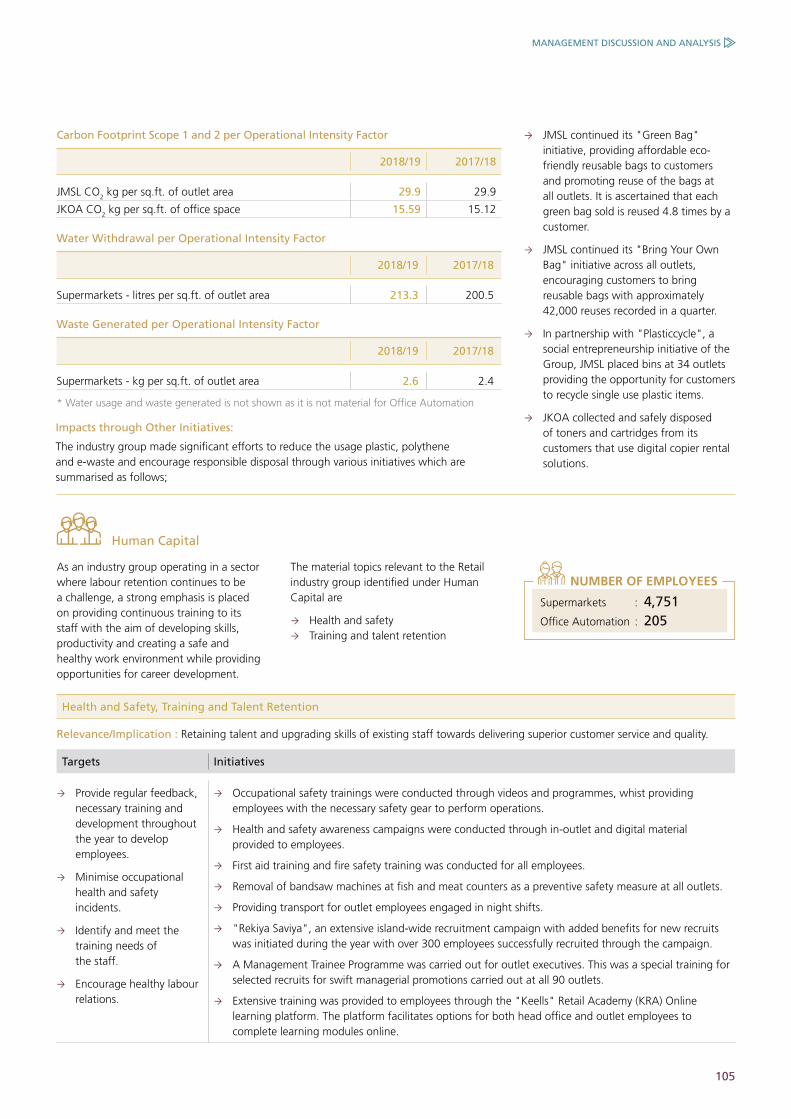
105
Carbon Footprint Scope 1 and 2 per Operational Intensity Factor
2018/19 2017/18
JMSL CO2 kg per sq.ft. of outlet area 29.9 29.9
JKOA CO2 kg per sq.ft. of office space 15.59 15.12
Water Withdrawal per Operational Intensity Factor
2018/19 2017/18
Supermarkets - litres per sq.ft. of outlet area 213.3 200.5
Waste Generated per Operational Intensity Factor
2018/19 2017/18
Supermarkets - kg per sq.ft. of outlet area 2.6 2.4
* Water usage and waste generated is not shown as it is not material for Office Automation
Impacts through Other Initiatives:
The industry group made significant efforts to reduce the usage plastic, polythene and e-waste and encourage responsible disposal through various initiatives which are summarised as follows;
JMSL continued its "Green Bag" initiative, providing affordable eco-friendly reusable bags to customers and promoting reuse of the bags at all outlets. It is ascertained that each green bag sold is reused 4.8 times by a customer.
JMSL continued its "Bring Your Own Bag" initiative across all outlets, encouraging customers to bring reusable bags with approximately 42,000 reuses recorded in a quarter.
In partnership with "Plasticcycle", a social entrepreneurship initiative of the Group, JMSL placed bins at 34 outlets providing the opportunity for customers to recycle single use plastic items.
JKOA collected and safely disposed of toners and cartridges from its customers that use digital copier rental solutions.
As an industry group operating in a sector where labour retention continues to be a challenge, a strong emphasis is placed on providing continuous training to its staff with the aim of developing skills, productivity and creating a safe and healthy work environment while providing opportunities for career development.
Human Capital
The material topics relevant to the Retail industry group identified under Human Capital are
Health and safety Training and talent retention
Supermarkets : 4,751Office Automation : 205
NUMBER OF EMPLOYEES
Health and Safety, Training and Talent Retention
Relevance/Implication : Retaining talent and upgrading skills of existing staff towards delivering superior customer service and quality.
Targets Initiatives
Provide regular feedback, necessary training and development throughout the year to develop employees.
Minimise occupational health and safety incidents.
Identify and meet the training needs of the staff.
Encourage healthy labour relations.
Occupational safety trainings were conducted through videos and programmes, whist providing employees with the necessary safety gear to perform operations.
Health and safety awareness campaigns were conducted through in-outlet and digital material provided to employees.
First aid training and fire safety training was conducted for all employees.
Removal of bandsaw machines at fish and meat counters as a preventive safety measure at all outlets.
Providing transport for outlet employees engaged in night shifts.
"Rekiya Saviya", an extensive island-wide recruitment campaign with added benefits for new recruits was initiated during the year with over 300 employees successfully recruited through the campaign.
A Management Trainee Programme was carried out for outlet executives. This was a special training for selected recruits for swift managerial promotions carried out at all 90 outlets.
Extensive training was provided to employees through the "Keells" Retail Academy (KRA) Online learning platform. The platform facilitates options for both head office and outlet employees to complete learning modules online.
MANAGEMENT DISCUSSION AND ANALYSIS
106 JOHN KEELLS HOLDINGS PLC | ANNUAL REPORT 2018/19
Indicators
It is pertinent to note that a majority of the injuries were minor in nature and no fatalities were recorded pertaining to the job.
2018/19 2017/18 %
Injuries (number) 63 64 (2)
Training (hours) 330,275 307,569 7
INDUSTRY GROUP REVIEWRETAIL
Social and Relationship Capital
The Retail industry group strives to build sustainable and mutually-beneficial relationships with its supply chain partners, consumers and all other stakeholders in order to continuously enhance the value created across the industry group. Sourcing high quality fresh produce while strengthening the development of the local economy, and focusing on educational needs of the communities the
industry group operating in, are some of the strategies employed to create value through operations.
The Group proactively engages with its diverse farmer communities, to create awareness on industry best practices to promote sustainable farming initiatives, among others. The farmers are required to adhere to agricultural practices that are environmentally friendly and produce high
yields. The industry group annually assess all significant suppliers, including suppliers providing janitorial and outsourced services, to gauge and remedy any negative sustainability impacts, as applicable.
The material topics relevant to the Retail industry group identified under Social and Relationship Capital are as follows:
Supply chain and sustainable sourcing Community engagement
Supply Chain and Sustainable Sourcing
Relevance/Implication : Ensure a continuous supply of raw material which reduces risk, enhances brand reputation and benefits local businesses.
Targets Initiatives
Boosting agricultural activity in villages, enhancing the quality and sustainability of agricultural practices, raising income levels and standards of living in diverse communities while improving stakeholder relationships and perceptions.
Assess all significant suppliers for environmental, social and labour risks.
Adhere to the Group’s policies on labour, child and forced labour with the aim of ensuring no such instances.
The Supermarket business continued its sustainable sourcing initiatives targeting improvements in the fresh produce supply chain. Free soil tests and technical assistance through helplines were provided to farmers in the Central and Northern provinces. Some of the other key activities carried out are listed below:
A programme titled "Good Manufacturing Practices (GMP) Certification" was organised for a number of small-scale suppliers.
Continuous adoption of best practice on raw material sourcing ensuring quality of produce is maintained in terms of freshness, size, and appearance resulting in farmers providing the best of the harvest to the collection centres.
Community bays for local small and medium-scale suppliers to display and market their products at "Keells" outlets with an annual sale of Rs.320,000.
Introduction of a scheme to provide exercise books by Atlas for every 2 kg worth of used exercise or text books collected in collection bins placed at 10 "Keells" outlets.
The significant suppliers within the industry group are illustrated below:
SIGNIFICANT SUPPLIERS
Dry food product suppliers
Frozen and chilled products
Vegetable and fruit farmers
JanitorsFresh meat suppliers
Household items
SecurityThird party
tenants (within premises)
" 'Rekiya Saviya', an extensive island-wide recruitment campaign with added benefits for new recruits was initiated during the year"

107
Company Number of Farmers Total Annual Supply (Kg’000) Total Annual Payment (Rs.million)
JMSL 2,563 22,233 2,797
Community Engagement
Relevance/Implication : Community focus and brand reputation.
Targets Initiatives
Build ongoing and sustainable relationships in order to promote social responsibility and integration within the community.
Education - JMSL continued to support two initiatives under John Keells Foundation’s education pillar.
92 students in schools in and around Sooriyawewa and Welimada where "Keells" collection centres are based received an opportunity to engage in a 4 month long English language scholarship programme under the John Keells English Language Scholarship Programme.
Further, 12 students in and around areas in which "Keells" has established a business presence in terms of outlets and supplier bases were provided scholarships under John Keells Foundation’s Higher Education Scholarship Programme as a means of encouraging deserving candidates to pursue Advanced Level and University studies.
Other initiatives -
Disaster Relief- JMSL carried out disaster relief efforts impacting 500+ families in Madampe by matching customer donations / contributions by a ratio of 1:1.
In addition, JMSL was a funding partner of the following initiatives of John Keells Foundation:
John Keells English Language Scholarship Programme Higher Education Scholarship Programme Village Adoption – Mullaitivu AYATI Supported Employment Unit focused on steering the employment/vocation related goals
of children with disabilities
As part of an ongoing CSR initiative, JKOA continued maintenance activities on the four 1,000L-1,500L water purifiers donated to 2 schools over the last two years. This initiative seeks to provide clean water to areas affected by arsenic disease impacting 1,500 – 2,000 children.
In addition, JKOA was a funding partner of the Foundation’s Village Adoption Project – Mullaitivu.
Refer the Group Consolidated Review - page 52
Intellectual Capital
Relevance/Implication : Financial, regulatory, brand reputation and business continuity implications.
Targets Initiatives
Formulation of new products and portfolio extensions to create value for money products and services.
Ensuring effective and responsible marketing communication.
Strategic partnerships and certifications.
JMSL obtained SLS certification for over 78 "Keells" outlets and in-outlet bakeries.
Of the 289 stock keeping units which are sourced by JMSL for private labelling; 60 per cent carried information on the ingredients use, 1 per cent carried information on raw material sourcing, 28 per cent and 95 per cent carried information on safe use, and responsible disposal of
products, respectively.
JKOA continued to operate as the authorised distributor of mobile devices for Samsung in the country whilst also maintaining a product portfolio of other world-renowned brands.
The Retail industry group constantly strives for excellence in its product and service quality. JMSL ensured ethical sourcing of fresh high quality produce and world-class services to consumers, whilst office automation strengthened strategic
partnerships as an authorised distributor in the country. JMSL continues to adhere to standards stipulated by the Sri Lanka Standards Institute and are on par with international best practice with respect to process excellence.
The material topics identified under Intellectual capital are as follows:
Product and service quality Responsible labelling and marketing
communications
MANAGEMENT DISCUSSION AND ANALYSIS
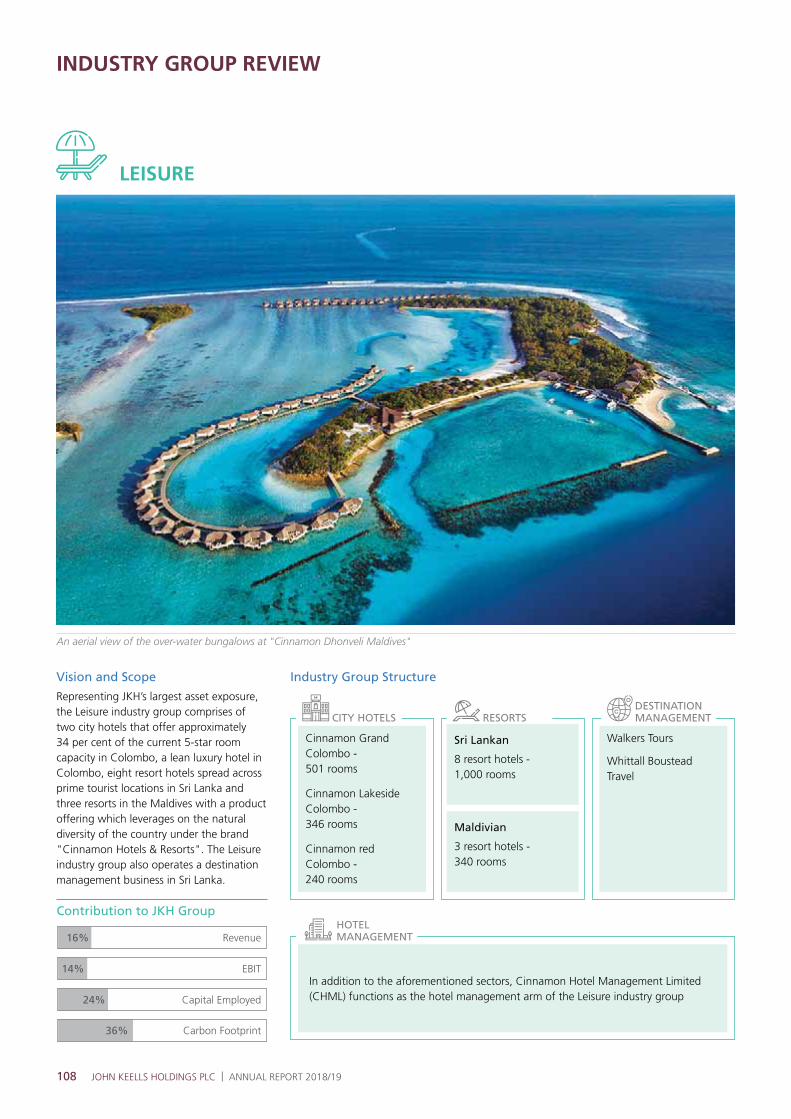
108 JOHN KEELLS HOLDINGS PLC | ANNUAL REPORT 2018/19
Maldivian
3 resort hotels - 340 rooms
LEISURE
An aerial view of the over-water bungalows at "Cinnamon Dhonveli Maldives"
Cinnamon Grand Colombo - 501 rooms
Cinnamon Lakeside Colombo - 346 rooms
Cinnamon red Colombo - 240 rooms
Sri Lankan
8 resort hotels - 1,000 rooms
Walkers Tours
Whittall Boustead Travel
Industry Group StructureVision and Scope
Representing JKH’s largest asset exposure, the Leisure industry group comprises of two city hotels that offer approximately 34 per cent of the current 5-star room capacity in Colombo, a lean luxury hotel in Colombo, eight resort hotels spread across prime tourist locations in Sri Lanka and three resorts in the Maldives with a product offering which leverages on the natural diversity of the country under the brand "Cinnamon Hotels & Resorts". The Leisure industry group also operates a destination management business in Sri Lanka.
CITY HOTELS RESORTSDESTINATION MANAGEMENT
HOTEL MANAGEMENT
Contribution to JKH Group
Revenue16%
14%
24%
36%
EBIT
Capital Employed
Carbon Footprint
INDUSTRY GROUP REVIEW
In addition to the aforementioned sectors, Cinnamon Hotel Management Limited (CHML) functions as the hotel management arm of the Leisure industry group

109
Key Indicators
Inputs (Rs.million) 2018/19 2017/18 % 2016/17
Total assets 78,681 73,445 7 71,996 Total equity 62,201 58,585 6 60,690 Total debt 6,093 5,154 18 5,874 Capital Employed 1 68,294 63,739 7 66,564 Employees (number) 2 4,434 4,823 (8) 5,041
Outputs (Rs.million) 2018/19 2017/18 % 2016/17
Revenue 3 24,113 25,298 (5) 26,136 EBIT 2,895 4,125 (30) 5,924 PBT 2,629 3,909 (33) 5,721 PAT 2,233 3,343 (33) 5,008 EBIT per employee 1 1 (24) 1 Carbon footprint (MT) 35,382 38,835 (9) 40,670
1. For equity accounted investees the capital employed is representative of the Group’s equity investment in these companies
2. As per the sustainability reporting boundary 3. Revenue is inclusive of the Group’s share of equity accounted investees
EXTERNAL ENVIRONMENT AND OPERATIONAL REVIEW
Industry Specific Indicators
Sri Lanka recorded tourist arrivals of 2,333,796 in CY2018, an increase of 10 per cent against CY2017.
The industry recorded total earnings of USD 4.38 billion in CY2018 [CY2017: USD 3.92 billion].
Average room nights per tourist were recorded at 10.8 nights in the calendar year as published by the Sri Lanka Tourism Development Authority (SLTDA), a marginal change compared to the 10.9 room nights recorded in the previous year.
Direct employment generated from the tourism industry increased by 8 per cent to 169,003 in CY2018 [CY2017: 156,369].
Average receipts per tourist per day increased to USD 174 in CY2018 from USD 170 in CY2017, an increase of 2 per cent in USD terms, however, this represents a significant increase of Rupee equivalent receipts considering the 19 per cent depreciation of the Rupee during the year.
SLTDA has granted approvals for the construction of 18,760 new rooms as at end December 2018, with a total investment value of USD 2.90 billion.
Other Developments
Sri Lanka launched a new destination marketing campaign and brand titled "So Sri Lanka" in November 2018.
Sri Lanka was recognised as a leading destination for travel and tourism by varied entities:
Named as the number one destination to travel in 2019 by Lonely Planet.
Asia’s leading adventure tourism destination at the World Travel Awards 2018.
The volatile political environment in the fourth quarter of the calendar year 2018 resulted in the issuance of adverse travel advisories from key tourism markets and impacted arrivals; the crisis was resolved in mid-December 2018, following which arrivals witnessed a recovery.
A series of coordinated bombings took place in the country, on Easter Sunday, 21 April 2019. The attacks targeted several religious establishments and three city hotels including "Cinnamon Grand Colombo".
Sri Lanka piloted a "visa on arrival" scheme for 39 selected countries, effective from May 2019, to promote arrivals during the off-season period. Implementation of this was however suspended subsequent to the Easter Sunday attacks.
Budget Proposals 2019
Nation Building Tax (NBT) of 2 per cent to be exempted on foreign currency receipts of tourist hotels.
Hotels and similar establishments offering more than 5 rooms per property can only accept online bookings/reservations through websites, only if such establishments are registered with the SLTDA, effective from 1 April 2020.
Mandatory requirement for travel agents to remit funds to hotels in US Dollars when invoiced in US Dollars.
Applicable Cess rates to be reduced on selected items and other concessionary benefits to support the refurbishment of hotels.
ESC rate for companies predominantly engaged in promotion of tourism will be reduced from 0.5 per cent to 0.25 per cent.
MACRO-ECONOMIC UPDATE
"Sri Lanka was recognised as a leading destination for travel and tourism by varied entities:
The number one destination to travel in 2019 by Lonely Planet.
Asia’s leading adventure tourism destination at the World Travel Awards 2018."
MANAGEMENT DISCUSSION AND ANALYSIS
REVENUE
(2017/18: Rs.25.30 bn)
Rs.24.11bn5%
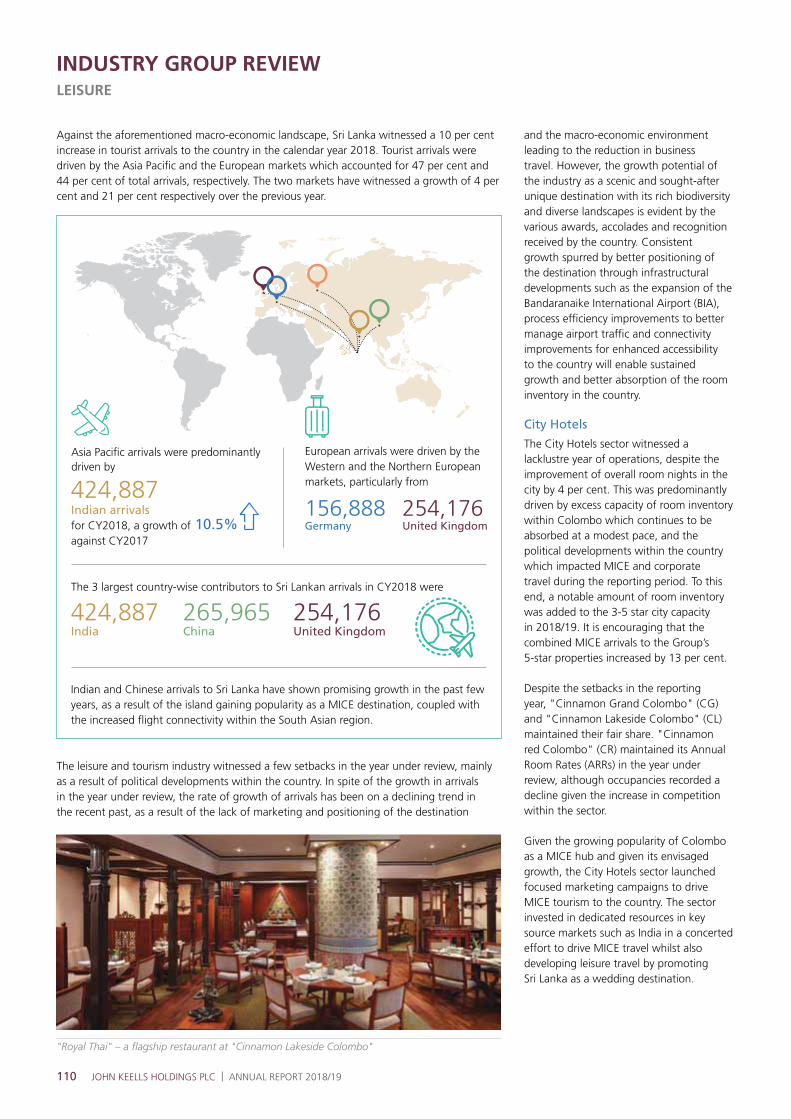
110 JOHN KEELLS HOLDINGS PLC | ANNUAL REPORT 2018/19
INDUSTRY GROUP REVIEWLEISURE
Against the aforementioned macro-economic landscape, Sri Lanka witnessed a 10 per cent increase in tourist arrivals to the country in the calendar year 2018. Tourist arrivals were driven by the Asia Pacific and the European markets which accounted for 47 per cent and 44 per cent of total arrivals, respectively. The two markets have witnessed a growth of 4 per cent and 21 per cent respectively over the previous year.
and the macro-economic environment leading to the reduction in business travel. However, the growth potential of the industry as a scenic and sought-after unique destination with its rich biodiversity and diverse landscapes is evident by the various awards, accolades and recognition received by the country. Consistent growth spurred by better positioning of the destination through infrastructural developments such as the expansion of the Bandaranaike International Airport (BIA), process efficiency improvements to better manage airport traffic and connectivity improvements for enhanced accessibility to the country will enable sustained growth and better absorption of the room inventory in the country.
City Hotels
The City Hotels sector witnessed a lacklustre year of operations, despite the improvement of overall room nights in the city by 4 per cent. This was predominantly driven by excess capacity of room inventory within Colombo which continues to be absorbed at a modest pace, and the political developments within the country which impacted MICE and corporate travel during the reporting period. To this end, a notable amount of room inventory was added to the 3-5 star city capacity in 2018/19. It is encouraging that the combined MICE arrivals to the Group’s 5-star properties increased by 13 per cent.
Despite the setbacks in the reporting year, "Cinnamon Grand Colombo" (CG)and "Cinnamon Lakeside Colombo" (CL)maintained their fair share. "Cinnamon red Colombo" (CR) maintained its Annual Room Rates (ARRs) in the year under review, although occupancies recorded a decline given the increase in competition within the sector.
Given the growing popularity of Colombo as a MICE hub and given its envisaged growth, the City Hotels sector launched focused marketing campaigns to drive MICE tourism to the country. The sector invested in dedicated resources in key source markets such as India in a concerted effort to drive MICE travel whilst also developing leisure travel by promoting Sri Lanka as a wedding destination.
The leisure and tourism industry witnessed a few setbacks in the year under review, mainly as a result of political developments within the country. In spite of the growth in arrivals in the year under review, the rate of growth of arrivals has been on a declining trend in the recent past, as a result of the lack of marketing and positioning of the destination
"Royal Thai" – a flagship restaurant at "Cinnamon Lakeside Colombo"
424,887156,888
424,887 265,965 254,176
254,176
European arrivals were driven by the Western and the Northern European markets, particularly from
Indian arrivals for CY2018, a growth of against CY2017
Asia Pacific arrivals were predominantly driven by
10.5% Germany
India China United Kingdom
United Kingdom
The 3 largest country-wise contributors to Sri Lankan arrivals in CY2018 were
Indian and Chinese arrivals to Sri Lanka have shown promising growth in the past few years, as a result of the island gaining popularity as a MICE destination, coupled with the increased flight connectivity within the South Asian region.

111
Key indicators pertaining to the Group’s City Hotel sector are as follows;
City Hotels Average Room Rate (USD) Occupancy (%)
2018/19 2017/18 2018/19 2017/18
Cinnamon Grand Colombo 128 129 48 65
Cinnamon Lakeside Colombo 127 124 49 63
City Hotels sector (excluding Cinnamon red Colombo) 128 127 48 64
Despite the significant increase in the food and beverage offering within the city, the City Hotels sector continued to place emphasis on quality and service in its offering of 21 restaurants collectively run by the three properties.
A series of coordinated attacks took place in the country on Easter Sunday, 21 April 2019, targeting several religious establishments and three city hotels, including the Group’s flagship City Hotel property, "Cinnamon Grand Colombo". The explosion occurred at the "Taprobane" restaurant of CG, claiming the lives of 15 guests and 5 staff members.
The courageous and speedy action by the team at CG, in assisting with emergency medical evacuations for those affected, in the face of shock and profound grief was truly remarkable and led to saving many lives. This extraordinary attitude and response at a time of strife, including the securing of the hotel, gave comfort to the guests, with most of them opting to remain at the hotel. The hotel remained operational throughout for its in-house guests which is a testament to the dedication and commitment of the staff to continue servicing our valued guests.
In the aftermath of this tragedy, security measures have been enhanced and additional safety measures introduced, in consultation with the authorities and security experts, to ensure the safety of the guests and staff. CG commenced accepting new bookings soon after the incident whilst most restaurants excluding those in the affected area of the attack were opened to the public on 30 April 2019. All prior bookings continue as planned as the hotel resumes operations. The damages to the property and loss of business will be covered by the hotel’s insurance cover. Reconstruction of the affected areas is expected to commence shortly.
Sri Lankan Resorts
The Sri Lankan Resorts segment maintained ARRs and occupancies in the year, despite the socio-political concerns that affected the country and the intense competition from both graded and informal sectors, especially in the Eastern and Southern coastal areas.
Key indicators pertaining to the Group’s Sri Lankan Resorts segment are as follows;
2018/19 2017/18
ARR (USD) 90 91
Occupancy (%) 80 81
As mentioned in the 2017/18 Annual Report, the segment commenced the construction of "Cinnamon red Kandy" in the heart of the hill capital of Sri Lanka in January 2019, complementing its round trip offering of its hotel portfolio. Given the success and the efficacy of the lean luxury model, the development will follow a similar asset light business model. The hotel, jointly developed by John Keells Hotels PLC (KHL) and Indra Traders (Private) Limited, will consist of 210 rooms at an aggregate investment of Rs.6.50 billion; where KHL’s investment is estimated to be Rs.1.00 billion. The hotel will be located in proximity to the upcoming Kandy-Colombo Expressway and is the first LEED-Gold green building certified hotel in Kandy. Construction work is currently underway with expected completion by the second half of 2020/21.
The portfolio of the Sri Lankan Resorts segment will be further strengthened post the completion of "Cinnamon Bentota Beach Bentota" which is expected to be operational by end 2019. Construction work of the hotel is currently underway, whilst "architecturally archiving" the original Bawa structure – essentially reconstructing the original structure while preserving the components of the building and materials. This flagship "Cinnamon"
property will be positioned as the epitome of luxury in the Group’s leisure portfolio, inclusive of amenities and services of global standard. "Cinnamon Bentota Beach Bentota", which will be offered at a premium ARR will be developed as an inspiring space combining both luxury and Sri Lankan heritage. The unique location and architecture of the 5-star property, coupled with an unparalleled F&B offering is expected to further strengthen and enhance the "Cinnamon" brand presence.
Maldivian Resorts
The Maldives recorded tourist arrivals of 1,484,274 in the calendar year 2018, an increase of 7 per cent from 1,389,542 arrivals recorded in CY2017. The Maldivian political landscape has remained stable since the presidential election held in September 2018, which in turn has led to a healthy arrivals trajectory in the immediate term.
Tourist demographics remained unchanged in CY2018, as Europe dominated with a market share of 49 per cent of total tourist arrivals, followed by Asia Pacific (42 per cent market share).
China remained the largest country wise contributor to arrivals with 283,116 arrivals, a decrease of 8 per cent compared to CY2017.
INSIGHTS
The Maldivian Resorts segment maintained ARRs and occupancies above the industry average despite the significant addition of room inventory, with the operational number of resorts increasing to approximately 130 in CY2018.
MANAGEMENT DISCUSSION AND ANALYSIS
"The segment commenced the construction of 'Cinnamon red Kandy' in the heart of the hill capital of Sri Lanka in January 2019"

112 JOHN KEELLS HOLDINGS PLC | ANNUAL REPORT 2018/19
INDUSTRY GROUP REVIEWLEISURE
Key indicators pertaining to the Group’s Maldivian Resorts segment are as follows:
2018/19 2017/18
ARR (USD) 309 320
Occupancy (%) 84 82
As mentioned in the JKH Annual Report 2017/18, the water bungalows of "Ellaidhoo Maldives by Cinnamon" were refurbished during the year, resulting in a partial closure of the property from May to October 2018, whilst "Cinnamon Hakuraa Huraa Maldives" was closed in May 2018 for the reconstruction of a new hotel. "Cinnamon Hakuraa Huraa Maldives" is expected to be operational in December 2019 and will be positioned as a premium luxury beach resort thereby commanding a higher ARR going forward. The Group is confident that it can leverage on its investments to drive the next phase of growth in its Maldivian properties given the significant opportunity, particularly driven by the Maldivian Government’s significant investment towards developing its leisure and tourism industries and the inherent tourism potential for the destination. To this end, it is encouraging to note that the ARR recorded by "Cinnamon Dhonveli Maldives" subsequent to the refurbishment undertaken in 2017/18, are above expectations.
Destination Management
The operating environment of the Destination Management sector continued to be challenging during the year under review, given the evolving clientele and preference for direct bookings. Walkers Tours implemented a new front-end reservation system, OKLO in the year under review. OKLO enables Walkers Tours to distribute its products and services to a wider audience using digital channels with seamless connectivity whilst also enabling greater efficiency for its back-end operations.
STRATEGY AND OUTLOOK
The leisure and tourism industry is one of the fastest growing industries within the Sri Lankan economy. It is currently the third largest foreign exchange earner of the economy with the potential to acquire a higher share of GDP given the growth trajectory of arrivals and Sri Lanka’s growing popularity as a diverse destination.
The series of coordinated attacks on Easter Sunday, which resulted in a death toll of over 250 people and injured over 500 individuals, is expected to have an impact on the tourism industry and related sectors of the economy, in the short-term. In the immediate aftermath of this horrific incident, the Group witnessed disruptions across most of its businesses on the back of heightened security measures and dampened sentiment. Against this backdrop, particularly given adverse travel advisories from key source markets within a few days of the incident, the tourism industry witnessed cancellations. While the Group will play its part in helping the industry and country achieve a speedy recovery, the Group, together with the relevant chambers of commerce, has been in engagement with the relevant authorities to urge them to take immediate steps to prevent a recurrence of such heinous acts and ensure regular and consistent dissemination of information only from designated spokespersons of the Government and military.
At the time of writing this report, the authorities have confirmed the security situation has been brought under control and encouraged continuity of normal business operations. The Government has also initiated plans to implement a public relations campaign to curtail the negative global media coverage whilst also working towards the removal of adverse travel advisories from key tourist markets. The Government, commendably, has also announced a range of concessions to help the revival of the leisure industry, including a moratorium on loans taken by the tourism related businesses and a proposed amendment to the Value Added Tax (VAT) for hotel and tour operators. Whilst these measures will provide relief to the industry in the short-term, the industry is expected to witness a challenging period until arrivals rebound to the pre-incident levels.
It is pertinent to note that studies of other travel destinations that were impacted by similar terrorism incidents indicate that destinations require 12 to 18 months to revert to pre-incident levels.
As evident in the illustrations below, popular destinations which were affected by acts of terrorism such as Bali, Mumbai, Paris and Brussels have indicated a recovery in less than 18 months.
Estimates by the World Travel and Tourism Council show the average recovery time in months by type of crisis:
Crisis Category Average Recovery Time (Months)
Political turmoil 26.7Terrorism 13.0
Pandemic 21.3Environmental disaster 23.8
Source: World Economic Forum
0
3,000
6,000
9,000
12,000
15,000
(’000)(’000)
2000
2002
2004
2006
2008
2010
2012
2014
2016
2018
Indonesia Bali Depicts a terrorist attack
Indonesia and Bali Tourist ArrivalsIndonesia and Bali Tourist Arrivals
6,000
8,000
10,000
(’000)(’000)
2000
2002
2004
2006
2008
2010
2012
2014
2016
2018
Belgium Tourist ArrivalsBelgium Tourist Arrivals
7,000
9,000
Depicts a terrorist attack
Source: World Bank and Bali Hotels Association Source: World Bank
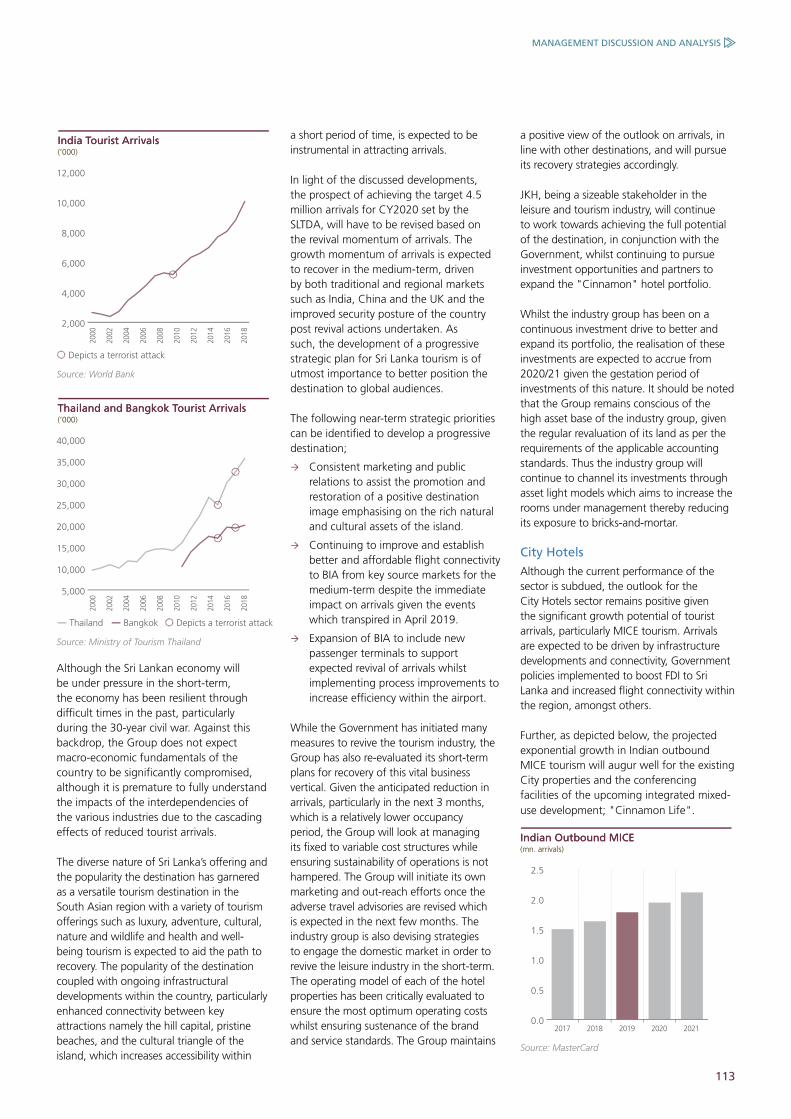
113
5,000
10,000
15,000
20,000
25,000
30,000
35,000
40,000
(’000)(’000)
2000
2002
2004
2006
2008
2010
2012
2014
2016
2018
Thailand Bangkok
Thailand and Bangkok Tourist ArrivalsThailand and Bangkok Tourist Arrivals
Depicts a terrorist attack
2,000
4,000
6,000
8,000
10,000
12,000
(’000)(’000)
2000
2002
2004
2006
2008
2010
2012
2014
2016
2018
India Tourist ArrivalsIndia Tourist Arrivals
Depicts a terrorist attack
Although the Sri Lankan economy will be under pressure in the short-term, the economy has been resilient through difficult times in the past, particularly during the 30-year civil war. Against this backdrop, the Group does not expect macro-economic fundamentals of the country to be significantly compromised, although it is premature to fully understand the impacts of the interdependencies of the various industries due to the cascading effects of reduced tourist arrivals.
The diverse nature of Sri Lanka’s offering and the popularity the destination has garnered as a versatile tourism destination in the South Asian region with a variety of tourism offerings such as luxury, adventure, cultural, nature and wildlife and health and well-being tourism is expected to aid the path to recovery. The popularity of the destination coupled with ongoing infrastructural developments within the country, particularly enhanced connectivity between key attractions namely the hill capital, pristine beaches, and the cultural triangle of the island, which increases accessibility within
a positive view of the outlook on arrivals, in line with other destinations, and will pursue its recovery strategies accordingly.
JKH, being a sizeable stakeholder in the leisure and tourism industry, will continue to work towards achieving the full potential of the destination, in conjunction with the Government, whilst continuing to pursue investment opportunities and partners to expand the "Cinnamon" hotel portfolio.
Whilst the industry group has been on a continuous investment drive to better and expand its portfolio, the realisation of these investments are expected to accrue from 2020/21 given the gestation period of investments of this nature. It should be noted that the Group remains conscious of the high asset base of the industry group, given the regular revaluation of its land as per the requirements of the applicable accounting standards. Thus the industry group will continue to channel its investments through asset light models which aims to increase the rooms under management thereby reducing its exposure to bricks-and-mortar.
City Hotels Although the current performance of the sector is subdued, the outlook for the City Hotels sector remains positive given the significant growth potential of tourist arrivals, particularly MICE tourism. Arrivals are expected to be driven by infrastructure developments and connectivity, Government policies implemented to boost FDI to Sri Lanka and increased flight connectivity within the region, amongst others.
Further, as depicted below, the projected exponential growth in Indian outbound MICE tourism will augur well for the existing City properties and the conferencing facilities of the upcoming integrated mixed-use development; "Cinnamon Life".
0.0
0.5
1.0
1.5
2.0
2.5
(mn. arrivals)(mn. arrivals)
2017 2018 2019 2020 2021
Indian Outbound MICE Indian Outbound MICE
a short period of time, is expected to be instrumental in attracting arrivals.
In light of the discussed developments, the prospect of achieving the target 4.5 million arrivals for CY2020 set by the SLTDA, will have to be revised based on the revival momentum of arrivals. The growth momentum of arrivals is expected to recover in the medium-term, driven by both traditional and regional markets such as India, China and the UK and the improved security posture of the country post revival actions undertaken. As such, the development of a progressive strategic plan for Sri Lanka tourism is of utmost importance to better position the destination to global audiences.
The following near-term strategic priorities can be identified to develop a progressive destination;
Consistent marketing and public relations to assist the promotion and restoration of a positive destination image emphasising on the rich natural and cultural assets of the island.
Continuing to improve and establish better and affordable flight connectivity to BIA from key source markets for the medium-term despite the immediate impact on arrivals given the events which transpired in April 2019.
Expansion of BIA to include new passenger terminals to support expected revival of arrivals whilst implementing process improvements to increase efficiency within the airport.
While the Government has initiated many measures to revive the tourism industry, the Group has also re-evaluated its short-term plans for recovery of this vital business vertical. Given the anticipated reduction in arrivals, particularly in the next 3 months, which is a relatively lower occupancy period, the Group will look at managing its fixed to variable cost structures while ensuring sustainability of operations is not hampered. The Group will initiate its own marketing and out-reach efforts once the adverse travel advisories are revised which is expected in the next few months. The industry group is also devising strategies to engage the domestic market in order to revive the leisure industry in the short-term. The operating model of each of the hotel properties has been critically evaluated to ensure the most optimum operating costs whilst ensuring sustenance of the brand and service standards. The Group maintains
MANAGEMENT DISCUSSION AND ANALYSIS
Source: MasterCard
Source: Ministry of Tourism Thailand
Source: World Bank
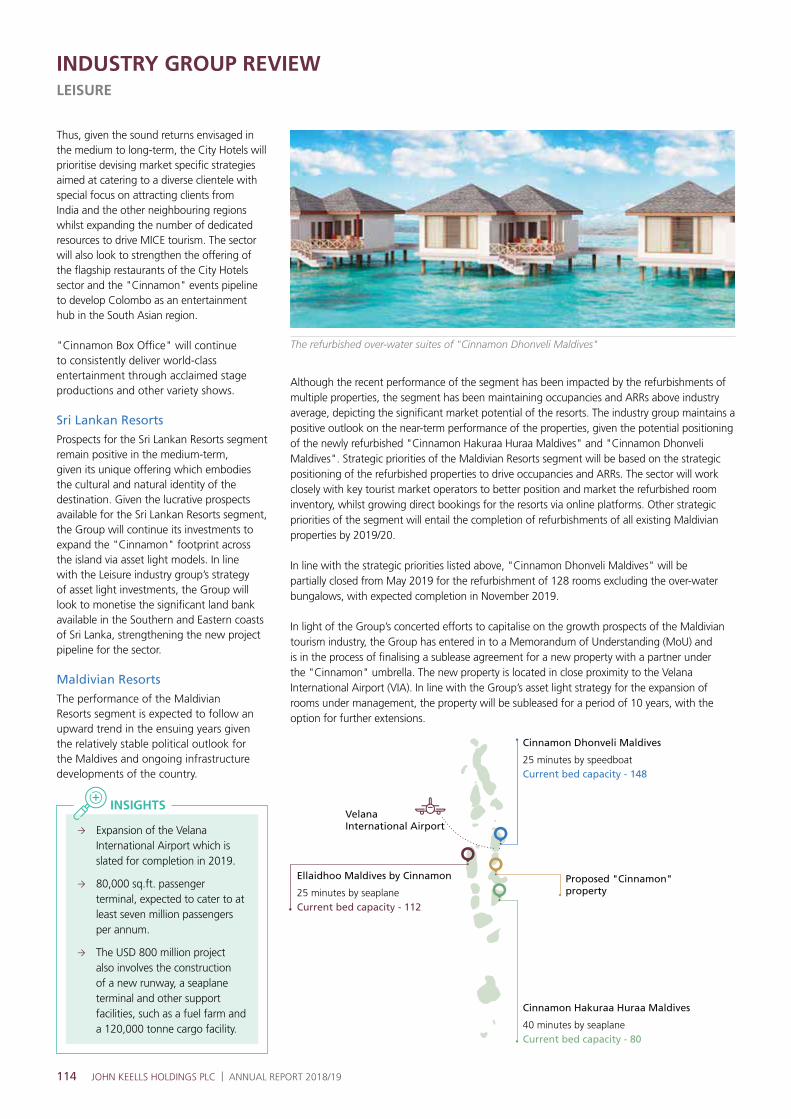
114 JOHN KEELLS HOLDINGS PLC | ANNUAL REPORT 2018/19
INDUSTRY GROUP REVIEWLEISURE
Expansion of the Velana International Airport which is slated for completion in 2019.
80,000 sq.ft. passenger terminal, expected to cater to at least seven million passengers per annum.
The USD 800 million project also involves the construction of a new runway, a seaplane terminal and other support facilities, such as a fuel farm and a 120,000 tonne cargo facility.
INSIGHTS
Thus, given the sound returns envisaged in the medium to long-term, the City Hotels will prioritise devising market specific strategies aimed at catering to a diverse clientele with special focus on attracting clients from India and the other neighbouring regions whilst expanding the number of dedicated resources to drive MICE tourism. The sector will also look to strengthen the offering of the flagship restaurants of the City Hotels sector and the "Cinnamon" events pipeline to develop Colombo as an entertainment hub in the South Asian region.
"Cinnamon Box Office" will continue to consistently deliver world-class entertainment through acclaimed stage productions and other variety shows.
Sri Lankan Resorts
Prospects for the Sri Lankan Resorts segment remain positive in the medium-term, given its unique offering which embodies the cultural and natural identity of the destination. Given the lucrative prospects available for the Sri Lankan Resorts segment, the Group will continue its investments to expand the "Cinnamon" footprint across the island via asset light models. In line with the Leisure industry group’s strategy of asset light investments, the Group will look to monetise the significant land bank available in the Southern and Eastern coasts of Sri Lanka, strengthening the new project pipeline for the sector.
Maldivian Resorts
The performance of the Maldivian Resorts segment is expected to follow an upward trend in the ensuing years given the relatively stable political outlook for the Maldives and ongoing infrastructure developments of the country.
Although the recent performance of the segment has been impacted by the refurbishments of multiple properties, the segment has been maintaining occupancies and ARRs above industry average, depicting the significant market potential of the resorts. The industry group maintains a positive outlook on the near-term performance of the properties, given the potential positioning of the newly refurbished "Cinnamon Hakuraa Huraa Maldives" and "Cinnamon Dhonveli Maldives". Strategic priorities of the Maldivian Resorts segment will be based on the strategic positioning of the refurbished properties to drive occupancies and ARRs. The sector will work closely with key tourist market operators to better position and market the refurbished room inventory, whilst growing direct bookings for the resorts via online platforms. Other strategic priorities of the segment will entail the completion of refurbishments of all existing Maldivian properties by 2019/20.
In line with the strategic priorities listed above, "Cinnamon Dhonveli Maldives" will be partially closed from May 2019 for the refurbishment of 128 rooms excluding the over-water bungalows, with expected completion in November 2019.
In light of the Group’s concerted efforts to capitalise on the growth prospects of the Maldivian tourism industry, the Group has entered in to a Memorandum of Understanding (MoU) and is in the process of finalising a sublease agreement for a new property with a partner under the "Cinnamon" umbrella. The new property is located in close proximity to the Velana International Airport (VIA). In line with the Group’s asset light strategy for the expansion of rooms under management, the property will be subleased for a period of 10 years, with the option for further extensions.
Ellaidhoo Maldives by Cinnamon
25 minutes by seaplane
Cinnamon Dhonveli Maldives
25 minutes by speedboat
Cinnamon Hakuraa Huraa Maldives
40 minutes by seaplane
Proposed "Cinnamon" property
Current bed capacity - 112
Current bed capacity - 148
Current bed capacity - 80
Velana International Airport
The refurbished over-water suites of "Cinnamon Dhonveli Maldives"
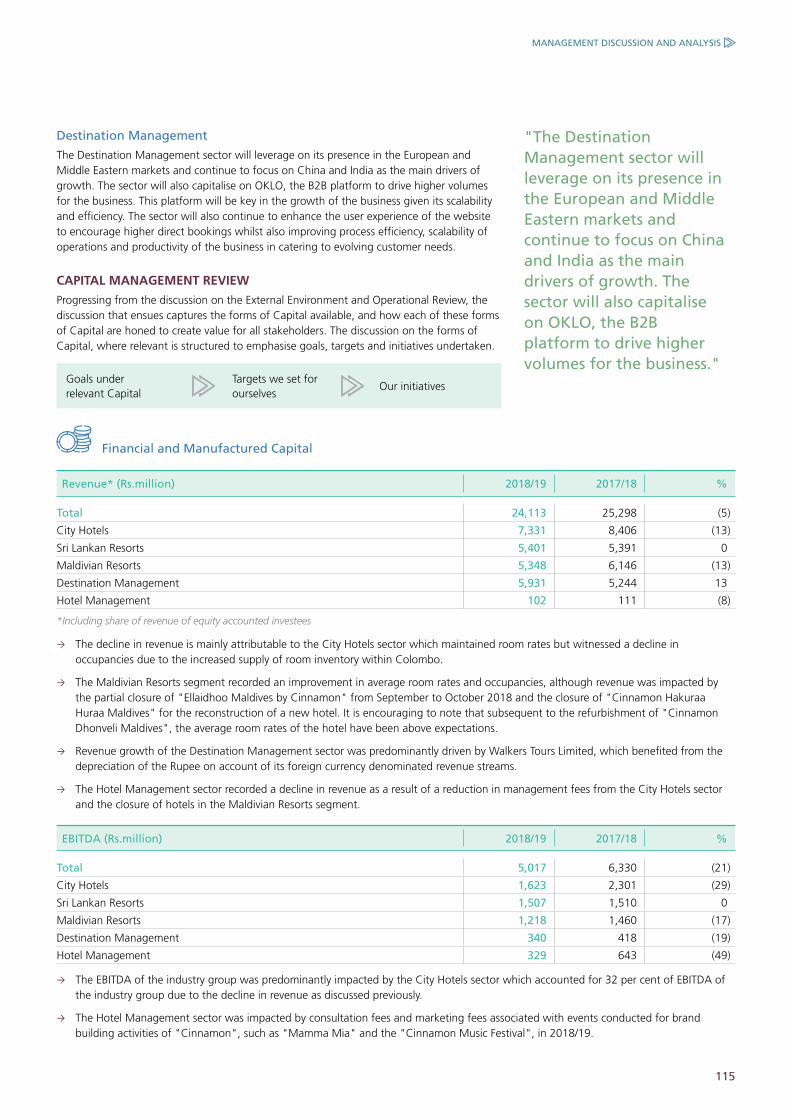
115
"The Destination Management sector will leverage on its presence in the European and Middle Eastern markets and continue to focus on China and India as the main drivers of growth. The sector will also capitalise on OKLO, the B2B platform to drive higher volumes for the business."
Destination Management
The Destination Management sector will leverage on its presence in the European and Middle Eastern markets and continue to focus on China and India as the main drivers of growth. The sector will also capitalise on OKLO, the B2B platform to drive higher volumes for the business. This platform will be key in the growth of the business given its scalability and efficiency. The sector will also continue to enhance the user experience of the website to encourage higher direct bookings whilst also improving process efficiency, scalability of operations and productivity of the business in catering to evolving customer needs.
CAPITAL MANAGEMENT REVIEW
Progressing from the discussion on the External Environment and Operational Review, the discussion that ensues captures the forms of Capital available, and how each of these forms of Capital are honed to create value for all stakeholders. The discussion on the forms of Capital, where relevant is structured to emphasise goals, targets and initiatives undertaken.
Goals under relevant Capital
Targets we set for ourselves
Our initiatives
Revenue* (Rs.million) 2018/19 2017/18 %
Total 24,113 25,298 (5)
City Hotels 7,331 8,406 (13)
Sri Lankan Resorts 5,401 5,391 0
Maldivian Resorts 5,348 6,146 (13)
Destination Management 5,931 5,244 13
Hotel Management 102 111 (8)
*Including share of revenue of equity accounted investees
The decline in revenue is mainly attributable to the City Hotels sector which maintained room rates but witnessed a decline in occupancies due to the increased supply of room inventory within Colombo.
The Maldivian Resorts segment recorded an improvement in average room rates and occupancies, although revenue was impacted by the partial closure of "Ellaidhoo Maldives by Cinnamon" from September to October 2018 and the closure of "Cinnamon Hakuraa Huraa Maldives" for the reconstruction of a new hotel. It is encouraging to note that subsequent to the refurbishment of "Cinnamon Dhonveli Maldives", the average room rates of the hotel have been above expectations.
Revenue growth of the Destination Management sector was predominantly driven by Walkers Tours Limited, which benefited from the depreciation of the Rupee on account of its foreign currency denominated revenue streams.
The Hotel Management sector recorded a decline in revenue as a result of a reduction in management fees from the City Hotels sector and the closure of hotels in the Maldivian Resorts segment.
EBITDA (Rs.million) 2018/19 2017/18 %
Total 5,017 6,330 (21)
City Hotels 1,623 2,301 (29)
Sri Lankan Resorts 1,507 1,510 0
Maldivian Resorts 1,218 1,460 (17)
Destination Management 340 418 (19)
Hotel Management 329 643 (49)
The EBITDA of the industry group was predominantly impacted by the City Hotels sector which accounted for 32 per cent of EBITDA of the industry group due to the decline in revenue as discussed previously.
The Hotel Management sector was impacted by consultation fees and marketing fees associated with events conducted for brand building activities of "Cinnamon", such as "Mamma Mia" and the "Cinnamon Music Festival", in 2018/19.
Financial and Manufactured Capital
MANAGEMENT DISCUSSION AND ANALYSIS
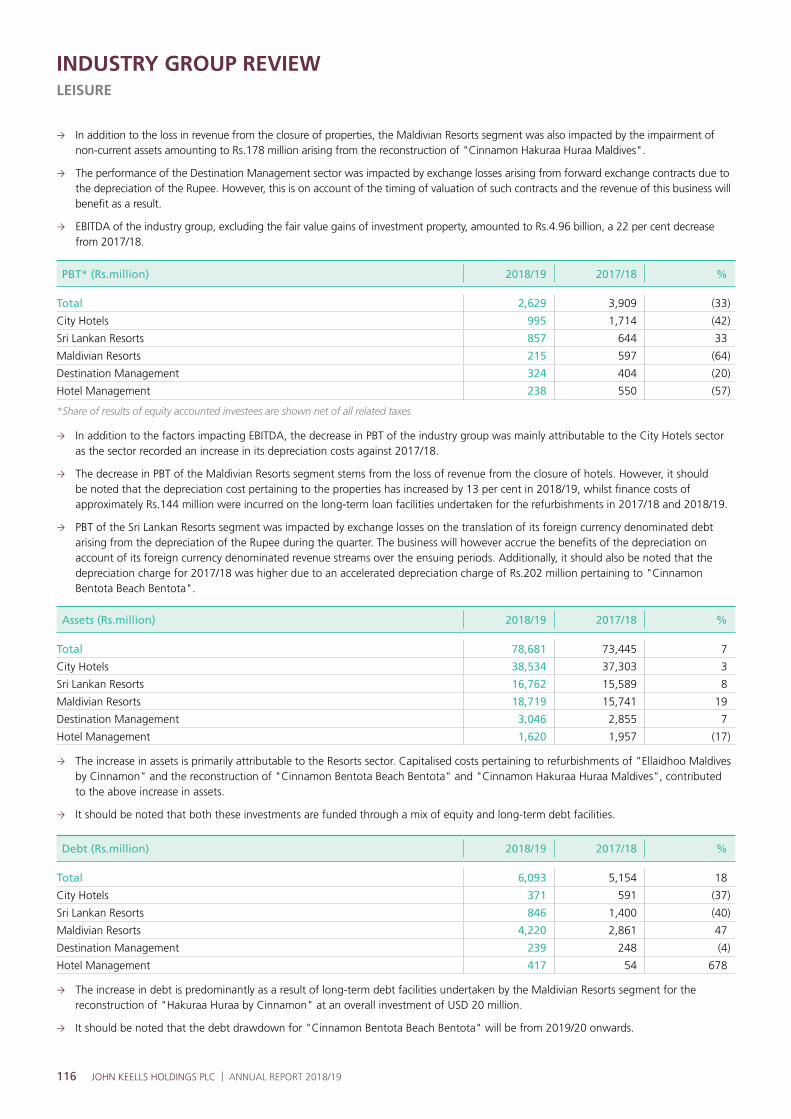
116 JOHN KEELLS HOLDINGS PLC | ANNUAL REPORT 2018/19
INDUSTRY GROUP REVIEWLEISURE
In addition to the loss in revenue from the closure of properties, the Maldivian Resorts segment was also impacted by the impairment of non-current assets amounting to Rs.178 million arising from the reconstruction of "Cinnamon Hakuraa Huraa Maldives".
The performance of the Destination Management sector was impacted by exchange losses arising from forward exchange contracts due to the depreciation of the Rupee. However, this is on account of the timing of valuation of such contracts and the revenue of this business will benefit as a result.
EBITDA of the industry group, excluding the fair value gains of investment property, amounted to Rs.4.96 billion, a 22 per cent decrease from 2017/18.
PBT* (Rs.million) 2018/19 2017/18 %
Total 2,629 3,909 (33)
City Hotels 995 1,714 (42)
Sri Lankan Resorts 857 644 33
Maldivian Resorts 215 597 (64)
Destination Management 324 404 (20)
Hotel Management 238 550 (57)
*Share of results of equity accounted investees are shown net of all related taxes
In addition to the factors impacting EBITDA, the decrease in PBT of the industry group was mainly attributable to the City Hotels sector as the sector recorded an increase in its depreciation costs against 2017/18.
The decrease in PBT of the Maldivian Resorts segment stems from the loss of revenue from the closure of hotels. However, it should be noted that the depreciation cost pertaining to the properties has increased by 13 per cent in 2018/19, whilst finance costs of approximately Rs.144 million were incurred on the long-term loan facilities undertaken for the refurbishments in 2017/18 and 2018/19.
PBT of the Sri Lankan Resorts segment was impacted by exchange losses on the translation of its foreign currency denominated debt arising from the depreciation of the Rupee during the quarter. The business will however accrue the benefits of the depreciation on account of its foreign currency denominated revenue streams over the ensuing periods. Additionally, it should also be noted that the depreciation charge for 2017/18 was higher due to an accelerated depreciation charge of Rs.202 million pertaining to "Cinnamon Bentota Beach Bentota".
Assets (Rs.million) 2018/19 2017/18 %
Total 78,681 73,445 7
City Hotels 38,534 37,303 3
Sri Lankan Resorts 16,762 15,589 8
Maldivian Resorts 18,719 15,741 19
Destination Management 3,046 2,855 7
Hotel Management 1,620 1,957 (17)
The increase in assets is primarily attributable to the Resorts sector. Capitalised costs pertaining to refurbishments of "Ellaidhoo Maldives by Cinnamon" and the reconstruction of "Cinnamon Bentota Beach Bentota" and "Cinnamon Hakuraa Huraa Maldives", contributed to the above increase in assets.
It should be noted that both these investments are funded through a mix of equity and long-term debt facilities.
Debt (Rs.million) 2018/19 2017/18 %
Total 6,093 5,154 18
City Hotels 371 591 (37)
Sri Lankan Resorts 846 1,400 (40)
Maldivian Resorts 4,220 2,861 47
Destination Management 239 248 (4)
Hotel Management 417 54 678
The increase in debt is predominantly as a result of long-term debt facilities undertaken by the Maldivian Resorts segment for the reconstruction of "Hakuraa Huraa by Cinnamon" at an overall investment of USD 20 million.
It should be noted that the debt drawdown for "Cinnamon Bentota Beach Bentota" will be from 2019/20 onwards.
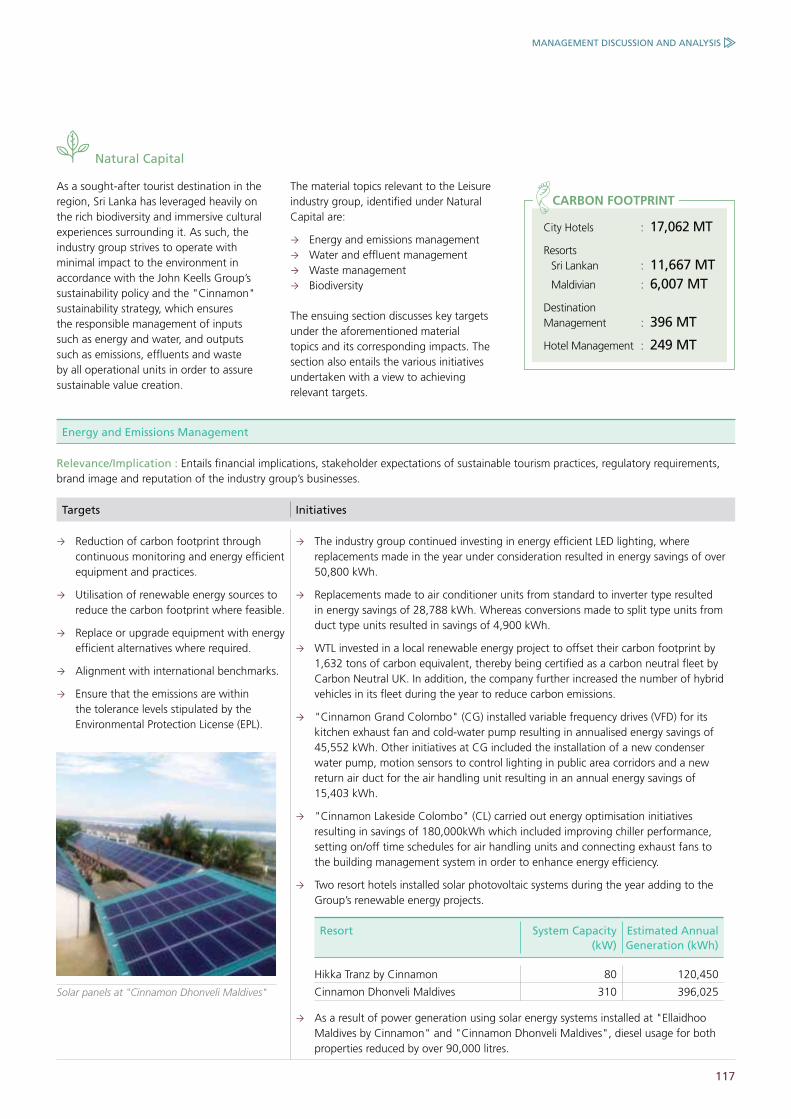
117
Natural Capital
As a sought-after tourist destination in the region, Sri Lanka has leveraged heavily on the rich biodiversity and immersive cultural experiences surrounding it. As such, the industry group strives to operate with minimal impact to the environment in accordance with the John Keells Group’s sustainability policy and the "Cinnamon" sustainability strategy, which ensures the responsible management of inputs such as energy and water, and outputs such as emissions, effluents and waste by all operational units in order to assure sustainable value creation.
The material topics relevant to the Leisure industry group, identified under Natural Capital are:
Energy and emissions management Water and effluent management Waste management Biodiversity
The ensuing section discusses key targets under the aforementioned material topics and its corresponding impacts. The section also entails the various initiatives undertaken with a view to achieving relevant targets.
City Hotels : 17,062 MT
ResortsSri Lankan : 11,667 MTMaldivian : 6,007 MT
Destination Management : 396 MT
Hotel Management : 249 MT
CARBON FOOTPRINT
Energy and Emissions Management
Relevance/Implication : Entails financial implications, stakeholder expectations of sustainable tourism practices, regulatory requirements, brand image and reputation of the industry group’s businesses.
Targets Initiatives
Reduction of carbon footprint through continuous monitoring and energy efficient equipment and practices.
Utilisation of renewable energy sources to reduce the carbon footprint where feasible.
Replace or upgrade equipment with energy efficient alternatives where required.
Alignment with international benchmarks.
Ensure that the emissions are within the tolerance levels stipulated by the Environmental Protection License (EPL).
The industry group continued investing in energy efficient LED lighting, where replacements made in the year under consideration resulted in energy savings of over 50,800 kWh.
Replacements made to air conditioner units from standard to inverter type resulted in energy savings of 28,788 kWh. Whereas conversions made to split type units from duct type units resulted in savings of 4,900 kWh.
WTL invested in a local renewable energy project to offset their carbon footprint by 1,632 tons of carbon equivalent, thereby being certified as a carbon neutral fleet by Carbon Neutral UK. In addition, the company further increased the number of hybrid vehicles in its fleet during the year to reduce carbon emissions.
"Cinnamon Grand Colombo" (CG) installed variable frequency drives (VFD) for its kitchen exhaust fan and cold-water pump resulting in annualised energy savings of 45,552 kWh. Other initiatives at CG included the installation of a new condenser water pump, motion sensors to control lighting in public area corridors and a new return air duct for the air handling unit resulting in an annual energy savings of 15,403 kWh.
"Cinnamon Lakeside Colombo" (CL) carried out energy optimisation initiatives resulting in savings of 180,000kWh which included improving chiller performance, setting on/off time schedules for air handling units and connecting exhaust fans to the building management system in order to enhance energy efficiency.
Two resort hotels installed solar photovoltaic systems during the year adding to the Group’s renewable energy projects.
Resort System Capacity (kW)
Estimated Annual Generation (kWh)
Hikka Tranz by Cinnamon 80 120,450
Cinnamon Dhonveli Maldives 310 396,025
As a result of power generation using solar energy systems installed at "Ellaidhoo Maldives by Cinnamon" and "Cinnamon Dhonveli Maldives", diesel usage for both properties reduced by over 90,000 litres.
Solar panels at "Cinnamon Dhonveli Maldives"
MANAGEMENT DISCUSSION AND ANALYSIS
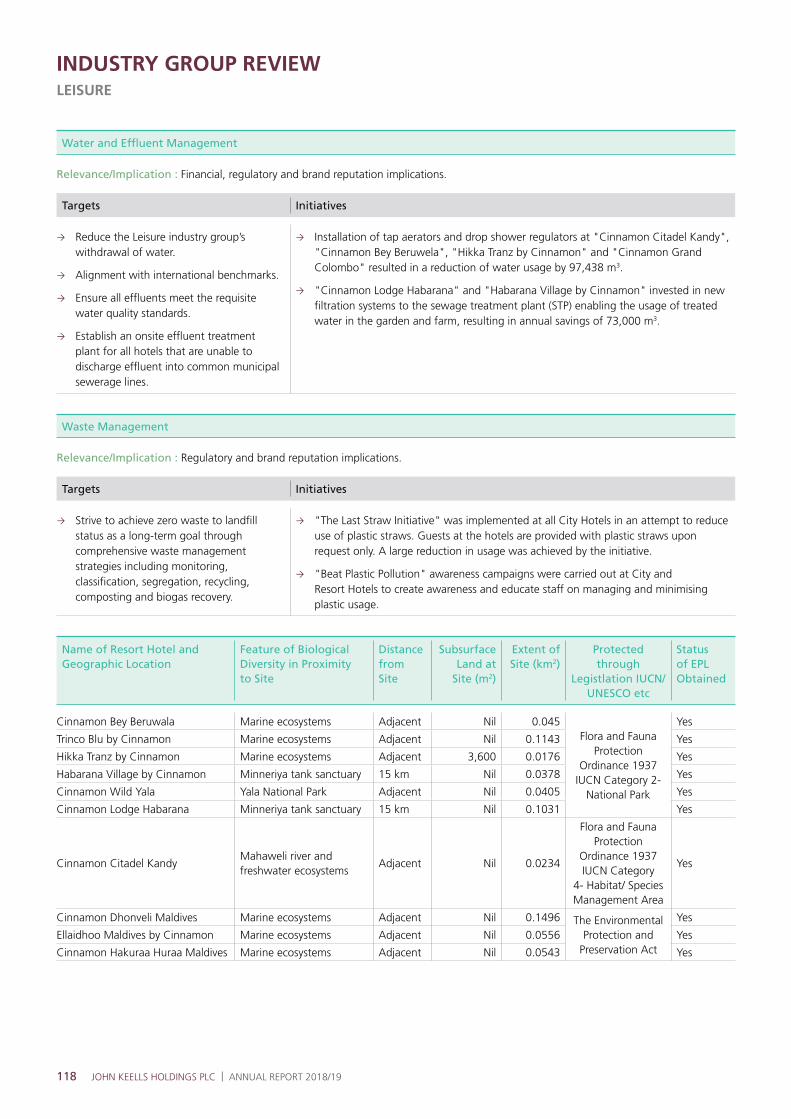
118 JOHN KEELLS HOLDINGS PLC | ANNUAL REPORT 2018/19
INDUSTRY GROUP REVIEWLEISURE
Water and Effluent Management
Relevance/Implication : Financial, regulatory and brand reputation implications.
Targets Initiatives
Reduce the Leisure industry group’s withdrawal of water.
Alignment with international benchmarks.
Ensure all effluents meet the requisite water quality standards.
Establish an onsite effluent treatment plant for all hotels that are unable to discharge effluent into common municipal sewerage lines.
Installation of tap aerators and drop shower regulators at "Cinnamon Citadel Kandy", "Cinnamon Bey Beruwela", "Hikka Tranz by Cinnamon" and "Cinnamon Grand Colombo" resulted in a reduction of water usage by 97,438 m3.
"Cinnamon Lodge Habarana" and "Habarana Village by Cinnamon" invested in new filtration systems to the sewage treatment plant (STP) enabling the usage of treated water in the garden and farm, resulting in annual savings of 73,000 m3.
Waste Management
Relevance/Implication : Regulatory and brand reputation implications.
Targets Initiatives
Strive to achieve zero waste to landfill status as a long-term goal through comprehensive waste management strategies including monitoring, classification, segregation, recycling, composting and biogas recovery.
"The Last Straw Initiative" was implemented at all City Hotels in an attempt to reduce use of plastic straws. Guests at the hotels are provided with plastic straws upon request only. A large reduction in usage was achieved by the initiative.
"Beat Plastic Pollution" awareness campaigns were carried out at City and Resort Hotels to create awareness and educate staff on managing and minimising plastic usage.
Name of Resort Hotel and Geographic Location
Feature of Biological Diversity in Proximity to Site
Distance from Site
Subsurface Land at
Site (m2)
Extent of Site (km2)
Protected through
Legistlation IUCN/UNESCO etc
Status of EPL Obtained
Cinnamon Bey Beruwala Marine ecosystems Adjacent Nil 0.045Flora and Fauna
Protection Ordinance 1937
IUCN Category 2- National Park
Yes
Trinco Blu by Cinnamon Marine ecosystems Adjacent Nil 0.1143 Yes
Hikka Tranz by Cinnamon Marine ecosystems Adjacent 3,600 0.0176 Yes
Habarana Village by Cinnamon Minneriya tank sanctuary 15 km Nil 0.0378 Yes
Cinnamon Wild Yala Yala National Park Adjacent Nil 0.0405 Yes
Cinnamon Lodge Habarana Minneriya tank sanctuary 15 km Nil 0.1031 Yes
Cinnamon Citadel KandyMahaweli river and freshwater ecosystems
Adjacent Nil 0.0234
Flora and Fauna Protection
Ordinance 1937 IUCN Category
4- Habitat/ Species Management Area
Yes
Cinnamon Dhonveli Maldives Marine ecosystems Adjacent Nil 0.1496 The Environmental Protection and
Preservation Act
Yes
Ellaidhoo Maldives by Cinnamon Marine ecosystems Adjacent Nil 0.0556 Yes
Cinnamon Hakuraa Huraa Maldives Marine ecosystems Adjacent Nil 0.0543 Yes

119
Indicators
2018/19 2017/18 %
Carbon footprint (MT) 35,382 38,835 (9)
Water withdrawn (m3) 951,891 1,026,289 (7)
Waste disposed (kg) 3,265,890 3,788,942 (14)
Carbon Footprint Scope 1 and 2 per Operational Intensity Factor
2018/19 2017/18 %
Sri Lankan Resorts segment CO2 kg per guest night 22.1 22.2 -Maldivian Resorts segment CO2 kg per guest night 36.7 36.3 1City Hotels sector CO2 kg per guest night 47.2 45.8 3Destination Management sector CO2 kg per client serviced 6.9 7.7 (10)
Biodiversity Conservation and Promotion
Relevance/Implication : Regulatory and brand reputation implications.
Targets Initiatives
Minimal impact to important biodiverse areas –
Ensure long-term value creation, given the proximity of resorts to biologically diverse areas.
Regular impact assessments to ascertain any impacts on biodiversity and the environment, resulting from operations.
During the year under review the following projects were carried out in partnership with John Keells Foundation under SDG 15.
The ‘Cinnamon Elephant Project" based at "Cinnamon Lodge Habarana" – an ongoing research initiative on elephant gathering, behavioural and dispersion patterns in the Anuradhapura District, conducted in collaboration with the Centre for Conservation and Research - tracks elephant migration patterns towards improving the management of elephant habitats and reducing human-elephant conflict for long-term conservation.
During the reporting year;
Regular field visits were made to both Kaudulla and Minneriya to observe the two matriarch elephants of two different herds fitted with GPS satellite collars in the previous year.
The "Cinnamon Elephant Project" won the Pacific Asia Travel Association (PATA) Gold Award for 2018 under the category of "Environment and Ecotourism" and the Silver Award at the International Travel and Tourism Award 2018 under the category of "Responsible Tourism".
"Project Leopard" - initiated in 2008 by Cinnamon Nature Trails as a way of minimising the human-leopard conflict while safeguarding and uplifting the livelihoods of cattle farmers operative in the area saw the completion of phase 1 which involved the donation of 100 stainless steel portable pens to farmers pasturing cattle in the periphery of the Yala National Park.
The impact of the initiative is currently being assessed through an independent study by the University of British Columbia of Canada.
"Cinnamon Dhonveli Maldives" successfully launched the first phase of its coral conservation programme with active participation of in-house guests, business partners as well as all staff.
"Ellaidhoo Maldives by Cinnamon" carried out a plant donation campaign distributing 70 Banyan trees to its neighbouring islands.
Coral conservation programme at "Cinnamon Dhonveli Maldives"
Performance
The Leisure industry group’s sustainability performance measured by the key indicators, carbon footprint, water withdrawn, and waste disposed is as follows;
MANAGEMENT DISCUSSION AND ANALYSIS
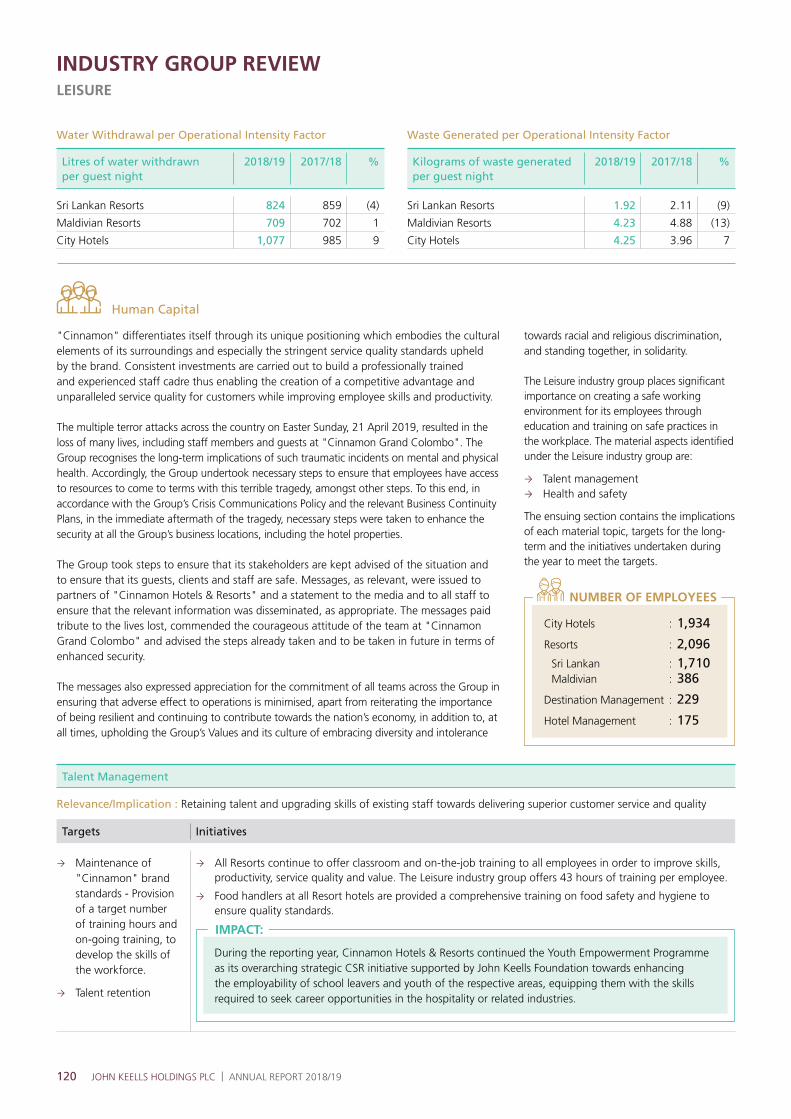
120 JOHN KEELLS HOLDINGS PLC | ANNUAL REPORT 2018/19
INDUSTRY GROUP REVIEWLEISURE
"Cinnamon" differentiates itself through its unique positioning which embodies the cultural elements of its surroundings and especially the stringent service quality standards upheld by the brand. Consistent investments are carried out to build a professionally trained and experienced staff cadre thus enabling the creation of a competitive advantage and unparalleled service quality for customers while improving employee skills and productivity.
The multiple terror attacks across the country on Easter Sunday, 21 April 2019, resulted in the loss of many lives, including staff members and guests at "Cinnamon Grand Colombo". The Group recognises the long-term implications of such traumatic incidents on mental and physical health. Accordingly, the Group undertook necessary steps to ensure that employees have access to resources to come to terms with this terrible tragedy, amongst other steps. To this end, in accordance with the Group’s Crisis Communications Policy and the relevant Business Continuity Plans, in the immediate aftermath of the tragedy, necessary steps were taken to enhance the security at all the Group’s business locations, including the hotel properties.
The Group took steps to ensure that its stakeholders are kept advised of the situation and to ensure that its guests, clients and staff are safe. Messages, as relevant, were issued to partners of "Cinnamon Hotels & Resorts" and a statement to the media and to all staff to ensure that the relevant information was disseminated, as appropriate. The messages paid tribute to the lives lost, commended the courageous attitude of the team at "Cinnamon Grand Colombo" and advised the steps already taken and to be taken in future in terms of enhanced security.
The messages also expressed appreciation for the commitment of all teams across the Group in ensuring that adverse effect to operations is minimised, apart from reiterating the importance of being resilient and continuing to contribute towards the nation’s economy, in addition to, at all times, upholding the Group’s Values and its culture of embracing diversity and intolerance
Human Capital
towards racial and religious discrimination, and standing together, in solidarity.
The Leisure industry group places significant importance on creating a safe working environment for its employees through education and training on safe practices in the workplace. The material aspects identified under the Leisure industry group are:
Talent management Health and safety
The ensuing section contains the implications of each material topic, targets for the long-term and the initiatives undertaken during the year to meet the targets.
Talent Management
Relevance/Implication : Retaining talent and upgrading skills of existing staff towards delivering superior customer service and quality
Targets Initiatives
Maintenance of "Cinnamon" brand standards - Provision of a target number of training hours and on-going training, to develop the skills of the workforce.
Talent retention
All Resorts continue to offer classroom and on-the-job training to all employees in order to improve skills, productivity, service quality and value. The Leisure industry group offers 43 hours of training per employee.
Food handlers at all Resort hotels are provided a comprehensive training on food safety and hygiene to ensure quality standards.
During the reporting year, Cinnamon Hotels & Resorts continued the Youth Empowerment Programme as its overarching strategic CSR initiative supported by John Keells Foundation towards enhancing the employability of school leavers and youth of the respective areas, equipping them with the skills required to seek career opportunities in the hospitality or related industries.
IMPACT:
Water Withdrawal per Operational Intensity Factor
Litres of water withdrawn per guest night
2018/19 2017/18 %
Sri Lankan Resorts 824 859 (4)
Maldivian Resorts 709 702 1
City Hotels 1,077 985 9
Waste Generated per Operational Intensity Factor
Kilograms of waste generated per guest night
2018/19 2017/18 %
Sri Lankan Resorts 1.92 2.11 (9)
Maldivian Resorts 4.23 4.88 (13)
City Hotels 4.25 3.96 7
City Hotels : 1,934
Resorts : 2,096Sri Lankan : 1,710Maldivian : 386
Destination Management : 229
Hotel Management : 175
NUMBER OF EMPLOYEES
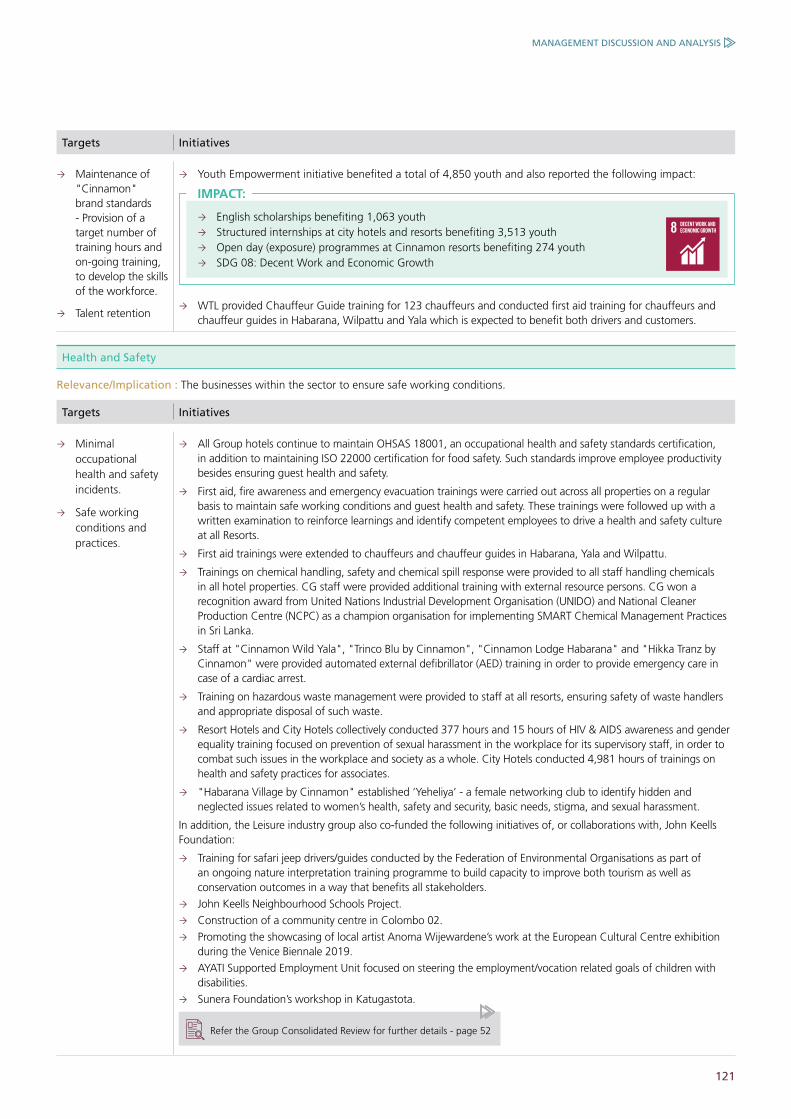
121
Targets Initiatives
Maintenance of "Cinnamon" brand standards - Provision of a target number of training hours and on-going training, to develop the skills of the workforce.
Talent retention
Youth Empowerment initiative benefited a total of 4,850 youth and also reported the following impact:
English scholarships benefiting 1,063 youth Structured internships at city hotels and resorts benefiting 3,513 youth Open day (exposure) programmes at Cinnamon resorts benefiting 274 youth SDG 08: Decent Work and Economic Growth
IMPACT:
WTL provided Chauffeur Guide training for 123 chauffeurs and conducted first aid training for chauffeurs and chauffeur guides in Habarana, Wilpattu and Yala which is expected to benefit both drivers and customers.
Health and Safety
Relevance/Implication : The businesses within the sector to ensure safe working conditions.
Targets Initiatives
Minimal occupational health and safety incidents.
Safe working conditions and practices.
All Group hotels continue to maintain OHSAS 18001, an occupational health and safety standards certification, in addition to maintaining ISO 22000 certification for food safety. Such standards improve employee productivity besides ensuring guest health and safety.
First aid, fire awareness and emergency evacuation trainings were carried out across all properties on a regular basis to maintain safe working conditions and guest health and safety. These trainings were followed up with a written examination to reinforce learnings and identify competent employees to drive a health and safety culture at all Resorts.
First aid trainings were extended to chauffeurs and chauffeur guides in Habarana, Yala and Wilpattu.
Trainings on chemical handling, safety and chemical spill response were provided to all staff handling chemicals in all hotel properties. CG staff were provided additional training with external resource persons. CG won a recognition award from United Nations Industrial Development Organisation (UNIDO) and National Cleaner Production Centre (NCPC) as a champion organisation for implementing SMART Chemical Management Practices in Sri Lanka.
Staff at "Cinnamon Wild Yala", "Trinco Blu by Cinnamon", "Cinnamon Lodge Habarana" and "Hikka Tranz by Cinnamon" were provided automated external defibrillator (AED) training in order to provide emergency care in case of a cardiac arrest.
Training on hazardous waste management were provided to staff at all resorts, ensuring safety of waste handlers and appropriate disposal of such waste.
Resort Hotels and City Hotels collectively conducted 377 hours and 15 hours of HIV & AIDS awareness and gender equality training focused on prevention of sexual harassment in the workplace for its supervisory staff, in order to combat such issues in the workplace and society as a whole. City Hotels conducted 4,981 hours of trainings on health and safety practices for associates.
"Habarana Village by Cinnamon" established ‘Yeheliya’ - a female networking club to identify hidden and neglected issues related to women’s health, safety and security, basic needs, stigma, and sexual harassment.
In addition, the Leisure industry group also co-funded the following initiatives of, or collaborations with, John Keells Foundation:
Training for safari jeep drivers/guides conducted by the Federation of Environmental Organisations as part of an ongoing nature interpretation training programme to build capacity to improve both tourism as well as conservation outcomes in a way that benefits all stakeholders.
John Keells Neighbourhood Schools Project.
Construction of a community centre in Colombo 02.
Promoting the showcasing of local artist Anoma Wijewardene’s work at the European Cultural Centre exhibition during the Venice Biennale 2019.
AYATI Supported Employment Unit focused on steering the employment/vocation related goals of children with disabilities.
Sunera Foundation’s workshop in Katugastota.
Refer the Group Consolidated Review for further details - page 52
MANAGEMENT DISCUSSION AND ANALYSIS

122 JOHN KEELLS HOLDINGS PLC | ANNUAL REPORT 2018/19
INDUSTRY GROUP REVIEWLEISURE
Performance
A total of 55 occupational health and safety incidents were recorded this year, while a total of 233,918 hours of training was provided to employees within the industry group.
Indicators
2018/19 2017/18 %
Injuries (number) 55 81 (32)
Training (hours) 233,918 269,469 (13)
Social and Relationship Capital
The Group recognises value in engaging with all stakeholders within operational communities and its value chain partners to ensure sustainable operations. The industry group encourages dialogue with the community and collaborates with key stakeholders to improve the well-being of the community within which it
operates, in addition to focusing on youth empowerment through CSR projects.
The industry group supports such development through dissemination of knowledge and best practices to strengthen the supply chain and thereby the service quality of Leisure operations. Produce sourced from the local community is also expected to foster entrepreneurship
Relevance/Implication : Supply chain and sustainable sourcing - assessing and educating significant suppliers to ensure mitigation of negative impacts with respect to environment, labour and human rights aspects. Community development - community engagement and collaborative operations within the community to create and maintain good relations.
Targets Initiatives
Engagement with significant supply chain partners-encourage environmentally friendly and socially responsible activities.
Stimulate local economies through sourcing of fresh produce and other outsourced services.
Supplier awareness sessions were carried out to all local suppliers and 10 Maldivian suppliers, educating them on the required standards in terms of the quality, environment protection and health and safety. In addition, supplier audits were carried out covering key suppliers of all City and Resort hotels and the central purchasing office (CPO).
Cinnamon Hotels & Resorts and John Keells Foundation (JKF) commemorated National Coastal and Marine Resource Conservation Week on 15 September 2018 by organising beach clean up programmes at the four coastal resorts in collaboration with the Marine Environment Protection Authority with the participation of over 100 staff volunteers, together with hotels guests and members of the community.
An art competition under the theme "Let's keep our beaches clean" was organised prior to the clean-up, in schools surrounding the respective resorts to enhance awareness and environmental stewardship. Six winners were selected at each location and prizes awarded.
"Cinnamon Life", in association with JKF, was the title sponsor of the "Guru Gedara Festival", the first immersive traditional arts experience in Sri Lanka presented by the Chitrasena Vajira Dance Foundation. The four-day festival aimed at showcasing and raising awareness and appreciation of traditional art forms that are uniquely Sri Lankan. The following impact was recorded in one location:
50 visiting artistes including one foreign panelist
10 traditional artistes at work on the festival site
Over 1,000 visitors of all ages
Over 250 teachers of dance and university students who participated in sessions free of charge
Traditional art forms including ritual and stage dance, drumming, vocalisation, costuming, jewellery making and gok crafting
within the operational environment while supporting growth within the local economy.
The material topics identified for the Leisure industry group under Social and Relationship Capital are as follows:
Supply chain sustainability Community development
OCCUPATIONAL HEALTH AND SAFETY INCIDENTS
(2017/18: 81)
5532%
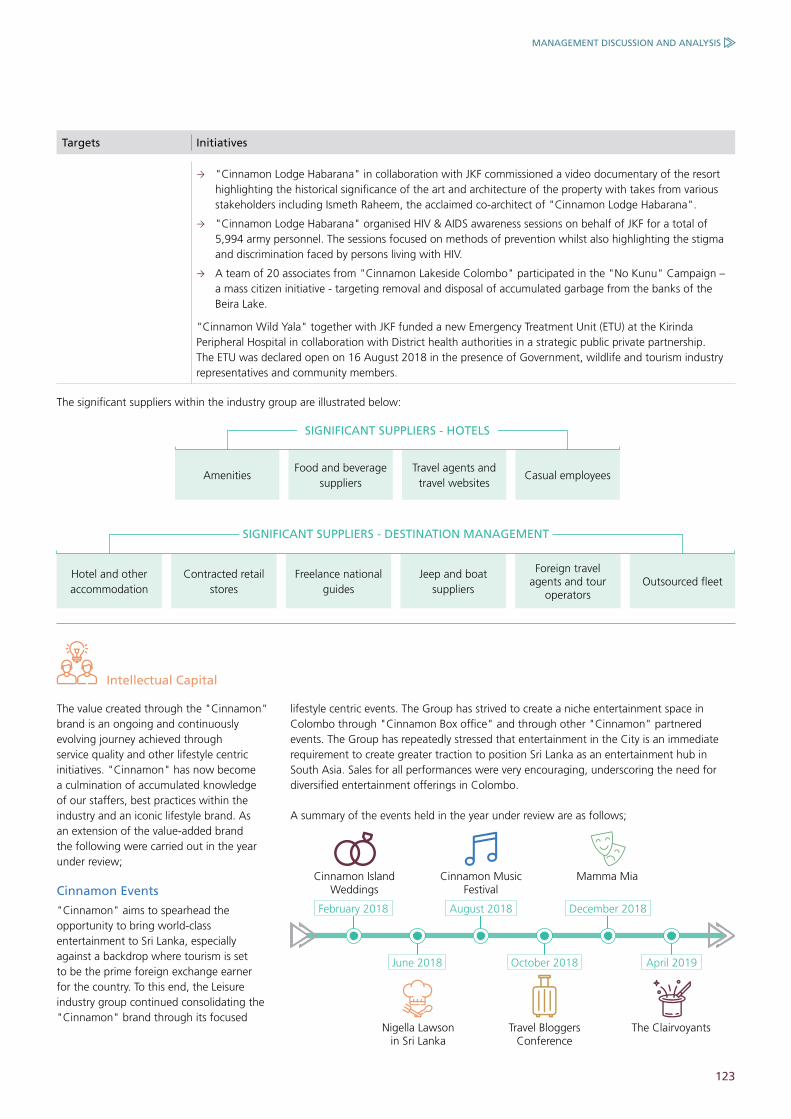
123
Targets Initiatives
"Cinnamon Lodge Habarana" in collaboration with JKF commissioned a video documentary of the resort highlighting the historical significance of the art and architecture of the property with takes from various stakeholders including Ismeth Raheem, the acclaimed co-architect of "Cinnamon Lodge Habarana".
"Cinnamon Lodge Habarana" organised HIV & AIDS awareness sessions on behalf of JKF for a total of 5,994 army personnel. The sessions focused on methods of prevention whilst also highlighting the stigma and discrimination faced by persons living with HIV.
A team of 20 associates from "Cinnamon Lakeside Colombo" participated in the "No Kunu" Campaign – a mass citizen initiative - targeting removal and disposal of accumulated garbage from the banks of the Beira Lake.
"Cinnamon Wild Yala" together with JKF funded a new Emergency Treatment Unit (ETU) at the Kirinda Peripheral Hospital in collaboration with District health authorities in a strategic public private partnership. The ETU was declared open on 16 August 2018 in the presence of Government, wildlife and tourism industry representatives and community members.
The significant suppliers within the industry group are illustrated below:
SIGNIFICANT SUPPLIERS - HOTELS
SIGNIFICANT SUPPLIERS - DESTINATION MANAGEMENT
Amenities
Hotel and other accommodation
Food and beverage suppliers
Contracted retail stores
Travel agents and travel websites
Freelance national guides
Foreign travel agents and tour
operators
Casual employees
Jeep and boat suppliers
Outsourced fleet
Intellectual Capital
The value created through the "Cinnamon" brand is an ongoing and continuously evolving journey achieved through service quality and other lifestyle centric initiatives. "Cinnamon" has now become a culmination of accumulated knowledge of our staffers, best practices within the industry and an iconic lifestyle brand. As an extension of the value-added brand the following were carried out in the year under review;
Cinnamon Events
"Cinnamon" aims to spearhead the opportunity to bring world-class entertainment to Sri Lanka, especially against a backdrop where tourism is set to be the prime foreign exchange earner for the country. To this end, the Leisure industry group continued consolidating the "Cinnamon" brand through its focused
lifestyle centric events. The Group has strived to create a niche entertainment space in Colombo through "Cinnamon Box office" and through other "Cinnamon" partnered events. The Group has repeatedly stressed that entertainment in the City is an immediate requirement to create greater traction to position Sri Lanka as an entertainment hub in South Asia. Sales for all performances were very encouraging, underscoring the need for diversified entertainment offerings in Colombo.
A summary of the events held in the year under review are as follows;
Mamma MiaCinnamon Music Festival
Travel Bloggers Conference
Cinnamon Island Weddings
The ClairvoyantsNigella Lawson in Sri Lanka
MANAGEMENT DISCUSSION AND ANALYSIS
June 2018 October 2018 April 2019
February 2018 August 2018 December 2018
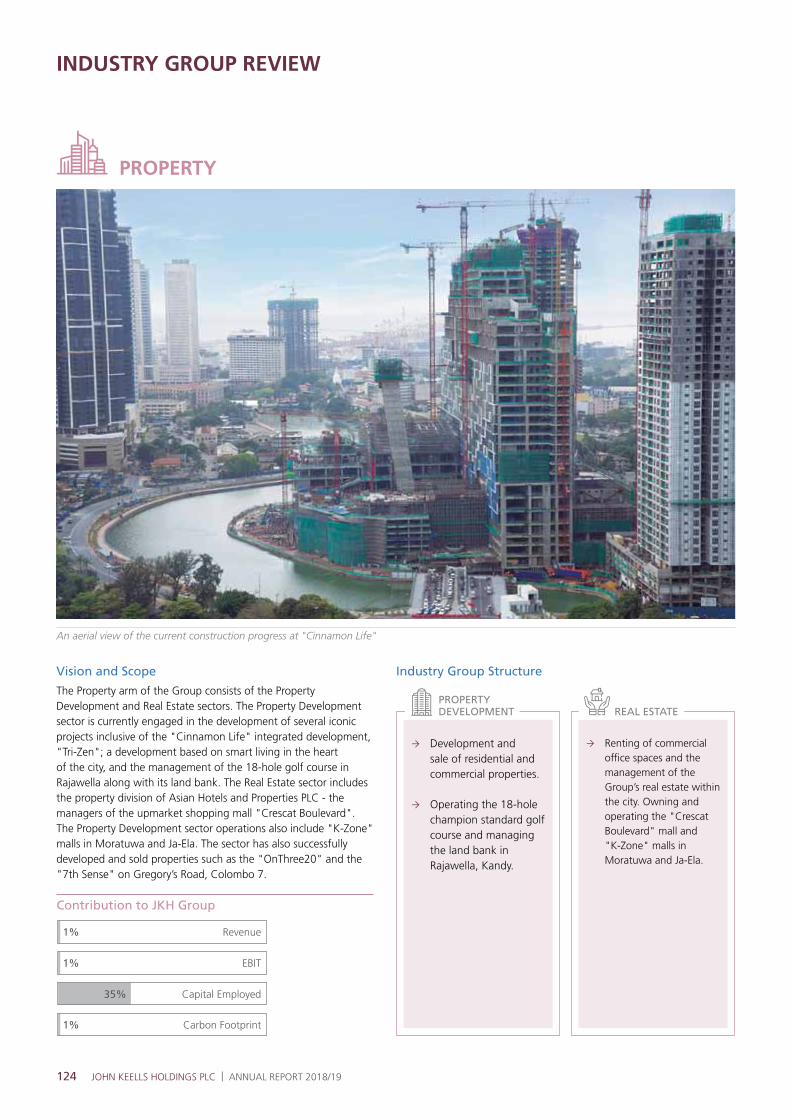
124 JOHN KEELLS HOLDINGS PLC | ANNUAL REPORT 2018/19
PROPERTY
An aerial view of the current construction progress at "Cinnamon Life"
INDUSTRY GROUP REVIEW
Vision and Scope
The Property arm of the Group consists of the Property Development and Real Estate sectors. The Property Development sector is currently engaged in the development of several iconic projects inclusive of the "Cinnamon Life" integrated development, "Tri-Zen"; a development based on smart living in the heart of the city, and the management of the 18-hole golf course in Rajawella along with its land bank. The Real Estate sector includes the property division of Asian Hotels and Properties PLC - the managers of the upmarket shopping mall "Crescat Boulevard". The Property Development sector operations also include "K-Zone" malls in Moratuwa and Ja-Ela. The sector has also successfully developed and sold properties such as the "OnThree20" and the "7th Sense" on Gregory’s Road, Colombo 7.
Contribution to JKH Group
Revenue
1%
1%
35%
1%
EBIT
Capital Employed
Carbon Footprint
Development and sale of residential and commercial properties.
Operating the 18-hole champion standard golf course and managing the land bank in Rajawella, Kandy.
Renting of commercial office spaces and the management of the Group’s real estate within the city. Owning and operating the "Crescat Boulevard" mall and "K-Zone" malls in Moratuwa and Ja-Ela.
Industry Group Structure
PROPERTY DEVELOPMENT REAL ESTATE
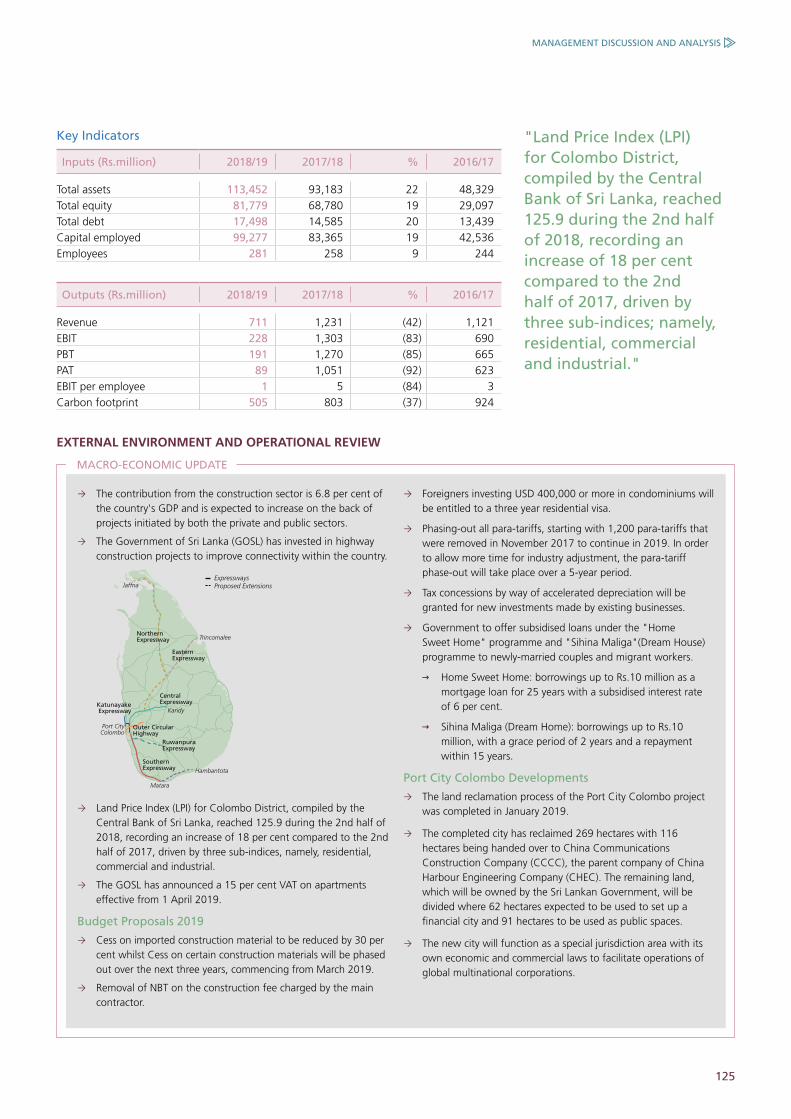
125
Key Indicators
Inputs (Rs.million) 2018/19 2017/18 % 2016/17
Total assets 113,452 93,183 22 48,329 Total equity 81,779 68,780 19 29,097 Total debt 17,498 14,585 20 13,439 Capital employed 99,277 83,365 19 42,536 Employees 281 258 9 244
Outputs (Rs.million) 2018/19 2017/18 % 2016/17
Revenue 711 1,231 (42) 1,121 EBIT 228 1,303 (83) 690 PBT 191 1,270 (85) 665 PAT 89 1,051 (92) 623 EBIT per employee 1 5 (84) 3 Carbon footprint 505 803 (37) 924
EXTERNAL ENVIRONMENT AND OPERATIONAL REVIEW
The contribution from the construction sector is 6.8 per cent of the country's GDP and is expected to increase on the back of projects initiated by both the private and public sectors.
The Government of Sri Lanka (GOSL) has invested in highway construction projects to improve connectivity within the country.
Central Expressway
Northern Expressway
Eastern Expressway
Kandy
Jaffna
Trincomalee
Hambantota
Matara
Port CityColombo
Southern Expressway
Katunayake Expressway
Outer Circular Highway
ExpresswaysProposed Extensions
Ruwanpura Expressway
Land Price Index (LPI) for Colombo District, compiled by the Central Bank of Sri Lanka, reached 125.9 during the 2nd half of 2018, recording an increase of 18 per cent compared to the 2nd half of 2017, driven by three sub-indices, namely, residential, commercial and industrial.
The GOSL has announced a 15 per cent VAT on apartments effective from 1 April 2019.
Budget Proposals 2019
Cess on imported construction material to be reduced by 30 per cent whilst Cess on certain construction materials will be phased out over the next three years, commencing from March 2019.
Removal of NBT on the construction fee charged by the main contractor.
Foreigners investing USD 400,000 or more in condominiums will be entitled to a three year residential visa.
Phasing-out all para-tariffs, starting with 1,200 para-tariffs that were removed in November 2017 to continue in 2019. In order to allow more time for industry adjustment, the para-tariff phase-out will take place over a 5-year period.
Tax concessions by way of accelerated depreciation will be granted for new investments made by existing businesses.
Government to offer subsidised loans under the "Home Sweet Home" programme and "Sihina Maliga"(Dream House) programme to newly-married couples and migrant workers.
Home Sweet Home: borrowings up to Rs.10 million as a mortgage loan for 25 years with a subsidised interest rate of 6 per cent.
Sihina Maliga (Dream Home): borrowings up to Rs.10 million, with a grace period of 2 years and a repayment within 15 years.
Port City Colombo Developments
The land reclamation process of the Port City Colombo project was completed in January 2019.
The completed city has reclaimed 269 hectares with 116 hectares being handed over to China Communications Construction Company (CCCC), the parent company of China Harbour Engineering Company (CHEC). The remaining land, which will be owned by the Sri Lankan Government, will be divided where 62 hectares expected to be used to set up a financial city and 91 hectares to be used as public spaces.
The new city will function as a special jurisdiction area with its own economic and commercial laws to facilitate operations of global multinational corporations.
MACRO-ECONOMIC UPDATE
"Land Price Index (LPI) for Colombo District, compiled by the Central Bank of Sri Lanka, reached 125.9 during the 2nd half of 2018, recording an increase of 18 per cent compared to the 2nd half of 2017, driven by three sub-indices; namely, residential, commercial and industrial."
MANAGEMENT DISCUSSION AND ANALYSIS
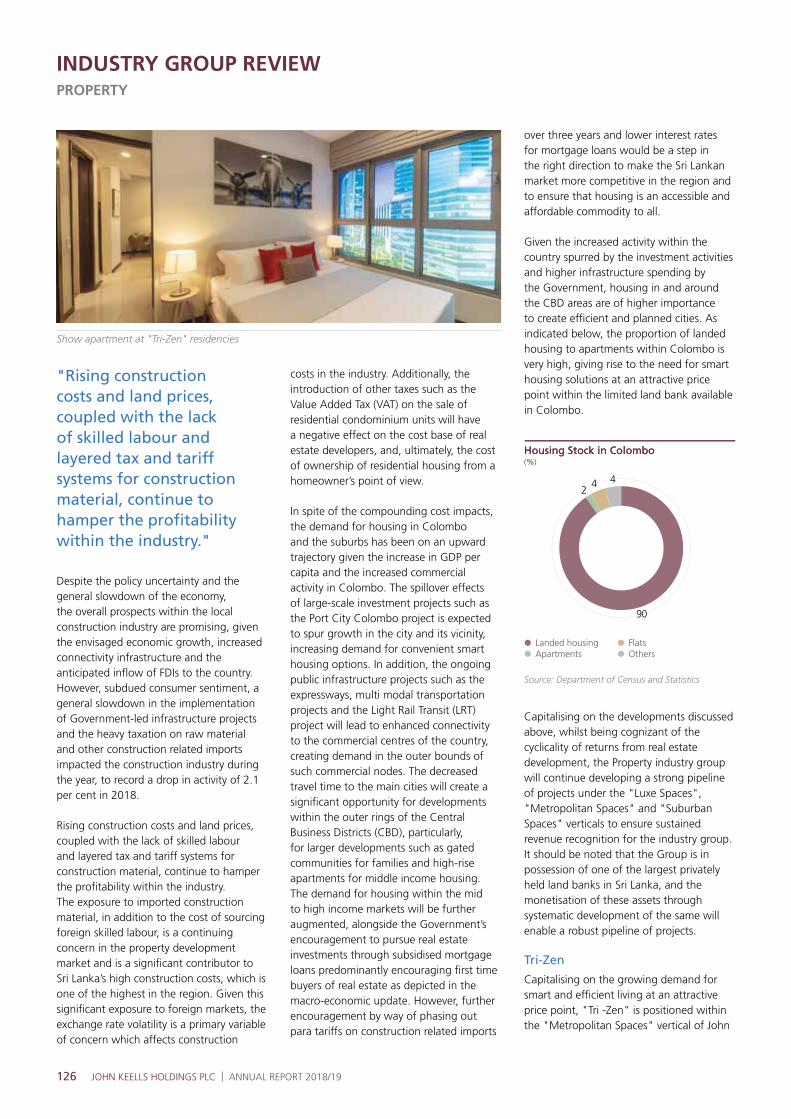
126 JOHN KEELLS HOLDINGS PLC | ANNUAL REPORT 2018/19
INDUSTRY GROUP REVIEWPROPERTY
Despite the policy uncertainty and the general slowdown of the economy, the overall prospects within the local construction industry are promising, given the envisaged economic growth, increased connectivity infrastructure and the anticipated inflow of FDIs to the country. However, subdued consumer sentiment, a general slowdown in the implementation of Government-led infrastructure projects and the heavy taxation on raw material and other construction related imports impacted the construction industry during the year, to record a drop in activity of 2.1 per cent in 2018.
Rising construction costs and land prices, coupled with the lack of skilled labour and layered tax and tariff systems for construction material, continue to hamper the profitability within the industry. The exposure to imported construction material, in addition to the cost of sourcing foreign skilled labour, is a continuing concern in the property development market and is a significant contributor to Sri Lanka’s high construction costs, which is one of the highest in the region. Given this significant exposure to foreign markets, the exchange rate volatility is a primary variable of concern which affects construction
"Rising construction costs and land prices, coupled with the lack of skilled labour and layered tax and tariff systems for construction material, continue to hamper the profitability within the industry."
costs in the industry. Additionally, the introduction of other taxes such as the Value Added Tax (VAT) on the sale of residential condominium units will have a negative effect on the cost base of real estate developers, and, ultimately, the cost of ownership of residential housing from a homeowner’s point of view.
In spite of the compounding cost impacts, the demand for housing in Colombo and the suburbs has been on an upward trajectory given the increase in GDP per capita and the increased commercial activity in Colombo. The spillover effects of large-scale investment projects such as the Port City Colombo project is expected to spur growth in the city and its vicinity, increasing demand for convenient smart housing options. In addition, the ongoing public infrastructure projects such as the expressways, multi modal transportation projects and the Light Rail Transit (LRT) project will lead to enhanced connectivity to the commercial centres of the country, creating demand in the outer bounds of such commercial nodes. The decreased travel time to the main cities will create a significant opportunity for developments within the outer rings of the Central Business Districts (CBD), particularly, for larger developments such as gated communities for families and high-rise apartments for middle income housing. The demand for housing within the mid to high income markets will be further augmented, alongside the Government’s encouragement to pursue real estate investments through subsidised mortgage loans predominantly encouraging first time buyers of real estate as depicted in the macro-economic update. However, further encouragement by way of phasing out para tariffs on construction related imports
4
90
42
Landed housingApartments
FlatsOthers
Housing Stock in ColomboHousing Stock in Colombo(%)(%)
Source: Department of Census and Statistics
Show apartment at "Tri-Zen" residencies
over three years and lower interest rates for mortgage loans would be a step in the right direction to make the Sri Lankan market more competitive in the region and to ensure that housing is an accessible and affordable commodity to all.
Given the increased activity within the country spurred by the investment activities and higher infrastructure spending by the Government, housing in and around the CBD areas are of higher importance to create efficient and planned cities. As indicated below, the proportion of landed housing to apartments within Colombo is very high, giving rise to the need for smart housing solutions at an attractive price point within the limited land bank available in Colombo.
Capitalising on the developments discussed above, whilst being cognizant of the cyclicality of returns from real estate development, the Property industry group will continue developing a strong pipeline of projects under the "Luxe Spaces", "Metropolitan Spaces" and "Suburban Spaces" verticals to ensure sustained revenue recognition for the industry group. It should be noted that the Group is in possession of one of the largest privately held land banks in Sri Lanka, and the monetisation of these assets through systematic development of the same will enable a robust pipeline of projects.
Tri-Zen
Capitalising on the growing demand for smart and efficient living at an attractive price point, "Tri -Zen" is positioned within the "Metropolitan Spaces" vertical of John

127
"The equity and debt financing requirement for the 'Cinnamon Life' project remains secured with the conclusion of the required debt financing for the project in December 2014 and availability of cash reserves."
Keells Properties, providing convenient and smart living in the heart of the city. The apartments, offered at attractive Rupee price points, mitigating risk against the depreciation of the Rupee, provides the buyers with an opportunity to purchase housing in Colombo with convenient access to the city’s hospitals, restaurants, schools, hotels and shopping malls whilst also providing access to the business hub of the city. "Tri-Zen" apartments are based on smart design principles, maximising space, comfort and efficient living, with a number of integrated innovative features to redefine city living.
The project developed as a joint venture with Indra Traders (Private) Limited, has recorded encouraging pre-sales in the year under review, with 200 apartments sold as at 31 March 2019. It is also heartening to note that a majority of the current buyers are first-time home buyers, a trend that the Property industry group has been targeting with the launch of "Metropolitan" spaces. The construction of the apartment is well underway and amid completing its piling work. The project is slated for completion in the first half of CY2023. It is pertinent to note that the revenue emanating from the sale of apartments of "Tri-Zen" will be recognised from the first quarter of 2019/20 onwards till project completion.
Cinnamon Life
The construction of the "Cinnamon Life" project is progressing with encouraging momentum, where the structural work of all buildings is now complete, and the installation of the mechanical and electrical services and the external facades are currently underway. The date for project completion now takes into account the staggered opening of some elements of the project and completion of all works
including the detailed interior design work. Accordingly, the completion dates of the residential and office towers will be March 2020, whilst the operations of the hotel and retail mall are expected to commence in March 2021.
The project cost, as estimated in 2013, was approximately USD 805 million, excluding interest during construction and applicable taxes and customs duties. Based on the finalised design concepts and increases in cost since 2013, the project cost is now estimated to be approximately 10 per cent higher.
The pre-sales of the Residential Towers; "The Suites of Cinnamon Life" and "The Residencies at Cinnamon Life" is currently at 65 per cent of total area available for sale, despite the general slowdown in the residential market. Given the steep depreciation of the Rupee and the political disruption in the country during the last quarter of 2018, the traction on the apartment and office sales has been subdued. The momentum is expected to improve as completion draws nearer. The total revenue from the sales of the residential apartments and 10 floors of the commercial office space of the "Cinnamon Life" project is estimated to be USD 250 million, which will be recognised post the handover of the sold units on commencement of operations.
The equity and debt financing requirement for the "Cinnamon Life" project remains secured with the conclusion of the required debt financing for the project in December
2014 and availability of cash reserves to meet equity commitments through the capital raised, and internally generated cash. The relevant sections of the USD 395 million syndicated project loan agreement will be amended to reflect the revised timelines of the project.
Vauxhall Land Development Limited
As discussed in the JKH Annual Report 2017/18, the Group acquired a 2.09-acre plot of land on Vauxhall Street for a consideration of Rs.4.37 billion. This asset was consolidated with an existing land plot of 3.56-acres, transferred from Whittall Boustead Limited (WBL), and 3.73 acres of land owned by Finlays Colombo Limited through a joint venture agreement signed in March 2018. The resulting contiguous 9.38-acre property is one of the largest privately held land banks in central Colombo and is within a proposed zoning area identified under the Beira Lake development plan of the Urban Development Authority (UDA). The strategic location in fast growing Colombo 02, has approximately 450 metres of street frontage, a majority of which faces the planned waterfront recreation zone in the Beira Lake Intervention Area Development Plan—which allows for a large-scale development with unobstructed views of the Beira Lake. This site which is one of the 15 sites identified for development, is classified as a residential and mixed-use development hub. The land parcels identified are expected to appreciate in price given the strategic positioning in the scenic vicinity of the Beira Lake waterfront and the development potential identified.
Ongoing piling work at "Tri-Zen"
MANAGEMENT DISCUSSION AND ANALYSIS

128 JOHN KEELLS HOLDINGS PLC | ANNUAL REPORT 2018/19
INDUSTRY GROUP REVIEWPROPERTY
Master plan concepts for a phased development of the site were identified through an international design competition, and architectural design work for the first phase is now underway. John Keells Properties aims to develop this primarily for metropolitan housing, complemented by other supporting commercial uses. The development on this site in many ways will define and set the benchmark for the new waterfront precinct of the city.
Rajawella Holdings Limited
The refurbishment of the golf course is well underway and will be relaunched under the management of Troon International; the largest golf course operator in the world with over 2.5 million members worldwide. The partnership is expected to boost the visibility of the course and position it as a championship golf course in the region.
The master planning for the remainder of the land bank has been completed and will be implemented in due course, in tandem with the completion of the Colombo - Kandy Expressway, where the increased connectivity is expected to unlock a significant appreciation in the land value.
Mall Operations
The mall operations of the industry group recorded a steady growth in the year under review, with occupancies above 90 per cent across all properties whilst a variety of promotional activities and other themed events drove footfall during the year. The key indicators pertaining to the mall operations are as follows;
Mall Operation Occupancy (%)
2018/19 2017/18
Crescat 97 98
"K-Zone" Ja-Ela 91 88
"K-Zone" Moratuwa 85 91
STRATEGY AND OUTLOOK
Property and real estate development in Sri Lanka is expected to continue its growth momentum in the ensuing years driven by the need for residential and commercial spaces, increased investment in infrastructure and an emerging upper-middle class consumer base. Notwithstanding the impact of the Easter Sunday terror attacks in April 2019, construction activity is expected grow in line with the envisaged demand to account for a greater portion of GDP in the ensuing years, especially considering the infrastructure led growth phase in the country. The Government-led infrastructure development programmes, alongside other subsidised loans and mortgage schemes offered by the Budget proposals, creates a significant opportunity for construction and real estate industries while boosting demand for prime real estate in the city.
Approximately 60-70 per cent of housing in regional mega cities, both luxury and mid-tier, are predominantly apartments to ensure maximum value creation within a limited land bank. However, apartment living in Colombo is approximately 9 per cent, despite the scarcity of land representing an opportunity within the market.
INSIGHTS
Projects in the Pipeline
The medium to long-term strategy of the industry group is focused on the positioning of John Keells Properties, as the leading real estate developer in the country. To this end, the industry group will develop differentiated projects incorporating luxury, convenience and smart living. Cognizant of the envisaged growth, the industry group is in the process of evaluating and consolidating a robust pipeline of projects to enable enhanced and sustained earnings over the medium and long-term.
The demand for housing, particularly middle to higher income housing in Colombo and the suburbs, is expected to be on the rise given the increased business and commercial activity within Colombo, as discussed. It should be noted that similar to other regional markets, Sri Lanka’s demand for high rise residential apartments in Colombo is on the rise, given the scarcity and price escalation of prime land in Colombo. The industry group will capitalise on such opportunities through developments such as "Tri-Zen", and monetising the extensive land bank of prime real estate in Colombo in order to generate steady returns for the industry group.
Proposed zoning plan by the UDA
JKH - Finlays amalgamated land
9.3 acres(Mixed development / residential zone)
Identified land parcels under the proposed Beira Lake development plan by the UDA
Beira Lake
D.R. W
ijewardena Mawatha
Union Place
Cinnamon Life integrated development
T.B.
Jay
a M
awat
ha
"Apartment living in Colombo is approximately 9 per cent, despite the scarcity of land representing an opportunity within the market."
Lotus Tower
Vauxhall street
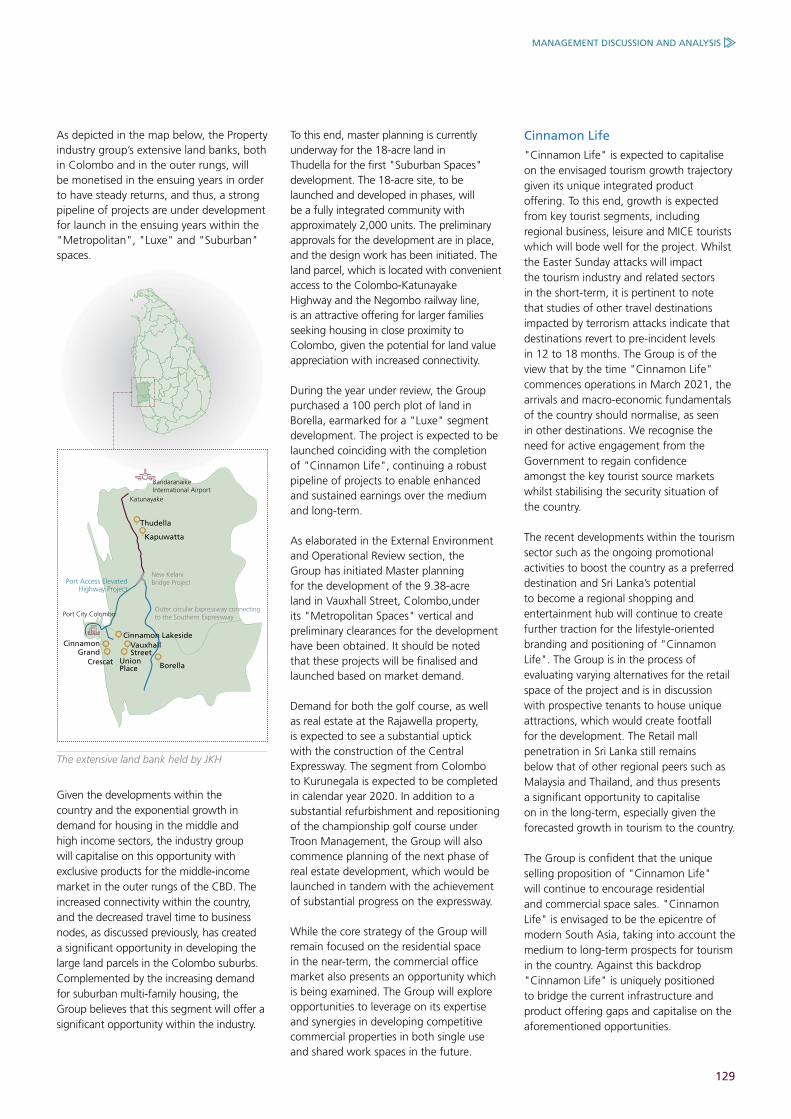
129
Given the developments within the country and the exponential growth in demand for housing in the middle and high income sectors, the industry group will capitalise on this opportunity with exclusive products for the middle-income market in the outer rungs of the CBD. The increased connectivity within the country, and the decreased travel time to business nodes, as discussed previously, has created a significant opportunity in developing the large land parcels in the Colombo suburbs. Complemented by the increasing demand for suburban multi-family housing, the Group believes that this segment will offer a significant opportunity within the industry.
To this end, master planning is currently underway for the 18-acre land in Thudella for the first "Suburban Spaces" development. The 18-acre site, to be launched and developed in phases, will be a fully integrated community with approximately 2,000 units. The preliminary approvals for the development are in place, and the design work has been initiated. The land parcel, which is located with convenient access to the Colombo-Katunayake Highway and the Negombo railway line, is an attractive offering for larger families seeking housing in close proximity to Colombo, given the potential for land value appreciation with increased connectivity.
During the year under review, the Group purchased a 100 perch plot of land in Borella, earmarked for a "Luxe" segment development. The project is expected to be launched coinciding with the completion of "Cinnamon Life", continuing a robust pipeline of projects to enable enhanced and sustained earnings over the medium and long-term.
As elaborated in the External Environment and Operational Review section, the Group has initiated Master planning for the development of the 9.38-acre land in Vauxhall Street, Colombo,under its "Metropolitan Spaces" vertical and preliminary clearances for the development have been obtained. It should be noted that these projects will be finalised and launched based on market demand.
Demand for both the golf course, as well as real estate at the Rajawella property, is expected to see a substantial uptick with the construction of the Central Expressway. The segment from Colombo to Kurunegala is expected to be completed in calendar year 2020. In addition to a substantial refurbishment and repositioning of the championship golf course under Troon Management, the Group will also commence planning of the next phase of real estate development, which would be launched in tandem with the achievement of substantial progress on the expressway.
While the core strategy of the Group will remain focused on the residential space in the near-term, the commercial office market also presents an opportunity which is being examined. The Group will explore opportunities to leverage on its expertise and synergies in developing competitive commercial properties in both single use and shared work spaces in the future.
Cinnamon Life
"Cinnamon Life" is expected to capitalise on the envisaged tourism growth trajectory given its unique integrated product offering. To this end, growth is expected from key tourist segments, including regional business, leisure and MICE tourists which will bode well for the project. Whilst the Easter Sunday attacks will impact the tourism industry and related sectors in the short-term, it is pertinent to note that studies of other travel destinations impacted by terrorism attacks indicate that destinations revert to pre-incident levels in 12 to 18 months. The Group is of the view that by the time "Cinnamon Life" commences operations in March 2021, the arrivals and macro-economic fundamentals of the country should normalise, as seen in other destinations. We recognise the need for active engagement from the Government to regain confidence amongst the key tourist source markets whilst stabilising the security situation of the country.
The recent developments within the tourism sector such as the ongoing promotional activities to boost the country as a preferred destination and Sri Lanka’s potential to become a regional shopping and entertainment hub will continue to create further traction for the lifestyle-oriented branding and positioning of "Cinnamon Life". The Group is in the process of evaluating varying alternatives for the retail space of the project and is in discussion with prospective tenants to house unique attractions, which would create footfall for the development. The Retail mall penetration in Sri Lanka still remains below that of other regional peers such as Malaysia and Thailand, and thus presents a significant opportunity to capitalise on in the long-term, especially given the forecasted growth in tourism to the country.
The Group is confident that the unique selling proposition of "Cinnamon Life" will continue to encourage residential and commercial space sales. "Cinnamon Life" is envisaged to be the epicentre of modern South Asia, taking into account the medium to long-term prospects for tourism in the country. Against this backdrop "Cinnamon Life" is uniquely positioned to bridge the current infrastructure and product offering gaps and capitalise on the aforementioned opportunities.
As depicted in the map below, the Property industry group’s extensive land banks, both in Colombo and in the outer rungs, will be monetised in the ensuing years in order to have steady returns, and thus, a strong pipeline of projects are under development for launch in the ensuing years within the "Metropolitan", "Luxe" and "Suburban" spaces.
MANAGEMENT DISCUSSION AND ANALYSIS
The extensive land bank held by JKH
Katunayake
Thudella
Kapuwatta
Port Access Elevated Highway Project
New Kelani Bridge Project
Outer circular Expressway connecting to the Southern Expressway
Bandaranaike International Airport
Crescat
Cinnamon Grand
Union Place Borella
Cinnamon LakesideVauxhall Street
Port City Colombo

130 JOHN KEELLS HOLDINGS PLC | ANNUAL REPORT 2018/19
INDUSTRY GROUP REVIEWPROPERTY
Financial and Manufactured Capital
Revenue* (Rs.million) 2018/19 2017/18 %
Total 711 1,231 (42)Property Development 137 676 (80)Real Estate 574 555 4
*Including share of revenue of equity accounted investees
The significant decrease in the revenue of the industry group is driven by the Property Development sector. The sector recorded a one-off gain of Rs.558 million in 2017/18 due to the recognition of deferred revenue arising from the re-assessment of the revenue recognition policy at Rajawella Holdings Limited (RHL) on the sale of leasehold rights.
Excluding the impact of the one-off gain at RHL, the revenue increase within the sector was recorded at 6 per cent. The resort operations and golf course operations at RHL were intermittently closed due to the ongoing refurbishment at the premises in the year under review.
It should be noted that revenue from the "Cinnamon Life" project will only be recognised post the handover of units whilst revenue from the "Tri-Zen" project will be recognised from 2019/20 onwards.
The increase in revenue of the Real Estate sector is on account of higher occupancy at "K-Zone" Ja-Ela.
EBITDA (Rs.million) 2018/19 2017/18 %
Total 323 1,382 (77)Property Development (53) 792 (107)Real Estate 376 590 (36)
The EBITDA discussion that follows is inclusive of fair value gains/losses on investment property (IP). The Group is of the view that fair value gains/losses on IP is integral to the industry group’s core operations, given the land banking strategy of the Property industry group, and the view of monetising such lands in the near-term through development and sales.
The decrease in EBITDA of the Property Development sector is mainly attributable to the aforementioned one-off recognition of deferred revenue at RHL in 2017/18 and the ramp-up of administration and promotion costs of the two on-going projects – "Cinnamon Life" and "Tri-Zen".
The Real Estate sector of the industry group recorded a decline in EBITDA as a result of a fair value loss on IP at "Crescat". "K-Zone" Ja-Ela, also reported a decline in its IP valuation gain in 2018/19, impacting EBITDA. Collectively, both properties resulted in a decline in fair value amounting to Rs.295 million compared to the previous year.
PBT* (Rs.million) 2018/19 2017/18 %
Total 191 1,270 (85)Property Development (101) 744 (114)Real Estate 292 526 (44)
*Share of results of equity accounted investees are shown net of all related taxes
In addition to the factors impacting EBITDA, PBT was also marginally impacted by finance costs incurred across its businesses.
Whilst "Cinnamon Life" is consolidated under the Property industry group, it is pertinent to note that all project related costs of "Cinnamon Life", including finance expense incurred under the syndicated project development facility, are capitalised in accordance with Sri Lanka Accounting standards (SLFRS/LKAS), unless explicitly mentioned. During the year under review, debt at "Cinnamon Life" increased by Rs.3.56 billion to Rs.17.07 billion.
CAPITAL MANAGEMENT REVIEW
Progressing from the discussion on the External Environment and Operational Review, the discussion that ensues captures the forms of Capital available, and how each of these forms of Capital are honed to create value for all stakeholders. The discussion on the forms of Capital, where relevant is structured to emphasise goals, targets and initiatives undertaken.
Goals under relevant Capital
Targets we set for ourselves
Our initiatives
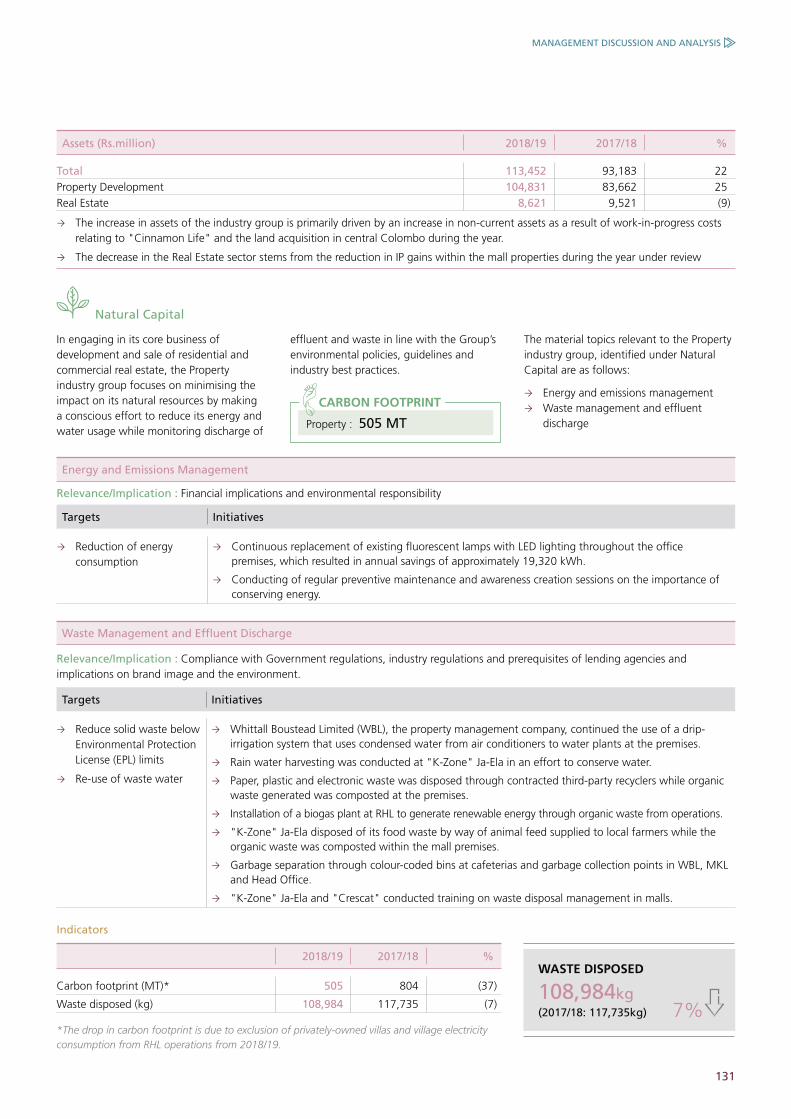
131
Assets (Rs.million) 2018/19 2017/18 %
Total 113,452 93,183 22 Property Development 104,831 83,662 25 Real Estate 8,621 9,521 (9)
The increase in assets of the industry group is primarily driven by an increase in non-current assets as a result of work-in-progress costs relating to "Cinnamon Life" and the land acquisition in central Colombo during the year.
The decrease in the Real Estate sector stems from the reduction in IP gains within the mall properties during the year under review
Natural Capital
In engaging in its core business of development and sale of residential and commercial real estate, the Property industry group focuses on minimising the impact on its natural resources by making a conscious effort to reduce its energy and water usage while monitoring discharge of
effluent and waste in line with the Group’s environmental policies, guidelines and industry best practices.
Property : 505 MT
CARBON FOOTPRINT
Energy and Emissions Management
Relevance/Implication : Financial implications and environmental responsibility
Targets Initiatives
Reduction of energy consumption
Continuous replacement of existing fluorescent lamps with LED lighting throughout the office premises, which resulted in annual savings of approximately 19,320 kWh.
Conducting of regular preventive maintenance and awareness creation sessions on the importance of conserving energy.
Waste Management and Effluent Discharge
Relevance/Implication : Compliance with Government regulations, industry regulations and prerequisites of lending agencies and implications on brand image and the environment.
Targets Initiatives
Reduce solid waste below Environmental Protection License (EPL) limits
Re-use of waste water
Whittall Boustead Limited (WBL), the property management company, continued the use of a drip-irrigation system that uses condensed water from air conditioners to water plants at the premises.
Rain water harvesting was conducted at "K-Zone" Ja-Ela in an effort to conserve water.
Paper, plastic and electronic waste was disposed through contracted third-party recyclers while organic waste generated was composted at the premises.
Installation of a biogas plant at RHL to generate renewable energy through organic waste from operations.
"K-Zone" Ja-Ela disposed of its food waste by way of animal feed supplied to local farmers while the organic waste was composted within the mall premises.
Garbage separation through colour-coded bins at cafeterias and garbage collection points in WBL, MKL and Head Office.
"K-Zone" Ja-Ela and "Crescat" conducted training on waste disposal management in malls.
The material topics relevant to the Property industry group, identified under Natural Capital are as follows:
Energy and emissions management Waste management and effluent
discharge
MANAGEMENT DISCUSSION AND ANALYSIS
Indicators
2018/19 2017/18 %
Carbon footprint (MT)* 505 804 (37)
Waste disposed (kg) 108,984 117,735 (7)
*The drop in carbon footprint is due to exclusion of privately-owned villas and village electricity consumption from RHL operations from 2018/19.
7%
WASTE DISPOSED
(2017/18: 117,735kg)
108,984kg
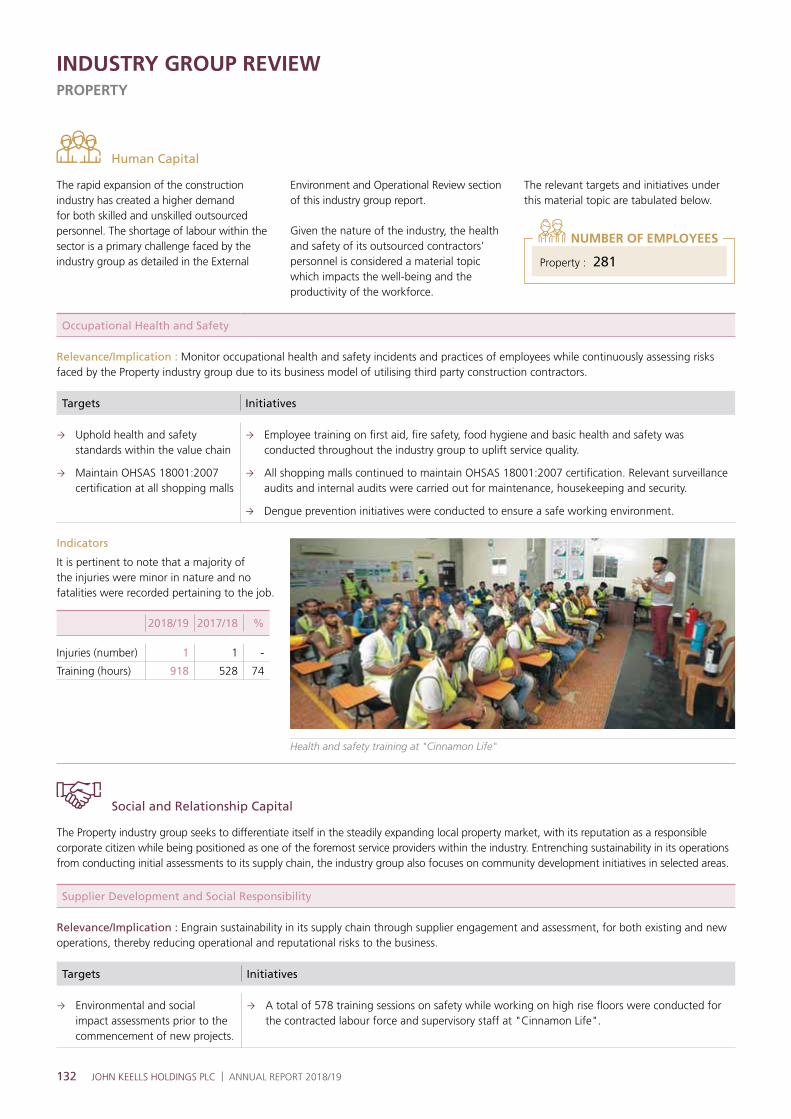
132 JOHN KEELLS HOLDINGS PLC | ANNUAL REPORT 2018/19
INDUSTRY GROUP REVIEWPROPERTY
The rapid expansion of the construction industry has created a higher demand for both skilled and unskilled outsourced personnel. The shortage of labour within the sector is a primary challenge faced by the industry group as detailed in the External
Human Capital
Property : 281
NUMBER OF EMPLOYEES
Environment and Operational Review section of this industry group report.
Given the nature of the industry, the health and safety of its outsourced contractors’ personnel is considered a material topic which impacts the well-being and the productivity of the workforce.
The relevant targets and initiatives under this material topic are tabulated below.
Occupational Health and Safety
Relevance/Implication : Monitor occupational health and safety incidents and practices of employees while continuously assessing risks faced by the Property industry group due to its business model of utilising third party construction contractors.
Targets Initiatives
Uphold health and safety standards within the value chain
Maintain OHSAS 18001:2007 certification at all shopping malls
Employee training on first aid, fire safety, food hygiene and basic health and safety was conducted throughout the industry group to uplift service quality.
All shopping malls continued to maintain OHSAS 18001:2007 certification. Relevant surveillance audits and internal audits were carried out for maintenance, housekeeping and security.
Dengue prevention initiatives were conducted to ensure a safe working environment.
Indicators
It is pertinent to note that a majority of the injuries were minor in nature and no fatalities were recorded pertaining to the job.
2018/19 2017/18 %
Injuries (number) 1 1 -
Training (hours) 918 528 74
Social and Relationship Capital
The Property industry group seeks to differentiate itself in the steadily expanding local property market, with its reputation as a responsible corporate citizen while being positioned as one of the foremost service providers within the industry. Entrenching sustainability in its operations from conducting initial assessments to its supply chain, the industry group also focuses on community development initiatives in selected areas.
Supplier Development and Social Responsibility
Relevance/Implication : Engrain sustainability in its supply chain through supplier engagement and assessment, for both existing and new operations, thereby reducing operational and reputational risks to the business.
Targets Initiatives
Environmental and social impact assessments prior to the commencement of new projects.
A total of 578 training sessions on safety while working on high rise floors were conducted for the contracted labour force and supervisory staff at "Cinnamon Life".
Health and safety training at "Cinnamon Life"

133
Targets Initiatives
Uphold health and safety standards within the value chain.
12,804 training sessions were completed including on the spot training, special training and refreshment trainings on areas such as safe lifting, signal men and traffic management, for contacted staff at "Cinnamon Life".
Monthly emergency evacuation drills, first aid training, fire warden training, advanced fire-fighting training, training on working in confined spaces was also conducted at "Cinnamon Life".
All companies within the industry group reviewed and tested their business continuity plans on a regular basis to ensure risk management and adaptability.
All suppliers are required to sign off on a sustainability check-list, where the industry group maintains stringent criteria for pre-qualification of suppliers / contractors.
The Property industry group, in collaboration with John Keells Foundation (JKF), continued to refurbish and maintain the Slave Island Railway Station for the 16th consecutive year, including its water and sanitation and garden facilities, to enhance commuter experience.
Investment: Rs.526,059.19
Users benefited: 703,514
Sustainability goals: SDG 11: Sustainable Cities and Communities
IMPACT:
Having identified challenges arising from the lack of a suitable location for community activities to be carried out in Wekanda, the industry group also commenced construction of a Community Centre at De Mel Park, in collaboration with JKF and the Colombo Municipal Council (CMC).
Construction operations were preceded by a needs assessment, stakeholder engagement and development of plans and allocation of funding for the construction as well as the entering into of Memorandum of Understanding between JKF and the CMC.
As part of sustained community interventions, a wide-ranging community awareness programme was conducted via JKF for the residents in the Wekanda area benefiting 75 participants
Refer the Group Consolidated Review for further details - page 52
The significant suppliers within the industry group are illustrated below:
SIGNIFICANT SUPPLIERS
Construction contractorsArchitects and interior
designers
The significant suppliers specific to Rajawella Holdings Limited is depicted below:
SIGNIFICANT SUPPLIERS
Amenities Food and beverage suppliersTravel agents and travel
websitesCasual employees
All significant suppliers have been assessed for significant negative impacts on environmental, labour and human rights aspects.
MANAGEMENT DISCUSSION AND ANALYSIS
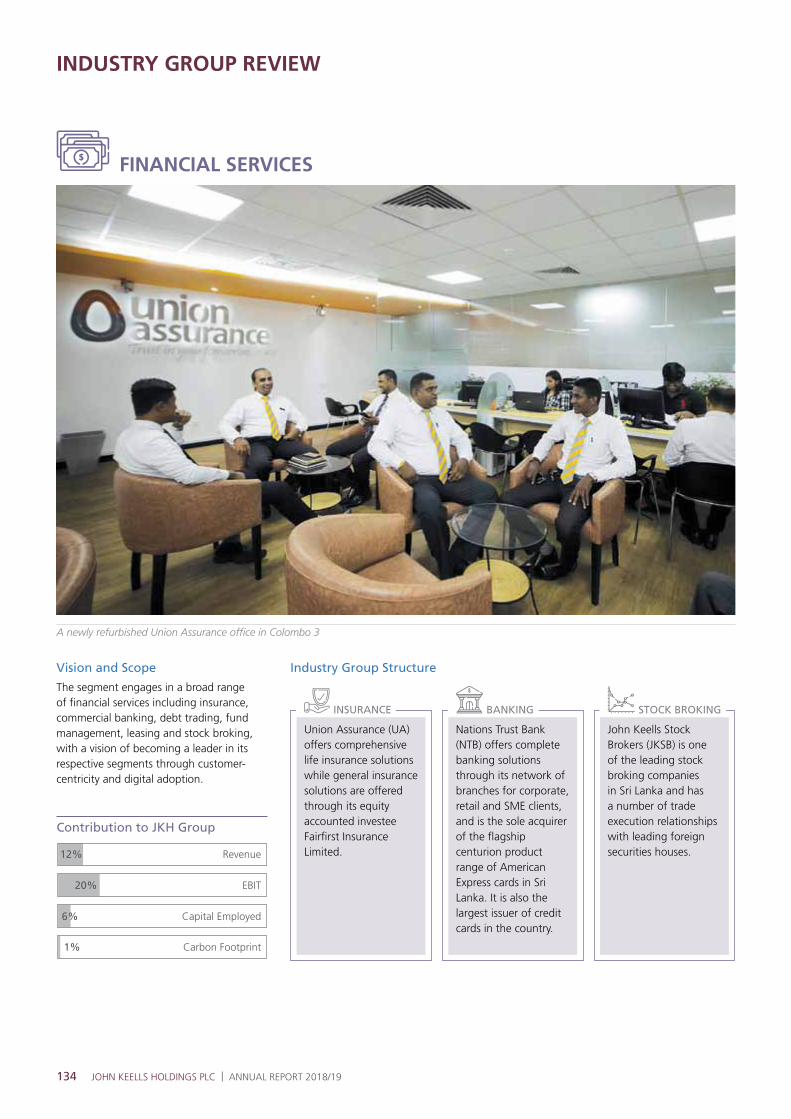
134 JOHN KEELLS HOLDINGS PLC | ANNUAL REPORT 2018/19
FINANCIAL SERVICES
A newly refurbished Union Assurance office in Colombo 3
INDUSTRY GROUP REVIEW
Vision and Scope
The segment engages in a broad range of financial services including insurance, commercial banking, debt trading, fund management, leasing and stock broking, with a vision of becoming a leader in its respective segments through customer-centricity and digital adoption.
Contribution to JKH Group
Revenue12%
20%
6%
1%
EBIT
Capital Employed
Carbon Footprint
Union Assurance (UA) offers comprehensive life insurance solutions while general insurance solutions are offered through its equity accounted investee Fairfirst Insurance Limited.
Nations Trust Bank (NTB) offers complete banking solutions through its network of branches for corporate, retail and SME clients, and is the sole acquirer of the flagship centurion product range of American Express cards in Sri Lanka. It is also the largest issuer of credit cards in the country.
John Keells Stock Brokers (JKSB) is one of the leading stock broking companies in Sri Lanka and has a number of trade execution relationships with leading foreign securities houses.
Industry Group Structure
INSURANCE BANKING STOCK BROKING
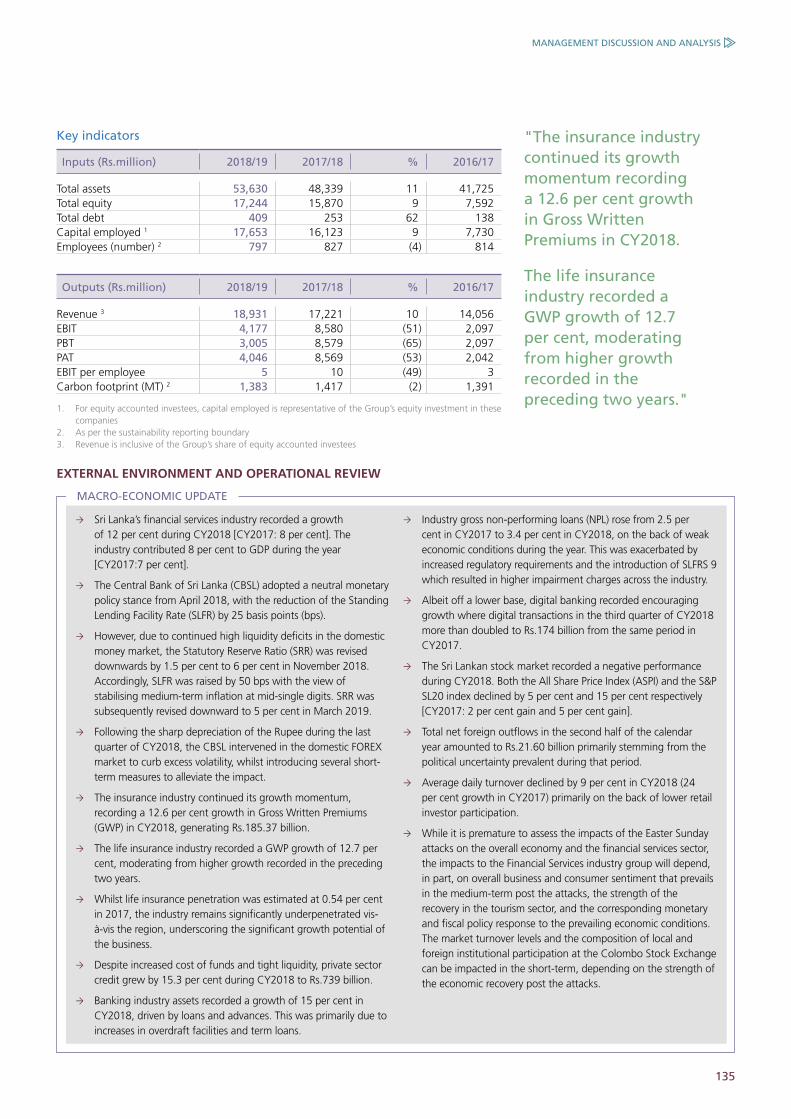
135
Key indicators
Inputs (Rs.million) 2018/19 2017/18 % 2016/17
Total assets 53,630 48,339 11 41,725 Total equity 17,244 15,870 9 7,592 Total debt 409 253 62 138 Capital employed 1 17,653 16,123 9 7,730 Employees (number) 2 797 827 (4) 814
Outputs (Rs.million) 2018/19 2017/18 % 2016/17
Revenue 3 18,931 17,221 10 14,056 EBIT 4,177 8,580 (51) 2,097 PBT 3,005 8,579 (65) 2,097 PAT 4,046 8,569 (53) 2,042 EBIT per employee 5 10 (49) 3 Carbon footprint (MT) 2 1,383 1,417 (2) 1,391
1. For equity accounted investees, capital employed is representative of the Group’s equity investment in these companies
2. As per the sustainability reporting boundary3. Revenue is inclusive of the Group’s share of equity accounted investees
EXTERNAL ENVIRONMENT AND OPERATIONAL REVIEW
Sri Lanka’s financial services industry recorded a growth of 12 per cent during CY2018 [CY2017: 8 per cent]. The industry contributed 8 per cent to GDP during the year [CY2017:7 per cent].
The Central Bank of Sri Lanka (CBSL) adopted a neutral monetary policy stance from April 2018, with the reduction of the Standing Lending Facility Rate (SLFR) by 25 basis points (bps).
However, due to continued high liquidity deficits in the domestic money market, the Statutory Reserve Ratio (SRR) was revised downwards by 1.5 per cent to 6 per cent in November 2018. Accordingly, SLFR was raised by 50 bps with the view of stabilising medium-term inflation at mid-single digits. SRR was subsequently revised downward to 5 per cent in March 2019.
Following the sharp depreciation of the Rupee during the last quarter of CY2018, the CBSL intervened in the domestic FOREX market to curb excess volatility, whilst introducing several short-term measures to alleviate the impact.
The insurance industry continued its growth momentum, recording a 12.6 per cent growth in Gross Written Premiums (GWP) in CY2018, generating Rs.185.37 billion.
The life insurance industry recorded a GWP growth of 12.7 per cent, moderating from higher growth recorded in the preceding two years.
Whilst life insurance penetration was estimated at 0.54 per cent in 2017, the industry remains significantly underpenetrated vis-à-vis the region, underscoring the significant growth potential of the business.
Despite increased cost of funds and tight liquidity, private sector credit grew by 15.3 per cent during CY2018 to Rs.739 billion.
Banking industry assets recorded a growth of 15 per cent in CY2018, driven by loans and advances. This was primarily due to increases in overdraft facilities and term loans.
Industry gross non-performing loans (NPL) rose from 2.5 per cent in CY2017 to 3.4 per cent in CY2018, on the back of weak economic conditions during the year. This was exacerbated by increased regulatory requirements and the introduction of SLFRS 9 which resulted in higher impairment charges across the industry.
Albeit off a lower base, digital banking recorded encouraging growth where digital transactions in the third quarter of CY2018 more than doubled to Rs.174 billion from the same period in CY2017.
The Sri Lankan stock market recorded a negative performance during CY2018. Both the All Share Price Index (ASPI) and the S&P SL20 index declined by 5 per cent and 15 per cent respectively [CY2017: 2 per cent gain and 5 per cent gain].
Total net foreign outflows in the second half of the calendar year amounted to Rs.21.60 billion primarily stemming from the political uncertainty prevalent during that period.
Average daily turnover declined by 9 per cent in CY2018 (24 per cent growth in CY2017) primarily on the back of lower retail investor participation.
While it is premature to assess the impacts of the Easter Sunday attacks on the overall economy and the financial services sector, the impacts to the Financial Services industry group will depend, in part, on overall business and consumer sentiment that prevails in the medium-term post the attacks, the strength of the recovery in the tourism sector, and the corresponding monetary and fiscal policy response to the prevailing economic conditions. The market turnover levels and the composition of local and foreign institutional participation at the Colombo Stock Exchange can be impacted in the short-term, depending on the strength of the economic recovery post the attacks.
"The insurance industry continued its growth momentum recording a 12.6 per cent growth in Gross Written Premiums in CY2018.
The life insurance industry recorded a GWP growth of 12.7 per cent, moderating from higher growth recorded in the preceding two years."
MACRO-ECONOMIC UPDATE
MANAGEMENT DISCUSSION AND ANALYSIS
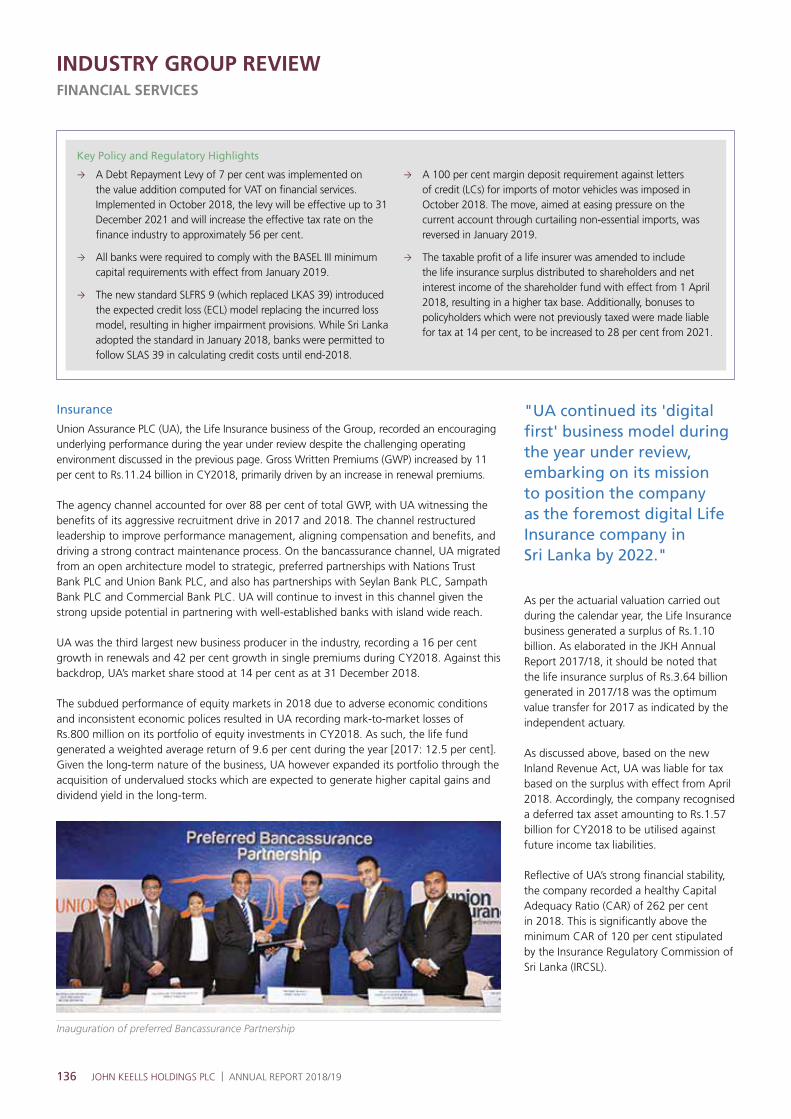
136 JOHN KEELLS HOLDINGS PLC | ANNUAL REPORT 2018/19
Key Policy and Regulatory Highlights
A Debt Repayment Levy of 7 per cent was implemented on the value addition computed for VAT on financial services. Implemented in October 2018, the levy will be effective up to 31 December 2021 and will increase the effective tax rate on the finance industry to approximately 56 per cent.
All banks were required to comply with the BASEL III minimum capital requirements with effect from January 2019.
The new standard SLFRS 9 (which replaced LKAS 39) introduced the expected credit loss (ECL) model replacing the incurred loss model, resulting in higher impairment provisions. While Sri Lanka adopted the standard in January 2018, banks were permitted to follow SLAS 39 in calculating credit costs until end-2018.
A 100 per cent margin deposit requirement against letters of credit (LCs) for imports of motor vehicles was imposed in October 2018. The move, aimed at easing pressure on the current account through curtailing non-essential imports, was reversed in January 2019.
The taxable profit of a life insurer was amended to include the life insurance surplus distributed to shareholders and net interest income of the shareholder fund with effect from 1 April 2018, resulting in a higher tax base. Additionally, bonuses to policyholders which were not previously taxed were made liable for tax at 14 per cent, to be increased to 28 per cent from 2021.
INDUSTRY GROUP REVIEWFINANCIAL SERVICES
Insurance
Union Assurance PLC (UA), the Life Insurance business of the Group, recorded an encouraging underlying performance during the year under review despite the challenging operating environment discussed in the previous page. Gross Written Premiums (GWP) increased by 11 per cent to Rs.11.24 billion in CY2018, primarily driven by an increase in renewal premiums.
The agency channel accounted for over 88 per cent of total GWP, with UA witnessing the benefits of its aggressive recruitment drive in 2017 and 2018. The channel restructured leadership to improve performance management, aligning compensation and benefits, and driving a strong contract maintenance process. On the bancassurance channel, UA migrated from an open architecture model to strategic, preferred partnerships with Nations Trust Bank PLC and Union Bank PLC, and also has partnerships with Seylan Bank PLC, Sampath Bank PLC and Commercial Bank PLC. UA will continue to invest in this channel given the strong upside potential in partnering with well-established banks with island wide reach.
UA was the third largest new business producer in the industry, recording a 16 per cent growth in renewals and 42 per cent growth in single premiums during CY2018. Against this backdrop, UA’s market share stood at 14 per cent as at 31 December 2018.
The subdued performance of equity markets in 2018 due to adverse economic conditions and inconsistent economic polices resulted in UA recording mark-to-market losses of Rs.800 million on its portfolio of equity investments in CY2018. As such, the life fund generated a weighted average return of 9.6 per cent during the year [2017: 12.5 per cent]. Given the long-term nature of the business, UA however expanded its portfolio through the acquisition of undervalued stocks which are expected to generate higher capital gains and dividend yield in the long-term.
As per the actuarial valuation carried out during the calendar year, the Life Insurance business generated a surplus of Rs.1.10 billion. As elaborated in the JKH Annual Report 2017/18, it should be noted that the life insurance surplus of Rs.3.64 billion generated in 2017/18 was the optimum value transfer for 2017 as indicated by the independent actuary.
As discussed above, based on the new Inland Revenue Act, UA was liable for tax based on the surplus with effect from April 2018. Accordingly, the company recognised a deferred tax asset amounting to Rs.1.57 billion for CY2018 to be utilised against future income tax liabilities.
Reflective of UA’s strong financial stability, the company recorded a healthy Capital Adequacy Ratio (CAR) of 262 per cent in 2018. This is significantly above the minimum CAR of 120 per cent stipulated by the Insurance Regulatory Commission of Sri Lanka (IRCSL).
"UA continued its 'digital first' business model during the year under review, embarking on its mission to position the company as the foremost digital Life Insurance company in Sri Lanka by 2022."
Inauguration of preferred Bancassurance Partnership

137
UA continued its "digital first" business model during the year under review, embarking on its mission to position the company as the foremost digital life insurance company in Sri Lanka by 2022. To this end, the business invested Rs.800 million on "eBaoTech", a system which enables automation and real-time analysis of internal processes. The system migration will facilitate the following benefits:
Simplify and accelerate product creation and modification;
Create efficiencies in key aspects in underwriting, policy administration, claim servicing, billing, payments and collection processes;
Improved efficiencies in regulatory reporting;
Pave the way for seamless flow of information within the operational process to assure end-to-end excellence in service delivery.
In addition to the above, UA also upgraded its digital point of sale tool (POS) used by agency and bancassurance sales staff with dynamic proposal functionality, optical character recognition technology (OCR) and enhancing auto underwriting rules to ensure 100 per cent digital submission of proposals and enable straight-through processing.
The business also reinforced its Cyber Security Framework by strengthening and streamlining device management and data protection.
In keeping with its mission to create value to the end consumer, UA launched several new products including;
Union Smart Health Plus – a health rider cover with overseas cover and "cashless service"
Investment Plus – investment product catered to short-term investment needs
GOYO – launch of GOYO freemium app, with enhanced features and improved ecosystem to promote an active lifestyle
"UA was recognised as one of Forbes Asia’s Best Under a Billion 200, the only Sri Lankan company to receive this honour."
NTB branch in Colombo 03
In compliance with Rule 7.13.2. of the Listing Rules of the Colombo Stock Exchange (CSE) which governs minimum public holding for listed entities, JKH divested 1,393,327 ordinary shares of Union Assurance PLC (UA) during the year under review, thereby reducing the Group’s stake to 90 per cent.
Fairfirst Insurance Limited, the General Insurance business in which the Group has a stake of 22 per cent, recorded encouraging premium growth of 14 per cent during CY2018, with a market share of 12 per cent as at 31 December 2018.
During the year under review, UA was recognised as one of Forbes Asia’s Best Under a Billion 200, the only Sri Lankan company to receive this honour. It was also recognised as the Most Trusted Life Insurance Company in Asia at the Asia’s Most Trusted Brand Awards 2018.
Banking
Nations Trust Bank PLC (NTB) recorded steady growth during the year under review primarily driven by an expansion in the Bank’s loan book as well as cross-selling opportunities within the Bank.
Loans and advances grew by 19 per cent in line with the industry, driven by corporate banking, credit cards and leasing. The Consumer and SME Banking segments performed relatively moderately, reflective of stressed market conditions during the calendar year.
Deposits grew by 19 per cent outpacing industry growth of 15 per cent. NTB recorded an improvement in its CASA ratio to 25 per cent, on the back of the Bank’s strategy aimed at strengthening its CASA base through network expansion and strengthening customer relationships.
Consumer Banking
SME Banking
Corporate Banking
Leasing
Growth in loans and advances (%) 15 11 46 20
Growth in deposits (%) 15 24 12 24*
*growth in new business
Healthy growth in the loan book, coupled with active management of asset liability maturity mismatches and strategic repricing enabled the Bank to maintain its Net Interest Margin (NIM) at 4.6 per cent during CY2018 [CY2017: 4.5 per cent]. The cost to income ratio dipped below 50 per cent for the first time to 48 per cent, reflecting investments made in lean culture, productivity enhancements and Robotic Process Automation (RPA), while benefiting from revenue growth.
MANAGEMENT DISCUSSION AND ANALYSIS

138 JOHN KEELLS HOLDINGS PLC | ANNUAL REPORT 2018/19
INDUSTRY GROUP REVIEWFINANCIAL SERVICES
The Bank continued its drive to become a technologically-driven customer-centric bank with an investment of Rs.880 million in information technology systems during CY2018. The investment will facilitate improved turnaround times, process efficiencies, scalability and stronger risk management. Digital self-service channels were widened during the year, with upgrades made to mobile and online banking applications. It should be noted that 60 per cent of all customer transactions have now migrated to digital channels [2016: 40 per cent].
The Bank’s digital banking platform "FriMi", which was launched in 2017, continued its positive growth trajectory, reaching Rs.1 billion in transactions in December 2018. The platform has the largest merchant QR network in the country and is the first to bring API based integration at retail level. The "FriMi" subscriber base grew by over 400 per cent during 2018, despite a marginal slowdown due to CBSL enforcing more stringent regulations regarding customer verification. The Bank leveraged on cross-selling opportunities during the year, partnering "FriMi" with the Corporate Banking division to penetrate key industry segments. "FriMi" was also recognised as one of the top 30 digital banks in the Asia Pacific region by the Asian Banker.
Other digital initiatives implemented during CY2017 including RPA and Open API Banking continued to gain traction with the Bank rolling out several initiatives to simplify processes and drive efficiencies. The Bank continued to leverage on its business intelligence (BI) capabilities and increased data analytics to optimise capacity and strengthen customer service.
The Bank invested in a core leasing system in May 2018 to facilitate better information for decision making. NTB
is also in the midst of implementing a Cash Management System to better support Corporate Banking customers. The implementation of these initiatives is expected to further NTB’s positioning as a futuristic, digitally agile bank, while enhancing customer experience.
The Bank’s micro-financing product ‘Nations Peramaga’, crossed Rs.100 million during the year. This offering is directed towards empowering micro businesses and approximately 60 per cent of the portfolio comprises lending to female entrepreneurs.
INSIGHTS
Stock Broking
The Group’s stock broking arm, John Keells Stockbrokers (JKSB) witnessed a challenging year on the back of a subdued performance of the Colombo Stock Exchange, particularly during the second half of the year. Despite a 33 per cent decline in average daily turnover, JKSB market share increased during the year under review. The business continued to focus on aligning its processes and systems with client needs, introducing efficiency enhancing and cost management initiatives to strengthen both its front office and back office operations.
" 'FriMi' which was launched in 2017 continued its positive growth trajectory, reached Rs.1 billion transactions during December 2018. 'FriMi' was also recognised as one of the top 30 digital banks in the Asia Pacific region by the Asian Banker."
During the calendar year under review, the Bank augmented its capital in line with the requirements of the BASEL III framework through the following initiatives:
Issue of 40,105,614 Convertible Non-Voting Shares (Convertible to Ordinary Voting Shares) to raise a sum of up to Rs.3.21 billion. The issue permitted shareholders to convert shares on a conversion ratio of 1 Ordinary Voting Share for every 1 Convertible Non-Voting Share, every calendar quarter.
Issue of 35 million Basel III compliant, Tier II, listed, rated, unsecured, subordinated, redeemable debentures amounting to Rs.3.50 billion, which was oversubscribed.
A dividend (in the form of Scrip dividend) of Rs 2.10 per share dividend in the proportion of 1 share for every 46.1 Ordinary Voting Shares and 1 share for every 42.0 Convertible Non-Voting Shares (Convertible to Ordinary Voting Shares) for CY2018.
Subsequent to the above initiatives, the core capital ratio improved from 10.8 per cent in CY2017 to 12.2 per cent as at 31 December 2018, whilst the total capital ratio stood at 15.6 per cent as at December 2018. The Bank is currently well in excess of the new regulatory capital requirements which came into force on 1 January 2019.
As discussed above, the introduction of SLFRS 9 resulted in a sharp increase in impairment charges across the industry. The Bank recorded impairment charges of Rs.3.2 billion during CY2018, with increases seen primarily in Consumer, Credit Cards and SME portfolios. In order to mitigate the impact from increased credit cost, the Bank restructured and strengthened its collections and recoveries procedures, whilst reviewing pricing models and leveraging on data analytics tools to identify future credit risks.
NTB was the largest issuer of credit cards in the country with sustained growth from this premium segment. Cards in issue grew by 3 per cent whilst transaction value rose by 18 per cent. The Bank also holds the widest merchant network in Sri Lanka.
INSIGHTS
The Bank was recognised as one of the top five SME Banks of the Year in Asia at the Global SME Finance Awards conducted by the International Finance Corporation. It was the only Sri Lankan to bank achieve this recognition.
AWARDS
139
STRATEGY AND OUTLOOKInsurance
The future prospects for the life insurance industry continue to be promising as a result of insurers playing a more active role in providing long-term health and annuity solutions to an ageing population. This is particularly of importance given the absence of a pension scheme for all citizens. It should be noted that rising consumer wealth and the increasing prevalence of non-communicable diseases (NCDs) have led to growth in life insurance in the past and is a likely trend that will continue.
Leveraging on the business’ strong brand presence, UA will continue to capitalise on the opportunities made available by the low life insurance penetration within the country, complemented by its digital strategy. Whilst the agency channel is expected to be a key contributor to drive revenue and profits, the bancassurance channel is also expected to drive future growth. There is strong potential in bancassurance given the high bank branch density (17 branches per 100,000 people) in Sri Lanka. Through its strategic partnerships with several leading banks in the country, UA will capitalise on the respective banks’ networks to offer differentiated products suitable to meet the dynamic needs of customers.
UA will continue its "digital first" trajectory as it strives to establish itself as the leading digital life insurer in Sri Lanka. Investments in technology are expected to facilitate a wide range of business opportunities to deliver end-to-end operational excellence from the initial point of contact to underwriting and claim settlement. As part of its long-term strategy, UA will focus on changing branch layout aligned with the UA digital agency model. The business will also focus on data analytics for better insight in evaluating the market and devising innovative products and growth strategies in the near-term.
UA will continue its investments into the transformation of the agency and bancassurance cadres. Given the service-centricity of the business transformation, strategies will focus on the continuous improvement of the agency force through skills development and the retention of this trained talent pool. Coupled with experienced staff, UA will aim to grow the life insurance business through enhanced operational excellence by leveraging on its strong brand presence, a differentiated product portfolio, and IT enabled cost effective processes.
Banking
Together with domestic macro-economic challenges, political uncertainty in Sri Lanka may impact the Banking industry in 2019, combining with modest credit growth so far during CY2019. The industry is also in the midst of its own transformation through disruptive business models and digitisation leading from continued growth in IT literacy and smartphone penetration. Some banks may also face challenges in meeting elevated capital adequacy requirements under BASEL III.
The CBSL will continue its focus on strengthening the regulatory framework through several initiatives which augur well for the industry in the medium to long-term:
The CBSL is expected to finalise the new Banking Act in 2019, to be implemented from 2020
The Banking Sustainability Rating Index (BSRI) will be implemented from 2019 for risk-based supervision and planning the supervisory calendar
A new regulatory framework will be established to ensure that treasury operations of licensed banks are carried out prudently and in line with the international best practices
CBSL is in the process of introducing a superior alternative USD/LKR reference rate for the benefit of all stakeholders, including foreign investors
The introduction of an alternative benchmark interest rate based on the marginal cost of banks is planned by the CBSL. This will help improve the sector’s competitiveness
Initiatives to strengthen resilience of banks to cyber security threats will continue
The Bank will continue to drive growth across its business verticals, leveraging on strong customer relationships and its branch network to provide access across the country for all its Consumer, SME and Mid-Market customers. Given the change in banking regulations, managing impairments will be a key priority, aided by the ongoing strengthening of monitoring and recovery processes.
The Bank will continue its digitisation drive, through the expansion of FriMi, branch digitalisation and the automation and further embedding of RPA in bank-wide processes. NTB will also leverage Open API banking for its Corporate and SME businesses, along with the new Cash Management System to bring the full cash flow ecosystem to customers of the Bank.
With a view to further strengthen its capital base, the Bank intends to raise Rs.3.5 billion BASEL III compliant, Tier II, Listed Rated Unsecured Subordinated Debentures with non-viability conversion to ordinary shares. The debentures will be listed on the CSE by way of an offer for subscription.
As mentioned in the Annual Report 2017/18, the Director of Bank Supervision of the Central Bank of Sri Lanka (CBSL) has informed the Bank that the Monetary Board of the CBSL has permitted the John Keells Group and Central Finance Group to retain their respective current shareholdings in the Bank till 31 December 2020 and to reduce
"The future prospects for the life insurance industry continue to be promising on the back of insurers playing a more active role in providing long-term health and annuity solutions to an ageing population. Rising consumer wealth and the increasing prevalence of non-communicable diseases (NCDs) have led to growth in life insurance in the past and is a likely trend that will continue."
MANAGEMENT DISCUSSION AND ANALYSIS
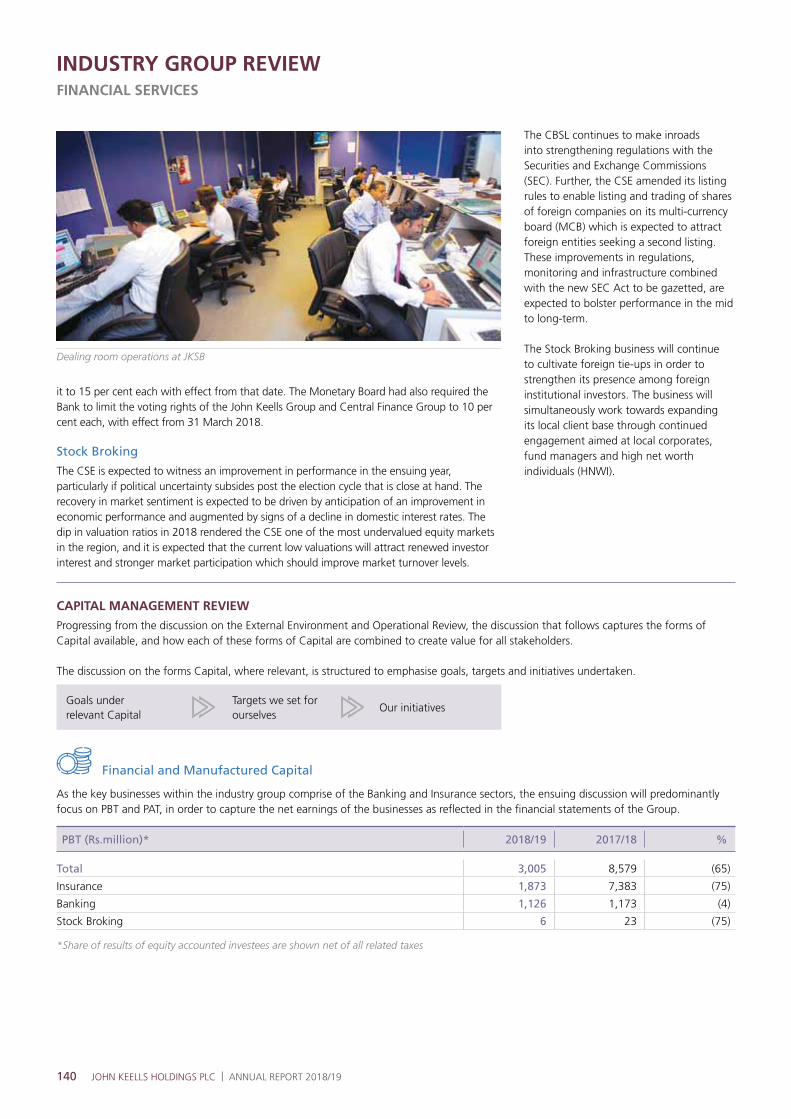
140 JOHN KEELLS HOLDINGS PLC | ANNUAL REPORT 2018/19
INDUSTRY GROUP REVIEWFINANCIAL SERVICES
Financial and Manufactured Capital
As the key businesses within the industry group comprise of the Banking and Insurance sectors, the ensuing discussion will predominantly focus on PBT and PAT, in order to capture the net earnings of the businesses as reflected in the financial statements of the Group.
PBT (Rs.million)* 2018/19 2017/18 %
Total 3,005 8,579 (65)
Insurance 1,873 7,383 (75)
Banking 1,126 1,173 (4)
Stock Broking 6 23 (75)
*Share of results of equity accounted investees are shown net of all related taxes
Goals under relevant Capital
Targets we set for ourselves
Our initiatives
it to 15 per cent each with effect from that date. The Monetary Board had also required the Bank to limit the voting rights of the John Keells Group and Central Finance Group to 10 per cent each, with effect from 31 March 2018.
Stock Broking
The CSE is expected to witness an improvement in performance in the ensuing year, particularly if political uncertainty subsides post the election cycle that is close at hand. The recovery in market sentiment is expected to be driven by anticipation of an improvement in economic performance and augmented by signs of a decline in domestic interest rates. The dip in valuation ratios in 2018 rendered the CSE one of the most undervalued equity markets in the region, and it is expected that the current low valuations will attract renewed investor interest and stronger market participation which should improve market turnover levels.
The CBSL continues to make inroads into strengthening regulations with the Securities and Exchange Commissions (SEC). Further, the CSE amended its listing rules to enable listing and trading of shares of foreign companies on its multi-currency board (MCB) which is expected to attract foreign entities seeking a second listing. These improvements in regulations, monitoring and infrastructure combined with the new SEC Act to be gazetted, are expected to bolster performance in the mid to long-term.
The Stock Broking business will continue to cultivate foreign tie-ups in order to strengthen its presence among foreign institutional investors. The business will simultaneously work towards expanding its local client base through continued engagement aimed at local corporates, fund managers and high net worth individuals (HNWI).
Dealing room operations at JKSB
CAPITAL MANAGEMENT REVIEW
Progressing from the discussion on the External Environment and Operational Review, the discussion that follows captures the forms of Capital available, and how each of these forms of Capital are combined to create value for all stakeholders.
The discussion on the forms Capital, where relevant, is structured to emphasise goals, targets and initiatives undertaken.
141
The notable decline in industry group PBT primarily stems from the Insurance business which recorded a 75 per cent decrease in PBT during the year under review, as explained below.
Increase in renewal and single premiums at UA augmented growth in gross written premiums (GWP), whilst new business premiums remained static.
As communicated in the 2017/18 Annual Report, the life insurance surplus of Rs.3.64 billion was the optimum value transfer for 2017 as indicated by the independent actuary. Whilst a normalisation in line with usual course of operations was anticipated, the business was impacted by the downturn in economic conditions. As such, UA recorded an annual life insurance surplus of Rs.1.10 billion in 2018/19, a notable decline against the life insurance surplus recorded in the previous year.
It is pertinent to note that UA profits for 2017/18 included a one-off surplus of Rs.3.38 billion attributable to non-participating and non-unit fund of unit linked business, which was transferred from the life policyholder fund to the life shareholder fund based on the directive issued by the Insurance Regulatory Commission of Sri Lanka (IRCSL) to the entire insurance industry, dated 20 March 2018.
In addition to the lower life insurance surplus, profits of UA were also impacted by mark-to-market losses on its equity portfolio and regular new business premiums which were static partly due to the disruptions caused by the transition to a new ERP platform. Premiums ceded to reinsurers increased due to a change in reinsurance agreements, whilst other costs increased in line with growth in gross written premiums (GWP) and strategic initiatives as per the long-term business plan of UA.
Up to the period ending 31 March 2018, UA did not recognise a deferred tax asset against its reported tax losses given uncertainty regarding the availability of taxable profits. However, with the introduction of the new tax base as per the Inland Revenue Act No. 24 of 2017, going forward, UA will have taxable income based on UA’s historical experiences and future projections. It is noted that UA is eligible to claim its brought forward tax losses against its taxable income. Accordingly, during the year under review, UA recognised a deferred tax asset of Rs.1.57 billion, arising from brought forward tax losses. In this light, the net income tax charge for 2018/19 of Rs.528 million was offset by the one-off recognition of the deferred tax asset of Rs.1.57 billion in the Income Statement, which resulted in a net income tax reversal of Rs.1.04 billion.
NTB recorded a growth of 21 per cent in net interest income driven by steady loan growth.
The cost to income ratio of NTB also improved during the year, despite an increase in operating expenses on the back of investments in training and development, branding and technology.
Profitability of NTB was impacted by higher impairment charges due to the heightened credit risk from subdued macro-economic conditions and the implementation of SLFRS 9, as discussed under the External Environment and Operational Review section of this Report. Impairment charges increased by 139 per cent during 2018/19, to Rs.3.32 billion.
Market share of the Stock Broking business increased, contributing to a 4 per cent YoY growth in revenue, despite the lacklustre performance of the CSE.
The 75 per cent decrease in PBT in JKSB was mainly attributable to an increase in operational costs associated with upgrading and strengthening back office systems.
PAT (Rs.million) 2018/19 2017/18 %
Total 4,046 8,569 (53)
Insurance 2,916 7,383 (61)
Banking 1,127 1,173 (4)
Stock Broking 3 13 (78)
Banking sector profits was also impacted by the Debt Repayment Levy (DRL) which came into effect in October 2018. A DRL of Rs.387 million resulted in a 16 per cent increase in taxes and levies on financial services during the year under review.
Fairfirst Insurance Limited; the associate company having interests in the general insurance business, witnessed a 5 per cent decline in PAT driven by a decrease in investment income and higher expenses for branch and infrastructure enhancements.
Recurring PAT for the Financial Services industry group was Rs.2.47 billion for 2018/19, compared to a recurring PAT of Rs.5.19 billion in 2017/18.
MANAGEMENT DISCUSSION AND ANALYSIS

142 JOHN KEELLS HOLDINGS PLC | ANNUAL REPORT 2018/19
INDUSTRY GROUP REVIEWFINANCIAL SERVICES
Indicators
2018/19 2017/18 %
Carbon footprint (MT) 1,383 1,417 (2)
The Industry group places a significant emphasis on its Human Capital management, recognising that empowered employees, particularly the sales agents, will enhance customer satisfaction in the wide range of services they provide.
Human Capital
Natural Capital
Energy and Emissions Management
Targets Brief Description
Minimising environmental impacts through sustainable energy conservation initiatives and better management of infrastructure across operations.
Timer switches on split type air condition units were installed at all UA branches to control the compressors, resulting in an annual energy savings of 9,728 kWh per annum.
Master timer switches were installed in the air conditioning units at the head office, enabling control of energy usage. This resulted in annual energy savings of 12,492 kWh.
All traditional bulbs were replaced with LED lights, resulting in an annual energy savings of 12,922 kWh.
Responsible disposal of electronic waste and other through certified third- party vendors.
Fluorescent bulbs, toner cartridges, all types of e-waste and waste paper are recycled through certified vendors.
Water and Effluent Management
Relevance/Implication : Regulatory and brand reputation implications
Targets Brief Description
Ensure that effluents meet requisite water quality where relevant.
The UA branch in Kurunegala includes a waste water treatment plant ensuring that discharged effluents meet the required standards.
Annual collection of 132,000 litres of water arising through the condensation process of air conditioners which was subsequently utilised for the purpose of washing vehicles at UA.
Sensor taps were installed in lunch rooms at UA, minimising wastage of water.
The Financial Services industry group has a comparatively lower exposure to natural resources than other industry groups given the service-oriented nature of its businesses. Regardless, the industry group continues to make a conscious effort to minimise any negative impact on the environment through its operations.
The material topics relevant to the Financial Services industry group, identified under Natural Capital are:
Energy and emissions management Water and effluent management
As such the key initiatives implemented during the year under review are as follows;
Training and development has remained a key part of the industry groups’ initiatives to enhance Human Capital productivity, with a vast number of curated talent management programmes carried out throughout the year encompassing all employee levels. To this end, during the year under review, UA was recognised by
the Great Place to Work (GPTW) Institute for the sixth consecutive year.
The material topics identified under Human Capital are as follows:
Occupational health and safety Talent management
"All traditional bulbs were replaced with LED lights, resulting in annual energy savings of 12,922 kWh."

143
Talent Management
Relevance/Implication : The need to continuously upgrade the skills of existing staff, whilst developing a resource base of professionals
Targets Brief Description
Build a high-performing employee cadre and an agency force through training, development and education.
Continuation of manager development programmes such as "Manager Par-Excellence" and "Exercise Magnum Opus."
A seven-day manager development programme was carried out for selected new managers.
Development programmes "Union Transformers", "Executive Development Programme" aimed at young executive employees were carried out.
Continuation of "The Ladder Project" with the aim of steering career progression for 32 selected non-executive staff members.
Occupational Health and Safety
Relevance/Implication : Providing a safe working environment to improve employee productivity
Targets Brief Description
Strive to ensure a safe and healthy work environment.
The annual fire evacuation drill was carried out at the UA Head Office in association with the Colombo Fire Brigade.
Indicators
2018/19 2017/18 %
Injuries (number) 38 29 31
Training (hours) 14,633 10,462 40
"The industry group constantly engages with the community through a range of initiatives catered towards creating a more empowered community, which in turn creates greater productivity and efficiency within the economy to drive growth."
Social and Relationship Capital
The Financial Services industry group continued to conduct operations within statutory and regulatory requirements in line with global best practices, creating value to its stakeholders by providing world-class services and high-quality products, while operating in accordance with the highest ethical standards and maintaining customer confidentiality.
The industry group constantly engages with the community through a range of initiatives catered towards creating a more empowered community, which in turn creates greater productivity and efficiency within the economy to drive growth.
The significant suppliers within the industry group are:
SIGNIFICANT SUPPLIERS
Reinsurers JanitorsBancassurance
partnersSecurity
TOTAL HOURS OF TRAINING
(2017/18: 10,462)
14,63340%
The material topics identified under the industry group are:
Customer satisfaction Community engagement Ethics, fraud and corruption
MANAGEMENT DISCUSSION AND ANALYSIS

144 JOHN KEELLS HOLDINGS PLC | ANNUAL REPORT 2018/19
INDUSTRY GROUP REVIEWFINANCIAL SERVICES
Customer Satisfaction
Relevance/Implication : Negative impact on key customer accounts, investor and client confidence
Targets Brief Description
Maintain high quality standards within the operating environment enabling the efficient and productive delivery of services.
Value addition through various digital initiatives and implementation of paperless operations, where possible.
Development and launch of several innovative digital solutions such as "FriMi."
Ethics, Fraud and Corruption
Relevance/Implication : Impact on brand reputation and possible regulatory non-compliance
Targets Brief Description
Zero breaches of the Code of Conduct specified by the Group, particularly pertaining to fraud and corruption.
A thorough coverage of corruption and unethical behaviour under the overall risk management process of the Group, particularly considering the relevance to the Financial Services industry group.
Intermittent/recurring internal reviews and audits as part of the continuous emphasis on mitigating fraud and corruption.
Community Engagement
Relevance/Implication : Proactive community engagement towards building trust and promoting brand image
Targets Brief Description
Ensure sound living standards within the community that the company operates in.
Awareness and prevention of diseases such as dengue and diabetes in the country.
UA continued its initiative "Union Manushyathwaya – Danuwath, Suwapath Yahapath Hetak" with the aim of promoting health and well-being around the country through the dissemination of vital information on diseases such as dengue, diabetes and thalassaemia.
Prevention of Epidemic Diseases - In collaboration with the Divisional Ministry of Health (DMOH) and the Public Health Department (PHD) of the Colombo Municipal Council, UA conducted island-wide dengue awareness programmes including house to house visits, school awareness sessions and 'shramadana' campaigns.
Mobile diabetes screening unit under 'Union Manushyathwaya'
"UA continued its initiatives 'Union Manushyathwaya – Danuwath, Suwapath and Yahapath Hetak' with the aim of promoting health and well-being around the country through the dissemination of vital information on diseases such as dengue, diabetes and thalassaemia."
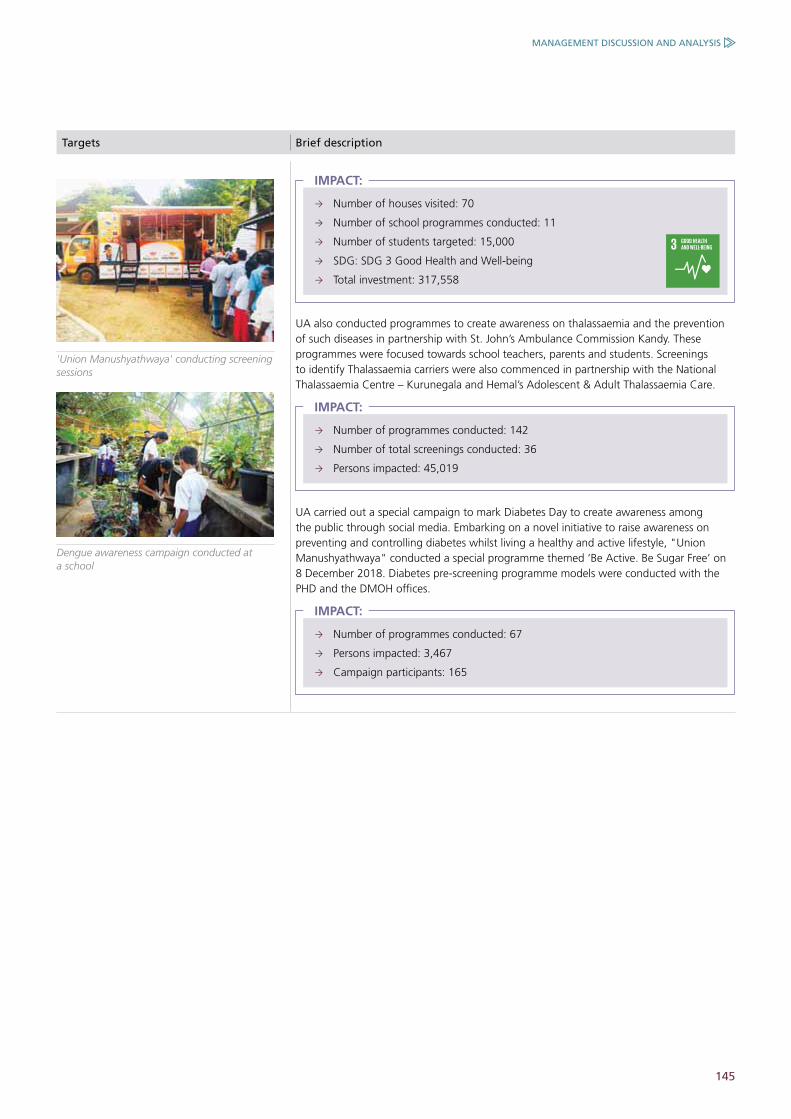
145
Targets Brief description
Number of houses visited: 70
Number of school programmes conducted: 11
Number of students targeted: 15,000
SDG: SDG 3 Good Health and Well-being
Total investment: 317,558
IMPACT:
UA also conducted programmes to create awareness on thalassaemia and the prevention of such diseases in partnership with St. John’s Ambulance Commission Kandy. These programmes were focused towards school teachers, parents and students. Screenings to identify Thalassaemia carriers were also commenced in partnership with the National Thalassaemia Centre – Kurunegala and Hemal’s Adolescent & Adult Thalassaemia Care.
Number of programmes conducted: 142
Number of total screenings conducted: 36
Persons impacted: 45,019
IMPACT:
UA carried out a special campaign to mark Diabetes Day to create awareness among the public through social media. Embarking on a novel initiative to raise awareness on preventing and controlling diabetes whilst living a healthy and active lifestyle, "Union Manushyathwaya" conducted a special programme themed ‘Be Active. Be Sugar Free’ on 8 December 2018. Diabetes pre-screening programme models were conducted with the PHD and the DMOH offices.
Number of programmes conducted: 67
Persons impacted: 3,467
Campaign participants: 165
IMPACT:
'Union Manushyathwaya' conducting screening sessions
Dengue awareness campaign conducted at a school
MANAGEMENT DISCUSSION AND ANALYSIS
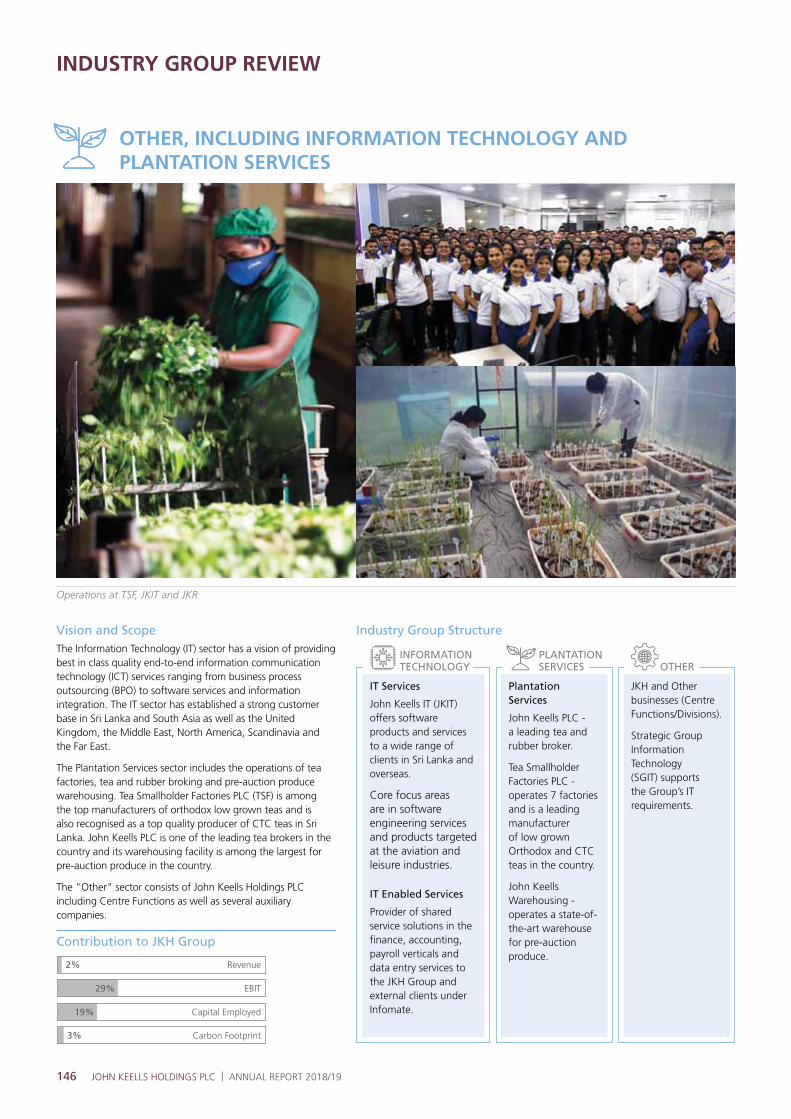
146 JOHN KEELLS HOLDINGS PLC | ANNUAL REPORT 2018/19
OTHER, INCLUDING INFORMATION TECHNOLOGY AND PLANTATION SERVICES
Operations at TSF, JKIT and JKR
INDUSTRY GROUP REVIEW
Vision and ScopeThe Information Technology (IT) sector has a vision of providing best in class quality end-to-end information communication technology (ICT) services ranging from business process outsourcing (BPO) to software services and information integration. The IT sector has established a strong customer base in Sri Lanka and South Asia as well as the United Kingdom, the Middle East, North America, Scandinavia and the Far East.
The Plantation Services sector includes the operations of tea factories, tea and rubber broking and pre-auction produce warehousing. Tea Smallholder Factories PLC (TSF) is among the top manufacturers of orthodox low grown teas and is also recognised as a top quality producer of CTC teas in Sri Lanka. John Keells PLC is one of the leading tea brokers in the country and its warehousing facility is among the largest for pre-auction produce in the country.
The "Other" sector consists of John Keells Holdings PLC including Centre Functions as well as several auxiliary companies.
Contribution to JKH Group
Revenue2%
29%
19%
3%
EBIT
Capital Employed
Carbon Footprint
IT Services
John Keells IT (JKIT) offers software products and services to a wide range of clients in Sri Lanka and overseas.
Core focus areas are in software engineering services and products targeted at the aviation and leisure industries.
IT Enabled Services
Provider of shared service solutions in the finance, accounting, payroll verticals and data entry services to the JKH Group and external clients under Infomate.
Plantation Services
John Keells PLC - a leading tea and rubber broker.
Tea Smallholder Factories PLC - operates 7 factories and is a leading manufacturer of low grown Orthodox and CTC teas in the country.
John Keells Warehousing - operates a state-of-the-art warehouse for pre-auction produce.
JKH and Other businesses (Centre Functions/Divisions).
Strategic Group Information Technology (SGIT) supports the Group’s IT requirements.
Industry Group Structure
INFORMATION TECHNOLOGY
PLANTATION SERVICES OTHER
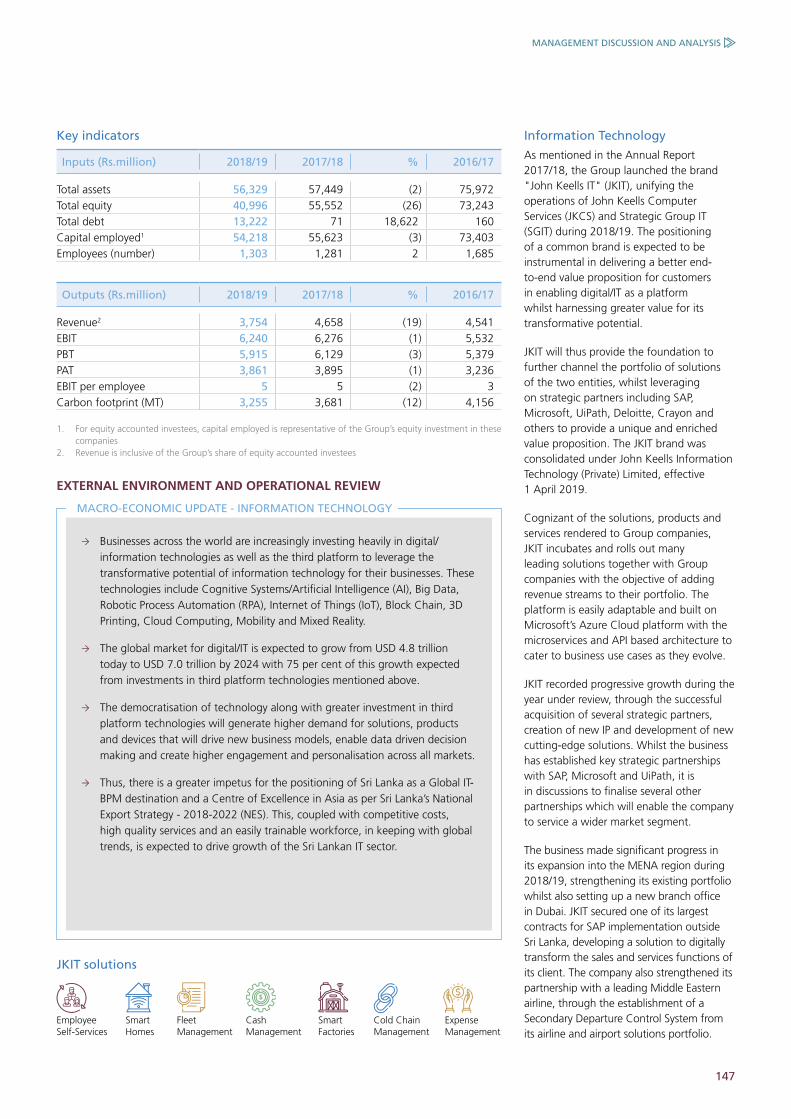
147
Key indicators
Inputs (Rs.million) 2018/19 2017/18 % 2016/17
Total assets 56,329 57,449 (2) 75,972 Total equity 40,996 55,552 (26) 73,243 Total debt 13,222 71 18,622 160 Capital employed1 54,218 55,623 (3) 73,403 Employees (number) 1,303 1,281 2 1,685
Outputs (Rs.million) 2018/19 2017/18 % 2016/17
Revenue2 3,754 4,658 (19) 4,541 EBIT 6,240 6,276 (1) 5,532 PBT 5,915 6,129 (3) 5,379 PAT 3,861 3,895 (1) 3,236 EBIT per employee 5 5 (2) 3 Carbon footprint (MT) 3,255 3,681 (12) 4,156
1. For equity accounted investees, capital employed is representative of the Group’s equity investment in these companies
2. Revenue is inclusive of the Group’s share of equity accounted investees
EXTERNAL ENVIRONMENT AND OPERATIONAL REVIEW
Businesses across the world are increasingly investing heavily in digital/information technologies as well as the third platform to leverage the transformative potential of information technology for their businesses. These technologies include Cognitive Systems/Artificial Intelligence (AI), Big Data, Robotic Process Automation (RPA), Internet of Things (IoT), Block Chain, 3D Printing, Cloud Computing, Mobility and Mixed Reality.
The global market for digital/IT is expected to grow from USD 4.8 trillion today to USD 7.0 trillion by 2024 with 75 per cent of this growth expected from investments in third platform technologies mentioned above.
The democratisation of technology along with greater investment in third platform technologies will generate higher demand for solutions, products and devices that will drive new business models, enable data driven decision making and create higher engagement and personalisation across all markets.
Thus, there is a greater impetus for the positioning of Sri Lanka as a Global IT-BPM destination and a Centre of Excellence in Asia as per Sri Lanka’s National Export Strategy - 2018-2022 (NES). This, coupled with competitive costs, high quality services and an easily trainable workforce, in keeping with global trends, is expected to drive growth of the Sri Lankan IT sector.
MACRO-ECONOMIC UPDATE - INFORMATION TECHNOLOGY
Information Technology
As mentioned in the Annual Report 2017/18, the Group launched the brand "John Keells IT" (JKIT), unifying the operations of John Keells Computer Services (JKCS) and Strategic Group IT (SGIT) during 2018/19. The positioning of a common brand is expected to be instrumental in delivering a better end-to-end value proposition for customers in enabling digital/IT as a platform whilst harnessing greater value for its transformative potential.
JKIT will thus provide the foundation to further channel the portfolio of solutions of the two entities, whilst leveraging on strategic partners including SAP, Microsoft, UiPath, Deloitte, Crayon and others to provide a unique and enriched value proposition. The JKIT brand was consolidated under John Keells Information Technology (Private) Limited, effective 1 April 2019.
Cognizant of the solutions, products and services rendered to Group companies, JKIT incubates and rolls out many leading solutions together with Group companies with the objective of adding revenue streams to their portfolio. The platform is easily adaptable and built on Microsoft’s Azure Cloud platform with the microservices and API based architecture to cater to business use cases as they evolve.
JKIT recorded progressive growth during the year under review, through the successful acquisition of several strategic partners, creation of new IP and development of new cutting-edge solutions. Whilst the business has established key strategic partnerships with SAP, Microsoft and UiPath, it is in discussions to finalise several other partnerships which will enable the company to service a wider market segment.
The business made significant progress in its expansion into the MENA region during 2018/19, strengthening its existing portfolio whilst also setting up a new branch office in Dubai. JKIT secured one of its largest contracts for SAP implementation outside Sri Lanka, developing a solution to digitally transform the sales and services functions of its client. The company also strengthened its partnership with a leading Middle Eastern airline, through the establishment of a Secondary Departure Control System from its airline and airport solutions portfolio.
Smart Factories
Employee Self-Services
Cold Chain Management
Fleet Management
Smart Homes
Expense Management
Cash Management
JKIT solutions
MANAGEMENT DISCUSSION AND ANALYSIS
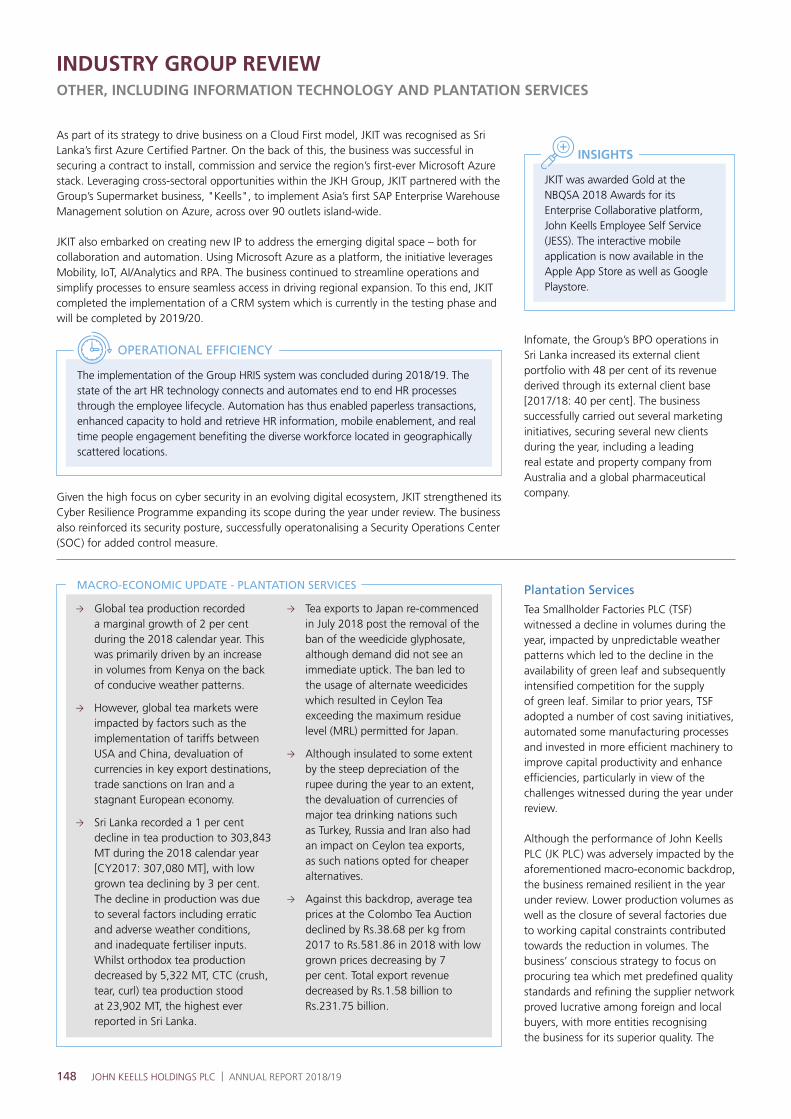
148 JOHN KEELLS HOLDINGS PLC | ANNUAL REPORT 2018/19
INDUSTRY GROUP REVIEWOTHER, INCLUDING INFORMATION TECHNOLOGY AND PLANTATION SERVICES
Global tea production recorded a marginal growth of 2 per cent during the 2018 calendar year. This was primarily driven by an increase in volumes from Kenya on the back of conducive weather patterns.
However, global tea markets were impacted by factors such as the implementation of tariffs between USA and China, devaluation of currencies in key export destinations, trade sanctions on Iran and a stagnant European economy.
Sri Lanka recorded a 1 per cent decline in tea production to 303,843 MT during the 2018 calendar year [CY2017: 307,080 MT], with low grown tea declining by 3 per cent. The decline in production was due to several factors including erratic and adverse weather conditions, and inadequate fertiliser inputs. Whilst orthodox tea production decreased by 5,322 MT, CTC (crush, tear, curl) tea production stood at 23,902 MT, the highest ever reported in Sri Lanka.
Tea exports to Japan re-commenced in July 2018 post the removal of the ban of the weedicide glyphosate, although demand did not see an immediate uptick. The ban led to the usage of alternate weedicides which resulted in Ceylon Tea exceeding the maximum residue level (MRL) permitted for Japan.
Although insulated to some extent by the steep depreciation of the rupee during the year to an extent, the devaluation of currencies of major tea drinking nations such as Turkey, Russia and Iran also had an impact on Ceylon tea exports, as such nations opted for cheaper alternatives.
Against this backdrop, average tea prices at the Colombo Tea Auction declined by Rs.38.68 per kg from 2017 to Rs.581.86 in 2018 with low grown prices decreasing by 7 per cent. Total export revenue decreased by Rs.1.58 billion to Rs.231.75 billion.
MACRO-ECONOMIC UPDATE - PLANTATION SERVICES
As part of its strategy to drive business on a Cloud First model, JKIT was recognised as Sri Lanka’s first Azure Certified Partner. On the back of this, the business was successful in securing a contract to install, commission and service the region’s first-ever Microsoft Azure stack. Leveraging cross-sectoral opportunities within the JKH Group, JKIT partnered with the Group’s Supermarket business, "Keells", to implement Asia’s first SAP Enterprise Warehouse Management solution on Azure, across over 90 outlets island-wide.
JKIT also embarked on creating new IP to address the emerging digital space – both for collaboration and automation. Using Microsoft Azure as a platform, the initiative leverages Mobility, IoT, AI/Analytics and RPA. The business continued to streamline operations and simplify processes to ensure seamless access in driving regional expansion. To this end, JKIT completed the implementation of a CRM system which is currently in the testing phase and will be completed by 2019/20.
The implementation of the Group HRIS system was concluded during 2018/19. The state of the art HR technology connects and automates end to end HR processes through the employee lifecycle. Automation has thus enabled paperless transactions, enhanced capacity to hold and retrieve HR information, mobile enablement, and real time people engagement benefiting the diverse workforce located in geographically scattered locations.
OPERATIONAL EFFICIENCY
Given the high focus on cyber security in an evolving digital ecosystem, JKIT strengthened its Cyber Resilience Programme expanding its scope during the year under review. The business also reinforced its security posture, successfully operatonalising a Security Operations Center (SOC) for added control measure.
JKIT was awarded Gold at the NBQSA 2018 Awards for its Enterprise Collaborative platform, John Keells Employee Self Service (JESS). The interactive mobile application is now available in the Apple App Store as well as Google Playstore.
INSIGHTS
Infomate, the Group’s BPO operations in Sri Lanka increased its external client portfolio with 48 per cent of its revenue derived through its external client base [2017/18: 40 per cent]. The business successfully carried out several marketing initiatives, securing several new clients during the year, including a leading real estate and property company from Australia and a global pharmaceutical company.
Plantation Services
Tea Smallholder Factories PLC (TSF) witnessed a decline in volumes during the year, impacted by unpredictable weather patterns which led to the decline in the availability of green leaf and subsequently intensified competition for the supply of green leaf. Similar to prior years, TSF adopted a number of cost saving initiatives, automated some manufacturing processes and invested in more efficient machinery to improve capital productivity and enhance efficiencies, particularly in view of the challenges witnessed during the year under review.
Although the performance of John Keells PLC (JK PLC) was adversely impacted by the aforementioned macro-economic backdrop, the business remained resilient in the year under review. Lower production volumes as well as the closure of several factories due to working capital constraints contributed towards the reduction in volumes. The business’ conscious strategy to focus on procuring tea which met predefined quality standards and refining the supplier network proved lucrative among foreign and local buyers, with more entities recognising the business for its superior quality. The

149
business also upgraded its software system with the objective of enhancing customer experience and improving process efficiencies during the year under review.
The Warehousing business recorded an increase in capacity utilisation with the quantity stored during the year increasing by 9 per cent during the year under review.
Other
John Keells Research (JKR), the research and development arm of the Group, reached a significant milestone during the year under review, completing the building of a prototype energy storage device. Having filed its first patent for a novel energy storage material in 2017, the application was published by the World Intellectual Property Office (WIPO) during the year under review. The prototype thus utilises the patented technology to enhance the Technology Readiness Level (TRL) and marketability of the intellectual property, allowing JKR to commence marketing the technology to potential licensees.
JKR concluded its collaborative research project with a US university, which commenced in 2017/18, to develop technologies for converting waste to energy. JKR is currently exploring avenues to commercialise the technology in Sri Lanka. JKR also embarked on a project employing drone technology in combination with AI based multispectral image analysis for the inspection of infrastructure. During the year under review, JKR also initiated "Innowave @ Techcity", a series of inspirational talks designed to share knowledge and spur collaboration. JKR will continue to host the talk series every quarter.
JKR was the only private sector based research group that was selected to participate in the project "Enabling IP Environment (EIE)" conducted by WIPO. JKR’s submission based on its patented technology was selected for Remote Mentorship as part of the project, with JKR also working on commercialising the said technology.
In addition to the above, JKR concluded its collaborative research project with the Human Genetics Units at the University of Colombo which led to the sequencing of the entire genome of "Godawee", an indigenous salt tolerant indica rice.
The team has since commenced on the next phase of the project which includes greenhouse testing.
During the year under review, the Group continued its social entrepreneurship initiative "Plasticcycle", which was launched in 2017/18 with the aim of significantly reducing plastic pollution in Sri Lanka. Plasticcycle completed the first phase of its Southern Expressway Project with the placement of 48 specially designed bins at all exit points and the service area of the Southern Expressway. The plastic waste collected through this project is recycled into value-added products that are sold in both the local and international markets by the recycling partner. Bins were also placed at "Keells" outlets across Colombo and Kalutara Districts and several tourist attractions.
Plasticcycle is currently supporting a pilot project initiated by the Sri Lanka Navy which aims to address non-recyclable plastics which is a significant cause of concern for the country. Additionally, it continued to undertake awareness initiatives including a trilingual anti-plastic burning campaign on social media, installation of banners at exit points of the Southern Expressway, handing out reusable bags to 3,000 children of group employees and continuous advocacy with regulatory bodies.
Dissemination of good agricultural practices
"PLASTICCYCLE" SOCIAL ENTREPRENEURSHIP INITIATIVE
Approximately 130 collection bins placed across the Western and Southern Provinces in collaboration with the Leisure, Consumer Foods and Retail industry groups.
Over 20 MT of plastic waste collected and recycled through partners registered with the Sri Lanka Recycling Association.
123 MT of plastic waste sent for recycling by Group companies for 2018/19.
INSIGHTS
MANAGEMENT DISCUSSION AND ANALYSIS
150 JOHN KEELLS HOLDINGS PLC | ANNUAL REPORT 2018/19
INDUSTRY GROUP REVIEW
Plantation Services
The global demand for tea is expected to gain momentum despite the subdued performance of the tea industry during 2018/19. Stemming from the appreciation of tea prices in Sri Lanka towards the end of CY2018, and the expected stabilisation of currencies in key export markets following the strengthening in oil prices, Sri Lankan tea exports are expected to continue their growth trajectory. Gains are also anticipated for low grown tea following growing demand from several Middle Eastern countries.
Although weather related issues remain key factors impacting business, the removal of the ban on glyphosate will enable plantation companies to increase production and reduce maximum residue levels (MRL) in keeping with the requirements for the Japanese and European markets. The Sri Lanka Tea Board’s (SLTB) focus on existing and potential markets such as China, Germany and the US, and measures towards curtailing the adulteration of tea in order to maintain the image of Ceylon Tea, augur well for all players in the industry. Although significant competition from tea producing nations, particularly Kenya, is expected, the Group anticipates Ceylon Tea to be resilient against such competition given its brand presence, unique flavour and quality.
TSF will continue its policy of focusing on the quality of its products while also diversifying its manufacturing mix to meet market trends and mitigate risk. Cost optimisation and improving factory utilisation also remain key focus areas for the business in the near-term. The business will continue its initiatives of replanting unproductive tea lands owned by smallholders, together with the introduction of sustainable plantation methods to ensure a sustainable operating model. TSF will also work towards obtaining the Rainforest Alliance Certification for its factories, which will enable the business to target a wider target audience, particularly in the European market.
The Warehousing business will continue to work closely with tea factories/producers to maintain and improve relationships while increasing warehousing utilisation. The business will also explore further expansion opportunities, based on requirements.
John Keells X, the corporate start-up accelerator run by JKH, continued its accelerator programme for 6 applicants who emerged winners of the second phase of "John Keells X - Open Innovation Challenge 2017". One team secured approval for further investment during the year under review. JKX 3.0 was launched in December 2018, where up to 7 teams will receive seed investment, entry to the programme and the opportunity to pitch for Rs.50 million in follow-on funding. 15 teams have been selected for the pre-accelerator programme under JKX 3.0.
STRATEGY AND OUTLOOKInformation Technology
The impacts of cloud computing, analytics and product innovation will continue to be key growth drivers as digital transformation evolves, facilitated by advanced networking. Against this backdrop, businesses will modernise core systems whilst embedding security, control and privacy in business culture and processes.
Sri Lanka’s IT sector is also expected to witness significant growth, through strengthened infrastructure, supportive policies and improving data and network connectivity. The Sri Lanka Association of Software and Service Companies (SLASSCOM) anticipates the IT/BPO sector to generate USD 5 billion in export revenue, provide over 200,000 skilled jobs and facilitate an ecosystem for start-ups by 2022.
In order to accelerate sector growth and build capacity, the Government of Sri Lanka has proposed several concessions through its 2019 Budget including:
removal of the minimum employee threshold required to qualify for the additional tax deduction (equal to 35 per cent of salary cost);
ESC rate for companies in the business of providing Information Technology Services which are subject to Income Tax at 14 per cent will be reduced from 0.5 per cent to 0.25 per cent;
Limited Liability Partnerships Structures to support financing for start-ups.
JKIT will continue to build and expand on its current capabilities and strengths whilst evaluating opportunities to create futuristic digital solutions including cloud computing, IoT, AI and mobility, amongst others. The strategic focus on key markets, principals and GTM partners alongside the development of own IP will help drive focused growth and expand into new markets. Cross-pollination of different technologies would be a near-term priority of the Group to ensure future ready product design and business models.
Having developed and successfully rolled out several key products within the John Keells Group, the business will explore prospects of scalability and expansion of these solutions to external parties. Following the encouraging growth trajectory of its business in the MENA region, the business will also explore opportunities in other regions including wider Asia and Europe. Further, certifications acquired through working with several key partners are expected to open more opportunities in generating new business.
JKIT has also established Robotics Process Automation, incubating the required skills within the organisation which will form the basis for further development in the immediate term. The business will continue to cross-pollinate digital solutions within the Group, incorporating digital stack extensions, elements of IoT and data analytics. This will ensure the creation of a more composite dashboard of information. Given the multitude of strategies in place to expand its offering, the Group expects a significant growth in the pipeline of business for JKIT.
Infomate is expected to continue its current momentum by increasing its market share through the acquisition of new clients. The business will focus on diversifying to higher-end jobs whilst consolidating its staff cadre. Infomate will also continue to work with JKIT to further automate several processes to enhance efficiency.
JKIT will continue to leverage on its strategic partnerships with SAP, Microsoft, and IBM, among others, to expand its client and partner footprint whilst placing emphasis on reviewing and rationalising product and service portfolios.
OTHER, INCLUDING INFORMATION TECHNOLOGY AND PLANTATION SERVICES
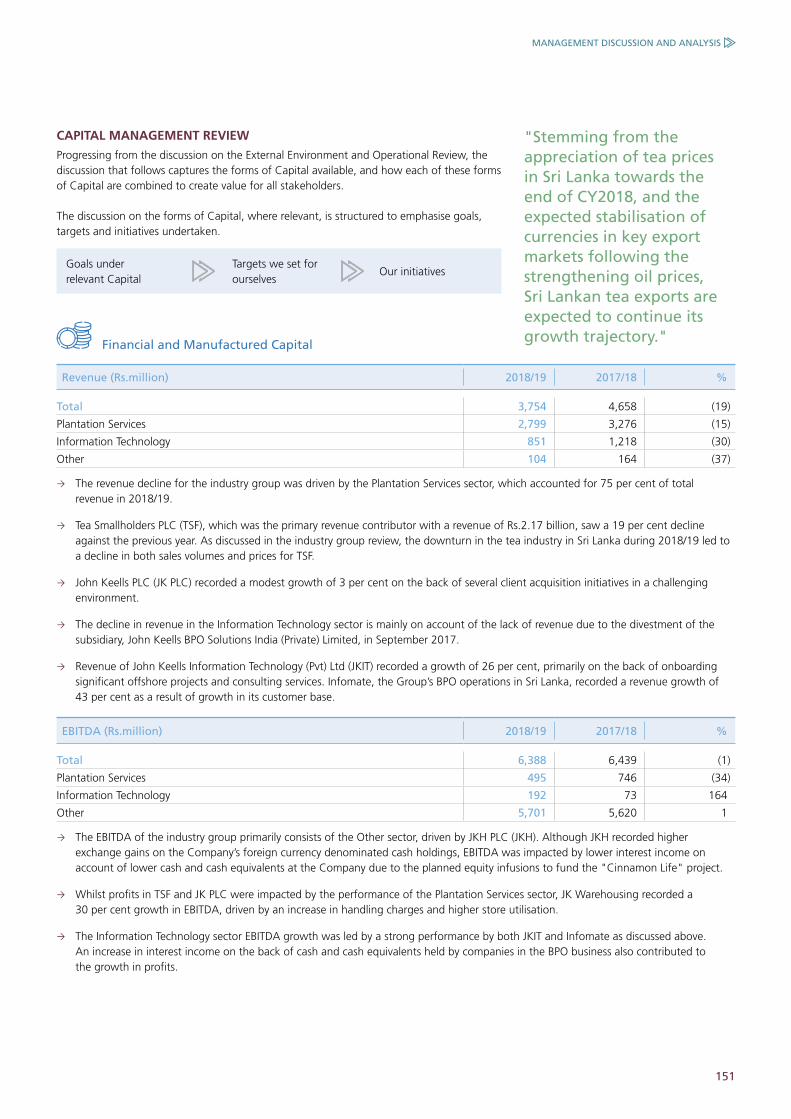
151
CAPITAL MANAGEMENT REVIEW
Progressing from the discussion on the External Environment and Operational Review, the discussion that follows captures the forms of Capital available, and how each of these forms of Capital are combined to create value for all stakeholders.
The discussion on the forms of Capital, where relevant, is structured to emphasise goals, targets and initiatives undertaken.
"Stemming from the appreciation of tea prices in Sri Lanka towards the end of CY2018, and the expected stabilisation of currencies in key export markets following the strengthening oil prices, Sri Lankan tea exports are expected to continue its growth trajectory."
Goals under relevant Capital
Targets we set for ourselves
Our initiatives
Financial and Manufactured Capital
Revenue (Rs.million) 2018/19 2017/18 %
Total 3,754 4,658 (19)
Plantation Services 2,799 3,276 (15)
Information Technology 851 1,218 (30)
Other 104 164 (37)
The revenue decline for the industry group was driven by the Plantation Services sector, which accounted for 75 per cent of total revenue in 2018/19.
Tea Smallholders PLC (TSF), which was the primary revenue contributor with a revenue of Rs.2.17 billion, saw a 19 per cent decline against the previous year. As discussed in the industry group review, the downturn in the tea industry in Sri Lanka during 2018/19 led to a decline in both sales volumes and prices for TSF.
John Keells PLC (JK PLC) recorded a modest growth of 3 per cent on the back of several client acquisition initiatives in a challenging environment.
The decline in revenue in the Information Technology sector is mainly on account of the lack of revenue due to the divestment of the subsidiary, John Keells BPO Solutions India (Private) Limited, in September 2017.
Revenue of John Keells Information Technology (Pvt) Ltd (JKIT) recorded a growth of 26 per cent, primarily on the back of onboarding significant offshore projects and consulting services. Infomate, the Group’s BPO operations in Sri Lanka, recorded a revenue growth of 43 per cent as a result of growth in its customer base.
EBITDA (Rs.million) 2018/19 2017/18 %
Total 6,388 6,439 (1)
Plantation Services 495 746 (34)
Information Technology 192 73 164
Other 5,701 5,620 1
The EBITDA of the industry group primarily consists of the Other sector, driven by JKH PLC (JKH). Although JKH recorded higher exchange gains on the Company’s foreign currency denominated cash holdings, EBITDA was impacted by lower interest income on account of lower cash and cash equivalents at the Company due to the planned equity infusions to fund the "Cinnamon Life" project.
Whilst profits in TSF and JK PLC were impacted by the performance of the Plantation Services sector, JK Warehousing recorded a 30 per cent growth in EBITDA, driven by an increase in handling charges and higher store utilisation.
The Information Technology sector EBITDA growth was led by a strong performance by both JKIT and Infomate as discussed above. An increase in interest income on the back of cash and cash equivalents held by companies in the BPO business also contributed to the growth in profits.
MANAGEMENT DISCUSSION AND ANALYSIS

152 JOHN KEELLS HOLDINGS PLC | ANNUAL REPORT 2018/19
INDUSTRY GROUP REVIEW
Natural Capital
Given the importance of the effective management of Natural Capital and the vital inputs from natural resources for Sri Lanka’s plantations sector, sustainability has become increasingly entrenched within the industry in recent years. In light of the growing demand for eco-friendly and sustainable practices, the group has used its ongoing collaborations and partnerships with international conservation bodies to disseminate international best practices and standards within the operating model of the sector; focusing on sustainable practices throughout the supply chain, from cultivation to distribution.
Along with the Centre Functions of the Group and in keeping with the Group’s environmental and energy management policy, the Information Technology industry group seeks to reduce its use of energy through process efficiencies and continuous monitoring. Furthermore, the industry group continues to invest in energy efficient solutions through the adoption of new technologies whilst electronic waste is disposed of in a responsible manner to minimise its environmental impact.
Information Technology : 211 MTPlantation Services : 2,563 MTOther : 481 MT
CARBON FOOTPRINT
Energy and Emissions Management
Relevance/Implication : Financial and regulatory implications, environment and social responsibility
Targets Brief Description
Continuous assessment of existing facilities, machinery and processes for energy efficiency and the implementation of improvements, as required.
The replacement of existing screw compressors with inverter type screw compressors at TSF factories, resulted in an annual energy saving of over 9,240 kWh.
The automation of the tea rolling process at Halwitigala tea factory resulted in an improvement in productivity.
The construction of fast drying firewood sheds covered with UV treated polythene create an increased combustion efficiency of biomass within the Plantation Services sector.
Heat insulation at all JKIT office premises was conducted to improve air conditioning efficiency and thereby conserve energy.
LED lighting was installed at JKIT office premises to reduce energy consumption.
PBT (Rs.million) 2018/19 2017/18 %
Total 5,915 6,129 (3)
Plantation Services 297 587 (49)
Information Technology 173 46 277
Other 5,445 5,496 (1)
The Other and Plantation Services sector recorded a decrease in PBT mainly on account of an increase in finance expense arising as a result of an increase in short-term borrowings, as explained below.
The industry group recorded IP gains of Rs.140 million, primarily from the Plantation Services sector. Recurring PBT with the exclusion of IP gains was Rs.5.77 billion, a 2 per cent decrease from the recurring PBT for 2017/18 of Rs.5.87 billion.
Debt (Rs.million) 2018/19 2017/18 %
Total 13,222 71 18,622
Plantation Services 1,141 7 17,377
Information Technology 8 2 399
Other 12,073 62 19,224
Short-term borrowings and bank overdrafts of the Company increased by Rs.11.23 billion, mainly as a result of temporary funding for the share repurchase undertaken by the Company which was completed in January 2019. The temporary funding was obtained to maximise yield on the Company’s short-term investments.
The Plantation Services sector recorded an increase in debt as a result of an increase in working capital requirements.
The material topics under Natural Capital are:
Energy and emissions management Waste and effluent management
OTHER, INCLUDING INFORMATION TECHNOLOGY AND PLANTATION SERVICES
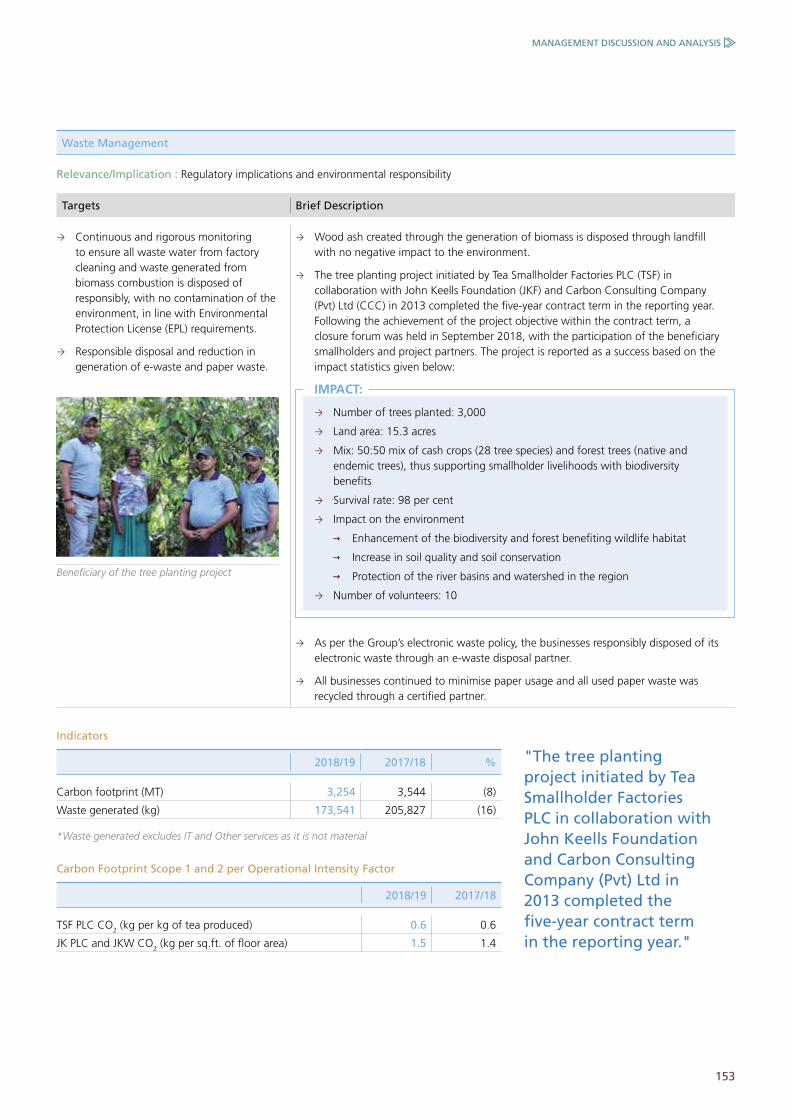
153
Waste Management
Relevance/Implication : Regulatory implications and environmental responsibility
Targets Brief Description
Continuous and rigorous monitoring to ensure all waste water from factory cleaning and waste generated from biomass combustion is disposed of responsibly, with no contamination of the environment, in line with Environmental Protection License (EPL) requirements.
Responsible disposal and reduction in generation of e-waste and paper waste.
Wood ash created through the generation of biomass is disposed through landfill with no negative impact to the environment.
The tree planting project initiated by Tea Smallholder Factories PLC (TSF) in collaboration with John Keells Foundation (JKF) and Carbon Consulting Company (Pvt) Ltd (CCC) in 2013 completed the five-year contract term in the reporting year. Following the achievement of the project objective within the contract term, a closure forum was held in September 2018, with the participation of the beneficiary smallholders and project partners. The project is reported as a success based on the impact statistics given below:
Number of trees planted: 3,000
Land area: 15.3 acres
Mix: 50:50 mix of cash crops (28 tree species) and forest trees (native and endemic trees), thus supporting smallholder livelihoods with biodiversity benefits
Survival rate: 98 per cent
Impact on the environment
Enhancement of the biodiversity and forest benefiting wildlife habitat
Increase in soil quality and soil conservation
Protection of the river basins and watershed in the region
Number of volunteers: 10
IMPACT:
As per the Group’s electronic waste policy, the businesses responsibly disposed of its electronic waste through an e-waste disposal partner.
All businesses continued to minimise paper usage and all used paper waste was recycled through a certified partner.
Indicators
2018/19 2017/18 %
Carbon footprint (MT) 3,254 3,544 (8)
Waste generated (kg) 173,541 205,827 (16)
*Waste generated excludes IT and Other services as it is not material
Carbon Footprint Scope 1 and 2 per Operational Intensity Factor
2018/19 2017/18
TSF PLC CO2 (kg per kg of tea produced) 0.6 0.6
JK PLC and JKW CO2 (kg per sq.ft. of floor area) 1.5 1.4
"The tree planting project initiated by Tea Smallholder Factories PLC in collaboration with John Keells Foundation and Carbon Consulting Company (Pvt) Ltd in 2013 completed the five-year contract term in the reporting year."
Beneficiary of the tree planting project
MANAGEMENT DISCUSSION AND ANALYSIS

154 JOHN KEELLS HOLDINGS PLC | ANNUAL REPORT 2018/19
INDUSTRY GROUP REVIEW
Due to operations of this industry group predominantly being service based, significant emphasis is placed on managing its Human Capital effectively. Companies that operate within Information Technology services recognise the importance of investing in training and development of staff to ensure service quality is maintained whilst strengthening career development and skill enhancement of employees. Companies within this sector continuously engage with universities and institutions through workshops and internship programmes, enabling the Group to improve the skills of potential recruits and also to increase the visibility of the businesses.
Human Capital
Workplace health and safety is a priority of the industry group. Workplace conditions are maintained at an acceptable standard in terms of ergonomic concerns, lighting and air quality and trainings on health and safety are regularly conducted. Further, arrangements are made to ensure employees’ safety in commuting, since some companies have 24-hour operations.
The Group initiated a human resource technology transformation during the previous year, launching a state-of-the-art human resource information platform to manage its human capital more effectively.
Material topics identified under Human Capital, are as follows:
Talent management Health and safety
Talent Management
Relevance/Implication : Ensuring functionally skilled and motivated staff, particularly at the IT and Centre Functions in facilitating Group-wide synergies. The need to retain and continuously upgrade the skills of existing staff, to ensure a pool of talent within the Group
Targets Brief Description
Ensure Group-wide synergies are created through continuous enhancement of knowledge and skills.
Engagement with local universities to build a pool of potential employees with the requisite soft skills.
Provided 10,023 hours of training to employees in the industry group, with 8 hours of training per employee, resulting in increased productivity.
Infomate, in collaboration with JKF and the Foundation for Advancing Rural Opportunity (FARO), continued their long-term collaboration in outsourcing some of the Group’s invoicing functions. This has enabled 47 rural and suburban youth in Mahavilachchiya (Anuradhapura District), Seenigama (Galle District) and Jaffna to secure sustainable employment opportunities in close proximity to their respective residences.
Total earnings recorded from the initiative: 15,294,439
Increase in earnings from 2018/18: 9 per cent
IMPACT:
The BPO units continued their growth towards self-sustenance demonstrated by the following:
Jaffna BPO marked its 5th year of operations and at its AGM, the first ever dividend was declared benefiting 13 of its associates.
All three BPO units contributed 50 per cent towards infrastructure such as computers and office equipment, a cost previously sponsored entirely by JKF.
During the year, there was a focused effort to uplift the leadership capabilities of all three Rural BPO units through facilitated leadership training and mentoring. The six-month mentoring programme was structured and carried out by JKF and Infomate with the assistance of management volunteers within the Group.
JKF organised a total immersion camp in English at the Mahavilachchiya OnTime BPO, which benefited 13 associates.
JKIT and Infomate continued to engage with local universities and higher education institutes by providing soft skills training as part of its recruitment. A number of graduates from these institutes were provided internship opportunities and on-the-job training at JKIT.
OTHER, INCLUDING INFORMATION TECHNOLOGY AND PLANTATION SERVICES
NUMBER OF EMPLOYEES
Information Technology : 474Plantation Services : 621Other : 208
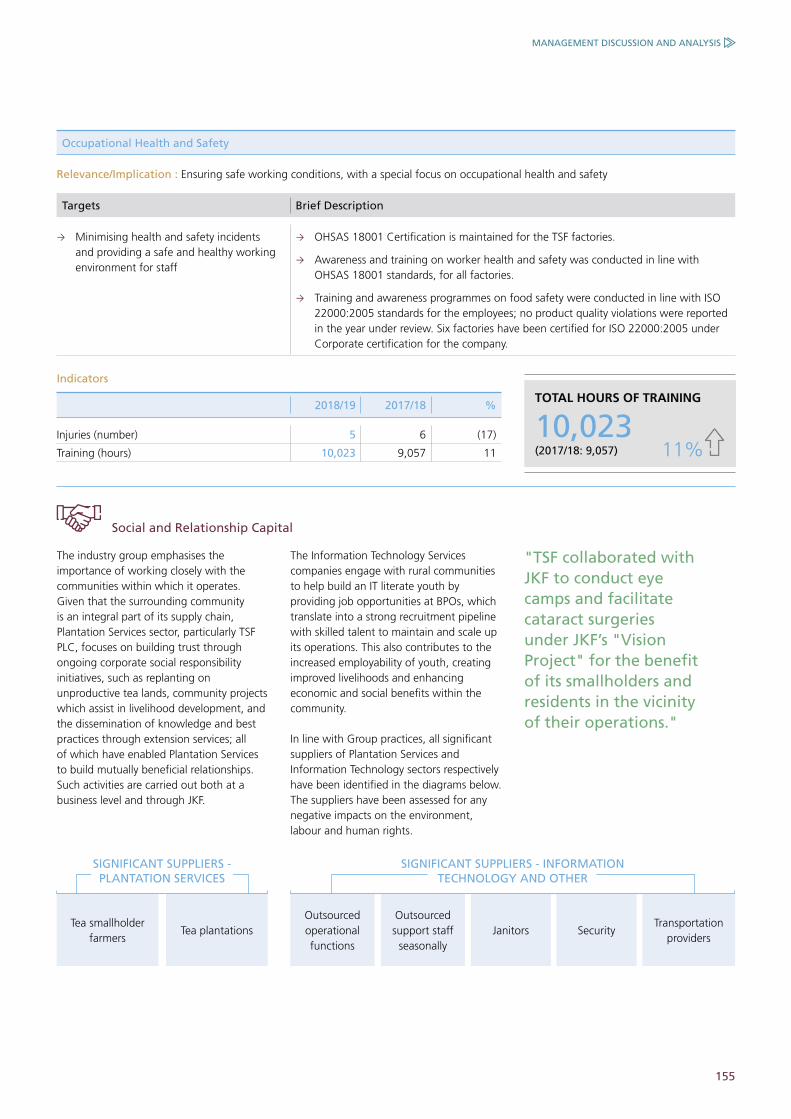
155
Occupational Health and Safety
Relevance/Implication : Ensuring safe working conditions, with a special focus on occupational health and safety
Targets Brief Description
Minimising health and safety incidents and providing a safe and healthy working environment for staff
OHSAS 18001 Certification is maintained for the TSF factories.
Awareness and training on worker health and safety was conducted in line with OHSAS 18001 standards, for all factories.
Training and awareness programmes on food safety were conducted in line with ISO 22000:2005 standards for the employees; no product quality violations were reported in the year under review. Six factories have been certified for ISO 22000:2005 under Corporate certification for the company.
Indicators
2018/19 2017/18 %
Injuries (number) 5 6 (17)
Training (hours) 10,023 9,057 11
Social and Relationship Capital
The industry group emphasises the importance of working closely with the communities within which it operates. Given that the surrounding community is an integral part of its supply chain, Plantation Services sector, particularly TSF PLC, focuses on building trust through ongoing corporate social responsibility initiatives, such as replanting on unproductive tea lands, community projects which assist in livelihood development, and the dissemination of knowledge and best practices through extension services; all of which have enabled Plantation Services to build mutually beneficial relationships. Such activities are carried out both at a business level and through JKF.
The Information Technology Services companies engage with rural communities to help build an IT literate youth by providing job opportunities at BPOs, which translate into a strong recruitment pipeline with skilled talent to maintain and scale up its operations. This also contributes to the increased employability of youth, creating improved livelihoods and enhancing economic and social benefits within the community.
In line with Group practices, all significant suppliers of Plantation Services and Information Technology sectors respectively have been identified in the diagrams below. The suppliers have been assessed for any negative impacts on the environment, labour and human rights.
SIGNIFICANT SUPPLIERS - INFORMATION TECHNOLOGY AND OTHER
SIGNIFICANT SUPPLIERS - PLANTATION SERVICES
Outsourced operational functions
Tea smallholder farmers
Outsourced support staff
seasonallyTea plantations Security
Transportation providers
Janitors
"TSF collaborated with JKF to conduct eye camps and facilitate cataract surgeries under JKF’s "Vision Project" for the benefit of its smallholders and residents in the vicinity of their operations."
TOTAL HOURS OF TRAINING
(2017/18: 9,057)
10,02311%
MANAGEMENT DISCUSSION AND ANALYSIS
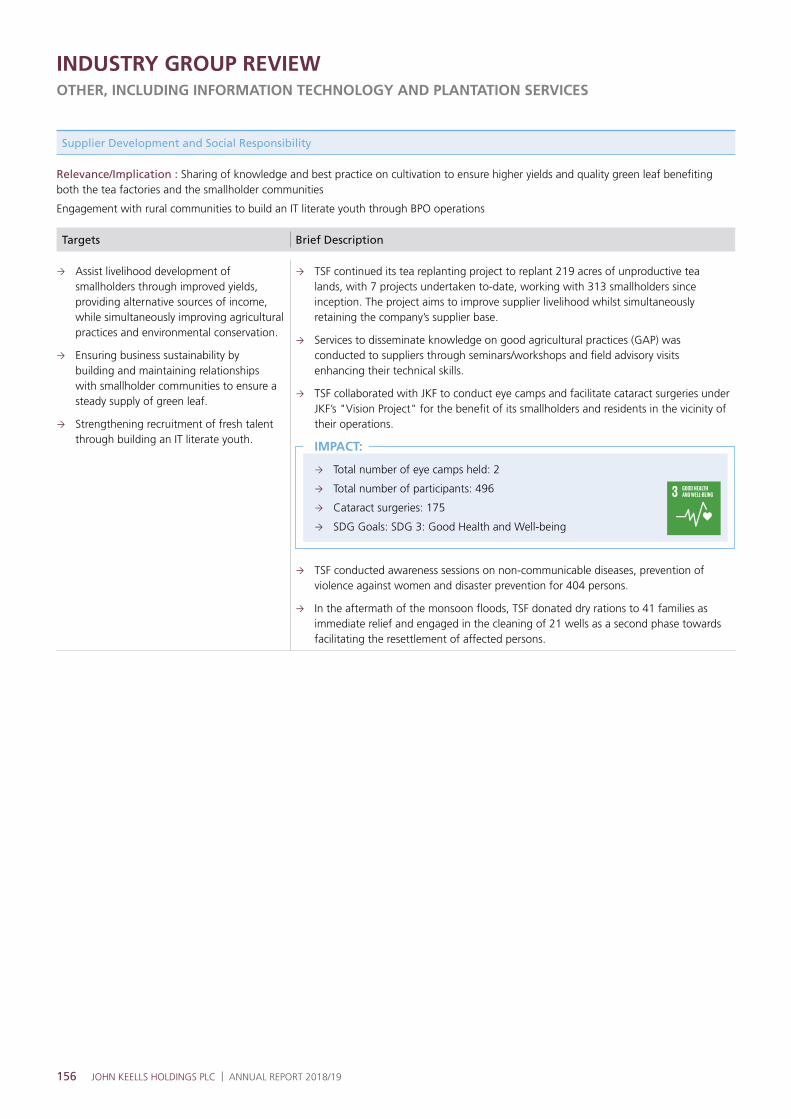
156 JOHN KEELLS HOLDINGS PLC | ANNUAL REPORT 2018/19
INDUSTRY GROUP REVIEW
Supplier Development and Social Responsibility
Relevance/Implication : Sharing of knowledge and best practice on cultivation to ensure higher yields and quality green leaf benefiting both the tea factories and the smallholder communities
Engagement with rural communities to build an IT literate youth through BPO operations
Targets Brief Description
Assist livelihood development of smallholders through improved yields, providing alternative sources of income, while simultaneously improving agricultural practices and environmental conservation.
Ensuring business sustainability by building and maintaining relationships with smallholder communities to ensure a steady supply of green leaf.
Strengthening recruitment of fresh talent through building an IT literate youth.
TSF continued its tea replanting project to replant 219 acres of unproductive tea lands, with 7 projects undertaken to-date, working with 313 smallholders since inception. The project aims to improve supplier livelihood whilst simultaneously retaining the company’s supplier base.
Services to disseminate knowledge on good agricultural practices (GAP) was conducted to suppliers through seminars/workshops and field advisory visits enhancing their technical skills.
TSF collaborated with JKF to conduct eye camps and facilitate cataract surgeries under JKF’s "Vision Project" for the benefit of its smallholders and residents in the vicinity of their operations.
Total number of eye camps held: 2
Total number of participants: 496
Cataract surgeries: 175
SDG Goals: SDG 3: Good Health and Well-being
IMPACT:
TSF conducted awareness sessions on non-communicable diseases, prevention of violence against women and disaster prevention for 404 persons.
In the aftermath of the monsoon floods, TSF donated dry rations to 41 families as immediate relief and engaged in the cleaning of 21 wells as a second phase towards facilitating the resettlement of affected persons.
OTHER, INCLUDING INFORMATION TECHNOLOGY AND PLANTATION SERVICES
GOVERNANCE
158 Board of Directors | 160 Group Executive Committee | 161 Group Operating Committee
164 Corporate Governance Commentary | 194 Materiality, Sustainability Integration and Stakeholder Engagement
201 Risks, Opportunities and Internal Controls
ADVANCING
STANDARDS
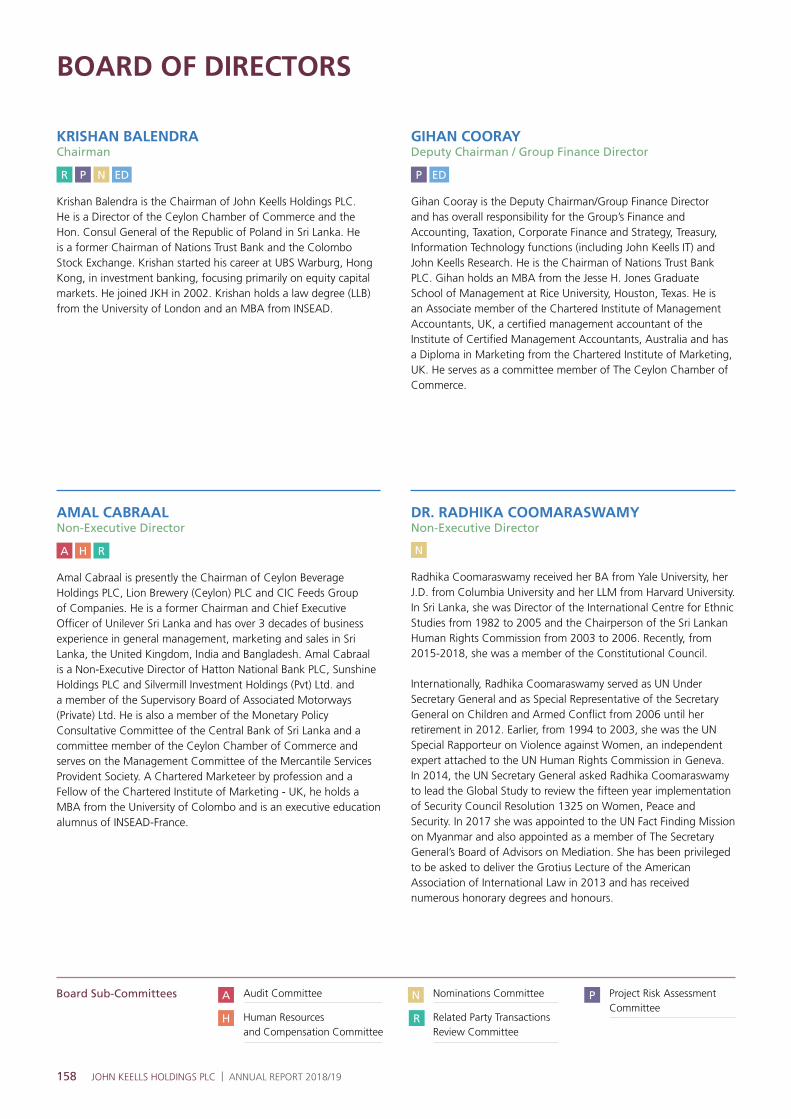
158 JOHN KEELLS HOLDINGS PLC | ANNUAL REPORT 2018/19
BOARD OF DIRECTORS
KRISHAN BALENDRAChairman
EDNR P
Krishan Balendra is the Chairman of John Keells Holdings PLC. He is a Director of the Ceylon Chamber of Commerce and the Hon. Consul General of the Republic of Poland in Sri Lanka. He is a former Chairman of Nations Trust Bank and the Colombo Stock Exchange. Krishan started his career at UBS Warburg, Hong Kong, in investment banking, focusing primarily on equity capital markets. He joined JKH in 2002. Krishan holds a law degree (LLB) from the University of London and an MBA from INSEAD.
GIHAN COORAYDeputy Chairman / Group Finance Director
EDP
Gihan Cooray is the Deputy Chairman/Group Finance Director and has overall responsibility for the Group’s Finance and Accounting, Taxation, Corporate Finance and Strategy, Treasury, Information Technology functions (including John Keells IT) and John Keells Research. He is the Chairman of Nations Trust Bank PLC. Gihan holds an MBA from the Jesse H. Jones Graduate School of Management at Rice University, Houston, Texas. He is an Associate member of the Chartered Institute of Management Accountants, UK, a certified management accountant of the Institute of Certified Management Accountants, Australia and has a Diploma in Marketing from the Chartered Institute of Marketing, UK. He serves as a committee member of The Ceylon Chamber of Commerce.
AMAL CABRAALNon-Executive Director
A H R
Amal Cabraal is presently the Chairman of Ceylon Beverage Holdings PLC, Lion Brewery (Ceylon) PLC and CIC Feeds Group of Companies. He is a former Chairman and Chief Executive Officer of Unilever Sri Lanka and has over 3 decades of business experience in general management, marketing and sales in Sri Lanka, the United Kingdom, India and Bangladesh. Amal Cabraal is a Non-Executive Director of Hatton National Bank PLC, Sunshine Holdings PLC and Silvermill Investment Holdings (Pvt) Ltd. and a member of the Supervisory Board of Associated Motorways (Private) Ltd. He is also a member of the Monetary Policy Consultative Committee of the Central Bank of Sri Lanka and a committee member of the Ceylon Chamber of Commerce and serves on the Management Committee of the Mercantile Services Provident Society. A Chartered Marketeer by profession and a Fellow of the Chartered Institute of Marketing - UK, he holds a MBA from the University of Colombo and is an executive education alumnus of INSEAD-France.
DR. RADHIKA COOMARASWAMYNon-Executive Director
N
Radhika Coomaraswamy received her BA from Yale University, her J.D. from Columbia University and her LLM from Harvard University. In Sri Lanka, she was Director of the International Centre for Ethnic Studies from 1982 to 2005 and the Chairperson of the Sri Lankan Human Rights Commission from 2003 to 2006. Recently, from 2015-2018, she was a member of the Constitutional Council.
Internationally, Radhika Coomaraswamy served as UN Under Secretary General and as Special Representative of the Secretary General on Children and Armed Conflict from 2006 until her retirement in 2012. Earlier, from 1994 to 2003, she was the UN Special Rapporteur on Violence against Women, an independent expert attached to the UN Human Rights Commission in Geneva. In 2014, the UN Secretary General asked Radhika Coomaraswamy to lead the Global Study to review the fifteen year implementation of Security Council Resolution 1325 on Women, Peace and Security. In 2017 she was appointed to the UN Fact Finding Mission on Myanmar and also appointed as a member of The Secretary General’s Board of Advisors on Mediation. She has been privileged to be asked to deliver the Grotius Lecture of the American Association of International Law in 2013 and has received numerous honorary degrees and honours.
Board Sub-Committees Project Risk AssessmentCommittee
P
Related Party Transactions Review Committee
Nominations CommitteeN
R
Audit Committee
Human Resources and Compensation Committee
A
H

159
DR. HANS WIJAYASURIYANon-Executive Director
H N P
In his capacity as the Regional CEO for South Asia, Dr. Hans Wijayasuriya heads the South Asian Operations of the Axiata Group Bhd., spanning Bangladesh, Nepal, Sri Lanka and India. Axiata is Asia’s second largest Telecommunications Group. Up to and including the year 2016, he additionally functioned as the Group Chief Executive of Dialog Axiata PLC (Dialog). Over the course of his tenure of leadership spanning close to two decades, Dialog progressed from being the 4th entrant to Sri Lanka’s mobile market to become the country’s leading multi-play connectivity provider, and one of the highest valued companies on the Colombo Stock Exchange. In the Year 2016, he was honoured by the GSM Association as the first recipient of the 'Outstanding Contribution to the Asian Mobile Industry' Award. Dr. Wijayasuriya is a past Chairman of GSM Asia Pacific – the regional interest group of the GSM Association, and also serves on the Board of the TM Forum (TMF). Dr Wijayasuriya was also named ‘Sri Lankan of the Year’ by Sri Lanka’s premier business journal, LMD in 2008. Dr. Wijayasuriya is currently the Vice Chairman of the Ceylon Chamber of Commerce, Sri Lanka’s premier business chamber. During the Period 2012-14, Dr. Wijayasuriya also functioned as the founding CEO of Axiata Digital Services – the Group-wide Digital Services Business of the Axiata Group. Dr. Wijayasuriya serves on the boards of several regional operating companies of the Axiata Group, and also on the boards of Axiata Digital Services and several of its Digital Ventures.
Dr. Wijayasuriya graduated from the University of Cambridge UK in 1989. He subsequently obtained his PhD in Digital Mobile Communications from the University of Bristol UK in 1994. A Chartered Engineer and Fellow of the Institute of Engineering Technology UK, Dr. Wijayasuriya also holds an MBA from the University of Warwick UK. Dr. Wijayasuriya has published widely on the subject of digital mobile communications, including research papers in publications of the Institute of Electrical and Electronic Engineers (IEEE) USA, Royal Society and the Institute of Engineering Technology (IET) UK.
ASHROFF OMARNon- Executive Director
H N
Group Chief Executive Officer of leading apparel exporter, Brandix Lanka Limited, Ashroff Omar has been instrumental in redefining the Sri Lankan apparel industry for over four decades. Ashroff spearheads a company that comprises manufacturing and product development facilities offering end-to-end apparel solutions from Tokyo to the US, including UK, Cambodia, Haiti, Sri Lanka, India and Bangladesh for some of the world’s most renowned brands, with a commitment to offering ‘Inspired Solutions’ to its clientele.
He is also credited with pioneering environmentally-friendly apparel manufacture in the world and establishing the world’s first LEED platinum manufacturing facility for eco-friendly manufacture. His extensive experience and ability to think beyond the norm has secured him positions in the Boards of some of Sri Lanka’s most respected corporates. He is also the Founder Chair of the Joint Apparel Association Forum (JAAF), the apex body of the Sri Lanka apparel industry.
NIHAL FONSEKANon- Executive Director
A R
Nihal Fonseka is a career banker and served as the Chief Executive Officer/Ex-Officio Director of DFCC Bank from 2000 until his retirement in 2013. He is currently a Member of the Monetary Board of the Central Bank of Sri Lanka, Non-Executive Director of Phoenix Ventures Pvt Ltd, Chairman of the Group Audit Committee of Brandix Lanka Limited and President of the Sri Lanka National Advisory Council of the Chartered Institute of Securities and Investments, UK. Prior to joining the DFCC Bank, he was the Deputy Chief Executive of HSBC Sri Lanka. He is a past Chairman of the Colombo Stock Exchange and the Association of Development Financing Institutions in Asia and the Pacific (ADFIAP). He has also served as a Director of the Employees’ Trust Fund Board and as a member of the Presidential Commission on Taxation (2009), National Procurement Commission and Strategic Enterprise Management Agency (SEMA). He holds a B.Sc from the University of Ceylon, Colombo, is a Fellow of the Institute of Financial Studies, (FIB) UK and a member of the Chartered Institute of Securities and Investments, (MCSI) UK.
PREMILA PERERANon-Executive Director
A N R P
Premila Perera was appointed to the Board of the Company with effect from 1 July 2014 as an Independent Non-Executive Director. Premila Perera, formerly a Partner, KPMG in Sri Lanka, also served as the Global Firms Regional Tax Director for ASPAC in 2000/01, as a member of the Global Task force commissioned in 1998, to advise the International Board of KPMG on future directions in determining long-term strategic plans, and faculty of the KPMG International Tax Business School. She also served a period of secondment with the US Firm’s National Tax Office in Washington DC, and was a participant at the KPMG-INSEAD International Banking School programme. She is a Fellow of the Institute of Chartered Accountants of Sri Lanka. She served as an Independent Director and Chairperson of the Audit and Related Party Transaction Committees of Ceylon Tobacco Company PLC until October 2017 and as a Non-Executive Director of Holcim (Lanka) Limited until August 2016.
Refer Group Directory for directorships held byExecutive Directors in other Group companies
ED
GOVERNANCE

160 JOHN KEELLS HOLDINGS PLC | ANNUAL REPORT 2018/19
GROUP EXECUTIVE COMMITTEE
DILANI ALAGARATNAMPresident
Dilani Alagaratnam is responsible for the Human Resources, Legal and Secretarial, Corporate Communications, Sustainability and Enterprise Risk Management, and Group Initiatives functions of the Group and overlooks John Keells Office Automation. She is also a Director of Union Assurance PLC and several unlisted companies within the John Keells Group. A lawyer by profession, she has been with John Keells Holdings PLC since 1992 and is a law graduate and a holder of a Masters Degree in Law. Currently, she is also the Chairperson of the Legislation Sub Committee of the Ceylon Chamber of Commerce, a member of the National Labour Advisory Committee and a director of CCC-ICLP ADR Centre.
SURESH RAJENDRAPresident
Suresh Rajendra is responsible for the Property industry group of the John Keells Group and also serves as a Director of Union Assurance PLC and Asian Hotels and Properties PLC. He has over 24 years of experience in the fields of finance, property and real estate, travel and tourism, and business development acquired both in Sri Lanka and overseas. Prior to joining the Group, he was the head of commercial and business development for NRMA Motoring and Services in Sydney, Australia, Director/General Manager of Aitken Spence Hotel Managements (Private) Limited, and also served on the Boards of the hotel companies of the Aitken Spence Group. Suresh is a Fellow of the Chartered Institute of Management Accountants, UK.
JITENDRA GUNARATNEPresident
Jitendra Gunaratne is responsible for the Leisure industry group and the Plantation Services sector. Prior to his appointment at Leisure, he was the President of the Consumer Foods industry group. His 39 years of Management experience in the Group also covers Property and Retail. He is currently a member of the Council of the Employer’s Federation of Ceylon.
CHARITHA SUBASINGHEPresident
Charitha Subasinghe is responsible for the Supermarket business of the Group. He has been with the John Keells Group since 2003. He was the Sector Financial Controller of the Supermarket business, before being appointed as the Chief Executive Officer in 2005. He was also employed at Aitken Spence Hotel Management as the Sector Financial Controller before moving over to John Keells. He is an Associate Member of the Chartered Institute of Management Accountants (UK) as well as a Diploma Holder of the Chartered Institute of Marketing (UK). He also holds an MBA from the University of Colombo.
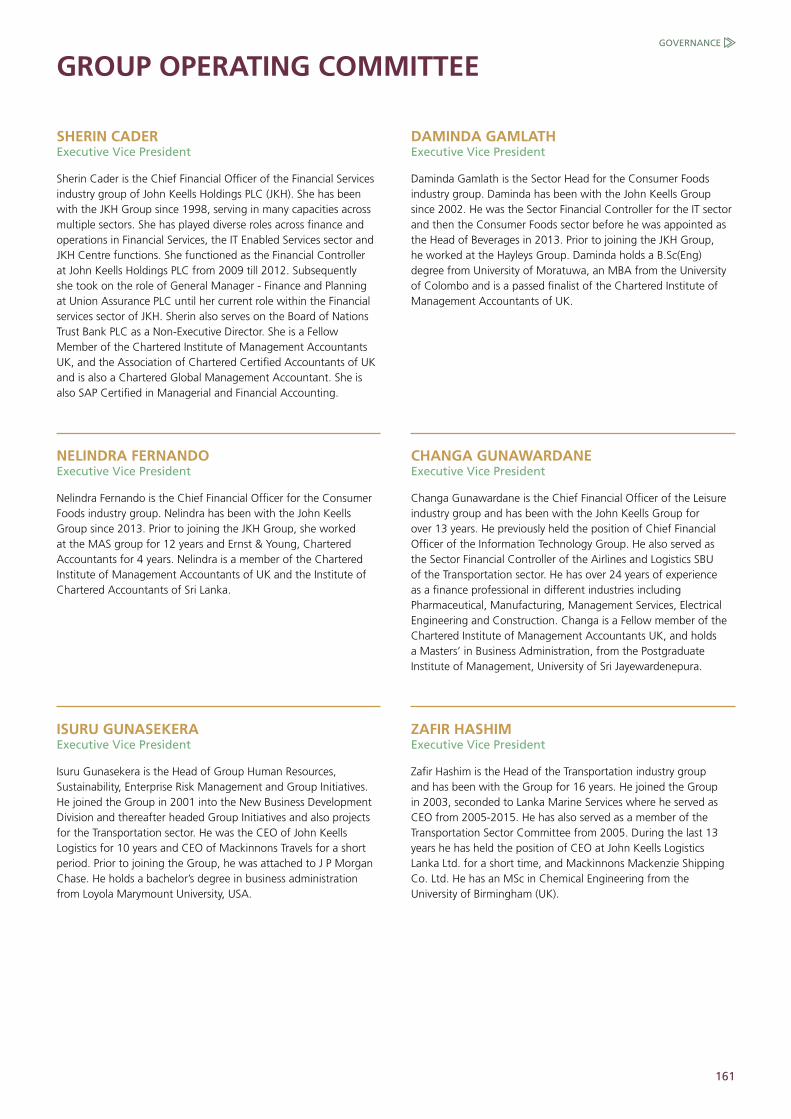
161
GROUP OPERATING COMMITTEE
SHERIN CADERExecutive Vice President
Sherin Cader is the Chief Financial Officer of the Financial Services industry group of John Keells Holdings PLC (JKH). She has been with the JKH Group since 1998, serving in many capacities across multiple sectors. She has played diverse roles across finance and operations in Financial Services, the IT Enabled Services sector and JKH Centre functions. She functioned as the Financial Controller at John Keells Holdings PLC from 2009 till 2012. Subsequently she took on the role of General Manager - Finance and Planning at Union Assurance PLC until her current role within the Financial services sector of JKH. Sherin also serves on the Board of Nations Trust Bank PLC as a Non-Executive Director. She is a Fellow Member of the Chartered Institute of Management Accountants UK, and the Association of Chartered Certified Accountants of UK and is also a Chartered Global Management Accountant. She is also SAP Certified in Managerial and Financial Accounting.
NELINDRA FERNANDOExecutive Vice President
Nelindra Fernando is the Chief Financial Officer for the Consumer Foods industry group. Nelindra has been with the John Keells Group since 2013. Prior to joining the JKH Group, she worked at the MAS group for 12 years and Ernst & Young, Chartered Accountants for 4 years. Nelindra is a member of the Chartered Institute of Management Accountants of UK and the Institute of Chartered Accountants of Sri Lanka.
DAMINDA GAMLATHExecutive Vice President
Daminda Gamlath is the Sector Head for the Consumer Foods industry group. Daminda has been with the John Keells Group since 2002. He was the Sector Financial Controller for the IT sector and then the Consumer Foods sector before he was appointed as the Head of Beverages in 2013. Prior to joining the JKH Group, he worked at the Hayleys Group. Daminda holds a B.Sc(Eng) degree from University of Moratuwa, an MBA from the University of Colombo and is a passed finalist of the Chartered Institute of Management Accountants of UK.
ISURU GUNASEKERAExecutive Vice President
Isuru Gunasekera is the Head of Group Human Resources, Sustainability, Enterprise Risk Management and Group Initiatives. He joined the Group in 2001 into the New Business Development Division and thereafter headed Group Initiatives and also projects for the Transportation sector. He was the CEO of John Keells Logistics for 10 years and CEO of Mackinnons Travels for a short period. Prior to joining the Group, he was attached to J P Morgan Chase. He holds a bachelor’s degree in business administration from Loyola Marymount University, USA.
CHANGA GUNAWARDANEExecutive Vice President
Changa Gunawardane is the Chief Financial Officer of the Leisure industry group and has been with the John Keells Group for over 13 years. He previously held the position of Chief Financial Officer of the Information Technology Group. He also served as the Sector Financial Controller of the Airlines and Logistics SBU of the Transportation sector. He has over 24 years of experience as a finance professional in different industries including Pharmaceutical, Manufacturing, Management Services, Electrical Engineering and Construction. Changa is a Fellow member of the Chartered Institute of Management Accountants UK, and holds a Masters’ in Business Administration, from the Postgraduate Institute of Management, University of Sri Jayewardenepura.
ZAFIR HASHIMExecutive Vice President
Zafir Hashim is the Head of the Transportation industry group and has been with the Group for 16 years. He joined the Group in 2003, seconded to Lanka Marine Services where he served as CEO from 2005-2015. He has also served as a member of the Transportation Sector Committee from 2005. During the last 13 years he has held the position of CEO at John Keells Logistics Lanka Ltd. for a short time, and Mackinnons Mackenzie Shipping Co. Ltd. He has an MSc in Chemical Engineering from the University of Birmingham (UK).
GOVERNANCE
162 JOHN KEELLS HOLDINGS PLC | ANNUAL REPORT 2018/19
GROUP OPERATING COMMITTEE
ROHAN KARUNARAJAHExecutive Vice President
Rohan Karunarajah is the Head of Brand Development for Cinnamon Hotels & Resorts, and Sector Head of Cinnamon’s City Hotels, overseeing "Cinnamon Grand Colombo", "Cinnamon Lakeside Colombo" and "Cinnamon red Colombo". A career hotelier counting over three decades, both in the local and international hospitality industry, he held the position of General Manager in several hotels in the United Kingdom, lastly being the Marriott Marble Arch, London. He is a Director of Asian Hotels and Properties PLC, Trans Asia Hotels PLC and Sancity Hotels and Properties Limited. He read for his Masters in Hospitality and Business Studies from the Thames Valley University, London.
WARUNA RAJAPAKSAExecutive Vice President
Waruna Rajapaksa, Head of New Business Development for the John Keells Group and Head of Operations for the "Cinnamon Life" integrated project, has over 31 years of experience in Sri Lanka and in the UK, primarily in management consultancy, infrastructure finance, and audit. Prior to joining the Group in 2002, he worked for the Government of Sri Lanka as an Executive Director at the Bureau of Infrastructure Investment, Informatics International Limited (UK) in the UK and at Ernst & Young, Sri Lanka. He is a member of the Board of Directors and Audit Committee of South Asia Gateway Terminals (Private) Limited. Waruna is a Fellow member of the Chartered Institute of Management Accountants UK, and an Associate member of the Institute of Chartered Accountants of Sri Lanka. He also holds an MBA from Cass Business School, City, University of London, UK.
RAMESH SHANMUGANATHANExecutive Vice President
Ramesh Shanmuganathan is the Group’s Chief Information Officer, a member of the Group Management Committee for the Information Technology industry group as well as Chief Executive Officer of John Keells IT (JKCS cum SGIT). He has over 25 years of experience in the ICT industry in Sri Lanka and the USA, with over 17 years in C-level management. Ramesh is a Hayes-Fulbright Scholar and holds to his credit a Doctor of Philosophy (Technology Management) from Keisei International University (Seoul, South Korea), Master of Science (Information Technology and Computer Science) with Phi Kappa Phi Honours from Rochester Institute of Technology (New York, USA), Master of Business Administration from Postgraduate Institute of Management, University of Sri Jayewardenepura, Bachelor of Science in Electronics and Telecommunications Engineering with First Class Honours from the University of Moratuwa. He is reading for his Doctor of Business Administration (DBA) at the International School of Management, Paris at present. He is a Chartered Engineer, Chartered IT Professional and a Fellow of the British Computer Society and Institute of Engineers, UK. He has active memberships in several other professional institutions and is a visiting faculty member for several post-graduate programmes. He is also the Chair of the Sri Lanka SAP User Group (SLSUG), member of the SLASSCOM General Council and is actively involved with the ICTA as well as other bodies in steering IT to greater heights within the country. He is also a member of the Gartner Research Circle.
NAYANA MAWILMADAExecutive Vice President
Nayana Mawilmada is the Sector Head of the Property industry group at JKH. With extensive international experience in planning, facilitating, and managing large scale urban development and infrastructure projects across 15 countries, and working within both the private and public domains, Nayana brings a unique perspective to property sector endeavours. He is widely seen as a key advocate and spokesperson for sound urban development policy and planning in the country. Among his previous roles, Nayana has served as the Director General of the Urban Development Authority of Sri Lanka, Managing Director of York Street Partners (Pvt) Ltd a boutique investment bank in Colombo, and as an Urban Development Specialist for the Asian Development Bank based in Manila, Philippines. His academic training includes an MBA from Harvard Business School, a Master of City Planning from Massachusetts Institute of Technology (MIT), and a Bachelor of Architecture from Hampton University in the USA. In recognition of his leadership in Sri Lanka’s urban development space, he was also awarded an Eisenhower Fellowship in 2017.
DIRK PEREIRAExecutive Vice President
Dirk Pereira is the Chief Executive Officer of Union Assurance PLC (UA) and a member of its Board. He is a Fellow member of the Chartered Institute of Management Accountants UK and the Institute of Chartered Accountants of Sri Lanka. He also holds an MBA from the University of Sri Jayewardenepura.
163
HISHAN SINGHAWANSAExecutive Vice President
Hishan Singhawansa is the Sector Head of the Resorts sector (Sri Lanka and Maldives) of the Leisure industry group. Hishan has been with the John Keells Group since 2008. He was with the Retail sector of the Group for 8 years holding positions in Category Management and heading Supply Chain before moving in to the Leisure industry group in 2017. Hishan holds a B.Sc Engineering (Hons) degree from the University of Moratuwa and is an Associate of the Chartered Institute of Management Accountants (UK). He also holds an MBA from the University of Wales.
NADIJA TAMBIAHExecutive Vice President
Nadija Tambiah is a law graduate from the University of Manchester, United Kingdom, a Barrister at Law (Middle Temple), UK and an Attorney at Law in Sri Lanka. She heads the Legal and Company Secretarial functions of the John Keells Group where she has worked for 24 years. She also heads the John Keells Foundation, the corporate social responsibility arm of John Keells Holdings PLC.
She serves as a member of the Steering Committee on Arbitration and Mediation at the Ceylon Chamber of Commerce. She is a Trustee of the George Keyt Foundation, Geoffrey Bawa Trust, Lunuganga Trust, a member of the Executive Committee of the Colombo Museum of Modern Art and sits on the Council of the Sri Lankan Institute of Directors.
ARAVINDA WANNIARACHCHIExecutive Vice President
Aravinda Wanniarachchi is the Chief Financial Officer of the Supermarket business and joined the John Keells Group in 2007. He was attached to the Corporate Finance and Strategy team of the JKH Group prior to joining the Retail sector. He is an Associate member of the Chartered Institute of Management Accountants UK and holds a BBA Marketing (Sp.) degree from the University of Colombo.
DEVIKA WEERASINGHEExecutive Vice President
Devika Weerasinghe is the Chief Financial Officer of the Transportation industry group, Plantation sector and Information Technology sector. She previously held the position of Sector Financial Controller of the Transportation sector. She also served as the Sector Financial Controller of the Airlines SBU of the Transportation sector during the period 1998-2004. An Associate member of the Chartered Institute of Management Accountants UK, Devika also holds a Bachelor’s Degree in Business Administration, from the University of Sri Jayewardenepura.
RAVI WIJEWANTHAExecutive Vice President
Ravi Wijewantha joined the Group in September 2003 and was appointed as Sector Financial Controller of the Property industry group in July 2006 and Chief Financial Officer of the same Industry Group in July 2017. He has over 24 years of experience in the fields of auditing and accounting.
He is an Associate Member of the Chartered Institute of Management Accountants UK and holds an MBA from ICFAI University Dehradun India.
GOVERNANCE

164 JOHN KEELLS HOLDINGS PLC | ANNUAL REPORT 2018/19
Key Internal Benchmarks
Articles of Association of the Company
Recruitment and selection policies
Learning and development policies
Policy on career management and promotions
Rewards and recognition policy
Leave, flexi-hours and teleworking policies
Code of conduct
Policy against sexual harassment
Policies on forced, compulsory and child labour
Disciplinary procedure
Policy on grievance handling
Anti-fraud policy
Policy on communications and advertising
Ombudsperson policy
Group accounting procedures and policies
Policies on enterprise risk management
Policies on fund management and FOREX risk mitigation
IT policies and procedures, including data protection and security
Group environmental and economic policies
Policies on energy, emissions, water and waste management
Policies on products and services
CORPORATE GOVERNANCE COMMENTARY
The Group’s well-structured Corporate Governance Framework, built on the core principles of accountability, participation and transparency, has been the cornerstone of the Group’s steady advancement over the years.
1 EXECUTIVE SUMMARY
Whilst the Group constantly re-aligns, reinvents and adapts to the changing business landscape, the Group’s corporate governance philosophy is institutionalised across all business units through a strong set of corporate values, a written code of conduct and a proven performance management and values monitoring system. Good governance practices are engrained in the Group’s culture, creating an enabling environment for growth in a structured, predictable and sustainable manner. It is this governance mindset which has enabled the Group to continuously create value for all its stakeholders notwithstanding the external environment and macro conditions.
The Group’s governance framework has its own set of internal benchmarks, processes and structures towards meeting accepted best practices in governance, in addition to the "triggers" which ensure compliance with mandatory regulatory requirements.
The ensuing report details:
The significant components of the JKH Corporate Governance System
The monitoring mechanism in place to ensure strict compliance to the Group’s Governance policy
The outlook and emerging challenges for corporate governance
JKH’s compliance with all mandatory requirements of law and its voluntary adoption of recommended codes in the governance field
Compliance Summary Regulatory Benchmarks
Standard/Principle/Code Adherence
The Companies Act No.7 of 2007 and regulations Mandatory provisions - fully compliant
Listing Rules of the Colombo Stock Exchange (CSE) Mandatory provisions - fully compliant
Securities and Exchange Commission of Sri Lanka Act No. 36 of 1987, including directives and circulars
Mandatory provisions - fully compliant
Code of Best Practice on Corporate Governance (2013) jointly advocated by the Securities and Exchange Commission of Sri Lanka (SEC) and the Institute of Chartered Accountants of Sri Lanka (CA Sri Lanka)
Voluntary provisions - fully compliant
UK Corporate Governance Code (formerly known as the Combined Code of 2010)
Voluntary provisions - fully compliant, as applicable to JKH
Code of Best Practice on Corporate Governance (2017) issued by CA Sri Lanka
Voluntary provisions - – compliant with almost the full 2017 Code, to the extent of business exigency and as required by the John Keells Group

165
Mr. S Ratnayake, former Chairman-CEO of the Company, retired with effect from 31 December 2018 after 33 years of service to the Group.
In line with the succession plans announced in November 2016, Mr. K Balendra assumed office as the Chairman-CEO and Mr. G Cooray as Deputy Chairman, in addition to his role as Group Finance Director, on 1 January 2019.
In line with the Group’s succession plan, key management personnel were appointed to the Group Executive Committee and the Group Operating Committee.
A Board sub-committee titled, 'Project Risk Assessment Committee' was established during the year under review, to further augment the Group’s Investment Evaluation Framework. The sub-committee provides the Board with increased visibility of large-scale new investments and assists the Board to assess risks associated with such significant investments at the initial stages of discussion to obtain feedback and input on relevant inputs in relation to mitigating risks and committing to structuring arrangements.
Refer Section 3.2.5 for further details.
During the year under review, the Group migrated to a state-of-the-art cloud-based human resource information platform from the on-premise system used by the Group during the previous ten years. This platform will seamlessly manage the entire employee life cycle from recruitment and onboarding, to performance management and succession planning, compensation and learning and development, through to off-boarding.
Refer the Capital Management Review section - page 48
As announced to the Colombo Stock Exchange, JKH concluded the offer to repurchase a maximum of 69,376,433 of Ordinary Shares (being 5 per cent of its issued shares), at a price of Rs.160.00 per share, on a pro rata basis of 1 share
for every 20 shares held, in January 2019. The offer was concluded with the acceptance of 46 per cent of the offer (32,189,118 ordinary shares) and the balance (37,187,315 ordinary shares) being accepted proportionately based on applications for additional shares to be repurchased. Accordingly, Rs.11.10 billion was paid in January 2019.
The Group, in liaison with a leading global management consulting firm, embarked on the first phase of an advanced analytics transformation journey during the year under review. The Group is uniquely positioned to capitalise on this opportunity given the diversity of industries the Group operates in and the unparalleled access to a comprehensive data ecosystem.
Over the next 24 to 36 months, the Group will pursue the roll-out of a roadmap of well-defined advanced analytics Use Cases, which aim to unlock significant value and address key business challenges across value chains in a few of its industry verticals. This effort will be further augmented by investment to develop capabilities to ensure that an enduring advanced analytics capability is built within the Group.
Refer the Capital Management Review section - page 58
INSIGHTS
The Group’s compensation policy was revised during the year under review.
The Group re-visited its long-term compensation philosophy based on feedback obtained from employees through surveys and also a study conducted by an internationally-renowned HR consulting firm on behalf of the Group. Based on the findings, the compensation and benefits schemes of the Group were revised to reflect the view that employee share option schemes are not as effective for middle level management where a higher proportion of cash compensation is preferred. This also aligns with the belief that employees at such levels have a relatively limited ability to influence the overall performance of the JKH Group, although having a material impact on their own businesses. As such, going forward, the ESOP scheme would be applicable only for senior levels of management where the quantum granted each year will be proportionately revised downwards to reflect the changes stated above.
In order to further align the interests of Group employees in the capacity of Vice President and above levels, existing Short-Term Incentive plans were revised and a long-term cash-based incentive plan, linked to the 5 year strategic plans, was announced. Given that the members of the Group Executive Committee (GEC) are enablers of the operating model of the Group, the GEC was, by plan, excluded from the long-term cash-based incentive scheme to better align their interest with shareholder interest.
Subsequent to the Easter Sunday attacks, the Board of Directors convened to understand the impacts on the Group, particularly the Leisure industry group. The Board was also apprised of the revisions to risk levels and consequent risk mitigatory actions.
INSIGHTS
The reporting structure of some businesses were realigned during the year under review, where the Consumer Foods and Retail industry group was segregated into two separate industry groups. Additionally, the Group’s Office Automation business, which was previously under the Information Technology industry group was classified under the Retail industry group, given the retail nature of its operations. The Consumer Foods industry group will encompass the Beverages, Frozen Confectionery and Convenience Foods businesses whilst the Retail industry group will include the Supermarket and Office Automation businesses.
Key Corporate Governance Highlights at JKH for the Year 2018/19
GOVERNANCE

166 JOHN KEELLS HOLDINGS PLC | ANNUAL REPORT 2018/19
CORPORATE GOVERNANCE COMMENTARY
Outlook and Emerging Challenges
Given global volatility and the evolving role of corporate governance, the Group is well aware of the need to remain vigilant and geared through its level of preparedness and its capability in meeting external challenges. The Group will continue to endeavour to stay abreast of governance best practice.
Concurrently, corporate disintegrations, the pursuit of continuous improvement in governance and a call for increased accountability and transparency continue to influence and shape selected governance aspects. Detailed below are the more significant challenges, amongst many others, being recurrently addressed by JKH.
Board Diversity
JKH acknowledges the need for diversity on the Board. JKH is conscious of the need to have a Board which comprises of Directors who reflect the needs of its businesses and vision and aligned to the needs of its customers, employees and other stakeholders. The Group places great emphasis on attracting appropriately skilled personnel to the Board and will continue to strike a balance in this regard, whilst ensuring that Board diversity does not come at the expense of Board effectiveness.
Given that women comprise a significant proportion of the customer and employee populations, the Group will make every effort to attract appropriately qualified women to its various Boards and we are confident of attracting women who are proficient, competent and capable to represent our Boards.
Shareholder Activism
Increasing reports of mismanagement within corporates across the globe have resulted in increased shareholder activism with the Boards being held increasingly accountable and responsible for company performance. To meet such challenges going forward, the Group will continue to focus on maintaining suitable channels of communication with investors and analysts, as required, on a timely basis.
Continual Strengthening of Internal Controls
Augmenting transactional and financial internal controls with operational aspects, in line with international best practice, remains a medium-term priority for the Group. Continuous strengthening of internal controls through a streamlined process that optimises and facilitates process audit information, life cycle management and related processes are expected to:
eliminate inefficiencies inherent in manual processes
provide a platform based on process enforcement
enable management follow-up based on centrally held data in a compliance repository
identify trends, action taken, effectiveness and opportunities for process improvement by analysing movement of the compliance posture
Digital Oversight and Cyber Security
The rapidly-advancing nature of technology and the continual integration of the Group’s operations with technological progress has resulted in the Group being more vulnerable from a digital standpoint. As such, the Board places significant emphasis on ensuring that the Group’s soft and hard infrastructure is adequate to meet a potential breach. Data protection and cyber security are regularly addressed during the Risk Management and Audit Committee meetings and periodically discussed at a Board level.
"Given global volatility and the evolving role of corporate governance, the Group is well aware of the need to remain vigilant and geared through its level of preparedness and its capability in meeting external challenges. The Group will continue to endeavour to stay abreast of governance best practice."
With reference to Rule 7.13.2 of the Listing Rules of the Colombo Stock Exchange governing the minimum public holdings of listed entities, JKH divested 1,393,327 ordinary shares of Union Assurance PLC (UA) during the year under review, thereby reducing the Group’s stake to 90 per cent. Subsequent to this, UA requested for a transfer to the Diri Savi Board of the CSE in compliance with the Listing Rules.
John Keells Hotels PLC requested a transfer to the Diri Savi Board of the CSE with reference to Rule 7.13.2 of the Listing Rules of the Colombo Stock Exchange governing minimum public holdings of listed entities.
The Board declared a final dividend of Rs.2.00 per share in May 2018 for the financial year 2017/18. For the year under review, the Board declared a first interim dividend and a second interim dividend of Rs.2.00 each in November 2018 and January 2019, respectively.
Highlights of the 39th Annual General Meeting Held on 29 June 2018
Mr. A Omar, who retired in terms of Article 84 of the Articles of Association of the Company was re-elected as a Non-Executive Independent Director of the Company.
Ms. P Perera, who retired in terms of Article 84 of the Articles of Association of the Company was re-elected as a Non-Executive Independent Director of the Company.
Ernst & Young (E&Y) was re-appointed as the External Auditors of the Company and the Directors were authorised to determine the remuneration of E&Y.

167
Data Protection, Information Management and Adoption
Although the Group has in place continuously evolving IT infrastructure and platforms to meet requirements of day-to-day business, adoption of such systems and features, particularly in relation to information management and data classification, still remain at an early stage across the Group. To address this divergence, awareness sessions are being conducted across Group companies to better drive user adoption.
The European Union General Data Protection Regulation (GDPR), which has directly impacted many businesses, is a noteworthy data privacy regulation which will fundamentally reshape the way in which data is handled, ensuring stringent consent management processes and effective data rights management systems to ensure data security. Given the emergence of such regulations, data integrity and information management will be of pivotal nature. Thus, in furtherance of this initiative, the Group will strengthen its data governance structure in the ensuing year to ensure ownership and accountability of clearly articulated data governance policies and processes and Group-wide data quality standards. Implementation of the same across data domains in the Group will be supported by dedicated data owners and data stewards to ensure data privacy, data quality and rights management.
Board Refreshment and Independence
Although some argue that frequent board refreshment is needed to ensure independence, fresh ideas and new experiences in line with the changing nature of business, others argue that tenured and experienced Directors who are well aware of the nature of the business are better decision makers. The Group believes in striking a balance between board refreshment and independence, particularly given the complex nature of its operations in a diversified conglomerate setting.
Greater Employee Involvement in Governance
Employees play a pivotal role in reinforcing an effective governance system across the Group. Going forward, JKH will continue to encourage greater employee participation through:
a further strengthened continuous performance management process, which envisage continuous feedback and enhanced engagement via the newly implemented employee information systems
engagement and empowerment via greater delegation of authority
increased communication and collaboration
adoption of differentiated means of communication based on the age dynamics of employee segments
"JKH is conscious of the need to have a Board which comprises of Directors who reflect the needs of its businesses and vision and aligned to the needs of its customers, employees and other stakeholders."
Key Governance Disclosures
Section under Corporate Governance Commentary
The Governance System 2
The Board of Directors 3.1
Audit Committee 3.2.1
Human Resources and Compensation Committee 3.2.2
Nominations Committee 3.2.3
Related Party Transactions Review Committee 3.2.4
Chairman-Chief Executive Officer 3.3
Group Executive Committee and other Management Committees
3.4
Human resource governance 4.2
Stakeholder management and effective communication 4.5
Assurance mechanisms 5
Compliance summary 7
GOVERNANCE

168 JOHN KEELLS HOLDINGS PLC | ANNUAL REPORT 2018/19
CORPORATE GOVERNANCE COMMENTARY
All 4 Board Sub-Committees are chaired by Independent Directors appointed by the Board
The Chairman-CEO is present at all Human Resources and Compensation Committee meetings unless the Chairman-CEO’s performance assessment or remuneration is under discussion. The Deputy Chairman/Group Finance Director and the President, Human Resources and Legal are invited as necessitated
Audit Committee meetings are attended by the Chairman-CEO and the Deputy Chairman/Group Finance Director. The Head of Group Business Process Review, External Auditors and the Group Financial Controller are regular attendees
GOC acts as the binding agent to the various businesses within the Group towards identifying and extracting Group synergies
Only the key components are depicted in the diagram due to space constraints
2 THE CORPORATE GOVERNANCE SYSTEM
LEVEL
Group
Group + Industry / Function
Industry / Function
Sector / Function / Sub-sector
Business / Function /
BU / Department
INTERNAL GOVERNANCE STRUCTURE
Board of Directors and Senior Management Committees
Project Risk Assessment Committee
Related Party Transactions
Review Committee
Nomination Committee
Audit Committee
Human Resources and Compensation
Committee
Chairman-CEO
Group Operating Committee (GOC)
Management Committee
Group Executive Committee (GEC)
Sector Committee
Group Management Committee (GMC)
Employee Empowerment
Refer Section 3
Board of
Directors
INTEGRATED GOVERNANCE
Integrated Governance Systems and Procedures
Strategy Formulation and Decision
Making Process
Refer 4.1
Human Resource Governance
Refer 4.2
Integrated Risk Management
Refer 4.3
IT Governance
Refer 4.4
Stakeholder Management and
Effective Communication
Refer 4.5
ASSURANCE MECHANISMS
Senior Independent
Director
Refer 5.2
Board Committee
Refer 5.3
Employee Participation
Refer 5.4
Internal Control
Refer 5.5
JKH Code of Conduct
Refer 5.1
Ombudsperson
Refer 5.6
External Assurance
Refer 5.7
REGULATORY BENCHMARKS
Companies Act No. 7 of 2007
Mandatory compliance
Listing Rules of the Colombo Stock
Exchange (CSE) and Securities and Exchange
Commission of Sri Lanka Act No. 36
of 1987
Mandatory compliance
Recommendations of the UK Corporate Governance Code
as practicable in the context of the nature of businesses and risk
profiles
Voluntary compliance
Code of Best Practice on Corporate
Governance (2017) issued by CA
Sri Lanka
Voluntary compliance with almost the full 2017 Code, to the extent of business exigency and as required by the John Keells Group
The Code of Best Practice on Corporate Governance (2013) as published by the
Securities and Exchange Commission and the Institute of Chartered
Accountants, Sri Lanka (CA Sri Lanka)
Voluntary compliance
Refer Section 6

169
CHAIRMAN-CEO
SENIOR MANAGEMENT COMMITTEESPurpose: Led by the Chairman-CEO, these committees execute strategies and policies determined by the Board, manages through delegation and empowerment, the business and affairs of the Group, makes portfolio decisions and prioritises the allocation of the capital, technical and human resources thereby ensuring that value is created/enhanced for all stakeholders throughout the value chain
EMPLOYEE EMPOWERMENT
Purpose: Effective recruitment, development and retention of this vital stakeholder, by equipping employees with the necessary skill set and competencies, to enable them to execute management decisions
PURPOSE AS CHAIRMAN:
To provide leadership to the Board whilst inculcating good governance and ensuring effectiveness of the Board
Ensure constructive working relations are maintained between the Executive and Non-Executive members of the Board
Ensure with the assistance of the Board Secretary that:
Board procedures are followed
Information is disseminated in a timely manner to the Board
PURPOSE AS CEO:
Execute strategies and policies of the Board
Ensure the efficient management of all businesses
Guide and supervise Executive Directors towards striking a balance between their Board and Executive responsibilities
Ensure the operating model of the Group is aligned with short and long-term strategies of the Group
Ensure succession at the very senior levels is planned
Audit Committee Purpose:
To assist the Board in meeting its oversight responsibilities pertaining to Group financial statements, risk management, internal controls, legal and regulatory frameworks
Human Resources and Compensation CommitteePurpose:
To assist the Board in the establishment of remuneration policies and practices
To review and recommend appropriate remuneration packages for the CEO and other Executive Directors
Nominations Committee Purpose:
To lead the process of Board appointments and recommendations to the Board
To define and establish a nomination process for Non-Executive Directors
Related Party Transactions Review CommitteePurpose:
To ensure that all related party transactions of the Group are consistent with the Code on Related Party Transactions issued by SEC and with the Listing Rules of the CSE
Project Risk Assessment CommitteePurpose:
To evaluate and assess risks associated with Significant New Investments at the initial stages of formulation and in any event prior to making any contractual commitments for the long-term.
BOARD OF DIRECTORS
Purpose: Assess the overall direction and implement strategy of the business; fiduciary duty towards protecting stakeholder interests; monitor the performance of the senior management; ensure effectiveness of governance practices; implement a framework for risk assessment and management, including internal controls etc.
Leadership and control
Reporting obligations
Accountability through reporting obligations
Operations management / Performance feedback Delegated authority
Refer 3.1
Refer 3.4
Refer 3.5
Refer 3.3
Refer 3.2.1 Refer 3.2.2 Refer 3.2.3 Refer 3.2.4 Refer 3.2.4
3 INTERNAL GOVERNANCE STRUCTURE
The Internal Governance Structure comprises the committees which formulate, execute and monitor Group strategies and initiatives and the policies, processes and procedures employed for doing so. These components have an impact on the execution and monitoring of all governance related initiatives, systems and methods, and is illustrated as follows
The above components in the structure are strengthened and complemented by internal policies, processes and procedures such as strategy formulation and decision making, human resource governance, sustainability governance, integrated risk management, IT governance and stakeholder management and effective communication.
GOVERNANCE

170 JOHN KEELLS HOLDINGS PLC | ANNUAL REPORT 2018/19
3.1 The Board of Directors3.1.1 Board Responsibilities
In carrying out its responsibilities, the Board promotes a culture of openness, productive dialogue and constructive dissent, ensuring an environment which facilitates employee empowerment and engagement and creates value to all stakeholders.
The Board’s key responsibilities include:
Providing direction and guidance to the Group in the formulation of sustainable, high-level, medium, and long-term strategies which are aimed at promoting the long-term success of the Group
Reviewing and approving annual plans and long-term business plans
Tracking actual progress against plans
Reviewing HR processes with emphasis on top management succession planning
Ensuring operations are carried within the scope of the Enterprise Risk Management framework
Appointing and reviewing the performance of the Chairman-CEO
Monitoring systems of governance and compliance
Overseeing systems of internal control, risk management and establishing whistle-blowing conduits
Determining any changes to the discretions/authorities delegated from the Board to the executive levels
Reviewing and approving major acquisitions, disposals and capital expenditure
Approving any amendments to constitutional documents
Approving the issue of JKH equity/debt securities
Ensuring all Related Party Transactions are compliant with statutory obligations
3.1.2 Board Composition
As at 24 May 2019, the Board comprised of 8 Directors, with 6 of them being Non-Executive and Independent Directors. The Group policy is to maintain a healthy balance between the Executive, Non-Executive and Independent Directors, in keeping with the applicable rules and codes, with the Executive Directors bringing in deep knowledge of the businesses and the Non-Executive Independent Directors bringing in experience, objectivity and independent oversight.
The key changes to the Board composition during the year under review are as follows:
Mr. S Ratnayake, retired from the Board with effect from 31 December 2018. Mr. S Ratnayake was the Chairman of the Group and an Executive Director of JKH. Mr. K Balendra succeeded Mr. S Ratnayake as Chairman, post his retirement.
Dr. Ms. R Coomaraswamy was appointed to the Board with effect from 1 October 2018 as an Independent, Non-Executive Director.
The current composition of the JKH Board is illustrated as follows:
0
1
2
3
4
5
6
7
8
Designation
ED Female
Male61-70
<6
3-6
>3
51-60
40-50
SID
NED
Gender Age group Board tenure(years)
3.1.3 Board Skills
Collectively, the Board brings in a wealth of diverse exposure in the fields of management, business administration, banking, finance, law, economics, marketing and human resources. All Directors possess the skills, expertise and knowledge complemented with a high sense of integrity and independent judgement.
Further details of their qualifications and experience are provided under the Board Profiles section of the Annual Report - page 158
CORPORATE GOVERNANCE COMMENTARY
The Group is also conscious of the need to maintain an appropriate mix of skills and experience in the Board through a regular review of its composition in order to ensure that the skills representation is in alignment with current and future needs of the Group.
3.1.4 Access to Independent Professional Advice
To preserve the independence of the Board and to strengthen the decision making, the Board is encouraged to seek independent professional advice, in furtherance of their duties, at the Group’s expense. This is coordinated through the Board Secretary, as and when requested.
3.1.5 Board Appointment
Board appointments follow a structured and formal process within the purview of the Nominations Committee.
The Terms of Reference for the members of the Nominations Committee and the Committee report can be found in section 3.2.3 of this Commentary.
Details of new Directors are disclosed to shareholders at the time of their appointment through a public announcement. Details of such appointments are also carried in the relevant Interim Releases and the Annual Reports. Directors are required to report any substantial change in their professional responsibilities and business associations to the Nominations Committee, which will examine the facts and circumstances and make recommendations to the Board accordingly.
3.1.6 Board Induction and Training
When Directors are newly appointed to the Board, they undergo a comprehensive induction where they are apprised, inter-alia, of the Group Values and culture, its operating model, policies, governance framework and processes, the Code of Conduct and the operational strategies of the Group.
Additionally, the newly appointed Directors are granted access to relevant parts of the business and are availed the opportunity to meet with key management personnel and other key third-party service providers such as External Auditors, Risk Consultants etcetera.
"All Directors possess the skills, expertise and knowledge complemented with a high sense of integrity and independent judgement."
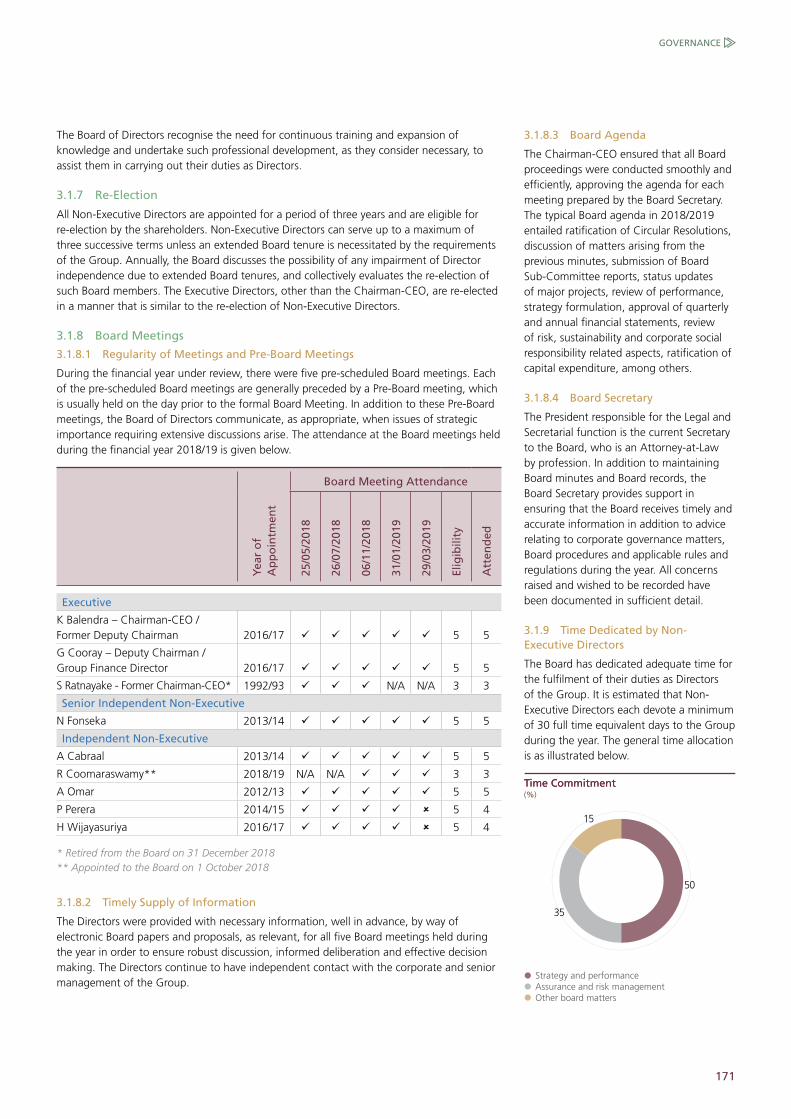
171
The Board of Directors recognise the need for continuous training and expansion of knowledge and undertake such professional development, as they consider necessary, to assist them in carrying out their duties as Directors.
3.1.7 Re-Election
All Non-Executive Directors are appointed for a period of three years and are eligible for re-election by the shareholders. Non-Executive Directors can serve up to a maximum of three successive terms unless an extended Board tenure is necessitated by the requirements of the Group. Annually, the Board discusses the possibility of any impairment of Director independence due to extended Board tenures, and collectively evaluates the re-election of such Board members. The Executive Directors, other than the Chairman-CEO, are re-elected in a manner that is similar to the re-election of Non-Executive Directors.
3.1.8 Board Meetings
3.1.8.1 Regularity of Meetings and Pre-Board Meetings
During the financial year under review, there were five pre-scheduled Board meetings. Each of the pre-scheduled Board meetings are generally preceded by a Pre-Board meeting, which is usually held on the day prior to the formal Board Meeting. In addition to these Pre-Board meetings, the Board of Directors communicate, as appropriate, when issues of strategic importance requiring extensive discussions arise. The attendance at the Board meetings held during the financial year 2018/19 is given below.
Board Meeting Attendance
Yea
r o
f A
pp
oin
tmen
t
25/0
5/20
18
26/0
7/20
18
06/1
1/20
18
31/0
1/20
19
29/0
3/20
19
Elig
ibili
ty
Att
end
ed
Executive
K Balendra – Chairman-CEO / Former Deputy Chairman 2016/17 5 5
G Cooray – Deputy Chairman / Group Finance Director 2016/17 5 5
S Ratnayake - Former Chairman-CEO* 1992/93 N/A N/A 3 3
Senior Independent Non-Executive
N Fonseka 2013/14 5 5
Independent Non-Executive
A Cabraal 2013/14 5 5
R Coomaraswamy** 2018/19 N/A N/A 3 3
A Omar 2012/13 5 5
P Perera 2014/15 5 4
H Wijayasuriya 2016/17 5 4
* Retired from the Board on 31 December 2018** Appointed to the Board on 1 October 2018
3.1.8.2 Timely Supply of Information
The Directors were provided with necessary information, well in advance, by way of electronic Board papers and proposals, as relevant, for all five Board meetings held during the year in order to ensure robust discussion, informed deliberation and effective decision making. The Directors continue to have independent contact with the corporate and senior management of the Group.
3.1.8.3 Board Agenda
The Chairman-CEO ensured that all Board proceedings were conducted smoothly and efficiently, approving the agenda for each meeting prepared by the Board Secretary. The typical Board agenda in 2018/2019 entailed ratification of Circular Resolutions, discussion of matters arising from the previous minutes, submission of Board Sub-Committee reports, status updates of major projects, review of performance, strategy formulation, approval of quarterly and annual financial statements, review of risk, sustainability and corporate social responsibility related aspects, ratification of capital expenditure, among others.
3.1.8.4 Board Secretary
The President responsible for the Legal and Secretarial function is the current Secretary to the Board, who is an Attorney-at-Law by profession. In addition to maintaining Board minutes and Board records, the Board Secretary provides support in ensuring that the Board receives timely and accurate information in addition to advice relating to corporate governance matters, Board procedures and applicable rules and regulations during the year. All concerns raised and wished to be recorded have been documented in sufficient detail.
3.1.9 Time Dedicated by Non-Executive Directors
The Board has dedicated adequate time for the fulfilment of their duties as Directors of the Group. It is estimated that Non-Executive Directors each devote a minimum of 30 full time equivalent days to the Group during the year. The general time allocation is as illustrated below.
50
35
15
(%)(%)
Strategy and performanceAssurance and risk managementOther board matters
Time CommitmentTime Commitment
GOVERNANCE
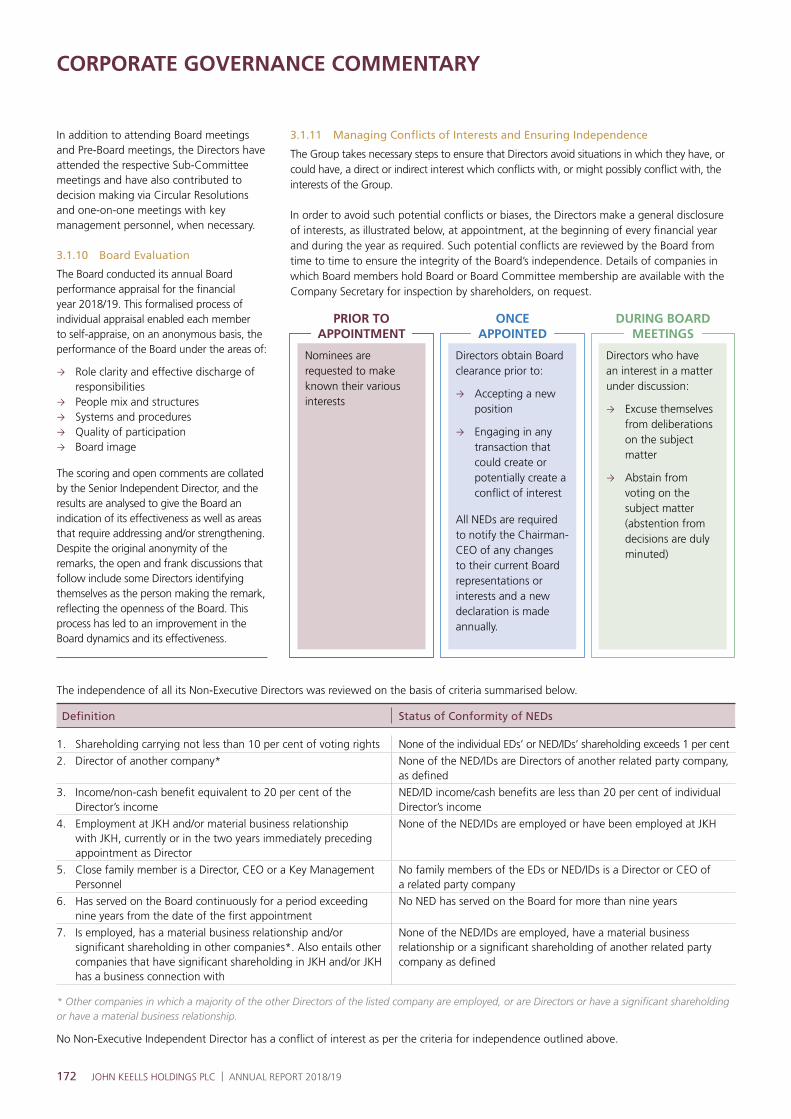
172 JOHN KEELLS HOLDINGS PLC | ANNUAL REPORT 2018/19
In addition to attending Board meetings and Pre-Board meetings, the Directors have attended the respective Sub-Committee meetings and have also contributed to decision making via Circular Resolutions and one-on-one meetings with key management personnel, when necessary.
3.1.10 Board Evaluation
The Board conducted its annual Board performance appraisal for the financial year 2018/19. This formalised process of individual appraisal enabled each member to self-appraise, on an anonymous basis, the performance of the Board under the areas of:
Role clarity and effective discharge of responsibilities
People mix and structures Systems and procedures Quality of participation Board image
The scoring and open comments are collated by the Senior Independent Director, and the results are analysed to give the Board an indication of its effectiveness as well as areas that require addressing and/or strengthening. Despite the original anonymity of the remarks, the open and frank discussions that follow include some Directors identifying themselves as the person making the remark, reflecting the openness of the Board. This process has led to an improvement in the Board dynamics and its effectiveness.
CORPORATE GOVERNANCE COMMENTARY
Nominees are requested to make known their various interests
Directors obtain Board clearance prior to:
Accepting a new position
Engaging in any transaction that could create or potentially create a conflict of interest
All NEDs are required to notify the Chairman-CEO of any changes to their current Board representations or interests and a new declaration is made annually.
Directors who have an interest in a matter under discussion:
Excuse themselves from deliberations on the subject matter
Abstain from voting on the subject matter (abstention from decisions are duly minuted)
PRIOR TO APPOINTMENT
ONCE APPOINTED
DURING BOARD MEETINGS
3.1.11 Managing Conflicts of Interests and Ensuring Independence
The Group takes necessary steps to ensure that Directors avoid situations in which they have, or could have, a direct or indirect interest which conflicts with, or might possibly conflict with, the interests of the Group.
In order to avoid such potential conflicts or biases, the Directors make a general disclosure of interests, as illustrated below, at appointment, at the beginning of every financial year and during the year as required. Such potential conflicts are reviewed by the Board from time to time to ensure the integrity of the Board’s independence. Details of companies in which Board members hold Board or Board Committee membership are available with the Company Secretary for inspection by shareholders, on request.
The independence of all its Non-Executive Directors was reviewed on the basis of criteria summarised below.
Definition Status of Conformity of NEDs
1. Shareholding carrying not less than 10 per cent of voting rights None of the individual EDs’ or NED/IDs’ shareholding exceeds 1 per cent
2. Director of another company* None of the NED/IDs are Directors of another related party company, as defined
3. Income/non-cash benefit equivalent to 20 per cent of the Director’s income
NED/ID income/cash benefits are less than 20 per cent of individual Director’s income
4. Employment at JKH and/or material business relationship with JKH, currently or in the two years immediately preceding appointment as Director
None of the NED/IDs are employed or have been employed at JKH
5. Close family member is a Director, CEO or a Key Management Personnel
No family members of the EDs or NED/IDs is a Director or CEO of a related party company
6. Has served on the Board continuously for a period exceeding nine years from the date of the first appointment
No NED has served on the Board for more than nine years
7. Is employed, has a material business relationship and/or significant shareholding in other companies*. Also entails other companies that have significant shareholding in JKH and/or JKH has a business connection with
None of the NED/IDs are employed, have a material business relationship or a significant shareholding of another related party company as defined
* Other companies in which a majority of the other Directors of the listed company are employed, or are Directors or have a significant shareholding or have a material business relationship.
No Non-Executive Independent Director has a conflict of interest as per the criteria for independence outlined above.
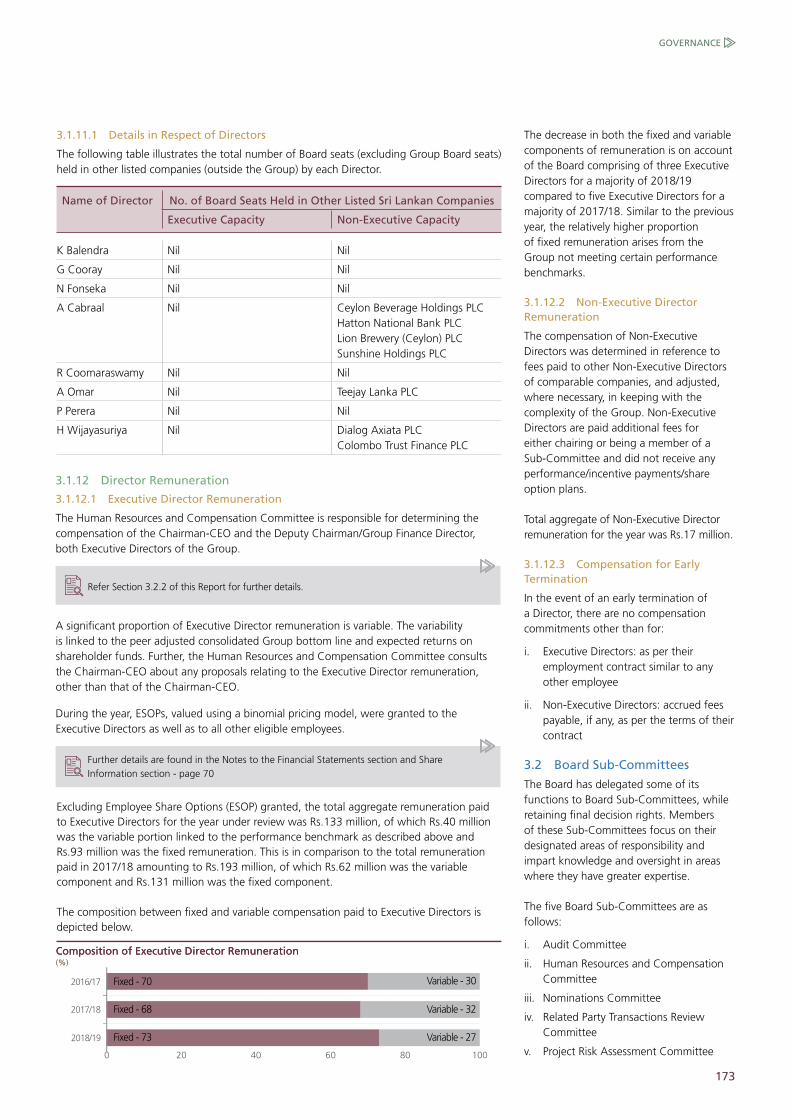
173
3.1.11.1 Details in Respect of Directors
The following table illustrates the total number of Board seats (excluding Group Board seats) held in other listed companies (outside the Group) by each Director.
Name of Director No. of Board Seats Held in Other Listed Sri Lankan Companies
Executive Capacity Non-Executive Capacity
K Balendra Nil Nil
G Cooray Nil Nil
N Fonseka Nil Nil
A Cabraal Nil Ceylon Beverage Holdings PLC Hatton National Bank PLC Lion Brewery (Ceylon) PLC Sunshine Holdings PLC
R Coomaraswamy Nil Nil
A Omar Nil Teejay Lanka PLC
P Perera Nil Nil
H Wijayasuriya Nil Dialog Axiata PLC Colombo Trust Finance PLC
3.1.12 Director Remuneration
3.1.12.1 Executive Director Remuneration
The Human Resources and Compensation Committee is responsible for determining the compensation of the Chairman-CEO and the Deputy Chairman/Group Finance Director, both Executive Directors of the Group.
Refer Section 3.2.2 of this Report for further details.
A significant proportion of Executive Director remuneration is variable. The variability is linked to the peer adjusted consolidated Group bottom line and expected returns on shareholder funds. Further, the Human Resources and Compensation Committee consults the Chairman-CEO about any proposals relating to the Executive Director remuneration, other than that of the Chairman-CEO.
During the year, ESOPs, valued using a binomial pricing model, were granted to the Executive Directors as well as to all other eligible employees.
Further details are found in the Notes to the Financial Statements section and Share Information section - page 70
Excluding Employee Share Options (ESOP) granted, the total aggregate remuneration paid to Executive Directors for the year under review was Rs.133 million, of which Rs.40 million was the variable portion linked to the performance benchmark as described above and Rs.93 million was the fixed remuneration. This is in comparison to the total remuneration paid in 2017/18 amounting to Rs.193 million, of which Rs.62 million was the variable component and Rs.131 million was the fixed component.
The composition between fixed and variable compensation paid to Executive Directors is depicted below.
The decrease in both the fixed and variable components of remuneration is on account of the Board comprising of three Executive Directors for a majority of 2018/19 compared to five Executive Directors for a majority of 2017/18. Similar to the previous year, the relatively higher proportion of fixed remuneration arises from the Group not meeting certain performance benchmarks.
3.1.12.2 Non-Executive Director Remuneration
The compensation of Non-Executive Directors was determined in reference to fees paid to other Non-Executive Directors of comparable companies, and adjusted, where necessary, in keeping with the complexity of the Group. Non-Executive Directors are paid additional fees for either chairing or being a member of a Sub-Committee and did not receive any performance/incentive payments/share option plans.
Total aggregate of Non-Executive Director remuneration for the year was Rs.17 million.
3.1.12.3 Compensation for Early Termination
In the event of an early termination of a Director, there are no compensation commitments other than for:
i. Executive Directors: as per their employment contract similar to any other employee
ii. Non-Executive Directors: accrued fees payable, if any, as per the terms of their contract
3.2 Board Sub-Committees
The Board has delegated some of its functions to Board Sub-Committees, while retaining final decision rights. Members of these Sub-Committees focus on their designated areas of responsibility and impart knowledge and oversight in areas where they have greater expertise.
The five Board Sub-Committees are as follows:
i. Audit Committee
ii. Human Resources and Compensation Committee
iii. Nominations Committee
iv. Related Party Transactions Review Committee
v. Project Risk Assessment Committee
GOVERNANCE
0 20 40 60 80 100
2016/17
2017/18
2018/19
Fixed - 70
Fixed - 68
Fixed - 73
Composition of Executive Director RemunerationComposition of Executive Director Remuneration
Variable - 32
Variable - 30
Variable - 27
(%)(%)

174 JOHN KEELLS HOLDINGS PLC | ANNUAL REPORT 2018/19
The Board Sub-Committees comprise predominantly of Independent Non-Executive Directors. The membership of the five Board Sub-Committees is as follows;
Board Sub-Committee Membership as at 31 March 2019
Au
dit
C
om
mit
tee
Hu
man
R
eso
urc
es a
nd
C
om
pen
sati
on
C
om
mit
tee
No
min
atio
ns
Co
mm
itte
e
Rel
ated
Par
ty
Tran
sact
ion
s R
evie
w
Co
mm
itte
e
Pro
ject
Ris
k A
sses
smen
t C
om
mit
tee
Executive
K Balendra - Chairman-CEO
G Cooray - Deputy Chairman / Group Finance Director
Senior Independent Non-Executive
N Fonseka
Independent Non-Executive
A Cabraal
R Coomaraswamy
A Omar
P Perera
H Wijayasuriya
Committee Member Committee Chair
3.2.1 Audit Committee
All members to be Non-Executive, Independent Directors, with at least one member having significant, recent and relevant financial management and accounting experience and a professional accounting qualification
The Chairman-CEO and the Group Finance Director are permanent invitees for all Committee meetings. The Group Financial Controller is also present at discussions relating to Group reporting
The Head of the Group Business Process Review division is the Secretary of the Committee
Review the quarterly and annual financial statements, including the quality, transparency, integrity, accuracy and compliance with accounting standards, laws and regulations
Assess the adequacy and effectiveness of the internal control environment in the Group and ensure appropriate action is taken on the recommendation of the Internal Auditors
Evaluate the competence and effectiveness of the risk management systems of the Group and ensure the robustness and effectiveness in monitoring and controlling risks
Review the adequacy and effectiveness of the internal audit arrangements
Recommend the appointment, re-appointment and removal of the External Auditors including their remuneration and terms of engagement by assessing qualifications, expertise, resources and independence
COMPOSITION
SCOPE
CORPORATE GOVERNANCE COMMENTARY
Report of the Audit Committee
Role of the Committee
The role of the Audit Committee is to assist the Board in fulfilling its oversight responsibilities in relation to the integrity of the financial statements of the Company and the Group, the internal control and risk management systems of the Group and its compliance with legal and regulatory requirements, the External Auditors’ performance, qualifications and independence, and, the adequacy and performance of the Internal Audit function, undertaken by the Group Business Process Review division (GBPR). The scope of functions and responsibilities are adequately set out in the terms of reference of the Committee which has been approved by the Board and is reviewed annually.
The Committee’s responsibilities pertain to the Group as a whole and in discharging its responsibilities, the Committee places reliance on the work of other Audit Committees in the Group without prejudicing the independence of those Committees. However, to the extent, and in a manner, it considers appropriate, the Committee provides feedback to those entities for their consideration and necessary action. An interactive forum with the participation of members of Audit Committees of Group entities was also held to discuss ways and means of improving coordination with GBPR and to exchange information on best practices.
The effectiveness of the Committee is evaluated annually by each member of the Committee and the results are communicated to the Board.
Composition of the Committee and Meetings
The Audit Committee is comprised by the undersigned and the following Independent Non-Executive Directors:
A CabraalP Perera
The Head of the GBPR division served as the Secretary to the Audit Committee.
175
The Audit Committee met five times during the financial year. Information on the attendance at these meetings by the members of the Committee is given in the ensuing section. The Chairman-CEO, the Group Finance Director, Group Financial Controller and the External Auditors attended most parts of these meetings by invitation. The Internal Auditors carrying out outsourced assignments and other officials of the Company and the Group also attended these meetings on a needs basis. The Committee engaged with management to review key risks faced by the Group as a whole and the main sectors, with a view to obtaining assurances that appropriate and effective risk mitigation strategies were in place.
The activities and views of the Committee have been communicated to the Board of Directors quarterly through verbal briefings, and by tabling the minutes of the Committee’s meetings.
Financial Reporting
The Audit Committee has reviewed and discussed the Group’s quarterly and annual financial statements with management and the External Auditors prior to publication. The scope of the review included ascertaining compliance of the statements and disclosures with the Sri Lanka Accounting Standards, the appropriateness and changes in accounting policies and material judgemental matters. The Committee also discussed with the External Auditors and management, any matters communicated to the Committee by the External Auditors in their reports to the Committee on the audit for the year.
The External Auditors were also engaged to conduct a limited review of the Group’s interim financial statements for the six months ended 30 September 2018. The results of this review were discussed with the External Auditors and management.
The Committee obtained independent input from the External Auditors on the effects of any new Sri Lanka Accounting Standards that came into effect for the year under review and satisfied themselves that the necessary preparatory work was carried out, to enable the Company to comply with these new standards.
Internal Audit, Risks and Controls
The Committee reviewed the adequacy of the Internal Audit coverage for the Group and the Internal Audit Plans for the Group with the Head of the GBPR division and management. The Internal Audit function of most Group companies is outsourced to leading professional firms under the overarching control of the GBPR division.
The GBPR division regularly reported to the Committee on the adequacy and effectiveness of internal controls in the Group and compliance with laws and regulations and established policies and procedures of the Group. Reports from the outsourced Internal Auditors on the operations of the Company and some of the unquoted subsidiaries of the Company were also reviewed by the Committee. Follow-up action taken on the recommendations of the outsourced Internal Auditors and any other significant follow-up matters were documented and presented to the Committee on a quarterly basis by the Head of GBPR.
The GBPR division, drawing from the growing benefits of assurance related inputs provided by the digital forensic capability that is operational across the entire Group, has extended the scope of the project to include measures to optimise internal process efficiencies and behavioural responses with a view to enhancing operational controls and to support governance reporting.
The Sustainability and Enterprise Risk Management division reported to the Committee on the process of identification, evaluation and management of all significant risks faced by the Group. The report covered the overall risk profile of the Group for the year under review in comparison with that for the previous year, and the most significant risks from a Group perspective together with the remedial measures taken to manage them.
Formal confirmations and assurances were obtained from the senior management of Group companies on a quarterly basis regarding the efficacy and status of the internal control systems and risk management systems and compliance with applicable laws and regulations.
The Committee reviewed the whistleblowing arrangements for the Group and had direct access to the Ombudsperson for the Group. The effectiveness and resource requirements of the GBPR division were reviewed and discussed with management and changes were effected where considered necessary.
External Audit
The External Auditors’ Letter of Engagement, including the scope of the audit, was reviewed and discussed by the Committee with the External Auditors and management prior to the commencement of the audit.
The External Auditors kept the Committee advised on an on-going basis regarding matters of significance that were pending resolution. Before the conclusion of the Audit, the Committee met with the External Auditors and management to discuss all audit issues and to agree on their treatment. This included the discussion of formal reports from the External Auditors to the Committee. The Committee also met the External Auditors, without management being present, prior to the finalisation of the financial statements to obtain their input on specific issues and to ascertain whether they had any areas of concern relating to their work. No matters other than those already discussed with management were raised by the External Auditors.
The External Auditors’ final management reports on the audit of the Company and Group financial statements for the year 2018/2019 were discussed with management and the auditors.
The Committee is satisfied that the independence of the External Auditors has not been impaired by any event or service that gives rise to a conflict of interest. Due consideration has been given to the nature of the services provided by the Auditors and the level of audit and non-audit fees received by the Auditors from the John Keells Group. The Committee also reviewed the arrangements made by the Auditors to maintain their independence and
GOVERNANCE

176 JOHN KEELLS HOLDINGS PLC | ANNUAL REPORT 2018/19
CORPORATE GOVERNANCE COMMENTARY
Audit Committee meeting attendance
No. of meetings - 5
Elig
ible
to
A
tten
d
Att
end
ed
A Cabraal 5 5
N Fonseka 5 5
P Perera 5 5
By Invitation
S Ratnayake* 4 4
K Balendra 5 5
G Cooray 5 5
*Retired from the Board on 31 December 2018
3.2.2 Human Resources and Compensation Committee
Committee to comprise exclusively of Non-Executive Directors, a majority of whom shall be independent
The Chairman of the Committee must be a Non-Executive Director
The Chairman-CEO and Group Finance Director are present at all Committee meetings unless the Chairman-CEO or Executive Director remuneration is under discussion respectively
The President - Human Resources and Legal, is the Secretary of the Committee
Review and recommend overall remuneration philosophy, strategy, policies and practice and, performance based pay plans for the Group
Determine and agree with the Board a framework for remuneration of Chairman and Executive Directors based on performance targets, benchmark principles, performance related pay schemes, industry trends and past remuneration
Succession planning of Key Management Personnel
Determining compensation of Non-Executive Directors will not be under the scope of this Committee
COMPOSITION
SCOPE
Report of the Human Resources and Compensation Committee
The Committee determined the remuneration of the Chairman-CEO in terms of the methodology set out by the Board, upon an evaluation of his performance by the Non-Executive Directors. The Chairman-CEO’s evaluation of the other Executive Directors and the members of the Group Executive Committee were considered by the Committee and remuneration was determined based on performance, market comparators for similar positions and in accordance with the Company’s Compensation and Benefits policy.
The succession plans discussed and agreed previously were successfully set in motion, including the appointment of the new Chairman-CEO, Mr. K. Balendra from 1 January 2019. The Compensation and Benefits (C&B) Plan for the Group was modified during the reporting year after obtaining expert inputs and conducting many internal deliberations. The new plan was successfully rolled out based on a pre agreed communication plan to the employees that were impacted by the change.
A report from the Chairman of the Human Resources and Compensation Committee continues to be a standing agenda item
at the quarterly Board meetings. The Chairman of the Committee reports on the developments which have taken place since the last Board meeting, if any, and updates the Board on various matters, as relevant and requested.
The Committee wishes to report that the Company has complied with the Companies Act in relation to remuneration of Directors. The annual performance appraisal scheme, the calculation of short-term incentives, and the award of ESOPs were executed in accordance with the approvals given by the Board, based on discussions conducted between the Committee and the Management.
I wish to thank my colleagues for their valuable inputs in guiding the Committee in its deliberations, and the President responsible for Human Resources of the Group for enabling fruitful interactions at the meetings of the Committee.
A CabraalChairman of the Human Resources and Compensation Committee
24 May 2019
confirmation has been received from the Auditors of their compliance with the independence guidance given in the Code of Ethics of the Institute of Chartered Accountants of Sri Lanka.
The performance of the External Auditors has been evaluated with the aid of a formal assessment process with input provided by the senior management of the Company and the Committee has recommended to the Board that Ernst & Young be re-appointed as the Lead/Consolidation Auditors of the Group for the financial year ending 31 March 2020, subject to approval by the shareholders at the Annual General Meeting.
N FonsekaChairman of the Audit Committee
24 May 2019
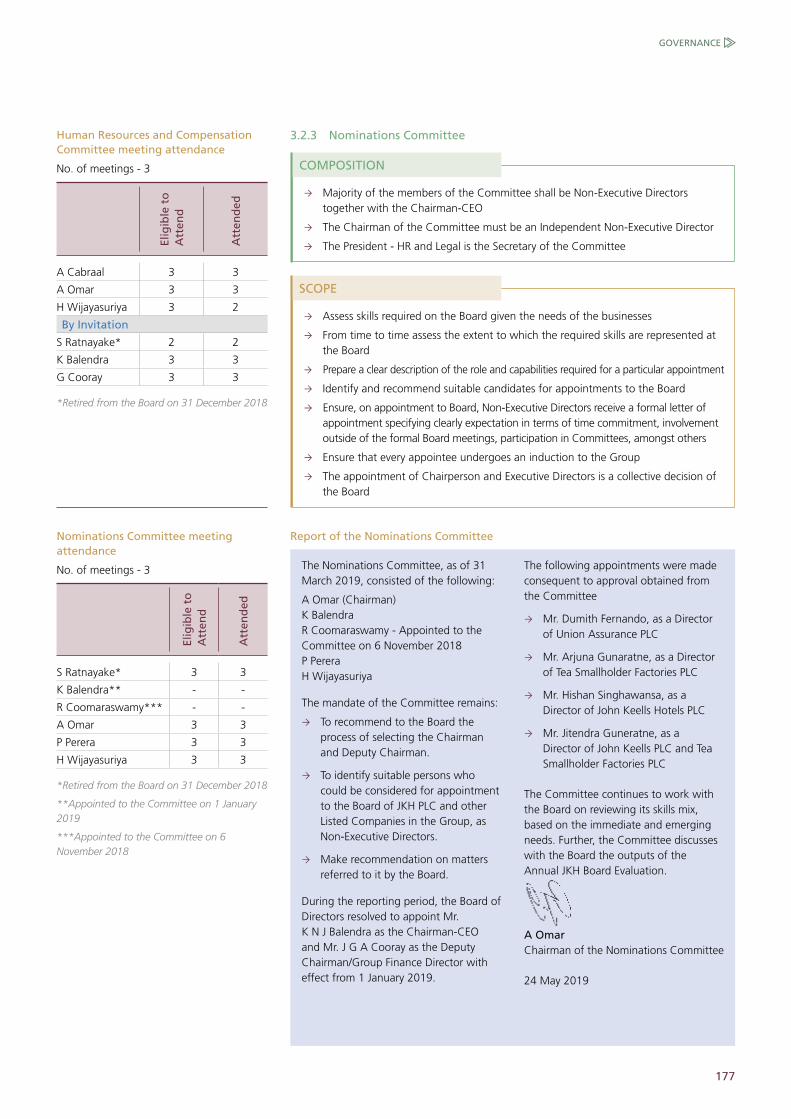
177
Human Resources and Compensation Committee meeting attendance
No. of meetings - 3El
igib
le t
o
Att
end
Att
end
ed
A Cabraal 3 3
A Omar 3 3
H Wijayasuriya 3 2
By Invitation
S Ratnayake* 2 2
K Balendra 3 3
G Cooray 3 3
*Retired from the Board on 31 December 2018
3.2.3 Nominations Committee
Majority of the members of the Committee shall be Non-Executive Directors together with the Chairman-CEO
The Chairman of the Committee must be an Independent Non-Executive Director
The President - HR and Legal is the Secretary of the Committee
Assess skills required on the Board given the needs of the businesses
From time to time assess the extent to which the required skills are represented at the Board
Prepare a clear description of the role and capabilities required for a particular appointment
Identify and recommend suitable candidates for appointments to the Board
Ensure, on appointment to Board, Non-Executive Directors receive a formal letter of appointment specifying clearly expectation in terms of time commitment, involvement outside of the formal Board meetings, participation in Committees, amongst others
Ensure that every appointee undergoes an induction to the Group
The appointment of Chairperson and Executive Directors is a collective decision of the Board
COMPOSITION
SCOPE
Report of the Nominations Committee
The Nominations Committee, as of 31 March 2019, consisted of the following:
A Omar (Chairman)K BalendraR Coomaraswamy - Appointed to the Committee on 6 November 2018P PereraH Wijayasuriya
The mandate of the Committee remains:
To recommend to the Board the process of selecting the Chairman and Deputy Chairman.
To identify suitable persons who could be considered for appointment to the Board of JKH PLC and other Listed Companies in the Group, as Non-Executive Directors.
Make recommendation on matters referred to it by the Board.
During the reporting period, the Board of Directors resolved to appoint Mr. K N J Balendra as the Chairman-CEO and Mr. J G A Cooray as the Deputy Chairman/Group Finance Director with effect from 1 January 2019.
The following appointments were made consequent to approval obtained from the Committee
Mr. Dumith Fernando, as a Director of Union Assurance PLC
Mr. Arjuna Gunaratne, as a Director of Tea Smallholder Factories PLC
Mr. Hishan Singhawansa, as a Director of John Keells Hotels PLC
Mr. Jitendra Guneratne, as a Director of John Keells PLC and Tea Smallholder Factories PLC
The Committee continues to work with the Board on reviewing its skills mix, based on the immediate and emerging needs. Further, the Committee discusses with the Board the outputs of the Annual JKH Board Evaluation.
A OmarChairman of the Nominations Committee
24 May 2019
Nominations Committee meeting attendance
No. of meetings - 3
Elig
ible
to
A
tten
d
Att
end
ed
S Ratnayake* 3 3
K Balendra** - -
R Coomaraswamy*** - -
A Omar 3 3
P Perera 3 3
H Wijayasuriya 3 3
*Retired from the Board on 31 December 2018
**Appointed to the Committee on 1 January 2019
***Appointed to the Committee on 6 November 2018
GOVERNANCE
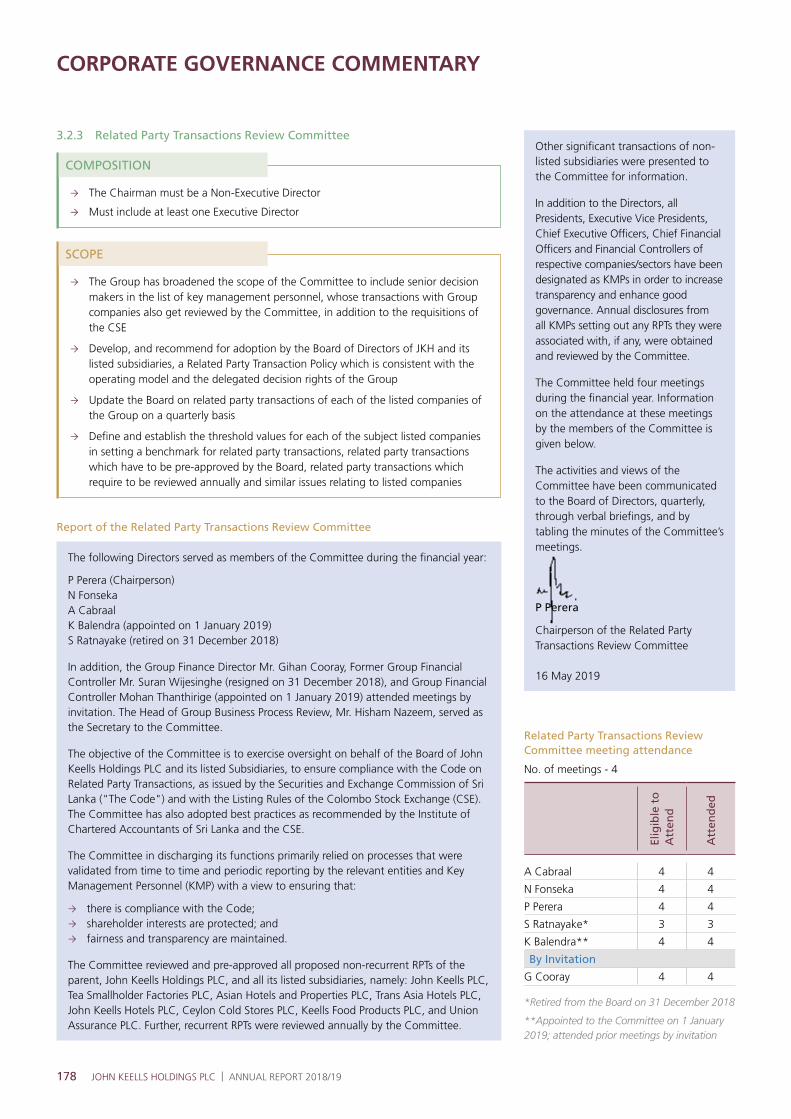
178 JOHN KEELLS HOLDINGS PLC | ANNUAL REPORT 2018/19
CORPORATE GOVERNANCE COMMENTARY
Report of the Related Party Transactions Review Committee
The following Directors served as members of the Committee during the financial year:
P Perera (Chairperson)N FonsekaA CabraalK Balendra (appointed on 1 January 2019)S Ratnayake (retired on 31 December 2018)
In addition, the Group Finance Director Mr. Gihan Cooray, Former Group Financial Controller Mr. Suran Wijesinghe (resigned on 31 December 2018), and Group Financial Controller Mohan Thanthirige (appointed on 1 January 2019) attended meetings by invitation. The Head of Group Business Process Review, Mr. Hisham Nazeem, served as the Secretary to the Committee.
The objective of the Committee is to exercise oversight on behalf of the Board of John Keells Holdings PLC and its listed Subsidiaries, to ensure compliance with the Code on Related Party Transactions, as issued by the Securities and Exchange Commission of Sri Lanka ("The Code") and with the Listing Rules of the Colombo Stock Exchange (CSE). The Committee has also adopted best practices as recommended by the Institute of Chartered Accountants of Sri Lanka and the CSE.
The Committee in discharging its functions primarily relied on processes that were validated from time to time and periodic reporting by the relevant entities and Key Management Personnel (KMP) with a view to ensuring that:
there is compliance with the Code; shareholder interests are protected; and fairness and transparency are maintained.
The Committee reviewed and pre-approved all proposed non-recurrent RPTs of the parent, John Keells Holdings PLC, and all its listed subsidiaries, namely: John Keells PLC, Tea Smallholder Factories PLC, Asian Hotels and Properties PLC, Trans Asia Hotels PLC, John Keells Hotels PLC, Ceylon Cold Stores PLC, Keells Food Products PLC, and Union Assurance PLC. Further, recurrent RPTs were reviewed annually by the Committee.
Other significant transactions of non-listed subsidiaries were presented to the Committee for information.
In addition to the Directors, all Presidents, Executive Vice Presidents, Chief Executive Officers, Chief Financial Officers and Financial Controllers of respective companies/sectors have been designated as KMPs in order to increase transparency and enhance good governance. Annual disclosures from all KMPs setting out any RPTs they were associated with, if any, were obtained and reviewed by the Committee.
The Committee held four meetings during the financial year. Information on the attendance at these meetings by the members of the Committee is given below.
The activities and views of the Committee have been communicated to the Board of Directors, quarterly, through verbal briefings, and by tabling the minutes of the Committee’s meetings.
P Perera
Chairperson of the Related Party Transactions Review Committee
16 May 2019
Related Party Transactions Review Committee meeting attendance
No. of meetings - 4
Elig
ible
to
A
tten
d
Att
end
ed
A Cabraal 4 4
N Fonseka 4 4
P Perera 4 4
S Ratnayake* 3 3
K Balendra** 4 4
By Invitation
G Cooray 4 4
*Retired from the Board on 31 December 2018
**Appointed to the Committee on 1 January 2019; attended prior meetings by invitation
3.2.3 Related Party Transactions Review Committee
The Chairman must be a Non-Executive Director
Must include at least one Executive Director
The Group has broadened the scope of the Committee to include senior decision makers in the list of key management personnel, whose transactions with Group companies also get reviewed by the Committee, in addition to the requisitions of the CSE
Develop, and recommend for adoption by the Board of Directors of JKH and its listed subsidiaries, a Related Party Transaction Policy which is consistent with the operating model and the delegated decision rights of the Group
Update the Board on related party transactions of each of the listed companies of the Group on a quarterly basis
Define and establish the threshold values for each of the subject listed companies in setting a benchmark for related party transactions, related party transactions which have to be pre-approved by the Board, related party transactions which require to be reviewed annually and similar issues relating to listed companies
COMPOSITION
SCOPE
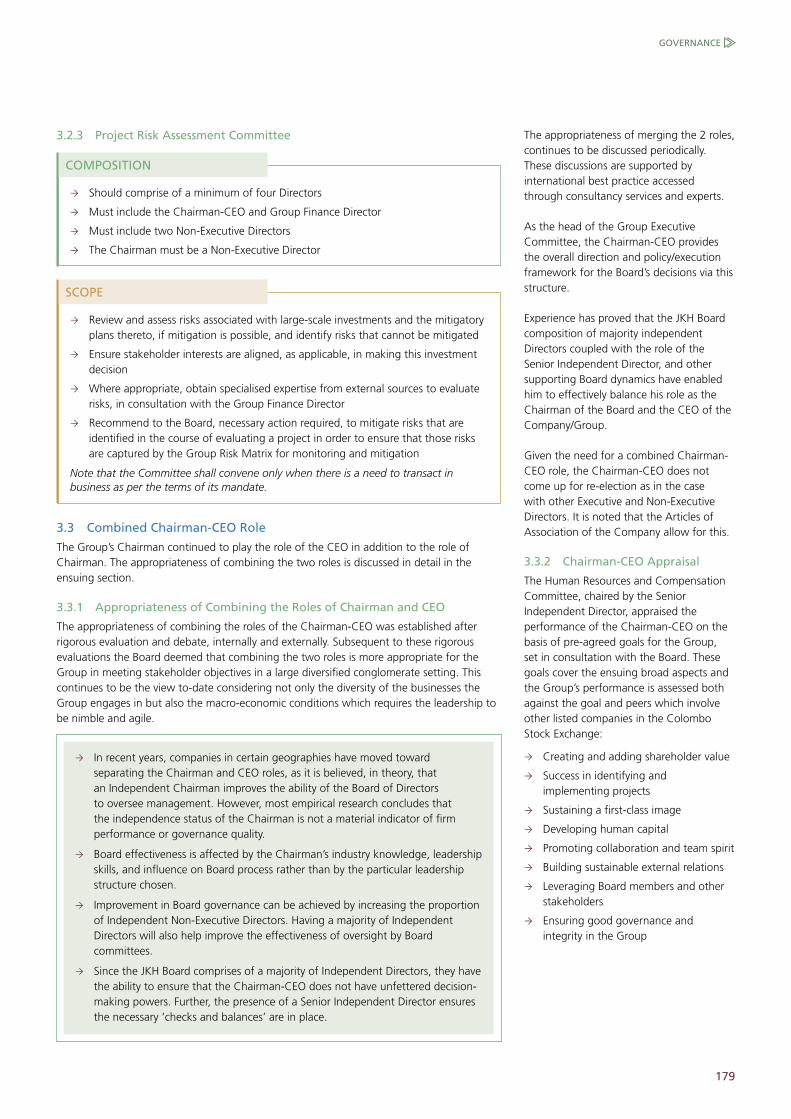
179
3.2.3 Project Risk Assessment Committee
Should comprise of a minimum of four Directors
Must include the Chairman-CEO and Group Finance Director
Must include two Non-Executive Directors
The Chairman must be a Non-Executive Director
Review and assess risks associated with large-scale investments and the mitigatory plans thereto, if mitigation is possible, and identify risks that cannot be mitigated
Ensure stakeholder interests are aligned, as applicable, in making this investment decision
Where appropriate, obtain specialised expertise from external sources to evaluate risks, in consultation with the Group Finance Director
Recommend to the Board, necessary action required, to mitigate risks that are identified in the course of evaluating a project in order to ensure that those risks are captured by the Group Risk Matrix for monitoring and mitigation
Note that the Committee shall convene only when there is a need to transact in business as per the terms of its mandate.
COMPOSITION
SCOPE
3.3 Combined Chairman-CEO Role
The Group’s Chairman continued to play the role of the CEO in addition to the role of Chairman. The appropriateness of combining the two roles is discussed in detail in the ensuing section.
3.3.1 Appropriateness of Combining the Roles of Chairman and CEO
The appropriateness of combining the roles of the Chairman-CEO was established after rigorous evaluation and debate, internally and externally. Subsequent to these rigorous evaluations the Board deemed that combining the two roles is more appropriate for the Group in meeting stakeholder objectives in a large diversified conglomerate setting. This continues to be the view to-date considering not only the diversity of the businesses the Group engages in but also the macro-economic conditions which requires the leadership to be nimble and agile.
The appropriateness of merging the 2 roles, continues to be discussed periodically. These discussions are supported by international best practice accessed through consultancy services and experts.
As the head of the Group Executive Committee, the Chairman-CEO provides the overall direction and policy/execution framework for the Board’s decisions via this structure.
Experience has proved that the JKH Board composition of majority independent Directors coupled with the role of the Senior Independent Director, and other supporting Board dynamics have enabled him to effectively balance his role as the Chairman of the Board and the CEO of the Company/Group.
Given the need for a combined Chairman-CEO role, the Chairman-CEO does not come up for re-election as in the case with other Executive and Non-Executive Directors. It is noted that the Articles of Association of the Company allow for this.
3.3.2 Chairman-CEO Appraisal
The Human Resources and Compensation Committee, chaired by the Senior Independent Director, appraised the performance of the Chairman-CEO on the basis of pre-agreed goals for the Group, set in consultation with the Board. These goals cover the ensuing broad aspects and the Group’s performance is assessed both against the goal and peers which involve other listed companies in the Colombo Stock Exchange:
Creating and adding shareholder value
Success in identifying and implementing projects
Sustaining a first-class image
Developing human capital
Promoting collaboration and team spirit
Building sustainable external relations
Leveraging Board members and other stakeholders
Ensuring good governance and integrity in the Group
In recent years, companies in certain geographies have moved toward separating the Chairman and CEO roles, as it is believed, in theory, that an Independent Chairman improves the ability of the Board of Directors to oversee management. However, most empirical research concludes that the independence status of the Chairman is not a material indicator of firm performance or governance quality.
Board effectiveness is affected by the Chairman’s industry knowledge, leadership skills, and influence on Board process rather than by the particular leadership structure chosen.
Improvement in Board governance can be achieved by increasing the proportion of Independent Non-Executive Directors. Having a majority of Independent Directors will also help improve the effectiveness of oversight by Board committees.
Since the JKH Board comprises of a majority of Independent Directors, they have the ability to ensure that the Chairman-CEO does not have unfettered decision-making powers. Further, the presence of a Senior Independent Director ensures the necessary ‘checks and balances’ are in place.
GOVERNANCE

180 JOHN KEELLS HOLDINGS PLC | ANNUAL REPORT 2018/19
CORPORATE GOVERNANCE COMMENTARY
3.3.3 Direct Discussions with the Non-Executive Directors
The Chairman-CEO conducts direct discussions with Non-Executive Directors at meetings held exclusively for Non-Executive Directors, which are convened by the Senior Independent Director. Issues arising from these discussions are actioned in consultation with the relevant persons. During the year under review, the Non-Executive Directors met thrice without the presence of the Executive Directors.
3.4 Group Executive Committee and Other Management Committees
The Group Executive Committee and the other Management Committees met regularly as per a timetable communicated to the participants 6 months in advance. In the absence of a compelling reason, attendance at these Committee meetings is mandatory for the Committee members. All the Committees carried out specific tasks entrusted to each component, as expected.
Whilst the Chairman-CEO and Presidents are ultimately accountable for the Company/Group and the industry groups/sectors/business functions respectively, all decisions are taken on a committee structure as described below.
3.4.1 Group Executive Committee (GEC)
As at 24 May 2019, the 6-member GEC consisted of the Chairman-CEO, the Deputy Chairman/Group Finance Director and the Presidents of each business/function. The GEC is the overlay structure that implements, under the leadership and direction of the Chairman-CEO, the strategies and policies determined by the Board, manages through delegation and empowerment, the business and affairs of the Group, makes portfolio decisions and prioritises the allocation of the capital, technical and human resources.
A key responsibility of the members of the GEC is to act as the enablers of the operating model of the Group. The members of the GEC are well equipped to execute these tasks and bring in a wealth of experience and diversity to the Group in terms of their expertise and exposure.
Refer the GEC Profiles section for further details - page 160
The GEC meets twice a month, in addition to the meetings that are scheduled as necessitated by the requirements of the Group.
3.4.2 Group Operating Committee (GOC)
As at 24 May 2019, the 22-member GOC consisted of the Chairman-CEO, the Deputy Chairman/Group Finance Director, the Presidents and the Executive Vice Presidents. The GOC provided a forum to share learnings, and identify synergies, across industry groups, sectors, business units and functions. The GOC meets once a month during the year and is instrumental in preserving a common group identity across diverse business units.
Refer the GOC Profiles section for further details - page 161
3.4.3 Other Management Committees
These include the Group Management Committee, Sector Committee and Management Committee which are responsible at the industry group level, sector level and business unit level respectively. The underlying intention of forming these Committees is to encourage the respective business units to take responsibility and accountability at the grass-root level via suitably structured Committees and teams by objective setting.
The agendas of these Committees are carefully structured to avoid duplication of effort and to ensure that discussions and debate are complementary, both in terms of a bottom-up and top-down flow of information and accountability. These Committees met regularly and carried out their tasks in keeping with their scope. The Management Committees proved to be key in enhancing employee engagement and empowerment. Illustrated below is the structure of the three Committees.
Industry group
Sector
Business unit/ Function
Group Management Committee
Sector Committee
Management Committee
Vice President/ Assistant Vice
President / Manager
President
Executive Vice President
Strategy formulation
Performance monitoring
Career management and succession planning
Risk management
Implementation of Group Initiatives
3.5 Employee Empowerment
Policies, processes and systems are in place to ensure effective recruitment, development and retention of this vital stakeholder. The bedrock of these policies is the Group’s competency framework. To support these policies, the Group continued with, and further strengthened, the following practices.
Top management and other senior staff are mandated to involve, as appropriate, all levels of staff in formulating goals, strategies and plans
Decision rights were defined for each level of employment in order to instil a sense of ownership, reduce bureaucracy and speed-up the decision making process
A bottom-up approach was taken in the preparation of annual and long-term plans and the Group also ensured employee involvement in strategy, and thereby empowerment
Organisational and Committee structures are designed to enable, and facilitate, high accessibility of all employees to every level of management
Open, honest, frank and constructive communication is encouraged at all levels. The Group strongly believes that constructive disagreement is essential for optimal decision making

181
Moreover, the Group provides a safe, secure and conducive environment for all its employees, allows freedom of association and collective bargaining, prohibits child labour, forced or compulsory labour and any discrimination based on gender, race, religion, gender identity or sexual orientation, and promotes workplaces which are free from physical, verbal or sexual harassment.
Complementing this, the Group continues to drive its CSR Initiative Project WAVE (Working Against Violence through Education) aimed at combating gender - based violence and child abuse through awareness creation. A total of 323,687 individuals, including Group staff, participated in the project as at 31 March 2019. The Group has also embarked on a project to create greater awareness among employees regarding gender identity and sexual orientation, towards building a truly inclusive culture within the Group. Additionally, the Group strives to incorporate these practices, where relevant, in the supply chain contracts entered into by the Group.
4 INTEGRATED GOVERNANCE SYSTEMS AND PROCEDURES
Listed below are the main governance systems and procedures of the Group. These systems and procedures strengthen the elements of the JKH Internal Governance Structure and are benchmarked against industry best practice.
i. Strategy formulation and decision making process
ii. Human resource governance
iii. Integrated risk management
iv. IT governance
v. Stakeholder management and effective communications
vi. Sustainability governance
4.1 Strategy Formulation and Decision Making Processes4.1.1 Strategy Mapping
Strategy mapping exercises, concentrating on the short, medium and long-term aspirations of each business, are conducted annually and reviewed, at a minimum, quarterly/half-yearly or as and when a situation so demands.
This exercise entails the following key aspects, among others.
Progress and deviation report of the strategies formed in the prior year, and current year
Competitor analysis and competitive positioning
Analysis of key risks and opportunities
Management of stakeholders such as suppliers and customers
Value enhancement through initiatives centered on the various forms of Capital under an integrated reporting framework
The strategies of the various business units, operating in diverse industries and markets, will always revolve around the Group strategy, while considering their domain specific factors. The prime focus always is to enhance value for all stakeholders.
The Group’s investment appraisal methodology and decision making process ensures the involvement of all key stakeholders that are relevant to the evaluation of the decision.
In this manner:
Several views, opinions and advice are obtained prior to making an investment decision
A holistic view is taken on the commercial viability and potential of any project, including operational, financial, funding, legal, risk, sustainability and tax implications
All investment decisions are consensual in nature, made through the afore-discussed management committee structure where no single individual has unfettered decision making powers over investment decisions
The ultimate responsibility and accountability of the investment decision rests with the Chairman-CEO
The following section further elaborates on the Group’s project appraisal and execution process.
Continuous performance
monitoring at BU/sector/industry
group level
1. Formulating business strategy, objectives and risk management for each BU for the financial year
and ensuing 5 years
2. GEC review and approval
5. Performance evaluation of the second
half/full year
4. Reforecasting the targets for the second half of the
year and GEC approval
3. Business performance evaluation of the first six
months against the target
GOVERNANCE

182 JOHN KEELLS HOLDINGS PLC | ANNUAL REPORT 2018/19
CORPORATE GOVERNANCE COMMENTARY
4.1.2 Medium-term Strategy
In 2017/18, in liaison with international industry experts, where applicable, the Group underwent a comprehensive strategy session for the medium-term which focuses on the ensuing 5 years. During the year under review, each business unit monitored the five-year strategy and business plan, formulated deviation strategies and presented rolling five-year strategies which was approved by the Group Executive Committee.
The ensuing section illustrates the comprehensive process followed by each business in developing the business’s strategy for the medium-term.
4.1.3 Project Approval Process
Projects undertaken at the Group follow a detailed feasibility report covering key business considerations under multiple scenarios, within a framework of sustainability. The feasibility stage is not restricted to a financial feasibility and encompasses a wider scope of work covering risk management, sustainable development and HR considerations.
Based on the decision rights matrix, subsequent to review by the relevant leadership committee of the feasibility report and post in principle approval, a multi-disciplined project team will proceed to the next phase of the project evaluation which will focus on detailed operational, commercial, financial and legal due diligence. Discussions will also commence with regulatory and licensing authorities, financial institutions and possible partners, worker representatives, as relevant and deemed necessary.
Risk management
Sustainability management
Legal, regulatory and HR requirements/framework
Project origination
Feasibility study
Review by the GEC
Due diligence
Board/GEC approval
Identification of the core values the business will operate with and the internal Promises that the business will strive to deliver to stakeholders
Review of global and regional trends
Identification of insights, risks, challenges, opportunities and implications, collated into key themes
Identifying key activities required to be undertaken under each theme and the articulation of the varied brand-led themes and activities
Identification of KPIs to measure delivery of Promises
Setting of a long-term goal and agreeing on the core pillars that would deliver growth
Target setting, scheduling activities and identifying workstreams to execute long-term initiatives
Identifying operating and capital expenditure along with capability resources
Articulation and approval of detailed project plans for execution of workstreams
Approval of Annual Business Plan
VALUES AND PROMISES
BRAND AND BUSINESS REVIEW BRAND PLAN LONG-TERM
BUSINESS PLANANNUAL
BUSINESS PLANS
PER
FOR
MA
NC
E M
EASU
REM
ENT Measure of performance against:
Promises
Annual plans and projects
Long-term initiatives
Financial objectives
Social and environmental impacts will also be considered. Where the transaction involves the transfer or lease of land, title searches would be conducted for both private and State land. In case of State land, every action would be taken to ensure compliance with the relevant rules and regulations. As appropriate, written authority and approvals will be obtained. Where the project is a part of a privatisation, the entire process will be conducted in line with the directives of the relevant administrative authority as communicated though expressions of interest, request for proposals, pre-bid meetings and official approvals and correspondence.
Subsequent to the project satisfying the above highlighted criteria, the final approval to proceed will be granted by the Board. When appropriate, the GEC is empowered to approve such proposals in terms of the delegated decision rights with the Board being kept informed.
The aforementioned project appraisal framework flow is illustrated below:
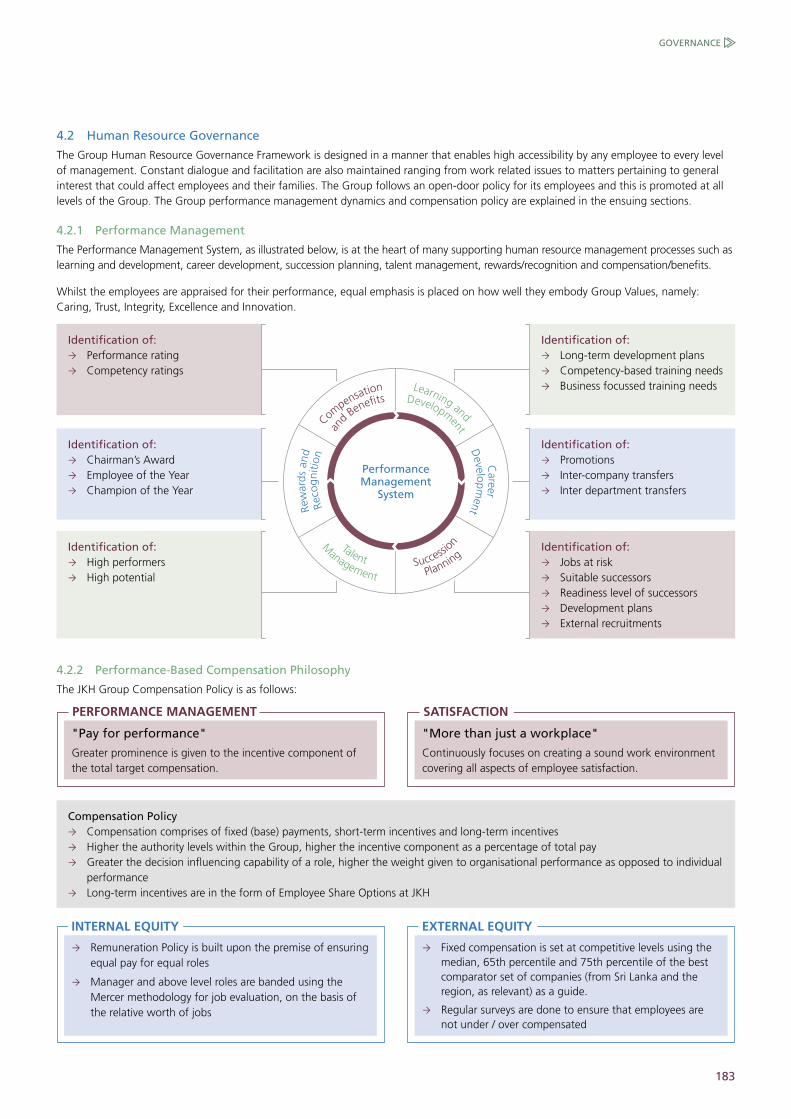
183
4.2 Human Resource Governance
The Group Human Resource Governance Framework is designed in a manner that enables high accessibility by any employee to every level of management. Constant dialogue and facilitation are also maintained ranging from work related issues to matters pertaining to general interest that could affect employees and their families. The Group follows an open-door policy for its employees and this is promoted at all levels of the Group. The Group performance management dynamics and compensation policy are explained in the ensuing sections.
4.2.1 Performance Management
The Performance Management System, as illustrated below, is at the heart of many supporting human resource management processes such as learning and development, career development, succession planning, talent management, rewards/recognition and compensation/benefits.
Whilst the employees are appraised for their performance, equal emphasis is placed on how well they embody Group Values, namely: Caring, Trust, Integrity, Excellence and Innovation.
Performance Management
System
Learning and
Development
Career
Developm
ent
PlanningSucce
ssionM
anagement
Talent
Rew
ards
and
Reco
gniti
onCom
pensation
an
d Benefits
Identification of: Performance rating Competency ratings
Identification of: High performers High potential
Identification of: Chairman’s Award Employee of the Year Champion of the Year
Identification of: Long-term development plans Competency-based training needs Business focussed training needs
Identification of: Jobs at risk Suitable successors Readiness level of successors Development plans External recruitments
Identification of: Promotions Inter-company transfers Inter department transfers
4.2.2 Performance-Based Compensation Philosophy
The JKH Group Compensation Policy is as follows:
Compensation Policy Compensation comprises of fixed (base) payments, short-term incentives and long-term incentives Higher the authority levels within the Group, higher the incentive component as a percentage of total pay Greater the decision influencing capability of a role, higher the weight given to organisational performance as opposed to individual
performance Long-term incentives are in the form of Employee Share Options at JKH
"Pay for performance"
Greater prominence is given to the incentive component of the total target compensation.
Remuneration Policy is built upon the premise of ensuring equal pay for equal roles
Manager and above level roles are banded using the Mercer methodology for job evaluation, on the basis of the relative worth of jobs
"More than just a workplace"
Continuously focuses on creating a sound work environment covering all aspects of employee satisfaction.
Fixed compensation is set at competitive levels using the median, 65th percentile and 75th percentile of the best comparator set of companies (from Sri Lanka and the region, as relevant) as a guide.
Regular surveys are done to ensure that employees are not under / over compensated
PERFORMANCE MANAGEMENT
INTERNAL EQUITY
SATISFACTION
EXTERNAL EQUITY
GOVERNANCE

184 JOHN KEELLS HOLDINGS PLC | ANNUAL REPORT 2018/19
CORPORATE GOVERNANCE COMMENTARY
"The Group conducted a comprehensive review of its Risk Management Framework in the immediate aftermath of the Easter Sunday attacks and revised the risk levels and mitigatory actions for such revised risks. The Group will continue to review the relevant risks in a timely manner and update the actions, as relevant."
4.2.2.1 Equity Sharing
Employee Share Option Plans are offered at defined career levels based on pre-determined criteria which are uniformly applied across the eligible levels and performance levels. These long-term incentives have been significantly instrumental in inculcating a deep sense of ownership in the recipients and is seen to be a key driver of performance driven rewards. Share options are awarded to individuals on the basis of their immediate performance and potential importance of their contribution to the Group’s future plans.
The Company issues share options not exceeding a specified percentage of the total issued shares of the Company as at the date of awarding every such option, which is subject to in-principle approval of the Exchange and shareholder approval, by way of a Special Resolution at a General Meeting.
4.3 Integrated Risk Management
JKH’s Group-wide risk management programme focuses on wider sustainability development, to identify, evaluate and manage significant Group risks and to stress test various risk scenarios. The programme ensures that a multitude of risks, arising as a result of the Group’s diverse operations, are effectively managed in creating and preserving stakeholder wealth. The Group manages its enterprise risk, audit and incident management processes through an automated risk
management platform that was introduced in 2016/17. This platform enables the maintenance of live, dynamic and virtual risk registers which are linked to business goals and responsible personnel. Features such as the provision of timely alerts on action plans and escalation processes for risks, where action plans are overdue, ensure maintenance of live risk grids.
Continuous steps taken towards promoting the Group’s integrated risk management process are:
Integrating and aligning activities and processes related to planning, policies, procedures, culture, competency, internal audit, financial management, monitoring and reporting with risk management
Supporting executives and managers in moving the organisation forward in a cohesive integrated and aligned manner to improve performance, while operating effectively, efficiently, ethically and legally within the established limits for risk taking. The risk management programmes have allowed greater visibility and understanding of risk appetites. Enabled by the automated risk management platform, key management personnel have virtual visibility of the risks, as relevant, while the Board has visibility of all Group risks
The Board, GEC and Group Management Committees, oversee risk management across the Group to ensure that risks are brought within tolerance, managed and/or mitigated. The Group conducted a comprehensive review of its Risk Management framework in the immediate aftermath of the Easter Sunday attacks and revised the risk levels and mitigatory actions for such revised risks. The Group will continue to review the relevant risks in a timely manner and update the actions, as relevant.
Please refer the Risks, Opportunities and Internal Control section (page 201) and Notes to the Financial Statements for a detailed discussion on the Group’s Integrated Risk Management process and the key risks identified in achieving the Group’s strategic business objectives
4.4 Information Technology (IT) Governance
IT governance stewardship roles are governed through layered and nested committees, cascading from the GEC to the Group IT Management Committee to the Group IT Operation Committee with well-defined roles and responsibilities at a Group, sector and business unit level.
The IT Governance Framework used within the Group leverages best practices and industry leading models such as CoBIT (Control Objectives for Information and Related Technology), ISO 35800, ISO27001, ISO 9000:2008, COSO (Committee of Sponsoring Organisations of the Treadway Commission)/BCP (Business Continuity Planning), ITIL (Information Technology Infrastructure Library), in providing a best of breed framework. The Group periodically tests its business resilience against the centrally facilitated and hosted IT services which provides an opportunity to identify limitations and areas for further improvement in the IT infrastructure.
During the year under review, the Group migrated identified software systems and processes to the cloud given its ability to make workflow more efficient and scalable. The cyber resilience programme was also revisited concurrently, with a revamped set of policies, procedures and methods put in place to cater to the evolving hybrid cloud environment and digitisation requirements of the Group, in order to strengthen the cyber security posture. Other initiatives also included the data classification and rights managements initiatives for data and two-factor authentication for employee accounts as an extra layer of security that requires not only a user name and password but also an input based on an item the employee has on them.
The Managed Security Operations Centre (SOC) implemented in 2017/18, continues to perform as per expectations, strengthening the Group’s IT infrastructure against vulnerabilities, thereby preventing, detecting, analysing, and responding to cyber security incidents.

185
Stakeholder Management
Customers /
Suppliers
Gover
nmen
t
StakeholdersOther Key
Employees
Shar
eholders /
In
vesto
rs
Transactions in compliance with all relevant laws and regulations, transparently and ethically
Zero tolerance policy in ensuring that all business units meet their statutory obligations in time and in full
Providing of quality and safe products
Constant engagement with customers
Procedures to ensure long-term business relationships with suppliers
Presence of an investor relations team
Social media presence Prompt release of information to
public/CSE Effective communication of AGM
related matters Measures in place in case of
serious loss of capital
Provision of formal and sometimes informal, access to other key stakeholders
Accessibility to all levels of the management
Various means for employee involvement
Corporate Communications JK Forum Young Forum John Keells Employee Self
Service (JESS) HIVE Staff Volunteerism
4.5.1 Communication with Shareholders
The primary modes of communication between the Company and the shareholders are through the announcements made to the CSE, Annual Reports, Quarterly Reports and the Annual General Meeting (AGM).
4.5.1.1 Investor Relations
The Investor Relations team of the Group is responsible for maintaining an active dialogue with shareholders, potential investors, investment banks, analysts and other interested parties in ensuring effective investor communication.
The Investor Relations team has regular discussions with shareholders, as and when applicable, to share highlights of the Group’s performance as well as to obtain constructive feedback. Investor Presentations, which include an update on the latest financial results, are made available on the corporate website, to provide easier access and in-depth detail of the operational performance of the Group.
4.5 Stakeholder Management and Effective Communication
Following are the key stakeholder management methodologies adopted by the Group.
Shareholders may, at any time, direct questions, request for publicly available information and provide comments and suggestions to Directors or management of the Group by contacting the Investor Relations team, Secretaries, the Senior Independent Director or the Chairman, although individual shareholders are encouraged to carry out adequate analysis or seek independent advice on their investing, holding or divesting decisions at all times.
4.5.1.2 Release of Information to the Public and CSE
The Board of Directors, in conjunction with the Audit Committee where applicable, is responsible in ensuring the accuracy and timeliness of published information and in presenting a true and fair view, and balanced assessment of results in the quarterly and annual financial statements. Accordingly, JKH has reported a true and fair view of its financial position and performance for the year ended 31 March 2019 and at the end of each quarter of the financial year 2018/19.
All other material and price sensitive information about the Company is promptly communicated to the CSE and such information is also released to employees, the press and shareholders. Shareholders may, at any time, direct questions, request for publicly available information and provide comments and suggestions to Directors or Management of JKH. Such questions, requests and comments should be addressed to the Company Secretary.
The Group focuses on open communication and fair disclosure, with emphasis on the integrity, timeliness and relevance of the information provided. The Group ensures that information is communicated accurately and in a manner that will avoid the creation or continuation of a false market.
Refer the Materiality, Sustainability Integration and Stakeholder Engagement section - page 194
GOVERNANCE
186 JOHN KEELLS HOLDINGS PLC | ANNUAL REPORT 2018/19
CORPORATE GOVERNANCE COMMENTARY
4.5.1.3 Annual General Meeting
Information is provided to the shareholders prior to the AGM to give them an opportunity to exercise the prerogative to raise any issues relating to the businesses of the Group. Shareholders are provided with the Annual Report of JKH in CD form. Shareholders may at any time elect to receive an Annual Report from JKH in printed form, which is provided free of charge.
The Group makes use of the AGM constructively towards enhancing relationships with the shareholders and towards this end the following procedures are followed:
Notice of the AGM and related documents are sent to the shareholders along with the Annual Report within the specified time
Summary of procedures governing voting at the AGM are clearly communicated
Most Executive and Non-Executive Directors are made available to answer queries
The Chairman-CEO ensures that the relevant senior managers are also available at the AGM to answer specific queries
Separate resolutions are proposed for each item
Proxy votes, those for, against, and withheld (abstained) are counted.
4.5.1.4 Serious Loss of Capital
In the unlikely event that the net assets of a company fall below half of its stated capital, shareholders will be notified and the requisite resolutions would be passed on the proposed way forward.
4.6 Sustainability Governance
The John Keells Group places great importance on sustainable development. The Group believes that its financial performance and brand image are closely aligned with sound corporate governance practices, product and service excellence, a productive workforce, environmental stewardship and social responsibility. The Group’s approach to sustainability continues to be aligned to support the Sustainable Development Goals adopted by the United Nations in 2015, which expands on the Millennium Development Goals.
5 ASSURANCE MECHANISMS
The Assurance Mechanisms comprise of the various supervisory, monitoring and benchmarking elements of the Group Corporate Governance System which are used to measure "actuals" against "plan" with a view to highlighting deviations, signalling the need for quick corrective action, and quick redress when necessary. These mechanisms also act as "safety nets" and internal checks in the Governance system.
5.1 The Code of Conduct
Allegiance to the Company and the Group
Compliance with rules and regulations applying in the territories that the Group operates in
Conduct all businesses in an ethical manner at all times in keeping with acceptable business practice
Exercise of professionalism and integrity in all business and 'public' personal transactions
JKH CODE OF CONDUCT
The objectives of the Code of Conduct are strongly affirmed by a strong set of Values which are well institutionalised at all levels within the Group through structured communication. The degree of employee conformance with Values and their degree of adherence to the JKH Code of Conduct are key elements of the reward and recognition schemes.
The Group Values continue to be consistently referred to by the Chairman-CEO, Presidents, Sector and Business Unit Heads during employee and other key stakeholder engagements, in order to instil these values in the hearts and DNA of the employee.
Group Values are found in Our Business Model - page 6
5.2 Senior Independent Director
Considering the combined role of the Chairman-CEO, the presence of the Senior Independent Director is important in ensuring that no one person has unfettered decision making powers, and that matters discussed at the Board level are done so in an environment which facilitates independent thought by individual Directors. The Senior Independent Director also acts as the independent party to whom concerns could be voiced on a confidential basis.
The Senior Independent Director meets with other Non-Executive Directors, without the presence of the Chairman-CEO, at least twice every year to evaluate the effectiveness of the Chairman-CEO and has regular meetings with the other Non-Executive Directors on matters relating to the effectiveness of the Board or the Board as appropriate. The Senior Independent Director is also kept informed by the Ombudsperson of any matters in respect of the JKH Code of Conduct which has come to his attention.
"The objectives of the Code of Conduct are strongly affirmed by a strong set of Values which are well institutionalised at all levels within the Group through structured communication."
"Considering the combined role of the Chairman-CEO, the presence of the Senior Independent Director is important in ensuring that no one person has unfettered decision making powers, and that matters discussed at the Board level are done so in an environment which facilitates independent thought by individual Directors."
187
Report of the Senior Independent Director
Independent Directors
A CabraalR Coomaraswamy (appointed to the Board on 1 October 2018) N FonsekaA OmarP PereraH Wijayasuriya
All Independent Directors have been Directors for less than nine years from their date of first appointment. The independence of each Director has been established based on the information and declarations submitted by them.
Apart from unstructured and informal contacts, the Independent Directors had three formal meetings to discuss matters relevant to their responsibilities as Non-Executive Directors. These meetings concluded with a wrap up session with the Chairman-CEO, who provided responses to matters raised, or agreed to provide further information or clarification at Board meetings. The year under review saw the implementation of the previously approved succession plan for the Chairman-CEO and Group Finance Director and overseeing the transition received the special attention of the Non-Executive Directors.
The minutes of meetings of the Group Executive Committee (GEC) are circulated to the Non-Executive Directors to ensure a high degree of transparency and interaction between the Executive and Non-Executive members of the Board. The Non-Executive Directors are also kept advised on the progress of key ongoing projects and management responds to any clarifications sought.
The Ombudsperson has reported to me that no issues have been brought to his attention that indicate mismanagement, unfair treatment or justified discontent on the part of any employee or ex-employee during the financial year.
The Independent Directors thank the past and present Chairman-CEO, Executive Directors, the GEC, Sector Heads and members of the management team for their openness and co-operation on all matters where their input was sought by the Non-Executive Directors.
N Fonseka Senior Independent Director
24 May 2019
Employee surveys
Monthly staff meetings
Access to Ombudsperson
Access to Senior Independent Director
Continuous reiteration and the practice of the 'Open-Door' Policy
Additionally, the Group continued with its Whistle-Blower Policy and Securities Trading Policy. The Group has witnessed an increased level of communication flow from employees. Such communication and feedback received from the employees by the management are recorded, irrespective of the level of anonymity, and subsequently discussed and followed up. The respective outcomes are duly recorded.
5.5 Internal Controls
The Board has taken necessary steps to ensure the integrity of the Group’s accounting and financial reporting systems and that internal control systems remain robust and effective via the review and monitoring of such systems on a periodic basis.
5.5.1 Internal Compliance
A quarterly self-certification programme requires the Presidents, Sector Heads and Chief Financial Officers of industry groups to confirm compliance with statutory and other regulatory procedures, and also to identify any significant deviations from the expected norms.
5.5.2 System of Internal Control
The Board has, through the involvement of the Group Business Process Review function taken steps to obtain assurance that systems designed to safeguard the Company’s assets are in place, and are functioning according to expectations.
This also entails automated monitoring and workflow based escalation in order to facilitate timely clearing of all transactional entries including complete reconciliation, unreconciled and open entries being flagged and periodically scrutinised, and formal disclosure being made to the relevant Audit Committees, efficient management and tracking of cash and cheques deposits, in line with international best practice and continual streamlining and optimisation of the Internal Audit function, via identification of focus areas,
5.3 Board Sub-Committees
The Board Sub-Committees play an important supervisory and monitoring role by focusing on the designated areas of responsibility passed to it by the Board.
For more information on the Board Sub-Committees section refer section 3.2 of this Report.
5.4 Employee Participation in Assurance
The Group is continuously working towards introducing innovative and effective ways of employee communication and employee awareness. The importance of communication – top-down, bottom-up, and lateral-in gaining employee commitment to organisational goals has been conveyed extensively through various communications issued by the Chairman-CEO and the management. Whilst employees have many opportunities to interact with senior management, the Group has created the ensuing formal channels for such communication through feedback.
Skip level meetings
Exit interviews
Young Forum meetings
360 degree evaluation
GOVERNANCE
188 JOHN KEELLS HOLDINGS PLC | ANNUAL REPORT 2018/19
CORPORATE GOVERNANCE COMMENTARY
improvement opportunities and feedback reporting in order to reinforce governance and assurance.
The risk review programme covering the internal audit of the whole Group is outsourced. Reports arising out of such audits are, in the first instance, considered and discussed at the business and functional unit levels and after review by the Sector Head and the President of the industry group are forwarded to the relevant Audit Committee on a regular basis. Further, the Audit Committees also assess the effectiveness of the risk review process and systems of internal control on a regular basis.
5.5.3 Segregation of Duties (SoD) under Sarbanes-Oxley (SOX) Guidelines
The Group is very aware of the need to ensure that no individual has excessive system access to execute transactions across an entire business process or business processes which have critical approval linkages, in the context that increasing use of information technology and integrated financial controls creates unintended exposures within the Group. SoD dictates that problems such as fraud, material misstatements and manipulation of financial statements have the potential to arise when the same individual is able to execute two or more conflicting, sensitive transactions. Separating disparate jobs into task-oriented roles can often result in inefficiencies and costs which do not meet the cost versus benefit criteria. Whilst the attainment of a zero SoD conflict state is utopian, the Group continues to take steps, to identify and evaluate existing conflicts and reduce residual risks to an acceptable level under a cost versus benefit rationale.
5.5.4 Internal Audit
The Group internal audit process is conducted by outsourced parties at regular intervals, coordinated by the Group Business Process Review function (GBPR) of the Group. GBPR ensures that the internal audit plan adequately covers the significant risks of the Group, reviews the important internal audit findings and follow-up procedures.
Whilst there are merits and demerits
associated with outsourcing an internal audit, the Group is of the view that having an external based auditor is more advantageous. However, there are certain industries where the domain is very operationally specific and requires an internal auditor in addition to the external auditor.
5.5.4.1 Data Analytics
Traditionally, internal auditing followed an approach which was based on a cyclical process that involves manually identifying control objectives, assessing and testing controls, performing tests, and sampling only a relatively small population of the dataset to measure control effectiveness and operational performance. Today, the Group operates in a complex and dynamic business environment where the number of transactions has increased exponentially over the years and the traditional cyclical/sample based internal auditing techniques are becoming less effective. As such, the Group continues to use 'big data analysis' techniques on the total data using standard deviations and z-scores in establishing real time, user-friendly 'outlier identification' and 'early warning triggers'.
5.6 Ombudsperson
An Ombudsperson is available to report any complaints from employees of alleged violations of the published Code of Conduct if the complainant feels that the alleged violation has not been addressed satisfactorily by the internally available mechanisms.
The findings and the recommendations of the Ombudsperson, subsequent to an independent inquiry, is confidentially communicated to the Chairman-CEO or to the Senior Independent Director upon which the involvement duty of the Ombudsperson ceases.
On matters referred to him by the Ombudsperson, the Chairman-CEO or the Senior Independent Director, as the case may be, will place before the Board:
i. the decision and the recommendations;
ii. action taken based on the recommendations;
iii. where the Chairman-CEO or the Senior Independent Director disagrees with any or all of the findings and or the recommendations thereon, the areas of disagreement and the reasons therefore.
In situation (iii) the Board is required to consider the areas of disagreement and decide on the way forward. The Chairman-CEO or the Senior Independent Director is expected to take such steps as are necessary to ensure that the complainant is not victimised, in any manner, for having invoked this process.
"Today, the Group operates in a complex and dynamic business environment where the number of transactions has increased exponentially over the years and the traditional cyclical/sample based internal auditing techniques are becoming less effective. As such, the Group continues to use 'big data analysis' techniques on the total data using Standard Deviations and Z-Scores in establishing real time, user-friendly 'outlier identification' and 'early warning triggers'."
189
"An Ombudsperson is available to report any complaints from employees of alleged violations of the published Code of Conduct if the complainant feels that the alleged violation has not been addressed satisfactorily by the internally available mechanisms."
Report of the Ombudsperson
Mandate and Role
For purposes of easy reference, I set out below the Ombudsperson’s mandate and role:
(a) legal and ethical violations of the Code of Conduct for employees, but in an appellate capacity, when a satisfactory outcome using existing procedures and processes has not resulted or when the matter has been inadequately dealt with;
(b) violations referred to above by individuals at the Executive Vice President, President and Executive Director levels, including that of the Chairman-CEO, in which case the complainant has the option of either complaining to the Ombudsperson in the first instance, or first exhausting the internal remedies;
(c) sexual harassment, in which event the complainant has the option of either complaining to the Ombudsperson in the first instance or first exhausting the internal remedies.
The mandate excludes disciplinary issues from the Ombudsperson’s responsibilities. The right to take disciplinary action is vested exclusively in the Chairman-CEO and those to whom this authority has been delegated.
No issues were raised by any member of the companies covered during the year under review.
Ombudsperson
24 May 2019
5.7 External Audit
Ernst & Young are the External Auditors of the Company as well as many of the Group companies. The individual Group companies also employed KPMG Ford, Rhodes, Thornton & Co, PricewaterhouseCoopers, and Luthra and Luthra, India as External Auditors. The appointment or re-appointment of these auditors was recommended by the individual Audit Committees to their respective Boards of Directors.
The audit fees paid by the Company and Group to its auditors are separately classified in the Notes to the Financial Statements of the Annual Report.
6 REGULATORY AND ACCOUNTING BENCHMARKS
The Board, through the Group Legal division, the Group Finance division and its other operating structures, strived to ensure that the Company and all its subsidiaries and associates complied with the laws and regulations of the countries they operated in.
The Board of Directors also took all reasonable steps in ensuring that all financial statements were prepared in accordance with the Sri Lanka Accounting Standards (SLFRS/LKAS) issued by the Institute of Chartered Accountants of Sri Lanka (CA Sri Lanka) and the requirements of the CSE and other applicable authorities. Information contained in the financial statements of the Annual Report is supplemented by a detailed Management Discussion and Analysis which explains to shareholders, the strategic, operational, investment, sustainability and risk related aspects of the Company, and the means by which value is created and how it is translated into the reported financial performance and is likely to influence future results.
JKH and its subsidiaries are fully compliant with all the mandatory rules and regulations stipulated by the:
Corporate Governance Listing Rules published by the CSE; and
Companies Act No.7 of 2007
The Group has also given due consideration to the Best Practice on Corporate Governance Reporting guidelines jointly set out by CA Sri Lanka and the SEC and have in all instances, barring a few, embraced such practices, voluntarily, particularly if such practices have been identified as relevant and value adding. In the very few instances where the Group has not adopted such best practice, the rationale for such non-adoption is articulated.
7 COMPLIANCE SUMMARY
Towards the continuous stride in achieving a more cohesive and efficient approach to corporate reporting, and in order to keep the report relevant and concise, the ensuing sections reflect a high-level summary of JKH’s conformance with standards and governance codes.
Detailed discussions pertaining to JKH’s conformance with each Section/Principle of the below discussed codes are found on the corporate website.
GOVERNANCE
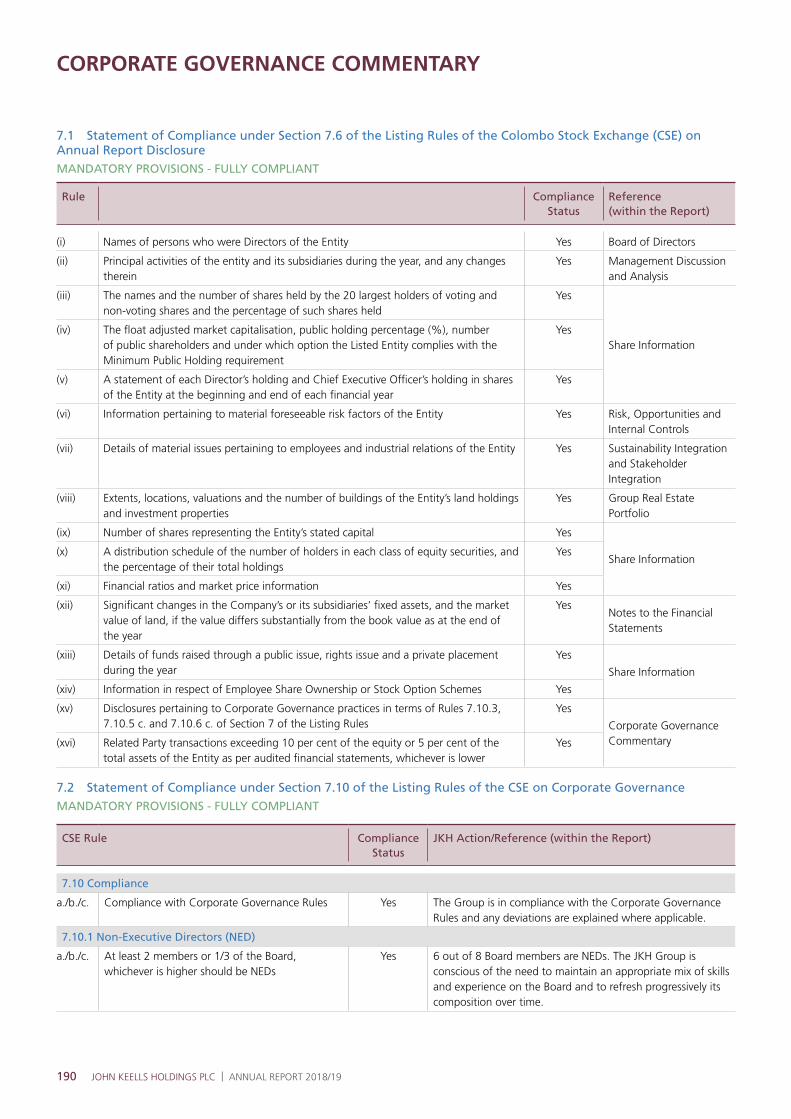
190 JOHN KEELLS HOLDINGS PLC | ANNUAL REPORT 2018/19
CORPORATE GOVERNANCE COMMENTARY
7.1 Statement of Compliance under Section 7.6 of the Listing Rules of the Colombo Stock Exchange (CSE) on Annual Report DisclosureMANDATORY PROVISIONS - FULLY COMPLIANT
Rule Compliance Status
Reference (within the Report)
(i) Names of persons who were Directors of the Entity Yes Board of Directors
(ii) Principal activities of the entity and its subsidiaries during the year, and any changes therein
Yes Management Discussion and Analysis
(iii) The names and the number of shares held by the 20 largest holders of voting and non-voting shares and the percentage of such shares held
Yes
Share Information(iv) The float adjusted market capitalisation, public holding percentage (%), number
of public shareholders and under which option the Listed Entity complies with the Minimum Public Holding requirement
Yes
(v) A statement of each Director’s holding and Chief Executive Officer’s holding in shares of the Entity at the beginning and end of each financial year
Yes
(vi) Information pertaining to material foreseeable risk factors of the Entity Yes Risk, Opportunities and Internal Controls
(vii) Details of material issues pertaining to employees and industrial relations of the Entity Yes Sustainability Integration and Stakeholder Integration
(viii) Extents, locations, valuations and the number of buildings of the Entity’s land holdings and investment properties
Yes Group Real Estate Portfolio
(ix) Number of shares representing the Entity’s stated capital Yes
Share Information(x) A distribution schedule of the number of holders in each class of equity securities, and
the percentage of their total holdingsYes
(xi) Financial ratios and market price information Yes
(xii) Significant changes in the Company’s or its subsidiaries’ fixed assets, and the market value of land, if the value differs substantially from the book value as at the end of the year
YesNotes to the Financial Statements
(xiii) Details of funds raised through a public issue, rights issue and a private placement during the year
Yes
Share Information
(xiv) Information in respect of Employee Share Ownership or Stock Option Schemes Yes
(xv) Disclosures pertaining to Corporate Governance practices in terms of Rules 7.10.3, 7.10.5 c. and 7.10.6 c. of Section 7 of the Listing Rules
Yes
Corporate Governance Commentary(xvi) Related Party transactions exceeding 10 per cent of the equity or 5 per cent of the
total assets of the Entity as per audited financial statements, whichever is lowerYes
7.2 Statement of Compliance under Section 7.10 of the Listing Rules of the CSE on Corporate GovernanceMANDATORY PROVISIONS - FULLY COMPLIANT
CSE Rule Compliance Status
JKH Action/Reference (within the Report)
7.10 Compliance
a./b./c. Compliance with Corporate Governance Rules Yes The Group is in compliance with the Corporate Governance Rules and any deviations are explained where applicable.
7.10.1 Non-Executive Directors (NED)
a./b./c. At least 2 members or 1/3 of the Board, whichever is higher should be NEDs
Yes 6 out of 8 Board members are NEDs. The JKH Group is conscious of the need to maintain an appropriate mix of skills and experience on the Board and to refresh progressively its composition over time.
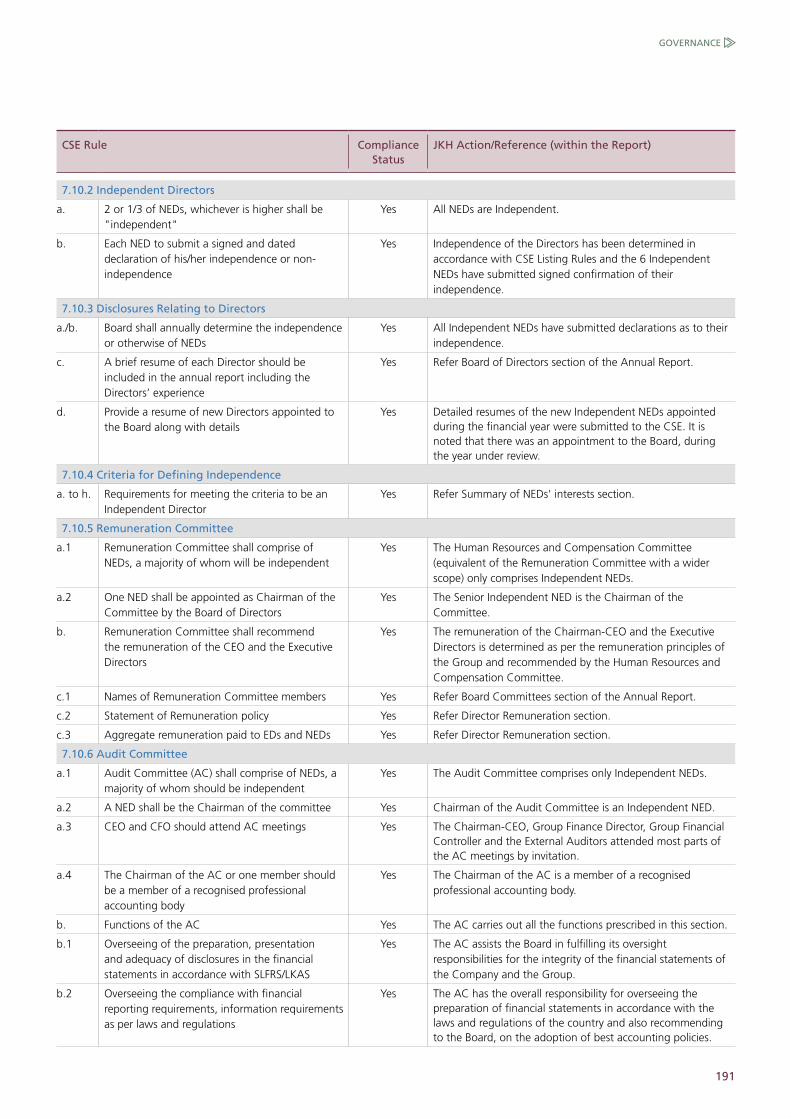
191
CSE Rule Compliance Status
JKH Action/Reference (within the Report)
7.10.2 Independent Directors
a. 2 or 1/3 of NEDs, whichever is higher shall be "independent"
Yes All NEDs are Independent.
b. Each NED to submit a signed and dated declaration of his/her independence or non-independence
Yes Independence of the Directors has been determined in accordance with CSE Listing Rules and the 6 Independent NEDs have submitted signed confirmation of their independence.
7.10.3 Disclosures Relating to Directors
a./b. Board shall annually determine the independence or otherwise of NEDs
Yes All Independent NEDs have submitted declarations as to their independence.
c. A brief resume of each Director should be included in the annual report including the Directors’ experience
Yes Refer Board of Directors section of the Annual Report.
d. Provide a resume of new Directors appointed to the Board along with details
Yes Detailed resumes of the new Independent NEDs appointed during the financial year were submitted to the CSE. It is noted that there was an appointment to the Board, during the year under review.
7.10.4 Criteria for Defining Independence
a. to h. Requirements for meeting the criteria to be an Independent Director
Yes Refer Summary of NEDs' interests section.
7.10.5 Remuneration Committee
a.1 Remuneration Committee shall comprise of NEDs, a majority of whom will be independent
Yes The Human Resources and Compensation Committee (equivalent of the Remuneration Committee with a wider scope) only comprises Independent NEDs.
a.2 One NED shall be appointed as Chairman of the Committee by the Board of Directors
Yes The Senior Independent NED is the Chairman of the Committee.
b. Remuneration Committee shall recommend the remuneration of the CEO and the Executive Directors
Yes The remuneration of the Chairman-CEO and the Executive Directors is determined as per the remuneration principles of the Group and recommended by the Human Resources and Compensation Committee.
c.1 Names of Remuneration Committee members Yes Refer Board Committees section of the Annual Report.
c.2 Statement of Remuneration policy Yes Refer Director Remuneration section.
c.3 Aggregate remuneration paid to EDs and NEDs Yes Refer Director Remuneration section.
7.10.6 Audit Committee
a.1 Audit Committee (AC) shall comprise of NEDs, a majority of whom should be independent
Yes The Audit Committee comprises only Independent NEDs.
a.2 A NED shall be the Chairman of the committee Yes Chairman of the Audit Committee is an Independent NED.
a.3 CEO and CFO should attend AC meetings Yes The Chairman-CEO, Group Finance Director, Group Financial Controller and the External Auditors attended most parts of the AC meetings by invitation.
a.4 The Chairman of the AC or one member should be a member of a recognised professional accounting body
Yes The Chairman of the AC is a member of a recognised professional accounting body.
b. Functions of the AC Yes The AC carries out all the functions prescribed in this section.
b.1 Overseeing of the preparation, presentation and adequacy of disclosures in the financial statements in accordance with SLFRS/LKAS
Yes The AC assists the Board in fulfilling its oversight responsibilities for the integrity of the financial statements of the Company and the Group.
b.2 Overseeing the compliance with financial reporting requirements, information requirements as per laws and regulations
Yes The AC has the overall responsibility for overseeing the preparation of financial statements in accordance with the laws and regulations of the country and also recommending to the Board, on the adoption of best accounting policies.
GOVERNANCE
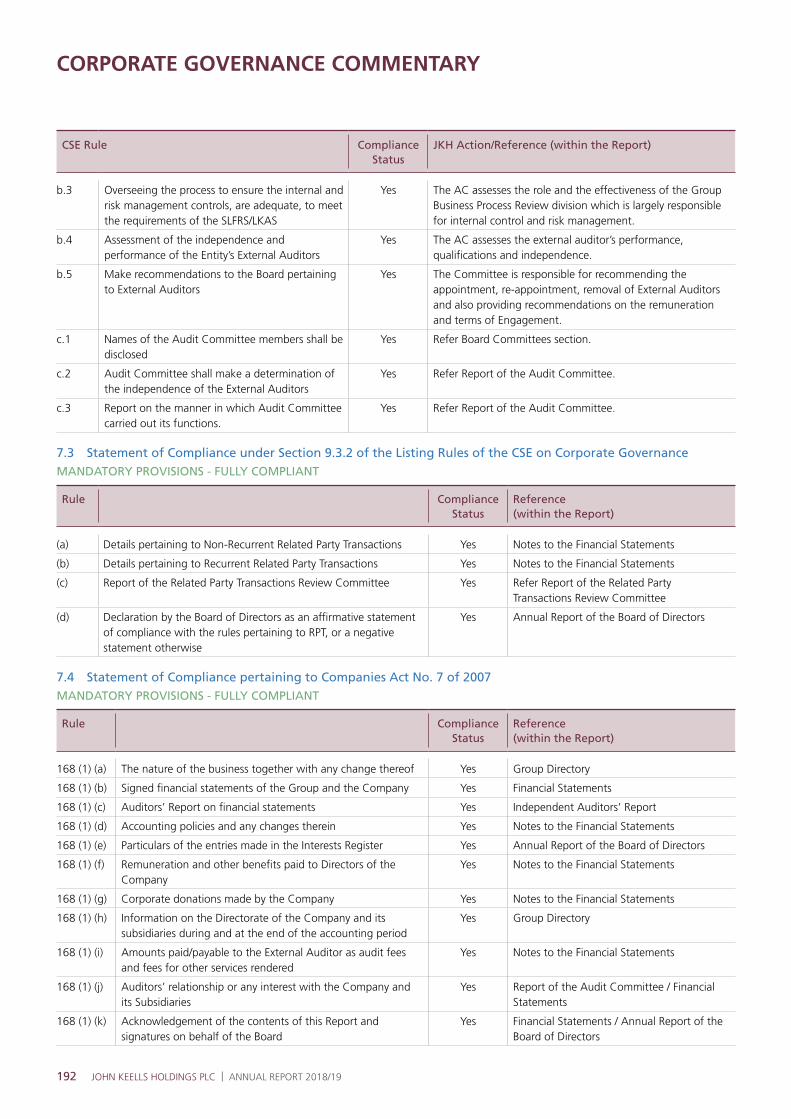
192 JOHN KEELLS HOLDINGS PLC | ANNUAL REPORT 2018/19
CSE Rule Compliance Status
JKH Action/Reference (within the Report)
b.3 Overseeing the process to ensure the internal and risk management controls, are adequate, to meet the requirements of the SLFRS/LKAS
Yes The AC assesses the role and the effectiveness of the Group Business Process Review division which is largely responsible for internal control and risk management.
b.4 Assessment of the independence and performance of the Entity’s External Auditors
Yes The AC assesses the external auditor’s performance, qualifications and independence.
b.5 Make recommendations to the Board pertaining to External Auditors
Yes The Committee is responsible for recommending the appointment, re-appointment, removal of External Auditors and also providing recommendations on the remuneration and terms of Engagement.
c.1 Names of the Audit Committee members shall be disclosed
Yes Refer Board Committees section.
c.2 Audit Committee shall make a determination of the independence of the External Auditors
Yes Refer Report of the Audit Committee.
c.3 Report on the manner in which Audit Committee carried out its functions.
Yes Refer Report of the Audit Committee.
7.3 Statement of Compliance under Section 9.3.2 of the Listing Rules of the CSE on Corporate GovernanceMANDATORY PROVISIONS - FULLY COMPLIANT
Rule Compliance Status
Reference (within the Report)
(a) Details pertaining to Non-Recurrent Related Party Transactions Yes Notes to the Financial Statements
(b) Details pertaining to Recurrent Related Party Transactions Yes Notes to the Financial Statements
(c) Report of the Related Party Transactions Review Committee Yes Refer Report of the Related Party Transactions Review Committee
(d) Declaration by the Board of Directors as an affirmative statement of compliance with the rules pertaining to RPT, or a negative statement otherwise
Yes Annual Report of the Board of Directors
7.4 Statement of Compliance pertaining to Companies Act No. 7 of 2007MANDATORY PROVISIONS - FULLY COMPLIANT
Rule Compliance Status
Reference (within the Report)
168 (1) (a) The nature of the business together with any change thereof Yes Group Directory
168 (1) (b) Signed financial statements of the Group and the Company Yes Financial Statements
168 (1) (c) Auditors’ Report on financial statements Yes Independent Auditors’ Report
168 (1) (d) Accounting policies and any changes therein Yes Notes to the Financial Statements
168 (1) (e) Particulars of the entries made in the Interests Register Yes Annual Report of the Board of Directors
168 (1) (f) Remuneration and other benefits paid to Directors of the Company
Yes Notes to the Financial Statements
168 (1) (g) Corporate donations made by the Company Yes Notes to the Financial Statements
168 (1) (h) Information on the Directorate of the Company and its subsidiaries during and at the end of the accounting period
Yes Group Directory
168 (1) (i) Amounts paid/payable to the External Auditor as audit fees and fees for other services rendered
Yes Notes to the Financial Statements
168 (1) (j) Auditors’ relationship or any interest with the Company and its Subsidiaries
Yes Report of the Audit Committee / Financial Statements
168 (1) (k) Acknowledgement of the contents of this Report and signatures on behalf of the Board
Yes Financial Statements / Annual Report of the Board of Directors
CORPORATE GOVERNANCE COMMENTARY

193
7.5 Code of Best Practice of Corporate Governance 2013 Issued Jointly by the Securities and Exchange Commission of Sri Lanka (SEC) and the Institute of Chartered Accountants of Sri Lanka (CA Sri Lanka)
VOLUNTARY PROVISIONS - FULLY COMPLIANT
The Company is directed, controlled and led by an effective Board that possess the skills, experience and knowledge and thus all Directors bring independent judgement on various subjects, particularly financial acumen.
Combining the roles of Chairman and CEO is justified given the nature of the Group, at this juncture. The Chairman-CEO is appraised annually. Board balance is maintained as the Code stipulates.
Given the combined role of Chairman and CEO, the Group has a Senior Independent Director.
Whilst there is a transparent procedure for Board Appointments, election and re-election, subject to shareholder approval, takes place at regular intervals.
The Human Resources and Compensation Committee, consisting of exclusively NEDs is responsible for determining the remuneration of Chairman-CEO and EDs.
ED compensation includes performance related elements in the pay structure. Compensation commitments in the event of early termination, determination of NED remuneration, remuneration policy and aggregate remuneration paid is disclosed under Section 3.1.12 and is in line with the Code.
There is constructive use of the AGM, as per Code. Notice of Meeting, with adequate details, is circulated to shareholders as per statute.
The Group has in place multiple channels to reach shareholders as discussed under Section 4.5.1.
Interim and other price sensitive and statutorily mandated reports are disclosed to Regulators. As evident from the Annual Report of the Board of Directors, the Company carried out all business in accordance with regulations and applicable laws, equitably and fairly.
The Company continues to be a going concern and remedial action for any material events is in place. All related party transactions are reported under the Notes to the Financial Statements.
There is an annual review of effectiveness of Internal Control which ensures the maintenance of a sound system of internal control.
The Internal Audit function and the Audit Committee, functions as stipulated by the Code.
The Company conducts regular and structured dialogue with shareholders based on a mutual understanding of objectives. This is done via the Investor Relations team and through the AGM.
Individual shareholders investing directly in shares of the Company are encouraged to carry out adequate analysis and seek independent advice in all investing and divesting decisions. They are encouraged to participate at the AGM and exercise their voting rights and seek clarity, whenever required.
The Group places emphasis on sustainable development and value creation. The Group’s Sustainability Management Framework includes strategies for entrenchment of sustainability through awareness creation, monitoring and sustainability assurance.
This Report has been prepared in accordance with the GRI Standards: Core option and International <IR> Framework.
DIRECTORS
DIRECTORS’ REMUNERATION
RELATIONSHIP WITH SHAREHOLDERS
ACCOUNTABILITY AND AUDIT
INSTITUTIONAL INVESTORS
OTHER INVESTORS
SUSTAINABILITY REPORTING
7.6 Code of Best Practice on Corporate Governance (2017) issued by CA Sri Lanka
The Company is compliant with almost the full 2017 Code of Best Practice on Corporate Governance issued by the ICASL to the extent of business exigency and as required by the John Keells Group.
GOVERNANCE
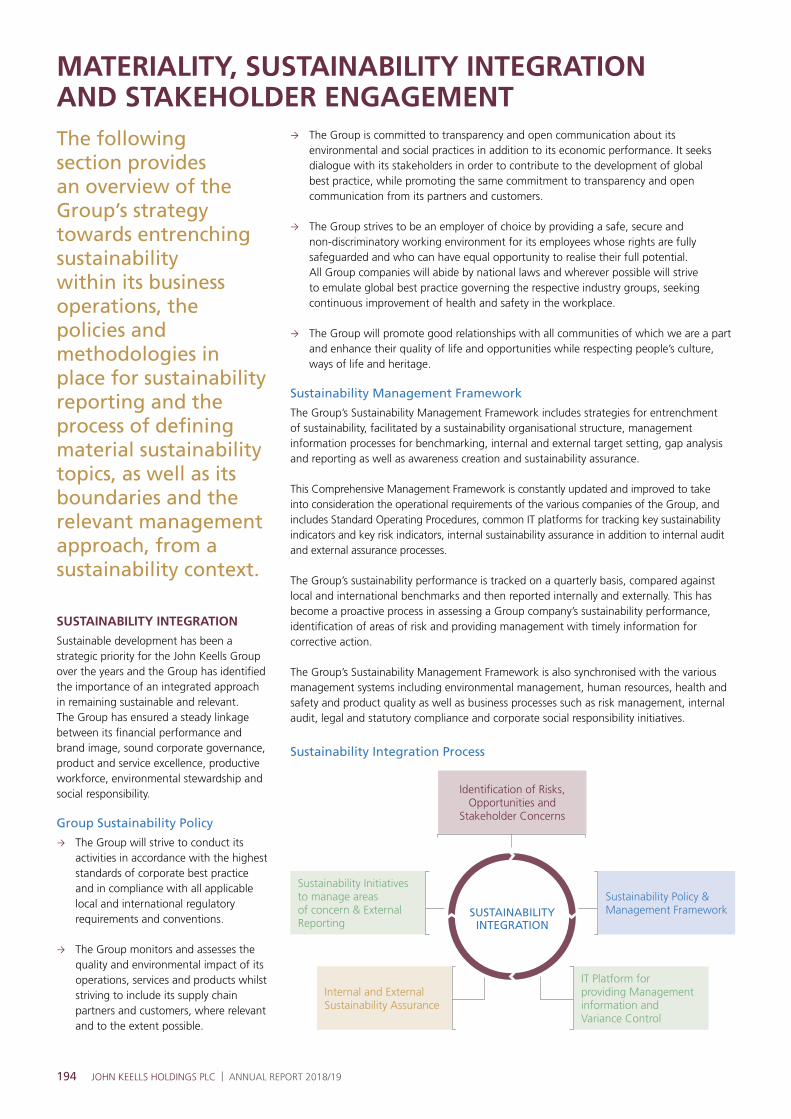
194 JOHN KEELLS HOLDINGS PLC | ANNUAL REPORT 2018/19
MATERIALITY, SUSTAINABILITY INTEGRATION AND STAKEHOLDER ENGAGEMENTThe following section provides an overview of the Group’s strategy towards entrenching sustainability within its business operations, the policies and methodologies in place for sustainability reporting and the process of defining material sustainability topics, as well as its boundaries and the relevant management approach, from a sustainability context.
SUSTAINABILITY INTEGRATION
Sustainable development has been a strategic priority for the John Keells Group over the years and the Group has identified the importance of an integrated approach in remaining sustainable and relevant. The Group has ensured a steady linkage between its financial performance and brand image, sound corporate governance, product and service excellence, productive workforce, environmental stewardship and social responsibility.
Group Sustainability Policy
The Group will strive to conduct its activities in accordance with the highest standards of corporate best practice and in compliance with all applicable local and international regulatory requirements and conventions.
The Group monitors and assesses the quality and environmental impact of its operations, services and products whilst striving to include its supply chain partners and customers, where relevant and to the extent possible.
The Group is committed to transparency and open communication about its environmental and social practices in addition to its economic performance. It seeks dialogue with its stakeholders in order to contribute to the development of global best practice, while promoting the same commitment to transparency and open communication from its partners and customers.
The Group strives to be an employer of choice by providing a safe, secure and non-discriminatory working environment for its employees whose rights are fully safeguarded and who can have equal opportunity to realise their full potential. All Group companies will abide by national laws and wherever possible will strive to emulate global best practice governing the respective industry groups, seeking continuous improvement of health and safety in the workplace.
The Group will promote good relationships with all communities of which we are a part and enhance their quality of life and opportunities while respecting people’s culture, ways of life and heritage.
Sustainability Management Framework
The Group’s Sustainability Management Framework includes strategies for entrenchment of sustainability, facilitated by a sustainability organisational structure, management information processes for benchmarking, internal and external target setting, gap analysis and reporting as well as awareness creation and sustainability assurance.
This Comprehensive Management Framework is constantly updated and improved to take into consideration the operational requirements of the various companies of the Group, and includes Standard Operating Procedures, common IT platforms for tracking key sustainability indicators and key risk indicators, internal sustainability assurance in addition to internal audit and external assurance processes.
The Group’s sustainability performance is tracked on a quarterly basis, compared against local and international benchmarks and then reported internally and externally. This has become a proactive process in assessing a Group company’s sustainability performance, identification of areas of risk and providing management with timely information for corrective action.
The Group’s Sustainability Management Framework is also synchronised with the various management systems including environmental management, human resources, health and safety and product quality as well as business processes such as risk management, internal audit, legal and statutory compliance and corporate social responsibility initiatives.
Sustainability Integration Process
SUSTAINABILITY INTEGRATION
Identification of Risks, Opportunities and
Stakeholder Concerns
Sustainability Policy & Management Framework
Sustainability Initiatives to manage areas of concern & External Reporting
Internal and External Sustainability Assurance
IT Platform for providing Management information and Variance Control
195
The Group’s sustainability performance is tracked on a quarterly basis, compared against local and international benchmarks and then reported internally and externally. This has become a proactive process in assessing a group company’s sustainability performance, identification of areas of risk and providing management with timely information for corrective action.
SUSTAINABILITY ORGANISATIONAL STRUCTURE
The Sustainability, Enterprise Risk Management and Group Initiatives Division, along with the Group Executive Committee and the Group Sustainability Committee formulates the Group sustainability strategy. The Division is responsible for the operationalisation of the Group’s Sustainability Management Framework under which business units carry out their specific sustainability strategies and initiatives.
The Division is also responsible for the process by which the Group identifies its significant stakeholders, the identification of materiality issues and sharing of best practices, carrying out risk reviews and the overall review and monitoring of the sustainability drive. Awareness campaigns are carried out on a regular basis, with an annual Group-wide awareness campaign being carried out to broad-base knowledge and to inculcate a culture of sustainability.
The Group has in place a robust sustainability structure with oversight from the Group Executive Committee and the Group Sustainability Committee, while task groups for each sustainability aspect are headed by a member of the Group Operating Committee. Additionally, each business unit has a dedicated Sustainability Champion responsible for sustainability initiatives and the overall sustainability performance, under the supervision of their respective Sector Heads and Heads of Business Units. This structure is used in integrating sustainability within the business operations as well as assessing and developing the value chain in sustainable practices.
The strategic planning process and annual plan cycle of Group companies are now based on a holistic approach and include an integrated strategy of considering all aspects of the triple bottom line whilst striving for optimised financial performance. Business units identify their material impacts and commit to medium-term strategies to minimise such impacts. This has enabled the Group to further integrate their sustainability strategies with their business strategies and has created the need for business units to assess the hidden costs of operations and include sustainability initiatives and other green projects in to their annual objectives. With business unit strategies and goals aligned to triple bottom line results, this has in
turn resulted in employee objectives being aligned to such results, which has enabled the Group to truly entrench sustainability into the organisational culture of the Group.
The Group has commenced a focused strategy of encouraging its significant suppliers to embrace sustainability as part of their operations. As such, the Group currently has in place processes to assess risks of environmental, labour and social impacts emanating from its value chain and to carry out internal assessments of supply chain partners. An annual drive to create awareness through supplier fora for the Group’s significant supply chain partners is also carried out and a Code of Conduct for all significant suppliers bidding for the Group’s centrally sourced goods and services has been introduced. In addition, the Group’s recently introduced Supplier Management platform further enhances the centrally-driven sourcing process, ensuring strengthened transparency during auctions, efficiency in negotiations and minimal paper usage.
Report Content
The annual report is one of the primary methods used by the Group to respond to stakeholder concerns during the financial year. The process of recognising key sustainability related risks, significant stakeholders, assessment of the material aspects based on relative importance to both the Group and stakeholders, and to formulate policies and management approaches to manage and mitigate these aspects have become an integral part of defining this report.
Engagement of Significant Stakeholders section of this Report explains the process adopted by the Group in determining the information requirements of its stakeholders, prioritisation of issues and establishing materiality. The section titled ‘Key Sustainability Concerns’ explains the outcomes of the stakeholder engagement process and establishes the relevance of the material aspects and key sustainability indicators that the Group has reported on.
This Report is the Group’s fourth Integrated Annual Report, and has been structured as per the International <IR> Framework (IIRC), and strives to discuss the inter connections between the six forms of capital, the Group’s business model and
the creation of value. Every year, this report provides a holistic overview including the Group’s overall strategy, corporate governance framework, risk management processes and financial and non-financial performance covering all aspects of the triple bottom line. During the last few years, the integrated report evolved from a group-centric approach to an approach which provided a sectorial analysis and presentation of relevant material aspects for each industry group. The report which provided the highlights of the triple bottom line performance of each industry group, also provided similar information from a Group-wide perspective.
As in the previous year, this year too, each industry group section and the Group Financial and Sustainability Review also strives to capture the interrelationships between identified material topics and the significance of these topics in areas such as financial performance, human capital and relationships with community and the environment with a view to providing information with regard to risks and opportunities and strategy going forward.
This annual report strives to provide a clear, concise and balanced overview to all significant stakeholders identified in the Engagement of Significant Stakeholder section of this Report, providing year on year comparisons for both financial and non-financial information relevant to such identified stakeholders. In keeping with the reporting principles for defining report
GOVERNANCE
GRI 102-46
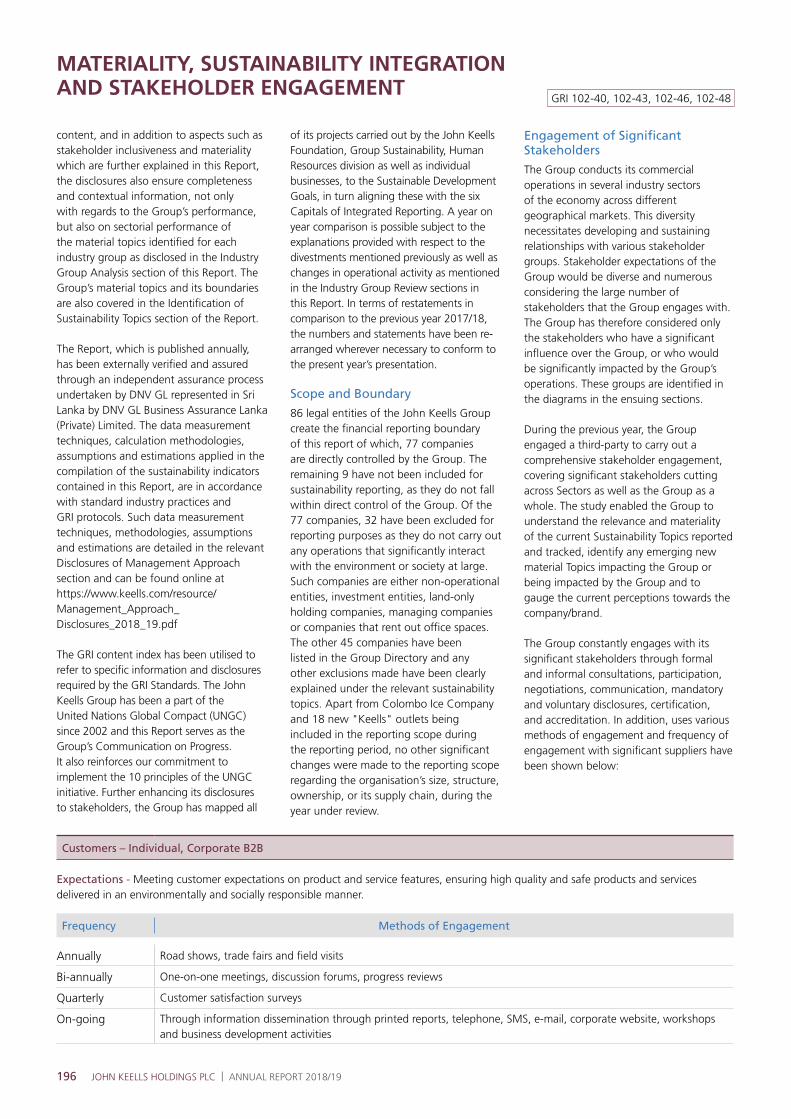
196 JOHN KEELLS HOLDINGS PLC | ANNUAL REPORT 2018/19
content, and in addition to aspects such as stakeholder inclusiveness and materiality which are further explained in this Report, the disclosures also ensure completeness and contextual information, not only with regards to the Group’s performance, but also on sectorial performance of the material topics identified for each industry group as disclosed in the Industry Group Analysis section of this Report. The Group’s material topics and its boundaries are also covered in the Identification of Sustainability Topics section of the Report.
The Report, which is published annually, has been externally verified and assured through an independent assurance process undertaken by DNV GL represented in Sri Lanka by DNV GL Business Assurance Lanka (Private) Limited. The data measurement techniques, calculation methodologies, assumptions and estimations applied in the compilation of the sustainability indicators contained in this Report, are in accordance with standard industry practices and GRI protocols. Such data measurement techniques, methodologies, assumptions and estimations are detailed in the relevant Disclosures of Management Approach section and can be found online at https://www.keells.com/resource/Management_Approach_Disclosures_2018_19.pdf
The GRI content index has been utilised to refer to specific information and disclosures required by the GRI Standards. The John Keells Group has been a part of the United Nations Global Compact (UNGC) since 2002 and this Report serves as the Group’s Communication on Progress. It also reinforces our commitment to implement the 10 principles of the UNGC initiative. Further enhancing its disclosures to stakeholders, the Group has mapped all
of its projects carried out by the John Keells Foundation, Group Sustainability, Human Resources division as well as individual businesses, to the Sustainable Development Goals, in turn aligning these with the six Capitals of Integrated Reporting. A year on year comparison is possible subject to the explanations provided with respect to the divestments mentioned previously as well as changes in operational activity as mentioned in the Industry Group Review sections in this Report. In terms of restatements in comparison to the previous year 2017/18, the numbers and statements have been re-arranged wherever necessary to conform to the present year’s presentation.
Scope and Boundary
86 legal entities of the John Keells Group create the financial reporting boundary of this report of which, 77 companies are directly controlled by the Group. The remaining 9 have not been included for sustainability reporting, as they do not fall within direct control of the Group. Of the 77 companies, 32 have been excluded for reporting purposes as they do not carry out any operations that significantly interact with the environment or society at large. Such companies are either non-operational entities, investment entities, land-only holding companies, managing companies or companies that rent out office spaces. The other 45 companies have been listed in the Group Directory and any other exclusions made have been clearly explained under the relevant sustainability topics. Apart from Colombo Ice Company and 18 new "Keells" outlets being included in the reporting scope during the reporting period, no other significant changes were made to the reporting scope regarding the organisation’s size, structure, ownership, or its supply chain, during the year under review.
Engagement of Significant Stakeholders
The Group conducts its commercial operations in several industry sectors of the economy across different geographical markets. This diversity necessitates developing and sustaining relationships with various stakeholder groups. Stakeholder expectations of the Group would be diverse and numerous considering the large number of stakeholders that the Group engages with. The Group has therefore considered only the stakeholders who have a significant influence over the Group, or who would be significantly impacted by the Group’s operations. These groups are identified in the diagrams in the ensuing sections.
During the previous year, the Group engaged a third-party to carry out a comprehensive stakeholder engagement, covering significant stakeholders cutting across Sectors as well as the Group as a whole. The study enabled the Group to understand the relevance and materiality of the current Sustainability Topics reported and tracked, identify any emerging new material Topics impacting the Group or being impacted by the Group and to gauge the current perceptions towards the company/brand.
The Group constantly engages with its significant stakeholders through formal and informal consultations, participation, negotiations, communication, mandatory and voluntary disclosures, certification, and accreditation. In addition, uses various methods of engagement and frequency of engagement with significant suppliers have been shown below:
MATERIALITY, SUSTAINABILITY INTEGRATION AND STAKEHOLDER ENGAGEMENT
Customers – Individual, Corporate B2B
Expectations - Meeting customer expectations on product and service features, ensuring high quality and safe products and services delivered in an environmentally and socially responsible manner.
Frequency Methods of Engagement
Annually Road shows, trade fairs and field visits
Bi-annually One-on-one meetings, discussion forums, progress reviews
Quarterly Customer satisfaction surveys
On-going Through information dissemination through printed reports, telephone, SMS, e-mail, corporate website, workshops and business development activities
GRI 102-40, 102-43, 102-46, 102-48

197
Employees – Directors, Executives, Non-executives
Expectations - Providing a safe and enabling environment, equal opportunity and a culture of meritocracy, enhancement of skills and knowledge, continuous engagement, providing feedback and encouraging work-life balance
Frequency Methods of Engagement
Annually Employee satisfaction surveys and dip stick surveys such as Great Place To Work (GPTW), VOE (Voice of Employee), Group-wide year end get-together.
Bi-annually Performance reviews, skip level meetings
Quarterly Intranet communications through JK Connect and My Portal
On-going Professional training, development activities and team building through internal and external programmes, joint consultative committees, open door policy at all management levels, sports events, Corporate Social Responsibility programmes
Community – Neighbours, Community, Community Leaders, Society
Expectations - Stimulating local economy through procurement and providing direct and indirect employment whilst carrying out operations with minimal impact on shared natural resources.
Frequency Methods of Engagement
One-off Engagement with the community is carried out prior to entry into the community area and on exit via one-on-one meetings, workshops, forums
Monthly Engagement is then carried out on a monthly basis while operating via one-on-one meetings, workshops, forums
On-going Corporate Social Responsibility programmes, creating awareness and education
Institutional Investors, Fund Managers, Analysts, Leaders, Multilateral Lenders
Expectations - Consistent economic performance leading to greater economic value generation.
Frequency Methods of Engagement
Annually Annual reports, disclosures and reviews
Quarterly Quarterly reports
Regularly Investor road shows
On-going Phone calls, e-mail, written communication, websites, one-on-one meetings
Government, Government Institutions and Departments
Expectations - Contribution to the country’s economy through strategic investments, creating direct and indirect employment, timely payment of taxes and levies and stimulating local economies
Frequency Methods of Engagement
Quarterly The senior management are members of chambers and industry associations who meet at least on a quarterly basis
On-going Engagement with the Government is carried out on an on-going basis through meetings, business forums, newsletters, circulars, presentations and briefings, advisory meetings of industry associates
Legal and Regulatory Bodies
Expectations - Carrying out operations in compliance to all relevant laws and regulations and operating as a responsible corporate citizen adhering to sound corporate governance practices
Frequency Methods of Engagement
Quarterly The senior management are members of chambers and industry associations who meet at least on a quarterly basis
On-going Engagement with the legal and regulatory bodies are carried out on an on-going basis through meetings, periodic disclosures, correspondence with bodies such as local authorities, municipal councils and other institutions such as Consumer Affairs Authority, Department of Inland Revenue, Customs Department, Securities & Exchange Commission, Colombo Stock Exchange and Tourist Board of Sri Lanka
GOVERNANCE
GRI 102-40, 102-43
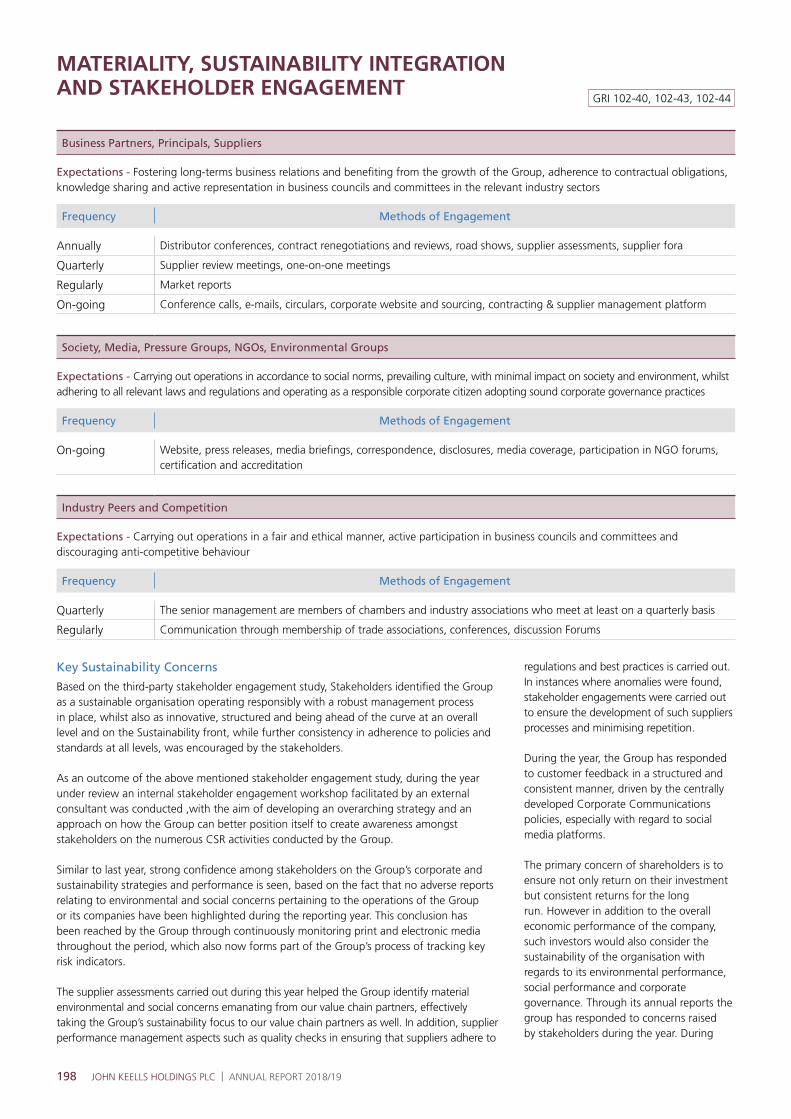
198 JOHN KEELLS HOLDINGS PLC | ANNUAL REPORT 2018/19
Business Partners, Principals, Suppliers
Expectations - Fostering long-terms business relations and benefiting from the growth of the Group, adherence to contractual obligations, knowledge sharing and active representation in business councils and committees in the relevant industry sectors
Frequency Methods of Engagement
Annually Distributor conferences, contract renegotiations and reviews, road shows, supplier assessments, supplier fora
Quarterly Supplier review meetings, one-on-one meetings
Regularly Market reports
On-going Conference calls, e-mails, circulars, corporate website and sourcing, contracting & supplier management platform
Society, Media, Pressure Groups, NGOs, Environmental Groups
Expectations - Carrying out operations in accordance to social norms, prevailing culture, with minimal impact on society and environment, whilst adhering to all relevant laws and regulations and operating as a responsible corporate citizen adopting sound corporate governance practices
Frequency Methods of Engagement
On-going Website, press releases, media briefings, correspondence, disclosures, media coverage, participation in NGO forums, certification and accreditation
Industry Peers and Competition
Expectations - Carrying out operations in a fair and ethical manner, active participation in business councils and committees and discouraging anti-competitive behaviour
Frequency Methods of Engagement
Quarterly The senior management are members of chambers and industry associations who meet at least on a quarterly basis
Regularly Communication through membership of trade associations, conferences, discussion Forums
Key Sustainability Concerns
Based on the third-party stakeholder engagement study, Stakeholders identified the Group as a sustainable organisation operating responsibly with a robust management process in place, whilst also as innovative, structured and being ahead of the curve at an overall level and on the Sustainability front, while further consistency in adherence to policies and standards at all levels, was encouraged by the stakeholders.
As an outcome of the above mentioned stakeholder engagement study, during the year under review an internal stakeholder engagement workshop facilitated by an external consultant was conducted ,with the aim of developing an overarching strategy and an approach on how the Group can better position itself to create awareness amongst stakeholders on the numerous CSR activities conducted by the Group.
Similar to last year, strong confidence among stakeholders on the Group’s corporate and sustainability strategies and performance is seen, based on the fact that no adverse reports relating to environmental and social concerns pertaining to the operations of the Group or its companies have been highlighted during the reporting year. This conclusion has been reached by the Group through continuously monitoring print and electronic media throughout the period, which also now forms part of the Group’s process of tracking key risk indicators.
The supplier assessments carried out during this year helped the Group identify material environmental and social concerns emanating from our value chain partners, effectively taking the Group’s sustainability focus to our value chain partners as well. In addition, supplier performance management aspects such as quality checks in ensuring that suppliers adhere to
regulations and best practices is carried out. In instances where anomalies were found, stakeholder engagements were carried out to ensure the development of such suppliers processes and minimising repetition.
During the year, the Group has responded to customer feedback in a structured and consistent manner, driven by the centrally developed Corporate Communications policies, especially with regard to social media platforms.
The primary concern of shareholders is to ensure not only return on their investment but consistent returns for the long run. However in addition to the overall economic performance of the company, such investors would also consider the sustainability of the organisation with regards to its environmental performance, social performance and corporate governance. Through its annual reports the group has responded to concerns raised by stakeholders during the year. During
MATERIALITY, SUSTAINABILITY INTEGRATION AND STAKEHOLDER ENGAGEMENT
GRI 102-40, 102-43, 102-44

199
the reporting year the Group has strengthened its policy frameworks and management approach, where it has become vital to address its material aspects and identify potential frontier risks.
Stakeholders such as society, pressure groups and regulatory authorities constantly assess the operations of the corporate with regard to the responsible utilisation of resources, conservation of biodiversity and environmental protection, as these will continue to be high priority areas for the Group.
The John Keells Group has always placed great importance in developing the communities within which it operates. The Group's corporate philosophy has always been to be a responsible corporate citizen; and therefore will continue to do so as done for the last 149 years in its existence. The Group also constantly engages with its employees, identifying areas such as employee welfare, training and retention of talent as focus areas.
Topic Grouping
Inte
rnal
Exte
rnal
Economic Performance
Procurement Practices, Indirect Economic Impact
Energy and Emissions
Water, Effluents and Waste
Biodiversity and Environmental Compliance
Employment, Diversity and Equal Opportunity, Labour Relations, Freedom of Association, Training, Occupational Health and Safety
Non-discrimination, Prevention of Child Labour, Prevention of Forced and Compulsory Labour
Local Communities
Anti-corruption and Regulatory Compliance
Supplier Assessment (Environmental and Labour)
Product Quality and Compliance, Labelling, Marketing Communications
"The Group considers its business units and employees as internal stakeholders whilst its external stakeholder consists of shareholders, investors, lenders, customers, suppliers, business partners, Government and regulatory authorities, peers, pressure groups, media and the community."
GOVERNANCE
IDENTIFICATION OF MATERIAL TOPICS
The Group considers its business units and employees as internal stakeholders whilst its external stakeholder consists of shareholders, investors, lenders, customers, suppliers, business partners, Government and regulatory authorities, peers, pressure groups media and the community. Continuing from the previous year, this year too, the Group provided greater focus to suppliers and distribution networks in an attempt to assess the risks faced by the Group through its value chain. There has been no significant changes from previous reporting periods in the list of material topics and topic boundaries. As such, taking into consideration the key sustainability concerns of its significant stakeholder groups, the material topic boundary assessed by the Group, are as follows.
Investors, community, suppliers
Investors, community,
peers, customers,
suppliersInvestors,
suppliers,
Governmen
t
Investors, pressure
groups, regulators
comm
unity,
media
Inve
stor
s, re
gula
tors
,
cust
omer
s, m
edia
, so
ciet
y
Inve
stor
s, r
egul
ator
s,
com
mun
ity,
cust
omer
s, p
ress
ure
grou
ps, s
uppl
iers
, m
edia
Inve
stor
s, s
uppl
iers
,
cust
omer
s, m
edia
Gover
nmen
t,
peer
s, pr
essu
re
grou
ps, c
omm
unity
,
custo
mer
s, in
vesto
rs,
regu
lator
s, m
edia
Investors, suppliers,
regulators, customers,
comm
unity, media
Regulators,
customers, investors,
suppliers, communityInvestors, suppliers, community
Leisure, Plantations, Consumer
Foods, Retail, employees
Leisure,
Transportation,
Consumer
Foods, Retail,
Plantations
All Group
companies
,
employee
s
Leisure,
Consum
er
Foods, Retail
Leisu
re,
Con
sum
er
Food
s, R
etai
l
All
Gro
up
com
pani
es
Leis
ure,
Plan
tatio
ns,
Con
sum
er,
Food
s, R
etai
l,
Prop
erty
All Gro
up
com
pani
es,
empl
oyee
s
All Group
companies,
employees Consumer Foods, Leisure, Plantations
EXTERNAL STAKEHOLDERS
INTERNAL STAKEHOLDERS
GRI 102-44, 102-46, 102-49

200 JOHN KEELLS HOLDINGS PLC | ANNUAL REPORT 2018/19
In defining report content, the Group sought to prioritise the material impacts based on their relative importance to internal and external stakeholders. This prioritisation and identification of material topics for reporting is shown below.
Colour Code of Category
Material Topic Management Approach
Economic Economic performance, procurement practices, indirect economic impacts Our Investors
Environment Energy, water, biodiversity, emissions, effluents, waste, compliance Our Environment
Employees Employment, training & development, diversity & equal opportunity, occupational health & safety Our People
Ethical Business & Human Rights
Anti-corruption, compliance, prevention of child labour, prevention of forced and compulsory labour, freedom of association
Our Ethics
Product Responsibility Product labelling, responsible advertising, product compliance, customer health & safety Our Products
Supplier Assessment Assessment of suppliers for environment stewardship, labour practices and human rights Our Supply Chain
Social Responsibility Local community Our Community
Market Presence
Indirect Economic Impact Economic PerformanceLocal Purchasing
Employment
Equal Pay Labour Relations
Labour Grievances
Training
Occupational Health & SafetySupplier Assessment Labour
Energy
Water
Waste
Effluents
Emissions
Env Compliance
Biodiversity
Materials
Transportation Impacts Env Conservation
Products & Services Impacts
Env Grievances
Supplier Assessment - EnvironmentResponsible Advertising
LabellingProduct Compliance
Customer Health & Safety
Customer Privacy
Overall Compliance
Local Community
Anti Corruption
Public PolicyAnti Competitive Behaviour
Supplier Assessment - Social
Forced LabourChild Labour
Non - Discrimination
Freedom of Association
Supplier Assessments - Human Rights
Security Practices
Indeginous Rights
Human Rights AssessmentHuman Rights Grievances
Investments
MATERIAL TOPICS
Low
High
Diversity & Equal Opportunity
Impa
ct t
o Ex
tern
al S
take
hold
ers
Impact to Internal StakeholdersHigh
A detailed description of the strategies and approach adopted by the Group in managing its material topics are contained the management approach disclosers section hosted on the Group website https://www.keells.com/resource/Management_Approach_Disclosures_2018_19.pdf
MATERIALITY, SUSTAINABILITY INTEGRATION AND STAKEHOLDER ENGAGEMENT
102-47
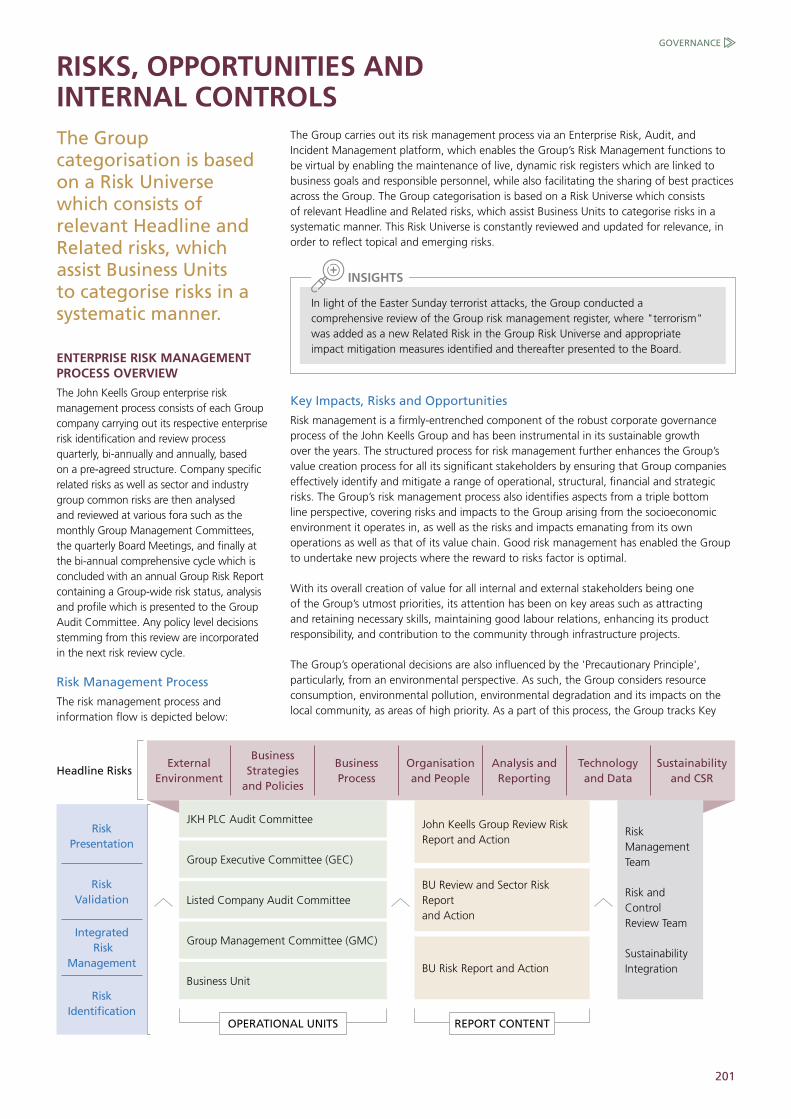
201
RISKS, OPPORTUNITIES AND INTERNAL CONTROLS
ENTERPRISE RISK MANAGEMENT PROCESS OVERVIEW
The John Keells Group enterprise risk management process consists of each Group company carrying out its respective enterprise risk identification and review process quarterly, bi-annually and annually, based on a pre-agreed structure. Company specific related risks as well as sector and industry group common risks are then analysed and reviewed at various fora such as the monthly Group Management Committees, the quarterly Board Meetings, and finally at the bi-annual comprehensive cycle which is concluded with an annual Group Risk Report containing a Group-wide risk status, analysis and profile which is presented to the Group Audit Committee. Any policy level decisions stemming from this review are incorporated in the next risk review cycle.
Risk Management Process
The risk management process and information flow is depicted below:
External Environment
Business Strategies
and Policies
Business Process
Organisation and People
Analysis and Reporting
Technology and Data
Sustainability and CSR
Risk Presentation
Risk Validation
Integrated Risk
Management
Risk Identification
JKH PLC Audit Committee John Keells Group Review Risk Report and Action
Group Executive Committee (GEC)
BU Review and Sector Risk Report and Action
Listed Company Audit Committee
BU Risk Report and Action
Risk Management Team
Risk and Control Review Team
Sustainability Integration
Group Management Committee (GMC)
Business Unit
Headline Risks
OPERATIONAL UNITS REPORT CONTENT
The Group carries out its risk management process via an Enterprise Risk, Audit, and Incident Management platform, which enables the Group’s Risk Management functions to be virtual by enabling the maintenance of live, dynamic risk registers which are linked to business goals and responsible personnel, while also facilitating the sharing of best practices across the Group. The Group categorisation is based on a Risk Universe which consists of relevant Headline and Related risks, which assist Business Units to categorise risks in a systematic manner. This Risk Universe is constantly reviewed and updated for relevance, in order to reflect topical and emerging risks.
In light of the Easter Sunday terrorist attacks, the Group conducted a comprehensive review of the Group risk management register, where "terrorism" was added as a new Related Risk in the Group Risk Universe and appropriate impact mitigation measures identified and thereafter presented to the Board.
INSIGHTS
Key Impacts, Risks and Opportunities
Risk management is a firmly-entrenched component of the robust corporate governance process of the John Keells Group and has been instrumental in its sustainable growth over the years. The structured process for risk management further enhances the Group’s value creation process for all its significant stakeholders by ensuring that Group companies effectively identify and mitigate a range of operational, structural, financial and strategic risks. The Group’s risk management process also identifies aspects from a triple bottom line perspective, covering risks and impacts to the Group arising from the socioeconomic environment it operates in, as well as the risks and impacts emanating from its own operations as well as that of its value chain. Good risk management has enabled the Group to undertake new projects where the reward to risks factor is optimal.
With its overall creation of value for all internal and external stakeholders being one of the Group’s utmost priorities, its attention has been on key areas such as attracting and retaining necessary skills, maintaining good labour relations, enhancing its product responsibility, and contribution to the community through infrastructure projects.
The Group’s operational decisions are also influenced by the 'Precautionary Principle', particularly, from an environmental perspective. As such, the Group considers resource consumption, environmental pollution, environmental degradation and its impacts on the local community, as areas of high priority. As a part of this process, the Group tracks Key
The Group categorisation is based on a Risk Universe which consists of relevant Headline and Related risks, which assist Business Units to categorise risks in a systematic manner.
GOVERNANCE

202 JOHN KEELLS HOLDINGS PLC | ANNUAL REPORT 2018/19
RISKS, OPPORTUNITIES AND INTERNAL CONTROLS
Risk Indicators such as natural disasters, emissions, climate change and impacts to biodiversity, ensuring a minimum impact on the environment within which it operates.
Discussions on risks, at a Group Level, are contained in the Capital Management section of the Group Consolidated Review section, the Industry Group Review section and the Financial Statements of this Report. Details on risks, opportunities and internal controls specific to business units, sectors and industry groups are discussed in the Industry Group Review section of this Report.
Headline Risks Macro-economic and Political Environment
2018/19 2017/18 2016/17
Risk rating Low Low Low
Similar to the last financial year, policy uncertainty and the volatility of the economic environment - both locally and globally - continued during the reporting year. Despite the current lack of clarity and definition on some of its economic policies, the Group and the business community remain positive about the future of Sri Lanka’s economy. Several senior management staff actively participate in key policy making bodies, committed to supporting the Government in its efforts to create sustainable and equitable economic growth. For the aforesaid reasons, this risk remains a Low.
Regulatory Environment
2018/19 2017/18 2016/17
Risk rating High High High
"The Group adopted prudent measures to manage the financial impacts arising from currency fluctuations, underscoring the importance of matching liabilities with corresponding inflows and constantly evaluating such positions."
A degree of uncertainty and volatility still prevails as a result of transitioning legal, regulatory and tax structures. The prolonged prevalence of this uncertainty and impact on our businesses result in the risk rating remaining at a High. The Group’s operating model, together with its internal processes, aims to ensure flexibility with, and adaptability to, any unexpected changes in the legal framework. Participation of the Group’s senior executives in various industry associations and industry chambers helps to bring clarity and consistency to Government policies and regulations.
Financial Exposure
2018/19 2017/18 2016/17
Risk rating Low Low Low
Group Treasury, guided by the GEC and supported by the Finance functions of the businesses, is responsible for the management of financial risks through continued monitoring. Hedging mechanisms, liquidity management strategies, capital structuring and other Board approved strategies for interest rate, currency and liquidity management are applied across the Group. Given the volatility and uncertainty in the global and domestic environment witnessed in the recent years, the ensuing section details material sources of financial risk and the state of the Group’s readiness to navigate such risks.
Currency / Exchange Rate
Risk rating – Medium
The Central Bank of Sri Lanka (CBSL) pursued a market-based exchange rate policy by allowing greater flexibility in the determination of exchange rates, with minimal intervention to curb unwarranted excessive volatility. Continued outflows as a result of global volatility, increased demand for FOREX, supply constraints and unfavourable political developments exerted pressure on the currency.
The Group adopted prudent measures to manage the financial impacts arising from currency fluctuations, underscoring the importance of matching liabilities with corresponding inflows and constantly evaluating such positions. Accumulation of foreign currency funds; matching Dollar revenue streams with expenses in lieu
of Dollar denominated debt to architect "natural hedges"; currency hedges; conversion management and the regular review of rates and related contractual pricing were some initiatives undertaken towards this end.
Interest Rate
Risk rating – Low
The Rupee interest rates saw an upward movement during the year under review as a result of a revision of policy rates by CBSL and due to liquidity constraints in the market. The Group made a conscious effort to invest in more medium-term instruments, during the year under review. Subject to liquidity requirements and other considerations, the Group was able to lock in investments at higher rates during the latter end of the year given the upward trend exhibited by interest rates. It is noted that a majority of the Rupee debt drawn-down during the year was based on pricing driven by the average weighted prime lending rate (AWPLR).
The Group continued to maintain a partial hedge of the USD 395 million syndicated loan facility as a prudent measure to mitigate the Group’s exposure to rate fluctuations, which was in-the-money throughout the year under review. The Group will continue to monitor its LIBOR exposure in relation to the syndicated loan facility, make periodic updates and recommendations to the Board as necessary, and take required action to mitigate exposure and potential risks.
Credit and Counterparty
Risk rating – Low
The Group continued to liaise with only reputed creditworthy counterparties. All clients are subject to credit verification procedures and are required to submit bank guarantees, performance bonds or counter guarantees, as applicable. These clients are regularly monitored, and subject arrangements are frequently reviewed. Concentration risk stemming from any single counterparty is mitigated due to internally set exposure limits.
Liquidity
Risk rating – Low
The Group continued to place emphasis on ensuring that cash and undrawn committed facilities are sufficient to meet the short, medium and long-term funding requirements, unforeseen obligations as
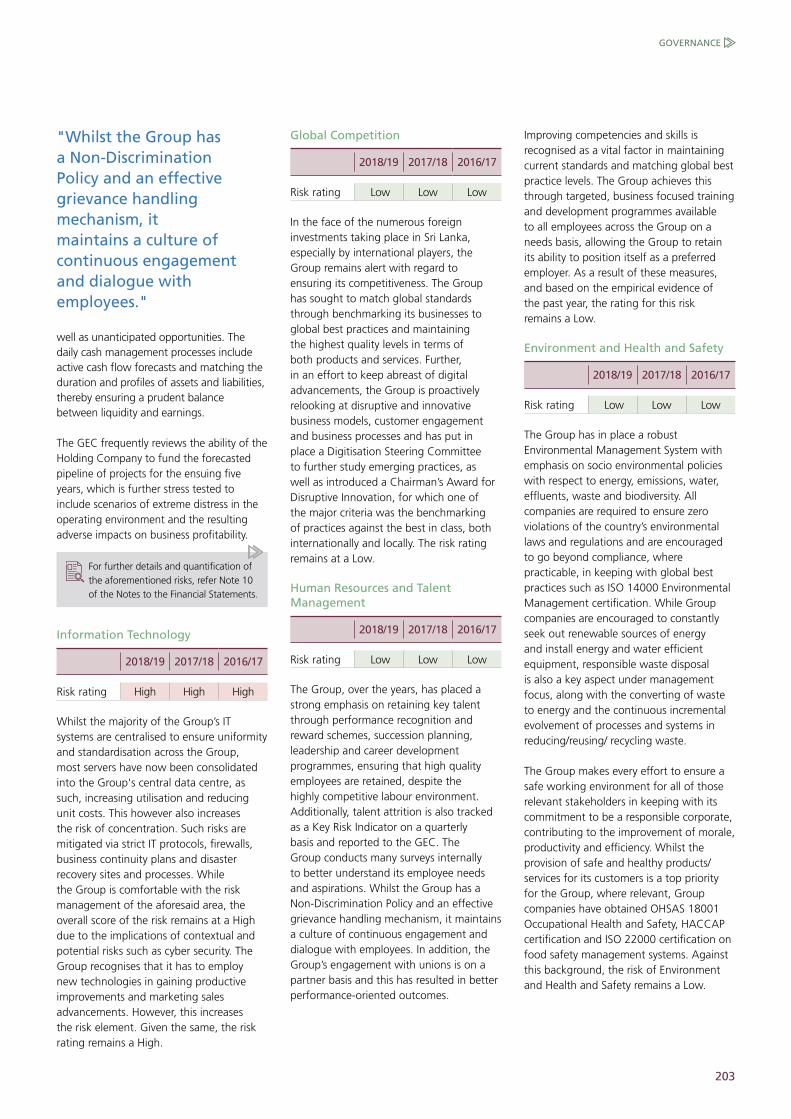
203
well as unanticipated opportunities. The daily cash management processes include active cash flow forecasts and matching the duration and profiles of assets and liabilities, thereby ensuring a prudent balance between liquidity and earnings.
The GEC frequently reviews the ability of the Holding Company to fund the forecasted pipeline of projects for the ensuing five years, which is further stress tested to include scenarios of extreme distress in the operating environment and the resulting adverse impacts on business profitability.
For further details and quantification of the aforementioned risks, refer Note 10 of the Notes to the Financial Statements.
Information Technology
2018/19 2017/18 2016/17
Risk rating High High High
Whilst the majority of the Group’s IT systems are centralised to ensure uniformity and standardisation across the Group, most servers have now been consolidated into the Group's central data centre, as such, increasing utilisation and reducing unit costs. This however also increases the risk of concentration. Such risks are mitigated via strict IT protocols, firewalls, business continuity plans and disaster recovery sites and processes. While the Group is comfortable with the risk management of the aforesaid area, the overall score of the risk remains at a High due to the implications of contextual and potential risks such as cyber security. The Group recognises that it has to employ new technologies in gaining productive improvements and marketing sales advancements. However, this increases the risk element. Given the same, the risk rating remains a High.
Global Competition
2018/19 2017/18 2016/17
Risk rating Low Low Low
In the face of the numerous foreign investments taking place in Sri Lanka, especially by international players, the Group remains alert with regard to ensuring its competitiveness. The Group has sought to match global standards through benchmarking its businesses to global best practices and maintaining the highest quality levels in terms of both products and services. Further, in an effort to keep abreast of digital advancements, the Group is proactively relooking at disruptive and innovative business models, customer engagement and business processes and has put in place a Digitisation Steering Committee to further study emerging practices, as well as introduced a Chairman’s Award for Disruptive Innovation, for which one of the major criteria was the benchmarking of practices against the best in class, both internationally and locally. The risk rating remains at a Low.
Human Resources and Talent Management
2018/19 2017/18 2016/17
Risk rating Low Low Low
The Group, over the years, has placed a strong emphasis on retaining key talent through performance recognition and reward schemes, succession planning, leadership and career development programmes, ensuring that high quality employees are retained, despite the highly competitive labour environment. Additionally, talent attrition is also tracked as a Key Risk Indicator on a quarterly basis and reported to the GEC. The Group conducts many surveys internally to better understand its employee needs and aspirations. Whilst the Group has a Non-Discrimination Policy and an effective grievance handling mechanism, it maintains a culture of continuous engagement and dialogue with employees. In addition, the Group’s engagement with unions is on a partner basis and this has resulted in better performance-oriented outcomes.
"Whilst the Group has a Non-Discrimination Policy and an effective grievance handling mechanism, it maintains a culture of continuous engagement and dialogue with employees."
Improving competencies and skills is recognised as a vital factor in maintaining current standards and matching global best practice levels. The Group achieves this through targeted, business focused training and development programmes available to all employees across the Group on a needs basis, allowing the Group to retain its ability to position itself as a preferred employer. As a result of these measures, and based on the empirical evidence of the past year, the rating for this risk remains a Low.
Environment and Health and Safety
2018/19 2017/18 2016/17
Risk rating Low Low Low
The Group has in place a robust Environmental Management System with emphasis on socio environmental policies with respect to energy, emissions, water, effluents, waste and biodiversity. All companies are required to ensure zero violations of the country’s environmental laws and regulations and are encouraged to go beyond compliance, where practicable, in keeping with global best practices such as ISO 14000 Environmental Management certification. While Group companies are encouraged to constantly seek out renewable sources of energy and install energy and water efficient equipment, responsible waste disposal is also a key aspect under management focus, along with the converting of waste to energy and the continuous incremental evolvement of processes and systems in reducing/reusing/ recycling waste.
The Group makes every effort to ensure a safe working environment for all of those relevant stakeholders in keeping with its commitment to be a responsible corporate, contributing to the improvement of morale, productivity and efficiency. Whilst the provision of safe and healthy products/services for its customers is a top priority for the Group, where relevant, Group companies have obtained OHSAS 18001 Occupational Health and Safety, HACCAP certification and ISO 22000 certification on food safety management systems. Against this background, the risk of Environment and Health and Safety remains a Low.
GOVERNANCE

204 JOHN KEELLS HOLDINGS PLC | ANNUAL REPORT 2018/19
"While Group companies are encouraged to constantly seek out renewable sources of energy and install energy and water efficient equipment responsible waste disposal is also a key aspect under management focus, along with the converting of waste to energy and the continuous incremental evolvement of processes and systems in reducing/reusing/ recycling waste."
Reputation and Brand Image
2018/19 2017/18 2016/17
Risk rating Low Low Low
The Group’s Code of Conduct is the foundation of its uncompromising approach to ethical and transparent business conduct with a 'zero tolerance' attitude to any Code of Conduct violations. This is further supplemented and strengthened, through the presence of an independent Ombudsperson, Whistleblower mechanisms and Chairman Direct conduits amongst other measures, supporting the governance structure of the Group.
The Group also identifies and mitigates potential brand reputation risks through the tracking and monitoring of such under a sustainability development framework. The numerous strategic infrastructure and community development projects carried out by the John Keells Foundation contributes to further strengthening its stakeholder engagement process. In addition, stringent quality assurance and product standards are maintained and product quality is continually monitored and tracked. In the few instances where public discontent has been identified, the Group took immediate steps to explain the circumstances. All marketing and public communications are vetted in ensuring conformance with the Group Marketing and Communications Policy, based on the ICC Code of Advertising and similar.
In addition, there has been a greater focus on social media response, given its progressively higher usage amongst the Group’s customers and other relevant stakeholders. In order to further mitigate this risk, a workshop was held and actions taken to address the concerns identified in the stakeholder engagement study conducted in the previous financial year. In this light, the Group is confident that the rating of this risk remains a Low.
Supply Chain Risk
2018/19 2017/18 2016/17
Risk rating Low Low Low
With a strong focus on integrating best practices within its value chain, the Group believes a comprehensive risk management process must also extend to its value chain partners, through regularly assessing risks associated with its supply chain. As such, supplier performance is reviewed on an annual basis with regard to compliance with labour, environmental and other relevant operating regulations of the country. Concurrently, the Group also provides training and knowledge transfer through supplier fora held annually both in Sri Lanka and the Maldives, for its significant value chain partners, assisting to further entrench sustainability within their own business operations, resulting in cost benefits as well as enhancement of their own brand image. The Group’s Supplier Code of Conduct also educates suppliers on the expectations of the Group with regards to sustainable and ethical business practices. As a result of these proactive steps taken by the Group, the risk rating remains at a Low.
The Capital Management Review of the Consolidated Review section of this Report details the Group’s performance with regard to all pillars of the triple bottom line. While the John Keells Group believes that risk management and sustainability go hand-in-hand, this is further reinforced through the Corporate’s Governance Framework, which in turn ensures a strong focus on compliance to regulatory and ethical guidelines, helping the Group operate in line with the principles of sustainable development continued to focus its efforts on supporting local economies in the geographical areas of its operations.
RISKS, OPPORTUNITIES AND INTERNAL CONTROLS
205
FINANCIAL STATEMENTS
207 Annual Report of the Board of Directors | 212 The Statement of Directors’ Responsibility
213 Independent Auditors’ Report | 216 Income Statement | 217 Statement of Comprehensive Income
218 Statement of Financial Position | 219 Statement of Cash Flows | 220 Statement of Changes in Equity
224 Notes to the Financial Statements
FINANCIAL STATEMENTS
ENHANCING
VALUE
206 JOHN KEELLS HOLDINGS PLC | ANNUAL REPORT 2018/19
INDEX TO THE FINANCIAL STATEMENTS
Corporate and Group information 1 Corporate information 224
2 Group information 224
Basis of Preparation and Other Significant Accounting Policies
3 Basis of preparation 224-225
4 Summary of significant accounting policies 225
5 Significant accounting judgements, estimates and assumptions 225-226
6 Changes in accounting standards and standards issued but not yet effective 226-227
Group Business, Operations and Management7 Operating segment information 227-232
8 Basis of consolidation and material partly owned subsidiaries 233-235
9 Business combinations and acquisitions of non-controlling interests 235-236
10 Financial risk management objectives and policies 237-245
11 Fair value measurement and related fair value disclosures 246-247
12 Financial instruments and related policies 248-252
Notes to the Income Statement, Statement of Comprehensive Income and Statement of Financial Position
13 Revenue 252-254
14 Dividend income 254
15 Other operating income and other operating expenses 254-255
16 Net finance income 255
17 Profit before tax 256
18 Earnings per share 257
19 Dividend per share 257
20 Taxes 258-263
21 Property , plant and equipment 264-269
22 Leases 269-270
23 Investment property 270-271
24 Intangible assets 272-274
25 Investment in subsidiaries 275-277
26 Investment in equity accounted investees 277-280
27 Non current financial assets 280-281
28 Other non current assets 281-282
29 Inventories 282
30 Trade and other receivables 283
31 Other current assets 283
32 Short term investments 283-284
33 Stated capital and other components of equity 284-285
34 Share-based payment plans 286-287
35 Insurance contract liabilities 287-290
36 Interest-bearing loans and borrowings 290-292
37 Employee benefit liabilities 293-294
38 Other non current liabilities 295
39 Trade and other payables 295
40 Short term borrowings 295
41 Other current liabilities 295
42 Related party transactions 296-299
Other Disclosures 43 Contingent liabilities 300-301
44 Capital and other commitments 301
45 Lease commitments 301-302
46 Assets pledged 302
47 Events after the reporting period 302
Annual Report of the Board of Directors 207-211
The Statement of Directors’ Responsibility 212
Independent Auditors’ Report 213-215
Income Statement 216
Statement of Comprehensive Income 217
Statement of Financial Position 218
Statement of Cash Flows 219-220
Statement of Changes in Equity 220-221
Financial Highlights 222
Group Contribution Highlights 223
Notes to the Financial Statements 224-302

207
FINANCIAL STATEMENTS
ANNUAL REPORT OF THE BOARD OF DIRECTORS
The Directors have pleasure in presenting the 40th Annual Report of your Company which covers the Audited Financial Statements, Chairman’s Message, Corporate Governance Commentary, Capital Management Review, Industry Group Review and all the other relevant information for the year ended 31 March 2019. Disclosures which appear in the Share Information section form a part of the Annual Report of the Board of Directors as it is a requirement of the Companies Act No. 07 of 2007.
Principal ActivitiesJohn Keells Holdings PLC (the Company), the Group’s holding Company, manages a portfolio of holdings consisting of a range of diverse business operations, which, together, constitute the John Keells Group (the Group), and provides function based services to its subsidiaries, joint ventures and associates.
The companies within the Group and its business activities are described in the Group Directory under the Supplementary Information section of the Annual Report. There were no significant changes to the principal activities of the Company or its subsidiaries during the year.
Corporate Vision and ValuesA culture of innovation, integrity, excellence, caring and trust has been developed within the Group. By being aligned with these values the Directors and employees conduct their activities to achieve the vision, “Building businesses that are leaders in the region”.
Review of Business SegmentsA review of the financial and operational performance and future business developments of the Group, sectors, and its business units are described in the Management Discussion and Analysis section of the Annual Report. Significant changes to business combinations and acquisition of non-controlling interests are provided in Note 9 to the Financial Statements. These reports, together with the audited financial statements, reflect the state of affairs of the Company and the Group. Segment wise contribution to Group revenue, results, assets and liabilities are provided in Note 7 to the Financial Statements.
Future DevelopmentsInformation on future developments are contained in the Chairman’s Message and Management Discussion and Analysis sections of this Annual Report.
Financial StatementsFinancial Statements of the Company and Group for the year ended 31 March
2019, which have been prepared in accordance with Sri Lanka Accounting Standards (SLFRS/LKAS) with the inclusion of the signatures of the Chairman, Deputy Chairman/Group Finance Director and Group Financial Controller, are given from pages 216 to 302 and form a part of the Integrated Annual Report.
John Keells Holdings PLC
For the year ended 31 MarchIn LKR ‘000s
2019 2018
Profit after tax 12,002,216 21,222,229
Other adjustments 994 (4,083)
Balance brought forward from the previous year 60,106,601 47,213,561
Amount available for appropriation 72,109,811 68,431,707
1st interim dividend of LKR. 2.00 per share (2018-LKR. 2.00) paid out of dividend received (2,775,057) (2,775,002)
2nd interim dividend of LKR. 2.00 per share (2018-LKR. 2.00) paid out of dividend received (2,636,336) (2,775,047)
Final dividend declared of LKR. 1.00 per share (2018-LKR. 2.00) to be paid out of dividend received* (1,318,173) (2,775,057)
Re-purchase of shares (11,100,229) -
Balance to be carried forward to the next year 54,280,016 60,106,601
*In accordance with LKAS 10, Events after the reporting period, the final dividend has not been recognised as a liability in the financial statements.
Financial Results and Appropriations RevenueRevenue generated by the Company amounted to LKR. 1,722 Mn (2018 – LKR. 1,348 Mn), whilst Group revenue amounted to LKR. 135,456 Mn (2018 – LKR. 121,215 Mn). Contribution to Group revenue, from the different business segments, is provided in Note 7 to the Financial Statements.
Profit and AppropriationsThe profit after tax of the Company was LKR. 12,002 Mn (2018 – LKR. 21,222 Mn) whilst the Group profit attributable to equity holders of the parent for the year was LKR. 15,254 Mn (2018 - LKR. 21,021 Mn).
The Company’s total comprehensive income net of tax was LKR. 11,977 Mn (2018 - LKR. 21,152 Mn), and the Group total comprehensive income attributable to parent was LKR. 23,208 Mn (2018 - LKR. 28,619 Mn).
Dividend and ReservesAs required by Section 56(2) of the Companies Act No 7 of 2007, the Board of Directors have confirmed that the Company satisfies the solvency test in accordance with Section 57 of the Companies Act No 7 of 2007, and has obtained certificates from the auditors, prior to declaring all dividends. A final dividend will be paid on 14 June 2019 to those shareholders on the register as of 3 June 2019.
Accounting PoliciesAll the significant accounting policies adopted by the Company and Group are mentioned in the Notes to the Financial Statements. There have been no changes in the accounting policies adopted by the Group during the year under review except for SLFRS 15 Revenue from Contracts with Customers and SLFRS 9 Financial Instruments standards the Group adopted with effect from 1 April 2018. For all periods up to and including the year ended 31 March 2019, the Group prepared its

208 JOHN KEELLS HOLDINGS PLC | ANNUAL REPORT 2018/19
ANNUAL REPORT OF THE BOARD OF DIRECTORS
financial statements in accordance with Sri Lanka Accounting Standards (SLFRS/LKAS) which have materially converged with the International Financial Reporting Standards (IFRS) as issued by the International Accounting Standards Board (IASB).
Capital ExpenditureThe Company’s and Group’s capital expenditure on property, plant and equipment amounted to LKR. 80 Mn (2018 - LKR. 86 Mn) and LKR. 12,020 Mn (2018 - LKR. 18,922 Mn), respectively, and all other related information and movements have been disclosed in Note 21 to the Financial Statements.
Additions of intangible assets of the Company and Group during the year amounted to LKR. 62 Mn (2018 - LKR. 33 Mn) and LKR. 1,810 Mn (2018 - LKR. 218 Mn), respectively, and all other related movements are disclosed in Note 24 to the Financial Statements.
Valuation of Land, Buildings and Investment PropertiesAll land and buildings owned by Group companies were revalued as at 31 December 2018 and the carrying value amounted to LKR. 75,948 Mn (2018 - LKR. 70,741 Mn). All information related to revaluation is given in Note 21.3 to the Financial Statements.
Investment properties of business units, when significantly occupied by Group companies, are classified as property, plant and equipment in the consolidated financial statements in compliance with LKAS 40.
The Group revalued all its investment properties as at 31 December 2018, and the carrying value amounted to LKR. 13,985 Mn (2018- LKR. 12,427 Mn). All information related to revaluation of the investment properties is provided in Note 23 to the Financial Statements.
Details of the Group’s real estate as at 31 March 2019, are disclosed in the Group Real Estate Portfolio in the Supplementary Information section of the Annual Report.
InvestmentsDetailed description of the long term investments held as at the reporting date,
is given in Notes 25, 26 and 27 to the Financial Statements.
Stated CapitalStated Capital as at 31 March 2019 for the Company amounted to LKR. 62,806 Mn (2018 - LKR. 62,802 Mn). The movement and composition of the Stated Capital is disclosed in the Statement of Changes in Equity and in Note 33.1 to the Financial Statements.
Revenue ReservesRevenue reserves as at 31 March 2019 for the Company and Group amounted to LKR. 55,598 Mn (2018 - LKR. 62,882 Mn) and LKR. 82,834 Mn (2018 - LKR. 87,266 Mn), respectively. The movement of the revenue reserve is disclosed in the Statement of Changes in Equity.
Share InformationThe distribution and composition of shareholders and the information relating to earnings, dividends, net assets, market value per share and share trading is given in the Share Information section of the Annual Report. As additional disclosures, the Company’s Board of Directors’ (including their close family members) shareholdings, options available under the employee share option (ESOP) plans as at 31 March 2019, market capitalisation, public holding percentage and number of public shareholders are given in the Share Information section of the Annual Report.
Major ShareholdersDetails of the twenty largest shareholders of the Company and the percentages held by each of them are disclosed in the Share Information section of the Annual Report.
Equitable Treatment of ShareholdersThe Company has at all times ensured that all shareholders are treated equitably.
The Board of DirectorsThe Board of Directors of the Company as at 31 March 2019 and their brief profiles are given in the Board of Directors section of the Annual Report.
Retirement and Re-Election of DirectorsIn accordance with Article 84 of the Articles of Association of the Company, J G A Cooray and S S H Wijayasuriya retire
by rotation, and, being eligible, offer themselves for re-election.
In accordance with Article 91 of the Articles of Association of the Company, R Coomaraswamy is eligible for re-election.
Review of The Performance of The BoardThe performance of the board has been appraised through a formalised process, where each individual Director anonymously comments on the dynamics of the Board. The process is described in the Corporate Governance Commentary section of the Annual Report.
Board CommitteesInformation relating to members of the Audit Committee, Human Resources and Compensation Committee, Nominations Committee, Related Party Transactions Review Committee and Project Risk Assessment Committee, including reports of each of the committees, where applicable, and attendance of Directors for each of the committee meetings, are disclosed in the Corporate Governance Commentary section of the Annual Report.
Interests Register and Interests in ContractsThe Company has maintained an Interests Register as contemplated by the Companies Act No 7 of 2007.
This Annual Report also contains particulars of entries made in the Interests Registers of subsidiaries which are public companies or private companies which have not dispensed with the requirement to maintain an Interests Register as permitted by Section 30 of the Companies Act No 7 of 2007.
The Directors have all made a general disclosure relating to share dealings and indemnities and remuneration to the Board of Directors as permitted by Section 192 (2) of the Companies Act No 7 of 2007 and no additional interests have been disclosed by any Director. The Interest Register is available at the registered head
office of the Company, in keeping with the requirements of the section 119 (1) (d) of the Companies Act No 7 of 2007.
209
FINANCIAL STATEMENTS
Share DealingsParticulars of the Company interest register are disclosed in the Share Information section of the Annual Report.
There were no share dealings to be reported, for subsidiaries which are public companies, or private companies, which have not dispensed with the requirement to maintain an interest register for the period from 1 April 2018 to 31 March 2019.
Indemnities and RemunerationThe Board approved the payment of remuneration of the following Executive Directors for the period of 1 April 2018 to 31 March 2019 comprising of;
An increment from 1 July 2018 based on the individual performance rating obtained by the Executive Directors in terms of the performance management system of the John Keells Group;
A short term variable incentive based on the individual performance, organisation performance and role responsibility based on the results of the financial year 2017/2018, and long term incentive plan including employee share options in John Keells Holdings PLC.
John Keells Holdings PLC• S C Ratnayake (retired w.e.f. 31
December 2018)• K N J Balendra • J G A Cooray
Asian Hotels and Properties PLC• R J Karunarajah (resigned w.e.f. 24 May
2019)• S Rajendra
Ceylon Cold Stores PLC• D P Gamlath
Union Assurance PLC• A D Pereira
Cinnamon Hotel Management Ltd• J R Gunaratne• M H Singhawansa (appointed w.e.f. 1
July 2018)
Walkers Tours Ltd• I N Amaratunga (appointed w.e.f 1
January 2019)• V Leelananda (retired w.e.f. 31 December
2018)
All approvals relating to indemnities and remuneration have been recommended by the Human Resources and Compensation Committee, taking into consideration inputs from market surveys, expert opinions and the specific management complexities associated with the John Keells Group and in keeping with the Group remuneration policy.
The contracts and standard director fees of the following Non-Executive Directors have been approved/renewed by the Board. The director fees are commensurate with the market complexities associated with the John Keells Group.
John Keells Holdings PLC• R Coomaraswamy (appointed w.e.f.
1 October 2018)
Asian Hotels and Properties PLC• J Durairatnam (appointed w.e.f.
8 September 2018)• A S De Zoysa (appointed w.e.f.
8 September 2018)
Ceylon Cold Stores PLC• M Hamza
John Keells PLC• J R Gunaratne (appointed w.e.f.
1 July 2018)
John Keells Hotels PLC• M H Singhawansa (appointed w.e.f
1 July 2018)
Union Assurance PLC• S C Ratnayake (retired w.e.f.
31 December 2018)• D H Fernando (appointed w.e.f.
3 August 2018)• K N J Balendra (appointed w.e.f.
1 January 2019)• S A Appleyard (appointed w.e.f.
1 January 2019)
Trans Asia Hotels PLC• E H Wijenaike
Fees payable to Non-Executive Nominee Directors of John Keells Holdings PLC was paid to John Keells Holdings PLC and not to individual Directors.
Directors’ RemunerationDetails of the remuneration and other benefits received by the Directors are
set out in Note 42.7 to the Financial Statements.
Related Party TransactionsThe Company’s transactions with Related Parties, given in Note 42 to the Financial Statements, have complied with Colombo Stock Exchange Listing Rule 9.3.2 and the Code of Best Practices on Related Party Transactions under the Securities and Exchange Commission Directive issued under Section 13(c) of the Securities and Exchange Commission Act.
Employee Share Option Plan (ESOP)At the beginning of the year, the employee share option plan consisted of the eighth and ninth plans approved by the shareholders on 28 June 2014 and 24 June 2016 respectively.
The Board of Directors of the Company also resolved to recommend to the shareholders, a tenth ESOP Plan (Plan 10), whereby the maximum number of options offered under the Plan will not exceed 1.50% of the total issued shares of the Company. From the total number of options offered under Plan 10, a maximum of 0.50% of the total issued shares may be offered every year, over three (3) years commencing in July 2019 and ending in June 2022. The proposed ESOP Plan is subject to the approval of the Colombo Stock Exchange and the shareholders of the Company at an extraordinary general meeting.
The Directors confirm that the Company has not granted any funding to employees to exercise options.
Details of the options granted, options exercised, the grant price and the options cancelled or lapsed and outstanding as at the date of the Directors’ Report, as required by the Listing Rules of the Colombo Stock Exchange, are given under the Share Information section of the Annual Report.
The highest, lowest and the closing prices of the Company shares were LKR. 164.80, LKR. 126.00 and LKR. 156.00, respectively.
The Group's compensation policyThe Group re-visited its long-term compensation philosophy based on feedback obtained from employees
210 JOHN KEELLS HOLDINGS PLC | ANNUAL REPORT 2018/19
ANNUAL REPORT OF THE BOARD OF DIRECTORS
through surveys and also a study conducted by an internationally renowned HR consulting firm on behalf of the Group. Based on the findings, the compensation and benefits schemes of the Group were revised to reflect the view that employee share option schemes are not as effective for middle level management where a higher proportion of cash compensation is preferred. This also aligns with the belief that employees at such levels have a relatively limited ability to influence the overall performance of the Group, although having a material impact on their own businesses. As such, going forward, the ESOP scheme would be applicable only for senior levels of management where the quantum granted each year will be proportionately revised downwards to reflect the changes stated above.
In order to align the interests of Group employees in the capacity of Vice President and above levels, the existing Short-Term Incentive plans were revised and a long- term cash- based incentive plan, linked to the 5 year strategic plans, was announced. Given that the members of the Group Executive Committee (GEC) are enablers of the operating model of the Group, the GEC was, by plan, excluded from the long-term cash based incentive scheme to better align their interest with shareholder interest.
EmploymentThe Group has an equal opportunity policy and these principles are enshrined in specific selection, training, development and promotion policies, ensuring that all decisions are based on merit. The Group practices equality of opportunity for all employees irrespective of ethnic origin, religion, political opinion, gender, marital status or physical disability. Employee ownership in the Company is facilitated through the employee share option plan.
During the year under review, the Group migrated to a state-of-the-art cloud based human resource information platform from the on-premise system used by the Group during the previous ten years. This platform will seamlessly manage the entire employee life cycle from recruitment and onboarding, to performance management and succession planning, compensation and learning and development, through to off-boarding.
Details of the Group’s human resource initiatives are detailed in the Human Capital section of the Capital Management Review section of the Annual Report.
The number of persons employed by the Company and Group as at 31 March 2019 was 195 (2018 - 180) and 14,280 (2018 – 13,619), respectively.
There have been no material issues pertaining to employees and industrial relations of the Company and the Group.
Supplier PolicyThe Group applies an overall policy of agreeing and clearly communicating the terms of payment as part of the commercial agreements negotiated with suppliers, and endeavours to pay for all items in accordance with these agreed terms. As at 31 March 2019, the trade and other payables of the Company and Group amounted to LKR. 347 Mn (2018 - LKR. 332 Mn) and LKR. 19,745 Mn (2018 - LKR. 16,077 Mn), respectively.
The Group strives to integrate principles of sustainable practices and policies in its value chain through extensive stakeholder consultations, the findings of which are integrated into work-plans. The entire sourcing process, from supplier identification to contracting, and supplier management for products and services was conducted through the electronic platform, during the year under review. This platform provided numerous benefits ranging from shortening of contracting life cycles, increased visibility of the sourcing process, accurate analytics and saving of paper.
Ratios and Market price informationThe ratios relating to equity, debt and market price information as required by the listing requirements of the Colombo Stock Exchange are given under the Share Information section of this report.
Corporate GovernanceThe Board of Directors is committed towards maintaining an effective Corporate Governance Framework by effectively implementing systems and structures required to ensuring best practices in Corporate Governance. The table from page 190 to 192 shows the manner in which the Company has complied
with Section 7.10 of the Listing Rules of the Colombo Stock Exchange (CSE) on Corporate Governance. The Corporate Governance Commentary is given from page 164 to 193.
Sustainability The Group pursues its business goals based on a model of stakeholder governance. Findings of the continuous internal stakeholder engagements have enabled the Group to focus on material issues such as the conservation of natural resources and the environment as well as material issues highlighted by other stakeholders such as employees, customers, suppliers and the community. These steps have been encapsulated in a Group-wide strategy focused on sustainable development which is continuously evolving based on the above mentioned stakeholder engagements.
This is the Group’s fourth Integrated Annual Report, which presents a comprehensive discussion on its financial and non-financial performance, in a bid to provide its stakeholders with holistic information relating to its value creation proposition through the six forms of capital reported under the International <IR> Framework. The Group has sought independent third-party assurance from DNV GL, represented in Sri Lanka by DNV Business Assurance Lanka (Pvt) Ltd, in relation to the non-financial information contained in this report. In addition, the report also adheres to the Global Reporting Initiative (GRI) Standards: Core option.
Research and DevelopmentThe Group has an active approach to research and development and recognises the contribution that it can make to intellectual property and the Group’s operations. Significant expenditure has taken place over the years and substantial efforts will continue to be made to introduce intellectual property rights, develop new products and processes and improve the operational efficiency of existing products and processes.
Environmental ProtectionThe Group complies with the relevant environmental laws, regulations and endeavours to comply with best practices applicable in the country of operation.
211
FINANCIAL STATEMENTS
Corporate Social Responsibility (CSR)The John Keells Foundation, which is funded by JKH and its subsidiaries, handles most of the Group’s CSR initiatives and activities. The Foundation manages a range of programmes that underpin its key principle of acting responsibly towards its stakeholders and to bring about sustainable development in the focus areas. The CSR initiatives, including completed and on-going projects, are detailed in the Group Consolidated Review section in the Annual Report.
In quantifying the Group’s contribution to CSR initiatives and activities, no account has been taken of in-house costs or management time.
DonationsTotal donations made by the Company and the Group during the year amounted to LKR. 0.5 Mn (2018 - LKR. 0.5 Mn) and LKR. 5 Mn (2018 - LKR. 8 Mn), respectively. These amounts do not include contributions on account of corporate social responsibility (CSR) initiatives.
Statutory Payments The Directors confirm that to the best of their knowledge, all taxes, duties and levies payable by the Company and its subsidiaries, all contributions, levies and taxes payable on behalf of, and in respect of, the employees of the Company and its subsidiaries, and all other known statutory dues as were due and payable by the Company and its subsidiaries as at the statement of financial position date have been paid or, where relevant, provided for, except as specified in Note 43 to the Financial Statements covering contingent liabilities.
Compliance with Laws and RegulationsTo the best of knowledge and belief of the Directors, the Company and the Group have not engaged in any activity, which contravenes laws and regulations of the country.
Enterprise Risk Management and Internal ControlsThe Board confirms that there is an ongoing process of identifying, evaluating and managing any significant risk faced by the Group, where annual risk reviews are carried out by the Enterprise Risk
Management Division and the risks are further reviewed each quarter by each business unit. The headline risks of each listed Company are presented by the Business Unit to its respective Audit Committee for review and in the case of John Keells Holdings PLC, by the Enterprise Risk Management Division to the John Keells Holdings PLC Audit Committee. The Corporate Governance section to this Report elaborates on these practices and the Group’s risk factors.
Internal Controls and AssuranceThe Board, through the involvement of the Group Business Process Review Division, takes steps to gain assurance on the effectiveness over the financial, operational and risk management control systems in place. The Audit Committee receives regular reports on the adequacy and effectiveness of internal controls in the Group, compliance with laws and regulations and established policies and procedures of the Group. The head of the Group Business Process Review Division has direct access to the Chairman of the Audit Committee. Reports of the outsourced internal auditors are also reviewed by the Committee.
Events After the Reporting PeriodThere have been no events subsequent to the reporting period, which would have any material effect on the Company or on the Group other than those disclosed in Note 47 to the Financial Statements.
Going ConcernThe Directors are satisfied that the Company, its subsidiaries, associates and joint ventures have adequate resources to continue in operational existence for the foreseeable future, to justify adopting the going concern basis in preparing these financial statements.
Appointment and Remuneration of Independent AuditorsMessrs. Ernst & Young, Chartered Accountants, are willing to continue as Auditors of the Company, and a resolution proposing their reappointment will be tabled at the Annual General Meeting.
The Independent Auditors’ Report is found in the Financial Statements section of the Annual Report.
The Audit Committee reviews the appointment of the Auditor, its effectiveness, its independence and its relationship with the Group, including the level of audit and non-audit fees paid to the Auditor.
The Group works with 3 firms of Chartered Accountants across the Group, namely, Ernst & Young, KPMG and PricewaterhouseCoopers. Details of audit fees are set out in Note 17 to the Financial Statements. The Auditors do not have any relationship (other than that of an Auditor) with the Company or any of its subsidiaries.
Further details on the work of the Auditor and the Audit Committee are set out in the Audit Committee Report.
Annual ReportThe Board of Directors approved the consolidated financial statements on 24 May 2019. The appropriate number of copies of this report will be submitted to the Colombo Stock Exchange and to the Sri Lanka Accounting and Auditing Standards Monitoring Board on 24 May 2019.
Annual General MeetingThe Annual General Meeting will be held at the Ceylon Chamber of Commerce, 50, Nawam Mawatha, Colombo 3, on Friday, 28 June 2019 at 10.00 a.m. The notice of meeting appears in the Supplementary Information section of the Annual Report.
This Annual Report is signed for and on behalf of the Board of Directors.
By Order of the Board
Director
Director
Keells Consultants (Pvt) Ltd.Secretaries24 May 2019
212 JOHN KEELLS HOLDINGS PLC | ANNUAL REPORT 2018/19
THE STATEMENT OF DIRECTORS’ RESPONSIBILITY
The responsibility of the Directors in relation to the financial statements is set out in the following statement. The responsibility of the auditors, in relation to the financial statements prepared in accordance with the provision of the Companies Act No. 7 of 2007, is set out in the Report of the Auditors.
The financial statements comprise of:
• income statement and statement of comprehensive income of the Company and its subsidiaries, which present a true and fair view of the financial performance of the Company and its subsidiaries for the financial year; and
• a statement of financial position, which presents a true and fair view of the state of affairs of the Company and its subsidiaries as at the end of the financial year: and
The Directors are required to confirm that the financial statements:
have been prepared:
• using appropriate accounting policies which have been selected and applied in a consistent manner, and material departures, if any, have been disclosed and explained; and
are
• presented in accordance with the Sri Lanka Accounting Standards (SLFRS/LKAS); and that reasonable and prudent judgments and estimates have been made so that the form and substance of transactions are properly reflected; and
• provide the information required by and otherwise comply with the Companies Act and the Listing Rules of the Colombo Stock Exchange.
The Directors are also required to ensure that the Company has adequate resources to continue in operation to justify applying the going concern basis in preparing these financial statements.
Further, the Directors have a responsibility to ensure that the Company maintains sufficient accounting records to disclose, with reasonable accuracy, the financial position of the Company and of the Group.
The Directors are also responsible for taking reasonable steps to safeguard the assets of the Company and of the Group and in this regard to give proper consideration to the establishment of appropriate internal control systems with a view to preventing and detecting fraud and other irregularities.
The Directors are required to prepare the financial statements and to provide the auditors with every opportunity to take whatever steps and undertake whatever inspections that may be considered being appropriate to enable them to give their audit opinion.
Further, as required by Section 56 (2) of the Companies Act No. 7 of 2007, the Board of Directors have confirmed that the Company, based on the information available, satisfies the solvency test immediately after the distribution, in accordance with Section 57 of the Companies Act No. 7 of 2007, and have obtained a certificate from the auditors, prior to declaring a final dividend of LKR. 1.00 per share for this year, to be paid on 14 June 2019.
The Directors are of the view that they have discharged their responsibilities as set out in this statement.
Compliance ReportThe Directors confirm that to the best of their knowledge, all taxes, duties and levies payable by the Company and its subsidiaries, all contributions, levies and taxes payable on behalf of and in respect of the employees of the Company and its subsidiaries, and all other known statutory dues as were due and payable by the Company and its subsidiaries as at the reporting date have been paid, or where relevant provided for, except as specified in Note 43 to the Financial Statements covering contingent liabilities.
By order of the Board
Keells Consultants (Pvt) Ltd.Secretaries24 May 2019
213
FINANCIAL STATEMENTS
INDEPENDENT AUDITORS’ REPORT
statements of the current period. These matters were addressed in the context of our audit of the financial statements as a whole, and in forming our opinion thereon, and we do not provide a separate opinion on these matters. For each matter below, our description of how our audit addressed the matter is provided in that context.
We have fulfilled the responsibilities described in the Auditor’s responsibilities for the audit of the financial statements section of our report, including in relation to these matters. Accordingly, our audit included the performance of procedures designed to respond to our assessment of the risks of material misstatement of the financial statements. The results of our audit procedures, including the procedures performed to address the matters below, provide the basis for our audit opinion on the accompanying financial statements.
INDEPENDENT AUDITORS’ REPORT TO THE SHAREHOLDERS OF JOHN KEELLS HOLDINGS PLC
Report on the audit of the Financial Statements
Opinion We have audited the financial statements of John Keells Holdings PLC (“the Company”) and the consolidated financial statements of the Company and its subsidiaries (“the Group”), which comprise the statement of financial position as at 31 March 2019, income statement and the statement of comprehensive income, statement of changes in equity and statement of cash flows for the year then ended, and notes to the financial statements, including a summary of significant accounting policies.
In our opinion, the accompanying financial statements of the Company and the Group give a true and fair view of the financial position of the Company and the Group as at 31 March 2019, and of their financial performance and cash flows for the year
then ended in accordance with Sri Lanka Accounting Standards.
Basis for opinionWe conducted our audit in accordance with Sri Lanka Auditing Standards (SLAuSs). Our responsibilities under those standards are further described in the Auditor’s responsibilities for the audit of the financial statements section of our report. We are independent of the Group in accordance with the Code of Ethics issued by CA Sri Lanka (Code of Ethics) and we have fulfilled our other ethical responsibilities in accordance with the Code of Ethics. We believe that the audit evidence we have obtained is sufficient and appropriate to provide a basis for our opinion.
Key audit mattersKey audit matters are those matters that, in our professional judgment, were of most significance in our audit of the financial
Key Audit Matter How our audit addressed the key audit matter
Valuation of land and buildings As at 31 March 2019, land and buildings (Including buildings on leasehold land) carried at fair value, classified as Property, Plant and Equipment and Investment Property amounted to LKR 75.95 Bn and LKR 13.99 Bn respectively. The fair value of such property was determined by external valuers engaged by the Group. The valuation of land and buildings was significant to our audit due to the use of significant estimates such as per perch price and value per square foot disclosed in notes 21.3 and 23 to the financial statements.
Our audit procedures focused on the valuations performed by external valuers engaged by the Group, and included the following;
• We assessed the competency, capability and objectivity of the external valuers engaged by the Group
• We read the external valuer’s report and understood the key estimates made and the approach taken by the valuers in determining the valuation of each property
• We engaged our internal specialised resources to assessing the reasonableness of the valuation technique, per perch price and value per square foot
• We have also assessed the adequacy of the disclosures made in note 21.3 and 23 to the financial statements relating to the valuation technique and estimates used by the external valuers.

214 JOHN KEELLS HOLDINGS PLC | ANNUAL REPORT 2018/19
INDEPENDENT AUDITORS’ REPORT
Key Audit Matter How our audit addressed the key audit matter
Insurance Contract LiabilitiesThe Group has significant insurance contract liabilities of LKR 32.8 Bn which represents 25% of the Group's total liabilities.
The valuation of the insurance contract liabilities in relation to the life business required the application of significant assumptions such as mortality, morbidity, lapses and surrenders, loss ratios, bonus and expenses and assessing the completeness and accuracy of the information used in the underlying valuations. Changes in such significant assumptions used in the valuation of the insurance contract liabilities directly impacts the change in insurance contract liabilities in the income statement.
Our audit procedures focused on the valuations performed by the external actuary engaged by the subsidiary company of the Group and included the following;
• We involved the component auditor of the subsidiary company to perform the audit procedures to assess the reasonableness of the assumptions and test the controls on a sample basis over the process of estimating the insurance contract liabilities.
• We engaged our internal expert to assess the reasonableness of the assumptions used in the valuations of the insurance contract liabilities
• We assessed the adequacy of the disclosures and the movement in the insurance contract liabilities.
Revenue RecognitionDuring the year, the Group adopted SLFRS 15 - Revenue from Contracts with Customers (the New Revenue Standard) which specifies how and when an entity should recognise revenue along with the need to provide users of financial statements with more informative, relevant disclosures.
Due to the Group’s involvement in diversified industries and wide spectrum of businesses such as Consumer Foods, Retail, Leisure, Property and Transportation, the Group was required to consider relevant clarifications and guidance specifically relating to point of revenue recognition i.e. at a point in time or over the period, agent vs principal relationships in adoption of the new revenue standard.
As more fully described in note 13 to the financial statements the process of adoption involved consideration of relevant legal aspects, industry practices, use of management critical judgments and estimates.
Considering all of the above matters, we determined the Group’s adoption of the New Revenue Standard during the current year audit as a key audit matter.
Our audit procedures focused on the Group’s adoption of the New Revenue Standard and included, amongst others, the following:
• We assessed the process followed by the Group to ensure all revenue streams are considered in its assessment and that the related contracts reviewed are representative of specified revenue streams & contractual terms.
• We perused Management’s correspondence with legal officers and other consultants to assess the reasonability of the final conclusions reached on matters such as point and amount of revenue recognition for adoption of the new revenue standard.
• We involved internal specialists in assessing the management's conclusions over revenue recognition relating to industry specific contractual terms/practices such as for Property, Retail sectors.
• We also assessed the adequacy of enhanced disclosures made in note 13 to the financial statements.
Other information included in the 2018/19 Annual ReportOther information consists of the information included in the Annual Report, other than the financial statements and our auditor’s report thereon. Management is responsible for the other information.
Our opinion on the financial statements does not cover the other information and we do not express any form of assurance conclusion thereon.
In connection with our audit of the financial statements, our responsibility is to read the other information and, in
doing so, consider whether the other information is materially inconsistent with the financial statements or our knowledge obtained in the audit or otherwise appears to be materially misstated. If, based on the work we have performed, we conclude that there is a material misstatement of this other information, we are required to report that fact. We have nothing to report in this regard.
Responsibilities of management and those charged with governance Management is responsible for the preparation of financial statements that give a true and fair view in accordance
with Sri Lanka Accounting Standards, and for such internal control as management determines is necessary to enable the preparation of financial statements that are free from material misstatement, whether due to fraud or error.
In preparing the financial statements, management is responsible for assessing the Group’s ability to continue as a going concern, disclosing, as applicable, matters related to going concern and using the going concern basis of accounting unless management either intends to liquidate the Group or to cease operations, or has no realistic alternative but to do so.

215
FINANCIAL STATEMENTS
Those charged with governance are responsible for overseeing the Company’s and the Group’s financial reporting process.
Auditor’s responsibilities for the audit of the financial statementsOur objectives are to obtain reasonable assurance about whether the financial statements as a whole are free from material misstatement, whether due to fraud or error, and to issue an auditor’s report that includes our opinion. Reasonable assurance is a high level of assurance, but is not a guarantee that an audit conducted in accordance with SLAuSs will always detect a material misstatement when it exists. Misstatements can arise from fraud or error and are considered material if, individually or in the aggregate, they could reasonably be expected to influence the economic decisions of users taken on the basis of these financial statements.
As part of an audit in accordance with SLAuSs, we exercise professional judgment and maintain professional skepticism throughout the audit. We also:
• Identify and assess the risks of material misstatement of the financial statements, whether due to fraud or error, design and perform audit procedures responsive to those risks, and obtain audit evidence that is sufficient and appropriate to provide a basis for our opinion. The risk of not detecting a material misstatement resulting from fraud is higher than for one resulting from error, as fraud may involve collusion, forgery, intentional omissions, misrepresentations, or the override of internal control.
• Obtain an understanding of internal control relevant to the audit in order to design audit procedures that are appropriate in the circumstances, but not for the purpose of expressing an opinion on the effectiveness of the internal controls of the Company and the Group.
• Evaluate the appropriateness of accounting policies used and the reasonableness of accounting estimates and related disclosures made by management.
• Conclude on the appropriateness of management’s use of the going concern basis of accounting and, based on the audit evidence obtained, whether a material uncertainty exists related to events or conditions that may cast significant doubt on the Group’s ability to continue as a going concern. If we conclude that a material uncertainty exists, we are required to draw attention in our auditor’s report to the related disclosures in the financial statements or, if such disclosures are inadequate, to modify our opinion. Our conclusions are based on the audit evidence obtained up to the date of our auditor’s report. However, future events or conditions may cause the Group to cease to continue as a going concern.
• Evaluate the overall presentation, structure and content of the financial statements, including the disclosures, and whether the financial statements represent the underlying transactions and events in a manner that achieves fair presentation.
• Obtain sufficient appropriate audit evidence regarding the financial information of the entities or business activities within the Group to express an opinion on the consolidated financial statements. We are responsible for the direction, supervision and performance of the Group audit. We remain solely responsible for our audit opinion.
We communicate with those charged with governance regarding, among other matters, the planned scope and timing of the audit and significant audit findings, including any significant deficiencies in internal control that we identify during our audit.
We also provide those charged with governance with a statement that we have complied with ethical requirements in accordance with the Code of Ethics regarding independence, and to communicate with them all relationships and other matters that may reasonably be thought to bear on our independence, and where applicable, related safeguards.
From the matters communicated with those charged with governance, we
determine those matters that were of most significance in the audit of the financial statements of the current period and are therefore the key audit matters. We describe these matters in our auditor’s report unless law or regulation precludes public disclosure about the matter or when, in extremely rare circumstances, we determine that a matter should not be communicated in our report because the adverse consequences of doing so would reasonably be expected to outweigh the public interest benefits of such communication.
Report on other legal and regulatory requirementsAs required by section 163 (2) of the Companies Act No. 07 of 2007, we have obtained all the information and explanations that were required for the audit and, as far as appears from our examination, proper accounting records have been kept by the Company.
CA Sri Lanka membership number of the engagement partner responsible for signing this independent auditor’s report is 2471.
24 May 2019Colombo

216 JOHN KEELLS HOLDINGS PLC | ANNUAL REPORT 2018/19
INCOME STATEMENT
GROUP COMPANY
For the year ended 31 March Note 2019 2018 2019 2018In LKR '000s
Continuing operations
Revenue from contracts with customers 124,818,922 111,343,239 1,721,687 1,347,707
Revenue from insurance contracts 10,637,226 9,871,833 - -
Total revenue 13 135,456,148 121,215,072 1,721,687 1,347,707
Cost of sales (107,668,833) (91,932,377) (839,306) (632,347)
Gross profit 27,787,315 29,282,695 882,381 715,360
Dividend income 14 - - 7,187,071 8,574,886
Other operating income 15.1 1,925,698 2,084,111 266,834 8,213,099
Selling and distribution expenses (5,939,294) (4,226,827) - -
Administrative expenses (12,411,130) (12,488,091) (1,263,484) (1,134,661)
Other operating expenses 15.2 (3,705,496) (3,190,163) (98,354) (72,925)
Results from operating activities 7,657,093 11,461,725 6,974,448 16,295,759
Finance cost 16 (2,722,289) (520,797) (184,544) (72,019)
Finance income 16 12,051,601 11,268,141 6,351,370 6,291,920
Change in insurance contract liabilities 35.2 (3,422,893) (2,449,379) - -
Change in contract liability due to transfer of one off surplus 35 - 3,381,934 - -
Change in fair value of investment property 23 324,653 896,380 - -
Share of results of equity accounted investees (net of tax) 26.3 4,727,345 3,596,430 - -
Profit before tax 17 18,615,510 27,634,434 13,141,274 22,515,660
Tax expense 20.1 (2,378,114) (4,514,629) (1,139,058) (1,293,431)
Profit for the year 16,237,396 23,119,805 12,002,216 21,222,229
Attributable to:
Equity holders of the parent 15,254,126 21,021,031
Non-controlling interests 983,270 2,098,774
16,237,396 23,119,805
LKR. LKR.
Earnings per share
Basic 18.1 11.13 15.15
Diluted 18.2 11.13 15.15
Dividend per share 19 6.00 6.00
Figures in brackets indicate deductions.The accounting policies and notes as set out in pages 224 to 302 form an integral part of these financial statements.

217
FINANCIAL STATEMENTS
STATEMENT OF COMPREHENSIVE INCOME
GROUP COMPANY
For the year ended 31 March Note 2019 2018 2019 2018In LKR '000s
Profit for the year 16,237,396 23,119,805 12,002,216 21,222,229
Other comprehensive income
Other comprehensive income to be reclassified to Income Statement in subsequent periods
Currency translation of foreign operations 6,133,985 1,101,842 - -
Net gain on cash flow hedges (169,713) 265,815 - -
Net gain/(loss) on financial instruments at fair value through other comprehensive income
(140,413) 731,605 - (66,510)
Share of other comprehensive income of equity accounted investees (net of tax)
839,565 511,589 - -
Net other comprehensive income to be reclassified to Income Statement in subsequent periods
6,663,424 2,610,851 - (66,510)
Other comprehensive income not to be reclassified to Income Statement in subsequent periods
Net gain / (loss) on equity instruments at fair value through other comprehensive income
(25,937) - (25,937) -
Revaluation of land and buildings 2,250,474 9,169,124 - -
Re-measurement gain / (loss) on defined benefit plans 37.2 29,050 (22,762) 994 (4,083)
Share of other comprehensive income of equity accounted investees (net of tax)
303,712 17,199 - -
Net other comprehensive income not to be reclassified to Income Statement in subsequent periods
2,557,299 9,163,561 (24,943) (4,083)
Tax on other comprehensive income 20.1 (405,806) (4,106,764) - -
Other comprehensive income for the period, net of tax 8,814,917 7,667,648 (24,943) (70,593)
Total comprehensive income for the period, net of tax 25,052,313 30,787,453 11,977,273 21,151,636
Attributable to :
Equity holders of the parent 23,207,536 28,618,650
Non-controlling interests 1,844,777 2,168,803
25,052,313 30,787,453
Figures in brackets indicate deductions.The accounting policies and notes as set out in pages 224 to 302 form an integral part of these financial statements.
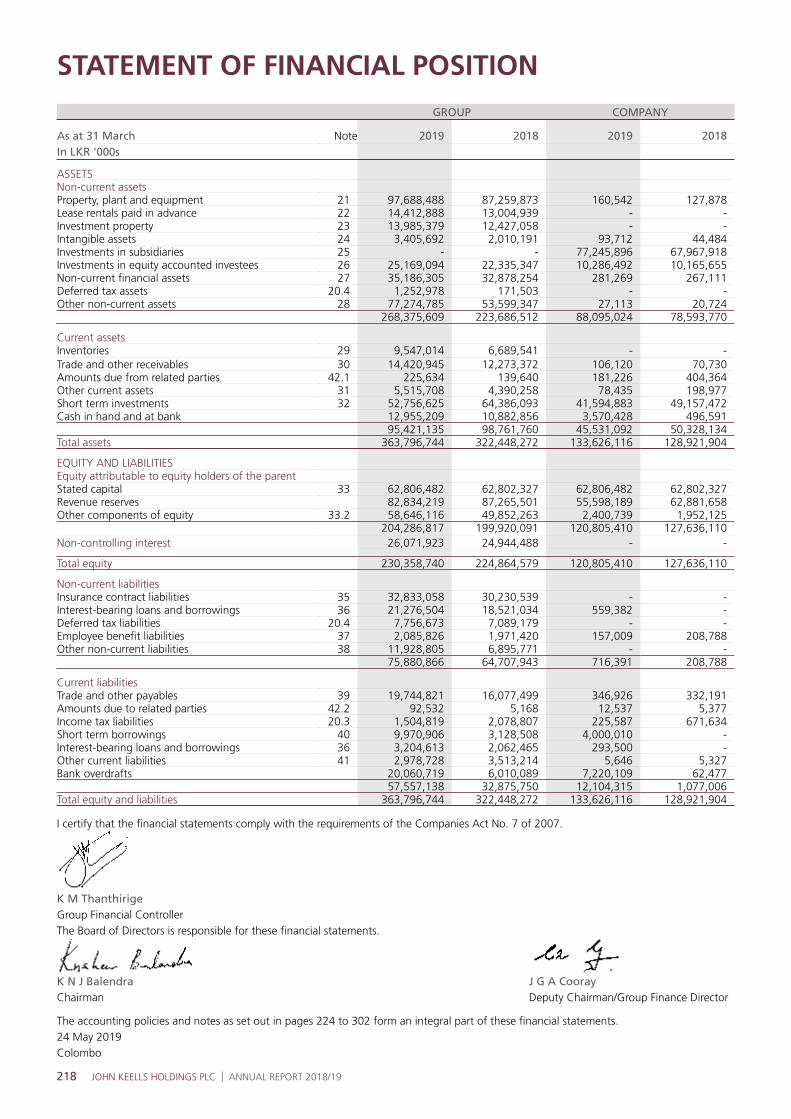
218 JOHN KEELLS HOLDINGS PLC | ANNUAL REPORT 2018/19
STATEMENT OF FINANCIAL POSITIONGROUP COMPANY
As at 31 March Note 2019 2018 2019 2018In LKR '000s
ASSETSNon-current assetsProperty, plant and equipment 21 97,688,488 87,259,873 160,542 127,878 Lease rentals paid in advance 22 14,412,888 13,004,939 - - Investment property 23 13,985,379 12,427,058 - - Intangible assets 24 3,405,692 2,010,191 93,712 44,484 Investments in subsidiaries 25 - - 77,245,896 67,967,918 Investments in equity accounted investees 26 25,169,094 22,335,347 10,286,492 10,165,655 Non-current financial assets 27 35,186,305 32,878,254 281,269 267,111 Deferred tax assets 20.4 1,252,978 171,503 - - Other non-current assets 28 77,274,785 53,599,347 27,113 20,724
268,375,609 223,686,512 88,095,024 78,593,770
Current assetsInventories 29 9,547,014 6,689,541 - - Trade and other receivables 30 14,420,945 12,273,372 106,120 70,730 Amounts due from related parties 42.1 225,634 139,640 181,226 404,364 Other current assets 31 5,515,708 4,390,258 78,435 198,977 Short term investments 32 52,756,625 64,386,093 41,594,883 49,157,472 Cash in hand and at bank 12,955,209 10,882,856 3,570,428 496,591
95,421,135 98,761,760 45,531,092 50,328,134 Total assets 363,796,744 322,448,272 133,626,116 128,921,904
EQUITY AND LIABILITIESEquity attributable to equity holders of the parentStated capital 33 62,806,482 62,802,327 62,806,482 62,802,327 Revenue reserves 82,834,219 87,265,501 55,598,189 62,881,658 Other components of equity 33.2 58,646,116 49,852,263 2,400,739 1,952,125
204,286,817 199,920,091 120,805,410 127,636,110 Non-controlling interest 26,071,923 24,944,488 - -
Total equity 230,358,740 224,864,579 120,805,410 127,636,110
Non-current liabilitiesInsurance contract liabilities 35 32,833,058 30,230,539 - - Interest-bearing loans and borrowings 36 21,276,504 18,521,034 559,382 - Deferred tax liabilities 20.4 7,756,673 7,089,179 - - Employee benefit liabilities 37 2,085,826 1,971,420 157,009 208,788 Other non-current liabilities 38 11,928,805 6,895,771 - -
75,880,866 64,707,943 716,391 208,788
Current liabilitiesTrade and other payables 39 19,744,821 16,077,499 346,926 332,191 Amounts due to related parties 42.2 92,532 5,168 12,537 5,377 Income tax liabilities 20.3 1,504,819 2,078,807 225,587 671,634 Short term borrowings 40 9,970,906 3,128,508 4,000,010 - Interest-bearing loans and borrowings 36 3,204,613 2,062,465 293,500 - Other current liabilities 41 2,978,728 3,513,214 5,646 5,327 Bank overdrafts 20,060,719 6,010,089 7,220,109 62,477
57,557,138 32,875,750 12,104,315 1,077,006 Total equity and liabilities 363,796,744 322,448,272 133,626,116 128,921,904
I certify that the financial statements comply with the requirements of the Companies Act No. 7 of 2007.
K M ThanthirigeGroup Financial ControllerThe Board of Directors is responsible for these financial statements.
K N J Balendra J G A CoorayChairman Deputy Chairman/Group Finance Director
The accounting policies and notes as set out in pages 224 to 302 form an integral part of these financial statements.24 May 2019Colombo

219
FINANCIAL STATEMENTS
STATEMENT OF CASH FLOWSGROUP COMPANY
For the year ended 31 March Note 2019 2018 2019 2018
In LKR '000s
CASH FLOWS FROM OPERATING ACTIVITIESProfit before working capital changes A 9,995,954 17,230,043 (140,535) (162,151)
(Increase) / Decrease in inventories (2,857,473) (1,083,829) - - (Increase) / Decrease in trade and other receivables 4,205,287 770,174 12,360 108,921 (Increase) / Decrease in other current assets (1,393,662) (1,160,879) 120,542 (99,535)(Increase) / Decrease in other non-current assets (23,675,438) (11,906,507) (6,389) (4,470)Increase / (Decrease) in trade, other payables and other non-current liabilities 8,787,720 4,070,175 6,611 (307,588)Increase / (Decrease) in other current liabilities (515,428) 578,591 319 (11,114)Increase / (Decrease) in insurance contract liabilities 2,602,519 (1,469,739) - - Cash generated from operations (2,850,521) 7,028,029 (7,092) (475,937)
Finance income received 12,051,601 11,069,018 4,298,933 5,338,590 Finance cost paid (1,598,646) (520,797) (190,040) (70,187)Dividend received 3,088,196 2,942,698 7,261,856 8,273,468 Tax paid (3,486,777) (4,204,461) (1,585,105) (1,257,330)Gratuity paid (334,143) (302,309) (106,622) (50,815)Net cash flows from operating activities 6,869,710 16,012,178 9,671,930 11,757,789
CASH FLOWS FROM/(USED IN) INVESTING ACTIVITIESPurchase and construction of property, plant and equipment (12,019,852) (10,319,886) (80,269) (85,673)Purchase of intangible assets 24 (1,809,775) (217,562) (62,190) (32,544)Addition to investment property 23 (1,233,668) (4,397,290) - - Purchase of lease rights 22 (582,176) - - - Acquisition of business, net of cash acquired - (78,584) - - Investment in equity accounted investee (420,561) (1,804,500) - - Investment in subsidiaries - - (1,222,611) -Increase in interest in subsidiaries - - (7,839,937) (17,366,523)Increase in interest in equity accounted investees - (1,629,147) - (1,131,089)Proceeds from sale of property, plant and equipment and intangible assets 222,749 262,819 206 19,507 Proceeds from sale of non-current investments - 285,114 301,474 874,690 Proceeds from sale of financial instruments - fair valued through profit or loss 535,147 944,936 - - Purchase of financial instruments - fair valued through profit or loss (637,994) (1,128,585) - - (Purchase) / Disposal of short term investments (net) 7,877,555 5,871,794 9,355,139 5,421,442 (Purchase) / Disposal of non-current financial assets (net) (2,510,360) (4,462,133) (54,085) (7,871)Grants received for investing activities - 32,560 - - Net cash flows from/(used in) investing activities (10,578,935) (16,640,464) 397,727 (12,308,061)
CASH FLOWS FROM/(USED IN) FINANCING ACTIVITIESProceeds from issue of shares 3,077 9,016 3,077 9,016 Repurchase of shares (11,100,229) - (11,100,229) -Changes in non-controlling interest 310,554 (173,574) - -Dividend paid to equity holders of parent (8,186,450) (8,324,983) (8,186,450) (8,324,983)Dividend paid to shareholders with non-controlling interest (732,298) (882,760) - - Proceeds from long term borrowings 36.1 3,797,498 5,832,308 898,125 - Repayment of long term borrowings (1,934,720) (2,795,723) (24,458) - Proceeds from (repayment of) other financial liabilities (net) 6,842,398 1,748,270 4,000,010 - Net cash flows from / (used in) financing activities (11,000,170) (4,587,446) (14,409,925) (8,315,967)
NET INCREASE / (DECREASE) IN CASH AND CASH EQUIVALENTS (14,709,395) (5,215,732) (4,340,268) (8,866,239)
CASH AND CASH EQUIVALENTS AT THE BEGINNING 42,427,873 47,643,605 31,122,950 39,989,189
CASH AND CASH EQUIVALENTS AT THE END 27,718,478 42,427,873 26,782,682 31,122,950
ANALYSIS OF CASH AND CASH EQUIVALENTSFavourable balancesShort term investments (less than 3 months) 32 34,823,988 37,555,106 30,432,363 30,688,836 Cash in hand and at bank 12,955,209 10,882,856 3,570,428 496,591 Unfavourable balancesBank overdrafts (20,060,719) (6,010,089) (7,220,109) (62,477)Total cash and cash equivalents 27,718,478 42,427,873 26,782,682 31,122,950
Cash and cash equivalents in the statement of cash flows, consist of cash in hand, cash at banks and short term deposits with a maturity of three months or less, net of outstanding bank overdrafts.
Figures in brackets indicate deductions.
The accounting policies and notes as set out in pages 224 to 302 form an integral part of these financial statements

220 JOHN KEELLS HOLDINGS PLC | ANNUAL REPORT 2018/19
STATEMENT OF CHANGES IN EQUITY
STATEMENT OF CASH FLOWS
GROUP COMPANY
For the year ended 31 March Note 2019 2018 2019 2018
In LKR '000s
A Profit before working capital changes Profit before tax 18,615,510 27,634,434 13,141,274 22,515,660 Adjustments for:
Finance income (12,051,601) (11,268,141) (6,351,370) (6,291,920) Dividend income - - (7,187,071) (8,574,886)
Finance costs 2,722,289 520,797 184,544 72,019 Share based payment expense 34 475,629 517,374 144,665 170,759 Change in fair value of investment property 23 (324,653) (896,380) - - Share of results of equity accounted investees 26.3 (4,727,345) (3,596,430) - - Profit on sale of non-current investments 15.1 - (28,575) (234,845) (8,183,167) Depreciation of property, plant and equipment 21.1, 21.2 3,657,780 3,236,226 36,870 32,555 Provision for impairment losses 15.2 174,700 23,445 46,600 40,712 (Profit) / loss on sale of property, plant and equipment and
intangible assets15.1, 15.2 58,546 (67,475) 9,999 (354)
Amortisation of lease rental paid in advance 22.1 478,292 458,459 - - Amortisation of intangible assets 24 415,951 325,531 12,962 18,861 Amortisation of other deferred liabilities - (1,805) - - Employee benefit provision and related costs 477,599 371,908 55,837 37,610 Accumulated unrecognised (gain)/loss (net) - (31,392) - - Unrealised (gain) / loss on foreign exchange (net) 23,257 32,067 - -
9,995,954 17,230,043 (140,535) (162,151)
COMPANY
In LKR '000s
Statedcapital
Othercapital reserve
Fair value reserveof financial assets
at FVOCI*
Revenuereserve
Totalequity
As at 1 April 2017 62,790,080 1,402,656 102,220 49,988,495 114,283,451
Profit for the year - - - 21,222,229 21,222,229 Other comprehensive income - - (66,510) (4,083) (70,593)Total comprehensive income - - (66,510) 21,218,146 21,151,636 Exercise of share options 9,016 - - - 9,016 Share based payments 3,231 513,759 - - 516,990 Final dividend paid - 2016/17 - - - (2,774,934) (2,774,934)Interim dividends paid - 2017/18 - - - (5,550,049) (5,550,049)As at 31 March 2018 62,802,327 1,916,415 35,710 62,881,658 127,636,110
Profit for the year - - - 12,002,216 12,002,216 Other comprehensive income - - (25,937) 994 (24,943)Total comprehensive income - - (25,937) 12,003,210 11,977,273 Exercise of share options 3,077 - - - 3,077 Share repurchase - 2018/19 - - - (11,100,229) (11,100,229)Share based payments 1,078 474,551 - - 475,629 Final dividend paid - 2017/18 - - - (2,775,057) (2,775,057)Interim dividends paid - 2018/19 - - - (5,411,393) (5,411,393)As at 31 March 2019 62,806,482 2,390,966 9,773 55,598,189 120,805,410
* Fair value through other comprehensive incomeFigures in brackets indicate deductions. The accounting policies and notes as set out in pages 224 to 302 form an integral part of these financial statements.
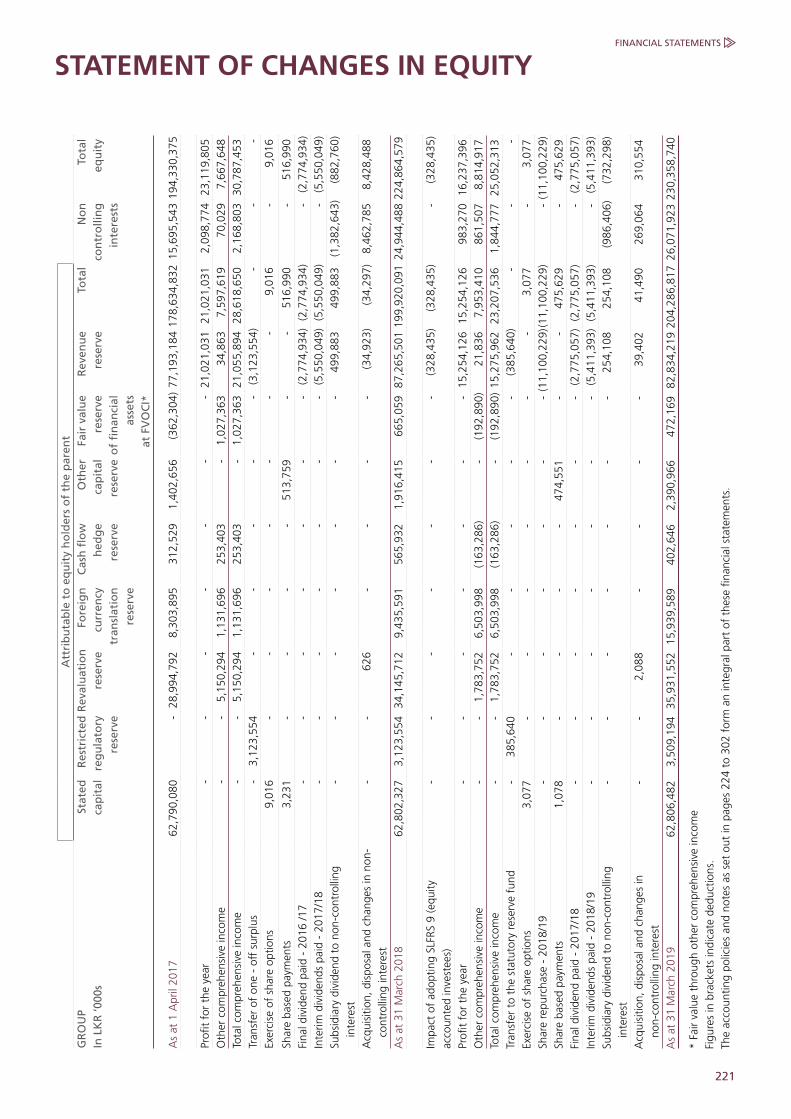
221
FINANCIAL STATEMENTS
STATEMENT OF CHANGES IN EQUITYA
ttri
bu
tab
le t
o e
qu
ity
ho
lder
s o
f th
e p
aren
tG
RO
UP
In L
KR
‘000
sSt
ated
cap
ital
R
estr
icte
d
reg
ula
tory
rese
rve
Rev
alu
atio
nre
serv
eFo
reig
ncu
rren
cytr
ansl
atio
nre
serv
e
Cas
h fl
ow
h
edg
e r
eser
ve
Oth
erca
pit
alre
serv
e
Fai
r va
lue
rese
rve
of
fin
anci
al
asse
tsat
FV
OC
I*
Rev
enu
e r
eser
veTo
tal
No
nco
ntr
olli
ng
inte
rest
s
Tota
leq
uit
y
As
at 1
Apr
il 20
17 6
2,79
0,08
0 -
28
,994
,792
8
,303
,895
3
12,5
29
1,4
02,6
56
(362
,304
) 77
,193
,184
178
,634
,832
15,
695,
543
194,
330,
375
Profi
t fo
r th
e ye
ar
-
-
-
-
-
-
-
21,0
21,0
31
21,0
21,0
31
2,0
98,7
74
23,1
19,8
05
Oth
er c
ompr
ehen
sive
inco
me
-
-
5,15
0,29
4 1
,131
,696
2
53,4
03
-
1,0
27,3
63
34,8
63 7
,597
,619
70,0
297,
667,
648
Tota
l com
preh
ensi
ve in
com
e -
-
5,
150,
294
1,1
31,6
96
253
,403
-
1
,027
,363
21
,055
,894
28
,618
,650
2
,168
,803
30,
787,
453
Tran
sfer
of
one
- of
f su
rplu
s -
3
,123
,554
-
-
-
-
-
(3
,123
,554
) -
-
-
Ex
erci
se o
f sh
are
optio
ns 9
,016
-
-
-
-
-
-
-
9
,016
-
9
,016
Shar
e ba
sed
paym
ents
3,2
31
-
-
-
-
513
,759
-
-
5
16,9
90
-
516
,990
Fi
nal d
ivid
end
paid
- 2
016
/17
-
-
-
-
-
-
-
(2,7
74,9
34)
(2,7
74,9
34)
-
(2,7
74,9
34)
Inte
rim d
ivid
ends
pai
d -
2017
/18
-
-
-
-
-
-
-
(5,5
50,0
49)
(5,5
50,0
49)
-
(5,5
50,0
49)
Subs
idia
ry d
ivid
end
to n
on-c
ontr
ollin
g in
tere
st
-
-
-
-
-
-
-
499
,883
4
99,8
83
(1,3
82,6
43)
(882
,760
)
Acq
uisi
tion,
dis
posa
l and
cha
nges
in n
on-
cont
rolli
ng in
tere
st -
-
6
26
-
-
-
-
(34,
923)
(34,
297)
8,4
62,7
85
8,4
28,4
88
As
at 3
1 M
arch
201
8 6
2,80
2,32
7 3
,123
,554
34
,145
,712
9,4
35,5
91
565
,932
1
,916
,415
6
65,0
59
87,2
65,5
01 1
99,9
20,0
91 2
4,94
4,48
822
4,86
4,57
9
Impa
ct o
f ad
optin
g SL
FRS
9 (e
quity
ac
coun
ted
inve
stee
s)-
--
--
- -
(3
28,4
35)
(328
,435
) -
(3
28,4
35)
Profi
t fo
r th
e ye
ar -
-
-
-
-
-
-
15
,254
,126
15
,254
,126
9
83,2
70
16,2
37,3
96
Oth
er c
ompr
ehen
sive
inco
me
-
-
1,7
83,7
52 6
,503
,998
(1
63,2
86)
-
(192
,890
) 2
1,83
6 7
,953
,410
8
61,5
07
8,8
14,9
17
Tota
l com
preh
ensi
ve in
com
e -
-
1
,783
,752
6,5
03,9
98
(163
,286
) -
(1
92,8
90)
15,2
75,9
62
23,2
07,5
36
1,8
44,7
77
25,0
52,3
13
Tran
sfer
to
the
stat
utor
y re
serv
e fu
nd-
385
,640
-
-
-
-
-
(385
,640
) -
-
-
Exer
cise
of
shar
e op
tions
3,0
77
-
-
-
-
-
-
-
3,0
77
-
3,0
77
Shar
e re
purc
hase
- 2
018/
19 -
-
-
-
-
-
-
(11
,100
,229
)(11
,100
,229
) -
(11
,100
,229
)Sh
are
base
d pa
ymen
ts 1
,078
-
-
-
-
4
74,5
51
-
-
475
,629
-
4
75,6
29
Fina
l div
iden
d pa
id -
201
7/18
-
-
-
-
-
-
-
(2,7
75,0
57)
(2,7
75,0
57)
-
(2,7
75,0
57)
Inte
rim d
ivid
ends
pai
d -
2018
/19
-
-
-
-
-
-
-
(5,4
11,3
93)
(5,4
11,3
93)
-
(5,4
11,3
93)
Subs
idia
ry d
ivid
end
to n
on-c
ontr
ollin
g in
tere
st -
-
-
-
-
-
-
2
54,1
08
254
,108
(9
86,4
06)
(732
,298
)
Acq
uisi
tion,
dis
posa
l and
cha
nges
in
non-
cont
rolli
ng in
tere
st -
-
2
,088
-
-
-
-
3
9,40
2 4
1,49
0 2
69,0
64
310
,554
As
at 3
1 M
arch
201
9 6
2,80
6,48
2 3
,509
,194
35
,931
,552
15
,939
,589
4
02,6
46
2,3
90,9
66
472,
169
82,
834,
219
204,
286,
817
26,
071,
923
230,
358,
740
* Fa
ir va
lue
thro
ugh
othe
r co
mpr
ehen
sive
inco
me
Figu
res
in b
rack
ets
indi
cate
ded
uctio
ns.
The
acco
untin
g po
licie
s an
d no
tes
as s
et o
ut in
pag
es 2
24 t
o 30
2 fo
rm a
n in
tegr
al p
art
of t
hese
fina
ncia
l sta
tem
ents
.

222 JOHN KEELLS HOLDINGS PLC | ANNUAL REPORT 2018/19
FINANCIAL HIGHLIGHTS
41%
18%
2018/192018/19 39%
21%
14%
26%
2017/182017/18
90
115
140
LKR. BnLKR. Bn
9294
106
121
135
Group Revenue (%) Group Revenue (%)
12%Revenue
LKR. 135 Bn
23%
14%10%
16%
37% 2018/192018/19
28%
15%
14%
12%
31%
2017/182017/18
1.0
15.5
30.0
LKR. BnLKR. Bn
19 19
23
28
19
Group Profit Before Tax (%) Group Profit Before Tax (%)
-33%Profit before tax
LKR. 19 Bn
31%
22%15%
32%
2018/192018/19
29%
23%
33%
15%
2017/182017/18
200
300
400
LKR. BnLKR. Bn
218
240
277
322
364
Group Total Assets (%) Group Total Assets (%)
13%Total Assets
LKR. 364 Bn
27%
24%
2018/192018/19
25%
15%
12%
15%
%
2017/182017/18
60
100
140
LKR. BnLKR. Bn
14/15
68
73
83
98
134
15/16 16/17 17/18 18/19
14/15 15/16 16/17 17/18 18/19
14/15 15/16 16/17 17/18 18/19
14/15 15/16 16/17 17/18 18/19
Group Total Liabilities (%) Group Total Liabilities (%)
37%Total Liabilities
LKR. 134 Bn
Transportation Financial services Leisure
Consumer Foods Remaining segments
33%
14%
20%
15%
Financial services Property Retail
Leisure Remaining segments
Retail Leisure Transportation Remaining segments
Property Leisure Financial services Remaining segments
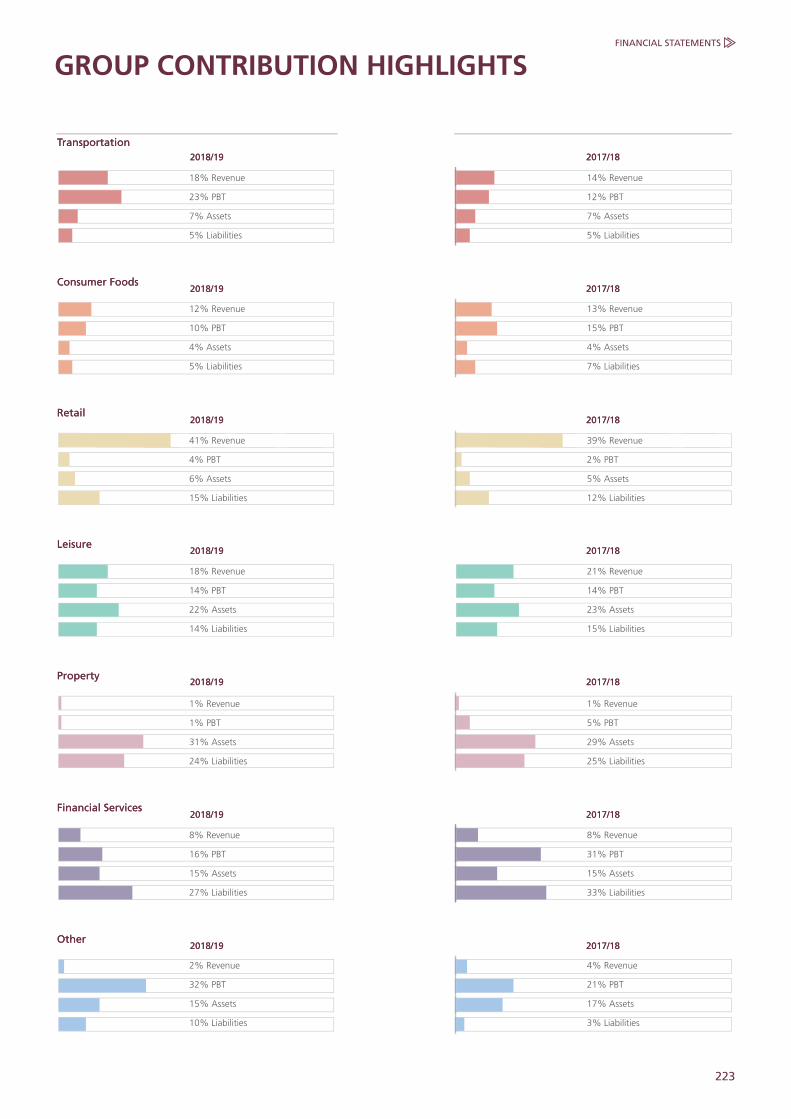
223
FINANCIAL STATEMENTS
GROUP CONTRIBUTION HIGHLIGHTS
2018/192018/19
TransportationTransportation
Consumer FoodsConsumer Foods
RetailRetail
LeisureLeisure
PropertyProperty
Financial ServicesFinancial Services
OtherOther
18% Revenue
23% PBT
7% Assets
5% Liabilities
12% Revenue
10% PBT
4% Assets
5% Liabilities
41% Revenue
4% PBT
6% Assets
15% Liabilities
18% Revenue
14% PBT
22% Assets
14% Liabilities
1% Revenue
1% PBT
31% Assets
24% Liabilities
8% Revenue
16% PBT
15% Assets
27% Liabilities
2% Revenue
32% PBT
15% Assets
10% Liabilities
2017/182017/18
14% Revenue
12% PBT
7% Assets
5% Liabilities
13% Revenue
15% PBT
4% Assets
7% Liabilities
39% Revenue
2% PBT
5% Assets
12% Liabilities
21% Revenue
14% PBT
23% Assets
15% Liabilities
1% Revenue
5% PBT
29% Assets
25% Liabilities
8% Revenue
31% PBT
15% Assets
33% Liabilities
4% Revenue
21% PBT
17% Assets
3% Liabilities
2018/192018/19 2017/182017/18
2018/192018/19 2017/182017/18
2018/192018/19 2017/182017/18
2018/192018/19 2017/182017/18
2018/192018/19 2017/182017/18
2018/192018/19 2017/182017/18
224 JOHN KEELLS HOLDINGS PLC | ANNUAL REPORT 2018/19
NOTES TO THE FINANCIAL STATEMENTS
CORPORATE AND GROUP INFORMATION 1. Corporate information Reporting entityJohn Keells Holdings PLC is a public limited liability company incorporated and domiciled in Sri Lanka. The registered office and principal place of business of the Company is located at No. 117, Sir Chittampalam A Gardiner Mawatha, Colombo 2.
Ordinary shares of the Company are listed on the Colombo Stock Exchange. Global depository receipts (GDRs) of John Keells Holdings PLC are listed on the Luxembourg Stock Exchange.
John Keells Holdings PLC became the holding company of the Group during the financial year ended 31 March 1986.
Consolidated financial statementsThe financial statements for the year ended 31 March 2019, comprise of “the Company” referring to John Keells Holdings PLC as the holding Company and “the Group” referring to the companies that have been consolidated therein.
Approval of financial statementsThe financial statements for the year ended 31 March 2019 were authorised for issue by the Board of Directors on 24 May 2019.
Principal activities and nature of operations of the holding CompanyJohn Keells Holdings PLC, the Group’s holding company, manages a portfolio of investments consisting of a range of diverse business operations, which together constitute the John Keells Group, and provides function based services to its subsidiaries, jointly controlled entities and associates.
Responsibility for financial statementsThe responsibility of the Board of Directors in relation to the financial statements is set out in the Statement of Directors’ Responsibility report in the Annual report.
Statements of complianceThe financial statements which comprise of the income statement, statement of comprehensive income, statement of financial position, statement of changes in equity and the statement of cash flows, together with the accounting policies and notes have been prepared in accordance with Sri Lanka Accounting Standards (SLFRS/ LKAS) as issued by the Institute of Chartered Accountants of Sri Lanka (CA Sri Lanka) and in compliance with the Companies Act No. 7 of 2007.
2. Group information Subsidiaries , associates and joint venturesThe companies within the Group and its business activities are described in the Group Directory under the Supplementary Information section of the Annual Report.
There were no significant changes in the nature of the principal activities of the Company and the Group during the financial year under review.
BASIS OF PREPARATION AND OTHER SIGNIFICANT ACCOUNTING POLICIES3. Basis of preparation The consolidated financial statements have been prepared on an accrual basis and under the historical cost convention except for investment properties, land and buildings, derivative financial instruments, fair value through profit or loss financial assets and fair value through other comprehensive income financial assets that have been measured at fair value.
Presentation of functional currencyThe consolidated financial statements are presented in Sri Lankan Rupees (LKR.), which is the currency in the primary economic environment in which the holding Company operates.
The following subsidiaries are using functional currencies other than Sri Lankan Rupees (LKR.).
Country of incorporation
Functional Currency
Name of the Subsidiary
India Indian Rupee (INR)
Serene Holidays (Pvt) Ltd.
Singapore Singapore Dollar (SGD)
John Keells Singapore (Pte) Ltd.
Republic of Maldives
United States Dollar (USD)
Fantasea World Investments (Pte) Ltd.
John Keells Maldivian Resort (Pte) Ltd.
Mack Air Services Maldives (Pte) Ltd.
Tranquility (Pte) Ltd.
Travel Club (Pte) Ltd.
Mauritius United States Dollar (USD)
John Keells BPO Holdings (Pvt) Ltd.
John Keells BPO International (Pvt) Ltd.
Sri Lanka United States Dollar (USD)
Waterfront Properties (Pvt) Ltd.
Each material class of similar items is presented cumulatively in the Financial Statements. Items of dissimilar nature or function are presented separately unless they are immaterial as permitted by the Sri Lanka Accounting Standard-LKAS 1 on ‘Presentation of Financial Statements’.
All values are rounded to the nearest Sri Lankan Rupees thousand (LKR. ’000) except when otherwise indicated.
The significant accounting policies are discussed with relevant individual notes.
The indicative US Dollar financial statements under Supplementary Information section of the Annual Report do not form a part of the financial statements prepared in accordance with SLFRS/LKAS.
Comparative informationThe presentation and classification of the financial statements of the previous years have been amended, where relevant for better presentation and to be comparable with those of the current year.
225
FINANCIAL STATEMENTS
Amendments to the financial statements due to changes in accounting standards are discussed in Note 6.
4. Summary of significant accounting policies Summary of significant accounting policies have been disclosed along with the relevant individual notes in the subsequent pages.
Those accounting policies presented with each note, have been applied consistently by the Group.
Other significant accounting policies not disclosed with individual notes.Following accounting policies, which have been applied consistently by the Group, are considered to be significant but not covered in any other sections
Current versus non-current classification The Group presents assets and liabilities in statement of financial position based on current/non-current classification.
An asset is current when it is:
• Expected to be realised or intended to be sold or consumed in the normal operating cycle
• Held primarily for the purpose of trading
• Expected to be realised within twelve months after the reporting period, or
• Cash or cash equivalent unless restricted from being exchanged or used to settle a liability for at least twelve months after the reporting period.
All other assets are classified as non-current.
A liability is current when it is:
• Expected to be settled in the normal operating cycle
• Held primarily for the purpose of trading
• Due to be settled within twelve months after the reporting period, or
• There is no unconditional right to defer the settlement of the liability for at least twelve months after the reporting period.
All other liabilities are classified as non-current.
Deferred tax assets and liabilities are classified as non-current assets and liabilities.
Foreign currency translation, foreign currency transactions and balancesThe consolidated financial statements are presented in Sri Lankan Rupees (LKR.), which is the Company’s functional and presentation currency. The functional currency is the currency of the primary economic environment in which the entities of the Group operate. All foreign exchange transactions are converted to functional currency, at the rates of exchange prevailing at the time the transactions are effected. Monetary assets and liabilities denominated in foreign currency are retranslated to functional currency equivalents at the spot exchange rate prevailing at the reporting date.
Non-monetary items that are measured in terms of historical cost in a foreign currency are translated using the exchange rates as at the dates of the initial transactions. Non-monetary assets and liabilities are translated using exchange rates that existed when the values were determined. The gain or loss arising on translation of non-monetary items is treated in line with the recognition of gain or loss of the item.
Foreign operationsThe statement of financial position and income statement of overseas subsidiaries, joint ventures and associates which are deemed to be foreign operations are translated to Sri Lankan Rupees at the rate of exchange prevailing as at the reporting date and at the average annual rate of exchange for the period respectively.
The exchange differences arising on the translation are taken directly to other comprehensive income. On disposal of a foreign entity, the deferred cumulative amount recognised in other comprehensive income relating to that particular foreign operation is recognised in the income statement.
The Group treated goodwill and any fair value adjustments to the carrying amounts of assets and liabilities arising on the acquisition as assets and liabilities of the parent. Therefore, those assets and liabilities are non-monetary items already expressed in the functional currency of the parent and no further translation differences occur.
5. Significant accounting judgements, estimates and assumptions
The preparation of the financial statements of the Group require the management to make judgements, estimates and assumptions, which may affect the amounts of income, expenditure, assets, liabilities and the disclosure of contingent liabilities, at the end of the reporting period.
Uncertainty about these assumptions and estimates could result in outcomes that require a material adjustment to the carrying amount of assets or liabilities affected in future periods. In the process of applying the Group’s accounting policies, management has made various judgements. Those which management has assessed to have the most significant effect on the amounts recognised in the consolidated financial statements have been discussed in the individual notes of the related financial statement line items.
The key assumptions concerning the future and other key sources of estimating uncertainty at the reporting date, that have a significant risk of causing a material adjustment to the carrying amounts of assets and liabilities within the next financial year, are also described in the individual notes to the financial statements. The Group based its assumptions and estimates on parameters available when the financial statements were prepared. Existing circumstances and assumptions about future developments, however, may change due to market changes or circumstances arising that are beyond the control of the Group. Such changes are reflected in the assumptions when they occur.

226 JOHN KEELLS HOLDINGS PLC | ANNUAL REPORT 2018/19
NOTES TO THE FINANCIAL STATEMENTS
The line items which have most significant effect on accounting judgements, estimate and assumptions are as follows;
a) Valuation of land and buildings and investment property
b) Impairment of non-financial assets
c) Share based payments
d) Taxes
e) Employee benefit liability
f) Valuation of insurance contract liabilities
g) Provision for expected credit losses of trade receivables and contract assets
6. Changes in accounting standards and standards issued but not yet effective
6.1 Changes in accounting standardThe Group applied SLFRS 15 and SLFRS 9 for the first time. The nature and effect of the changes as a result of the adoption of these new accounting standards are described below.
There are other amendments and interpretations applied for the first time in 2018/19 financial year, which do not have a significant impact on the consolidated financial statements of the Group. The Group has not early adopted any standards, interpretations or amendments that have been issued but are not yet effective.
SLFRS 15 Revenue from Contracts with CustomersSLFRS 15 supersedes LKAS 11 Construction Contracts, LKAS 18 Revenue and related Interpretations and it applies to all revenue arising from contracts with customers, unless those contracts are in the scope of other standards. The new standard establishes a five-step model to account for revenue arising from contracts with customers. Under SLFRS 15, revenue is recognised at an amount that reflects the consideration to which an entity expects to be entitled in exchange for transferring goods or services to a customer.
The standard requires entities to exercise judgement, taking into consideration all of the relevant facts and circumstances when applying each step of the model to contracts with their customers. The standard also specifies the accounting for the incremental costs of obtaining a contract and the costs directly related to fulfilling a contract.
The Group adopted SLFRS 15 using the full retrospective method of adoption. Based on the impact assessment performed, the Group concluded that SLFRS 15 does not have a material impact on the Group's consolidated financial statements.
SLFRS 9 Financial InstrumentsSLFRS 9 Financial Instruments replaces LKAS 39 Financial Instruments: Recognition and Measurement, bringing together all three aspects of accounting for financial instruments which are classification and measurement, impairment and hedge accounting.
With the exception of hedge accounting, which the Group applied prospectively, the Group has applied SLFRS 9 retrospectively, with the initial application date of 1 April 2018. The Group has taken an exception not to restate comparative information for prior periods with respect to classification and measurement requirements.
6.2 Standards issued but not yet effectiveThe following SLFRS has been issued by the Institute of Chartered Accountants of Sri Lanka, effective in the future and therefore has not been applied in preparing these financial statements. This SLFRS will have an effect on the accounting policies currently adopted by the Group and may have an impact on the future financial statements.
The Group intends to adopt this standard, if applicable, when it becomes effective.
Accounting Standard Summary of the Requirements Possible Impact on Consolidated Financial Statements
SLFRS 16 - Leases
[Effective on or after 1 January 2019 (early adoption permitted)]
SLFRS 16 sets out the principles for the recognition, measurement, presentation and disclosure of leases and requires lessees to account for all leases under a single on-balance sheet model similar to the accounting for finance leases under LKAS 17. It will result in almost all leases being recognised on the statement of financial position by lessees, as the distinction between operating and finance leases is removed. Under the new standard, an asset (the right to use the leased item) and a financial liability to pay rentals are recognised. The only exceptions are short-term and low-value leases.
The Group will apply the standard from its mandatory adoption date which financial reporting period starting from 1 April 2019. The Group intends to apply the simplified transition approach and will not restate comparative amounts for the year prior to first adoption. The standard will affect primarily the accounting for the Group’s operating leases and lease commitments. The Group will elect to apply the standard to contracts that were previously identified as leases applying LKAS 17 and IFRIC 4. The Group will elect to use the exemptions applicable to the standard on lease contracts for which the lease terms end within 12 months as of the date of initial application, and lease contracts for which the underlying asset is of low value. The Group has rent agreements with several parties where the lease term ends within 12 months.
5. Significant accounting judgements, estimates and assumptions (Contd.)

227
FINANCIAL STATEMENTS
The following amendments and improvements are not expected to have a significant impact on the Group’s financial statements• Revised Conceptual Framework for Financial Reporting
• Presentation of Financial Statements & Accounting Policies and Changes in Accounting Estimates and Errors (Amendments to LKAS 1 & LKAS 8)
• Improving the definition of a business (amendments to SLFRS 3)
• Annual Improvements Cycle - 2015-2017
• IFRIC Interpretation 23 Uncertainty over Income Tax Treatment
• Sale or Contribution of Assets between an Investor and its Associate or Joint Venture (Amendments to SLFRS 10 and LKAS 28)
• Plan Amendment, Curtailment or Settlement (Amendments to LKAS 19)
Accounting Standard Summary of the Requirements Possible Impact on Consolidated Financial Statements
The objective is to ensure that lessees and lessors provide relevant information in a manner that faithfully represents those transactions. This information gives a basis for the users of financial statements to assess the effect that leases have on the financial position.
Right-of-use assets for property leases will be measured on transition as if the new rules had always been applied. All other right-of-use assets will be measured at the amount of the lease liability on adoption (adjusted for any prepaid or accrued lease expenses).
The Group has performed a detailed impact assessment of SLFRS 16 as at the reporting date.
Assets LKR '000
Right-of-use assets 26,245,373
Lease rentals paid in advance (12,979,597)
Liabilities
Lease liabilities 13,265,776
Net impact to equity Nil
The Group expects that net profit after tax will decrease by approximately LKR. 351 Mn for 2019/20 financial year as a result of adopting the new rules. EBITDA used to measure segment results is expected to increase by approximately LKR. 2,156 Mn, as the operating lease payments were part of EBITDA, but the amortisation of the right-of-use assets and interest on the lease liability will be excluded from this measure in the future.
Operating cash flows will increase and financing cash flows decrease by approximately LKR. 1,165 Mn as repayment of the principal portion of the lease liabilities will be classified as cash flows from financing activities. The Group’s activities as a lessor are not material and hence the Group does not expect any significant impact on the financial statements.
GROUP BUSINESS, OPERATIONS AND MANAGEMENT7. Operating segment information Accounting policy The Group’s internal organisation and management is structured based on individual products and services which are similar in nature and process and where the risks and returns are similar. The operating segments represent this business structure.
In addition, segments are determined based on the Group’s geographical spread of operations as well. The geographical analysis of turnover and profits are based on location of customers and assets respectively.
The activities of each of the operating business segments of the Group are detailed in the Group directory in the Supplementary section of the Annual report.
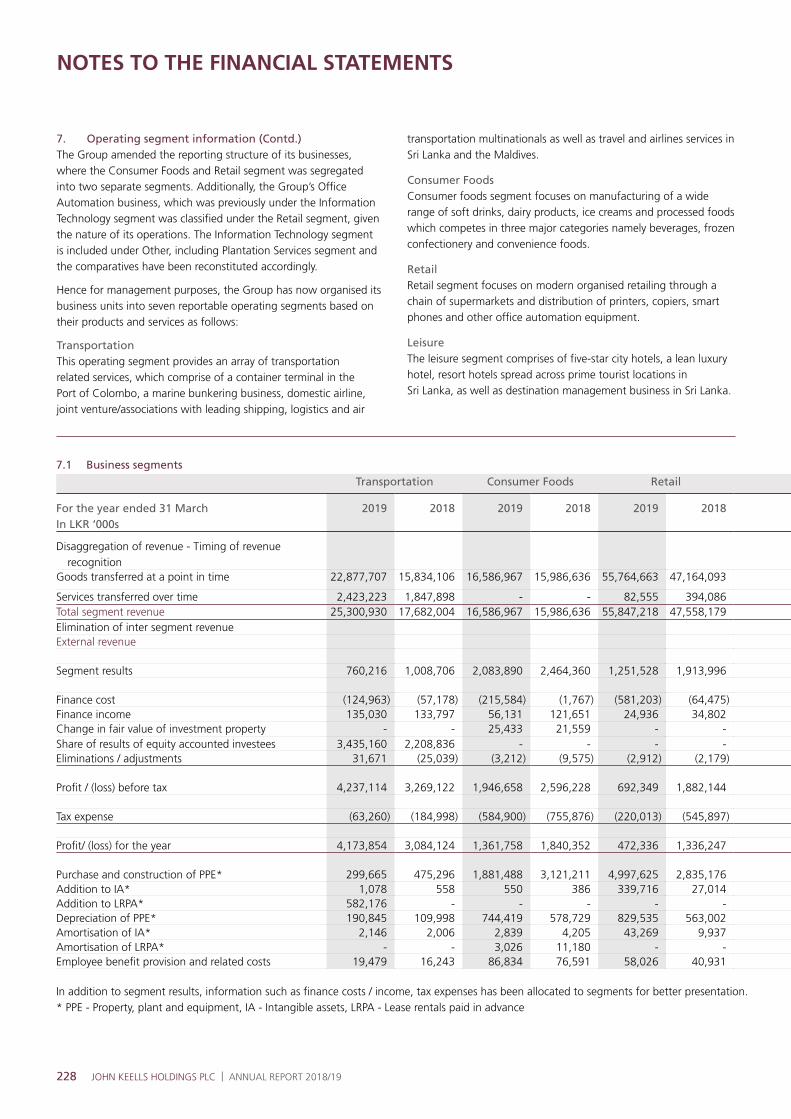
228 JOHN KEELLS HOLDINGS PLC | ANNUAL REPORT 2018/19
NOTES TO THE FINANCIAL STATEMENTS
7.1 Business segments
Transportation Consumer Foods Retail
For the year ended 31 MarchIn LKR ‘000s
2019 2018 2019 2018 2019 2018
Disaggregation of revenue - Timing of revenue recognition
Goods transferred at a point in time 22,877,707 15,834,106 16,586,967 15,986,636 55,764,663 47,164,093
Services transferred over time 2,423,223 1,847,898 - - 82,555 394,086 Total segment revenue 25,300,930 17,682,004 16,586,967 15,986,636 55,847,218 47,558,179 Elimination of inter segment revenueExternal revenue
Segment results 760,216 1,008,706 2,083,890 2,464,360 1,251,528 1,913,996
Finance cost (124,963) (57,178) (215,584) (1,767) (581,203) (64,475)Finance income 135,030 133,797 56,131 121,651 24,936 34,802 Change in fair value of investment property - - 25,433 21,559 - - Share of results of equity accounted investees 3,435,160 2,208,836 - - - - Eliminations / adjustments 31,671 (25,039) (3,212) (9,575) (2,912) (2,179)
Profit / (loss) before tax 4,237,114 3,269,122 1,946,658 2,596,228 692,349 1,882,144
Tax expense (63,260) (184,998) (584,900) (755,876) (220,013) (545,897)
Profit/ (loss) for the year 4,173,854 3,084,124 1,361,758 1,840,352 472,336 1,336,247
Purchase and construction of PPE* 299,665 475,296 1,881,488 3,121,211 4,997,625 2,835,176 Addition to IA* 1,078 558 550 386 339,716 27,014 Addition to LRPA* 582,176 - - - - - Depreciation of PPE* 190,845 109,998 744,419 578,729 829,535 563,002 Amortisation of IA* 2,146 2,006 2,839 4,205 43,269 9,937 Amortisation of LRPA* - - 3,026 11,180 - - Employee benefit provision and related costs 19,479 16,243 86,834 76,591 58,026 40,931
In addition to segment results, information such as finance costs / income, tax expenses has been allocated to segments for better presentation. * PPE - Property, plant and equipment, IA - Intangible assets, LRPA - Lease rentals paid in advance
7. Operating segment information (Contd.)The Group amended the reporting structure of its businesses, where the Consumer Foods and Retail segment was segregated into two separate segments. Additionally, the Group’s Office Automation business, which was previously under the Information Technology segment was classified under the Retail segment, given the nature of its operations. The Information Technology segment is included under Other, including Plantation Services segment and the comparatives have been reconstituted accordingly.
Hence for management purposes, the Group has now organised its business units into seven reportable operating segments based on their products and services as follows:
TransportationThis operating segment provides an array of transportation related services, which comprise of a container terminal in the Port of Colombo, a marine bunkering business, domestic airline, joint venture/associations with leading shipping, logistics and air
transportation multinationals as well as travel and airlines services in Sri Lanka and the Maldives.
Consumer FoodsConsumer foods segment focuses on manufacturing of a wide range of soft drinks, dairy products, ice creams and processed foods which competes in three major categories namely beverages, frozen confectionery and convenience foods.
RetailRetail segment focuses on modern organised retailing through a chain of supermarkets and distribution of printers, copiers, smart phones and other office automation equipment.
LeisureThe leisure segment comprises of five-star city hotels, a lean luxury hotel, resort hotels spread across prime tourist locations in Sri Lanka, as well as destination management business in Sri Lanka.
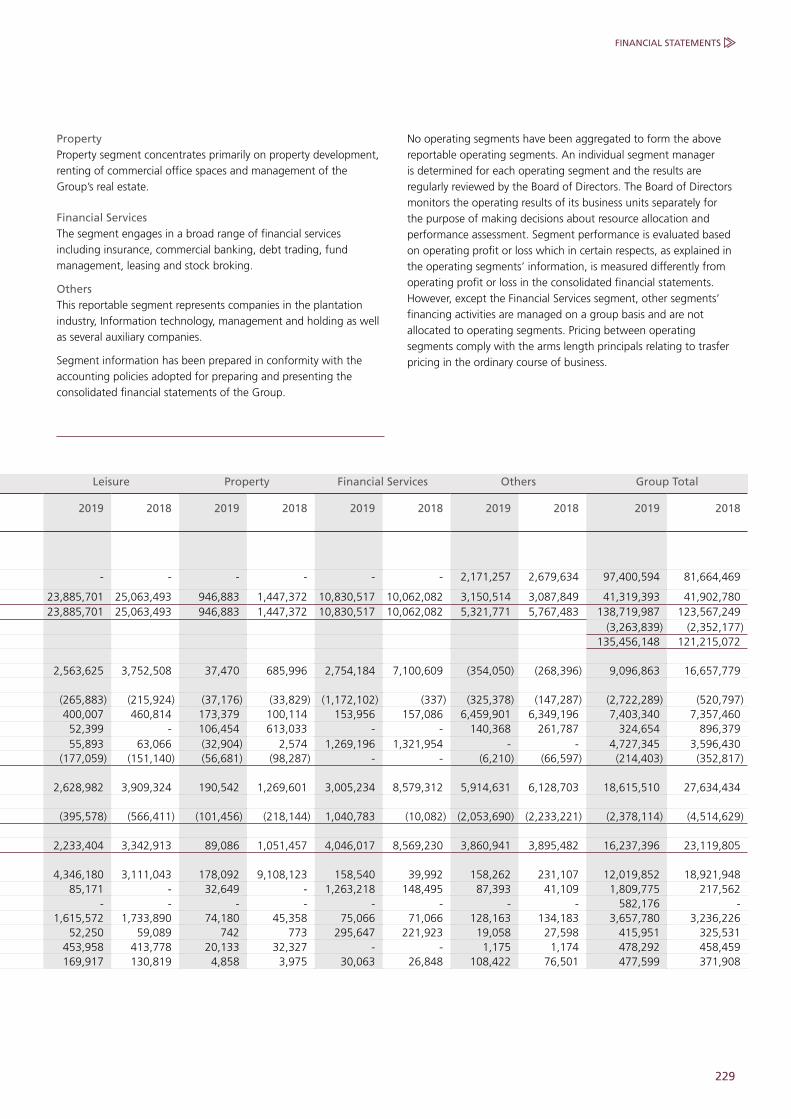
229
FINANCIAL STATEMENTS
Leisure Property Financial Services Others Group Total
2019 2018 2019 2018 2019 2018 2019 2018 2019 2018
- - - - - - 2,171,257 2,679,634 97,400,594 81,664,469
23,885,701 25,063,493 946,883 1,447,372 10,830,517 10,062,082 3,150,514 3,087,849 41,319,393 41,902,780 23,885,701 25,063,493 946,883 1,447,372 10,830,517 10,062,082 5,321,771 5,767,483 138,719,987 123,567,249
(3,263,839) (2,352,177) 135,456,148 121,215,072
2,563,625 3,752,508 37,470 685,996 2,754,184 7,100,609 (354,050) (268,396) 9,096,863 16,657,779
(265,883) (215,924) (37,176) (33,829) (1,172,102) (337) (325,378) (147,287) (2,722,289) (520,797) 400,007 460,814 173,379 100,114 153,956 157,086 6,459,901 6,349,196 7,403,340 7,357,460 52,399 - 106,454 613,033 - - 140,368 261,787 324,654 896,379 55,893 63,066 (32,904) 2,574 1,269,196 1,321,954 - - 4,727,345 3,596,430
(177,059) (151,140) (56,681) (98,287) - - (6,210) (66,597) (214,403) (352,817)
2,628,982 3,909,324 190,542 1,269,601 3,005,234 8,579,312 5,914,631 6,128,703 18,615,510 27,634,434
(395,578) (566,411) (101,456) (218,144) 1,040,783 (10,082) (2,053,690) (2,233,221) (2,378,114) (4,514,629)
2,233,404 3,342,913 89,086 1,051,457 4,046,017 8,569,230 3,860,941 3,895,482 16,237,396 23,119,805
4,346,180 3,111,043 178,092 9,108,123 158,540 39,992 158,262 231,107 12,019,852 18,921,948 85,171 - 32,649 - 1,263,218 148,495 87,393 41,109 1,809,775 217,562
- - - - - - - - 582,176 - 1,615,572 1,733,890 74,180 45,358 75,066 71,066 128,163 134,183 3,657,780 3,236,226
52,250 59,089 742 773 295,647 221,923 19,058 27,598 415,951 325,531 453,958 413,778 20,133 32,327 - - 1,175 1,174 478,292 458,459 169,917 130,819 4,858 3,975 30,063 26,848 108,422 76,501 477,599 371,908
PropertyProperty segment concentrates primarily on property development, renting of commercial office spaces and management of the Group’s real estate.
Financial ServicesThe segment engages in a broad range of financial services including insurance, commercial banking, debt trading, fund management, leasing and stock broking.
OthersThis reportable segment represents companies in the plantation industry, Information technology, management and holding as well as several auxiliary companies.
Segment information has been prepared in conformity with the accounting policies adopted for preparing and presenting the consolidated financial statements of the Group.
No operating segments have been aggregated to form the above reportable operating segments. An individual segment manager is determined for each operating segment and the results are regularly reviewed by the Board of Directors. The Board of Directors monitors the operating results of its business units separately for the purpose of making decisions about resource allocation and performance assessment. Segment performance is evaluated based on operating profit or loss which in certain respects, as explained in the operating segments’ information, is measured differently from operating profit or loss in the consolidated financial statements. However, except the Financial Services segment, other segments’ financing activities are managed on a group basis and are not allocated to operating segments. Pricing between operating segments comply with the arms length principals relating to trasfer pricing in the ordinary course of business.

230 JOHN KEELLS HOLDINGS PLC | ANNUAL REPORT 2018/19
NOTES TO THE FINANCIAL STATEMENTS
7. Operating segment information (Contd.)
7.2. Business segments
Transportation Consumer Foods Retail
AS at 31 March 2019 2018 2019 2018 2019 2018
In LKR '000s
Property, plant and equipment 1,038,231 876,075 9,322,821 8,071,509 10,375,534 6,283,252 Lease rentals paid in advance 582,176 - 143,237 146,263 - - Investment property 7,662 118,000 254,034 228,601 - - Intangible assets 11,556 12,624 247,900 6,242 341,148 44,700 Non-current financial assets 142,837 139,889 181,764 170,347 151,432 141,423 Other non-current assets 22,508 20,268 53,241 46,852 1,185,653 813,484 Segment non-current assets 1,804,970 1,166,856 10,202,997 8,669,814 12,053,767 7,282,859
Investments in equity accounted investees 11,993,153 10,760,644 - - - - Deferred tax assets Goodwill Eliminations / adjustments Total non-current assets
Inventories 1,290,816 717,600 1,740,779 1,445,001 5,889,251 3,874,804 Trade and other receivables 2,509,977 2,178,988 2,806,119 2,276,076 2,615,831 2,213,106 Short term investments 310,960 133,943 89,476 1,031,410 10,064 9,745 Cash in hand and at bank 3,542,220 2,880,564 291,851 293,290 478,037 363,680 Segment current assets 7,653,973 5,911,095 4,928,225 5,045,777 8,993,183 6,461,335
Other current assets Eliminations / adjustments Total current assets Total assets
Insurance contract liabilities - - - - - -Interest-bearing loans and borrowings - - 1,458,333 1,958,333 27,443 27,483 Employee benefit liabilities 80,255 75,411 465,817 457,406 211,578 164,244 Other non-current liabilities - 10,760 137,590 172,921 21,022 36,925 Segment non-current liabilities 80,255 86,171 2,061,740 2,588,660 260,043 228,652
Deferred tax liabilities Eliminations / adjustments Total non-current liabilities
Trade and other payables 1,909,280 1,289,228 1,796,864 1,609,317 7,877,326 6,785,427 Short term borrowings 3,485,908 3,088,538 - - 2,494,393 - Interest-bearing loans and borrowings - - 523,147 533,495 - 6,088 Bank overdrafts 767,891 260,280 1,000,085 210,653 7,616,440 3,655,537 Segment current liabilities 6,163,079 4,638,046 3,320,096 2,353,465 17,988,159 10,447,052
Income tax liabilities Other current liabilities Eliminations / adjustments Total current liabilities
Total liabilities
Total segment assets 9,458,943 7,077,951 15,131,222 13,715,591 21,046,950 13,744,194
Total segment liabilities 6,243,334 4,724,217 5,381,836 4,942,125 18,248,202 10,675,704
Inter company investments made by the Group of companies have not been considered for the calculation of segment assets.
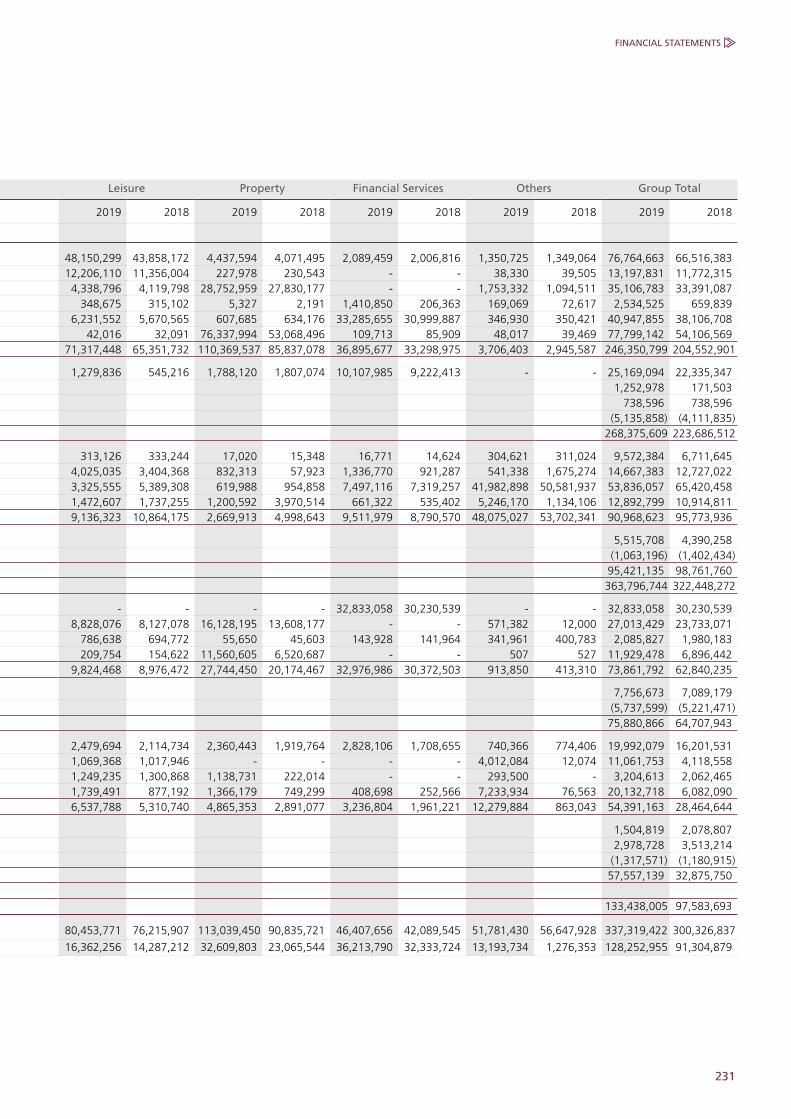
231
FINANCIAL STATEMENTS
Leisure Property Financial Services Others Group Total
2019 2018 2019 2018 2019 2018 2019 2018 2019 2018
48,150,299 43,858,172 4,437,594 4,071,495 2,089,459 2,006,816 1,350,725 1,349,064 76,764,663 66,516,383 12,206,110 11,356,004 227,978 230,543 - - 38,330 39,505 13,197,831 11,772,315
4,338,796 4,119,798 28,752,959 27,830,177 - - 1,753,332 1,094,511 35,106,783 33,391,087 348,675 315,102 5,327 2,191 1,410,850 206,363 169,069 72,617 2,534,525 659,839
6,231,552 5,670,565 607,685 634,176 33,285,655 30,999,887 346,930 350,421 40,947,855 38,106,708 42,016 32,091 76,337,994 53,068,496 109,713 85,909 48,017 39,469 77,799,142 54,106,569
71,317,448 65,351,732 110,369,537 85,837,078 36,895,677 33,298,975 3,706,403 2,945,587 246,350,799 204,552,901
1,279,836 545,216 1,788,120 1,807,074 10,107,985 9,222,413 - - 25,169,094 22,335,347 1,252,978 171,503
738,596 738,596 (5,135,858) (4,111,835)
268,375,609 223,686,512
313,126 333,244 17,020 15,348 16,771 14,624 304,621 311,024 9,572,384 6,711,645 4,025,035 3,404,368 832,313 57,923 1,336,770 921,287 541,338 1,675,274 14,667,383 12,727,022 3,325,555 5,389,308 619,988 954,858 7,497,116 7,319,257 41,982,898 50,581,937 53,836,057 65,420,458 1,472,607 1,737,255 1,200,592 3,970,514 661,322 535,402 5,246,170 1,134,106 12,892,799 10,914,811 9,136,323 10,864,175 2,669,913 4,998,643 9,511,979 8,790,570 48,075,027 53,702,341 90,968,623 95,773,936
5,515,708 4,390,258 (1,063,196) (1,402,434)
95,421,135 98,761,760 363,796,744 322,448,272
- - - - 32,833,058 30,230,539 - - 32,833,058 30,230,539 8,828,076 8,127,078 16,128,195 13,608,177 - - 571,382 12,000 27,013,429 23,733,071
786,638 694,772 55,650 45,603 143,928 141,964 341,961 400,783 2,085,827 1,980,183 209,754 154,622 11,560,605 6,520,687 - - 507 527 11,929,478 6,896,442
9,824,468 8,976,472 27,744,450 20,174,467 32,976,986 30,372,503 913,850 413,310 73,861,792 62,840,235
7,756,673 7,089,179 (5,737,599) (5,221,471)
75,880,866 64,707,943
2,479,694 2,114,734 2,360,443 1,919,764 2,828,106 1,708,655 740,366 774,406 19,992,079 16,201,531 1,069,368 1,017,946 - - - - 4,012,084 12,074 11,061,753 4,118,558 1,249,235 1,300,868 1,138,731 222,014 - - 293,500 - 3,204,613 2,062,465 1,739,491 877,192 1,366,179 749,299 408,698 252,566 7,233,934 76,563 20,132,718 6,082,090 6,537,788 5,310,740 4,865,353 2,891,077 3,236,804 1,961,221 12,279,884 863,043 54,391,163 28,464,644
1,504,819 2,078,807 2,978,728 3,513,214
(1,317,571) (1,180,915) 57,557,139 32,875,750
133,438,005 97,583,693
80,453,771 76,215,907 113,039,450 90,835,721 46,407,656 42,089,545 51,781,430 56,647,928 337,319,422 300,326,837
16,362,256 14,287,212 32,609,803 23,065,544 36,213,790 32,333,724 13,193,734 1,276,353 128,252,955 91,304,879
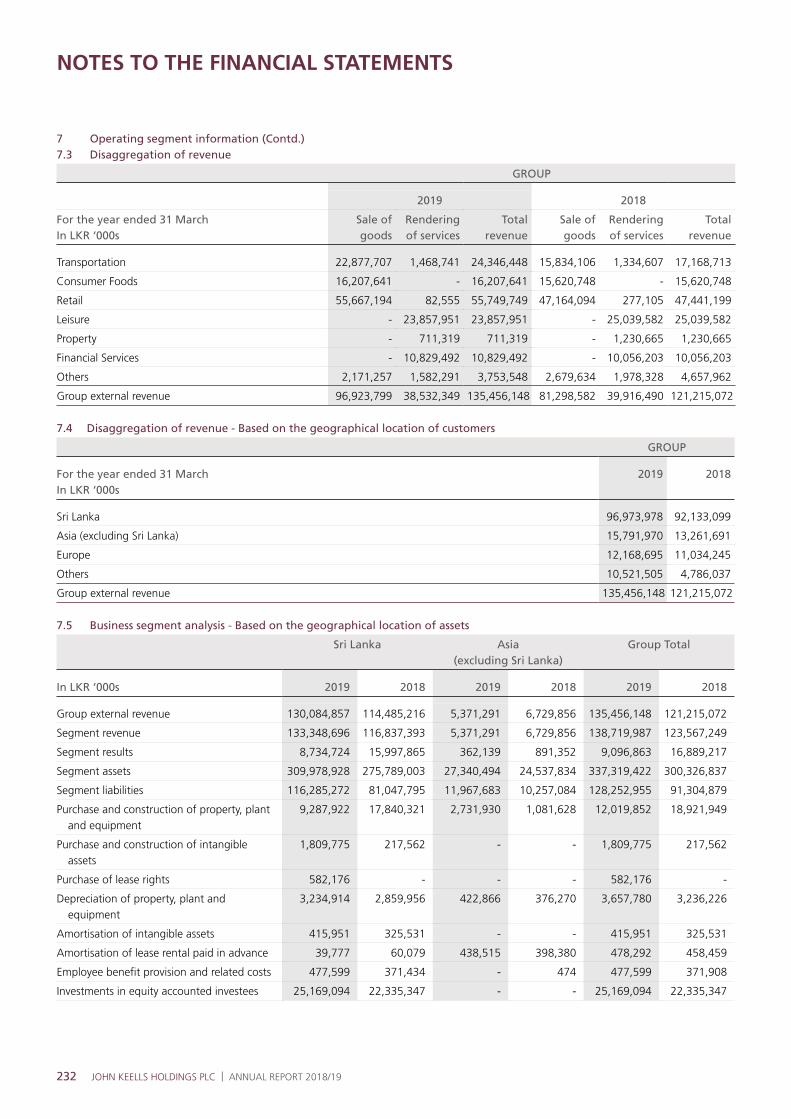
232 JOHN KEELLS HOLDINGS PLC | ANNUAL REPORT 2018/19
NOTES TO THE FINANCIAL STATEMENTS
7 Operating segment information (Contd.)7.3 Disaggregation of revenue
GROUP
2019 2018
For the year ended 31 MarchIn LKR ‘000s
Sale of goods
Renderingof services
Totalrevenue
Sale of goods
Renderingof services
Totalrevenue
Transportation 22,877,707 1,468,741 24,346,448 15,834,106 1,334,607 17,168,713
Consumer Foods 16,207,641 - 16,207,641 15,620,748 - 15,620,748
Retail 55,667,194 82,555 55,749,749 47,164,094 277,105 47,441,199
Leisure - 23,857,951 23,857,951 - 25,039,582 25,039,582
Property - 711,319 711,319 - 1,230,665 1,230,665
Financial Services - 10,829,492 10,829,492 - 10,056,203 10,056,203
Others 2,171,257 1,582,291 3,753,548 2,679,634 1,978,328 4,657,962
Group external revenue 96,923,799 38,532,349 135,456,148 81,298,582 39,916,490 121,215,072
7.4 Disaggregation of revenue - Based on the geographical location of customers
GROUP
For the year ended 31 MarchIn LKR ‘000s
2019 2018
Sri Lanka 96,973,978 92,133,099
Asia (excluding Sri Lanka) 15,791,970 13,261,691
Europe 12,168,695 11,034,245
Others 10,521,505 4,786,037
Group external revenue 135,456,148 121,215,072
7.5 Business segment analysis - Based on the geographical location of assets
Sri Lanka Asia (excluding Sri Lanka)
Group Total
In LKR ‘000s 2019 2018 2019 2018 2019 2018
Group external revenue 130,084,857 114,485,216 5,371,291 6,729,856 135,456,148 121,215,072
Segment revenue 133,348,696 116,837,393 5,371,291 6,729,856 138,719,987 123,567,249
Segment results 8,734,724 15,997,865 362,139 891,352 9,096,863 16,889,217
Segment assets 309,978,928 275,789,003 27,340,494 24,537,834 337,319,422 300,326,837
Segment liabilities 116,285,272 81,047,795 11,967,683 10,257,084 128,252,955 91,304,879
Purchase and construction of property, plant and equipment
9,287,922 17,840,321 2,731,930 1,081,628 12,019,852 18,921,949
Purchase and construction of intangible assets
1,809,775 217,562 - - 1,809,775 217,562
Purchase of lease rights 582,176 - - - 582,176 -
Depreciation of property, plant and equipment
3,234,914 2,859,956 422,866 376,270 3,657,780 3,236,226
Amortisation of intangible assets 415,951 325,531 - - 415,951 325,531
Amortisation of lease rental paid in advance 39,777 60,079 438,515 398,380 478,292 458,459
Employee benefit provision and related costs 477,599 371,434 - 474 477,599 371,908
Investments in equity accounted investees 25,169,094 22,335,347 - - 25,169,094 22,335,347

233
FINANCIAL STATEMENTS
8. Basis of consolidation and material partly owned subsidiaries
Accounting policy Basis of consolidationThe consolidated financial statements comprise the financial statements of the Group and its subsidiaries as at the end of reporting period. Control over an investee is achieved when the Group is exposed, or has rights, to variable returns from its involvement with the investee and has the ability to affect those returns through its power over the investee.
Control over an investee Specifically, the Group controls an investee if, and only if, the Group has:
• Power over the investee (i.e., existing rights that give it the current ability to direct the relevant activities of the investee)
• Exposure, or rights, to variable returns from its involvement with the investee
• The ability to use its power over the investee to affect its returns
Consolidation of entities in which the Group holds less than a majority of voting rights When the Group has less than a majority of the voting or similar rights of an investee, the Group considers all relevant facts and circumstances in assessing whether it has power over an investee, including:
• The contractual arrangement with the other vote holders of the investee;
• Rights arising from other contractual arrangements; and
• The Group’s voting rights and potential voting rights
Subsidiaries that are consolidated have been listed in the Group directory under Supplementary section of the annual report.
The following companies, with equity control equal to or less than 50%, have been consolidated as subsidiaries based on above criteria.
% ofEffective Holding
Rajawella Holdings Ltd. 49.85
Mack Air Services Maldives (Pte) Ltd. 49.00
Tea Smallholder Factories PLC. 37.62
The Group re-assesses whether or not it controls an investee, if facts and circumstances indicate that there are changes to one or more of the three elements of control. Consolidation of a subsidiary begins when the Group obtains control over the subsidiary and ceases when the Group loses control of the subsidiary. Assets, liabilities, income and expenses of a subsidiary acquired or disposed of during the year are included in the consolidated financial statements from the date the Group gains control until the date the Group ceases to control the subsidiary.
Profit or loss and each component of other comprehensive income (OCI) are attributed to the equity holders of the parent of the Group and to the non-controlling interests, even if this results in the non-controlling interests having a deficit balance. The financial statements of the subsidiaries are prepared for the same reporting period as the parent Company, which is 12 months ending 31 March, using consistent accounting policies.
Transactions eliminated on consolidation All intra-group assets, liabilities, equity, income, expenses and cash flows relating to transactions between members of the Group are eliminated in full on consolidation. A change in the ownership interest of a subsidiary, without a loss of control, is accounted for as an equity transaction.
Loss of controlIf the Group loses control over a subsidiary, it derecognises the related assets (including goodwill), liabilities, non-controlling interest and other components of equity while any resultant gain or loss is recognised in the Income Statement. Any investment retained is recognised at fair value.
The total profits and losses for the year of the Company and of its subsidiaries included in consolidation are shown in the Consolidated Income Statement and Consolidated Statement of Comprehensive Income and all assets and liabilities of the Company and of its subsidiaries included in consolidation are shown in the Consolidated Statement of Financial Position.
Non-controlling interest (NCI) Non-controlling interest, which represents the portion of profit or loss and net assets not held by the Group, is shown as a component of profit for the year in the Consolidated Income Statement and Statement of Comprehensive Income and as a component of equity in the Consolidated Statement of Financial Position, separately from equity attributable to the shareholders of the parent.
The Consolidated Statement of Cash Flow includes the cash flows of the Company and its subsidiaries.

234 JOHN KEELLS HOLDINGS PLC | ANNUAL REPORT 2018/19
NOTES TO THE FINANCIAL STATEMENTS
8 Basis of consolidation and material partly owned subsidiaries (Contd.)8.1 Material partly-owned subsidiaries Financial information of subsidiaries that have material non-controlling interests (NCI) are provided below.
CONSUMER FOODS RETAIL LEISURE
In LKR ‘000s 2019 2018 2019 2018 2019 2018
Summarised income statement for the year ended 31 March
Revenue 17,460,880 16,768,231 55,847,218 47,558,179 25,879,890 26,793,664
Operating cost (14,664,088) (13,557,810) (54,595,690) (45,644,182) (22,797,185) (21,389,257)
Finance cost (215,584) (1,767) (581,203) (64,475) (265,883) (215,924)
Finance income 56,131 121,651 24,936 34,802 400,007 460,814
Change in fair value of investment property 25,433 21,559 - - 218,999 397,600
Profit before tax 2,662,772 3,351,864 695,261 1,884,324 3,435,828 6,046,897
Tax expense (584,900) (755,876) (218,104) (546,583) (396,070) (538,572)
Profit for the year 2,077,872 2,595,988 477,157 1,337,741 3,039,758 5,508,325
Other comprehensive income 3,100,565 63,388 16,007 (42,386) 3,132,916 1,029,264
Total comprehensive income 5,178,437 2,659,376 493,164 1,295,355 6,172,674 6,537,589
Profit/(loss) allocated to NCI 234,645 325,612 61,636 196,104 349,329 520,966
Dividend paid to NCI 289,212 283,325 154,517 154,517 350,105 580,460
Summarised statement of financial position as at 31 March
Current assets 4,928,225 5,045,777 8,993,183 6,461,335 9,136,323 10,864,175
Non-current assets 10,202,997 8,669,814 12,053,767 7,282,859 71,317,448 65,351,732
Total assets 15,131,222 13,715,591 21,046,950 13,744,194 80,453,771 76,215,907
Current liabilities 3,320,096 2,353,465 17,988,159 10,447,052 6,537,787 5,310,740
Non-current liabilities 2,061,740 2,588,660 260,043 228,652 9,824,468 8,976,472
Total liabilities 5,381,836 4,942,125 18,248,202 10,675,704 16,362,255 14,287,212
Accumulated balances of NCI 2,817,397 1,895,821 720,927 514,549 12,654,080 12,414,526
Summarised statement of cash flows for the year ended 31 March
Cash flows from/(used in) operating activities 3,796,062 2,541,277 (99,174) 952,961 4,053,132 7,455,908
Cash flows from/(used in) investing activities (5,944,099) (3,354,857) (5,316,530) (2,786,504) (4,296,281) (3,696,335)
Cash flows from/(used in) financing activities 709,362 1,538,318 1,569,309 (1,303,956) (1,893,214) (3,031,700)
Net increase / (decrease) in cash and cash equivalents
(1,438,675) 724,738 (3,846,395) (3,137,499) (2,136,363) 727,873
The above information is based on amounts before inter-company eliminations.

235
FINANCIAL STATEMENTS
Names of material partly-owned subsidiaries and effective holding % owned by non-controlling interest:
Effective holding % of Non-Controlling
Interest
Material partly-owned subsidiary 2018/19 2017/18
Consumer Foods
Ceylon Cold Stores PLC. 18.64% 18.64%
Keells Food Products PLC. 11.37% 11.37%
The Colombo Ice Company (Pvt) Ltd. 18.64% 18.64%
Retail
JayKay Marketing Services (Pvt) Ltd. 18.64% 18.64%
Leisure
Ahungalle Holiday Resorts (Pvt) Ltd. 19.68% 19.68%
Asian Hotels and Properties PLC. 21.44% 21.44%
Beruwala Holiday Resorts (Pvt) Ltd. 20.22% 20.22%
Ceylon Holiday Resorts Ltd. 20.40% 20.40%
Cinnamon Holidays (Pvt) Ltd. 19.68% 19.68%
Fantasea World Investments (Pte) Ltd. 19.68% 19.68%
Habarana Lodge Ltd. 21.01% 21.01%
Habarana Walk Inn Ltd. 20.66% 20.66%
Hikkaduwa Holiday Resorts (Pvt) Ltd. 20.40% 20.40%
International Tourists and Hoteliers Ltd. 20.22% 20.22%
John Keells Hotels PLC. 19.68% 19.68%
John Keells Maldivian Resorts (Pte) Ltd. 19.68% 19.68%
Kandy Walk Inn Ltd. 20.97% 20.97%
Nuwara Eliya Holiday Resorts (Pvt) Ltd. 19.68% 19.68%
Rajawella Hotels Company Ltd. 19.68% 19.68%
Resort Hotels Ltd. 20.75% 20.75%
Serene Holidays (Pvt) Ltd. 1.26% 1.26%
Tranquility (Pte) Ltd. 19.68% 19.68%
Trans Asia Hotels PLC. 17.26% 17.26%
Travel Club (Pte) Ltd. 19.68% 19.68%
Trinco Holiday Resorts (Pvt) Ltd. 19.68% 19.68%
Trinco Walk Inn Ltd. 19.68% 19.68%
Walkers Tours Ltd. 1.49% 1.49%
Wirawila Walk Inn Ltd. 19.68% 19.68%
Yala Village (Pvt) Ltd. 24.67% 24.67%
Accounting judgements, estimates and assumptionsConsolidation of entities in which the Group holds less than a majority of voting rights (de facto control).
The Group considers that it controls some subsidiaries even though it owns less than 50% of the voting rights. This is because the Group is the single largest shareholder of those subsidiaries with equity interest. The remaining equity shares in those subsidiaries are widely held by many other shareholders, and there is no history of the other shareholders collaborating to exercise their votes collectively or to outvote the Group.
Considering the Group balances, none of the individual partly-owned subsidiaries have material non-controlling interest. However, the above information has been presented on the aggregated interests in similar entities attached to the Consumer Foods, Retail and Leisure segments, based on the nature and risks of the products and services.
9 Business combinations and acquisitions of non-controlling interests
Accounting policy Business combinations & goodwillBusiness combinations are accounted for using the acquisition method of accounting. The Group measures goodwill at the acquisition date as the fair value of the consideration transferred including the recognised amount of any non-controlling interests in the acquiree, less the net recognised amount (generally fair value) of the identifiable assets acquired and liabilities assumed, all measured as of the acquisition date.
When the fair value of the consideration transferred including the recognised amount of any non-controlling interests in the acquiree is lower than the fair value of net assets acquired, a gain is recognised immediately in the income statement. The Group elects on a transaction-by-transaction basis whether to measure non-controlling interests at fair value, or at their proportionate share of the recognised amount of the identifiable net assets, at the acquisition date. Transaction costs, other than those associated with the issue of debt or equity securities, that the Group incurs in connection with a business combination are expensed as incurred. When the Group acquires a business, it assesses the financial assets and liabilities assumed for appropriate classification and designation in accordance with the contractual terms, economic circumstances and pertinent conditions as at the acquisition date. If the business combination is achieved in stages, the acquisition date fair value of the acquirer’s previously held equity interest in the acquiree is remeasured to fair value at the acquisition date through profit or loss. Any contingent consideration to be transferred by the acquirer will be recognised at fair value at the acquisition date. Contingent consideration, resulting from business combinations, is valued at fair value at the acquisition date. Contingent consideration classified as equity is not remeasured and its subsequent settlement is accounted for within equity. Contingent consideration classified as an asset or liability that is a financial instrument and within the scope of SLFRS 9 Financial Instruments, is measured at fair value with the changes in fair value recognised in the Income Statement, in accordance with SLFRS 9.
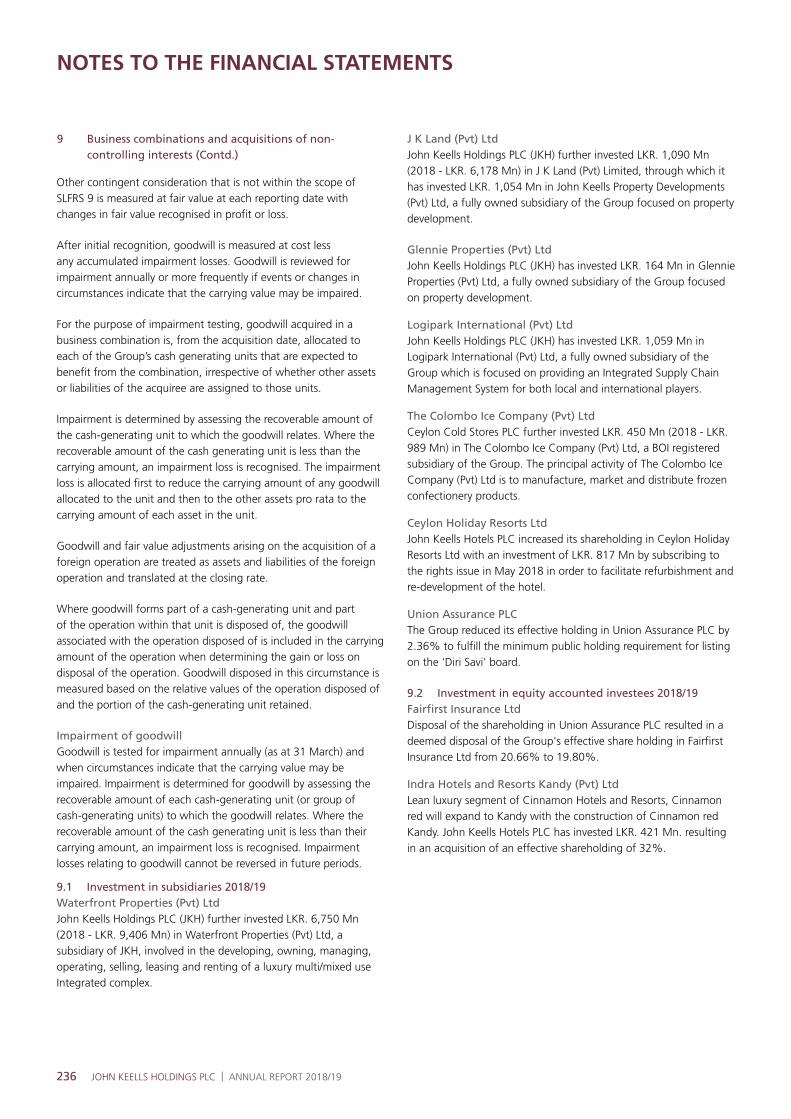
236 JOHN KEELLS HOLDINGS PLC | ANNUAL REPORT 2018/19
NOTES TO THE FINANCIAL STATEMENTS
Other contingent consideration that is not within the scope of SLFRS 9 is measured at fair value at each reporting date with changes in fair value recognised in profit or loss.
After initial recognition, goodwill is measured at cost less any accumulated impairment losses. Goodwill is reviewed for impairment annually or more frequently if events or changes in circumstances indicate that the carrying value may be impaired.
For the purpose of impairment testing, goodwill acquired in a business combination is, from the acquisition date, allocated to each of the Group’s cash generating units that are expected to benefit from the combination, irrespective of whether other assets or liabilities of the acquiree are assigned to those units.
Impairment is determined by assessing the recoverable amount of the cash-generating unit to which the goodwill relates. Where the recoverable amount of the cash generating unit is less than the carrying amount, an impairment loss is recognised. The impairment loss is allocated first to reduce the carrying amount of any goodwill allocated to the unit and then to the other assets pro rata to the carrying amount of each asset in the unit.
Goodwill and fair value adjustments arising on the acquisition of a foreign operation are treated as assets and liabilities of the foreign operation and translated at the closing rate.
Where goodwill forms part of a cash-generating unit and part of the operation within that unit is disposed of, the goodwill associated with the operation disposed of is included in the carrying amount of the operation when determining the gain or loss on disposal of the operation. Goodwill disposed in this circumstance is measured based on the relative values of the operation disposed of and the portion of the cash-generating unit retained.
Impairment of goodwillGoodwill is tested for impairment annually (as at 31 March) and when circumstances indicate that the carrying value may be impaired. Impairment is determined for goodwill by assessing the recoverable amount of each cash-generating unit (or group of cash-generating units) to which the goodwill relates. Where the recoverable amount of the cash generating unit is less than their carrying amount, an impairment loss is recognised. Impairment losses relating to goodwill cannot be reversed in future periods.
9.1 Investment in subsidiaries 2018/19Waterfront Properties (Pvt) LtdJohn Keells Holdings PLC (JKH) further invested LKR. 6,750 Mn (2018 - LKR. 9,406 Mn) in Waterfront Properties (Pvt) Ltd, a subsidiary of JKH, involved in the developing, owning, managing, operating, selling, leasing and renting of a luxury multi/mixed use Integrated complex.
J K Land (Pvt) LtdJohn Keells Holdings PLC (JKH) further invested LKR. 1,090 Mn (2018 - LKR. 6,178 Mn) in J K Land (Pvt) Limited, through which it has invested LKR. 1,054 Mn in John Keells Property Developments (Pvt) Ltd, a fully owned subsidiary of the Group focused on property development.
Glennie Properties (Pvt) LtdJohn Keells Holdings PLC (JKH) has invested LKR. 164 Mn in Glennie Properties (Pvt) Ltd, a fully owned subsidiary of the Group focused on property development.
Logipark International (Pvt) LtdJohn Keells Holdings PLC (JKH) has invested LKR. 1,059 Mn in Logipark International (Pvt) Ltd, a fully owned subsidiary of the Group which is focused on providing an Integrated Supply Chain Management System for both local and international players.
The Colombo Ice Company (Pvt) LtdCeylon Cold Stores PLC further invested LKR. 450 Mn (2018 - LKR. 989 Mn) in The Colombo Ice Company (Pvt) Ltd, a BOI registered subsidiary of the Group. The principal activity of The Colombo Ice Company (Pvt) Ltd is to manufacture, market and distribute frozen confectionery products.
Ceylon Holiday Resorts LtdJohn Keells Hotels PLC increased its shareholding in Ceylon Holiday Resorts Ltd with an investment of LKR. 817 Mn by subscribing to the rights issue in May 2018 in order to facilitate refurbishment and re-development of the hotel.
Union Assurance PLCThe Group reduced its effective holding in Union Assurance PLC by 2.36% to fulfill the minimum public holding requirement for listing on the 'Diri Savi' board.
9.2 Investment in equity accounted investees 2018/19Fairfirst Insurance LtdDisposal of the shareholding in Union Assurance PLC resulted in a deemed disposal of the Group's effective share holding in Fairfirst Insurance Ltd from 20.66% to 19.80%.
Indra Hotels and Resorts Kandy (Pvt) LtdLean luxury segment of Cinnamon Hotels and Resorts, Cinnamon red will expand to Kandy with the construction of Cinnamon red Kandy. John Keells Hotels PLC has invested LKR. 421 Mn. resulting in an acquisition of an effective shareholding of 32%.
9 Business combinations and acquisitions of non-controlling interests (Contd.)

237
FINANCIAL STATEMENTS
10. Financial risk management objectives and policies The Group has loans and other receivables, trade and other receivables and cash and short-term deposits that arise directly from its operations. The Group also holds investments in debt and equity investments and may enter into derivative transactions. The Group’s principal financial liabilities comprise of loans and borrowings, trade and other payables and financial guarantee contracts. The main purpose of these financial liabilities is to finance the Group’s operations and to provide guarantees to support its operations. The financial risk governance framework provides assurance to the Group’s senior management that the Group’s financial risk activities are governed by appropriate policies and procedures and that financial risks are identified, measured and managed in accordance with the Group’s policies and risk objectives. The Group is exposed to market risk, credit risk and liquidity risk.
10.1 Credit risk Credit risk is the risk that a counterparty will not meet its obligations under a financial instrument or customer contract, leading to a financial loss. The Group is exposed to credit risk from its operating activities (primarily trade receivables) and from its financing activities, including deposits with banks and financial institutions, foreign exchange transactions and other financial instruments.
The Group trades only with recognised, creditworthy third parties. It is the Group’s policy that all clients who wish to trade on credit terms are subject to credit verification procedures. In addition, receivable balances are monitored on an ongoing basis with the result that the Group’s exposure to bad debts is not significant.
With respect to credit risk arising from the other financial assets of the Group, such as cash and cash equivalents, investments in debt and equity investments and certain derivative instruments, the Group’s exposure to credit risk arises from default of the counterparty. The Group manages its operations to avoid any excessive concentration of counterparty risk and the Group takes all reasonable steps to ensure the counterparties fulfill their obligations.
10.1.1 Risk exposure The maximum risk positions of financial assets which are generally subject to credit risk are equal to their carrying amounts (without consideration of collateral, if available).
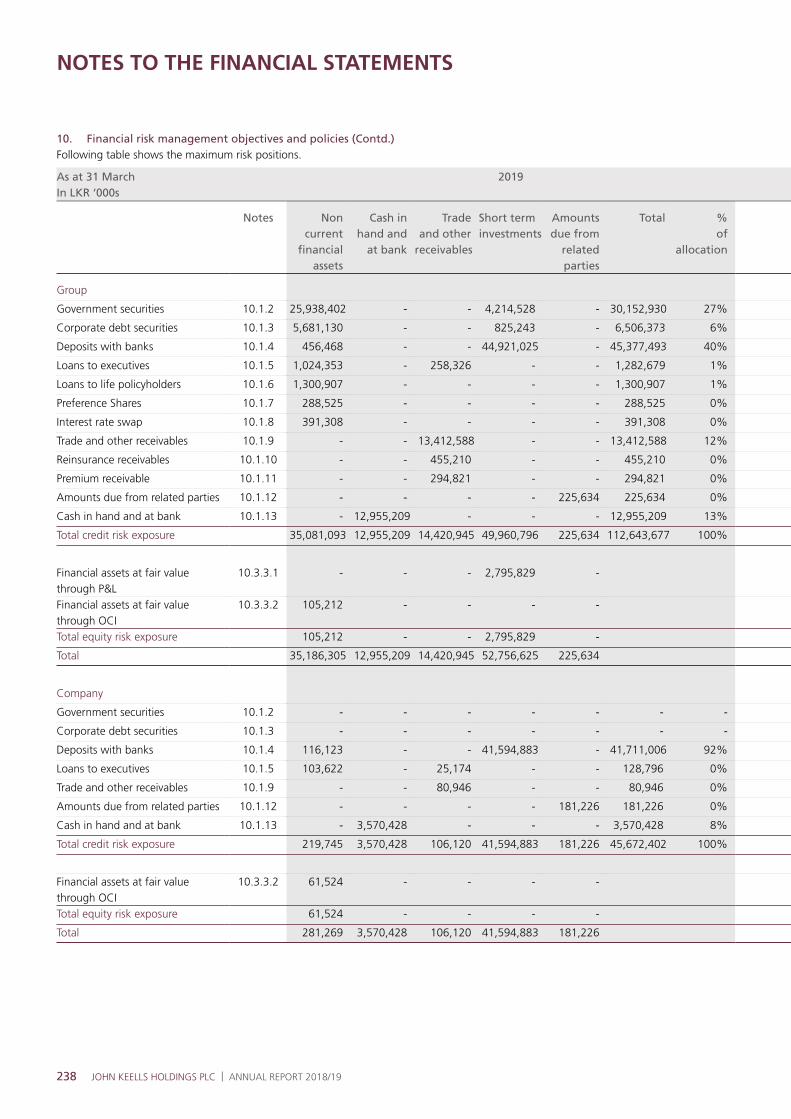
238 JOHN KEELLS HOLDINGS PLC | ANNUAL REPORT 2018/19
NOTES TO THE FINANCIAL STATEMENTS
10. Financial risk management objectives and policies (Contd.)Following table shows the maximum risk positions.
As at 31 MarchIn LKR ‘000s
2019
Notes Non current
financial assets
Cash in hand and
at bank
Tradeand other
receivables
Short term investments
Amounts due from
related parties
Total %of
allocation
Group
Government securities 10.1.2 25,938,402 - - 4,214,528 - 30,152,930 27%
Corporate debt securities 10.1.3 5,681,130 - - 825,243 - 6,506,373 6%
Deposits with banks 10.1.4 456,468 - - 44,921,025 - 45,377,493 40%
Loans to executives 10.1.5 1,024,353 - 258,326 - - 1,282,679 1%
Loans to life policyholders 10.1.6 1,300,907 - - - - 1,300,907 1%
Preference Shares 10.1.7 288,525 - - - - 288,525 0%
Interest rate swap 10.1.8 391,308 - - - - 391,308 0%
Trade and other receivables 10.1.9 - - 13,412,588 - - 13,412,588 12%
Reinsurance receivables 10.1.10 - - 455,210 - - 455,210 0%
Premium receivable 10.1.11 - - 294,821 - - 294,821 0%
Amounts due from related parties 10.1.12 - - - - 225,634 225,634 0%
Cash in hand and at bank 10.1.13 - 12,955,209 - - - 12,955,209 13%
Total credit risk exposure 35,081,093 12,955,209 14,420,945 49,960,796 225,634 112,643,677 100%
Financial assets at fair value through P&L
10.3.3.1 - - - 2,795,829 -
Financial assets at fair value through OCI
10.3.3.2 105,212 - - - -
Total equity risk exposure 105,212 - - 2,795,829 -
Total 35,186,305 12,955,209 14,420,945 52,756,625 225,634
Company
Government securities 10.1.2 - - - - - - -
Corporate debt securities 10.1.3 - - - - - - -
Deposits with banks 10.1.4 116,123 - - 41,594,883 - 41,711,006 92%
Loans to executives 10.1.5 103,622 - 25,174 - - 128,796 0%
Trade and other receivables 10.1.9 - - 80,946 - - 80,946 0%
Amounts due from related parties 10.1.12 - - - - 181,226 181,226 0%
Cash in hand and at bank 10.1.13 - 3,570,428 - - - 3,570,428 8%
Total credit risk exposure 219,745 3,570,428 106,120 41,594,883 181,226 45,672,402 100%
Financial assets at fair value through OCI
10.3.3.2 61,524 - - - -
Total equity risk exposure 61,524 - - - -
Total 281,269 3,570,428 106,120 41,594,883 181,226

239
FINANCIAL STATEMENTS
2018
Non current
financial assets
Cash in hand and
at bank
Tradeand other
receivables
Short term investments
Amounts due from
related parties
Total %of
allocation
24,901,319 - - 3,440,812 - 28,342,131 24%
4,828,338 - - 1,188,991 - 6,017,329 5%
172,748 - - 55,939,666 - 56,112,414 48%
934,297 - 222,885 - - 1,157,182 1%
1,048,966 - - - - 1,048,966 1%
275,114 - - - - 275,114 0%
598,097 - - - - 598,097 1%
- - 11,448,660 - - 11,448,660 10%
- - 333,249 - - 333,249 0%
- - 268,578 - - 268,578 0%
- - - - 139,640 139,640 0%
- 10,882,856 - - - 10,882,856 10%
32,758,879 10,882,856 12,273,372 60,569,469 139,640 116,642,216 100%
- - - 3,816,624 -
119,375 - - - -
119,375 - - 3,816,624 -
32,878,254 10,882,856 12,273,372 64,386,093 139,640
- - - - - - -
- - - - - - -
105,510 - - 49,157,472 - 49,262,982 98%
86,140 - 23,549 - - 109,689 0%
- - 47,181 - - 47,181 0%
- - - - 404,364 404,364 1%
- 496,591 - - - 496,591 1%
191,650 496,591 70,730 49,157,472 404,364 50,320,807 100%
75,461 - - - -
75,461 - - - -
267,111 496,591 70,730 49,157,472 404,364

240 JOHN KEELLS HOLDINGS PLC | ANNUAL REPORT 2018/19
NOTES TO THE FINANCIAL STATEMENTS
10. Financial risk management objectives and policies (Contd.)10.1.2 Government securities As at 31 March 2019 as shown in previous table 27% (2018 - 24%) of the Group financial assets comprise of investments in government securities consisting of treasury bonds, bills and reverse repo investments. Government securities are usually referred to as risk free due to the sovereign nature of the instrument.
10.1.3 Corporate debt securitiesAs at 31 March 2019, corporate debt securities comprise 6% (2018 - 5%) of the total investments in debt securities, out of which 66% (2018 – 69%) were rated “A” or better, or guaranteed by a banking institution with a rating of “A” or better.
GROUP
As at 31 March 2019 2018
Fitch ratings In LKR ’000s % In LKR ’000s %
AA+ 211,420 3% - -
AA 283,746 5% 284,753 5%
AA- 1,002,828 15% 518,442 9%
A+ 917,417 14% 1,464,969 24%
A 1,895,025 29% 1,891,125 31%
A- 1,331,899 21% 1,126,015 19%
BBB+ 864,038 13% 732,025 12%
Total 6,506,373 100% 6,017,329 100%
10.1.4 Deposits with banksDeposits with bank mainly consist of fixed and call deposits.
As at 31 March 2019, fixed and call deposits, which comprise 96% (2018 - 87%) each for the Group and the Company, respectively, were rated “A+” or better.
GROUP COMPANY
As at 31 March 2019 2018 2019 2018
Fitch ratings In LKR’000s
% In LKR’000s
% In LKR’000s
% In LKR’000s
%
AAA 402,739 1% 387,619 1% - - - -
AA+ 21,782,391 48% 23,575,985 42% 20,449,442 49% 19,866,538 41%
AA 157,927 0% 4,021,056 7% 54,543 0% 4,070,587 8%
AA- 15,478,890 34% 19,006,484 34% 14,037,445 34% 17,369,327 35%
A+ 5,515,912 13% 1,727,461 3% 5,515,911 13% 1,512,538 3%
A 385,969 0% 6,802,124 12% - - 6,002,314 12%
A- 1,653,665 4% 591,685 1% 1,653,665 4% 441,678 1%
Total 45,377,493 100% 56,112,414 100% 41,711,006 100% 49,262,982 100%
10.1.5 Loans to executives Loans to executive portfolio is largely made up of vehicle loans given to staff at assistant manager level and above. The respective business units have obtained the necessary promissory notes as collateral for the loans granted.
10.1.6 Loans to life policyholders The surrender values of insurance policies are considered as the collateral for the loans given to life policy holders by Union Assurance PLC. System controls are in place to automatically convert a policy to lapse stage when the policy loan amount together with the interest is reaching the surrender value of the policy.
10.1.7 Preference SharesCumulative preference share investment which has a lien over assets, redeemable at the option of share holder.
10.1.8 Interest rate swapThe Group has entered into an interest rate swap that is a cash flow hedge. The changes in counterparty credit risk had no material effect on the hedge effectiveness assessment for derivatives designated in hedge relationships. Refer Note 12.3.

241
FINANCIAL STATEMENTS
10.1.9 Trade and other receivables
GROUP COMPANY
As at 31 MarchIn LKR ‘000s
2019 2018 2019 2018
Neither past due nor impaired 5,771,789 6,242,130 70,403 10,055
Past due but not impaired
0-30 days 5,700,688 2,688,856 1,255 4,166
31–60 days 948,464 987,250 3,334 17,748
61–90 days 240,657 307,675 644 4,331
> 91 days 750,990 1,222,749 5,310 10,881
Allowance for expected credit losses 579,858 691,590 4,682 -
Gross carrying value 13,992,446 12,140,250 85,628 47,181
Allowance for expected credit losses (579,858) (691,590) (4,682) -
Total 13,412,588 11,448,660 80,946 47,181
The Group has obtained customer deposits from major customers by reviewing their past performance and credit worthiness, as collateral.
The requirement for an impairment is analysed at each reporting date on an individual basis for major customers. Additionally, a large number of minor receivables are grouped into homogenous groups and assessed for impairment collectively. The calculation is based on its historical credit loss experience, adjusted for forward-looking factors specific to the debtors and the economic environment.
10.1.10 Reinsurance receivables The Union Assurance PLC operates a policy to manage its reinsurance counterparty exposures by limiting the reinsurers that may be used and applying strict limits to each reinsurer.
10.1.11 Premium receivableOnly designated institutions are employed as intermediary parties by Union Assurance PLC
Agreements have been signed with the intermediaries, committing them to settle dues within a specified time period.
10.1.12 Amounts due from related parties The Group’s amounts due from related parties mainly consists of associates and joint ventures.
The Company balance consists of the balances from affiliate companies.
10.1.13 Cash and cash equivalentsIn order to mitigate the concentration, settlement and operational risks related to cash and cash equivalents, the Group consciously manages the exposure to a single counterparty taking into consideration, where relevant, the rating or financial standing of the counterparty (where the position is reviewed as and when required), the duration of the exposure and the nature of the transaction and agreement governing the exposure.
10.2 Liquidity risk The Group’s policy is to hold cash and undrawn committed facilities at a level sufficient to ensure that the Group has available funds to meet its short and medium term capital and funding obligations, including organic growth and acquisition activities, and to meet any unforeseen obligations and opportunities. The Group holds cash and undrawn committed facilities to enable the Group to manage its liquidity risk.
The Group monitors its risk from a shortage of funds using a daily cash management process. This process considers the maturity of both the Group’s financial investments and financial assets (e.g. accounts receivable, other financial assets) and projected cash flows from operations.
The Group’s objective is to maintain a balance between continuity of funding and flexibility through the use of multiple sources of funding including debentures, bank loans, loan notes, overdrafts and finance leases over a broad spread of maturities.

242 JOHN KEELLS HOLDINGS PLC | ANNUAL REPORT 2018/19
NOTES TO THE FINANCIAL STATEMENTS
10 Financial risk management objectives and policies (Contd.)10.2.1 Net debt/(cash)
GROUP COMPANY
As at 31 MarchIn LKR ‘000s
2019 2018 2019 2018
Short term investments 52,756,625 64,386,093 41,594,883 49,157,472
Cash in hand and at bank 12,955,209 10,882,856 3,570,428 496,591
Adjustments to liquid assets (15,583,658) (12,028,016) - -
Total liquid assets 50,128,176 63,240,933 45,165,311 49,654,063
Interest-bearing loans and borrowings (Non-current) 21,276,504 18,521,034 559,382 -
Short term borrowings 9,970,906 3,128,508 4,000,010 -
Interest-bearing loans and borrowings (Current) 3,204,613 2,062,465 293,500 -
Bank overdrafts 20,060,719 6,010,089 7,220,109 62,477
Total liabilities 54,512,742 29,722,096 12,073,001 62,477
Net debt / (cash) 4,384,566 (33,518,837) (33,092,310) (49,591,586)
10.2.2 Liquidity risk management The mixed approach combines elements of the cash flow matching approach and the liquid assets approach. The business units attempt to match cash outflows in each time bucket against a combination of contractual cash inflows plus other inflows that can be generated through the sale of assets, repurchase agreement or other secured borrowing.
Maturity analysis - GroupThe table below summarises the maturity profile of the Group’s financial liabilities as at 31 March 2019 based on contractual undiscounted (principal plus interest) payments.
In LKR ‘000s Within 1 year
Between1-2 years
Between2-3 years
Between3-4 years
Between4-5 years
More than 5 years
Total
Interest-bearing loans and borrowings 3,322,211 4,844,343 2,819,896 15,789,811 868,732 - 27,644,993
Trade and other payables 19,744,822 - - - - - 19,744,822
Amounts due to related parties 92,532 - - - - - 92,532
Short term borrowings 10,002,601 - - - - - 10,002,601
Bank overdrafts 20,060,719 - - - - - 20,060,719
53,222,885 4,844,343 2,819,896 15,789,811 868,732 - 77,545,667
The table below summarises the maturity profile of the Group’s financial liabilities as at 31 March 2018 based on contractual undiscounted (principal plus interest) payments.
In LKR ‘000s Within 1 year
Between1-2 years
Between2-3 years
Between3-4 years
Between4-5 years
More than 5 years
Total
Interest-bearing loans and borrowings 2,327,985 1,680,425 1,400,490 14,585,385 1,084,159 128,618 21,207,062
Trade and other payables 16,077,499 - - - - - 16,077,499
Amounts due to related parties 5,168 - - - - - 5,168
Short term borrowings 3,128,508 - - - - - 3,128,508
Bank overdrafts 6,010,090 - - - - - 6,010,090
27,549,250 1,680,425 1,400,490 14,585,385 1,084,159 128,618 46,428,327
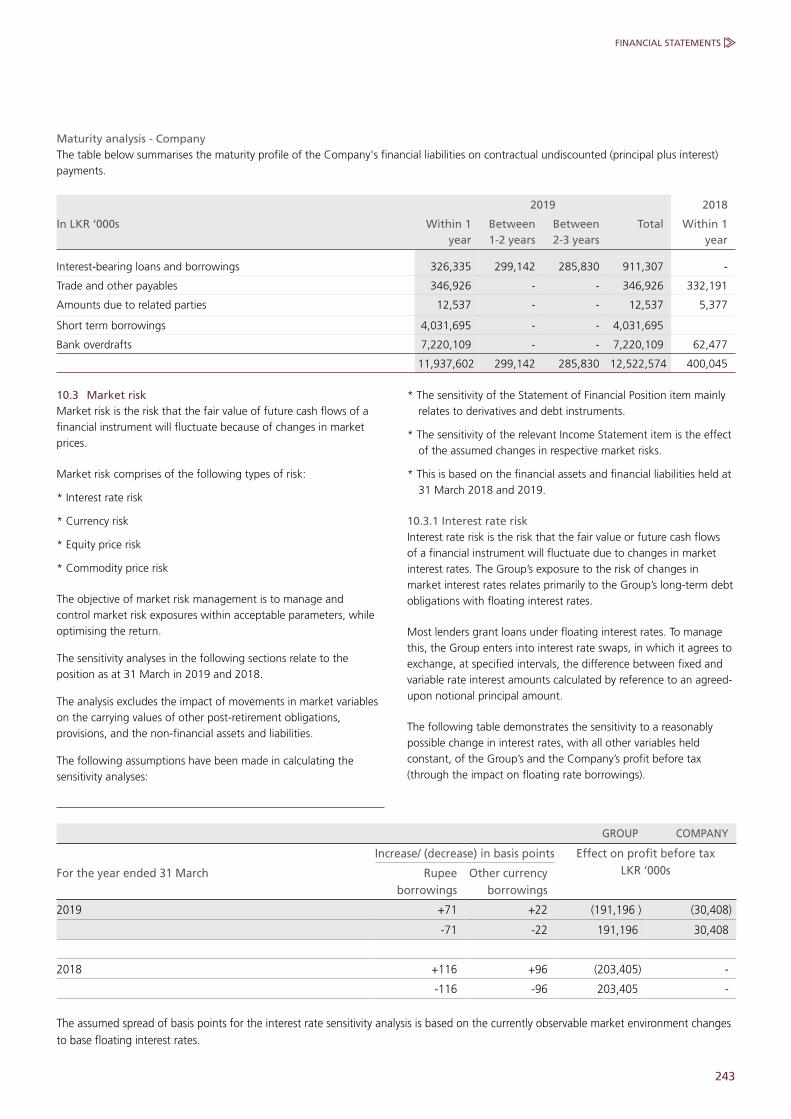
243
FINANCIAL STATEMENTS
Maturity analysis - CompanyThe table below summarises the maturity profile of the Company's financial liabilities on contractual undiscounted (principal plus interest) payments.
2019 2018
In LKR ‘000s Within 1 year
Between1-2 years
Between2-3 years
Total Within 1 year
Interest-bearing loans and borrowings 326,335 299,142 285,830 911,307 -
Trade and other payables 346,926 - - 346,926 332,191
Amounts due to related parties 12,537 - - 12,537 5,377
Short term borrowings 4,031,695 - - 4,031,695
Bank overdrafts 7,220,109 - - 7,220,109 62,477
11,937,602 299,142 285,830 12,522,574 400,045
10.3 Market risk Market risk is the risk that the fair value of future cash flows of a financial instrument will fluctuate because of changes in market prices.
Market risk comprises of the following types of risk:
* Interest rate risk
* Currency risk
* Equity price risk
* Commodity price risk
The objective of market risk management is to manage and control market risk exposures within acceptable parameters, while optimising the return.
The sensitivity analyses in the following sections relate to the position as at 31 March in 2019 and 2018.
The analysis excludes the impact of movements in market variables on the carrying values of other post-retirement obligations, provisions, and the non-financial assets and liabilities.
The following assumptions have been made in calculating the sensitivity analyses:
* The sensitivity of the Statement of Financial Position item mainly relates to derivatives and debt instruments.
* The sensitivity of the relevant Income Statement item is the effect of the assumed changes in respective market risks.
* This is based on the financial assets and financial liabilities held at 31 March 2018 and 2019.
10.3.1 Interest rate risk Interest rate risk is the risk that the fair value or future cash flows of a financial instrument will fluctuate due to changes in market interest rates. The Group’s exposure to the risk of changes in market interest rates relates primarily to the Group’s long-term debt obligations with floating interest rates.
Most lenders grant loans under floating interest rates. To manage this, the Group enters into interest rate swaps, in which it agrees to exchange, at specified intervals, the difference between fixed and variable rate interest amounts calculated by reference to an agreed-upon notional principal amount.
The following table demonstrates the sensitivity to a reasonably possible change in interest rates, with all other variables held constant, of the Group’s and the Company’s profit before tax (through the impact on floating rate borrowings).
GROUP COMPANY
Increase/ (decrease) in basis points Effect on profit before tax LKR ‘000sFor the year ended 31 March Rupee
borrowingsOther currency
borrowings
2019 +71 +22 (191,196 ) (30,408)
-71 -22 191,196 30,408
2018 +116 +96 (203,405) -
-116 -96 203,405 -
The assumed spread of basis points for the interest rate sensitivity analysis is based on the currently observable market environment changes to base floating interest rates.

244 JOHN KEELLS HOLDINGS PLC | ANNUAL REPORT 2018/19
NOTES TO THE FINANCIAL STATEMENTS
10 Financial risk management objectives and policies (Contd.)10.3.2 Foreign currency risk Foreign currency risk is the risk that the fair value or future cash flows of a financial instrument will fluctuate because of changes in foreign exchange rates. The Group has exposure to foreign currency risk where it has cash flows from overseas operations and foreign currency transactions which are affected by foreign exchange movements. Group treasury analyses the market condition of foreign exchange and provides market updates to the Group Executive Committee (GEC), with the use of external consultants’ advice. Based on the suggestions made by Group treasury, the GEC
takes decisions on whether to hold, sell, or make forward bookings of foreign currency as per decision rights given by the Board of Directors.
10.3.2.1 Effects of currency transaction on forward contract The following table demonstrates the sensitivity to a reasonably possible change in the USD/LKR exchange rate, with all other variables held constant, of the Group’s profit before tax due to changes in the fair value of the Group’s forward exchange contracts. Currently these financial instruments are categorised under trade and other receivables.
GROUP
For the year ended 31 March Increase/(decrease) in exchange rate USD
Effect on profit before tax LKR ‘000s
2019 +15% (97,248)
-15% 97,248
2018 +3% (49,614)
-3% 49,614
The assumed spread of the exchange rate is based on the current observable market environment.
10.3.2.2 Effects of currency translationFor purposes of the consolidated financial statements, the income and expenses and the assets and liabilities of subsidiaries located outside Sri Lanka are converted into Sri Lankan Rupees (LKR.). Therefore, period-to-period changes in average exchange rates may cause currency translation effects that have a significant impact on, for example, revenue, segment results (Earnings Before Interest
and Taxes –EBIT) and assets and liabilities of the Group. Unlike exchange rate transaction risk, exchange rate translation risk does not necessarily affect future cash flows. The Group’s equity position reflects changes in book values caused by exchange rates.
The Group’s exposure to foreign currency changes for all other currencies is not material.
GROUP COMPANY
For the year ended 31 March
Increase/(decrease)in exchange rate USD
Effect on profit before tax LKR ‘000s
Effect on equity LKR ‘000s
Effect on profit before tax LKR ‘000s
2019 +15% 396,230 9,531,171 3,359,434
-15% (396,230) (9,531,171) (3,359,434)
2018 +3% 243,361 1,440,806 500,683
-3% (243,361) (1,440,806) (500,683)
AssumptionsThe assumed spread of the exchange rate is based on the current observable market environment.
10.3.3 Equity price riskThe Group’s listed and unlisted equity securities are susceptible to market price risk arising from uncertainties about future values of the investment securities.
10.3.3.1 Financial assets at fair value through Profit and lossThe Group manages the equity price risk through diversification and by placing limits on individual and total equity instruments. Reports on the equity portfolio are submitted to the Group’s senior management on a regular basis. The Board of Directors reviews and approves all equity investment decisions.

245
FINANCIAL STATEMENTS
GROUP
As at 31 March 2019 2018
LKR ’000s % LKR ’000s %
Banks finance and insurance 1,759,255 64% 2,160,179 57%
Beverage food and tobacco 121,116 5% 96,964 3%
Construction and engineering 38,555 1% 123,427 3%
Diversified holdings 400,785 14% 488,139 13%
Manufacturing 402,602 14% 717,644 19%
Motors 6,722 0% 10,255 0%
Other services 11,623 0% 16,428 0%
Telecommunications 55,171 2% 203,588 5%
2,795,829 100% 3,816,624 100%
The above list comprises of the investments made by Union Assurance PLC.
10.3.3.2 Financial assets at fair value through OCIAll unquoted equity investments are made after obtaining Board of Directors’ approval.
10.3.3.3 Sensitivity analysisThe following table demonstrates the sensitivity to a reasonably possible change in the market index, with all other variables held constant, of the Group profit before tax and equity due to changes in the fair value of the listed equity securities.
GROUP
For the year ended 31 March Change in year-end market price index
Effect on profitbefore tax LKR ‘000s
Effect on equityLKR ‘000s
2019 13% 195,708 -
-13% (195,708) -
2018 7% 267,164 -
-7% (267,164) -
10.4 Capital management The primary objective of the Group’s capital management is to ensure that it maintains a strong financial position and healthy capital ratios in order to support its businesses and maximise shareholder value.
The Group manages its capital structure, and makes adjustments to it, in the light of changes in economic conditions. To maintain or adjust the capital structure, the Group may issue new shares, have a rights issue or buy back shares.
GROUP COMPANY
As at 31 March 2019 2018 2019 2018
Debt / Equity 23.6% 13.2% 10.0% 0.0%
246 JOHN KEELLS HOLDINGS PLC | ANNUAL REPORT 2018/19
NOTES TO THE FINANCIAL STATEMENTS
11. Fair value measurement and related fair value disclosures
Fair value measurement Fair value related disclosures for financial instruments and non-financial assets that are measured at fair value or where fair values are only, disclosed are reflected in this note. Aside from this note, additional fair value related disclosures, including the valuation methods, significant estimates and assumptions are also provided in:
• Investment in unquoted equity shares - Note 27.1
• Property, plant and equipment under revaluation model - Note 21.3
• Investment properties - Note 23
• Financial Instruments (including those carried at amortised cost) - Note 12
Accounting policyFair value is the price that would be received to sell an asset or paid to transfer a liability in an orderly transaction between market participants at the measurement date. The fair value measurement is based on the presumption that the transaction to sell the asset or transfer the liability takes place either:
• In the principal market for the asset or liability, or
• In the absence of a principal market, in the most advantageous market for the asset or liability
The principal or the most advantageous market must be accessible by the Group.
The fair value of an asset or a liability is measured using the assumptions that market participants would use when pricing the asset or liability, assuming that market participants act in their economic best interest.
A fair value measurement of a non-financial asset takes into account a market participant’s ability to generate economic benefits by using the asset in its highest and best use or by selling it to another market participant that would use the asset in its highest and best use.
The Group uses valuation techniques that are appropriate in the circumstances and for which sufficient data are available to measure fair value, maximising the use of relevant observable inputs and minimising the use of unobservable inputs.
All assets and liabilities for which fair value is measured or disclosed in the financial statements are categorised within the fair value hierarchy, described as follows, based on the lowest level input that is significant to the fair value measurement as a whole:
• Level 1 — Quoted (unadjusted) market prices in active markets for identical assets or liabilities
• Level 2 — Valuation techniques for which the lowest level input that is significant to the fair value measurement is directly or indirectly observable.
• Level 3 — Valuation techniques for which the lowest level input that is significant to the fair value measurement is unobservable.
For assets and liabilities that are recognised in the financial statements on a recurring basis, the Group determines whether transfers have occurred between levels in the hierarchy by re-assessing categorisation (based on the lowest level input that is significant to the fair value measurement as a whole) at the end of each reporting period.
The Group determines the policies and procedures for both recurring fair value measurement, such as investment properties and unquoted equity instruments, and for non-recurring measurement, such as assets held for sale in discontinued operations.
The services of external valuers are obtained for valuation of significant assets, such as land and building and investment properties. Selection criteria for external valuers include market knowledge, reputation, independence and whether professional standards are maintained. The Group decides, after discussions with the external valuers, which valuation techniques and inputs to use for individual assets.
For the purpose of fair value disclosures, the Group has determined classes of assets on the basis of the nature, characteristics and risks of the asset and the level of the fair value hierarchy as explained above.

247
FINANCIAL STATEMENTS
11.1 Fair value measurement hierarchy - GroupThe Group held the following financial instruments carried at fair value in the Statement of Financial Position:
Level 1 Level 2 Level 3 Total
As at 31 MarchIn LKR ‘000s
2019 2018 2019 2018 2019 2018 2019 2018
FINANCIAL ASSETS
Non-Listed Equity Investments
- - 273 150 104,705 119,031 104,978 119,181
Listed Equity Investments 2,796,063 3,816,968 88,407 92,621 - - 2,884,470 3,909,589
Quoted Debt Instruments 8,634,965 7,764,716 108,830 30,591 - - 8,743,795 7,795,307
Unquoted Debt Instruments - - 5,344 19,105 - - 5,344 19,105
Interest Rate SWAPs - - 391,308 598,097 - - 391,308 598,097
Total 11,431,028 11,581,684 594,162 740,564 104,705 119,031 12,129,895 12,441,279
NON FINANCIAL ASSETS
Note
Assets measured at fair value
Land and buildings 21.1 58,273,324 56,359,091 58,273,324 56,359,091
Buildings on leasehold land
21.1 17,675,171 14,382,337 17,675,171 14,382,337
Investment property 23 13,985,379 12,427,058 13,985,379 12,427,058
Total 89,933,874 83,168,486 89,933,874 83,168,486
In determining the fair value, highest and best use of the property has been considered including the current condition of the properties, future usability and associated redevelopment requirements. Also, the valuers have made reference to market evidence of transaction prices for similar properties, with appropriate adjustments for size and location. The appraised fair values are rounded within the range of values.
There has been no transfer between level 1 and level 2 in the current year.
11.2 Fair value measurement hierarchy - Company
FINANCIAL ASSETS Level 3
As at 31 MarchIn LKR ‘000s
2019 2018
Non-listed equity investments 61,524 75,461
11.3 Reconciliation of fair value measurements of level 3 financial instrumentsThe Group and Company carries unquoted equity shares classified as Level 3 within the fair value hierarchy. A reconciliation of the beginning and closing balances including movements is summarised below:
Non-listed equity investments
In LKR ‘000s Group Company
As at 1 April 2018 119,031 75,461
Purchase of unquoted equity shares 12,000 12,000
Disposal of unquoted equity shares (389) -
Remeasurement recognised in OCI (25,937) (25,937)
As at 31 March 2019 104,705 61,524
Fair valuation done as at 31 March 2019 for all unquoted equity shares are classified as Level 3 within the fair value hierarchy using fair valuation methodology. Fair value would not significantly vary if one or more of the inputs were changed.

248 JOHN KEELLS HOLDINGS PLC | ANNUAL REPORT 2018/19
NOTES TO THE FINANCIAL STATEMENTS
12. Financial instruments and related policies Accounting policyFinancial instruments — Initial recognition and subsequent measurementInitial recognition and measurementFinancial assets within the scope of SLFRS 9 are classified as amortised cost, fair value through other comprehensive income (OCI), and fair value through profit or loss.
The classification of financial assets at initial recognition depends on the financial asset’s contractual cash flow characteristics and the Group’s business model for managing them. This assessment is referred to as the SPPI test and is performed at an instrument level. The business model determines whether cash flows will result from collecting contractual cash flows, selling the financial assets, or both. With the exception of trade receivables that do not contain a significant financing component or for which the Group has applied the practical expedient are measured at the transaction price.
At initial recognition, the Group measures a financial asset at its fair value plus, in the case of a financial asset not at fair value through profit or loss (FVPL), transaction costs that are directly attributable to the acquisition of the financial asset. Transaction costs of financial assets carried at FVPL are expensed in profit or loss.
The Group’s financial assets include cash and short-term deposits, trade and other receivables, loans and other receivables, quoted and unquoted financial instruments and derivative financial instruments.
Subsequent measurementFor purposes of subsequent measurement, financial assets are classified in four categories
• Financial assets at amortised cost
• Financial assets at fair value through OCI with recycling of cumulative gains and losses
• Financial assets designated at fair value through OCI with no recycling of cumulative gains and losses upon derecognition
• Financial assets at fair value through profit or loss
Debt instrumentsFinancial assets at amortised costAssets that are held for collection of contractual cash flows where those cash flows represent solely payments of principal and interest are measured at amortised cost. The Group measures financial assets at amortised cost if both of the following conditions are met:
• The financial asset is held within a business model with the objective to hold financial assets in order to collect contractual cash flows
And
• The contractual terms of the financial asset give rise on specified dates to cash flows that are solely payments of principal and interest on the principal amount outstanding.
Financial assets at amortised cost are subsequently measured using the effective interest (EIR) method and are subject to impairment. Gains and losses are recognised in profit or loss when the asset is derecognised, modified or impaired.
The Group’s financial assets at amortised cost includes trade receivables and short term investments.
Financial assets at fair value through OCIAssets that are held for collection of contractual cash flows and for selling the financial assets, where the assets’ cash flows represent solely payments of principal and interest, are measured at FVOCI. The Group measures debt instruments at fair value through OCI if both of the following conditions are met:
• The financial asset is held within a business model with the objective of both holding to collect contractual cash flows and selling.
And
• The contractual terms of the financial asset give rise on specified dates to cash flows that are solely payments of principal and interest on the principal amount outstanding.
Movements in the carrying amount are taken through OCI, except for the recognition of impairment gains or losses, interest income and foreign exchange gains and losses which are recognised in profit or loss. When the financial asset is derecognised, the cumulative gain or loss previously recognised in OCI is reclassified from equity to profit or loss and recognised in other gains/(losses). Interest income from these financial assets is included in finance income using the effective interest rate method. Foreign exchange gains and losses are presented in other gains/(losses) and impairment expenses are presented as separate line item in the income statement.
Equity InstrumentsFinancial assets designated at fair value through OCI
Upon initial recognition, the Group can elect to classify irrevocably its equity investments as equity instruments designated at fair value through OCI when they meet the definition of equity under LKAS 32 Financial Instruments: Presentation and are not held for trading. The classification is determined on an instrument-by-instrument basis.
Gains and losses on these financial assets are never recycled to profit or loss. Dividends are recognised as other income in the statement of profit or loss when the right of payment has been established, except when the Group benefits from such proceeds as a recovery of part of the cost of the financial asset, in which case, such gains are recorded in OCI. Equity instruments designated at fair value through OCI are not subject to impairment assessment.
The Group elected to classify irrevocably its non-listed equity investments under this category.

249
FINANCIAL STATEMENTS
Financial assets at fair value through profit or lossFinancial assets at fair value through profit or loss include financial assets held for trading, financial assets designated upon initial recognition at fair value through profit or loss, or financial assets mandatorily required to be measured at fair value. Financial assets are classified as held for trading if they are acquired for the purpose of selling or repurchasing in the near term. Derivatives, including separated embedded derivatives, are also classified as held for trading unless they are designated as effective hedging instruments. Financial assets with cash flows that are not solely payments of principal and interest are classified and measured at fair value through profit or loss, irrespective of the business model. Notwithstanding the criteria for debt instruments to be classified at amortised cost or at fair value through OCI, as described above, debt instruments may be designated at fair value through profit or loss on initial recognition if doing so eliminates, or significantly reduces, an accounting mismatch.
Financial assets at fair value through profit or loss are carried in the statement of financial position at fair value with net changes in fair value recognised in the statement of profit or loss.
This category includes derivative instruments and listed equity investments which the Group had not irrevocably elected to classify at fair value through OCI. Dividends on listed equity investments are also recognised as other income in the statement of profit or loss when the right of payment has been established.
Financial assets - derecognitionFinancial assets are derecognised when the rights to receive cash flows from the financial assets have expired or have been transferred and the Group has transferred substantially all the risks and rewards of ownership.
Impairment of financial assetsFrom 1 April 2018, the Group assesses on a forward looking basis the expected credit losses associated with its debt instruments carried at amortised cost and FVOCI. The impairment methodology applied depends on whether there has been a significant increase in credit risk.
For trade receivables, the Group applies the simplified approach permitted by SLFRS 9, which requires expected lifetime losses to be recognised from initial recognition of the receivables. The Group has established a provision matrix that is based on its historical credit loss experience, adjusted for forward-looking factors specific to the debtors and the economic environment.
Financial LiabilitiesInitial recognition and measurementFinancial liabilities are classified, at initial recognition, as financial liabilities at fair value through profit or loss, loans and borrowings, payables, or as derivatives designated as hedging instruments in an effective hedge, as appropriate.
All financial liabilities are recognised initially at fair value and, in the case of loans and borrowings and payables, net of directly attributable transaction costs.
The Group’s financial liabilities include trade and other payables, loans and borrowings including bank overdrafts, and derivative financial instruments.
Subsequent measurementThe measurement of financial liabilities depends on their classification, as described below:
Financial liabilities at fair value through profit or lossFinancial liabilities at fair value through profit or loss include financial liabilities held for trading and financial liabilities designated upon initial recognition as at fair value through profit or loss.
Financial liabilities are classified as held for trading if they are incurred for the purpose of repurchasing in the near term. This category also includes derivative financial instruments entered into by the Group that are not designated as hedging instruments in hedge relationships as defined by SLFRS 9. Separated embedded derivatives are also classified as held for trading unless they are designated as effective hedging instruments.
Gains or losses on liabilities held for trading are recognised in the statement of profit or loss.
Loans and borrowingsThis is the category most relevant to the Group. After initial recognition, interest-bearing loans and borrowings are subsequently measured at amortised cost using the EIR method. Gains and losses are recognised in profit or loss when the liabilities are derecognised as well as through the EIR amortisation process.
Amortised cost is calculated by taking into account any discount or premium on acquisition and fees or costs that are an integral part of the EIR. The EIR amortisation is included as finance costs in the statement of profit or loss.
DerecognitionA financial liability is derecognised when the obligation under the liability is discharged or cancelled or expires. When an existing financial liability is replaced by another from the same lender on substantially different terms, or the terms of an existing liability are substantially modified, such an exchange or modification is treated as the derecognition of the original liability and the recognition of a new liability. The difference in the respective carrying amounts is recognised in the statement of profit or loss.
Offsetting of financial instrumentsFinancial assets and financial liabilities are offset and the net amount is reported in the consolidated statement of financial position if there is a currently enforceable legal right to offset the recognised amounts and there is an intention to settle on a net basis, to realise the assets and settle the liabilities simultaneously.
Derivative financial instruments and hedge accounting - Initial recognition and subsequent measurementThe Group uses derivative financial instruments, such as forward currency contracts, interest rate swaps and forward commodity

250 JOHN KEELLS HOLDINGS PLC | ANNUAL REPORT 2018/19
NOTES TO THE FINANCIAL STATEMENTS
contracts, to hedge its foreign currency risks, interest rate risks and commodity price risks, respectively. Such derivative financial instruments are initially recognised at fair value on the date on which a derivative contract is entered into and are subsequently
remeasured at fair value. Derivatives are carried as financial assets when the fair value is positive and as financial liabilities when the fair value is negative.
12. Financial instruments and related policies (Contd.)
12.1 Financial assets and liabilities by categories in accordance with SLFRS 9 - Group
Financial assets at amortised cost
Financial assets at fair value through OCI / AFS*
As at 31 MarchIn LKR ‘000s
2019 2018 2019 2018
Financial instruments in non-current assets / non-current liabilities
Non-current financial assets 27,116,064 24,973,100 7,590,526 7,183,319
Interest-bearing loans and borrowings - - - -
Financial instruments in current assets / current liabilities
Trade and other receivables / Payables 14,420,945 12,273,372 - -
Amounts due from / Due to related parties 225,634 139,640 - -
Short term investments / Short term borrowings 48,542,096 60,945,281 4,214,529 3,440,812
Cash in hand and at bank / Bank overdrafts 12,955,209 10,882,856 - -
Interest-bearing loans and borrowings - - - -
Bank overdrafts - - - -
Total 103,259,948 109,214,249 11,805,055 10,624,131
* AFS - Available for sale financial assets
12.2 Financial assets and liabilities by categories in accordance with SLFRS 9 - Company
Financial assets at amortised cost
Financial assets at fair value through profit or loss
As at 31 MarchIn LKR ‘000s
2019 2018 2019 2018
Financial instruments in non-current assets/non-current liabilities
Non-current financial assets 219,745 191,650 61,524 75,461
Interest-bearing loans and borrowings - - - -
- - - -
Financial instruments in current assets/current liabilities
Trade and other receivables / payables 106,120 70,730 - -
Amounts due from / due to related parties 181,226 404,364 - -
Short term investments / Short term borrowings 41,594,883 49,157,472 - -
Cash in hand and at bank 3,570,428 496,591 - -
Interest-bearing loans and borrowings - - - -
Bank overdrafts - - - -
Total 45,672,402 50,320,807 61,524 75,461

251
FINANCIAL STATEMENTS
For the purpose of hedge accounting, hedges are classified as:
• Fair value hedges when hedging the exposure to changes in the fair value of a recognised asset or liability or an unrecognised firm commitment
• Cash flow hedges when hedging the exposure to variability in cash flows that is either attributable to a particular risk associated with a recognised asset or liability or a highly probable forecast transaction or the foreign currency risk in an unrecognised firm commitment
• Hedges of a net investment in a foreign operation.
Financial assets at fair value through profit or loss
Derivative financial instruments
Total Financial liabilities measured at amortised cost
2019 2018 2019 2018 2019 2018 2019 2018
88,407 123,738 391,308 598,097 35,186,305 32,878,254 - -
- - - - - - 21,276,504 18,521,034
- - - - 14,420,945 12,273,372 19,744,821 16,077,499
- - - - 225,634 139,640 92,532 5,168
- - - - 52,756,625 64,386,093 - -
- - - - 12,955,209 10,882,856 9,970,906 3,128,508
- - - - - - 3,204,613 2,062,465
- - - - - - 20,060,719 6,010,089
88,407 123,738 391,308 598,097 115,544,718 120,560,215 74,350,095 45,804,763
Total Financial liabilities measured at amortised cost
2019 2018 2019 2018
281,269 267,111 - -
- - 559,382 -
- - - -
106,120 70,730 346,926 332,191
181,226 404,364 12,537 5,377
41,594,883 49,157,472 4,000,010 -
3,570,428 496,591 - -
- - 293,500 -
- - 7,220,109 62,477
45,733,926 50,396,268 12,432,464 400,045
The management assessed that, cash and short-term deposits, trade receivables, trade payables, bank overdrafts and other current financial liabilities approximate their carrying amounts largely due to the short-term maturities of these instruments.
Fair value is the price that would be received to sell an asset or paid to transfer a liability in an orderly transaction between market participants at the measurement date.
The following methods and assumptions were used to estimate the fair values:Fair value of quoted equities, debentures and bonds is based on price quotations in an active market at the reporting date
The fair value of unquoted instruments, loans from banks and other financial liabilities, obligations under finance leases, as well as other non-current financial liabilities are estimated by discounting future cash flows using rates currently available for debt on similar terms, credit risk and remaining maturities.

252 JOHN KEELLS HOLDINGS PLC | ANNUAL REPORT 2018/19
NOTES TO THE FINANCIAL STATEMENTS
Accounting judgements, estimates and assumptionsFair value of financial instrumentsWhere the fair value of financial assets and financial liabilities recorded in the statement of financial position cannot be derived from active markets, their fair value is determined using valuation techniques including the discounted cash flow model. The inputs to these models are taken from observable markets where possible.
Where this is not feasible, a degree of judgement is required in establishing fair values. The judgements include considerations of inputs such as liquidity risk, credit risk and volatility.
NOTES TO THE INCOME STATEMENT, STATEMENT OF COMPREHENSIVE INCOME AND STATEMENT OF FINANCIAL POSITION
13. RevenueAccounting policy13.1 Total revenue13.1.1 Revenue from contract with customersRevenue from contracts with customers is recognised when control of the goods or services is transferred to the customer at an amount that reflects the consideration to which the Group expects to be entitled in exchange for those goods or services.
Goods transferred at a point in timeUnder SLFRS 15, revenue is recognised upon satisfaction of a performance obligation. The revenue recognition occurs at a point in time when control of the asset is transferred to the customer, generally, on delivery of the goods.
Services transferred over timeUnder SLFRS 15, the Group determines, at contract inception, whether it satisfies the performance obligation over time or at a point in time. For each performance obligation satisfied over time, the Group recognises the revenue over time by measuring the progress towards complete satisfaction of that performance obligation.
13.1.2 Revenue from insurance contractsRevenue from insurance contracts comprise of gross written premiums net of premium ceded to reinsurers.
13.2 Disaggregation of revenue The Group presented disaggregated revenue with Group’s reportable segments based on timing of revenue recognition and geographical region in the operating segment information section.
GROUP COMPANY
For the year ended 31 MarchIn LKR ‘000s
Note 2019 2018 2019 2018
Timing of revenue recognition
Goods transferred at a point in time 96,923,799 81,974,902 - -
Services transferred over time 27,895,123 29,368,337 1,721,687 1,347,707
Total revenue from contracts with customers 13.1.1 124,818,922 111,343,239 1,721,687 1,347,707
Revenue from insurance contracts 13.1.2 10,637,226 9,871,833 - -
Total revenue 135,456,148 121,215,072 1,721,687 1,347,707
12. Financial instruments and related policies (Contd.)Fair value of the unquoted ordinary shares has been estimated using a Discounted Cash Flow (DCF) model. The valuation requires management to make certain assumptions about the model inputs,
including forecast cash flows, the discount rate, credit risk and volatility. The probabilities of the various estimates within the range can be reasonably assessed and are used in management’s estimate of fair value for these unquoted equity investments.
12.3 Derivative financial instruments
GROUP
Contract notional amountIn USD ‘000s
Fair valueIn LKR ‘000s
As at 31 March Cash-flow hedges
2019 2018
Interest rate swaps 75,000 391,308 598,097
253
FINANCIAL STATEMENTS
13.3 Reconciliation of revenue Reconciliation between Revenue from contracts with customers and revenue information that is disclosed for each reportable segment has been provided in the operating segment information section.
13.4 Contract balancesContract assetsContract assets are the Group’s right to consideration in exchange for goods or services that the Group has transferred to a customer, with rights that are conditional on some criteria other than the passage of time. Upon satisfaction of the conditions, the amounts recognised as contract assets are reclassified to trade receivables.
Contract liabilitiesContract liabilities are the Group's obligation to transfer goods or services to a customer for which the Group has received consideration (or the amount is due) from the customer. Contract liabilities include long-term advances received to deliver goods and services, short-term advances received to render certain services as well as transaction price allocated to unexpired service warranties, and loyalty points not yet redeemed.
Contract liabilities of the Group have been disclosed in other non current liabilities, trade and other payables and other current liabilities in Note 38, 39 and 41 respectively.
13.5 Performance obligations and significant judgementsThe Group’s performance obligations and significant judgements are summarised below:
TransportationThis operating segment provides an array of transportation related services, which primarily include a marine bunkering business, shipping, logistics and air transportation multinationals as well as travel and airline services. In providing airline services, net revenue is recognised at a point in time upon the sale of tickets as the entity is deemed as the agent. Total transaction price is comprised of cost and commission which is equal to the total ticketing service fee.
In providing Marine Services, the principal activity of the entity is to supply bunker services to their customers, in exchange for a bunker fee. The performance obligation can be termed as bunkering services. Revenue is recognised at a point in time, upon supply of the bunker to the vessels. Transaction price shall comprise of cost and mark up which is equal to total bunkering fee.
Consumer Foods Consumer Foods segment focuses on manufacturing of a wide range of beverages, frozen confectionary, processed meat and dairy products. Revenue is recognised at the point in time when the control of the asset is transferred to the customer, which is generally upon delivery of the goods. Revenue is measured based on actual sales, and therefore the output method is used for revenue recognition.
RetailThe Retail segment focuses on modern organised retailing through a chain of supermarkets. The office automation business comprises of distribution of printers, copiers, smart phones and other office automation equipment.
Revenue is recognised upon satisfaction of a performance obligation. The revenue recognition occurs at a point in time when control of the asset is transferred to the customer, which is generally upon delivery of the goods. The output method will provide a faithful depiction in recognising revenue.
Customers who purchase from outlets may enter the entity’s customer loyalty programme and earn points that are redeemable against future purchases of the entity’s products. The entity will allocate a portion of the transaction price to the loyalty programme based on relative standalone selling price.
Leisure Leisure segment comprises of city hotels, resort hotels, as well as destination management business.
The revenue for providing the services are usually recognised at or after the guests' departure, over the period of stay or at the point of arrival of guests. The entity identifies the services under each contract as one performance obligation. The revenue is accounted based on the output method. Since revenue will be based on the final good or service provided, the output method will provide a faithful depiction in recognising revenue.
In providing destination management services, the entity acts as the principal. Customer receives and consumes the benefits of the entity's performance, as and when the service is performed. Therefore, revenue is recognised at gross over the period, based on the output method. The timing and the amount of cashflow will vary according to the agreements.
Transaction price shall comprise of supplier fee and company mark-up, summing up to be the Gross Service fee. The advance payments are recognised as a liability. Upon provision of the services, the liability is set off and revenue is recognised over the period.
PropertyProperty segment concentrates primarily on property development, renting of office, retail space and management of the Group’s real estate.
At inception of the contract, the entity determines whether it satisfies the performance obligation over time or at a point in time. Timing and amount of cashflow will be determined according to the agreement.
Financial ServicesFinancial Services provides a complete range of financial solutions including commercial banking, insurance, stock broking, debt trading, fund management and leasing. The services under one contract can be identified as one performance obligation.
Entity determines at contract inception whether it satisfies the performance obligation over time or at a point in time. For each performance obligation satisfied overtime, the entity recognises the revenue over time by measuring the progress towards complete satisfaction of that performance obligation. The output method will provide a faithful depiction in recognising revenue.
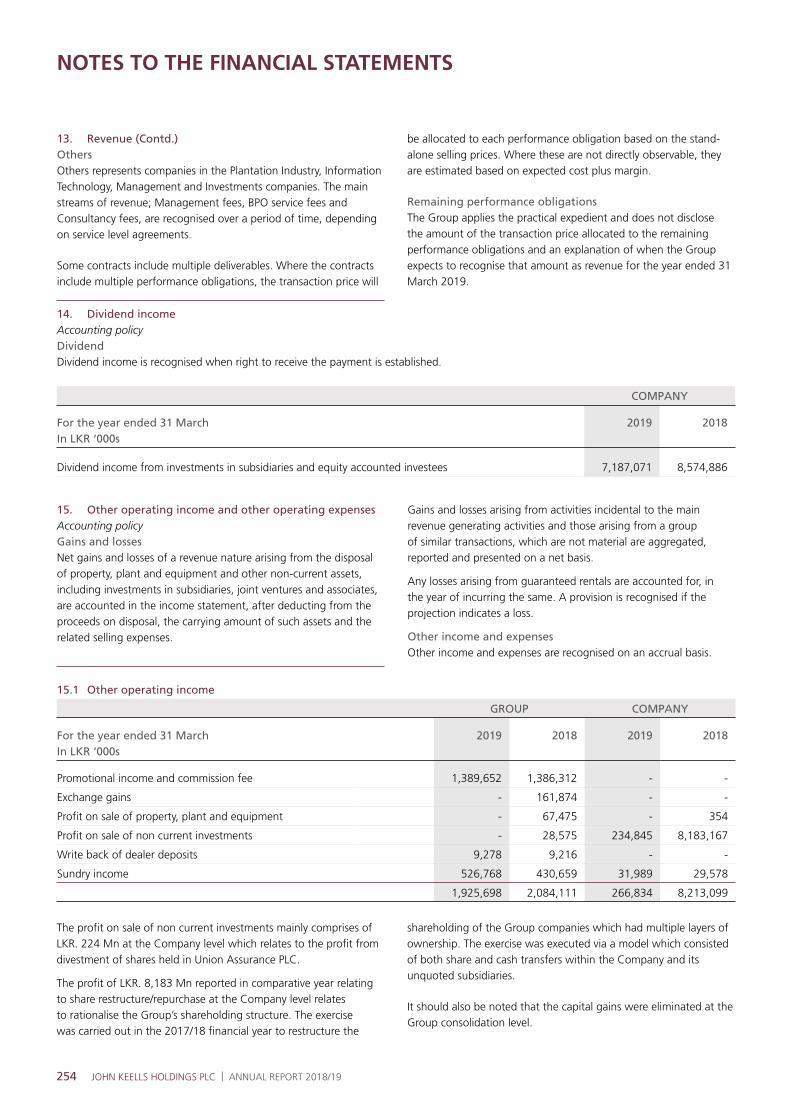
254 JOHN KEELLS HOLDINGS PLC | ANNUAL REPORT 2018/19
NOTES TO THE FINANCIAL STATEMENTS
14. Dividend income Accounting policy DividendDividend income is recognised when right to receive the payment is established.
COMPANY
For the year ended 31 MarchIn LKR ‘000s
2019 2018
Dividend income from investments in subsidiaries and equity accounted investees 7,187,071 8,574,886
15. Other operating income and other operating expenses Accounting policy Gains and lossesNet gains and losses of a revenue nature arising from the disposal of property, plant and equipment and other non-current assets, including investments in subsidiaries, joint ventures and associates, are accounted in the income statement, after deducting from the proceeds on disposal, the carrying amount of such assets and the related selling expenses.
Gains and losses arising from activities incidental to the main revenue generating activities and those arising from a group of similar transactions, which are not material are aggregated, reported and presented on a net basis.
Any losses arising from guaranteed rentals are accounted for, in the year of incurring the same. A provision is recognised if the projection indicates a loss.
Other income and expensesOther income and expenses are recognised on an accrual basis.
15.1 Other operating income
GROUP COMPANY
For the year ended 31 MarchIn LKR ‘000s
2019 2018 2019 2018
Promotional income and commission fee 1,389,652 1,386,312 - -
Exchange gains - 161,874 - -
Profit on sale of property, plant and equipment - 67,475 - 354
Profit on sale of non current investments - 28,575 234,845 8,183,167
Write back of dealer deposits 9,278 9,216 - -
Sundry income 526,768 430,659 31,989 29,578
1,925,698 2,084,111 266,834 8,213,099
13. Revenue (Contd.)OthersOthers represents companies in the Plantation Industry, Information Technology, Management and Investments companies. The main streams of revenue; Management fees, BPO service fees and Consultancy fees, are recognised over a period of time, depending on service level agreements.
Some contracts include multiple deliverables. Where the contracts include multiple performance obligations, the transaction price will
be allocated to each performance obligation based on the stand-alone selling prices. Where these are not directly observable, they are estimated based on expected cost plus margin.
Remaining performance obligationsThe Group applies the practical expedient and does not disclose the amount of the transaction price allocated to the remaining performance obligations and an explanation of when the Group expects to recognise that amount as revenue for the year ended 31 March 2019.
The profit on sale of non current investments mainly comprises of LKR. 224 Mn at the Company level which relates to the profit from divestment of shares held in Union Assurance PLC.
The profit of LKR. 8,183 Mn reported in comparative year relating to share restructure/repurchase at the Company level relates to rationalise the Group’s shareholding structure. The exercise was carried out in the 2017/18 financial year to restructure the
shareholding of the Group companies which had multiple layers of ownership. The exercise was executed via a model which consisted of both share and cash transfers within the Company and its unquoted subsidiaries.
It should also be noted that the capital gains were eliminated at the Group consolidation level.
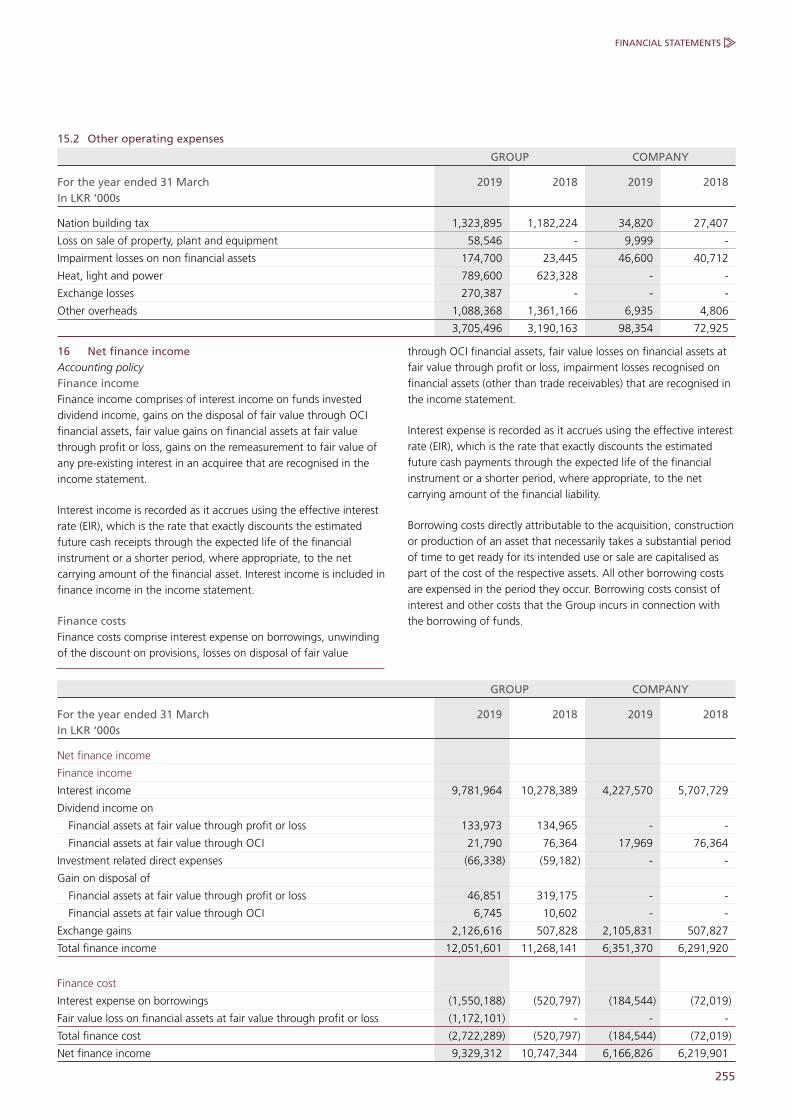
255
FINANCIAL STATEMENTS
15.2 Other operating expenses
GROUP COMPANY
For the year ended 31 MarchIn LKR ‘000s
2019 2018 2019 2018
Nation building tax 1,323,895 1,182,224 34,820 27,407
Loss on sale of property, plant and equipment 58,546 - 9,999 -
Impairment losses on non financial assets 174,700 23,445 46,600 40,712
Heat, light and power 789,600 623,328 - -
Exchange losses 270,387 - - -
Other overheads 1,088,368 1,361,166 6,935 4,806
3,705,496 3,190,163 98,354 72,925
16 Net finance income Accounting policy Finance incomeFinance income comprises of interest income on funds invested dividend income, gains on the disposal of fair value through OCI financial assets, fair value gains on financial assets at fair value through profit or loss, gains on the remeasurement to fair value of any pre-existing interest in an acquiree that are recognised in the income statement.
Interest income is recorded as it accrues using the effective interest rate (EIR), which is the rate that exactly discounts the estimated future cash receipts through the expected life of the financial instrument or a shorter period, where appropriate, to the net carrying amount of the financial asset. Interest income is included in finance income in the income statement.
Finance costsFinance costs comprise interest expense on borrowings, unwinding of the discount on provisions, losses on disposal of fair value
through OCI financial assets, fair value losses on financial assets at fair value through profit or loss, impairment losses recognised on financial assets (other than trade receivables) that are recognised in the income statement.
Interest expense is recorded as it accrues using the effective interest rate (EIR), which is the rate that exactly discounts the estimated future cash payments through the expected life of the financial instrument or a shorter period, where appropriate, to the net carrying amount of the financial liability.
Borrowing costs directly attributable to the acquisition, construction or production of an asset that necessarily takes a substantial period of time to get ready for its intended use or sale are capitalised as part of the cost of the respective assets. All other borrowing costs are expensed in the period they occur. Borrowing costs consist of interest and other costs that the Group incurs in connection with the borrowing of funds.
GROUP COMPANY
For the year ended 31 MarchIn LKR ‘000s
2019 2018 2019 2018
Net finance income
Finance income
Interest income 9,781,964 10,278,389 4,227,570 5,707,729
Dividend income on
Financial assets at fair value through profit or loss 133,973 134,965 - -
Financial assets at fair value through OCI 21,790 76,364 17,969 76,364
Investment related direct expenses (66,338) (59,182) - -
Gain on disposal of
Financial assets at fair value through profit or loss 46,851 319,175 - -
Financial assets at fair value through OCI 6,745 10,602 - -
Exchange gains 2,126,616 507,828 2,105,831 507,827
Total finance income 12,051,601 11,268,141 6,351,370 6,291,920
Finance cost
Interest expense on borrowings (1,550,188) (520,797) (184,544) (72,019)
Fair value loss on financial assets at fair value through profit or loss (1,172,101) - - -
Total finance cost (2,722,289) (520,797) (184,544) (72,019)
Net finance income 9,329,312 10,747,344 6,166,826 6,219,901

256 JOHN KEELLS HOLDINGS PLC | ANNUAL REPORT 2018/19
NOTES TO THE FINANCIAL STATEMENTS
GROUP COMPANY
For the year ended 31 MarchIn LKR ‘000s
2019 2018 2019 2018
Profit before tax
Profit before tax is stated after charging all expenses including the following;
Remuneration to executive directors 372,220 366,959 133,084 192,881
Remuneration to non executive directors 46,380 47,037 17,280 17,360
Costs of defined employee benefits
Defined benefit plan cost 381,970 371,908 34,458 37,610
Defined contribution plan cost - EPF and ETF 965,095 872,819 82,117 79,033
Other long term employee benefits cost 95,629 - 21,379 -
Staff expenses 13,384,639 11,458,870 629,606 609,705
Share based payments 475,629 517,374 144,665 170,759
Auditors’ remuneration
Audit 45,265 42,266 6,332 5,974
Non-audit 24,767 18,162 8,164 6,758
Depreciation of property, plant and equipment 3,657,780 3,236,226 36,870 32,555
Amortisation of intangible assets 415,951 325,531 12,962 18,861
Amortisation of lease rentals paid in advance 478,292 458,459 - -
Impairment losses 174,700 23,445 46,600 40,712
Operating lease payments 787,077 746,369 - -
Sub lease payments 56,210 36,083 - -
(Profit) / loss on sale of property, plant and equipment and intangible assets 58,546 (67,475) 9,999 (354)
Donations 4,949 8,256 505 505
17 Profit before tax Accounting policy Expenditure recognitionExpenses are recognised in the income statement on the basis of a direct association between the cost incurred and the earning of specific items of income. All expenditure incurred in the running of
the business and in maintaining the property, plant and equipment in a state of efficiency has been charged to the income statement.
For the purpose of presentation of the income statement, the “function of expenses” method has been adopted, on the basis that it presents fairly the elements of the Company’s and Group’s performance.

257
FINANCIAL STATEMENTS
18. Earnings per shareAccounting policyBasic EPS is calculated by dividing the profit for the year attributable to ordinary equity holders of the parent by the weighted average number of ordinary shares outstanding during the year. Diluted EPS is calculated by dividing the profit attributable to ordinary equity
18.1 Basic earnings per share
GROUP
For the year ended 31 MarchIn LKR ‘000s
Note 2019 2018
Profit attributable to equity holders of the parent 15,254,126 21,021,031
Weighted average number of ordinary shares 18.3 1,370,193 1,387,497
Basic earnings per share 11.13 15.15
18.2 Diluted earnings per share
Profit attributable to equity holders of the parent 15,254,126 21,021,031
Adjusted weighted average number of ordinary shares 18.3 1,370,348 1,387,969
Diluted earnings per share 11.13 15.15
18.3 Amount used as denominator
GROUP
For the year ended 31 MarchIn ‘000s
2019 2018
Ordinary shares at the beginning of the year 1,387,529 1,387,468
Re-purchase of ordinary shares (17,339) -
Effect of share options exercised 3 29
Weighted average number of ordinary shares in issue before dilution 1,370,193 1,387,497
Effects of dilution from:
Employee share option plans 155 472
Adjusted weighted average number of ordinary shares 1,370,348 1,387,969
19. Dividend per share
COMPANY
For the year ended 31 March 2019 2018
LKR In LKR ‘000s LKR In LKR ‘000s
Equity dividend on ordinary shares declared and paid during the year
Final dividend (Previous years’ final dividend paid in the current year) 2.00 2,775,057 2.00 2,774,934
Interim dividends 4.00 5,411,393 4.00 5,550,049
Total dividend 6.00 8,186,450 6.00 8,324,983
holders of the parent (after adjusting for outstanding share options) by the weighted average number of ordinary shares outstanding during the year plus the weighted average number of ordinary shares that would be issued on conversion of all the dilutive potential ordinary shares into ordinary shares.

258 JOHN KEELLS HOLDINGS PLC | ANNUAL REPORT 2018/19
NOTES TO THE FINANCIAL STATEMENTS
20. TaxesAccounting policy Current taxCurrent tax assets and liabilities for the current and prior periods are measured at the amount expected to be recovered from or paid to the taxation authorities. The tax rates and tax laws used to compute the amount are those that are enacted or substantively enacted, at the reporting date in the countries where the Group operates and generates taxable income.
Current income tax relating to items recognised directly in equity is recognised in equity and for items recognised in other comprehensive income shall be recognised in other comprehensive income and not in the income statement. Management periodically evaluates positions taken in the tax returns with respect to situations in which applicable tax regulations are subject to interpretation and establishes provisions where appropriate.
Management has used its judgment on the application of tax laws including transfer pricing regulations involving identification of associated undertakings, estimation of the respective arm’s length prices and selection of appropriate pricing mechanisms.
The Group has complied with the arm’s length principles relating to transfer pricing as prescribed in the Inland Revenue Act.
Deferred taxDeferred tax is provided using the liability method on temporary differences at the reporting date between the tax bases of assets and liabilities and their carrying amounts for financial reporting purposes.
Deferred tax liabilities are recognised for all taxable temporary differences, except:
• Where the deferred tax liability arising from the initial recognition of goodwill or of an asset or liability in a transaction that is not a business combination and, at the time of the transaction, affects neither the accounting profit nor the taxable profit or loss; and
• In respect of taxable temporary differences associated with investments in subsidiaries, associates and interests in joint ventures, where the timing of the reversal of the temporary differences can be controlled and it is probable that the temporary differences will not reverse in the foreseeable future.
Deferred tax assets are recognised for all deductible temporary differences, and unused tax credits and tax losses carried forward, to the extent that it is probable that taxable profit will be available against which the deductible temporary differences and the unused tax credits and tax losses carried forward can be utilised except:
• Where the deferred income tax assets relating to the deductible temporary difference arises from the initial recognition of an asset or liability in a transaction that is not a business combination and, at the time of the transaction, affects neither the accounting profit nor taxable profit or loss; and
• In respect of deducible temporary differences associated with investments in subsidiaries, associates and interests in joint ventures, deferred tax assets are recognised only to the extent that it is probable that the temporary differences will reverse in the foreseeable future and taxable profit will be available against which the temporary differences can be utilised.
The carrying amount of deferred tax assets is reviewed at each reporting date and reduced to the extent that it is no longer probable that sufficient taxable profit will be available to allow all or part of the deferred tax asset to be utilised. Unrecognised deferred tax assets are reassessed at each reporting date and are recognised to the extent that it has become probable that future taxable profit will allow the deferred tax asset to be recovered.
Deferred tax assets and liabilities are measured at tax rates that are expected to apply to the year when the asset is realised or liability is settled, based on the tax rates and tax laws that have been enacted or substantively enacted as at the reporting date.
Deferred tax relating to items recognised outside the income statement is recognised outside the income statement. Deferred tax items are recognised in correlation to the underlying transaction either in other comprehensive income or directly in equity.
Deferred tax assets and deferred tax liabilities are offset, if a legally enforceable right exists to set off current tax assets against current tax liabilities and when the deferred taxes relate to the same taxable entity and the same taxation authority.
No deferred tax asset or liability has been recognised in the companies which are enjoying the Board of Investment (BOI) tax holiday period, if there are no qualifying assets or liabilities beyond the tax holiday period.
Sales taxRevenues, expenses and assets are recognised net of the amount of sales tax except:
• Where the sales tax incurred on the purchase of an asset or service is not recoverable from the taxation authority, in which case the sales tax is recognised as part of the cost of acquisition of the asset or as part of the expense item as applicable; and
• Where receivables and payables are stated with the amount of sales tax included.
The net amount of sales tax recoverable from, or payable to, the taxation authority is included as part of receivables or payables in the statement of financial position.

259
FINANCIAL STATEMENTS
20.1 Tax expense
GROUP COMPANY
For the year ended 31 MarchIn LKR ‘000s
2019 2018 2019 2018
Income statement
Current tax charge 20.5 2,456,600 3,240,376 1,139,058 1,293,431
(Over)/Under provision of current tax of previous years (49,920) (63,223) - -
Irrecoverable economic service charge 20.7 8,842 - - -
Withholding tax on inter company dividends 801,201 681,700 - -
Deferred tax charge/(reversal)
Relating to origination and reversal of temporary differences 20.2 (838,609) 655,776 - -
20.6 2,378,114 4,514,629 1,139,058 1,293,431
Other comprehensive income
Deferred tax charge/(reversal)
Relating to origination and reversal of temporary differences 20.2 405,806 4,106,764 - -
20.2 405,806 4,106,764 - -
20.2 Deferred tax expense
GROUP
For the year ended 31 MarchIn LKR ‘000s
2019 2018
Income statement
Deferred tax expense arising from;
Accelerated depreciation for tax purposes 216,654 366,581
Revaluation of investment property to fair value 31,757 169,372
Retirement benefit obligations (6,691) (21,490)
Benefit arising from tax losses (1,125,255) (83,300)
Others 44,926 224,613
Deferred tax charged / (credited) directly to Income Statement (838,609) 655,776
Other comprehensive income
Deferred tax expense arising from;
Actuarial losses on defined benefit obligations 3,027 (4,849)
Revaluation of land and building to fair value 366,820 4,111,613
Net gain/loss on financial assets at fair value through OCI 35,959 -
Deferred tax charged/(credited) directly to OCI 405,806 4,106,764
Deferred tax has been computed at 28% for all standard rate companies (including listed companies) and at rates as disclosed in Notes 20.9 and 20.10.
Temporary differences associated with the undistributed reserves in subsidiaries for which a deferred tax liability has not been recognised, amounts to LKR. 3,161 Mn (2018 - LKR. 1,878 Mn). The deferred tax effect on undistributed reserves of subsidiaries has not been recognised since the parent can control the timing of the reversal of these temporary differences.
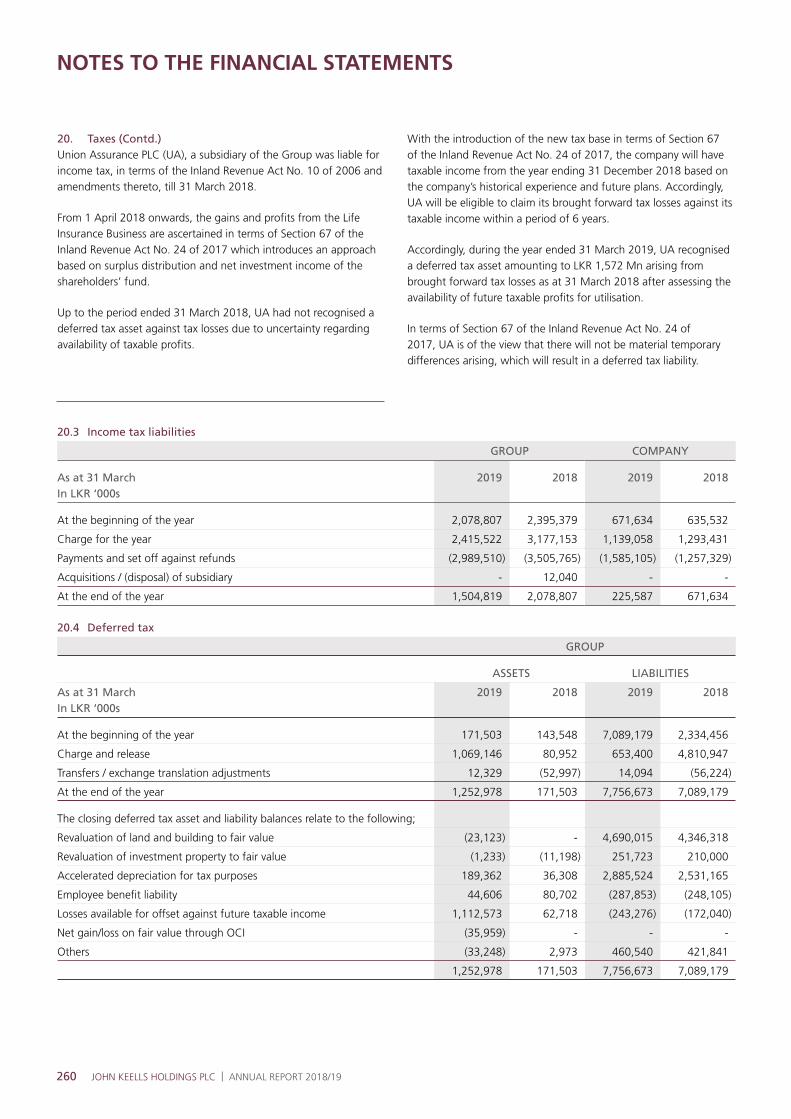
260 JOHN KEELLS HOLDINGS PLC | ANNUAL REPORT 2018/19
NOTES TO THE FINANCIAL STATEMENTS
20.3 Income tax liabilities
GROUP COMPANY
As at 31 MarchIn LKR ‘000s
2019 2018 2019 2018
At the beginning of the year 2,078,807 2,395,379 671,634 635,532
Charge for the year 2,415,522 3,177,153 1,139,058 1,293,431
Payments and set off against refunds (2,989,510) (3,505,765) (1,585,105) (1,257,329)
Acquisitions / (disposal) of subsidiary - 12,040 - -
At the end of the year 1,504,819 2,078,807 225,587 671,634
20.4 Deferred tax
GROUP
ASSETS LIABILITIES
As at 31 MarchIn LKR ‘000s
2019 2018 2019 2018
At the beginning of the year 171,503 143,548 7,089,179 2,334,456
Charge and release 1,069,146 80,952 653,400 4,810,947
Transfers / exchange translation adjustments 12,329 (52,997) 14,094 (56,224)
At the end of the year 1,252,978 171,503 7,756,673 7,089,179
The closing deferred tax asset and liability balances relate to the following;
Revaluation of land and building to fair value (23,123) - 4,690,015 4,346,318
Revaluation of investment property to fair value (1,233) (11,198) 251,723 210,000
Accelerated depreciation for tax purposes 189,362 36,308 2,885,524 2,531,165
Employee benefit liability 44,606 80,702 (287,853) (248,105)
Losses available for offset against future taxable income 1,112,573 62,718 (243,276) (172,040)
Net gain/loss on fair value through OCI (35,959) - - -
Others (33,248) 2,973 460,540 421,841
1,252,978 171,503 7,756,673 7,089,179
20. Taxes (Contd.)Union Assurance PLC (UA), a subsidiary of the Group was liable for income tax, in terms of the Inland Revenue Act No. 10 of 2006 and amendments thereto, till 31 March 2018.
From 1 April 2018 onwards, the gains and profits from the Life Insurance Business are ascertained in terms of Section 67 of the Inland Revenue Act No. 24 of 2017 which introduces an approach based on surplus distribution and net investment income of the shareholders’ fund.
Up to the period ended 31 March 2018, UA had not recognised a deferred tax asset against tax losses due to uncertainty regarding availability of taxable profits.
With the introduction of the new tax base in terms of Section 67 of the Inland Revenue Act No. 24 of 2017, the company will have taxable income from the year ending 31 December 2018 based on the company’s historical experience and future plans. Accordingly, UA will be eligible to claim its brought forward tax losses against its taxable income within a period of 6 years.
Accordingly, during the year ended 31 March 2019, UA recognised a deferred tax asset amounting to LKR 1,572 Mn arising from brought forward tax losses as at 31 March 2018 after assessing the availability of future taxable profits for utilisation.
In terms of Section 67 of the Inland Revenue Act No. 24 of 2017, UA is of the view that there will not be material temporary differences arising, which will result in a deferred tax liability.

261
FINANCIAL STATEMENTS
The Group has tax losses amounting to LKR. 8,824 Mn (2018 - LKR. 10,408 Mn) that are available to offset against future taxable profits of the companies in which the tax losses arose.
A deferred tax liability for the Group amounting to LKR. 460 Mn (2018 – LKR. 430 Mn) has been recognised based on the impact of declared dividends of subsidiaries and the Group’s portion of distributable reserves of equity accounted investees.
Accounting judgements, estimates and assumptions
The Group is subject to income tax and other taxes including VAT. Significant judgement was required to determine the total provision for current, deferred and other taxes due to uncertainties that exist with respect to the interpretation of the applicability of tax law at the time of the preparation of these financial statements.
Uncertainties also exist with respect to the interpretation of complex tax regulations and the amount and timing of future
taxable income. Given the wide range of business relationships and the long-term nature and complexity of existing contractual agreements, differences arising between the actual results and the assumptions made, or future changes to such assumptions, could necessitate future adjustments to tax income and expense already recorded. Where the final tax outcome of such matters is different from the amounts that were initially recorded, such differences will impact the income and deferred tax amounts in the period in which the determination is made.
The Group has contingent liabilities amounting to LKR. 1,321 Mn (2018 – LKR. 1,371 Mn). These have been arrived at after discussing with independent legal and tax experts and based on information available. All assumptions are revisited as of the reporting date.
Further details of contingent liabilities are disclosed in Note 43 in the financial statements.
20.5 Reconciliation between current tax charge and the accounting profit
GROUP COMPANY
For the year ended 31 MarchIn LKR ‘000s
2019 2018 2019 2018
Profit before tax 18,615,510 27,634,434 13,141,274 22,515,660
Dividend income from Group companies 8,830,125 11,269,163 - -
Share of results of equity accounted investees (net of tax) (4,727,345) (3,596,430) - -
Other consolidation adjustments 521,175 14,820,285 - -
Profit after adjustment 23,239,465 50,127,452 13,141,274 22,515,660
Exempt profits (171,029) (1,460,681) - (929,053)
Income not liable for income tax (636,011) (15,163,860) (255,344) (8,197,016)
Resident dividend (8,523,301) (9,453,819) (7,205,040) (8,651,250)
Adjusted accounting profit chargeable to income taxes 13,909,124 24,049,092 5,680,890 4,738,341
Disallowable expenses 10,977,226 9,391,906 713,712 589,297
Allowable expenses (8,429,866) (6,041,067) (2,323,426) (703,149)
Utilisation of tax losses (2,476,212) (262,591) -
Current year tax losses not utilised 220,558 270,466
Qualifying payment deductions (1,497) (5,388) (3,111) (5,093)
Taxable income 14,199,333 27,402,418 4,068,065 4,619,396
Income tax charged at:
Standard rate of 28% 1,968,902 2,796,298 1,139,058 1,293,431
Other concessionary rates 487,698 444,078 - -
Current tax charge 2,456,600 3,240,376 1,139,058 1,293,431

262 JOHN KEELLS HOLDINGS PLC | ANNUAL REPORT 2018/19
NOTES TO THE FINANCIAL STATEMENTS
20. Taxes (Contd) 20.6 Reconciliation between tax expense and the product of accounting profit
GROUP COMPANY
For the year ended 31 MarchIn LKR ‘000s
2019 2018 2019 2018
Adjusted accounting profit chargeable to income taxes 13,909,124 24,049,092 5,680,890 4,738,341
Tax effect on chargeable profits 2,866,054 3,324,785 1,590,649 1,326,735
Tax effect on non deductible expenses 517,569 441,725 160,488 84,380
Tax effect on deductions claimed (743,747) (385,504) (615,603) (123,697)
Net tax effect of unrecognised deferred tax assets for the year 33,174 171,562 3,524 6,013
Net tax effect of unrecognised deferred tax assets for prior years (39,992) 9,128 - -
Under/(over) provision for previous years (49,920) (63,223) - -
Deferred tax due to carried forward tax losses (1,043,722) - - -
Deferred tax due to rate differentials (1,345) 164,456 - -
Other income based taxes: -
Irrecoverable economic service charge 8,842 - - -
Withholding tax on inter-company dividends 801,201 681,700 - -
Deferred tax on withholding tax of affiliated companies dividends 30,000 170,000 - -
Tax expense 2,378,114 4,514,629 1,139,058 1,293,431
Group tax expense is based on the taxable profit of individual companies within the Group. At present the tax laws of Sri Lanka do not provide for Group taxation.
20.7 Economic Service Charge (ESC)
GROUP
For the year ended 31 MarchIn LKR ‘000s
2019 2018
Irrecoverable Economic Service Charge (ESC) 8,842 -
8,842 -
20.8 Tax losses carried forward
GROUP COMPANY
For the year ended 31 MarchIn LKR ‘000s
2019 2018 2019 2018
Tax losses brought forward 10,407,718 9,146,951 1,230,471 1,230,471
Adjustments on finalisation of liability (7,934) 492,233 - -
Tax losses arising during the year 900,305 1,031,125 - -
Utilisation of tax losses (2,476,212) (262,591) - -
8,823,877 10,407,718 1,230,471 1,230,471

263
FINANCIAL STATEMENTS
20.9 Applicable rates of income tax The tax liability of resident companies are computed at the standard rate of 28% except for the following companies which enjoy full or partial exemptions and concessions.
Company / Sector Basis Exemptions or concessions
Period
Exemptions / concessions granted under the Inland Revenue Act
John Keells Properties Ja-Ela (Pvt) Ltd. New undertaking engaged in construction of commercial buildings
Exempt 9 years from 1st April 2015
Saffron Aviation (Pvt) Ltd. Domestic airline - do - 8 years from 1st year of profit or 2 years from operations
Sancity Hotels & Properties Ltd. (Subsidiary of Capitol Hotel Holdings (Pvt) Ltd.)
Construction and operation of a tourist hotel
- do - 12 years from 1st year of profit or 2 years from operations
John Keells Information Technology (Pvt) Ltd. Information technology services 14% Open ended
John Keells International (Pvt) Ltd. Exporting services - do - - do -
Lanka Marine Services (Pvt) Ltd. Qualified export profits - do - - do -
Leisure sector Promotion of tourism - do - - do -
Exemptions / concessions granted under the Board of Investment Law
Asian Hotels and Properties PLC Construction and operation of office, apartment complex and a hotel
2% of turnover
15 years from 1st April 2014
Beruwala Holiday Resorts (Pvt) Ltd. Construction and operation of a tourist hotel
Exempt 8 years from 1st year of profit or 2 years from operations
British Overseas (Pvt) Ltd. Infrastructure development - do - 9 years from 1st April 2013
John Keells Residential Properties (Pvt) Ltd. Real estate developer - do - 8 years from 1st April 2011
South Asia Gateway Terminals (Pvt) Ltd. Port services at “Queen Elizabeth” quay - do - 20 years from 1st September 1999
Trinco Holiday Resorts (Pvt) Ltd. For upgrading and refurbishment of a hotel in the Eastern province
- do - 10 years from 1st year of profit or 2 years from operations
Infomate (Pvt) Ltd. IT enabled services 20% Concessionary rate of 20% until closure of business
John Keells Logistics (Pvt) Ltd (Sites covered by the BOI agreement)
Warehousing - do - - do -
Waterfront Properties (Pvt) Ltd. Integrated super luxury tourist resort
Exempt 10 years from 1st year of profit or 3 years from operations
20.10 Income tax rates of off-shore subsidiaries
Country of incorporation Company Rate
India John Keells Foods India (Pvt) Ltd. 30.9%
Serene Holidays (Pvt) Ltd. 25%
Mauritius John Keells BPO Holdings (Pvt) Ltd. 3% (Effective)
John Keells BPO International (Pvt) Ltd. 3% (Effective)
Republic of Maldives Fantasea World Investments (Pte) Ltd. 15%
Tranquility (Pte) Ltd. 15%
Travel Club (Pte) Ltd. 15%
John Keells Maldivian Resorts (Pte) Ltd. 15%
Mack Air Services Maldives (Pte) Ltd. 15%
Singapore John Keells Singapore (Pte) Ltd. 17% (Max)

264 JOHN KEELLS HOLDINGS PLC | ANNUAL REPORT 2018/19
NOTES TO THE FINANCIAL STATEMENTS
21. Property , plant and equipment Accounting policy Basis of recognitionProperty, plant and equipment are recognised if it is probable that future economic benefits associated with the asset will flow to the Group and the cost of the asset can be reliably measured.
Basis of measurementProperty, plant and equipment except for land and buildings are stated at cost less accumulated depreciation and any accumulated impairment loss. Such cost includes the cost of replacing component parts of the plant and equipment and borrowing costs for long-term construction projects if the recognition criteria are met. When significant parts of plant and equipment are required to be replaced at intervals, the Group derecognises the replaced part, and recognises the new part with its own associated useful life and depreciation. Likewise, when a major inspection is performed, its cost is recognised in the carrying amount of the plant and equipment as a replacement if the recognition criteria are satisfied. All other repair and maintenance costs are recognised in the income statement as incurred.
Land and buildings are measured at fair value less accumulated depreciation on buildings and impairment charged subsequent to the date of the revaluation.
The carrying values of property, plant and equipment are reviewed for impairment when events or changes in circumstances indicate that the carrying value may not be recoverable.
Any revaluation surplus is recognised in other comprehensive income and accumulated in equity under the asset revaluation reserve, except to the extent that it reverses a revaluation decrease of the same asset previously recognised in the income statement, in which case the increase is recognised in the income statement. A revaluation deficit is recognised in the income statement, except to the extent that it offsets an existing surplus on the same asset recognised in the asset revaluation reserve.
Accumulated depreciation as at the revaluation date is eliminated against the gross carrying amount of the asset and the net amount is restated to the revalued amount of the asset. Upon disposal, any revaluation reserve relating to the particular asset being sold is transferred to retained earnings. Where land and buildings are subsequently revalued, the entire class of such assets is revalued at fair value on the date of revaluation. The Group has adopted a policy of revaluing assets by professional valuers at least every 5 years, except for properties held for rental and occupied mainly by group companies, which are revalued by professional valuers at least every 3 years.
DerecognitionAn item of property, plant and equipment is derecognised upon replacement, disposal or when no future economic benefits are expected from its use. Any gain or loss arising on derecognition of the asset is included in the income statement in the year the asset is derecognised.
DepreciationDepreciation is calculated by using a straight-line method on the cost or valuation of all property, plant and equipment, other than freehold land, in order to write off such amounts over the estimated useful economic life of such assets.
The estimated useful life of assets is as follows:
Assets Years
Buildings (other than hotels) 50
Hotel buildings up to 60
Plant and machinery 10 – 20
Equipment 2– 15
Furniture and fittings 2– 15
Motor vehicles 4 – 10
Returnable Containers 10
Vessels 10-25
Borrowing costs Borrowing costs directly attributable to the acquisition, construction or production of an asset that necessarily takes a substantial period of time to get ready for its intended use or sale are capitalised as part of the cost of the asset. All other borrowing costs are expensed in the period in which they occur. Borrowing costs consist of interest and other costs that an entity incurs in connection with the borrowing of funds.
Group as a lesseeFinance leases which transfer to the Group substantially all the risks and benefits incidental to ownership of the leased item, are capitalised at the commencement of the lease at the fair value of the leased property or, if lower, at the present value of the minimum lease payments. Lease payments are apportioned between finance charges and reduction of the lease liability so as to achieve a constant rate of interest on the remaining balance of the liability. Finance charges are recognised in finance costs in the income statement.
A leased asset is depreciated over the useful life of the asset. However, if there is no reasonable certainty that the Group will obtain ownership by the end of the lease term, the asset is
265
FINANCIAL STATEMENTS
depreciated over the shorter of the estimated useful life of the asset and the lease term. Operating lease payments are recognised as an operating expense in the income statement on a straight-line basis over the lease term.
Impairment of property plant and equipmentThe Group assesses at each reporting date whether there is an indication that an asset may be impaired. If any such indication exists, or when annual impairment testing for an asset is required, the Group makes an estimate of the asset’s recoverable amount. An asset’s recoverable amount is the higher of an asset’s or cash generating unit’s fair value less costs to sell and its value in use and is determined for an individual asset, unless the asset does not generate cash inflows that are largely independent of those from other assets or groups of assets. Where the carrying amount of an asset exceeds its recoverable amount, the asset is considered impaired and is written down to its recoverable amount. In assessing value in use, the estimated future cash flows are discounted to their present value using a pre-tax discount rate that reflects current market assessments of the time value of money and the risks specific to the asset. Impairment losses are recognised in the income statement, except that, impairment losses in respect of property, plant and equipment previously revalued are recognised against the revaluation reserve through the statement of other comprehensive income to the extent that it reverses a previous revaluation surplus.
An assessment is made at each reporting date as to whether there is any indication that previously recognised impairment losses may no longer exist or may have decreased. If such an indication exists, the recoverable amount is estimated. A previously recognised impairment loss is reversed only if there has been a change in the estimates used to determine the asset’s recoverable amount since the last impairment loss was recognised. If that is the case, the carrying amount of the asset is increased to its recoverable amount. That increased amount cannot exceed the carrying amount that would have been determined, net of depreciation, had no impairment loss been recognised for the asset in prior years. Such reversal is recognised in the income statement unless the asset is carried at revalued amount, in which case the reversal is treated as a revaluation increase. After such a reversal, the depreciation charge is adjusted in future periods to allocate the asset’s revised carrying amount, less any residual value, on a systematic basis over its remaining useful life.

266 JOHN KEELLS HOLDINGS PLC | ANNUAL REPORT 2018/19
NOTES TO THE FINANCIAL STATEMENTS
21. Property , plant and equipment (Contd.)21.1 Property , plant and equipment - Group
As at 31 March In LKR ‘000s
Land andbuildings
Buildings on leasehold
land
Plant andmachinery
Equipment,furniture
and fittings
Cost or valuation
At the beginning of the year 57,303,425 16,942,315 9,892,045 10,602,630 Additions 155,329 1,996,317 2,623,403 2,243,264 Acquisition / (disposal) of subsidiary - - - -Disposals (49,700) (30,716) (172,059) (1,085,286)Revaluations 2,095,884 149,680 - 4,910 Transfers (from revaluation adjustment) (292,747) (194,961) - -Impairment / derecognition - (174,700) - -Transfers 109,935 1,676,095 1,752,459 87,043Exchange translation difference - 407,449 67,840 94,975 At the end of the year 59,322,126 20,771,479 14,163,688 11,947,536
Accumulated depreciation and impairmentAt the beginning of the year (944,334) (2,559,978) (4,657,232) (5,959,842)Charge for the year (397,215) (592,712) (853,404) (1,134,066)(Acquisition) / disposal of subsidiary - - - -Disposals - 79,051 138,502 912,368 Transfers (from revaluation adjustment) 292,747 194,961 - -Transfers - - - 37,118 Exchange translation difference - (217,630) (43,547) (61,860)At the end of the year (1,048,802) (3,096,308) (5,415,681) (6,206,282)
Carrying valueAs at 31 March 2019 58,273,324 17,675,171 8,748,007 5,741,254
As at 31 March 2018 56,359,091 14,382,337 5,234,813 4,642,788
21.2 Property , plant and equipment - Company
As at 31 March In LKR ‘000s
Plant and machinery
Equipment, furniture
and fittings
Motor vehicles
Capitalwork in
progress
Total 2019
Total 2018
Cost
At the beginning of the year 3,768 285,346 83,162 - 372,276 332,552 Additions - 33,478 - 46,791 80,269 85,673 Disposals - (74,960) (33,000) - (107,960) (45,949)At the end of the year 3,768 243,864 50,162 46,791 344,585 372,276
Accumulated depreciation and impairmentAt the beginning of the year (3,578) (218,665) (22,155) - (244,398) (238,639)Charge for the year (89) (24,862) (11,919) - (36,870) (32,555)Disposals - 74,258 22,967 - 97,225 26,796 At the end of the year (3,667) (169,269) (11,107) - (184,043) (244,398)
Carrying valueAs at 31 March 2019 101 74,595 39,055 46,791 160,542 As at 31 March 2018 190 66,681 61,007 - 127,878

267
FINANCIAL STATEMENTS
Motor vehicles Returnablecontainers
Others Vessels Capitalwork in
progress
Total 2019
Total 2018Freehold Leasehold
686,819 51,195 986,269 4,837,731 777,100 3,414,495 105,494,024 81,420,427 109,886 - 7,488 744,903 65,488 4,073,774 12,019,852 18,921,948
- - - - - - - (497,801) (92,917) - (64,156) (232,268) - (4,458) (1,731,560) (1,458,176)
- - - - - - 2,250,474 9,169,124 - - - - - - (487,708) (366,482) - - - - - - (174,700) - - - - 42,102 - (3,709,938) (42,304) (1,777,856)
7,728 - - 4,332 - 25,415 607,739 82,840 711,516 51,195 929,601 5,396,800 842,588 3,799,288 117,935,817 105,494,024
(411,300) (12,543) (594,767) (2,956,950) (137,205) - (18,234,151) (17,024,054) (60,949) (7,581) (64,632) (496,043) (51,178) - (3,657,780) (3,236,226)
- - - - - - - 450,505 63,352 - 53,891 208,522 - - 1,455,686 1,262,832
- - - - - - 487,708 366,482 - - - - - - 37,118 10,648
(6,676) - - (6,197) - - (335,910) (64,338) (415,573) (20,124) (605,508) (3,250,668) (188,383) - (20,247,329) (18,234,151)
295,943 31,071 324,093 2,146,132 654,205 3,799,288 97,688,488
275,519 38,652 391,502 1,880,781 639,895 3,414,495 87,259,873
21.3 Revaluation of land and buildings Accounting judgements, estimates and assumptions The Group uses the revaluation model of measurement of land and buildings. The Group engaged independent expert valuers to determine the fair value of its land and buildings. Fair value is determined by reference to market-based evidence of transaction prices for similar properties. Valuations are based on open market prices, adjusted for any difference in the nature, location or condition of the specific property. These valuation techniques that are appropriate in the circumstances and for which sufficient data
is available to measure fair value, maximising the use of relevant observable inputs and minimising the use of unobservable inputs. The most recent revaluation was carried out on 31 December 2018.
The changes in fair value are recognised in other comprehensive income and in the statement of equity. The valuer has used valuation techniques such as market values and discounted cash flow methods where there was lack of comparable market data available based on the nature of the property.
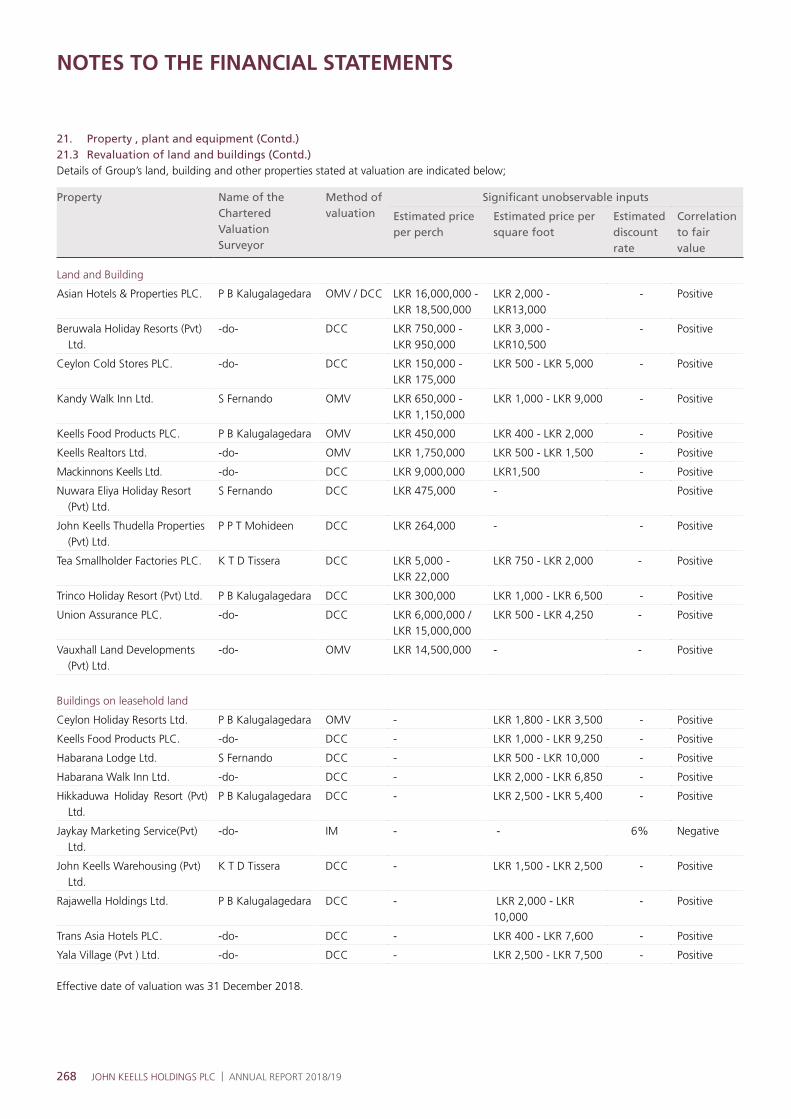
268 JOHN KEELLS HOLDINGS PLC | ANNUAL REPORT 2018/19
NOTES TO THE FINANCIAL STATEMENTS
21. Property , plant and equipment (Contd.)21.3 Revaluation of land and buildings (Contd.)Details of Group’s land, building and other properties stated at valuation are indicated below;
Property Name of the Chartered Valuation Surveyor
Method of valuation
Significant unobservable inputs
Estimated price per perch
Estimated price per square foot
Estimated discount rate
Correlation to fair value
Land and Building
Asian Hotels & Properties PLC. P B Kalugalagedara OMV / DCC LKR 16,000,000 - LKR 18,500,000
LKR 2,000 - LKR13,000
- Positive
Beruwala Holiday Resorts (Pvt) Ltd.
-do- DCC LKR 750,000 - LKR 950,000
LKR 3,000 - LKR10,500
- Positive
Ceylon Cold Stores PLC. -do- DCC LKR 150,000 - LKR 175,000
LKR 500 - LKR 5,000 - Positive
Kandy Walk Inn Ltd. S Fernando OMV LKR 650,000 - LKR 1,150,000
LKR 1,000 - LKR 9,000 - Positive
Keells Food Products PLC. P B Kalugalagedara OMV LKR 450,000 LKR 400 - LKR 2,000 - Positive
Keells Realtors Ltd. -do- OMV LKR 1,750,000 LKR 500 - LKR 1,500 - Positive
Mackinnons Keells Ltd. -do- DCC LKR 9,000,000 LKR1,500 - Positive
Nuwara Eliya Holiday Resort (Pvt) Ltd.
S Fernando DCC LKR 475,000 - Positive
John Keells Thudella Properties (Pvt) Ltd.
P P T Mohideen DCC LKR 264,000 - - Positive
Tea Smallholder Factories PLC. K T D Tissera DCC LKR 5,000 - LKR 22,000
LKR 750 - LKR 2,000 - Positive
Trinco Holiday Resort (Pvt) Ltd. P B Kalugalagedara DCC LKR 300,000 LKR 1,000 - LKR 6,500 - Positive
Union Assurance PLC. -do- DCC LKR 6,000,000 / LKR 15,000,000
LKR 500 - LKR 4,250 - Positive
Vauxhall Land Developments (Pvt) Ltd.
-do- OMV LKR 14,500,000 - - Positive
Buildings on leasehold land
Ceylon Holiday Resorts Ltd. P B Kalugalagedara OMV - LKR 1,800 - LKR 3,500 - Positive
Keells Food Products PLC. -do- DCC - LKR 1,000 - LKR 9,250 - Positive
Habarana Lodge Ltd. S Fernando DCC - LKR 500 - LKR 10,000 - Positive
Habarana Walk Inn Ltd. -do- DCC - LKR 2,000 - LKR 6,850 - Positive
Hikkaduwa Holiday Resort (Pvt) Ltd.
P B Kalugalagedara DCC - LKR 2,500 - LKR 5,400 - Positive
Jaykay Marketing Service(Pvt) Ltd.
-do- IM - - 6% Negative
John Keells Warehousing (Pvt) Ltd.
K T D Tissera DCC - LKR 1,500 - LKR 2,500 - Positive
Rajawella Holdings Ltd. P B Kalugalagedara DCC - LKR 2,000 - LKR 10,000
- Positive
Trans Asia Hotels PLC. -do- DCC - LKR 400 - LKR 7,600 - Positive
Yala Village (Pvt ) Ltd. -do- DCC - LKR 2,500 - LKR 7,500 - Positive
Effective date of valuation was 31 December 2018.
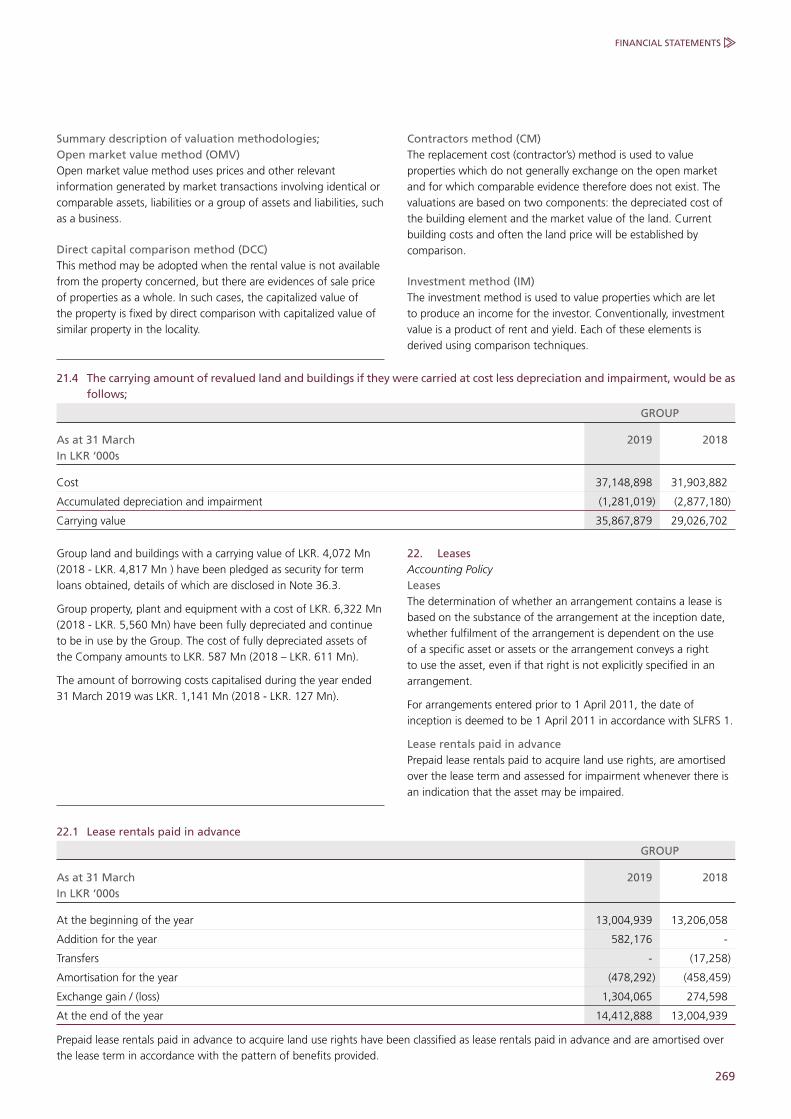
269
FINANCIAL STATEMENTS
Summary description of valuation methodologies;Open market value method (OMV)Open market value method uses prices and other relevant information generated by market transactions involving identical or comparable assets, liabilities or a group of assets and liabilities, such as a business.
Direct capital comparison method (DCC)This method may be adopted when the rental value is not available from the property concerned, but there are evidences of sale price of properties as a whole. In such cases, the capitalized value of the property is fixed by direct comparison with capitalized value of similar property in the locality.
Contractors method (CM)The replacement cost (contractor’s) method is used to value properties which do not generally exchange on the open market and for which comparable evidence therefore does not exist. The valuations are based on two components: the depreciated cost of the building element and the market value of the land. Current building costs and often the land price will be established by comparison.
Investment method (IM)The investment method is used to value properties which are let to produce an income for the investor. Conventionally, investment value is a product of rent and yield. Each of these elements is derived using comparison techniques.
21.4 The carrying amount of revalued land and buildings if they were carried at cost less depreciation and impairment, would be as follows;
GROUP
As at 31 MarchIn LKR ‘000s
2019 2018
Cost 37,148,898 31,903,882
Accumulated depreciation and impairment (1,281,019) (2,877,180)
Carrying value 35,867,879 29,026,702
Group land and buildings with a carrying value of LKR. 4,072 Mn (2018 - LKR. 4,817 Mn ) have been pledged as security for term loans obtained, details of which are disclosed in Note 36.3.
Group property, plant and equipment with a cost of LKR. 6,322 Mn (2018 - LKR. 5,560 Mn) have been fully depreciated and continue to be in use by the Group. The cost of fully depreciated assets of the Company amounts to LKR. 587 Mn (2018 – LKR. 611 Mn).
The amount of borrowing costs capitalised during the year ended 31 March 2019 was LKR. 1,141 Mn (2018 - LKR. 127 Mn).
22.1 Lease rentals paid in advance
GROUP
As at 31 MarchIn LKR ‘000s
2019 2018
At the beginning of the year 13,004,939 13,206,058
Addition for the year 582,176 -
Transfers - (17,258)
Amortisation for the year (478,292) (458,459)
Exchange gain / (loss) 1,304,065 274,598
At the end of the year 14,412,888 13,004,939
Prepaid lease rentals paid in advance to acquire land use rights have been classified as lease rentals paid in advance and are amortised over the lease term in accordance with the pattern of benefits provided.
22. Leases Accounting PolicyLeasesThe determination of whether an arrangement contains a lease is based on the substance of the arrangement at the inception date, whether fulfilment of the arrangement is dependent on the use of a specific asset or assets or the arrangement conveys a right to use the asset, even if that right is not explicitly specified in an arrangement.
For arrangements entered prior to 1 April 2011, the date of inception is deemed to be 1 April 2011 in accordance with SLFRS 1.
Lease rentals paid in advancePrepaid lease rentals paid to acquire land use rights, are amortised over the lease term and assessed for impairment whenever there is an indication that the asset may be impaired.

270 JOHN KEELLS HOLDINGS PLC | ANNUAL REPORT 2018/19
NOTES TO THE FINANCIAL STATEMENTS
22. Leases (Contd.)22.2 Details of lease rentals paid in advance
Total
Property Land extent(in acres)
Lease period 2019In LKR ‘000s
2018In LKR ‘000s
Fantasea World Investment (Pte) Ltd. Cinnamon Hakuraa Huraa Maldives
18.90 33 years from 27-08-2014 351,937 323,726
John Keells Warehousing (Pvt) Ltd. Muthurajawela
6.00 50 years from 19-09-2001 34,757 35,846
John Keells Logistics (Pvt) Ltd. Muthurajawela
9.23 30 years from 13-06-2018 582,176 -
Rajawella Holdings Ltd. Digana
517.09 99 years from 02-12-1996 1,444,124 1,464,257
Tea Smallholder Factories PLC. Karawita Tea Factory
4.98 50 years from 15-08-1997 2,484 2,569
The Colombo Ice Company (Pvt) Ltd. Avissawella
9.30 50 Years from 18-07-2016 143,237 146,263
Tranquility (Pte) Ltd. Cinnamon Dhonveli Maldives
17.16 38 Years from 26-08-2010 9,784,448 9,027,806
Trans Asia Hotels PLC. Colombo
7.65 99 years from 07-08-1981 756,644 769,048
Travel Club (Pte) Ltd. Ellaidhoo Maldives by Cinnamon
13.75 24 years from 04-08-2006 1,260,483 1,179,786
Yala Village (Pvt) Ltd. Kirinda
11.25 30 years from 27-11-1997 52,598 55,638
14,412,888 13,004,939
23. Investment propertyAccounting policyInvestment properties are measured initially at cost, including transaction costs. The carrying value of an investment property includes the cost of replacing part of an existing investment property, at the time that cost is incurred if the recognition criteria are met and excludes the costs of day to- day servicing of the investment property. Subsequent to initial recognition, the investment properties are stated at fair values, which reflect market conditions at the reporting date.
Gains or losses arising from changes in fair value are included in the income statement in the year in which they arise. Fair values are revaluated at least every 3 years by an accredited external, independent valuer. The most recent revaluation was carried out on 31 December 2018.
Investment properties are derecognised when disposed, or permanently withdrawn from use because no future economic benefits are expected. Any gains or losses on retirement or disposal are recognised in the income statement in the year of retirement or disposal.
Transfers are made to or from investment property only when there is a change in use for a transfer from investment property to owner occupied property or inventory (WIP), the deemed cost for subsequent accounting is the fair value at the date of change in use. If owner occupied property becomes an investment property or inventory (WIP), the Group accounts for such property
in accordance with the policy stated under property, plant and equipment up to the date of change in use. Where Group companies occupy a significant portion of the investment property of a subsidiary, such investment properties are treated as property, plant and equipment in the consolidated financial statements, and accounted for using accounting policy for property, plant and equipment.
GROUP
As at 31 MarchIn LKR ‘000s
2019 2018
Carrying value
At the beginning of the year 12,427,058 5,366,180
Additions 1,233,668 4,397,290
Transfers - 1,767,208
Change in fair value during the year 324,653 896,380
At the end of the year 13,985,379 12,427,058
Freehold property 13,522,700 12,019,147
Leasehold property 462,679 407,911
13,985,379 12,427,058
Rental income earned 602,883 567,885
Direct operating expenses incurred 197,299 191,467
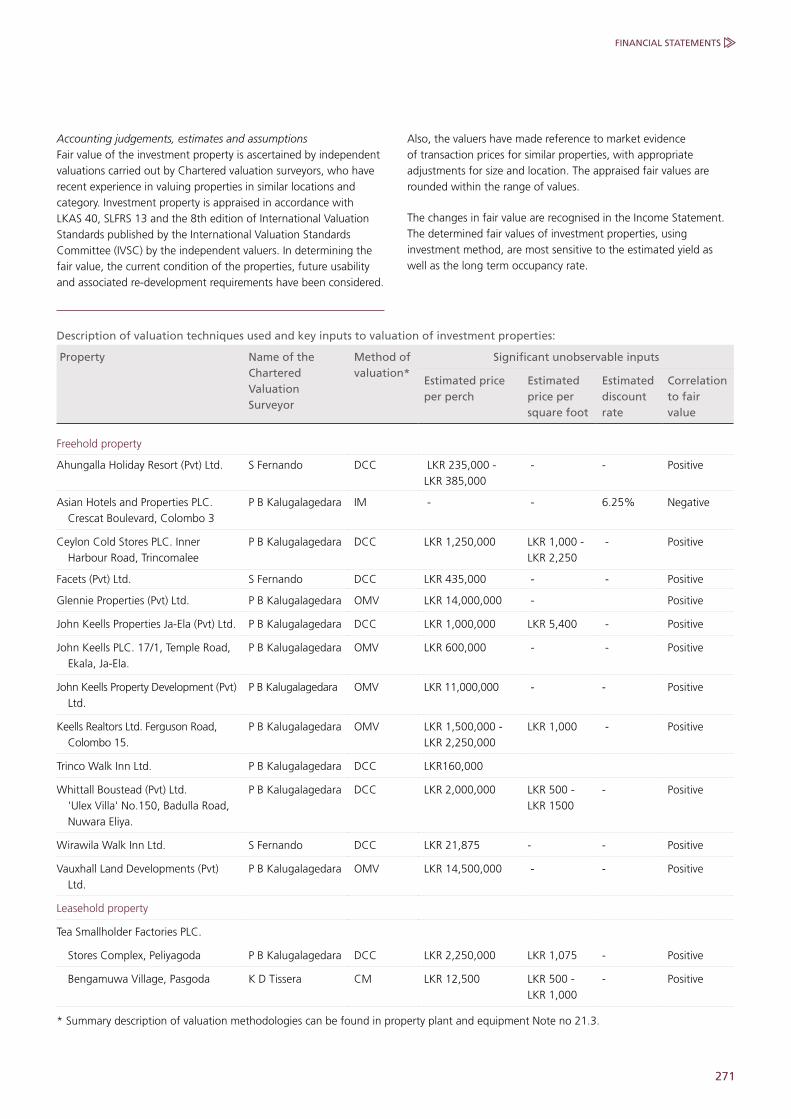
271
FINANCIAL STATEMENTS
Accounting judgements, estimates and assumptions Fair value of the investment property is ascertained by independent valuations carried out by Chartered valuation surveyors, who have recent experience in valuing properties in similar locations and category. Investment property is appraised in accordance with LKAS 40, SLFRS 13 and the 8th edition of International Valuation Standards published by the International Valuation Standards Committee (IVSC) by the independent valuers. In determining the fair value, the current condition of the properties, future usability and associated re-development requirements have been considered.
Also, the valuers have made reference to market evidence of transaction prices for similar properties, with appropriate adjustments for size and location. The appraised fair values are rounded within the range of values.
The changes in fair value are recognised in the Income Statement. The determined fair values of investment properties, using investment method, are most sensitive to the estimated yield as well as the long term occupancy rate.
Description of valuation techniques used and key inputs to valuation of investment properties:
Property Name of the Chartered Valuation Surveyor
Method of valuation*
Significant unobservable inputs
Estimated price per perch
Estimated price per square foot
Estimated discount rate
Correlation to fair value
Freehold property
Ahungalla Holiday Resort (Pvt) Ltd. S Fernando DCC LKR 235,000 - LKR 385,000
- - Positive
Asian Hotels and Properties PLC. Crescat Boulevard, Colombo 3
P B Kalugalagedara IM - - 6.25% Negative
Ceylon Cold Stores PLC. Inner Harbour Road, Trincomalee
P B Kalugalagedara DCC LKR 1,250,000 LKR 1,000 - LKR 2,250
- Positive
Facets (Pvt) Ltd. S Fernando DCC LKR 435,000 - - Positive
Glennie Properties (Pvt) Ltd. P B Kalugalagedara OMV LKR 14,000,000 - Positive
John Keells Properties Ja-Ela (Pvt) Ltd. P B Kalugalagedara DCC LKR 1,000,000 LKR 5,400 - Positive
John Keells PLC. 17/1, Temple Road, Ekala, Ja-Ela.
P B Kalugalagedara OMV LKR 600,000 - - Positive
John Keells Property Development (Pvt) Ltd.
P B Kalugalagedara OMV LKR 11,000,000 - - Positive
Keells Realtors Ltd. Ferguson Road, Colombo 15.
P B Kalugalagedara OMV LKR 1,500,000 - LKR 2,250,000
LKR 1,000 - Positive
Trinco Walk Inn Ltd. P B Kalugalagedara DCC LKR160,000
Whittall Boustead (Pvt) Ltd. 'Ulex Villa' No.150, Badulla Road, Nuwara Eliya.
P B Kalugalagedara DCC LKR 2,000,000 LKR 500 - LKR 1500
- Positive
Wirawila Walk Inn Ltd. S Fernando DCC LKR 21,875 - - Positive
Vauxhall Land Developments (Pvt) Ltd.
P B Kalugalagedara OMV LKR 14,500,000 - - Positive
Leasehold property
Tea Smallholder Factories PLC.
Stores Complex, Peliyagoda P B Kalugalagedara DCC LKR 2,250,000 LKR 1,075 - Positive
Bengamuwa Village, Pasgoda K D Tissera CM LKR 12,500 LKR 500 - LKR 1,000
- Positive
* Summary description of valuation methodologies can be found in property plant and equipment Note no 21.3.
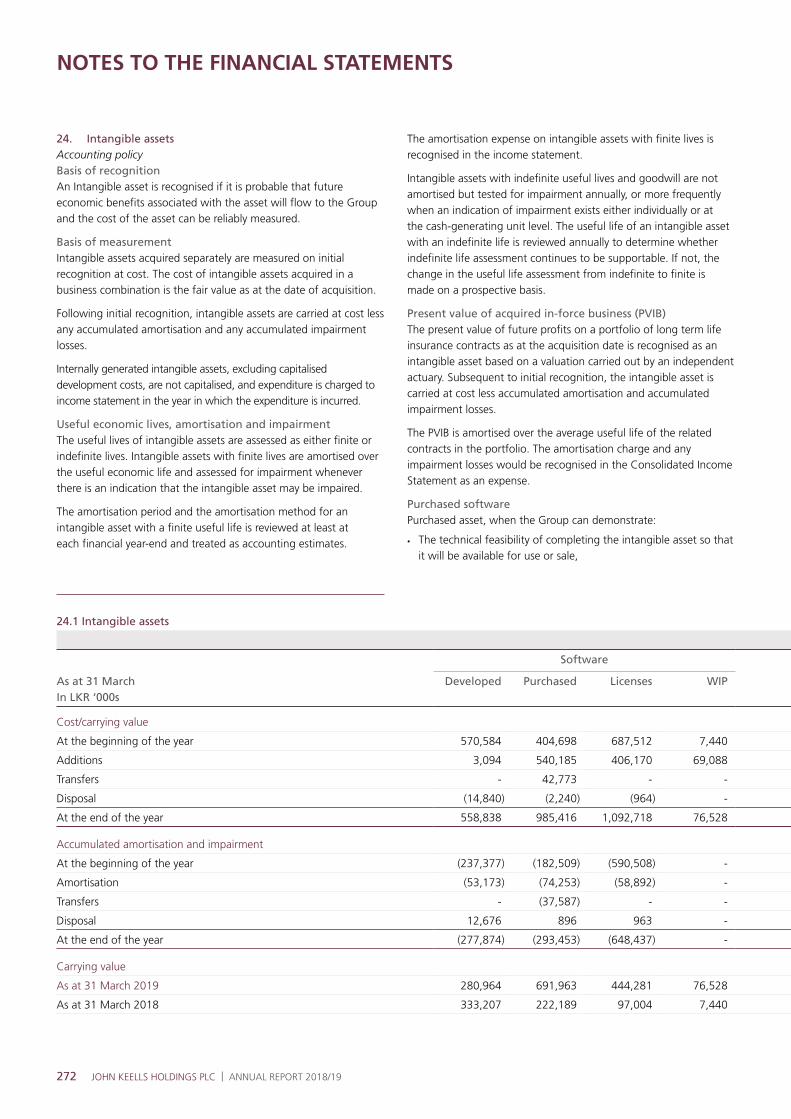
272 JOHN KEELLS HOLDINGS PLC | ANNUAL REPORT 2018/19
NOTES TO THE FINANCIAL STATEMENTS
24. Intangible assets Accounting policy Basis of recognitionAn Intangible asset is recognised if it is probable that future economic benefits associated with the asset will flow to the Group and the cost of the asset can be reliably measured.
Basis of measurement Intangible assets acquired separately are measured on initial recognition at cost. The cost of intangible assets acquired in a business combination is the fair value as at the date of acquisition.
Following initial recognition, intangible assets are carried at cost less any accumulated amortisation and any accumulated impairment losses.
Internally generated intangible assets, excluding capitalised development costs, are not capitalised, and expenditure is charged to income statement in the year in which the expenditure is incurred.
Useful economic lives, amortisation and impairmentThe useful lives of intangible assets are assessed as either finite or indefinite lives. Intangible assets with finite lives are amortised over the useful economic life and assessed for impairment whenever there is an indication that the intangible asset may be impaired.
The amortisation period and the amortisation method for an intangible asset with a finite useful life is reviewed at least at each financial year-end and treated as accounting estimates.
The amortisation expense on intangible assets with finite lives is recognised in the income statement.
Intangible assets with indefinite useful lives and goodwill are not amortised but tested for impairment annually, or more frequently when an indication of impairment exists either individually or at the cash-generating unit level. The useful life of an intangible asset with an indefinite life is reviewed annually to determine whether indefinite life assessment continues to be supportable. If not, the change in the useful life assessment from indefinite to finite is made on a prospective basis.
Present value of acquired in-force business (PVIB)The present value of future profits on a portfolio of long term life insurance contracts as at the acquisition date is recognised as an intangible asset based on a valuation carried out by an independent actuary. Subsequent to initial recognition, the intangible asset is carried at cost less accumulated amortisation and accumulated impairment losses.
The PVIB is amortised over the average useful life of the related contracts in the portfolio. The amortisation charge and any impairment losses would be recognised in the Consolidated Income Statement as an expense.
Purchased softwarePurchased asset, when the Group can demonstrate:
• The technical feasibility of completing the intangible asset so that it will be available for use or sale,
24.1 Intangible assets
Software
As at 31 MarchIn LKR ‘000s
Developed Purchased Licenses WIP
Cost/carrying value
At the beginning of the year 570,584 404,698 687,512 7,440
Additions 3,094 540,185 406,170 69,088
Transfers - 42,773 - -
Disposal (14,840) (2,240) (964) -
At the end of the year 558,838 985,416 1,092,718 76,528
Accumulated amortisation and impairment
At the beginning of the year (237,377) (182,509) (590,508) -
Amortisation (53,173) (74,253) (58,892) -
Transfers - (37,587) - -
Disposal 12,676 896 963 -
At the end of the year (277,874) (293,453) (648,437) -
Carrying value
As at 31 March 2019 280,964 691,963 444,281 76,528
As at 31 March 2018 333,207 222,189 97,004 7,440
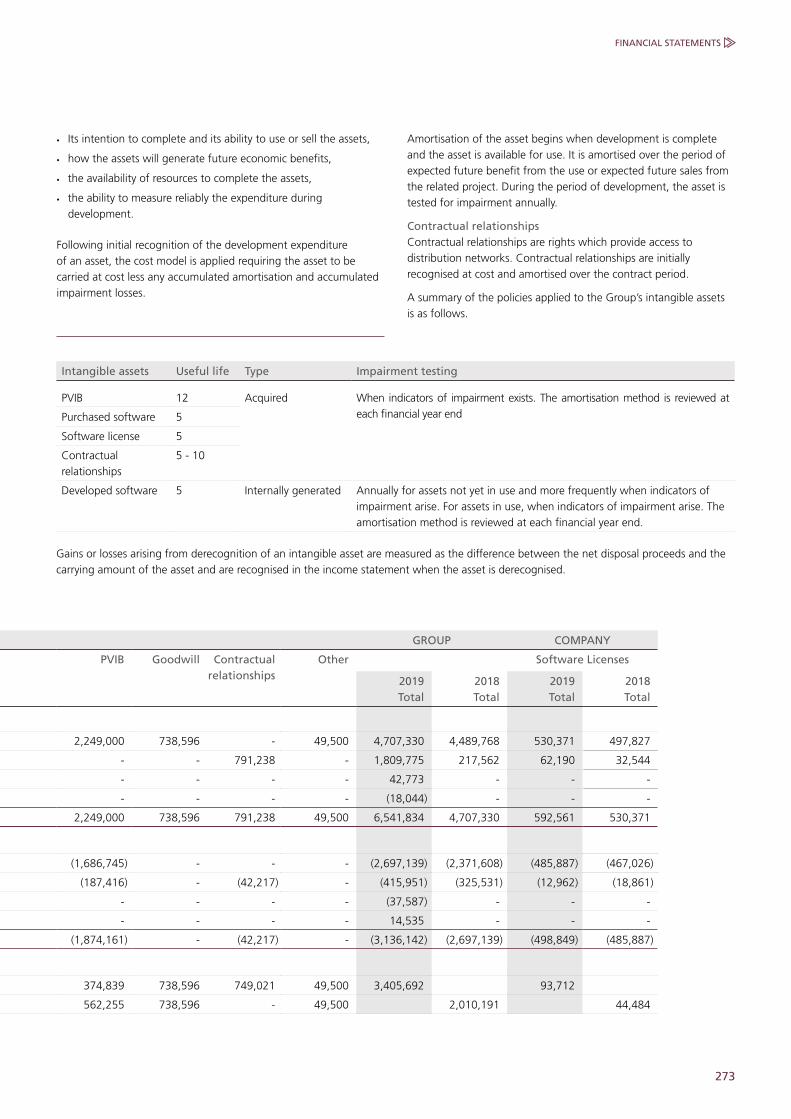
273
FINANCIAL STATEMENTS
Intangible assets Useful life Type Impairment testing
PVIB 12 Acquired When indicators of impairment exists. The amortisation method is reviewed at each financial year endPurchased software 5
Software license 5
Contractual relationships
5 - 10
Developed software 5 Internally generated Annually for assets not yet in use and more frequently when indicators of impairment arise. For assets in use, when indicators of impairment arise. The amortisation method is reviewed at each financial year end.
Gains or losses arising from derecognition of an intangible asset are measured as the difference between the net disposal proceeds and the carrying amount of the asset and are recognised in the income statement when the asset is derecognised.
• Its intention to complete and its ability to use or sell the assets,
• how the assets will generate future economic benefits,
• the availability of resources to complete the assets,
• the ability to measure reliably the expenditure during development.
Following initial recognition of the development expenditure of an asset, the cost model is applied requiring the asset to be carried at cost less any accumulated amortisation and accumulated impairment losses.
Amortisation of the asset begins when development is complete and the asset is available for use. It is amortised over the period of expected future benefit from the use or expected future sales from the related project. During the period of development, the asset is tested for impairment annually.
Contractual relationshipsContractual relationships are rights which provide access to distribution networks. Contractual relationships are initially recognised at cost and amortised over the contract period.
A summary of the policies applied to the Group’s intangible assets is as follows.
GROUP COMPANY
PVIB Goodwill Contractualrelationships
Other Software Licenses
2019Total
2018Total
2019Total
2018Total
2,249,000 738,596 - 49,500 4,707,330 4,489,768 530,371 497,827
- - 791,238 - 1,809,775 217,562 62,190 32,544
- - - - 42,773 - - -
- - - - (18,044) - - -
2,249,000 738,596 791,238 49,500 6,541,834 4,707,330 592,561 530,371
(1,686,745) - - - (2,697,139) (2,371,608) (485,887) (467,026)
(187,416) - (42,217) - (415,951) (325,531) (12,962) (18,861)
- - - - (37,587) - - -
- - - - 14,535 - - -
(1,874,161) - (42,217) - (3,136,142) (2,697,139) (498,849) (485,887)
374,839 738,596 749,021 49,500 3,405,692 93,712
562,255 738,596 - 49,500 2,010,191 44,484
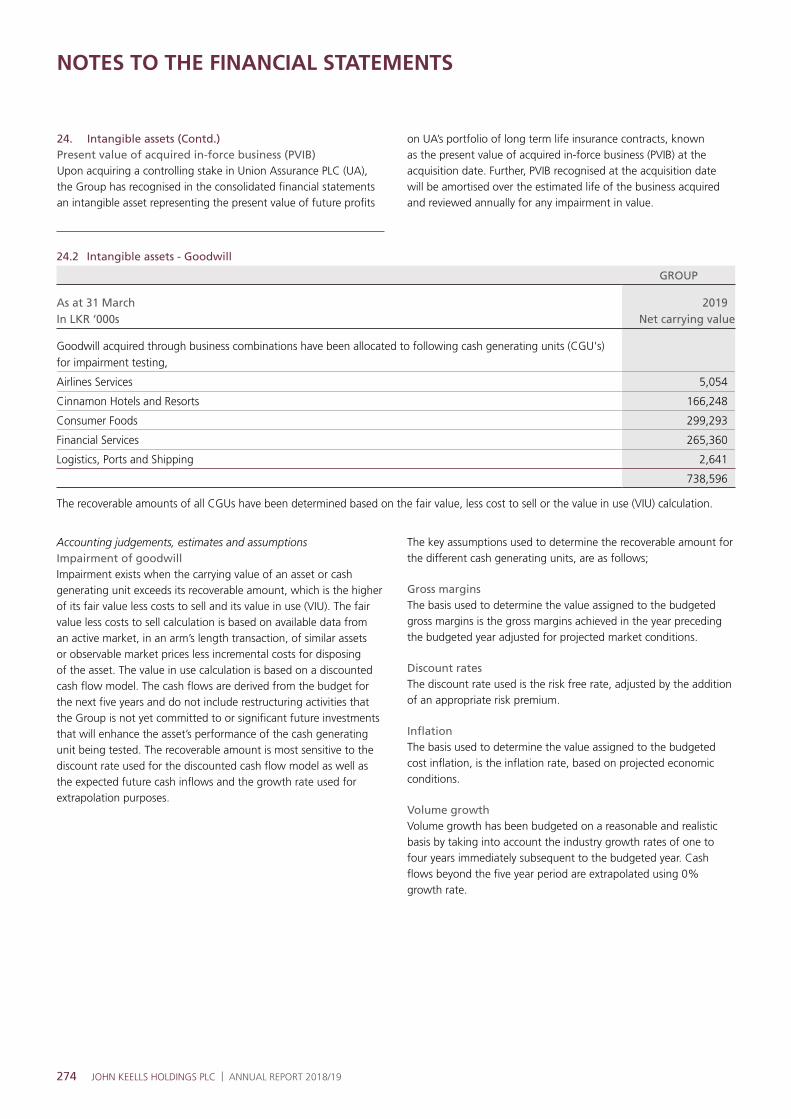
274 JOHN KEELLS HOLDINGS PLC | ANNUAL REPORT 2018/19
NOTES TO THE FINANCIAL STATEMENTS
24.2 Intangible assets - Goodwill
GROUP
As at 31 MarchIn LKR ‘000s
2019Net carrying value
Goodwill acquired through business combinations have been allocated to following cash generating units (CGU's) for impairment testing,
Airlines Services 5,054
Cinnamon Hotels and Resorts 166,248
Consumer Foods 299,293
Financial Services 265,360
Logistics, Ports and Shipping 2,641
738,596
The recoverable amounts of all CGUs have been determined based on the fair value, less cost to sell or the value in use (VIU) calculation.
Accounting judgements, estimates and assumptions Impairment of goodwillImpairment exists when the carrying value of an asset or cash generating unit exceeds its recoverable amount, which is the higher of its fair value less costs to sell and its value in use (VIU). The fair value less costs to sell calculation is based on available data from an active market, in an arm’s length transaction, of similar assets or observable market prices less incremental costs for disposing of the asset. The value in use calculation is based on a discounted cash flow model. The cash flows are derived from the budget for the next five years and do not include restructuring activities that the Group is not yet committed to or significant future investments that will enhance the asset’s performance of the cash generating unit being tested. The recoverable amount is most sensitive to the discount rate used for the discounted cash flow model as well as the expected future cash inflows and the growth rate used for extrapolation purposes.
The key assumptions used to determine the recoverable amount for the different cash generating units, are as follows;
Gross marginsThe basis used to determine the value assigned to the budgeted gross margins is the gross margins achieved in the year preceding the budgeted year adjusted for projected market conditions.
Discount ratesThe discount rate used is the risk free rate, adjusted by the addition of an appropriate risk premium.
InflationThe basis used to determine the value assigned to the budgeted cost inflation, is the inflation rate, based on projected economic conditions.
Volume growthVolume growth has been budgeted on a reasonable and realistic basis by taking into account the industry growth rates of one to four years immediately subsequent to the budgeted year. Cash flows beyond the five year period are extrapolated using 0% growth rate.
24. Intangible assets (Contd.)Present value of acquired in-force business (PVIB) Upon acquiring a controlling stake in Union Assurance PLC (UA), the Group has recognised in the consolidated financial statements an intangible asset representing the present value of future profits
on UA’s portfolio of long term life insurance contracts, known as the present value of acquired in-force business (PVIB) at the acquisition date. Further, PVIB recognised at the acquisition date will be amortised over the estimated life of the business acquired and reviewed annually for any impairment in value.

275
FINANCIAL STATEMENTS
25.1 Carrying value
COMPANY
As at 31 MarchIn LKR ‘000s
Note 2019 2018
Investment in subsidiaries
Quoted 25.2 20,115,878 20,066,449
Unquoted 25.3 57,130,018 47,901,469
77,245,896 67,967,918
25.2 Group quoted investments
GROUP COMPANY
As at 31 March Number ofshares
Effective holding %
Number ofshares
Effective holding %
2019In LKR ‘000s
2018In LKR ‘000s
Cost
Asian Hotels and Properties PLC. 347,824,190 78.56 347,824,190 78.56 5,350,028 5,324,044
Ceylon Cold Stores PLC. 77,321,326 81.36 67,155,930 70.61 1,618,486 1,563,192
John Keells Hotels PLC. 1,169,598,478 80.32 1,169,598,478 80.32 7,102,140 7,102,140
John Keells PLC. 52,834,784 86.90 52,834,784 86.90 478,227 468,923
Keells Food Products PLC. 22,937,250 88.63 20,364,054 79.86 1,232,659 1,223,691
Tea Smallholder Factories PLC. 11,286,000 37.62 11,286,000 37.62 65,308 64,452
Trans Asia Hotels PLC. 184,107,284 82.74 97,284,256 48.64 1,613,714 1,609,523
Union Assurance PLC. 53,035,715 90.00 53,035,715 90.00 2,655,316 2,710,484
20,115,878 20,066,449
GROUP COMPANY
As at 31 MarchIn LKR ‘000s
2019 2018 2019 2018
Market Value
Asian Hotels and Properties PLC. 14,573,834 17,460,774 14,573,834 17,460,774
Ceylon Cold Stores PLC. 44,459,762 73,455,148 38,614,592 63,798,021
John Keells Hotels PLC. 8,771,989 10,877,266 8,771,989 10,877,266
John Keells PLC. 2,536,070 3,122,536 2,536,070 3,122,536
Keells Food Products PLC. 2,862,569 2,979,549 2,541,434 2,645,291
Tea Smallholder Factories PLC. 271,993 383,724 271,993 383,724
Trans Asia Hotels PLC. 14,065,796 17,490,192 7,432,517 9,242,004
Union Assurance PLC. 15,889,500 8,115,370 15,889,500 8,115,370
103,431,513 133,884,559 90,631,929 115,644,986
25. Investment in subsidiaries Accounting policy Investment in subsidiaries is initially recognised at cost in the financial statements of the Company. Any transaction cost relating to acquisition of investment in subsidiaries is immediately
recognised in the income statement. After the initial recognition, Investments in subsidiaries are carried at cost less any accumulated impairment losses.

276 JOHN KEELLS HOLDINGS PLC | ANNUAL REPORT 2018/19
NOTES TO THE FINANCIAL STATEMENTS
25. Investment in subsidiaries (Contd.)25.3 Group unquoted investments
GROUP COMPANY
As at 31 March 2019 2019 2018
Number ofshares
Effective holding %
Number ofshares
Effective holding %
CostIn LKR ‘000s
CostIn LKR ‘000s
Ahungalla Holiday Resorts (Pvt) Ltd. 13,275,000 80.32 - - - -
Beruwala Holiday Resorts (Pvt ) Ltd. 219,725,653 79.78 - - 3,526 2,553
British Overseas (Pvt) Ltd. 61 61.00 61 61.00 - -
Ceylon Holiday Resorts Ltd. 18,260,784 79.60 - - 3,590 3,285
Cinnamon Hotel Management Ltd. 1,000,000 100.00 1,000,000 100.00 301,533 227,578
Cinnamon Hotel Management International (Pvt) Ltd. 50,000 100.00 - - - -
Cinnamon Holidays (Pvt) Ltd. 20,000 80.32 - - - -
Facets (Pvt) Ltd. 15,000 100.00 15,000 100.00 - -
Fantasea World Investments (Pte) Ltd. 7,299 80.32 - - 3,451 2,444
Glennie Properties (Pvt) Ltd. 16,386,140 100.00 16,386,140 100.00 163,861 -
Habarana Lodge Ltd. 12,981,548 78.99 - - 4,384 3,867
Habarana Walk Inn Ltd. 4,321,381 79.34 - - 2,561 2,123
Hikkaduwa Holiday Resorts (Pvt) Ltd. 107,596,700 79.60 - - 2,147 1,557
InfoMate (Pvt) Ltd. 2,000,000 100.00 2,000,000 100.00 35,125 32,374
International Tourists and Hoteliers Ltd. 38,490,901 79.78 - - - -
JayKay Marketing Services (Pvt) Ltd. 202,239,025 81.36 - - 162,329 137,367
J K Packaging (Pvt) Ltd. 1,450,000 100.00 1,450,000 100.00 - -
J K Thudella Properties (Pvt) Ltd. 45,346,760 100.00 - - - -
John Keells BPO Holdings (Pvt) Ltd. 19,000,000 100.00 - - - -
John Keells BPO International (Pvt) Ltd. 1,500,000,000 100.00 - - - -
John Keells BPO Solutions Lanka (Pvt) Ltd. 32,843,578 100.00 - - - -
John Keells Foods India (Pvt) Ltd. 8,999,990 88.63 - - - -
John Keells Information Technology (Pvt) Ltd. (formerly known as John Keells Computer Services (Pvt) Ltd.) 9,650,000 100.00 9,650,000 100.00 120,496 118,672
John Keells International (Pvt) Ltd. 199,160,000 100.00 199,160,000 100.00 666,463 662,788
John Keells Land (Pvt) Ltd. 1,704,721,023 100.00 1,704,721,023 100.00 17,047,210 15,957,048
John Keells Logistics (Pvt) Ltd. 19,999,998 100.00 19,999,998 100.00 222,247 215,284
John Keells Maldivian Resorts (Pte) Ltd. 49,044,238 80.32 - - 15,853 13,396
John Keells Office Automation (Pvt) Ltd. 500,000 100.00 500,000 100.00 59,850 50,541
John Keells Properties (Pvt) Ltd. 101,804 100.00 101,804 100.00 815 815
John Keells Properties Ja-Ela (Pvt) Ltd. 95,436,000 100.00 - - - -
John Keells Property Developments (Pvt) Ltd. 105,405,680 100.00 - - - -
John Keells Residential Properties (Pvt) Ltd. 2,081,698 100.00 2,081,698 100.00 20,817 20,817
John Keells Singapore (Pte) Ltd. 160,000 80.00 160,000 80.00 4,209 4,209
John Keells Stock Brokers (Pvt) Ltd. 1,500,000 90.04 360,000 24.00 68,186 58,234
John Keells Teas Ltd. 12,000 100.00 12,000 100.00 16,886 14,561
John Keells Warehousing (Pvt) Ltd. 12,000,000 86.90 - - 4,640 3,662
Kandy Walk Inn Ltd. 6,165,484 79.03 - - 3,696 2,998
Keells Consultants (Pvt) Ltd. 928 100.00 928 100.00 1,660 1,196
Keells Realtors Ltd. 7,500,000 95.81 5,100,000 40.00 119,124 119,124
Keells Shipping (Pvt) Ltd. 50,000 100.00 50,000 100.00 - 502
Lanka Marine Services (Pvt) Ltd. 34,805,470 99.44 34,805,470 99.44 1,384,291 1,371,833
Logipark International (Pvt) Ltd. 60,407,698 100.00 60,407,698 100.00 1,058,750 -
Mack Air (Pvt) Ltd. 89,260 100.00 89,260 100.00 30,382 20,943

277
FINANCIAL STATEMENTS
GROUP COMPANY
As at 31 March 2019 2019 2018
Number ofshares
Effective holding %
Number ofshares
Effective holding %
CostIn LKR ‘000s
CostIn LKR ‘000s
Mack Air Services Maldives (Pvt) Ltd. 4,900 49.00 4,700 47.00 2,021 2,021
Mack International Freight (Pvt) Ltd. 13,000,000 100.00 13,000,000 100.00 214 -
Mackinnons Keells Ltd. 31,966,951 100.00 31,966,951 100.00 670,166 670,166
Mackinnon Mackenzie and Company (Shipping) Ltd. 139,092 100.00 139,092 100.00 65,789 65,789
Mackinnon Mackenzie and Company of (Ceylon) Ltd. 1,244 100.00 1,244 100.00 29,122 29,122
Mackinnons Travels (Pvt) Ltd. 499,996 100.00 499,996 100.00 27,420 23,533
Mortlake (Pvt) Ltd. 43 100.00 43 100.00 20,000 20,000
Nuwara Eliya Holiday Resorts (Pvt) Ltd. 31,606,252 80.32 - - - -
Rajawella Holdings Ltd. 13,063,936 49.85 11,573,339 45.18 801,707 801,707
Rajawella Hotels Company Ltd. 3,157,384 80.32 - - - -
Resort Hotels Ltd. 151,107 79.60 - - - -
Serene Holidays (Pvt) Ltd. 800,000 98.35 - - - -
The Colombo Ice Company (Pvt) Ltd. 169,999,999 81.36 - - - -
Tranquility (Pte) Ltd. 637,499 80.32 - - 5,076 4,459
Trans-ware Logistics (Pvt) Ltd. 5,539,929 100.00 5,539,929 100.00 58,983 105,583
Travel Club (Pte) Ltd. 29,059 80.32 - - 2,801 2,352
Trinco Holiday Resorts (Pvt) Ltd. 8,120,005 80.32 - - 3,118 2,275
Trinco Walk Inn Ltd. 3,000,007 80.32 - - - -
Vauxhall Land Developments (Pvt) Ltd. 1,305,314,694 60.28 - - - -
Walkers Tours Ltd. 3,737,634 98.51 3,737,634 98.05 174,565 156,848
Waterfront Properties (Pvt) Ltd. 3,906,673,896 96.78 3,175,749,469 81.29 31,844,341 25,094,567
Whittall Boustead (Pvt) Ltd. 5,341,105 100.00 5,341,105 100.00 1,623,663 1,604,485
Whittall Boustead (Travel) Ltd. 22,452,271 100.00 22,452,271 100.00 270,631 267,040
Wirawila Walk Inn Ltd. 1,706,750 80.32 - - - -
Yala Village (Pvt) Ltd. 28,268,000 75.33 - - 2,319 1,751
Yala Village (Pvt) Ltd.- Non voting preference shares 10,000,000 80.32 - - - -
57,130,018 47,901,469
26. Investment in equity accounted investees Accounting policy An associate is an entity over which the Group has significant influence. Significant influence is the power to participate in the financial and operating policy decisions of the investee, but is not control or joint control over those policies.
Associate companies incorporated in Sri Lanka of the Group which have been accounted for under the equity method of accounting are: Capitol Hotel Holdings (Pvt) Ltd. Fairfirst Insurance Ltd. Indra Hotels and Resorts Kandy (Pvt) Ltd. Maersk Lanka (Pvt) Ltd. Nations Trust Bank PLC. Saffron Aviation (Pvt) Ltd. South Asia Gateway Terminals (Pvt) Ltd.
A joint venture is a type of joint arrangement whereby the parties that have joint control of the arrangement have rights to the net assets of the joint venture. Joint control is the contractually agreed sharing of control of an arrangement, which exists only when
decisions about the relevant activities require unanimous consent of the parties sharing control.
Joint ventures incorporated in Sri Lanka entered into by the Group, which have been accounted for using the equity method, are: Braybrooke Residential Properties (Pvt) Ltd. DHL Keells (Pvt) Ltd. Sentinel Reality (Pvt) Ltd.
The considerations made in determining significant influence or joint control are similar to those necessary to determine control over subsidiaries.
The Group’s investments in its associate and joint venture are accounted for using the equity method. Under the equity method, the investment in an associate or a joint venture is initially recognised at cost. The carrying amount of the investment is adjusted to recognise changes in the Group’s share of net assets of the associate or joint venture since the acquisition date. Goodwill relating to the associate or joint venture is included in the carrying amount of the investment and is not tested for impairment individually.
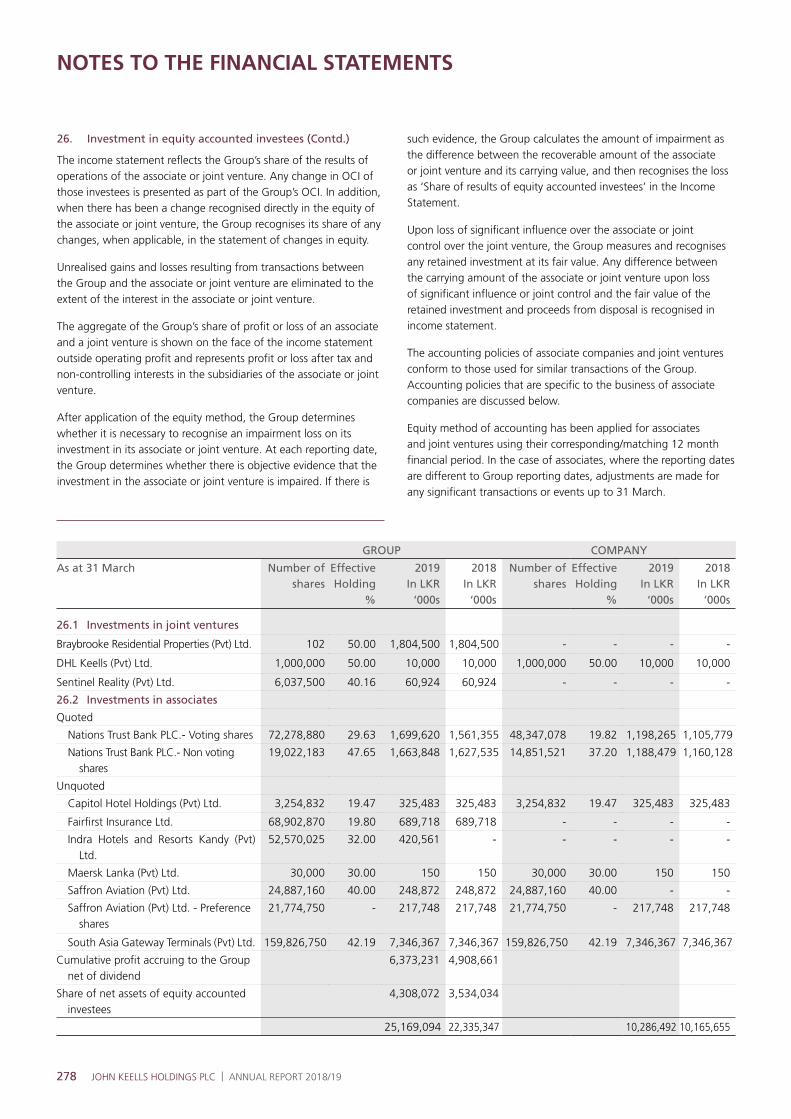
278 JOHN KEELLS HOLDINGS PLC | ANNUAL REPORT 2018/19
NOTES TO THE FINANCIAL STATEMENTS
The income statement reflects the Group’s share of the results of operations of the associate or joint venture. Any change in OCI of those investees is presented as part of the Group’s OCI. In addition, when there has been a change recognised directly in the equity of the associate or joint venture, the Group recognises its share of any changes, when applicable, in the statement of changes in equity.
Unrealised gains and losses resulting from transactions between the Group and the associate or joint venture are eliminated to the extent of the interest in the associate or joint venture.
The aggregate of the Group’s share of profit or loss of an associate and a joint venture is shown on the face of the income statement outside operating profit and represents profit or loss after tax and non-controlling interests in the subsidiaries of the associate or joint venture.
After application of the equity method, the Group determines whether it is necessary to recognise an impairment loss on its investment in its associate or joint venture. At each reporting date, the Group determines whether there is objective evidence that the investment in the associate or joint venture is impaired. If there is
26. Investment in equity accounted investees (Contd.) such evidence, the Group calculates the amount of impairment as the difference between the recoverable amount of the associate or joint venture and its carrying value, and then recognises the loss as ‘Share of results of equity accounted investees’ in the Income Statement.
Upon loss of significant influence over the associate or joint control over the joint venture, the Group measures and recognises any retained investment at its fair value. Any difference between the carrying amount of the associate or joint venture upon loss of significant influence or joint control and the fair value of the retained investment and proceeds from disposal is recognised in income statement.
The accounting policies of associate companies and joint ventures conform to those used for similar transactions of the Group. Accounting policies that are specific to the business of associate companies are discussed below.
Equity method of accounting has been applied for associates and joint ventures using their corresponding/matching 12 month financial period. In the case of associates, where the reporting dates are different to Group reporting dates, adjustments are made for any significant transactions or events up to 31 March.
GROUP COMPANY
As at 31 March Number of shares
Effective Holding
%
2019In LKR
‘000s
2018In LKR
‘000s
Number of shares
Effective Holding
%
2019In LKR
‘000s
2018In LKR
‘000s
26.1 Investments in joint ventures
Braybrooke Residential Properties (Pvt) Ltd. 102 50.00 1,804,500 1,804,500 - - - -
DHL Keells (Pvt) Ltd. 1,000,000 50.00 10,000 10,000 1,000,000 50.00 10,000 10,000
Sentinel Reality (Pvt) Ltd. 6,037,500 40.16 60,924 60,924 - - - -
26.2 Investments in associates
Quoted
Nations Trust Bank PLC.- Voting shares 72,278,880 29.63 1,699,620 1,561,355 48,347,078 19.82 1,198,265 1,105,779
Nations Trust Bank PLC.- Non voting shares
19,022,183 47.65 1,663,848 1,627,535 14,851,521 37.20 1,188,479 1,160,128
Unquoted
Capitol Hotel Holdings (Pvt) Ltd. 3,254,832 19.47 325,483 325,483 3,254,832 19.47 325,483 325,483
Fairfirst Insurance Ltd. 68,902,870 19.80 689,718 689,718 - - - -
Indra Hotels and Resorts Kandy (Pvt) Ltd.
52,570,025 32.00 420,561 - - - - -
Maersk Lanka (Pvt) Ltd. 30,000 30.00 150 150 30,000 30.00 150 150
Saffron Aviation (Pvt) Ltd. 24,887,160 40.00 248,872 248,872 24,887,160 40.00 - -
Saffron Aviation (Pvt) Ltd. - Preference shares
21,774,750 - 217,748 217,748 21,774,750 - 217,748 217,748
South Asia Gateway Terminals (Pvt) Ltd. 159,826,750 42.19 7,346,367 7,346,367 159,826,750 42.19 7,346,367 7,346,367
Cumulative profit accruing to the Group net of dividend
6,373,231 4,908,661
Share of net assets of equity accounted investees
4,308,072 3,534,034
25,169,094 22,335,347 10,286,492 10,165,655

279
FINANCIAL STATEMENTS
GROUP COMPANY
As at 31 MarchIn LKR ‘000s
2019 2018 2019 2018
Market ValueQuoted shares of Nations Trust Bank PLC.
Voting shares 6,497,871 5,709,065 4,346,402 3,818,773
Non voting shares 1,527,481 1,466,881 1,192,577 1,145,264
8,025,352 7,175,946 5,538,979 4,964,037
26.3 Summarised financial information of equity accounted investees
South Asia Gateway Terminals (Pvt) Ltd.
Other associates Joint ventures Total
As at 31 MarchIn LKR ‘000s
2019 2018 2019 2018 2019 2018 2019 2018
Group share of;
Revenue 6,688,598 5,901,220 9,031,584 8,039,374 2,019,181 1,932,883 17,739,363 15,873,477
Operating expenses including cost of sales
(3,858,010) (3,826,709) (6,725,599) (5,709,288) (1,797,382) (1,667,191) (12,380,991) (11,203,188)
Net finance income 81,222 59,240 2,455 25,337 27,905 16,144 111,582 100,721
Tax expense (3,912) (310,328) (659,014) (783,697) (79,683) (80,555) (742,609) (1,174,580)
Share of results of equity accounted investees
2,907,898 1,823,423 1,649,426 1,571,726 170,021 201,281 4,727,345 3,596,430
Other comprehensive income
832,203 159,448 294,310 370,622 16,764 (1,282) 1,143,277 528,788
Group share of;
Total assets 9,093,504 7,067,218 118,035,323 99,866,059 3,007,778 800,343 130,136,605 107,733,620
Total liabilities (2,681,409) (1,694,649) (106,406,232) (88,039,687) (623,120) (407,187) (109,710,761) (90,141,523)
Net assets 6,412,095 5,372,569 11,629,091 11,826,372 2,384,658 393,156 20,425,844 17,592,097
Goodwill 4,674,278 4,674,278 55,712 55,712 13,260 13,260 4,743,250 4,743,250
11,086,373 10,046,847 11,684,803 11,882,084 2,397,918 406,416 25,169,094 22,335,347
Contingent liabilities - - - - - - - -
Capital commitments - - 273,019 128,355 8,099,056 - 8,372,075 128,355
Other commitments and Guarantees
- - 61,297,752 55,678,928 - - 61,297,752 55,678,928
Dividend received 2,700,712 2,251,731 562,063 540,967 - 150,000 3,262,775 2,942,698
The share of results of equity accounted investees in the Income Statement and the Statement of Other Comprehensive Income are shown net of all related taxes.
The Group and the Company have neither contingent liabilities nor capital and other commitments towards its associates and joint ventures.
Group’s shareholding in Nations Trust Bank PLC. (NTB)The Director of Bank Supervision of the Central Bank of Sri Lanka (CBSL) has by letter dated 12 October 2017 informed NTB that the Monetary Board of the CBSL has permitted the Group to retain its current shareholding in voting shares in the Bank till 31 December
2020 and to reduce it to 15 per cent with effect from that date. The Monetary Board has also required NTB to limit the voting rights of the Group to 10 per cent with effect from 31 March 2018. NTB will continue to be an associate company of the Group. As at 31 March 2019, the Group has an economic interest of 32.16% in NTB.

280 JOHN KEELLS HOLDINGS PLC | ANNUAL REPORT 2018/19
NOTES TO THE FINANCIAL STATEMENTS
26. Investment in equity accounted investees (Contd.)Significant accounting policies that are specific to the business of equity accounted investeesNations Trust Bank PLC. (Bank)Revenue from contracts with customersRevenue is recognised to the extent that it is probable that the economic benefits will flow to the Bank and the revenue can be reliably measured. The following specific recognition criteria must also be met before revenue is recognised.
Interest income and expenseThe Bank calculates interest income by applying the EIR to the gross carrying amount of financial assets other than credit-impaired assets. The Bank ceases the recognition of interest income on assets when it is probable that the economic benefit associated will not continue to flow to the Bank. Interest income on all trading assets and financial assets mandatorily required to be measured at fair value through profit or loss is also recognised using the contractual interest rate in interest income.
Fee and commission incomeThe Bank earns fee and commission income from a diverse range of services it provides to its customers. Fee income can be divided in to the following three categories:
• Fee income earned from services that are provided over a certain period of time Fees earned for the provision of services are recognised as revenue as the services are provided. These fees include commission income and asset management fees, custody and other management and advisory fees.
• Fee income from providing financial services are earned on the execution of a significant act Fees and commissions arising from negotiating or participating in the negotiation of a transaction for a third party, such as the arrangement/participation or negotiation of the lending transactions or other securities are recognised on completion of the underlying transaction. Fees or components of fees that are linked to a certain performance are recognised after fulfilling the corresponding criteria.
• Fee income forming an integral part of the corresponding financial instrument Fees that the Bank considers to be an integral part of the corresponding financial instruments include: loan origination fees, loan commitment fees for loans that are likely to be drawn down and other credit related fees. The
recognition of these fees (together with any incremental costs) form an integral part of the corresponding financial instruments and are recognised as interest income through an adjustment to the EIR. The exception is, when it is unlikely that a loan will be drawn down, the loan commitment fees are recognised as revenue on expiry.
Dividend incomeDividend income is recognised when the Bank’s right to receive the payment is established which is generally when the shareholders approve the dividend.
Net trading incomeResults arising from trading activities include all gains and losses from changes in fair value.
Rental incomeRental income is recognised on a straight line basis
Other income Other income is recognised on an accrual basis
South Asia Gateway Terminals (Pvt) Ltd.Stevedoring revenue Stevedoring revenue is recognised on the berthing time of the vessel.
Storage revenueStorage revenue is recognised on the issue of delivery advice.
South Asia Gateway Terminals (Pvt) Ltd uses United States Dollar (USD) as its functional currency.
Fairfirst Insurance Ltd.Revenue from insurance contractsGeneral insurance business-gross written premiumGross written premiums (GWP) comprise the total premiums received/ receivable for the whole period of cover provided by contracts entered into during the accounting period. GWP is generally written upon inception of the policy. Rebates that form part of the premium rate, such as no-claim rebates, are deducted from the gross written premium
Insurance contract liabilities - generalNon-life insurance contract liabilities include the outstanding claims provision (Reserve for gross outstanding and incurred but not reported, and incurred and not enough reported - IBNR/ IBNER) and the provision for unearned premium and the provision for premium deficiency.
27. Non current financial assets
GROUP COMPANY
As at 31 MarchIn LKR ‘000s
Note 2019 2018 2019 2018
Quoted equity investments 234 344 - -
Unquoted equity investments 27.1 104,978 119,031 61,524 75,461
Non equity investments 27.2 35,081,093 32,758,879 219,745 191,650
35,186,305 32,878,254 281,269 267,111
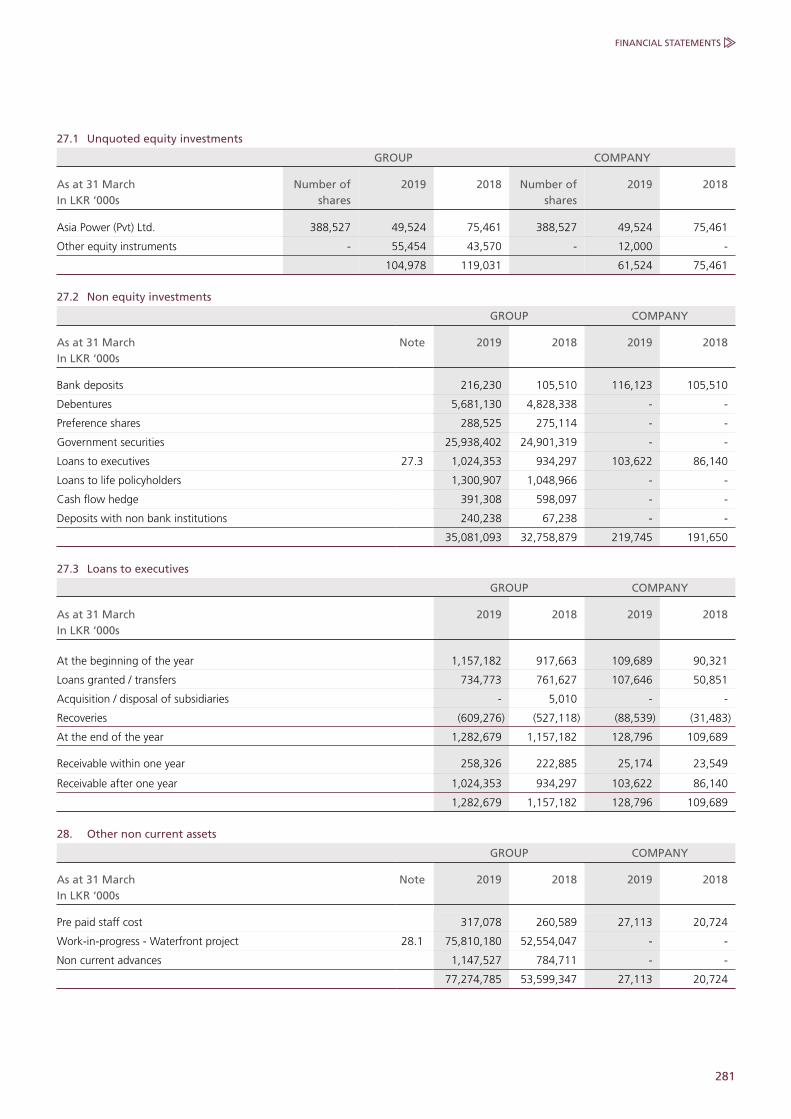
281
FINANCIAL STATEMENTS
27.1 Unquoted equity investments
GROUP COMPANY
As at 31 MarchIn LKR ‘000s
Number ofshares
2019 2018 Number ofshares
2019 2018
Asia Power (Pvt) Ltd. 388,527 49,524 75,461 388,527 49,524 75,461
Other equity instruments - 55,454 43,570 - 12,000 -
104,978 119,031 61,524 75,461
27.2 Non equity investments
GROUP COMPANY
As at 31 MarchIn LKR ‘000s
Note 2019 2018 2019 2018
Bank deposits 216,230 105,510 116,123 105,510
Debentures 5,681,130 4,828,338 - -
Preference shares 288,525 275,114 - -
Government securities 25,938,402 24,901,319 - -
Loans to executives 27.3 1,024,353 934,297 103,622 86,140
Loans to life policyholders 1,300,907 1,048,966 - -
Cash flow hedge 391,308 598,097 - -
Deposits with non bank institutions 240,238 67,238 - -
35,081,093 32,758,879 219,745 191,650
27.3 Loans to executives
GROUP COMPANY
As at 31 MarchIn LKR ‘000s
2019 2018 2019 2018
At the beginning of the year 1,157,182 917,663 109,689 90,321
Loans granted / transfers 734,773 761,627 107,646 50,851
Acquisition / disposal of subsidiaries - 5,010 - -
Recoveries (609,276) (527,118) (88,539) (31,483)
At the end of the year 1,282,679 1,157,182 128,796 109,689
Receivable within one year 258,326 222,885 25,174 23,549
Receivable after one year 1,024,353 934,297 103,622 86,140
1,282,679 1,157,182 128,796 109,689
28. Other non current assets
GROUP COMPANY
As at 31 MarchIn LKR ‘000s
Note 2019 2018 2019 2018
Pre paid staff cost 317,078 260,589 27,113 20,724
Work-in-progress - Waterfront project 28.1 75,810,180 52,554,047 - -
Non current advances 1,147,527 784,711 - -
77,274,785 53,599,347 27,113 20,724

282 JOHN KEELLS HOLDINGS PLC | ANNUAL REPORT 2018/19
NOTES TO THE FINANCIAL STATEMENTS
28. Other non current assets (Contd.)28.1 Work-in-progress - Waterfront project
GROUP
As at 31 MarchIn LKR ‘000s
2019 2018
Freehold property* 11,127,057 9,887,194
Leasehold property* 4,518,412 3,616,534
Other constructions in progress 55,354,766 33,051,125
Contractor advances 4,809,945 5,999,194
75,810,180 52,554,047
* The freehold and leasehold property are located at Glennie Street and Justice Akbar Mawatha, Colombo 2.
Other non-current assets, represents the construction work in progress, which mainly consists of freehold land, advance paid on obtaining lease land and other project cost incurred. Freehold land included under other non-current asset is carried at cost. Lease prepaid in advance consist of the prepayment made to obtain the lease land rights for 99 years. Other project cost includes advances paid to contractors, directly attributable cost incurred on the project and the capitalised borrowing cost.
Details of the Waterfront Integrated Resort ProjectThe company is engaged in the development and construction of an integrated complex with an approximate area of 4,500,000 square feet, comprising of offices, residential units, a hotel and conference centre, retail and associate facilities and a car park.
Details of property
Leasehold Freehold
BOI* UDA**
Extent: 3A-0R-19.35P 13P 7A-0R-16.63P
Period: 99 years from 12-02-2014
99 years from 01-08-2018
-
Lease commitment:
Upfront Lease rental of LKR. 3,030 Mn
Upfront Lease rental of LKR. 75.5 Mn
-
* Board of Investment** Urban Development Authority
28.2 Total project cost - Waterfront projectThe total project cost will be allocated based on the following percentages under each asset category, as estimated at this juncture of time. The final project cost allocation will be done in an absolute manner, once the project is close to completion.
Asset category Type Cost percentage
Property, plant and equipment
Hotel 49%
Investment Property Commercial buildings 27%
Inventory Residential apartments 24%
100%
29. Inventories Accounting policy Inventories are valued at the lower of cost and net realisable value. Net realisable value is the estimated selling price less estimated costs of completion and the estimated costs necessary to make the sale.
The costs incurred in bringing inventories to its present location and condition, are accounted for as follows:
• Raw materials - On a weighted average basis
• Finished goods and work-in-progress - At the cost of direct materials, direct labour and an appropriate proportion of fixed production overheads based on normal operating capacity but excluding borrowing costs
• Other inventories – At actual cost
GROUP
As at 31 MarchIn LKR ‘000s
2019 2018
Inventories
Raw materials 587,057 509,381
Finished goods 7,120,299 4,953,602
Produce stocks 298,700 309,974
Other stocks 1,540,958 916,584
9,547,014 6,689,541
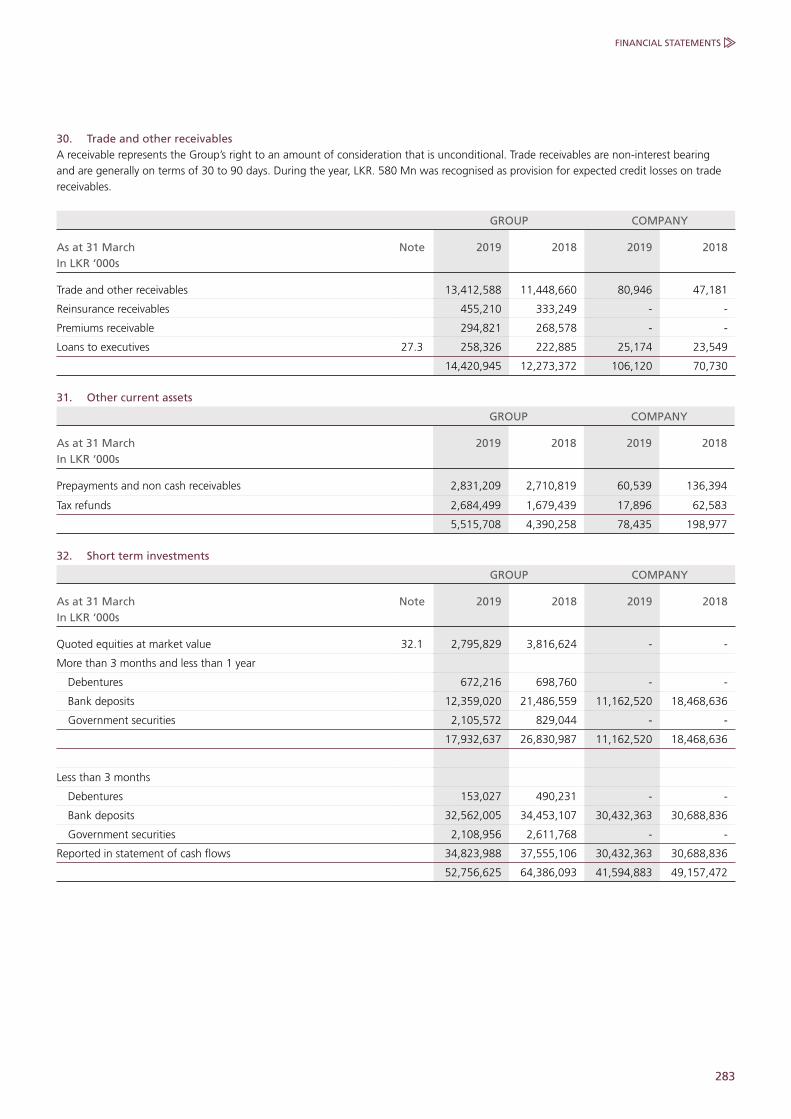
283
FINANCIAL STATEMENTS
30. Trade and other receivables A receivable represents the Group’s right to an amount of consideration that is unconditional. Trade receivables are non-interest bearing and are generally on terms of 30 to 90 days. During the year, LKR. 580 Mn was recognised as provision for expected credit losses on trade receivables.
GROUP COMPANY
As at 31 MarchIn LKR ‘000s
Note 2019 2018 2019 2018
Trade and other receivables 13,412,588 11,448,660 80,946 47,181
Reinsurance receivables 455,210 333,249 - -
Premiums receivable 294,821 268,578 - -
Loans to executives 27.3 258,326 222,885 25,174 23,549
14,420,945 12,273,372 106,120 70,730
31. Other current assets
GROUP COMPANY
As at 31 MarchIn LKR ‘000s
2019 2018 2019 2018
Prepayments and non cash receivables 2,831,209 2,710,819 60,539 136,394
Tax refunds 2,684,499 1,679,439 17,896 62,583
5,515,708 4,390,258 78,435 198,977
32. Short term investments
GROUP COMPANY
As at 31 MarchIn LKR ‘000s
Note 2019 2018 2019 2018
Quoted equities at market value 32.1 2,795,829 3,816,624 - -
More than 3 months and less than 1 year
Debentures 672,216 698,760 - -
Bank deposits 12,359,020 21,486,559 11,162,520 18,468,636
Government securities 2,105,572 829,044 - -
17,932,637 26,830,987 11,162,520 18,468,636
Less than 3 months
Debentures 153,027 490,231 - -
Bank deposits 32,562,005 34,453,107 30,432,363 30,688,836
Government securities 2,108,956 2,611,768 - -
Reported in statement of cash flows 34,823,988 37,555,106 30,432,363 30,688,836
52,756,625 64,386,093 41,594,883 49,157,472
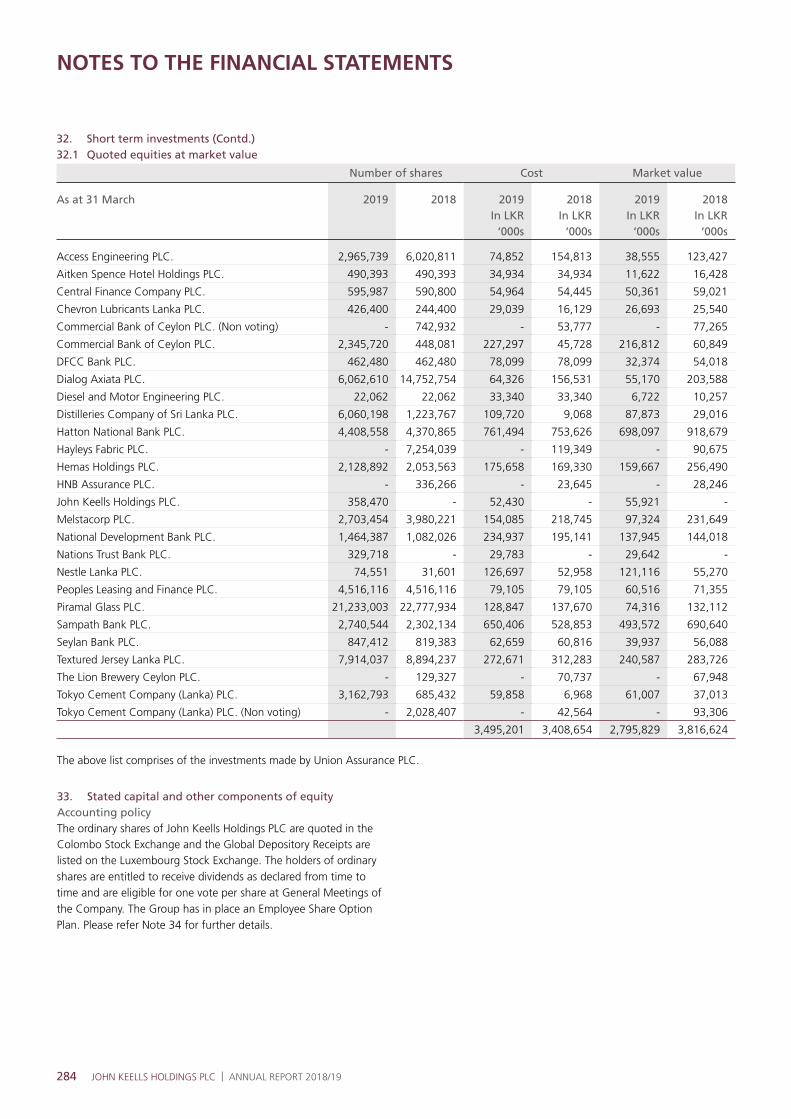
284 JOHN KEELLS HOLDINGS PLC | ANNUAL REPORT 2018/19
NOTES TO THE FINANCIAL STATEMENTS
32. Short term investments (Contd.)32.1 Quoted equities at market value
Number of shares Cost Market value
As at 31 March 2019 2018 2019In LKR
‘000s
2018In LKR
‘000s
2019In LKR
‘000s
2018In LKR
‘000s
Access Engineering PLC. 2,965,739 6,020,811 74,852 154,813 38,555 123,427
Aitken Spence Hotel Holdings PLC. 490,393 490,393 34,934 34,934 11,622 16,428
Central Finance Company PLC. 595,987 590,800 54,964 54,445 50,361 59,021
Chevron Lubricants Lanka PLC. 426,400 244,400 29,039 16,129 26,693 25,540
Commercial Bank of Ceylon PLC. (Non voting) - 742,932 - 53,777 - 77,265
Commercial Bank of Ceylon PLC. 2,345,720 448,081 227,297 45,728 216,812 60,849
DFCC Bank PLC. 462,480 462,480 78,099 78,099 32,374 54,018
Dialog Axiata PLC. 6,062,610 14,752,754 64,326 156,531 55,170 203,588
Diesel and Motor Engineering PLC. 22,062 22,062 33,340 33,340 6,722 10,257
Distilleries Company of Sri Lanka PLC. 6,060,198 1,223,767 109,720 9,068 87,873 29,016
Hatton National Bank PLC. 4,408,558 4,370,865 761,494 753,626 698,097 918,679
Hayleys Fabric PLC. - 7,254,039 - 119,349 - 90,675
Hemas Holdings PLC. 2,128,892 2,053,563 175,658 169,330 159,667 256,490
HNB Assurance PLC. - 336,266 - 23,645 - 28,246
John Keells Holdings PLC. 358,470 - 52,430 - 55,921 -
Melstacorp PLC. 2,703,454 3,980,221 154,085 218,745 97,324 231,649
National Development Bank PLC. 1,464,387 1,082,026 234,937 195,141 137,945 144,018
Nations Trust Bank PLC. 329,718 - 29,783 - 29,642 -
Nestle Lanka PLC. 74,551 31,601 126,697 52,958 121,116 55,270
Peoples Leasing and Finance PLC. 4,516,116 4,516,116 79,105 79,105 60,516 71,355
Piramal Glass PLC. 21,233,003 22,777,934 128,847 137,670 74,316 132,112
Sampath Bank PLC. 2,740,544 2,302,134 650,406 528,853 493,572 690,640
Seylan Bank PLC. 847,412 819,383 62,659 60,816 39,937 56,088
Textured Jersey Lanka PLC. 7,914,037 8,894,237 272,671 312,283 240,587 283,726
The Lion Brewery Ceylon PLC. - 129,327 - 70,737 - 67,948
Tokyo Cement Company (Lanka) PLC. 3,162,793 685,432 59,858 6,968 61,007 37,013
Tokyo Cement Company (Lanka) PLC. (Non voting) - 2,028,407 - 42,564 - 93,306
3,495,201 3,408,654 2,795,829 3,816,624
The above list comprises of the investments made by Union Assurance PLC.
33. Stated capital and other components of equityAccounting policyThe ordinary shares of John Keells Holdings PLC are quoted in the Colombo Stock Exchange and the Global Depository Receipts are listed on the Luxembourg Stock Exchange. The holders of ordinary shares are entitled to receive dividends as declared from time to time and are eligible for one vote per share at General Meetings of the Company. The Group has in place an Employee Share Option Plan. Please refer Note 34 for further details.

285
FINANCIAL STATEMENTS
Revaluation reserve consists of the net surplus on the revaluation of property, plant and equipment and present value of acquired in-force business (PVIB).
Foreign currency translation reserve comprises the net exchange movement arising on the currency translation of foreign operations and equity accounted investees into Sri Lankan rupees.
The other capital reserve is used to recognise the value of equity-settled share-based payments provided to employees, including key management personnel, as part of their remuneration.
Restricted regulatory reserve
Union Assurance PLC (UA)Based on the direction issued by the IRCSL dated 20 March 2018, UA has transferred LKR. 3,382 Mn attributable to non-participating and non unit fund of unit linked business from the life policyholder fund to the life shareholder fund (SHF). The distribution of the one-off surplus to shareholders, held as part of the Restricted Regulatory Reserve, is subject to meeting governance requirements stipulated by the IRCSL and can only be released upon receiving
approval from the IRCSL. The one-off surplus in the SHF is represented by government debt securities as per the direction of the IRCSL.
Nations Trust Bank PLC (NTB)Statutory reserve fund is maintained as per the requirement in terms of Section 20 of the Banking Act No 30 of 1988. Accordingly, a sum equivalent to 5% of profit after tax is (LKR. 386 Mn) transferred to the reserve fund until the reserve fund is equal to 50% of the Bank’s Stated Capital. Thereafter, a further 2% of profits will be transferred until the said reserve fund is equal to the Bank’s stated Capital.
Cash flow hedge reserve includes the fair value changes on the effective portion of interest rate swaps designated as cash flow hedges.
Fair value reserve of financial assets at FVOCI includes changes in fair value of financial instruments designated as financial assets at FVOCI.
33.1 Stated capital
COMPANY
As at 31 March 2019 2018
Number ofshares
In ‘000s
Value ofshares
In LKR ‘000s
Number ofshares
In ‘000s
Value ofshares
In LKR ‘000s
Fully paid ordinary shares
At the beginning of the year 1,387,529 62,802,327 1,387,468 62,790,080
Share options exercised 20 4,155 61 12,247
Share repurchase (69,376) - - -
At the end of the year 1,318,173 62,806,482 1,387,529 62,802,327
The number of shares in issue as at 31 March 2019 was 1,318 Mn which include global depository receipts (GDRs) of 1,320,942 (2018 - 1,320,942). Further information on the composition of shares in issue is given under the share information section of the annual report. A quantum of 45,736,456 shares
(2018 - 44,893,817) have been reserved to be issued under the employee share option plan as at 31 March 2019.
The Company repurchased 69,376,433 of its Ordinary Shares during the 2018/19 financial year amounting to 5 per cent of the total number of issued shares of the Company, at LKR 160.00 per share.
33.2 Other components of equity
GROUP COMPANY
As at 31 MarchIn LKR ‘000s
2019 2018 2019 2018
Revaluation reserve 35,931,552 34,145,712 - -
Foreign currency translation reserve 15,939,589 9,435,591 - -
Other capital reserve 2,390,966 1,916,415 2,390,966 1,916,415
Restricted regulatory reserve 3,509,194 3,123,554 - -
Cash flow hedge reserve 402,646 565,932 - -
Fair value reserve of financial assets at FVOCI / AFS 472,169 665,059 9,773 35,710
58,646,116 49,852,263 2,400,739 1,952,125

286 JOHN KEELLS HOLDINGS PLC | ANNUAL REPORT 2018/19
NOTES TO THE FINANCIAL STATEMENTS
34. Share-based payment plans Accounting PolicyEmployee share option plan - Equity-settled transactionsEmployees of the Group receive remuneration in the form of share-based payment transactions, whereby employees render services as consideration for equity instruments (equity-settled transactions).
The Group applies SLFRS 2 Share Based Payments in accounting for employee remuneration in the form of shares from 1 April 2013 onwards.
The cost of equity-settled transactions is recognised, together with a corresponding increase in other capital reserves in equity, over the period in which the performance and service conditions are fulfilled. The cumulative expense recognised for equity-settled transactions at each reporting date until the vesting date reflects the extent to which the vesting period has expired and the Group’s best estimate of the number of equity instruments that will ultimately vest. The expense or credit to the income statement for a period represents the movement in cumulative expense recognised as at the beginning and end of that period and is recognised in employee benefits expense.
No expense is recognised for awards that do not ultimately vest, except for equity-settled transactions where vesting is conditional upon a market or non-vesting condition, which are treated as vesting irrespective of whether or not the market or non-vesting condition is satisfied, provided that all other performance and service conditions are satisfied.
Where the terms of an equity-settled transaction award are modified, the minimum expense recognised is the expense as if the terms had not been modified, if the original terms of the award are met. An additional expense is recognised for any modification that increases the total fair value of the share-based payment transaction, or is otherwise beneficial to the employee as measured at the date of modification.
The dilutive effect of outstanding options is reflected as additional share dilution in the computation of diluted earnings per share (further details are given in Note 18.2).
Employee share option schemeUnder the John Keells Group’s Employees share option scheme (ESOP), share options of the parent are granted to executives of the Group generally with more than 12 months of service. The exercise price of the share options is equal to the 30 day volume weighted average market price of the underlying shares on the date of grant. The share options vest over a period of four years and is dependent on a performance criteria and a service criteria. The performance criteria being a minimum performance achievement of “Met Expectations” and service criteria being that the employee has to be in employment at the time the share options vest. The fair value of the share options is estimated at the grant date using a binomial option pricing model, taking into account the terms and conditions upon which the share options were granted.
The contractual term for each option granted is five years. There are no cash settlement alternatives. The Group does not have a past practice of cash settlement for these share options.
Share-based payment plans
GROUP COMPANY
For the year ended 31 MarchIn LKR ‘000s
2019 2018 2019 2018
Total expense arising from share-based payment transactions 475,629 517,374 144,665 170,759
Movements in the yearThe following table illustrates the number (No.) and weighted average exercise prices (WAEP) of, and movements in, share options during the year;
GROUP COMPANY
As at 31 March 2019 2018 2019 2018
No. WAEP No. WAEP No. WAEP No. WAEP
Outstanding at the beginning of the year 44,893,817 166.69 35,465,363 164.43 16,320,171 168.10 12,379,456 166.43
Granted during the year 10,381,395 154.10 10,402,204 173.25 3,048,027 154.10 3,100,564 173.25
Transfers - - - - 753,927 161.88 1,221,229 167.13
Exercised during the year (21,054) 146.14 (56,232) 146.24 (21,054) 146.14 (10,176) 146.48
Expired during the year (9,517,702) 188.70 (917,518) 162.31 (3,869,204) 190.82 (370,902) 159.01
Outstanding at the end of the year 45,736,456 159.26 44,893,817 166.69 16,231,867 159.80 16,320,171 168.10
Exercisable at the end of the year 26,310,276 160.44 25,054,358 171.59 10,140,831 171.53 10,753,779 171.78
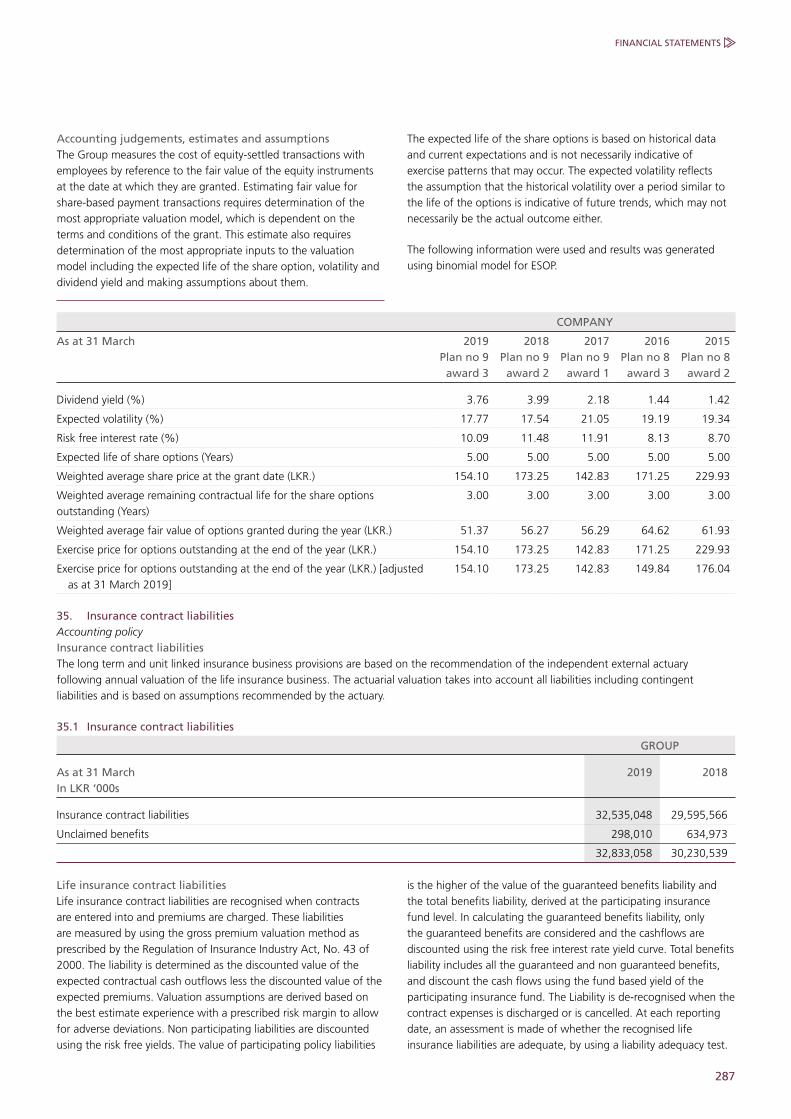
287
FINANCIAL STATEMENTS
Accounting judgements, estimates and assumptions The Group measures the cost of equity-settled transactions with employees by reference to the fair value of the equity instruments at the date at which they are granted. Estimating fair value for share-based payment transactions requires determination of the most appropriate valuation model, which is dependent on the terms and conditions of the grant. This estimate also requires determination of the most appropriate inputs to the valuation model including the expected life of the share option, volatility and dividend yield and making assumptions about them.
The expected life of the share options is based on historical data and current expectations and is not necessarily indicative of exercise patterns that may occur. The expected volatility reflects the assumption that the historical volatility over a period similar to the life of the options is indicative of future trends, which may not necessarily be the actual outcome either.
The following information were used and results was generated using binomial model for ESOP.
COMPANY
As at 31 March 2019Plan no 9
award 3
2018Plan no 9
award 2
2017Plan no 9
award 1
2016Plan no 8
award 3
2015Plan no 8
award 2
Dividend yield (%) 3.76 3.99 2.18 1.44 1.42
Expected volatility (%) 17.77 17.54 21.05 19.19 19.34
Risk free interest rate (%) 10.09 11.48 11.91 8.13 8.70
Expected life of share options (Years) 5.00 5.00 5.00 5.00 5.00
Weighted average share price at the grant date (LKR.) 154.10 173.25 142.83 171.25 229.93
Weighted average remaining contractual life for the share options outstanding (Years)
3.00 3.00 3.00 3.00 3.00
Weighted average fair value of options granted during the year (LKR.) 51.37 56.27 56.29 64.62 61.93
Exercise price for options outstanding at the end of the year (LKR.) 154.10 173.25 142.83 171.25 229.93
Exercise price for options outstanding at the end of the year (LKR.) [adjusted as at 31 March 2019]
154.10 173.25 142.83 149.84 176.04
35. Insurance contract liabilitiesAccounting policy Insurance contract liabilities The long term and unit linked insurance business provisions are based on the recommendation of the independent external actuary following annual valuation of the life insurance business. The actuarial valuation takes into account all liabilities including contingent liabilities and is based on assumptions recommended by the actuary.
35.1 Insurance contract liabilities
GROUP
As at 31 MarchIn LKR ‘000s
2019 2018
Insurance contract liabilities 32,535,048 29,595,566
Unclaimed benefits 298,010 634,973
32,833,058 30,230,539
Life insurance contract liabilities Life insurance contract liabilities are recognised when contracts are entered into and premiums are charged. These liabilities are measured by using the gross premium valuation method as prescribed by the Regulation of Insurance Industry Act, No. 43 of 2000. The liability is determined as the discounted value of the expected contractual cash outflows less the discounted value of the expected premiums. Valuation assumptions are derived based on the best estimate experience with a prescribed risk margin to allow for adverse deviations. Non participating liabilities are discounted using the risk free yields. The value of participating policy liabilities
is the higher of the value of the guaranteed benefits liability and the total benefits liability, derived at the participating insurance fund level. In calculating the guaranteed benefits liability, only the guaranteed benefits are considered and the cashflows are discounted using the risk free interest rate yield curve. Total benefits liability includes all the guaranteed and non guaranteed benefits, and discount the cash flows using the fund based yield of the participating insurance fund. The Liability is de-recognised when the contract expenses is discharged or is cancelled. At each reporting date, an assessment is made of whether the recognised life insurance liabilities are adequate, by using a liability adequacy test.

288 JOHN KEELLS HOLDINGS PLC | ANNUAL REPORT 2018/19
NOTES TO THE FINANCIAL STATEMENTS
35. Insurance contract liabilities (Contd.) Liability adequacy test (LAT)At each reporting date, an assessment is made of whether the recognised life insurance liabilities are adequate by using an existing liability adequacy test as laid out under SLFRS 4. The liability value is adjusted to the extent that it is adequate to meet future benefits and expenses. In performing the adequacy test, current best estimates of future contractual cash flows, including related cash flows such as claims handling and policy administration expenses, policyholder options and guarantees, as well as investment income from assets backing such liabilities, are used.
Any deficiency is recognised in the income statement by setting up a provision for liability adequacy.
Accounting judgements, estimates and assumptionsProduct classificationSLFRS 4 requires contracts written by insurers to be classified as either insurance contracts or investment contracts depending on the level of insurance risk transferred.
Insurance contracts are contracts under which one party (the Insurer) accepts significant insurance risk from another party (the policyholder) by agreeing to compensate the policyholder if a specified uncertain future event (the insured event) adversely affects the policyholder. Significant insurance risk exists if an insured event could cause an insurer to pay significant additional benefits in any scenario, excluding scenarios that lack commercial substance (i.e. have no discernible effect on the economics of the transaction). The classification of contracts identifies both the insurance contracts that the company issues and reinsurance contracts that the company holds.
Contracts where the company does not assume a significant insurance risk is classified as investment contracts.
Investment contracts are those contracts that transfer significant financial risks and no significant insurance risks. Financial risk is the risk of a possible future change in one or more of a specified interest rates, financial instrument prices, commodity prices, foreign exchange rates, index of price or rates, credit ratings or credit index or other variables, provided in the case of a non financial variable that the variable is not specific to a party to the contract.
Once a contract has been classified as an insurance contract, it remains an insurance contract for the remainder of its lifetime, even if the insurance risk reduces significantly during this period, unless all rights and obligations are extinguished or expired. Investment contracts can, however, be reclassified as insurance contracts after inception if insurance risk becomes significant.
Insurance and investment contracts are further classified as being either with or without discretionary participating features.
Discretionary participating features (DPF)DPF is a contractual right to receive, as a supplement to guaranteed benefits, additional benefits that;
• are likely to be a significant portion of the total contractual benefits;
• the amount or timing of which is contractually at the discretion of the issuer; and contractually based on:
• The performance of a specified pool of contracts or a specified type of contract,
• Realised and or unrealised investment returns on a specified pool of assets held by the issuer, and
• The profit or loss of the company, fund or other entity that issues the contract.
Derivatives embedded in an insurance contract or an investment contract with DPF are separated and fair valued through the income statement unless the embedded derivative itself is an insurance contract or investment contract with DPF. The derivative is also not separated if the host insurance contract and / or investment contract with DPF is measured at fair value through the profit and loss.
IRCSL regulations and the terms and conditions of these contracts set out the bases for the determination of the amounts on which the additional discretionary benefits are based (the DPF eligible surplus) and within which the company may exercise its discretion as to the quantum and timing of their payment to contract holders. At least 90% of the eligible surplus must be attributed to contract holders as a group (which can include future contract holders) and the amount and timing of the distribution to individual contract holders is at the discretion of the company, subject to the advice of the appointed actuary. All DPF liabilities including unallocated surpluses, both guaranteed and discretionary, at the end of the reporting period are held within insurance contract liabilities, as appropriate.
Valuation of life insurance contract liabilitiesLong duration contract liabilities included in the life insurance fund, result primarily from traditional participating and non participating life insurance products. Short duration contract liabilities are primarily group term, accident and health insurance products. The actuarial reserves have been established based on the following;
• Non participating liabilities are discounted using risk free yield curve provided by the IRCSL and the participating liabilities are based on the fund yield of the life fund.
• Mortality rates based on published mortality tables adjusted for actual experience as required by regulations issued by the IRCSL.
• Surrender rates based on actual experience.
The amount of policyholder dividend to be paid is determined annually by the company. The dividend includes life policyholders share of net income that is required to be allocated by the insurance contract.
Mortality, morbidity, longevity, investment returns, expenses, lapses, surrender rates and discount rates were the assumptions used for the valuation of insurance contract liabilities. For those contracts that insure risk related to longevity, prudent allowance is made for

289
FINANCIAL STATEMENTS
expected future mortality improvements, as well as wide ranging changes to the life style, which could result in significant changes to the expected future mortality exposure.
Estimates are also made for future investment income arising from the assets backing Life Insurance contracts. These estimates are based on current market returns, as well as expectations about future economic and financial developments.
Assumptions on future expenses are based on current expense levels, adjusted for expected expense inflation, if appropriate. Lapse and surrender rates are based on the company’s historical experience of lapses and surrenders.
Valuation of life insurance fundThe valuation of the conventional life insurance fund as at 31 December 2018 was carried out by Mr. Vivek Jalan FIA, FIAI of Willis Towers Watson India Private Limited and a sum of LKR. 1,085 Mn was transferred from the conventional life insurance fund to the shareholders fund for the year 2018. Subsequent to the transfer the conventional life fund stood at LKR. 30,557 Mn.
Similarly, the non unit fund of linked long term business valuation was carried out by Mr. Vivek Jalan FIA, FIAI of Willis Towers Watson
India Private Limited and a sum of LKR. 15 Mn was transferred from the non unit fund to the shareholders fund for the year 2018. Subsequent to the transfer the non unit fund stood at LKR. 43 Mn.
In the opinion of the consultant actuary, the admissible assets of the conventional life insurance fund and the non unit fund of linked long term business as at 31 December 2018 is adequate to cover the liabilities of the funds.
One - off surplus arising from change in policyliability valuationBased on the letter issued by the Insurance Regulatory Commission of Sri Lanka (IRCSL) (previously known as IBSL) dated 30 December 2016, all insurance companies were instructed to maintain the one - off surplus arising from change in policy liability valuation, separately within the long-term insurance fund / insurance contract liabilities. Accordingly, the one - off surplus was identified separately within the insurance contract liabilities as “Surplus created due to changes in valuation method from NPV to GPV”.
Based on the directions issued by the IRCSL dated 20 March 2018 and subsequent approval, UA PLC. has transferred LKR. 3,382 Mn attributable to non - participating and non unit fund of unit linked business from life policyholder fund through the income statement to life shareholder fund and held as part of the Restricted Regulatory Reserve under equity in the statement of financial position.
Movement in Life Insurance fund
As at 31 DecemberIn LKR ‘000s
2018 2017
Conventional life insurance fund
Balance as at 1 January 26,912,057 27,703,410
Increase in life insurance fund before surplus transfer to share holders 5,106,818 5,950,069
Transfer to shareholders (1,084,874) (3,438,283)
Transfer of one-off surplus from non participating fund - (3,393,900)
Effect of taxation on surplus/bonus transferred to policyholders (26,428) -
Net change in unclaimed benefits (350,253) 90,761
Balance as at 31 December 30,557,320 26,912,057
Non unit fund of linked life insurance contracts
Balance as at 1 January 37,556 186,272
Increase in non unit fund of linked life insurance before surplus transfer to share holders 8,929 39,259
Transfer to shareholders (15,126) (203,717)
Transfer of one-off surplus from non participating fund - 11,966
Net change in unclaimed benefits 11,202 3,776
Balance as at 31 December 42,561 37,556
30,599,881 26,949,613
Liability adequacy test (LAT) - Life insurance contract liabilitiesAs at 31 December 2018, liability adequacy test was performed by the appointed actuary Mr. Vivek Jalan FIA, FIAI of Willis Towers Watson India Private Limited who concluded that, the liability value is sufficient to meet future benefits and expenses. Hence, no provision was required to be made for any premium deficiency.
35.2 Change in life insurance contract liabilities The results of Union Assurance PLC’s (UA) life business segment is consolidated into the Group’s Consolidated Income Statement. The change in life insurance contract liabilities represents the transfer to the Life Fund, the difference between all income and expenditure attributable to life policy holders during the year.
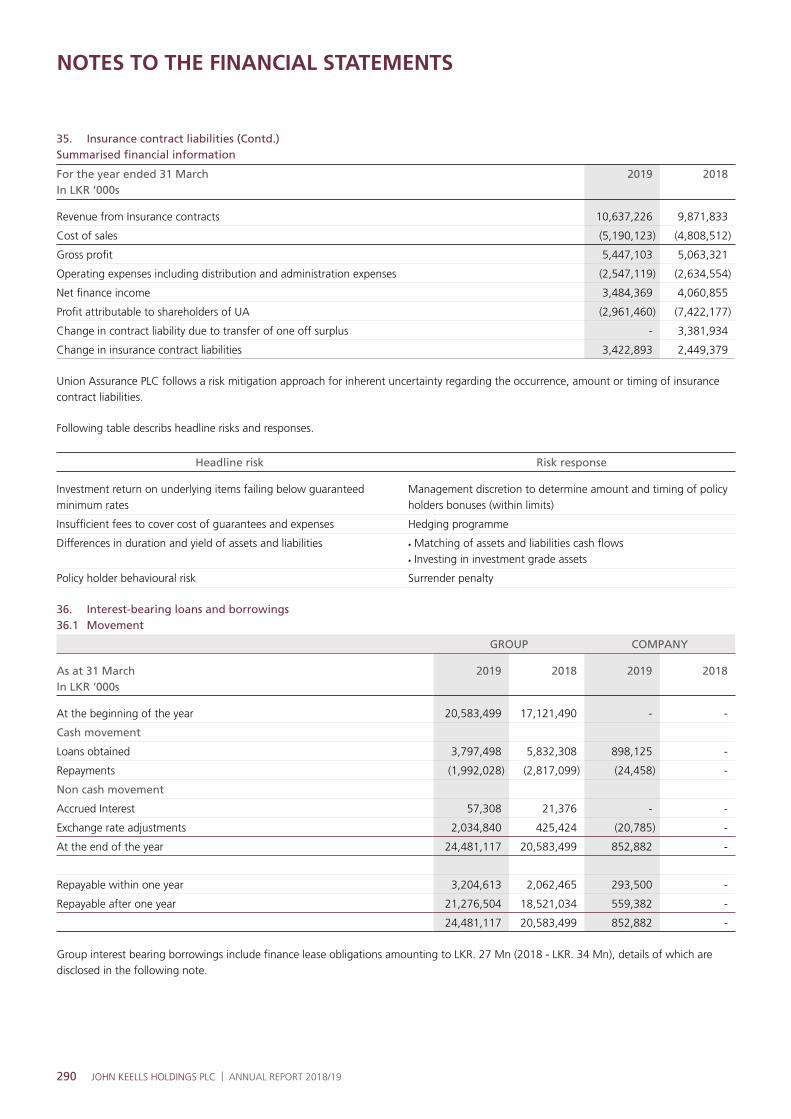
290 JOHN KEELLS HOLDINGS PLC | ANNUAL REPORT 2018/19
NOTES TO THE FINANCIAL STATEMENTS
35. Insurance contract liabilities (Contd.) Summarised financial information
For the year ended 31 MarchIn LKR ‘000s
2019 2018
Revenue from Insurance contracts 10,637,226 9,871,833
Cost of sales (5,190,123) (4,808,512)
Gross profit 5,447,103 5,063,321
Operating expenses including distribution and administration expenses (2,547,119) (2,634,554)
Net finance income 3,484,369 4,060,855
Profit attributable to shareholders of UA (2,961,460) (7,422,177)
Change in contract liability due to transfer of one off surplus - 3,381,934
Change in insurance contract liabilities 3,422,893 2,449,379
Union Assurance PLC follows a risk mitigation approach for inherent uncertainty regarding the occurrence, amount or timing of insurance contract liabilities.
Following table describs headline risks and responses.
Headline risk Risk response
Investment return on underlying items failing below guaranteed minimum rates
Management discretion to determine amount and timing of policy holders bonuses (within limits)
Insufficient fees to cover cost of guarantees and expenses Hedging programme
Differences in duration and yield of assets and liabilities • Matching of assets and liabilities cash flows• Investing in investment grade assets
Policy holder behavioural risk Surrender penalty
36. Interest-bearing loans and borrowings 36.1 Movement
GROUP COMPANY
As at 31 MarchIn LKR ‘000s
2019 2018 2019 2018
At the beginning of the year 20,583,499 17,121,490 - -
Cash movement
Loans obtained 3,797,498 5,832,308 898,125 -
Repayments (1,992,028) (2,817,099) (24,458) -
Non cash movement
Accrued Interest 57,308 21,376 - -
Exchange rate adjustments 2,034,840 425,424 (20,785) -
At the end of the year 24,481,117 20,583,499 852,882 -
Repayable within one year 3,204,613 2,062,465 293,500 -
Repayable after one year 21,276,504 18,521,034 559,382 -
24,481,117 20,583,499 852,882 -
Group interest bearing borrowings include finance lease obligations amounting to LKR. 27 Mn (2018 - LKR. 34 Mn), details of which are disclosed in the following note.
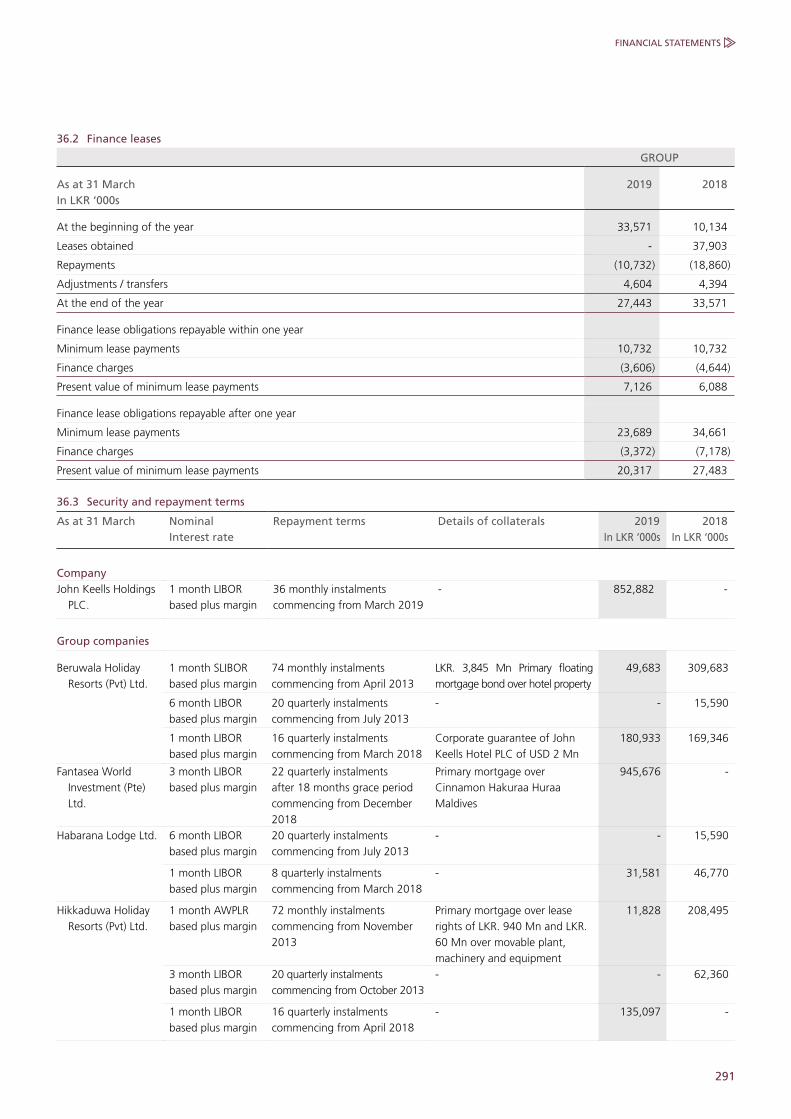
291
FINANCIAL STATEMENTS
36.2 Finance leases
GROUP
As at 31 MarchIn LKR ‘000s
2019 2018
At the beginning of the year 33,571 10,134
Leases obtained - 37,903
Repayments (10,732) (18,860)
Adjustments / transfers 4,604 4,394
At the end of the year 27,443 33,571
Finance lease obligations repayable within one year
Minimum lease payments 10,732 10,732
Finance charges (3,606) (4,644)
Present value of minimum lease payments 7,126 6,088
Finance lease obligations repayable after one year
Minimum lease payments 23,689 34,661
Finance charges (3,372) (7,178)
Present value of minimum lease payments 20,317 27,483
36.3 Security and repayment terms
As at 31 March Nominal Interest rate
Repayment terms Details of collaterals 2019In LKR ‘000s
2018In LKR ‘000s
CompanyJohn Keells Holdings
PLC.1 month LIBOR based plus margin
36 monthly instalments commencing from March 2019
- 852,882 -
Group companies
Beruwala Holiday Resorts (Pvt) Ltd.
1 month SLIBOR based plus margin
74 monthly instalments commencing from April 2013
LKR. 3,845 Mn Primary floating mortgage bond over hotel property
49,683 309,683
6 month LIBOR based plus margin
20 quarterly instalments commencing from July 2013
- - 15,590
1 month LIBOR based plus margin
16 quarterly instalments commencing from March 2018
Corporate guarantee of John Keells Hotel PLC of USD 2 Mn
180,933 169,346
Fantasea World Investment (Pte) Ltd.
3 month LIBOR based plus margin
22 quarterly instalments after 18 months grace period commencing from December 2018
Primary mortgage over Cinnamon Hakuraa Huraa Maldives
945,676 -
Habarana Lodge Ltd. 6 month LIBOR based plus margin
20 quarterly instalments commencing from July 2013
- - 15,590
1 month LIBOR based plus margin
8 quarterly instalments commencing from March 2018
- 31,581 46,770
Hikkaduwa Holiday Resorts (Pvt) Ltd.
1 month AWPLR based plus margin
72 monthly instalments commencing from November 2013
Primary mortgage over lease rights of LKR. 940 Mn and LKR. 60 Mn over movable plant, machinery and equipment
11,828 208,495
3 month LIBOR based plus margin
20 quarterly instalments commencing from October 2013
- - 62,360
1 month LIBOR based plus margin
16 quarterly instalments commencing from April 2018
- 135,097 -

292 JOHN KEELLS HOLDINGS PLC | ANNUAL REPORT 2018/19
NOTES TO THE FINANCIAL STATEMENTS
36. Interest-bearing loans and borrowings (Contd.)36.3 Security and repayment terms (Contd.)
As at 31 March Nominal Interest rate
Repayment terms Details of collaterals 2019In LKR ‘000s
2018In LKR ‘000s
John Keells Properties Ja-Ela (Pvt) Ltd.
1 month COF based plus margin
60 monthly instalments commencing from December 2016
General terms and conditions for LKR. 450 Mn signed relating to the term loan
337,080 376,360
Keells Food Products PLC.
3 month AWDR plus margin
60 monthly instalments commencing from December 2013 with 1 year grace period
- - 33,495
1 month COF plus margin
60 month equal capital installment commencing from February 2019
- 23,147 -
The Colombo Ice Company (Pvt) Ltd.
COF based plus margin
60 monthly instalments commencing from February 2016 with 1 year grace period
Corporate guarantee of Ceylon Cold Stores PLC. for LKR. 3.8 Bn
1,958,333 2,458,333
Trans Asia Hotels PLC.
Fixed rate (annually reviewed)
16 quarterly instalments commencing from September 2016
- 165,479 292,313
Tranquility (Pte) Ltd. 3 month LIBOR plus margin
20 quarterly instalments after 1 year grace period commencing from July 2017
Primary mortgage over Cinnamon Dhonveli Maldives
2,460,686 2,572,350
Travel Club (Pte) Ltd. 1 month LIBOR based plus margin
12 quarterly instalments commencing from September 2017
- 146,208 233,850
Trinco Holiday Resorts (Pvt) Ltd.
6 month LIBOR based plus margin
20 quarterly instalments commencing from April 2014
- - 36,306
3 month AWPLR based minus margin
83 monthly instalments commencing from July 2014
Letter of comfort from John Keells Hotels PLC.
165,000 187,800
1 month LIBOR based plus margin
8 quarterly instalments commencing from May 2018
- 36,529 54,097
Waterfront Properties (Pvt) Ltd.
1 month LIBOR based plus margin
13 quarterly instalments commencing from September 2019
Freehold and leasehold land of LKR. 11.4 Bn. Additionally, as a part of the sponsor support, John Keells Holdings PLC. has pledged 3,175 Mn of its shares in Waterfront Properties (Pvt) Ltd.
16,929,845 13,453,831
Yala Village (Pvt) Ltd. 1 month AWPLR based minus margin
30 monthly instalments commencing from July 2014
- - 11,667
6 month LIBOR based plus margin
20 quarterly instalments commencing from July 2013
- - 11,692
1 month LIBOR based plus margin
8 quarterly instalments commencing from April 2018
Corporate guarantee of John Keells Hotels PLC. for USD. 1.5 Mn
23,687 -
24,453,674 20,549,928
John Keells Office Automation (Pvt) Ltd.
Monthly interest Finance Lease - 27,443 33,571
24,481,117 20,583,499

293
FINANCIAL STATEMENTS
37.1 Employee benefit liabilities
GROUP COMPANY
As at 31 MarchIn LKR ‘000s
Note 2019 2018 2019 2018
Employee defined benefit plan - gratuity 37.2 1,990,197 1,971,420 135,630 208,788
Other long term employee benefit 37.3 95,629 - 21,379 -
At the end of the year 2,085,826 1,971,420 157,009 208,788
37.2 Employee defined benefit plan - gratuity
GROUP COMPANY
As at 31 MarchIn LKR ‘000s
2019 2018 2019 2018
At the beginning of the year 1,971,420 1,880,287 208,788 217,910
Current service cost 196,458 173,128 12,535 13,640
Acquisitions - 7,535 - -
Transfers - - 2,634 24,272
Acquisition / (disposal) of subsidiary - (8,763) - -
Interest cost on benefit obligation 185,512 198,780 21,923 23,970
Payments (334,143) (302,309) (109,256) (75,087)
(Gain) / loss arising from changes in assumptions (29,050) 22,762 (994) 4,083
At the end of the year 1,990,197 1,971,420 135,630 208,788
The expenses are recognised in the income statement in the following line items;
Cost of sales 200,862 190,969 9,458 12,017
Selling and distribution expenses 28,139 31,863 - -
Administrative expenses 152,969 149,076 25,000 25,593
381,970 371,908 34,458 37,610
37. Employee benefit liabilitiesAccounting PolicyEmployee contribution plans - EPF/ETFEmployees are eligible for Employees’ Provident Fund contributions and Employees’ Trust Fund contributions in line with respective statutes and regulations. The companies contribute the defined percentages of gross emoluments of employees to an approved Employees’ Provident Fund and to the Employees’ Trust Fund respectively, which are externally funded.
Employee defined benefit plan - gratuityThe liability recognised in the statement of financial position is the present value of the defined benefit obligation as at the reporting date using the projected unit credit method. Any actuarial gains or
losses arising are recognised immediately in other comprehensive income.
Other long term employee benefitA new Long-Term Incentive Plan (LTI) has been launched for senior employees of the Group. The overall incentive will be paid in cash as a lump sum payment upon achievement of key performance indicators linked to the five year strategic plan in place.
The liability recognised with respect to other long term employee benefits is measured as the present value of the estimated future cash outflows expected to be made by the Group in relation to the performance and the services of the relevant employees, up to the reporting date.

294 JOHN KEELLS HOLDINGS PLC | ANNUAL REPORT 2018/19
NOTES TO THE FINANCIAL STATEMENTS
37. Employee benefit liabilities (Contd.)37.3 Other long term employee benefits
GROUP COMPANY
As at 31 MarchIn LKR ‘000s
2019 2018 2019 2018
Current service cost 95,629 - 21,379 -
At the end of the year 95,629 - 21,379 -
Accounting judgements , estimates and assumptions Employee benefit liabilityThe employee benefit liability of the Group is based on the actuarial valuation carried out by Independent actuarial specialists. The actuarial valuations involve making assumptions about discount rates and future salary increases. The complexity of the valuation,
the underlying assumptions and its long term nature, the defined benefit obligation is highly sensitive to changes in these assumptions. All assumptions are reviewed at each reporting date.
The principal assumptions used in determining the cost of employee benefits were:
As at 31 MarchIn LKR ‘000s
2019 2018
Discount rate 9.5% - 11.00% 9.00% - 10.5%
Future salary increases 6.00% - 10.00% 6.00% - 10.00%
37.4 Sensitivity of assumptions usedA one percentage change in the assumptions would have the following effects to employee defined benefit plan - gratuity.
GROUP COMPANY
As at 31 MarchIn LKR ‘000s
2019 2018 2019 2018
Discount rate:
1% Increase (81,343) (73,010) (7,309) (6,682)
1% Decrease 88,653 101,525 8,061 7,281
Salary Increment rate:
1% Increase 92,332 90,843 8,298 7,709
1% Decrease (86,203) (77,137) (7,649) (7,219)
37.5 Maturity analysis of the payments The following payments are expected on employee benefit plan - gratuity in future years.
GROUP COMPANY
As at 31 MarchIn LKR ‘000s
2019 2018 2019 2018
Within the next 12 months 186,302 273,562 6,858 74,985
Between 1 and 2 years 254,958 223,855 8,197 4,949
Between 2 and 5 years 741,680 650,931 16,675 51,316
Between 5 and 10 years 737,708 741,218 90,501 75,516
Beyond 10 years 69,549 81,854 13,399 2,022
Total expected payments 1,990,197 1,971,420 135,630 208,788
Weighted average duration (years) of defined benefit obligation 5.76 5.87 9.97 8.29

295
FINANCIAL STATEMENTS
38. Other non current liabilitiesAccounting policyGroup classifies all non financial non current liabilities under other non current liabilities which include non refundable advances and deposits.
GROUP
As at 31 March In LKR ‘000s
2019 2018
Advances received 1,669,093 1,931,661
Contract liabilities 9,891,511 4,599,786
Deposits 137,589 172,921
Other deferred liabilities 230,612 191,403
11,928,805 6,895,771
39. Trade and other payablesAccounting policy Trade payables are the aggregate amount of obligations to pay for goods or services, that have been acquired in the ordinary course of business. Trade payables are classified as current liabilities if payment is due within one year.
GROUP COMPANY
As at 31 March In LKR ‘000s
2019 2018 2019 2018
Trade and other payables 18,844,876 15,533,778 346,926 332,191
Contract Liabilities 74,266 51,521 - -
Reinsurance payables 661,912 375,410 - -
Advances and deposits 163,767 116,790 - -
19,744,821 16,077,499 346,926 332,191
Trade and other payables are non-interest bearing and settled within one year. Reinsurance payables are settled within one year. For further explanation on the Group’s liquidity risk management process refer Note 10.2.2.
40. Short term borrowingsAccounting policy Short term borrowings are the interest bearing borrowings of the Group which fall due within 12 months from the end of the financial year. These are obtained for working capital requirements.
GROUP COMPANY
As at 31 March In LKR ‘000s
2019 2018 2019 2018
Bank borrowings 9,970,906 3,128,508 4,000,010 -
9,970,906 3,128,508 4,000,010 -
41. Other current liabilities Accounting policyGroup classifies all non financial current liabilities under other current liabilities.
GROUP COMPANY
As at 31 March In LKR ‘000s
2019 2018 2019 2018
Non refundable deposits 372,639 834,038 2,566 2,566
Contract Liabilities 961,112 1,071,773 - -
Other tax payables 1,644,977 1,607,403 3,080 2,761
2,978,728 3,513,214 5,646 5,327
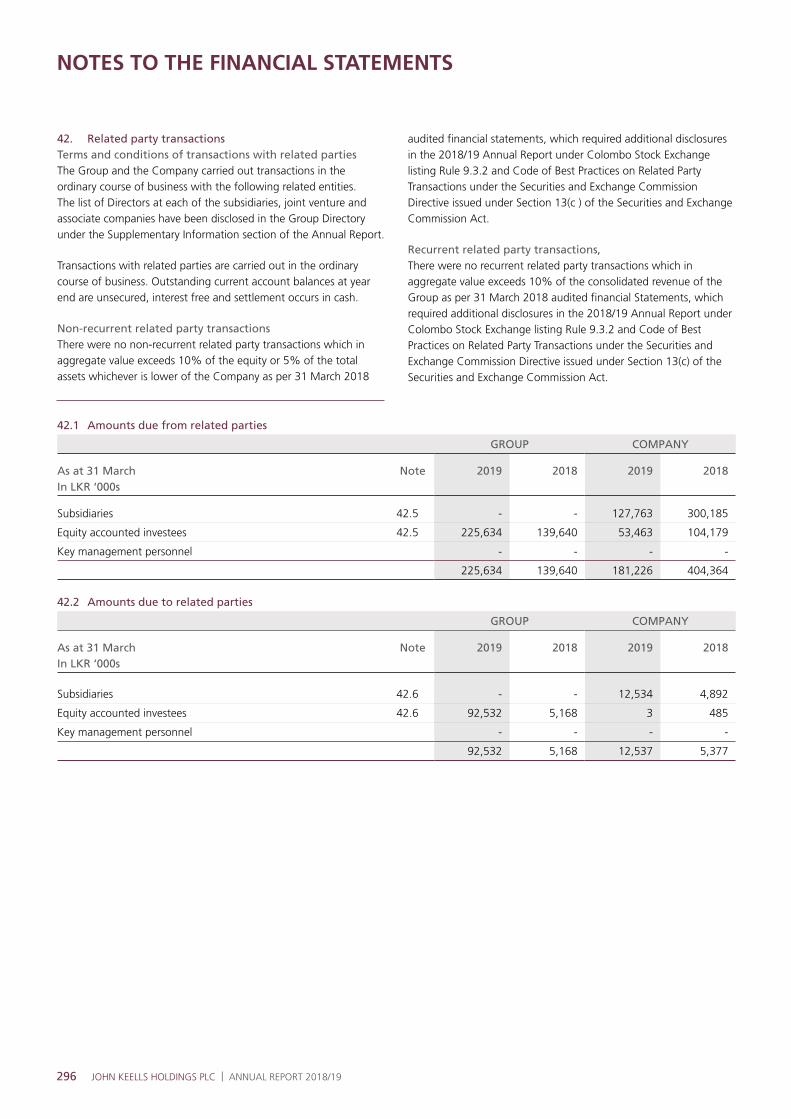
296 JOHN KEELLS HOLDINGS PLC | ANNUAL REPORT 2018/19
NOTES TO THE FINANCIAL STATEMENTS
42. Related party transactionsTerms and conditions of transactions with related partiesThe Group and the Company carried out transactions in the ordinary course of business with the following related entities. The list of Directors at each of the subsidiaries, joint venture and associate companies have been disclosed in the Group Directory under the Supplementary Information section of the Annual Report.
Transactions with related parties are carried out in the ordinary course of business. Outstanding current account balances at year end are unsecured, interest free and settlement occurs in cash.
Non-recurrent related party transactionsThere were no non-recurrent related party transactions which in aggregate value exceeds 10% of the equity or 5% of the total assets whichever is lower of the Company as per 31 March 2018
audited financial statements, which required additional disclosures in the 2018/19 Annual Report under Colombo Stock Exchange listing Rule 9.3.2 and Code of Best Practices on Related Party Transactions under the Securities and Exchange Commission Directive issued under Section 13(c ) of the Securities and Exchange Commission Act.
Recurrent related party transactions,There were no recurrent related party transactions which in aggregate value exceeds 10% of the consolidated revenue of the Group as per 31 March 2018 audited financial Statements, which required additional disclosures in the 2018/19 Annual Report under Colombo Stock Exchange listing Rule 9.3.2 and Code of Best Practices on Related Party Transactions under the Securities and Exchange Commission Directive issued under Section 13(c) of the Securities and Exchange Commission Act.
42.1 Amounts due from related parties
GROUP COMPANY
As at 31 March In LKR ‘000s
Note 2019 2018 2019 2018
Subsidiaries 42.5 - - 127,763 300,185
Equity accounted investees 42.5 225,634 139,640 53,463 104,179
Key management personnel - - - -
225,634 139,640 181,226 404,364
42.2 Amounts due to related parties
GROUP COMPANY
As at 31 March In LKR ‘000s
Note 2019 2018 2019 2018
Subsidiaries 42.6 - - 12,534 4,892
Equity accounted investees 42.6 92,532 5,168 3 485
Key management personnel - - - -
92,532 5,168 12,537 5,377
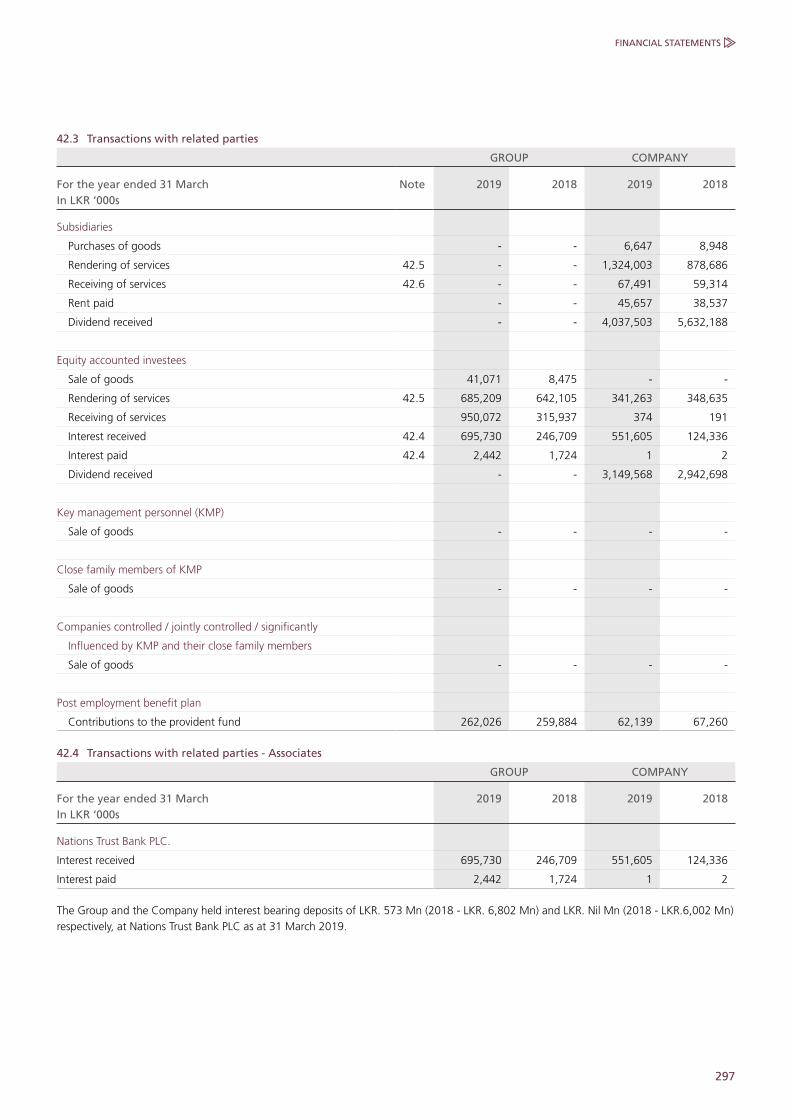
297
FINANCIAL STATEMENTS
42.3 Transactions with related parties
GROUP COMPANY
For the year ended 31 March In LKR ‘000s
Note 2019 2018 2019 2018
Subsidiaries
Purchases of goods - - 6,647 8,948
Rendering of services 42.5 - - 1,324,003 878,686
Receiving of services 42.6 - - 67,491 59,314
Rent paid - - 45,657 38,537
Dividend received - - 4,037,503 5,632,188
Equity accounted investees
Sale of goods 41,071 8,475 - -
Rendering of services 42.5 685,209 642,105 341,263 348,635
Receiving of services 950,072 315,937 374 191
Interest received 42.4 695,730 246,709 551,605 124,336
Interest paid 42.4 2,442 1,724 1 2
Dividend received - - 3,149,568 2,942,698
Key management personnel (KMP)
Sale of goods - - - -
Close family members of KMP
Sale of goods - - - -
Companies controlled / jointly controlled / significantly
Influenced by KMP and their close family members
Sale of goods - - - -
Post employment benefit plan
Contributions to the provident fund 262,026 259,884 62,139 67,260
42.4 Transactions with related parties - Associates
GROUP COMPANY
For the year ended 31 MarchIn LKR ‘000s
2019 2018 2019 2018
Nations Trust Bank PLC.
Interest received 695,730 246,709 551,605 124,336
Interest paid 2,442 1,724 1 2
The Group and the Company held interest bearing deposits of LKR. 573 Mn (2018 - LKR. 6,802 Mn) and LKR. Nil Mn (2018 - LKR.6,002 Mn) respectively, at Nations Trust Bank PLC as at 31 March 2019.

298 JOHN KEELLS HOLDINGS PLC | ANNUAL REPORT 2018/19
NOTES TO THE FINANCIAL STATEMENTS
42. Related party transactions (Contd.)42.5 Related party transactions and balances
COMPANY
Rendering of services Amounts due from
For the year ended/As at 31 March In LKR ‘000s
2019 2018 2019 2018
Subsidiaries
Asian Hotels and Properties PLC. 58,117 50,411 8,099 5,809
Ceylon Cold Stores PLC. 87,880 69,791 - 35
Cinnamon Hotel Management Ltd. 121,436 100,272 6,924 12,896
InfoMate (Pvt) Ltd. 34,794 26,694 1,909 1,835
JayKay Marketing Services (Pvt) Ltd. 363,457 153,730 34,210 25,153
John Keells Logistics (Pvt) Ltd. 32,454 18,807 3,837 3,236
John Keells Office Automation (Pvt) Ltd. 34,619 28,211 2,573 7,994
John Keells PLC. 22,118 18,373 1,395 1,430
Keells Food Products PLC. 31,835 26,004 2,667 3,700
Lanka Marine Services Ltd. 13,384 12,525 5 1,228
Mack Air (Pvt) Ltd. 17,165 12,668 1,380 2,205
Mackinnons Keells Ltd. 2,636 2,754 - 103
Mackinnons Travels (Pvt) Ltd. 14,223 13,015 - -
Rajawella Holdings Ltd. 4,532 3,162 1,312 5
Trans Asia Hotels PLC. 35,948 29,721 - -
Union Assurance PLC. 110,300 52,023 40,203 19,904
Walkers Tours Ltd. 49,781 38,995 4,429 188,929
Waterfront Properties (Pvt) Ltd. 50,362 49,374 4,994 4,007
Whittall Boustead (Pvt) Ltd. 61,896 22,843 3,768 2,869
Other subsidiaries 177,066 149,313 10,058 18,847
1,324,003 878,686 127,763 300,185
Equity accounted investees
Joint ventures 308,749 296,663 49,928 100,514
Associates 32,514 51,972 3,535 3,665
341,263 348,635 53,463 104,179

299
FINANCIAL STATEMENTS
42.6 Related party transactions and balances
COMPANY
Receiving of services Amounts due to
For the year ended/As at 31 March In LKR ‘000s
2019 2018 2019 2018
Subsidiaries
Asian Hotels and Properties PLC. 9,687 6,101 - -
InfoMate (Pvt) Ltd. 5,910 6,372 - -
Mackinnons Travels (Pvt) Ltd. 18,955 22,487 2,399 2,019
Trans Asia Hotels PLC. 7,914 4,573 513 841
Whittall Boustead (Pvt) Ltd. 9,820 9,131 - -
Other subsidiaries 15,205 10,650 9,622 2,032
67,491 59,314 12,534 4,892
Equity accounted investees
Joint ventures 231 191 - -
Associates 143 - 3 485
374 191 3 485
42.7 Compensation of key management personnelKey management personnel include members of the Board of Directors of John Keells Holdings PLC and its subsidiary companies.
GROUP COMPANY
For the year ended 31 MarchIn LKR ‘000s
2019 2018 2019 2018
Short-term employee benefits 470,278 464,567 169,879 237,442
Post employment benefits 7,408 8,436 2,235 3,294
Other long-term benefits - - - -
Termination benefits - - - -
Share based payments 122,823 163,799 61,831 109,007
600,509 636,802 233,945 349,743
Directors’ interest in the employee share option plan of the CompanyAs at 31 March 2019, the executive members of the Board of Directors held options to purchase ordinary shares under the employee share option plan as follows;
COMPANY
2019 2018
Expiry date Adjusted exerciseprice LKR
Number of sharesoutstanding at
the end of period
Number of sharesexercisable at the
end of period
Number of sharesoutstanding at the
end of period
Number of shares exercisable at the
end of period
30.06.2019 176.04 446,796 446,796 2,038,537 1,717,508
24.06.2020 149.84 502,522 376,890 1,675,073 1,115,408
14.08.2021 142.83 600,000 300,000 1,575,000 862,500
02.07.2022 173.25 725,000 181,250 1,740,000 660,000
21.06.2023 154.10 880,000 - - -
No share options have been granted to the non-executive members of the Board of Directors under the employee share option plan.
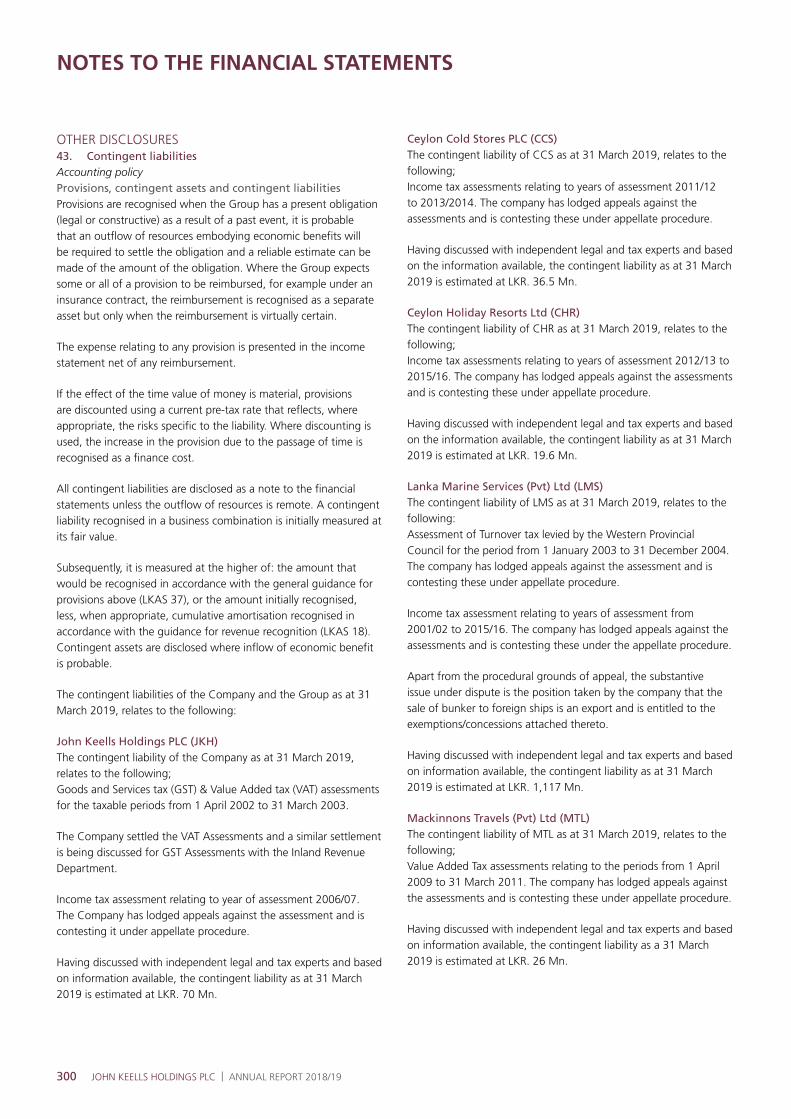
300 JOHN KEELLS HOLDINGS PLC | ANNUAL REPORT 2018/19
NOTES TO THE FINANCIAL STATEMENTS
OTHER DISCLOSURES43. Contingent liabilitiesAccounting policyProvisions, contingent assets and contingent liabilities Provisions are recognised when the Group has a present obligation (legal or constructive) as a result of a past event, it is probable that an outflow of resources embodying economic benefits will be required to settle the obligation and a reliable estimate can be made of the amount of the obligation. Where the Group expects some or all of a provision to be reimbursed, for example under an insurance contract, the reimbursement is recognised as a separate asset but only when the reimbursement is virtually certain.
The expense relating to any provision is presented in the income statement net of any reimbursement.
If the effect of the time value of money is material, provisions are discounted using a current pre-tax rate that reflects, where appropriate, the risks specific to the liability. Where discounting is used, the increase in the provision due to the passage of time is recognised as a finance cost.
All contingent liabilities are disclosed as a note to the financial statements unless the outflow of resources is remote. A contingent liability recognised in a business combination is initially measured at its fair value.
Subsequently, it is measured at the higher of: the amount that would be recognised in accordance with the general guidance for provisions above (LKAS 37), or the amount initially recognised, less, when appropriate, cumulative amortisation recognised in accordance with the guidance for revenue recognition (LKAS 18). Contingent assets are disclosed where inflow of economic benefit is probable.
The contingent liabilities of the Company and the Group as at 31 March 2019, relates to the following:
John Keells Holdings PLC (JKH)The contingent liability of the Company as at 31 March 2019, relates to the following;Goods and Services tax (GST) & Value Added tax (VAT) assessments for the taxable periods from 1 April 2002 to 31 March 2003.
The Company settled the VAT Assessments and a similar settlement is being discussed for GST Assessments with the Inland Revenue Department.
Income tax assessment relating to year of assessment 2006/07. The Company has lodged appeals against the assessment and is contesting it under appellate procedure.
Having discussed with independent legal and tax experts and based on information available, the contingent liability as at 31 March 2019 is estimated at LKR. 70 Mn.
Ceylon Cold Stores PLC (CCS)The contingent liability of CCS as at 31 March 2019, relates to the following;Income tax assessments relating to years of assessment 2011/12 to 2013/2014. The company has lodged appeals against the assessments and is contesting these under appellate procedure.
Having discussed with independent legal and tax experts and based on the information available, the contingent liability as at 31 March 2019 is estimated at LKR. 36.5 Mn.
Ceylon Holiday Resorts Ltd (CHR)The contingent liability of CHR as at 31 March 2019, relates to the following;Income tax assessments relating to years of assessment 2012/13 to 2015/16. The company has lodged appeals against the assessments and is contesting these under appellate procedure.
Having discussed with independent legal and tax experts and based on the information available, the contingent liability as at 31 March 2019 is estimated at LKR. 19.6 Mn.
Lanka Marine Services (Pvt) Ltd (LMS)The contingent liability of LMS as at 31 March 2019, relates to the following:Assessment of Turnover tax levied by the Western Provincial Council for the period from 1 January 2003 to 31 December 2004. The company has lodged appeals against the assessment and is contesting these under appellate procedure.
Income tax assessment relating to years of assessment from 2001/02 to 2015/16. The company has lodged appeals against the assessments and is contesting these under the appellate procedure.
Apart from the procedural grounds of appeal, the substantive issue under dispute is the position taken by the company that the sale of bunker to foreign ships is an export and is entitled to the exemptions/concessions attached thereto.
Having discussed with independent legal and tax experts and based on information available, the contingent liability as at 31 March 2019 is estimated at LKR. 1,117 Mn.
Mackinnons Travels (Pvt) Ltd (MTL)The contingent liability of MTL as at 31 March 2019, relates to the following;Value Added Tax assessments relating to the periods from 1 April 2009 to 31 March 2011. The company has lodged appeals against the assessments and is contesting these under appellate procedure.
Having discussed with independent legal and tax experts and based on information available, the contingent liability as a 31 March 2019 is estimated at LKR. 26 Mn.

301
FINANCIAL STATEMENTS
Trans Asia Hotels PLC (TAH)The contingent liability of the TAH as at 31 March 2019, relates to the following;Income tax assessments relating to years of assessments 2012/13 to 2015/2016. The company has lodged appeals against the assessments and is contesting these under appellate procedure.
Having discussed with independent legal and tax experts and based on the information available, the contingent liability as at 31 March 2019 is estimated at LKR. 41.1 Mn.
Walkers Tours Limited (WTL)The contingent liability of the WTL as at 31 March 2019, relates to the following;Economic Service Charge assessment relating to the year of assessment 2014/15. The company has lodged an appeal against the assessment and is contesting it under appellate procedure.
Having discussed with independent legal and tax experts and based on the information available, the contingent liability as at 31 March 2019 is estimated at LKR. 10.5 Mn.
Union Assurance PLC (UA)Income Tax Assessments received for years of assessments 2010/11, 2011/12, 2012/13, 2013/14, 2014/15 and 2015/16
The assessments were raised for the above years of assessments by making life insurance income liable to pay income taxes of LKR. 13 Mn, LKR. 132 Mn, LKR. 411 Mn, LKR. 175 Mn, LKR. 862 Mn and LKR. 832 Mn respectively. The company has lodged valid appeals against the assessments raised and is contesting these under the appellate procedure.
Having discussed with independent legal and tax experts and based on information available, the Directors are of the view that the company has followed due process and acted in accordance with the prevailing laws in its tax submissions for years of assessment from 2010/11 to 2015/16 and accordingly have concluded that the above assessments have no rationale or basis in law.
44. Capital and other commitments
GROUP COMPANY
As at 31 MarchIn LKR ‘000s
2019 2018 2019 2018
Capital commitments approved but not provided for 82,642,798 64,859,651 - -
Guarantees 2,824,709 299,044 117,000 117,000
85,467,507 65,158,695 117,000 117,000
45. Lease commitments
GROUP
As at 31 MarchIn LKR ‘000s
2019 2018
Lease rentals due on non-cancellable operating leases;
Within one year 1,093,204 965,899
Between one and five years 2,708,745 2,472,142
After five years 8,508,357 8,252,530
12,310,306 11,690,571
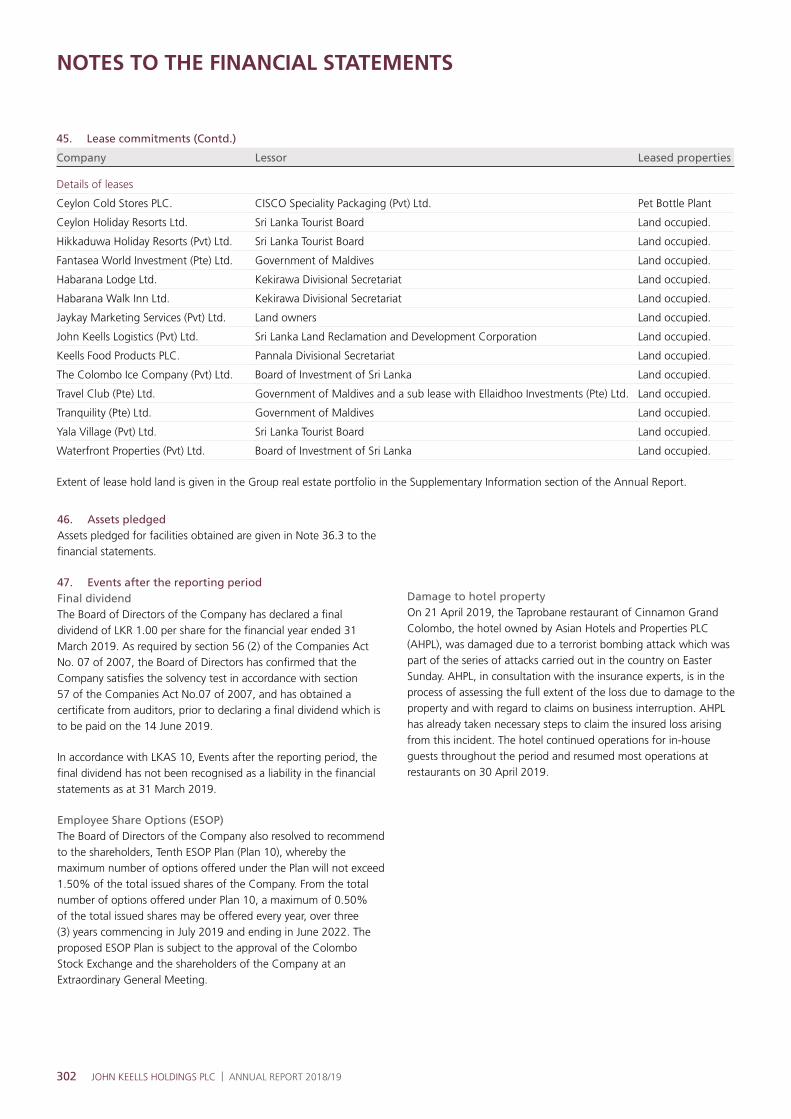
302 JOHN KEELLS HOLDINGS PLC | ANNUAL REPORT 2018/19
NOTES TO THE FINANCIAL STATEMENTS
46. Assets pledgedAssets pledged for facilities obtained are given in Note 36.3 to the financial statements.
47. Events after the reporting periodFinal dividend The Board of Directors of the Company has declared a final dividend of LKR 1.00 per share for the financial year ended 31 March 2019. As required by section 56 (2) of the Companies Act No. 07 of 2007, the Board of Directors has confirmed that the Company satisfies the solvency test in accordance with section 57 of the Companies Act No.07 of 2007, and has obtained a certificate from auditors, prior to declaring a final dividend which is to be paid on the 14 June 2019.
In accordance with LKAS 10, Events after the reporting period, the final dividend has not been recognised as a liability in the financial statements as at 31 March 2019.
Employee Share Options (ESOP)The Board of Directors of the Company also resolved to recommend to the shareholders, Tenth ESOP Plan (Plan 10), whereby the maximum number of options offered under the Plan will not exceed 1.50% of the total issued shares of the Company. From the total number of options offered under Plan 10, a maximum of 0.50% of the total issued shares may be offered every year, over three (3) years commencing in July 2019 and ending in June 2022. The proposed ESOP Plan is subject to the approval of the Colombo Stock Exchange and the shareholders of the Company at an Extraordinary General Meeting.
45. Lease commitments (Contd.)
Company Lessor Leased properties
Details of leases
Ceylon Cold Stores PLC. CISCO Speciality Packaging (Pvt) Ltd. Pet Bottle Plant
Ceylon Holiday Resorts Ltd. Sri Lanka Tourist Board Land occupied.
Hikkaduwa Holiday Resorts (Pvt) Ltd. Sri Lanka Tourist Board Land occupied.
Fantasea World Investment (Pte) Ltd. Government of Maldives Land occupied.
Habarana Lodge Ltd. Kekirawa Divisional Secretariat Land occupied.
Habarana Walk Inn Ltd. Kekirawa Divisional Secretariat Land occupied.
Jaykay Marketing Services (Pvt) Ltd. Land owners Land occupied.
John Keells Logistics (Pvt) Ltd. Sri Lanka Land Reclamation and Development Corporation Land occupied.
Keells Food Products PLC. Pannala Divisional Secretariat Land occupied.
The Colombo Ice Company (Pvt) Ltd. Board of Investment of Sri Lanka Land occupied.
Travel Club (Pte) Ltd. Government of Maldives and a sub lease with Ellaidhoo Investments (Pte) Ltd. Land occupied.
Tranquility (Pte) Ltd. Government of Maldives Land occupied.
Yala Village (Pvt) Ltd. Sri Lanka Tourist Board Land occupied.
Waterfront Properties (Pvt) Ltd. Board of Investment of Sri Lanka Land occupied.
Extent of lease hold land is given in the Group real estate portfolio in the Supplementary Information section of the Annual Report.
Damage to hotel propertyOn 21 April 2019, the Taprobane restaurant of Cinnamon Grand Colombo, the hotel owned by Asian Hotels and Properties PLC (AHPL), was damaged due to a terrorist bombing attack which was part of the series of attacks carried out in the country on Easter Sunday. AHPL, in consultation with the insurance experts, is in the process of assessing the full extent of the loss due to damage to the property and with regard to claims on business interruption. AHPL has already taken necessary steps to claim the insured loss arising from this incident. The hotel continued operations for in-house guests throughout the period and resumed most operations at restaurants on 30 April 2019.

303
FINANCIAL STATEMENTS
304 History of the John Keells Group | 305 Decade at a Glance | 306 Economic Value Statement | 308 Indicative US Dollar
Financial Statements | 310 Group Real Estate Portfolio | 312 Sri Lankan Economy | 314 Glossary | 315 Independent Assurance
Statement on Non-Financial Reporting | 318 Group Directory | 323 GRI Content Index | 331 Notice of Meeting
332 Corporate Information | 333 Proxy Form
SUPPLEMENTARY INFORMATION
EVOLVING
ENTERPRISES

304 JOHN KEELLS HOLDINGS PLC | ANNUAL REPORT 2018/19
HISTORY OF JOHN KEELLS GROUP
1870-19701870 – Two English brothers, George and Edwin John set up E. John & Co, a firm of produce and exchange brokers
1948 – The firm merged with two other London based tea brokers, thereby evolving into a private liability company by the name of E. John, Thompson, White & Company Ltd
1960 – Amalgamated with Keell and Waldock Ltd., another long established produce, share and freight broking company. The company changed its name to John Keell Thompson White Ltd
1971-19901973 – Walkers Tours and Travels (Ceylon) Ltd, a leading inbound tour operator, was acquired
1974 – The firm became a Rupee quoted public company with its name changed to John Keells Ltd
1986 – A newly incorporated John Keells Holdings (JKH) acquired a controlling stake in John Keells Limited and obtained a quotation on the Colombo Stock Exchange (CSE) amidst a heavily over-subscribed public share issue
1991-20001991 – Acquired the Whittalls Group of Companies, thus gaining control of Ceylon Cold Stores, Ceylon Holiday Resorts, and Union Assurance. The acquisition was one of the largest deals of the time
1994 – JKH became the first Sri Lankan company to obtain a listing overseas, by way of issuing Global Depository Receipts (GDRs) on the Luxembourg Stock Exchange
1996 – Velidhu Resort Hotel, an 80-roomed island resort in the Maldives, was acquired. This marked the Group’s first major overseas investment
1999 – Nations Trust Bank (NTB) was established, in a joint venture with the International Finance Corporation (IFC) and Central Finance Co. Ltd. The South Asia Gateway Terminal (SAGT) commenced operations to own, operate, and develop the Queen Elizabeth Quay at the Port of Colombo
2000 – JKH became the first Sri Lankan company to obtain the SL-AAA credit rating from Fitch Ratings. The firm was admitted as a full member of the World Economic Forum and was also rated among the best 300 small companies in the world by Forbes Global magazine
2001-20072003 – JKH acquired Asian Hotels and Properties, thereby gaining control of 40 per cent of the five-star room capacity in Colombo
2004 - John Keells Hotels Limited (KHL) was created as a holding company for all Group resorts. The Group’s CSR arm, the John Keells Social Responsibility Foundation was established as a non-profit organisation
2005 - The Group launched its hotel brands “Cinnamon Hotels and Resorts” and “Chaaya Hotels and Resorts”. JKH entered into a MoU to develop a third resort in the Maldives and also acquired 80 per cent of the Yala Village Hotel. Keells Plantations was sold off, marking the Group’s exit from the ownership of plantations
JKH also entered into the BPO space through a joint venture with Raman Roy Associates
2006 - The Group acquired a lease on Dhonveli Beach and Spa and Ellaidhoo Tourist Resort in the Maldives. The Group also increased its stake in SAGT by 8 per cent to 34 per cent. John Keells Holdings Ltd was renamed John Keells Holdings PLC
2007 - Cinnamon Island Alidhoo commenced operations. The Group signed a long-term funding arrangement amounting to USD 75 million with IFC
2008-20102008 - JKH acquired a further 8.4 per cent in SAGT and also increased stakes in UA, CCS, JKL and KFPL. The stake in AMW was divested
2009 - JKH’s market capitalisation surpassed USD 1 billion. The Trans Asia Hotel was re-branded and re-launched as Cinnamon Lakeside. The Group released its first standalone Sustainability Report, in full compliance with the Global Reporting Initiative (GRI-G3) framework
2010 - The head lease of Alidhoo Island was divested while the head lease of Dhonveli Island was acquired for a period of 18 years. Construction of “OnThree20”, a 475-unit apartment complex in the heart of Colombo commenced. Walkers Tours and Whittall Boustead became the only destination management companies to obtain both ISO 9001 and ISO 14001 certifications. Ceylon Cold Stores added “KIK” as its cola brand in its portfolio of soft drinks. JKH also acquired 5.6 Mn shares of Union Assurance PLC and increased its stake to 95.6 per cent
2011-20142011/12 - “The Emperor” apartment project at Crescat City, Colombo reached completion
2012/13: Cinnamon Bey, a 200 room five-star resort was launched. “K-Zone”, a 140,000 sq. ft. mall was opened in Ja-Ela, Colombo. Keells Food Products PLC and Union Assurance PLC successfully raised Rs. 1.2 billion and Rs. 720 million respectively, via rights issues
2013/14: The market capitalisation of JKH exceeded USD 2 billion for the first time in the Group’s history. The “Waterfront” integrated resort project was announced to the public. JKH was recognised as one of the top 15 great places to work in Sri Lanka through a survey conducted by the Great Place to Work Institute
2014/15: “Cinnamon red”, the first lean luxury hotel in Sri Lanka, was launched. The “OnThree20” residential development project was successfully completed. Union Assurance was segregated as per a regulatory directive, and the General Insurance segment was divested. JayKay Marketing Services (Private) Limited merged with Nexus Networks (Private) Limited, with JMSL being the surviving entity. Divested stakes in Expo Lanka Holdings PLC and Access Engineering PLC
2015 - Present2015/16: Waterfront Properties (Private) Limited raised the necessary debt funding for the “Cinnamon Life” project, by way of the largest syndicated debt facility obtained by a local firm. A controlling stake in Rajawella Holdings Ltd (RHL) was acquired for Rs. 1.04 billion. SAGT was ranked number one in South Asia and number four in the world for terminal productivity by the Journal of Commerce, USA. The Group raised Rs. 8 billion by converting 50 million warrants, “7th Sense” on Gregory’s Road, a high end, niche, residential development was completed
2016/17: “John Keells X: Open Innovation Challenge 2016” was launched, creating a unique platform for disruptive and innovative solutions. John Keells Research filed its first patent for a novel energy source material that was developed through a research project undertaken in collaboration with the National Metallurgical Lab of the Council for Scientific and Industrial Research (CSIR-NML) in India. The second residential tower of the “Cinnamon Life” project, “The Suites at Cinnamon Life”, comprising of 196 apartment units was launched. SAGT was awarded "The Best Terminal in South Asia" by the Singapore based Global Ports Forum
2017/18: The construction of the ice cream plant in Seethawaka neared completion. JMSL launched a new store format for its “Keells” supermarkets. NTB launched “FriMi”, the country’s first digital bank, enabling the opening of a bank account through a smart device. JKH launched Tri-Zen, an 891 apartment joint venture residential development

305
SUPPLEMENTARY INFORMATION
DECADE AT A GLANCE
31 MarchLKR Mn
2019 2018 2017 2016 2015 2014 2013 2012 2011 2010*
OPERATING RESULTSGroup revenue 135,456 121,215 106,273 93,710 91,852 86,706 85,408 75,924 60,500 47,980 EBIT 21,338 28,155 23,324 20,192 19,226 16,537 16,677 14,192 11,425 7,908 Finance cost (2,722) (521) (436) (994) (668) (1,217) (1,081) (1,416) (796) (1,370) Share of results of equity accounted
investees (net of tax) 4,727 3,596 3,303 2,781 2,778 3,089 3,440 2,809 2,641 2,556
Profit before tax 18,616 27,634 22,888 19,198 18,557 15,320 15,595 12,778 10,629 6,538 Tax expense (2,378) (4,515) (4,771) (3,406) (2,812) (2,362) (2,162) (1,827) (1,566) (986)Profit after tax 16,237 23,120 18,117 15,792 15,745 12,958 13,433 10,951 9,063 5,552
Attributable to:Equity holders of the parent 15,254 21,021 16,275 14,070 14,348 11,721 12,113 9,689 8,245 5,201 Non-controlling interests 983 2,099 1,842 1,722 1,397 1,237 1,320 1,262 818 351
16,237 23,120 18,117 15,792 15,745 12,958 13,433 10,951 9,063 5,552
CAPITAL EMPLOYEDStated capital 62,806 62,802 62,790 58,702 50,703 49,749 26,480 25,111 24,612 23,322 Other components of equity 58,646 49,852 38,652 28,715 24,501 21,845 20,635 13,226 9,560 7,574 Revenue reserves 82,834 87,266 77,193 67,565 62,594 51,304 42,704 33,001 25,415 18,936
204,286 199,920 178,635 154,982 137,798 122,898 89,819 71,338 59,587 49,832 Non-controlling interest 26,072 24,944 15,696 13,499 12,279 11,421 11,152 8,624 7,608 6,430 Total equity 230,358 224,864 194,331 168,481 150,077 134,319 100,971 79,962 67,195 56,262 Total debt 54,513 29,722 22,766 20,750 23,934 26,139 20,107 20,054 14,641 17,453
284,871 254,586 217,097 189,231 174,011 160,458 121,078 100,016 81,836 73,715
ASSETS EMPLOYEDProperty, plant and equipment (PP&E) 97,688 87,260 64,396 52,737 49,563 47,406 49,200 34,246 28,628 29,989 Non-current assets other than PP&E 170,687 136,427 107,912 93,376 78,030 71,969 59,787 52,397 47,436 34,104 Current assets 95,421 98,762 104,964 94,863 90,493 82,206 49,934 47,412 34,228 34,566 Liabilities net of debt (78,925) (67,862) (60,175) (51,745) (44,075) (41,123) (37,843) (34,039) (28,456) (24,944)
284,871 254,587 217,097 189,231 174,011 160,458 121,078 100,016 81,836 73,715
CASH FLOWSNet cash flows from 6,870 16,012 21,020 20,513 20,855 8,041 14,568 16,476 8,501 9,485 operating activities Net cash flows from / (used in) (10,579) (16,640) (17,670) (9,567) (1,255) (19,710) (16,199) (9,003) (4,469) (5,823) investing activities Net cash flows from / (used in) (11,000) (4,587) (4,105) (7,717) (4,838) 25,446 (1,320) 496 (6,791) (636) financing activitiesNet increase / (decrease) in (14,709) (5,215) (755) 3,229 14,762 13,777 (2,951) 7,969 (2,759) 3,026 cash and cash equivalents
KEY INDICATORSBasic earnings per share (Rs.) 11.13 15.20 11.9 10.5 12.6 10.5 10.7 9.5 8.2 5.2 Interest cover (no. of times) 7.8 54 52.8 51.5 27.7 13.6 15.4 10.0 14.4 5.8 Net assets per share** (Rs.) 155.0 151.7 135.5 117.6 104.5 93.2 68.1 54.1 45.2 37.8Enterprise value (EV) 210,020 187,926 136,022 124,182 155,675 124,182 203,615 166,143 175,672 109,548 EV / EBITDA 8.1 5.8 5.0 5.0 6.6 10.0 10.0 13.1 13.1 10.9 ROE (%) 7.5 11.1 9.8 9.6 11. 0 11.0 15.0 14.7 15.1 10.9 Debt / equity ratio (%) 23.7 13.2 11.7 12.3 15.9 19.5 19.9 25.0 21.8 31.0 Dividend payout (Rs. Mn) 8,186 8,325 7,280 8,038 3,476 3,267 2,982 2,314 1,844 1,883 Current ratio (no. of times) 1.7 3.0 3.7 4.0 2.6 2.4 2.0 2.0 1.8 2.1 Market price per share unadjusted (Rs.) 156.0 159.6 137.9 148.0 199.4 227.0 247.0 206.0 285.6 184.0 Market price per share diluted (Rs.) 156.0 159.6 137.9 129.5 192.7 173.8 238.2 152.6 34.6 66.0Revenue growth rate (%) 11.8 14.1 13.4 1.6 5.9 4.1 9.7 25.5 26.1 17.0USD closing rate (Rs.) 175.5 155.9 151.9 147.7 133.5 130.7 126.8 128.1 110.4 114.0USD average rate (Rs.) 168.6 153.6 148.0 139.2 131.2 130.1 129.9 112.6 112.1 115.0
* Figures are derived from financial statements prepared in accordance with previous SLASs. The figures for the subsequent years are derived from financial statements prepared in accordance with SLFRS/LKAS.
** Net assets per share has been calculated, for all periods, based on the net assets of the Group and number of shares in issue as at 31 March 2019.
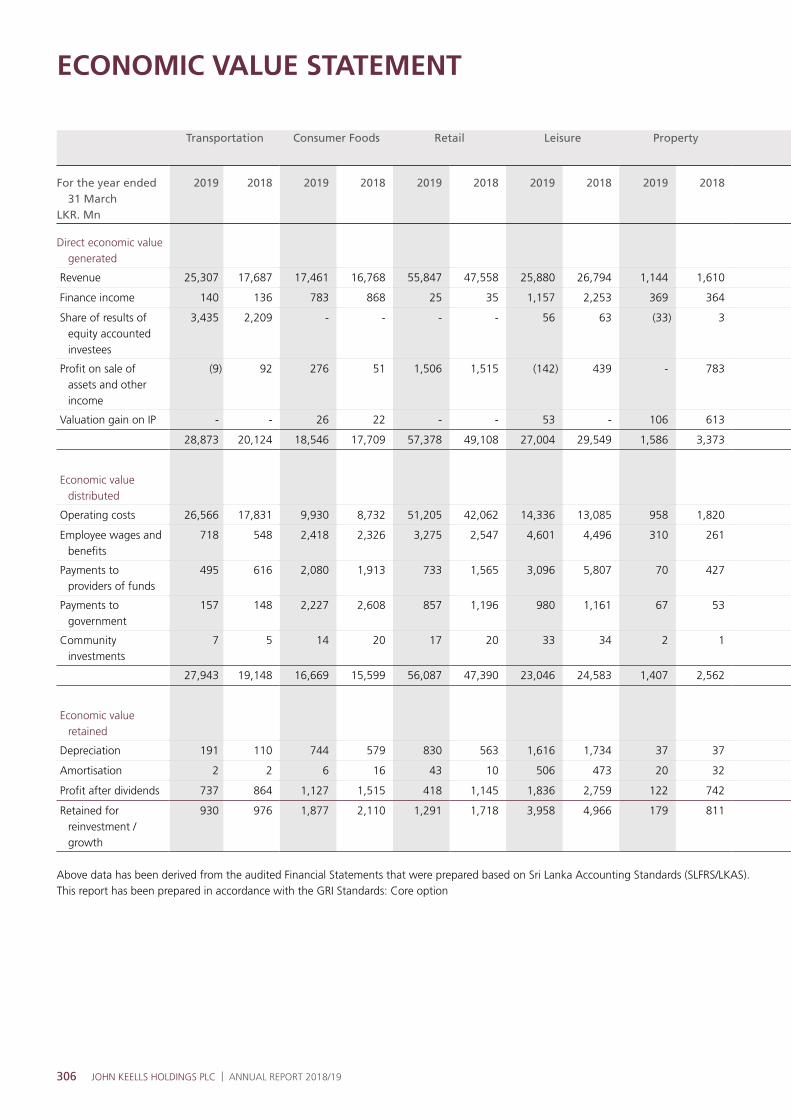
306 JOHN KEELLS HOLDINGS PLC | ANNUAL REPORT 2018/19
ECONOMIC VALUE STATEMENT
Transportation Consumer Foods Retail Leisure Property
For the year ended 31 March
LKR. Mn
2019 2018 2019 2018 2019 2018 2019 2018 2019 2018
Direct economic value generated
Revenue 25,307 17,687 17,461 16,768 55,847 47,558 25,880 26,794 1,144 1,610
Finance income 140 136 783 868 25 35 1,157 2,253 369 364
Share of results of equity accounted investees
3,435 2,209 - - - - 56 63 (33) 3
Profit on sale of assets and other income
(9) 92 276 51 1,506 1,515 (142) 439 - 783
Valuation gain on IP - - 26 22 - - 53 - 106 613
28,873 20,124 18,546 17,709 57,378 49,108 27,004 29,549 1,586 3,373
Economic value distributed
Operating costs 26,566 17,831 9,930 8,732 51,205 42,062 14,336 13,085 958 1,820
Employee wages and benefits
718 548 2,418 2,326 3,275 2,547 4,601 4,496 310 261
Payments to providers of funds
495 616 2,080 1,913 733 1,565 3,096 5,807 70 427
Payments to government
157 148 2,227 2,608 857 1,196 980 1,161 67 53
Community investments
7 5 14 20 17 20 33 34 2 1
27,943 19,148 16,669 15,599 56,087 47,390 23,046 24,583 1,407 2,562
Economic value retained
Depreciation 191 110 744 579 830 563 1,616 1,734 37 37
Amortisation 2 2 6 16 43 10 506 473 20 32
Profit after dividends 737 864 1,127 1,515 418 1,145 1,836 2,759 122 742
Retained for reinvestment / growth
930 976 1,877 2,110 1,291 1,718 3,958 4,966 179 811
Above data has been derived from the audited Financial Statements that were prepared based on Sri Lanka Accounting Standards (SLFRS/LKAS).This report has been prepared in accordance with the GRI Standards: Core option
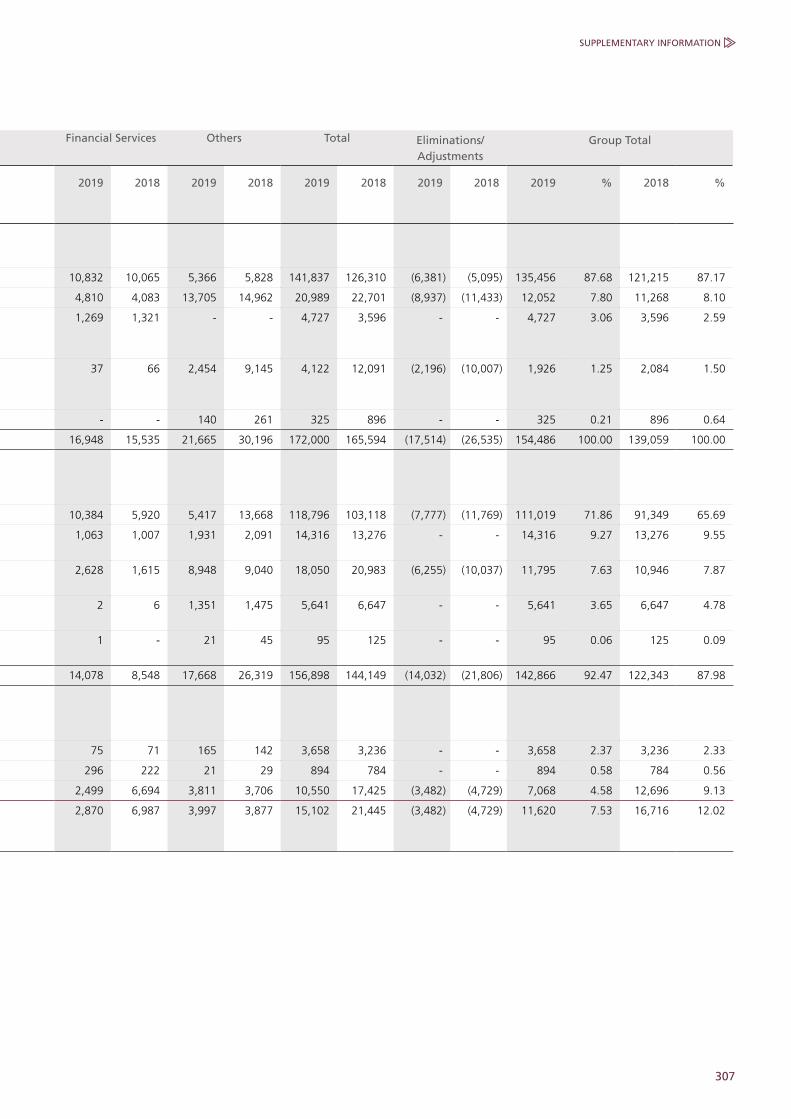
307
SUPPLEMENTARY INFORMATION
Financial Services Others Total Eliminations/Adjustments
Group Total
2019 2018 2019 2018 2019 2018 2019 2018 2019 % 2018 %
10,832 10,065 5,366 5,828 141,837 126,310 (6,381) (5,095) 135,456 87.68 121,215 87.17
4,810 4,083 13,705 14,962 20,989 22,701 (8,937) (11,433) 12,052 7.80 11,268 8.10
1,269 1,321 - - 4,727 3,596 - - 4,727 3.06 3,596 2.59
37 66 2,454 9,145 4,122 12,091 (2,196) (10,007) 1,926 1.25 2,084 1.50
- - 140 261 325 896 - - 325 0.21 896 0.64
16,948 15,535 21,665 30,196 172,000 165,594 (17,514) (26,535) 154,486 100.00 139,059 100.00
10,384 5,920 5,417 13,668 118,796 103,118 (7,777) (11,769) 111,019 71.86 91,349 65.69
1,063 1,007 1,931 2,091 14,316 13,276 - - 14,316 9.27 13,276 9.55
2,628 1,615 8,948 9,040 18,050 20,983 (6,255) (10,037) 11,795 7.63 10,946 7.87
2 6 1,351 1,475 5,641 6,647 - - 5,641 3.65 6,647 4.78
1 - 21 45 95 125 - - 95 0.06 125 0.09
14,078 8,548 17,668 26,319 156,898 144,149 (14,032) (21,806) 142,866 92.47 122,343 87.98
75 71 165 142 3,658 3,236 - - 3,658 2.37 3,236 2.33
296 222 21 29 894 784 - - 894 0.58 784 0.56
2,499 6,694 3,811 3,706 10,550 17,425 (3,482) (4,729) 7,068 4.58 12,696 9.13
2,870 6,987 3,997 3,877 15,102 21,445 (3,482) (4,729) 11,620 7.53 16,716 12.02

308 JOHN KEELLS HOLDINGS PLC | ANNUAL REPORT 2018/19
INDICATIVE US DOLLAR FINANCIAL STATEMENTS
Income Statementfor information purposes only
GROUP COMPANY
For the year ended 31 MarchIn USD ’000s
2019 2018 2019 2018
Continuing operations
Revenue from contracts with customers 711,422 525,817 9,813 8,645
Revenue from Insurance contracts 60,628 251,701 - -
Total Revenue 772,050 777,518 9,813 8,645
Cost of sales (613,672) (589,688) (4,784) (4,056)
Gross profit 158,378 187,830 5,029 4,589
Dividend income - - 40,964 55,002
Other operating income 10,976 13,368 1,521 52,682
Selling and distribution expenses (33,852) (27,112) - -
Administrative expenses (70,739) (80,103) (7,201) (7,278)
Other operating expenses (21,120) (20,463) (561) (468)
Results from operating activities 43,643 73,520 39,752 104,527
Finance cost (15,516) (3,341) (1,052) (462)
Finance income 68,690 72,278 36,200 40,359
Change in insurance contract liabilities (19,509) (15,711) - -
Change in contract liability due to transfer of one of surplus - 21,693 - -
Change in fair value of investment property 1,850 5,750 - -
Share of results of equity accounted investees (net of tax) 26,944 23,069 - -
Profit before tax 106,102 177,258 74,900 144,424
Tax expense (13,554) (28,958) (6,492) (8,297)
Profit for the year 92,548 148,300 68,408 136,127
Attributable to:
Equity holders of the parent 86,944 134,838
Non-controlling interests 5,604 13,462
92,548 148,300
Earnings per share
Basic 0.06 0.10
Diluted 0.06 0.10
Dividend per share 0.03 0.04
This information does not constitute a full set of financial statements in compliance with SLFRS/LKAS. The above should be read together with the Auditors’ opinion and the notes to the financial statements. The exchange rate prevailing at year end, which was USD/LKR. 175.45 (2018 - 155.90), has been used to convert the income statement.

309
SUPPLEMENTARY INFORMATION
Statement of Financial Position for information purposes only
GROUP COMPANY
As at 31 MarchIn USD ’000s
2019 2018 2019 2018
ASSETSNon-current assetsProperty, plant and equipment 556,788 559,717 915 820 Lease rentals paid in advance 82,148 83,418 - - Investment property 79,711 79,712 - - Intangible assets 19,411 12,894 534 285 Investments in subsidiaries - - 440,273 435,971 Investments in equity accounted investees 143,455 143,267 58,629 65,206 Non-current financial assets 200,549 210,893 1,603 1,713 Deferred tax assets 7,142 1,100 - - Other non-current assets 440,438 343,806 155 133
1,529,642 1,434,807 502,109 504,128
Current assetsInventories 54,414 42,909 - - Trade and other receivables 82,194 78,726 605 454 Amounts due from related parties 1,286 896 1,033 2,594 Other current assets 31,437 28,161 447 1,276 Short term investments 300,693 412,996 237,075 315,314 Cash in hand and at bank 73,327 69,807 20,350 3,185
543,351 633,495 259,510 322,823 Total assets 2,072,993 2,068,302 761,619 826,951
EQUITY AND LIABILITIESEquity attributable to equity holders of the parentStated capital 357,974 402,837 357,974 402,837 Revenue reserves 473,977 559,753 316,889 403,346 Other components of equity 332,408 319,771 13,681 12,520
1,164,359 1,282,361 688,544 818,703 Non-controlling interest 148,600 160,003 - -
Total equity 1,312,959 1,442,364 688,544 818,703
Non-current liabilitiesInsurance contract liabilities 187,136 193,910 - - Interest-bearing loans and borrowings 121,268 118,801 3,188 - Deferred tax liabilities 44,210 45,473 - - Employee benefit liabilities 11,888 12,645 895 1,339 Other non-current liabilities 67,990 44,232 - -
432,492 415,061 4,083 1,339
Current liabilitiesTrade and other payables 112,538 103,127 1,977 2,131 Amounts due to related parties 527 33 71 34 Income tax liabilities 8,577 13,334 1,286 4,308 Short term borrowings 56,830 20,067 22,799 - Interest-bearing loans and borrowings 18,265 13,229 1,673 - Other current liabilities 16,978 22,535 32 34 Bank overdrafts 113,827 38,552 41,154 402
327,542 210,877 68,992 6,909 Total equity and liabilities 2,072,993 2,068,302 761,619 826,951
This information does not constitute a full set of financial statements in compliance with SLFRS/LKAS. The above should be read together with the Auditors’ opinion and the notes to the financial statements. The exchange rate prevailing at year end, which was USD/LKR. 175.45 (2018 - 155.90), has been used to convert the statement of financial position.

310 JOHN KEELLS HOLDINGS PLC | ANNUAL REPORT 2018/19
GROUP REAL ESTATE PORTFOLIO
Land in acres Net book value
Owning company and location Number of Buildings
Buildingsin (sq. ft.)
Freehold Leasehold 2019LKR ‘000s
2018LKR ‘000s
PROPERTIES IN COLOMBOJohn Keells PLC. 56/1, 58, 58 1/1 Kirulapone Avenue, Colombo 5. - - 0.08 - 1,249 1,249 Keells Realtors Ltd. 427 & 429, Ferguson Road, Colombo 15. 2 27,750 1.22 - 400,282 348,870 Mackinnon Keells Ltd. Leyden Bastian Road, York Street, Colombo 01. 1 31,656 0.45 - 673,193 606,608 Union Assurance PLC. No 20, St. Michaels' Road, Colombo 03. 1 57,916 0.58 - 1,595,122 1,600,000 Vauxhall Developments (Private) Limited No.199 ,Union Place, Colombo 2 and 148,
Vauxhall Street, Colombo 2. 7 209,484 6.62 - 8,390,057 8,400,876 No.188, 188/1, 188/2, 190, 192 Vauxhall
Street, Colombo 2 and 42, Dawson Street, Colombo 2 - - 2.09 - 5,008,850 5,015,309
No. 186, 186/3 Vauxhall Street, Colombo 2 3.73 8,333,254 8,344,000 Glennie Properties (Pvt) Ltd.
No.82, Glennie Street, Colombo 02. - - 0.08 - 169,680 - John Keells Property Developments
No. 12, 12/1, 12/2, 12/2A, 12/3, Tickell Road, Borella - - 0.62 - 1,087,680 -
11 326,806 15.47 - 25,659,367 24,316,912
PROPERTIES OUTSIDE COLOMBOCeylon Cold Stores PLC. Kaduwela. 21 313,024 27.35 - 1,438,357 1,348,994 Trincomalee. 3 19,071 1.06 - 254,035 228,601 Facets (Pvt) Ltd.
Ahungalla. - 6.31 - 438,800 428,700 J K Thudella Properties (Pvt) Ltd. Thudella, Ja-Ela. 10 64,670 17.77 - 458,737 557,611 John Keells Logistics (Pvt) Ltd.
Muthurajawela. - - - 9.23 582,176 - John Keells PLC.
17/1, Temple Road, Ekala, Ja-Ela. - - 3.77 - 362,350 286,850 John Keells Properties Ja-Ela (Pvt) Ltd
No 525, Colombo Road, Kapuwatta, Ja-Ela. 1 144,631 6.60 - 1,911,978 1,872,500 John Keells Warehousing (Pvt) Ltd.
Muthurajawela. 3 126,743 - 6.00 346,110 345,846 Keells Food Products PLC. 41, Temple Road, Ekala, Ja-Ela. 6 51,768 3.00 1.00 321,094 278,036 Gonawala, Pannala 4 32,454 - 4.08 244,592 211,793 Rajawella Holdings Ltd.
Mahaberiatenna, Kandy. 4 59,032 - 517.09 2,008,621 2,003,013 Tea Smallholder Factories PLC. Broadlands. 8 56,478 4.14 - 73,452 69,000 Halwitigala. 7 48,747 9.61 - 65,535 62,500 Hingalgoda. 12 63,676 17.00 - 89,424 86,000 Karawita. 8 80,364 - 4.98 121,366 116,069 Kurupanawa. 7 51,410 11.80 - 76,504 76,500 Neluwa. 13 48,888 5.27 - 72,268 70,000 New Panawenna. 7 44,568 10.59 - 55,693 51,000 Pasgoda. 7 40,091 - 7.24 75,000 58,911 Peliyagoda. 2 31,629 - 0.98 387,679 349,000

311
SUPPLEMENTARY INFORMATION
Land in acres Net book value
Owning company and location Number of Buildings
Buildingsin (sq. ft.)
Freehold Leasehold 2019LKR ‘000s
2018LKR ‘000s
PROPERTIES OUTSIDE COLOMBOThe Colombo Ice Company (Pvt) Ltd. Avissawella 4 151,954 - 9.30 1,588,136 146,263 Union Assurance PLC. No 06,Rajapihilla Road, Kurunegala. 1 27,904 0.20 - 268,688 270,209 Whittall Boustead Ltd. 150, Badulla Road, Nuwara Eliya. 1 4,343 0.46 - 159,586 134,500
129 1,461,445 124.93 559.90 11,400,181 9,051,896
HOTEL PROPERTIESAsian Hotels and Properties PLC. Cinnamon Grand Premises, Colombo 2. 4 648,793 8.03 - 28,277,278 26,973,981 Crescat Boulevard, Colombo 2. 1 145,196 - - 2,597,398 2,621,000 Ahungalla Holiday Resort (Pvt) Ltd. Ahungalla - - 6.51 - 289,900 279,600 Beruwala Holiday Resorts (Pvt) Ltd. Cinnamon Bey, Beruwala. 5 460,515 11.39 - 3,842,677 3,650,025 Ceylon Holiday Resorts Ltd. Bentota Beach by Cinnamon 8 309,479 2.32 11.02 204,540 181,295 Fantasea World Investments (Pte) Ltd. Cinnamon Hakuraa Huraa, Maldives. 12 150,412 - 18.90 1,081,068 1,166,697 Habarana Lodge Ltd. Cinnamon Lodge, Habarana. 79 202,999 - 25.48 769,883 743,800 Habarana Walk Inn Ltd. Habarana Village by Cinnamon 84 121,767 - 9.34 323,079 320,921 Hikkaduwa Holiday Resort (Pvt) Ltd. Hikka Tranz by Cinnamon 5 233,965 0.29 4.36 1,206,458 1,211,391 Kandy Walk Inn Ltd. Cinnamon Citadel, Kandy. 6 173,900 6.57 - 1,671,011 1,616,915 Nuwara Eliya Holiday Resort (Pvt) Ltd Nuwara Eliya. - - 2.66 - 272,640 313,900 Resort Hotels Ltd. Medway Estate, Nilaveli. 1 4,485 41.73 - 892,180 867,900 Trans Asia Hotels PLC. Cinnamon Lake Side, Colombo 2. 2 448,791 - 7.65 6,114,352 6,021,627 Tranquility (Pte) Ltd. Cinnamon Dhonveli, Maldives. 144 246,358 - 17.16 10,751,188 9,978,261 Travel Club (Pte) Ltd. Ellaidhoo Maldives by Cinnamon 114 170,877 - 13.75 2,244,430 1,759,032 Trinco Holiday Resorts (Pvt) Ltd. Trinco Blu by Cinnamon 9 120,910 13.24 - 1,234,024 1,129,389 Trinco Walk Inn Ltd. Club Oceanic, Trincomalee. - - 14.64 - 282,082 265,514 Wirawila Walk Inn Ltd. Randunukelle Estate, Wirawila. - - 25.15 - 88,128 86,880 Yala Village (Pvt) Ltd. Cinnamon Wild, Yala. 76 113,509 - 11.25 488,207 496,638
550 3,551,956 132.53 118.91 62,630,523 59,684,766
Improvements to Keells outlets on leased hold properties 97 1,059,038 - 71.13 4,656,689 3,119,855
Consolidated value of land and buildings, lease rentals paid in advance and investment property 787 6,399,245 272.93 749.94 104,346,760 96,173,429

312 JOHN KEELLS HOLDINGS PLC | ANNUAL REPORT 2018/19
SRI LANKAN ECONOMY
Summary Indicator Units 2009 2010 2011 2012 2013 2014 2015 2016 2017 2018GDP growth (2010 base) Per cent 8.4 9.1 3.4 5.0 5.0 4.5 3.4 3.2
GDP growth (2002 base) Per cent 3.5 8.0 8.2 6.3 7.2 7.4 5.7
GDP (current prices: 2010 base) Rs. billion 6,414 7,219 8,732 9,592 10,361 10,951 11,996 13,418 14450
GDP (current prices: 2002 base) Rs. billion 4,835 5,604 6,543 7,579 8,674 9,785 10,660
GDP (current prices: 2010 base) USD billion 56.7 65.3 68.4 74.3 79.4 80.6 82.4 88.0 88.9
GDP (current prices: 2002 base) USD billion 42.1 49.6 59.2 59.4 67.2 74.9 78.4
GDP per capita (USD) growth : 2010 base Per cent 14.0% 7.1% 7.7% 5.9% 0.5% 1.1% 5.6% 0.0%
GDP per capita (USD) growth : 2002 base Per cent 2.1% 16.7% 18.3% 3% 12% 11% 8%
GDP per capita (market prices: 2010 base) Rs 000 310 346 428 466 499 522 566 626 667
GDP per capita (market prices: 2002 base) Rs 000 236 271 314 371 422 471 508
GDP per capita (market prices: 2010 base) USD 2,744 3,129 3,351 3,609 3,821 3,842 3,886 4104 4102
GDP per capita (market prices: 2002 base) USD 2,057 2,400 2836 2,908 3,265 3,608 3894
Inflation (CCPI 2013=100) annual average Per cent 2.2 4 6.6 4.3
Inflation (CCPI 2006/07=100) annual average Per cent 3.5 6.2 6.7 7.6 6.9 3.3 0.9 3.7
Inflation (NCPI 2013=100) annual average Per cent 3.8 4 7.7 2.1
Current account balance USD billion -0.2 -1.1 -4.6 -4.0 -2.5 -2.0 -1.9 -1.7 -2.3 -2.8
Current account % of GDP* Per cent -0.5 -1.9 7.1 -5.8 -3.4 -2.5 -2.3 -2.1 -2.6 -3.2
Population Million 20.5 20.7 20.9 20.4 20.6 20.8 21.0 21.2 21.4 21.7
Exchange rate (annual average) Rs/USD 114.9 113.1 110.6 127.6 129.1 130.6 135.9 145.6 152.5 162.5
Exchange rate change (annual average) Per cent 6.1 -1.6 -2.2 15.4 1.2 1.1 4.1 7.1 4.7 6.6
12m T-Bill yield (year-end) Per cent 9.3 7.6 9.3 11.7 8.3 6.0 7.3 10.2 8.9 11.2
Prime lending rate (year-end) Per cent 10.9 9.3 10.8 14.4 10.1 6.3 7.5 11.5 11.6 12.1
M2b money supply growth Per cent 18.6 15.8 19.1 17.6 16.7 13.4 17.8 18.4 16.7 13.0
Exports USD billion 7.1 8.6 10.6 9.8 10.4 11.1 10.5 10.3 11.4 11.9
Imports USD billion 10.2 13.5 20.3 19.2 18.0 19.4 18.9 19.2 21.0 22.2
Balance of payments* Per cent of GDP 6.5 1.6 -1.6 0.2 1.3 1.7 -1.8 -0.6 2.3 1.2
Budget deficit* Per cent of GDP -9.9 -7.0 -6.2 -5.6 -5.4 -5.7 -7.6 -5.3 -5.5 -5.3
Unemployment rate Per cent 5.8 4.9 4.2 4.0 4.4 4.3 4.7 4.4 4.2 4.4
All share index (year-end) Points 3386 6636 6074 5643 5913 7299 6895 6228 6369 6052.4
Tourist arrivals No.' 000 447.9 654.5 856.0 1,006 1275 1527 1,798 2,051 2,116 2,334
* Uses rebased GDP (2010 base) from 2010 onwards
The Sri Lankan economy continued its moderate growth trajectory in 2018, recording a 3.2 per cent YoY growth in real Gross Domestic Product (GDP), against 3.4 per cent recorded in 2017. While a recovery was seen in agricultural activities due to favourable weather conditions, a contraction in the industrial sector - mainly due to a decline in construction activities - led to the slowdown in economic growth. As such, the Agriculture and Services sub-sectors recorded growth rates of 4.8 per cent and 4.7 per cent respectively, while the Industrial sector recorded a modest growth of 0.9 per cent.
The Agricultural sector bounced back in 2018 driven by favourable weather conditions which led to a substantial increase in the contribution to GDP from the growing of rice, fruits, oleaginous fruits (coconut, king coconut, oil palm) and spices during the year. Conversely, the contribution of tea production towards GDP saw a decline of 0.8 per cent, due to unfavourable weather conditions during May and June 2018. The industry also faced adverse wage related trade union actions, which disrupted tea production. Rubber production also saw a decline owing to high cost of production and
poor management of plantations, resulting in an overall decline of 0.6 per cent.
Industrial sector growth was significantly lower than the 4.1 per cent growth reported in the previous year. This slowdown was mainly due to the contraction in construction and mining activities, which accounted for a significant share of 35.1 per cent of Industrial activities.
The Service sector, the most significant component of GDP, registered a growth of 4.7 per cent YoY in 2018, significantly higher than the 3.6 per cent growth in 2017. This growth in Services activities was primarily driven by the robust growth in financial services (YoY growth of 8.2 per cent) and was further supported by the continuous expansion observed in wholesale and retail trade activities (YoY growth of 4.0 per cent).
Headline inflation, as measured by the YoY change of the Colombo Consumers Price Index (CCPI), remained largely within the band of 4.0 per cent - 6.0 per cent during the first nine months of the year and declined to levels below 4.0 per cent thereafter. As such, headline inflation reached an annual average
of 4.3 per cent in 2018, significantly lower than the inflation of 6.6 per cent recorded in 2017. This drop in the inflation rate was driven primarily by favourable weather which resulted in relatively steady food prices. Implementation of the fuel pricing mechanism amidst fairly favourable global oil prices also aided in keeping overall inflation subdued throughout the year, despite a sharp depreciation seen in the value of the Rupee in 2018.
The Central Bank of Sri Lanka (CBSL) signalled an end to its tight monetary policy stance in April 2018. Accordingly, considering the favourable developments in inflation and the sub-par performance of the economy, the CBSL reduced the Standing Lending Facility Rate (SLFR) by 25 basis points to 8.50 per cent. Thereafter, a neutral policy stance was maintained considering the impacts on the external sector due to key global developments and the continued monetary policy normalisation in the United States. However, a large and persistent liquidity deficit in the money market necessitated the CBSL to inject liquidity by reducing the Statutory Reserve Ratio (SRR) applicable on all Rupee deposit liabilities of commercial

313
SUPPLEMENTARY INFORMATION
banks by 150 basis points in mid-November 2018. Further, the Standing Deposit Facility Rate (SDFR) was increased by 75 basis points and the SLFR by 50 basis points in order to maintain the CBSL’s neutral policy stance. The SRR was reduced by a further 100 basis points in March 2019 in response to the continued high liquidity deficit in the market.
In line with the moderation of overall economic growth, domestic consumption demand in real terms recorded a YoY growth of 1.6 per cent in 2018 [2017: 1.8 per cent]. This moderation can be attributed to the tighter fiscal policies implemented within the year. Meanwhile, investment expenditure grew by 6.6 per cent YoY in real terms [2017: 8.2 per cent].
Growth in aggregate domestic and national savings slowed down further in 2018, to 5.6 per cent and 4.5 per cent YoY respectively. This is partly attributed to a slower growth in private savings and an increase in Government dis-savings during the year. Meanwhile, due to the relatively higher growth in investment spending, the national savings-investment gap broadened to 3.1 per cent of GDP in 2018 [2017: 2.6 per cent].
Key market interest rates saw a slight increase during the year with the Average Weighted Prime Lending Rate (AWPLR) rising by 31 basis points to 11.94 per cent by end-2018 from 11.33 per cent by end-2017. The Average Weighted Deposit Rate (AWDR) also saw a reduction of 26 basis points to 8.81 per cent by end-2018.
Broad money supply moderated in the year 2018, largely due to the decline of Net Foreign Assets (NFA) of the banking system. The growth of the broad money supply decelerated to 13.0 per cent in 2018 in comparison to the 16.7 per cent growth in 2017. Meanwhile, credit to the private sector saw an absolute increase of Rs. 762.1 billion, relatively larger than the Rs. 613.4 billion rise in the previous year. Net credit to the Government saw an increase of 16.0 per cent, while credit to public corporations showed a significant increase of 40.7 per cent, reflecting the increased reliance on bank financing by most State Owned Business Enterprises (SOBEs). It should be noted that Ceylon Petroleum Corporation (CPC) and Ceylon Electricity Board (CEB) accounted for approximately 72 per cent of the overall expansion.
On the external front, Sri Lanka’s trade deficit widened considerably during 2018, with the balance of payments recording a deficit of USD 1.1 billion from the USD 2.1 billion surplus recorded in the previous year. The current account deficit expanded to 3.2 per cent of GDP in 2018 while the trade deficit expanded to USD 10.3 billion [2017: USD 9.6 billion]. Earnings from exports which rebounded strongly in 2017, continued to
maintain its growth momentum in 2018, growing by 4.7 per cent, to reach USD 11.9 billion by end-2018. This was largely supported by the restoration of the GSP+ facility and conducive external trade policies. Exports of seafood and petroleum products were the main contributors to export growth, recording increases of 10.5 per cent and 43.2 per cent YoY respectively.
Meanwhile, overall import expenditure expanded by 6.0 per cent YoY in 2018 recording the highest ever import bill of USD 22.2 billion. This was induced by higher fuel, personal vehicle and gold imports and led to an offsetting of the improvement in the export performance. A 9.2 per cent growth in expenditure on Intermediate goods contributed to the overall increase in imports, driven by the substantial increase in fuel imports by 21.1 per cent YoY. This growth was mainly due to the significant increase in average import prices of both refined petroleum products and crude oil, as well as a moderate growth of import volumes of these items.
Expenditure on consumer goods increased by 10.6 per cent, however, import expenditure on food and beverages declined by 12.8 per cent due to the reduction in import volumes of rice. Expenditure on non-food consumer goods increased significantly due to the increased demand for personal vehicles, which recorded a growth of 116.3 per cent during the first 8 months of the year. This was due to the revision of taxes in the 2018 Budget. Accordingly, import expenditure on non-food consumer goods increased substantially by 26.8 per cent YoY. However, towards the latter part of the year, the Government tightened its external policy stance and introduced measures to reduce vehicle and gold imports to mitigate the adverse impacts of growing import demand.
A significant improvement in tourism earnings was observed in 2018 with tourist arrivals increasing 10.3 per cent, to record the highest annual tourist arrivals during a year. As a result, the earnings from tourism grew by 11.6 per cent, to record an absolute increase of USD 456 million compared to the previous year’s USD 407 million. Workers’ remittances continued to moderate in 2018, owing to geopolitical uncertainties in the Middle Eastern region along with a shift in labour migration patterns. As a result, workers’ remittances reduced by 2.1 per cent and stood at USD 7 billion as at end-2018.
The Rupee depreciated by a sharp 19 per cent against the US dollar in 2018 compared to a 2.0 per cent depreciation recorded the previous year. The policy rate hikes of the US Federal Reserve resulted in significant outflows from the Rupee denominated Government securities market, leading to a net outflow of USD 990 million in 2018. Downward pressure
on the Rupee was exacerbated by the political uncertainty faced during the last quarter of the year, which also resulted in a sovereign credit downgrading by major rating agencies and a temporary pause of the IMF Extended Fund Facility programme. The programme was subsequently revived in early 2019. These developments, couple with weak investor sentiment contributed to significant outflows being recorded at the Colombo Stock Exchange (CSE).
Foreign Direct Investments recorded an all-time high of USD 2.1 billion in 2018, a notable increase of 11.8 per cent from the USD 1.9 billion in 2017. FDI inflows in 2018 were mainly received by the Hambantota International Port Group (Private) Limited. The remainder was channelled largely to projects related to ports, telecommunications, housing and property development and hotels, while FDI inflows to the manufacturing sector remained moderate.
Proceeds from two ISBs issued by the Government totalling USD 2.4 billion in April 2018 supplemented the build-up of gross official reserves to reach a record high level of USD 9.9 billion by end-April 2018.
However, external sector vulnerabilities required the CBSL to intervene in the currency market to prevent excessive depreciation, causing reserves to fall to USD 6.9 billion by end 2018.
Having reached a primary surplus in 2017 for the first time since 1992, the Government stayed on track to achieve the same feat in 2018, recording a primary surplus of Rs. 91.4 billion. The Government budget deficit also recorded a decline to 5.3 per cent of GDP in 2018, down from 5.5 per cent of GDP in 2017. However, the revenue-to-GDP ratio declined to 13.3 per cent in 2018 from 13.6 per cent in 2017 due to lower than expected tax revenue collections from key items such as a Value Added Taxes (VAT) and Excise duties. Recurrent expenditure increased marginally owing to higher interest payments. However, the effects of this were neutralised by the reduction of public investments. As such total Government expenditure and net lending as a percentage of GDP declined to 18.6 per cent in 2018 [2017: 19.2 per cent].
The Colombo Stock Exchange (CSE) witnessed net foreign outflows of USD 55 million in 2018, a significant drop when compared to the net inflows of USD 279 million in 2017. The All Share Price Index (ASPI) recorded a decline in 2018, falling by 5.0 per cent over the year, while market capitalisation also declined to Rs. 2.8 trillion in 2018 from Rs. 2.9 trillion in 2017. Meanwhile, the Government securities market recorded a net outflow of USD 990 million during the year, compared to a net inflow of USD 441 million in 2017.

314 JOHN KEELLS HOLDINGS PLC | ANNUAL REPORT 2018/19
GLOSSARY
ACCRUAL BASISRecording revenues and expenses in the period in which they are earned or incurred regardless of whether cash is received or disbursed in that period.
ASSET TURNOVERRevenue including equity accounted investees divided by average total assets.
BETACovariance between daily JKH share return and market return divided by variance of daily market return, over a 5 year period.
CAPITAL EMPLOYEDShareholders’ funds plus non-controlling interests and debt.
CAPITAL STRUCTURE LEVERAGE (CSL)Average total assets divided by average shareholders’ equity.
CASH EARNINGS PER SHAREProfit attributable to equity holders of the parent adjusted for non-cash items minus share of profits of equity accounted investees plus dividends from equity accounted investees divided by the weighted average number of ordinary shares in issue during the period
COMMON EARNINGS LEVERAGE (CEL)Profit attributable to equity holders of the parent divided by profit after tax.
CONTINGENT LIABILITIESA condition or situation existing as at the date of the Report due to past events, where the financial effect is not recognised because:
1. The obligation is crystallised by the occurrence or non-occurrence of one or more future events or,
2. A probable outflow of economic resources is not expected or,
3. It is unable to be measured with sufficient reliability
CURRENT RATIOCurrent assets divided by current liabilities.
DEBT/EQUITY RATIODebt as a percentage of shareholders’ funds and non-controlling interests.
DILUTED EARNINGS PER SHARE (EPS)Profit attributable to equity holders of the parent divided by the weighted average number of ordinary shares in issue during the period adjusted for options granted but not exercised and outstanding unexpired warrants.
DIVIDEND PAYABLEFinal dividend per share multiplied by the latest available total number of shares as at the date of the Report.
DIVIDEND PAYOUT RATIODividend paid as a percentage of Company profits adjusted for non-cash gains items.
DIVIDEND YIELDDividends adjusted for changes in number of shares in issue as a percentage of the share price (diluted) at the end of the period.
EARNINGS PER SHARE (BASIC)Profit attributable to equity holders of the parent divided by the weighted average number of ordinary shares in issue during the period.
EBITEarnings before interest expense and tax (includes other operating income). Note that EBIT includes interest income, fair value gains and losses on investment property, depreciation and amortization, and share of results of equity accounted investees.
EBITDAEarnings before interest expense, tax, depreciation and amortisation. Note that EBITDA includes interest income, fair value gains and losses on investment property and share of results of equity accounted investees.
EBIT MARGINEBIT divided by revenue inclusive of share of equity accounted investees.
EFFECTIVE RATE OF TAXATIONTax expense divided by profit before tax.
ENTERPRISE VALUE (EV)Market capitalisation plus net debt/(net cash).
INTEREST COVERConsolidated profit before interest and tax over interest expense.
LIABILITIES TO TANGIBLE NET WORTHTotal non-current and current liabilities including contingent liabilities divided by tangible net worth.
LONG TERM DEBT TO TOTAL DEBTLong term loans as a percentage of total debt.
MARKET CAPITALISATIONNumber of shares in issue at the end of the period multiplied by the market price at the end of the period.
NET ASSETSTotal assets minus current liabilities, long term liabilities, and non-controlling interests.
NET ASSETS PER SHARENet assets as at a particular financial year end divided by the number of shares in issue as at the current financial year end.
NET DEBT (CASH)Total debt minus cash plus short term deposits, excluding short term investments of the life fund of UA, restricted regulatory fund at UA and customer advances at the Property Development sector.
NET PROFIT MARGINProfit after tax attributable to equity holders of the parent divided by total revenue equity accounted investees.
PRICE EARNINGS RATIOMarket price per share (diluted) over diluted earnings per share.
PRICE TO BOOK RATIOMarket price per share (diluted) over net asset value per share.
PRICE TO CASH EARNINGSDiluted market price per share divided by diluted cash earnings per share.
PUBLIC HOLDINGPercentage of shares held by the public calculated as per the Colombo Stock Exchange Listing Rules as at the date of the Report.
QUICK RATIOCash plus short term investments plus receivables, divided by current liabilities.
RECURRING EBITDA/ RECURRING EBIT/RECURRING PAT/RECURRING PAT TO EQUITY HOLDERS OF THE PARENTProfit, as applicable, adjusted for the one-off impacts discussed under the Group Consolidated Review section of the Report: Page 36.
RETURN ON ASSETSProfit after tax divided by the average total assets.
RETURN ON CAPITAL EMPLOYED (ROCE)EBIT as a percentage of average capital employed.
RETURN ON EQUITY (ROE)Profit attributable to shareholders as a percentage of average shareholders’ funds.
SCOPE 1 AND SCOPE 2The GHG Protocol has established a classification of GHG emissions called ‘Scope’: Scope 1, Scope 2 and Scope 3. The GHG emissions standard published by the International Organization for Standardization (ISO), ‘ISO 14064’, represents these classifications of Scope with the following terms:
1. Direct GHG emissions = Scope I
2. Energy indirect GHG emissions = Scope 2
SHAREHOLDERS’ FUNDSTotal of stated capital, other components of equity and revenue reserves.
TANGIBLE NET WORTHTotal equity less intangible assets and deferred tax assets.
TOTAL DEBTLong term loans plus short term loans and overdrafts.
TOTAL EQUITYShareholders’ funds plus non-controlling interest.
WORKING CAPITALCurrent assets minus current liabilities.

315
SUPPLEMENTARY INFORMATION
INDEPENDENT ASSURANCE STATEMENT ON NON-FINANCIAL REPORTING
Scope and ApproachDNV GL represented by DNV GL Business Assurance Lanka (Private) Limited has been commissioned by the management of John Keells Holdings PLC (‘JKH’ or ‘the Company’, Company Registration Number PQ 14) to carry out an independent assurance engagement for the non-financial - qualitative and quantitative information, including sustainability performance, reported in JKH’s Annual Report 2018/19 (‘the Report’) in its printed format for the financial year ending 31st March 2019. The sustainability disclosures in this Report are prepared by JKH considering the key requirements of the International Integrated Reporting Council’s (IIRC’s) <IR> Framework and in accordance with the GRI Standards Core option of the Global Reporting Initiative (GRI) Sustainability Reporting Standards 2016 (‘GRI Standards’).
We performed our verification (Type 2, Moderate level) activities based on AccountAbility’s AA1000 Assurance Standard 2008 (AA1000 AS) with 2018 Addendum, DNV GL’s assurance methodology VeriSustainTM1, which is based on our professional experience, international assurance best practice including International Standard on Assurance Engagements 3000 (ISAE 3000) Revised* and GRI Guidelines. Our assurance engagement was planned and carried out in February 2019 – May 2019.
The intended user of this assurance statement is the Management of JKH. We disclaim any liability or responsibility to a third party for decisions, whether investment or otherwise, based on this Assurance Statement.
The reporting Topic Boundaries of sustainability performance are based on internal and external materiality assessment carried out by the Company and covers JKH’s operations in Sri Lanka
and Maldives. The Report does not include performance data and information related to the activities of non-operational entities, investment entities and companies holding only land, over which JKH does not exercise operational and management control. This is as set out in the Report in the section ‘Scope and Boundary’. The reported data on economic performance, and other financial data are based on audited financial statements issued by the Company’s statutory auditors.
We planned and performed our work to obtain the evidence we considered necessary to provide a basis for our assurance opinion and the process did not involve engagement with external stakeholders.
Responsibilities of the Management of JKH and of the Assurance ProvidersThe Management of JKH has the sole responsibility for the preparation of the Report as well as the processes for collecting, analysing and reporting the information presented in the Report. In performing this assurance work, DNV GL’s responsibility is to the Management; however, this statement represents our independent opinion and is intended to inform the outcome of the assurance to the stakeholders of the Company.
DNV GL provides a range of other services to JKH, none of which in our opinion, constitute a conflict of interest with this assurance work.
DNV GL’s assurance engagements are based on the assumption that the data and information provided by the client to us as part of our review have been provided in good faith. We were not involved in the preparation of any statements or data included in the Report except for this Assurance Statement. DNV GL expressly disclaims any liability or co-responsibility
for any decision a person or an entity may make based on this Assurance Statement.
Basis of our OpinionAs part of the assurance a multi-disciplinary team of sustainability and assurance specialists performed work at JKH’s Corporate Office, and we visited sample operations in Sri Lanka. We undertook the following activities:
• Review of JKH’s approach to stakeholder engagement and materiality determination process and the outcome as presented in this Report. We did not have any direct engagement with external stakeholders;
• Interviews with selected senior managers responsible for management of sustainability issues and review of selected evidence to support issues disclosed within the Report. We were free to choose interviewees and interviewed those with overall responsibility to deliver the Company’s sustainability objectives;
• Site visits to sample operations of the Group: (i) Hikka Tranz by Cinnamon at Hikkaduwa (Cinnamon Hotels and Resorts), (ii) Colombo Ice Company at Avissawella (Ceylon Cold Stores), and (iii) Keells, Kesbewa outlet at Colombo (JayKay Marketing Services) (iv) Tea Factory at Neluwa Medagama (Plantation Services) - to review processes and systems for preparing site level sustainability data and implementation of sustainability strategy. We were free to choose sites for conducting Assessments;
• Review of supporting evidence for key claims and data in the Report;
• Review of the processes for gathering and consolidating the specified performance data related to identified material topics and, for a sample, checking the data consolidation in context to the Principle of Completeness as per VeriSustain.
1 The VeriSustain protocol is available on www.dnvgl.com* Assurance Engagements other than Audits or Reviews of Historical Financial Information.
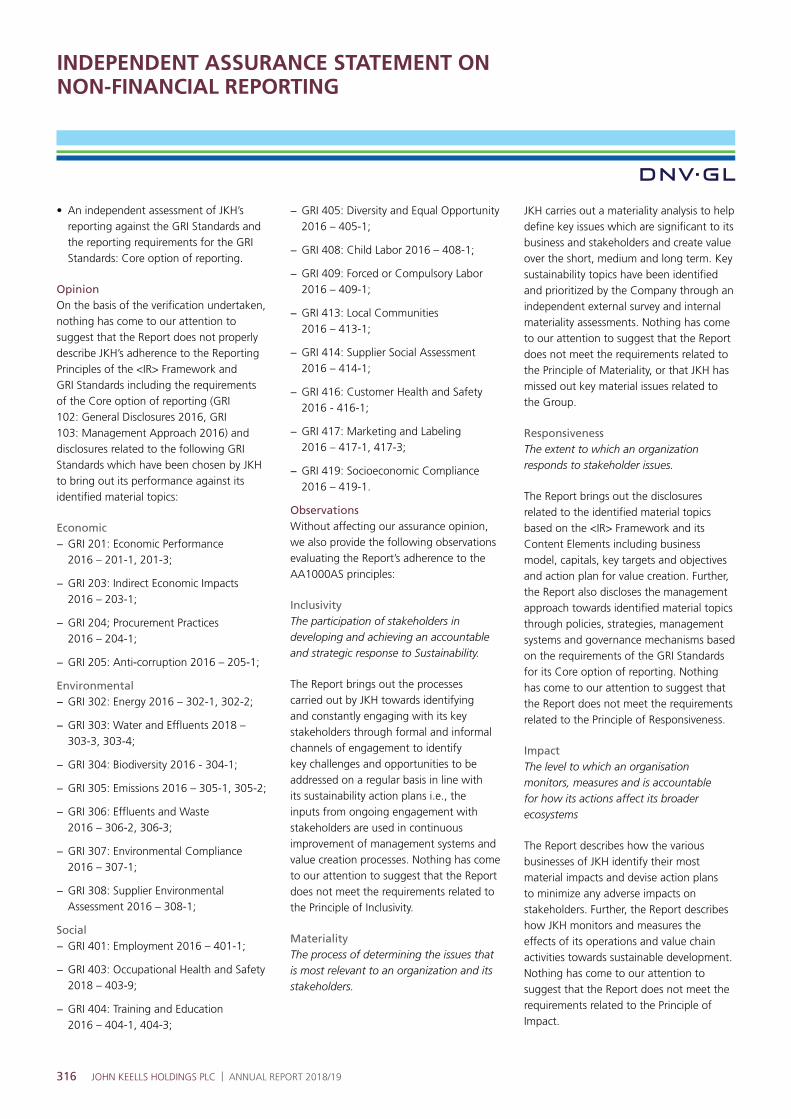
316 JOHN KEELLS HOLDINGS PLC | ANNUAL REPORT 2018/19
INDEPENDENT ASSURANCE STATEMENT ON NON-FINANCIAL REPORTING
• An independent assessment of JKH’s reporting against the GRI Standards and the reporting requirements for the GRI Standards: Core option of reporting.
OpinionOn the basis of the verification undertaken, nothing has come to our attention to suggest that the Report does not properly describe JKH’s adherence to the Reporting Principles of the <IR> Framework and GRI Standards including the requirements of the Core option of reporting (GRI 102: General Disclosures 2016, GRI 103: Management Approach 2016) and disclosures related to the following GRI Standards which have been chosen by JKH to bring out its performance against its identified material topics:
Economic− GRI 201: Economic Performance
2016 – 201-1, 201-3;
− GRI 203: Indirect Economic Impacts 2016 – 203-1;
− GRI 204; Procurement Practices 2016 – 204-1;
− GRI 205: Anti-corruption 2016 – 205-1;
Environmental− GRI 302: Energy 2016 – 302-1, 302-2;
− GRI 303: Water and Effluents 2018 – 303-3, 303-4;
− GRI 304: Biodiversity 2016 - 304-1;
− GRI 305: Emissions 2016 – 305-1, 305-2;
− GRI 306: Effluents and Waste 2016 – 306-2, 306-3;
− GRI 307: Environmental Compliance 2016 – 307-1;
− GRI 308: Supplier Environmental Assessment 2016 – 308-1;
Social− GRI 401: Employment 2016 – 401-1;
− GRI 403: Occupational Health and Safety 2018 – 403-9;
− GRI 404: Training and Education 2016 – 404-1, 404-3;
− GRI 405: Diversity and Equal Opportunity 2016 – 405-1;
− GRI 408: Child Labor 2016 – 408-1;
− GRI 409: Forced or Compulsory Labor 2016 – 409-1;
− GRI 413: Local Communities 2016 – 413-1;
− GRI 414: Supplier Social Assessment 2016 – 414-1;
− GRI 416: Customer Health and Safety 2016 - 416-1;
− GRI 417: Marketing and Labeling 2016 – 417-1, 417-3;
− GRI 419: Socioeconomic Compliance 2016 – 419-1.
ObservationsWithout affecting our assurance opinion, we also provide the following observations evaluating the Report’s adherence to the AA1000AS principles:
InclusivityThe participation of stakeholders in developing and achieving an accountable and strategic response to Sustainability.
The Report brings out the processes carried out by JKH towards identifying and constantly engaging with its key stakeholders through formal and informal channels of engagement to identify key challenges and opportunities to be addressed on a regular basis in line with its sustainability action plans i.e., the inputs from ongoing engagement with stakeholders are used in continuous improvement of management systems and value creation processes. Nothing has come to our attention to suggest that the Report does not meet the requirements related to the Principle of Inclusivity.
MaterialityThe process of determining the issues that is most relevant to an organization and its stakeholders.
JKH carries out a materiality analysis to help define key issues which are significant to its business and stakeholders and create value over the short, medium and long term. Key sustainability topics have been identified and prioritized by the Company through an independent external survey and internal materiality assessments. Nothing has come to our attention to suggest that the Report does not meet the requirements related to the Principle of Materiality, or that JKH has missed out key material issues related to the Group.
ResponsivenessThe extent to which an organization responds to stakeholder issues.
The Report brings out the disclosures related to the identified material topics based on the <IR> Framework and its Content Elements including business model, capitals, key targets and objectives and action plan for value creation. Further, the Report also discloses the management approach towards identified material topics through policies, strategies, management systems and governance mechanisms based on the requirements of the GRI Standards for its Core option of reporting. Nothing has come to our attention to suggest that the Report does not meet the requirements related to the Principle of Responsiveness.
Impact The level to which an organisation monitors, measures and is accountable for how its actions affect its broader ecosystems
The Report describes how the various businesses of JKH identify their most material impacts and devise action plans to minimize any adverse impacts on stakeholders. Further, the Report describes how JKH monitors and measures the effects of its operations and value chain activities towards sustainable development. Nothing has come to our attention to suggest that the Report does not meet the requirements related to the Principle of Impact.

317
SUPPLEMENTARY INFORMATION
Specific Evaluation of the Information on Sustainability PerformanceWe consider the methodology and the process for gathering information developed by JKH for its sustainability performance reporting to be appropriate, and the qualitative and quantitative data included in the Report was found to be identifiable and traceable; the personnel responsible were able to demonstrate the origin and interpretation of the data and its reliability. Nothing has come to our attention that the information provided to us was inconsistent, inaccurate and unreliable, or that the Report is not a faithful description of JKH’s reported sustainability activities for the reporting period.
ReliabilityThe accuracy and comparability of information presented in the report, as well as the quality of underlying data management systems.
The majority of data and information verified at Corporate Office and at sampled sites visited were found to be fairly accurate and reliable. Some of the data inaccuracies identified during the verification process were found to be attributable to transcription, interpretation and aggregation errors and the errors have been corrected. JKH uses a software to capture and analyze data related to its sustainability performance on its material topics from all sites of operations on a quarterly basis. Nothing has come to our attention to suggest that the Report does not meet the requirements related to the Principle of Reliability.
Additional principles as per DNV GL VeriSustainCompletenessHow much of all the information that has been identified as material to the organisation and its stakeholders is reported?
The Report brings out the key requirements of the <IR> framework and GRI Standards in terms of scope, boundary and time, ie., JKH’s business model, strategy, governance systems and monitoring mechanisms for value creation, for the Company’s major business areas. Nothing has come to our attention to suggest that the Report does not meet the requirements related to the Principle of Completeness.
NeutralityThe extent to which a report provides a balanced account of an organization’s performance, delivered in a neutral tone.
The disclosures within the Report, related to sustainability issues and performances are presented in a neutral tone, in terms of content and presentation along with key concerns and challenges faced during the period. Nothing has come to our attention to suggest that the Report does not meet the requirements related to the Principle of Neutrality.
For DNV GL AS
Kiran RadhakrishnanLead Verifier - Sustainability Services
Vadakepatth NandkumarHead – Sustainability and Supply Chain OperationsRegion – India and Sri Lanka
Prasun KunduAssurance Reviewer Global Service Responsible - Social Accountability.
17th May 2019, Colombo, Sri Lanka.
DNV GL Business Assurance Lanka (Private) Limited is part of DNV GL – Business Assurance, a global provider of certification, verification, assessment and training services, helping customers to build sustainable business performance. www.dnvgl.com
318 JOHN KEELLS HOLDINGS PLC | ANNUAL REPORT 2018/19
GROUP DIRECTORY
TRANSPORTATION Ports and ShippingMackinnon Mackenzie & Co (Shipping) Ltd. (PB 359) (100%)Shipping agency representation & logistics servicesIncorporated in 19734, Leyden Bastian Road, Colombo 1T. 2475423Directors: J R Gunaratne, A Z Hashim K C SubasingheStated capital: LKR. 5,000,000
Maersk Lanka (Pvt) Ltd. (PV 2550 ) (30%)**Shipping agency representation & freight forwarding servicesIncorporated in 1992Level 16, "Park Land", 33, Park Street, Colombo 02.T. 0114794800Directors: W T Ellawala, R M David,F Dedenis, S Bandara Z Mukhi (Appointed w.e.f (25/03/2016)Stated capital: LKR.10,000,000
South Asia Gateway Terminals (Pvt) Ltd. (PV 326) (42.19%)**Ports & shipping servicesIncorporated in 1998Port of Colombo, P.O. Box 141, Colombo 1.T. 24575509Directors: K N J Balendra - Chairman J G A Cooray, D C Alagaratnam, J R Gunaratne, S Rajendra, R M W B C Rajapaksa, A Z Hashim, C Kuo Cheng, S S Jakobsen, J M Bevis, A M Garrett, J R Graham, K D W Ratnayaka, A HewavitharanaStated capital: LKR. 3,788,485,900
LogisticsDHL Keells (Pvt) Ltd. (PV 1307) (50%)**International express courier servicesIncorporated in 1986No. 148, Vauxhall Street, Colombo 2.T. 2304304 / 4798600Directors: K N J Balendra - Chairman A Z Hashim, Y B A Khan, S P Wall Stated capital: LKR. 20,000,020
John Keells Logistics (Pvt) Ltd. (PV 318) (100%)Integrated supply chain managementIncorporated in 2006No. 117, Sir Chittampalam A. Gardiner Mawatha, Colombo 2.T. 2475574Directors: J R Gunaratne, A Z Hashim Stated capital: LKR. 200,000,000
Logipark International (Pvt) Ltd.(PV 201610) (100%)Integrated Supply Chain ManagementIncorporated in 2018No. 117, Sir Chittampalam A. Gardiner Mawatha, Colombo 02.T. 2475574Directors: J R GunaratneK C Subasinghe , A Z Hashim Stated capital: LKR. 1,058,750,000
Mack International Freight (Pvt) Ltd. (PV 831) (100%)International freight forwarding and clearing & forwardingIncorporated in 1980No. 11, York Street, Colombo 1T. 7671671Directors: J R Gunaratne, K C Subasinghe A Z HashimStated capital: LKR.130,000,000
Lanka Marine Services (Pvt) Ltd. (PV 475) (99.44%)Importer & supplier of heavy marine fuel oilsIncorporated in 19934, Leyden Bastian Road, Colombo 1T. 2475410-421Directors: K N J Balendra - ChairmanA Z Hashim Stated capital: LKR. 350,000,000
Mackinnon Mackenzie & Co of Ceylon Ltd. (PB 348) (100%)*Foreign recruitment agents & consultantsIncorporated in 1975No. 11, York Street, Colombo 1T. 2475509Directors: J R Gunaratne, K C Subasinghe A Z HashimStated capital: LKR. 90,000
Saffron Aviation (Pvt) Ltd. (PV 84728) (40%)Domestic air line operationsIncorporated in 2012No.11,York Street , Colombo 01T. 2475502Directors: J G A Cooray - ChairmanJ R Gunaratne, A Z Hashim B A B Goonetilleke, K Balasundaram, F OmarStated capital: LKR. 622,179,000
Trans-ware Logistics (Pvt) Ltd. (PV 3134) (100%)*Renting of storage spaceIncorporated in 1994No 11, York Street, Colombo 01T. 2475545/539Directors: D C Alagaratnam, K C Subasinghe A Z Hashim, N N MawilmadaStated capital: LKR. 220,000,080
Air LinesMack Air (Pvt) Ltd. (PV 868) (100%)General sales agents for airlines in Sri LankaIncorporated in 1980No. 11 , York Street, Colombo 1T. 2475375/2475335Directors: J R Gunaratne, K C Subasinghe A Z Hashim Stated capital: LKR. 12,500,000
Mackinnons Travels (Pvt) Ltd. (PV 1261) (100%)IATA accredited travel agent and travel related services Incorporated in 1971No. 186, Vauxhall Street, Colombo 2T. 2318600 Directors: J R Gunaratne, K C Subasinghe A Z Hashim Stated capital: LKR. 5,000,000
Mack Air Services Maldives (Pte) Ltd. (C/I 35-2000) (49%)*General sales agents for airlines in the MaldivesIncorporated in 20004th Floor, STO Aifaanu Building,Boduthakurufaanu Magu, Male 20-05Republic of MaldivesT. +9603334708 - 09Directors: J R Gunaratne, K C Subasinghe A Z Hashim, S Hameed, A ShihabStated capital: LKR. 677,892
CONSUMER FOODSCeylon Cold Stores PLC. (PQ 4) (81.36%)Manufacture & marketing of beverages and frozen confectionery and the holding company of JayKay Marketing Services (Pvt) Ltd.Incorporated in 1926No.117, Chittampalam A Gardiner Mawatha,Colombo - 02T. 2318798Directors: K N J Balendra- ChairmanJ G A Cooray, D P Gamlath, M Hamza S T Ratwatte, R S W Wijeratnam Stated capital: LKR. 918,200,000
The Colombo Ice Company. (PV 113758) (81.36%)*Manufacturing and marketing of frozen confectioneryIncorporated in 2016No.117,Sir Chittampalam A,Gardiner Mawatha,Colombo - 02T. 2306000 Directors: J R Gunaratne, D P GamlathStated capital: LKR.1,700,000,000
John Keells Foods India (Pvt) Ltd. (U15122MH2008FTC180902) (88.63%)*Marketing of Branded meat and convenience food productsIncorporated in 2008Luthra and Luthra Chartered AccountantsA 16 / 9 , Vasant Vihar, New Delhi -110057 IndiaT. 0091 1142591823, 0091 1126148048,26151853, 26147365Fax: +91-11-2614 5222Directors J R Gunaratne, D P GamlathStated capital: LKR.220,294,544 (INR 90,000,000)
Keells Food Products PLC. (PQ 3) (88.63%)Manufacturer and distributor of Processed meat, breaded meat and convenience food products.Incorporated in 1982P.O Box 10,No.16, Minuwangoda Road, EkalaJa-ElaT. 2236317/ 2236364Directors: K N J Balendra- ChairmanJ G A Cooray, D P Gamlath, S De Silva A E H Sanderatne, I SamarajivaP D SamarasingheStated capital: LKR.1,294,815,000
GRI 102-45
319
SUPPLEMENTARY INFORMATION
RETAIL JayKay Marketing Services (Pvt) Ltd. (PV 33) (81.36%)Owns and Operates the "Keells" chain of supermarkets and "Nexus Mobile" loyalty card programme.Incorporated in 1980No.117,Chittampalam A,Gardiner Mawatha,Colombo - 02T. 2316800Directors: J G A Cooray- Chairman, J R Gunaratne, K C SubasingheStated capital: LKR.1,198,000,000
John Keells Office Automation (Pvt) Ltd. (PV 127) (100%)Distributor/Reseller and Services Provider in Office Automation(OA), Retail Automation (RA) and Mobile DevicesIncorporated in 1992Corporate Office: 90 Union Place Colombo - 2Technical Services:148 Vauxhall Street, Colombo - 2T. 2313000, 2431576, 2445760Directors: D C AlagaratnamJ R Gunaratne, K C SubasingheStated capital: LKR. 5,000,000
LEISURE Hotel ManagementCinnamon Hotel Management Ltd. (PB 7) (100%)Operator & marketer of hotels and resortsIncorporated in 1974No.117 Chittampalam A. Gardiner Mawatha, Colombo - 02T. 2306600, 2421101-8Directors: J R Gunaratne, J E P Kehelpannala R J Karunarajah, M H SinghawansaStated capital: LKR. 19,520,000
Cinnamon Hotel Management International (Private) Ltd. (PV 131788) (100%)*Operator & marketer of overseas hotels and resortsIncorporated in 2018No.117 Chittampalam A. Gardiner Mawatha, Colombo - 02Directors: J R Gunaratne, K C Subasinghe J E P Kehelpannala, R J Karunaraj M H SinghawansaStated capital: LKR. 500,000
John Keells Hotels PLC. (PQ 8) (80.32%)*Holding company of group resort hotel companies in Sri Lanka & MaldivesIncorporated in 1979No.117, Chittampalam A Gardiner Mawatha, Colombo - 02T. 2306600Directors: K N J Balendra – Chairman J G A Cooray, J R Gunaratne J E P Kehelpannala, M H Singhawansa,N B Weerasekera, T L F W Jayasekera A K MoonesingheStated capital: LKR.9,500,246,939
Sentinel Realty (Pvt) Ltd. (PV 80706) (42.41%)**Investment company for Hotel Development landIncorporated in 2011No.117, Chittampalam A Gardiner Mawatha Colombo - 02T. 2306000 Directors: B A B Goonettileke - Chairman S Rajendra, J R Gunaratne, K BalasundaramStated capital: LKR. 132,288,080
City HotelsAsian Hotels and Properties PLC - Cinnamon Grand. (PQ 2) (78.56%)Owner & operator of the five star city hotel "Cinnamon Grand"Incorporated in 199377, Galle Road, Colombo 3T. 2437437 /2497206Directors: K N J Balendra - Chairman Managing DirectorJ G A Cooray, J R Gunaratne, S Rajendra R J Karunarajah, C J L Pinto, J Durairatnam A S De ZoysaStated capital: LKR.3,345,118,012
Capitol Hotel Holdings Ltd. (PB 5013) (19.47%)**Developer of City Business Hotels Incorporated in 2012No.117, Chittampalam A Gardiner Mawatha, Colombo - 02T. 2306000 Directors: M S Weerasekera - ChairmanJ R Gunaratne, W R K Wannigama D A Kannangara , M D R Gunatilleke L C H Leow, A J Pathmarajah, R J KarunarajahStated capital: LKR. 1,168,800,100
Trans Asia Hotels PLC. (PQ 5) (82.74%)Owner & operator of the five star city hotel "Cinnamon Lakeside".Incorporated in 1981No. 115, Sir Chittampalam A Gardiner Mawatha, Colombo 2.T. 2491000Directors: K N J Balendra - ChairmanJ G A Cooray, J R Gunaratne, R J Karunarajah N L Goonaratne, C J L Pinto, E H Wijenaike J C PonniahStated capital: LKR.1,112,879,750
Resort Hotels - Sri LankaAhungalla Holiday Resorts (Pvt) Ltd. (PV 85046) (80.32%)*owner of real estateIncorporated in 2012No.117, Chittampalam A Gardiner Mawatha Colombo - 02T. 2306000Directors: J R Gunaratne, K C Subasinghe M H SinghawansaStated capital: LKR. 133,490,000
Beruwala Holiday Resorts (Pvt) Ltd. (PV 69678) (79.78%)Owner & operator of "Cinnamon Bey" in BeruwalaIncorporated in 2009Moragolla Beruwala.T. 2306600, 034 2297000 Directors: J R Gunaratne, K C Subasinghe M H SinghawansaStated Capital: LKR. 2,338,150,000
Ceylon Holiday Resorts Ltd*- Bentota Beach Hotel. (PB 40) (79.60%)Owner & operator of "Bentota Beach by Cinnamon" in Bentota Incorporated in 1966Galle Road, BentotaT. 034 2275176 / 034 2275266Directors: J R Gunaratne, K C Subasinghe M H SinghawansaStated capital: LKR. 2,378,973,307
Habarana Lodge Ltd. (PB 38) (78.99%)Owner & operator of "Cinnamon Lodge" in HabaranaIncorporated in 1978P.O Box 2, HabaranaT. 066 2270011-2/ 066 2270072Directors: J R Gunaratne, K C Subasinghe M H SinghawansaStated capital: LKR.341,555,262
Habarana Walk Inn Ltd. (PB 33) (79.34%)Owner & operator of "Habarana Village by Cinnamon" in HabaranaIncorporated in 1973P.O Box 1, HabaranaT. 066 2270046-7/ 066 2270077Directors: J R Gunaratne, K C Subasinghe M H SinghawansaStated capital: LKR. 126,350,000
Hikkaduwa Holiday Resorts (Pvt) Ltd. (PV 71747) (79.60%)Owner & operator of "Hikka Tranz by Cinnamon" in HikkaduwaIncorporated in 2010P.O Box 1, Galle Road, HikkaduwaT. 091 2298000Directors: J R Gunaratne, K C Subasinghe M H SinghawansaStated capital: LKR.1,062,635,460
Indra Hotel and Resorts (Pvt) Ltd. (PV 124247) (32.13%)*Owner of Cinnamon Red KandyIncorporated in 2017No. 273, Katugastota Road, KandyT. 081 2234346Directors: Y S H I K Silva, Y S H R S Silva Y S H H K Silva, J R Gunaratne K C SubasingheStated capital: LKR.1,051,400,493
GRI 102-45

320 JOHN KEELLS HOLDINGS PLC | ANNUAL REPORT 2018/19
GROUP DIRECTORY
International Tourists and Hoteliers Ltd. (PB 17) (79.78%)*Owner of real estateIncorporated in 1973No.117, Chittampalam A Gardiner Mawatha Colombo - 02T. 2306600, 2421101-8Directors: J R Gunaratne, K C Subasinghe M H SinghawansaStated capital: LKR. 1,939,760,925
Kandy Walk Inn Ltd. (PB 395) (79.03%)Owner & operator of "Cinnamon Citadel" in KandyIncorporated in 1979No.124, Srimath Kuda Ratwatte Mawatha, KandyT. 081 2234365-6/ 081 2237273-4Directors: J R Gunaratne, K C Subasinghe M H SinghawansaStated capital: LKR. 115,182,009
Nuwara Eliya Holiday Resorts (Pvt) Ltd* (PV98357) (80.32%)owner of real estateIncorporated in 2014No.117, Chittampalam A Gardiner Mawatha Colombo - 02T. 2306000Directors: J R Gunaratne, K C Subasinghe M H SinghawansaStated Capital: LKR. 323,074,820
Rajawella Hotels Company Ltd. (PB 92) (80.32%)*Owner of real estateIncorporated in 1992No.117, Chittampalam A Gardiner Mawatha Colombo - 02T. 2306000 Directors: J R Gunaratne, K C Subasinghe M H SinghawansaStated capital: LKR. 35,411,762
Resort Hotels Ltd. (PB 193) (79.60%)*Owner of real estateIncorporated in 1978No.117, Chittampalam A Gardiner Mawatha Colombo - 02T. 2306780, 2421101-8Directors: J R Gunaratne, K C Subasinghe M H SinghawansaStated capital: LKR. 8,299,150
Trinco Holiday Resorts (Pvt) Ltd.(PV 69908) (80.32%)Owner & Operator of "Trinco Blu by Cinnamon" in TrincomaleeIncorporated in 2009Alles Garden, Uppuvelli, Sampathiv PostT. 026 2222307 / 026 2221611Directors: J R Gunaratne, K C Subasinghe M H SinghawansaStated Capital: LKR.357,000,000
Trinco Walk Inn Ltd. (PB 168) (80.32%)*Owner of Real Estate Incorporated in 1984Alles Garden, Uppuveli,Sampathiv Post,TrincomaleeT. 026 2222307 / 011 2306600Directors: J R Gunaratne, K C Subasinghe M H SinghawansaStated capital: LKR.119,850,070
Wirawila Walk Inn Ltd. (PB 89) (80.32%)*Owner of real estateIncorporated in 1994No.117, Chittampalam A Gardiner Mawatha Colombo - 02T. 2306780, 2421101-8Directors: J R Gunaratne, K C Subasinghe M H SinghawansaStated capital: LKR. 20,204,150
Yala Village (Pvt) Ltd. (PV 2868) (75.33%)Owner & operator of "Cinnamon Wild" in YalaIncorporated in 1999P.O Box 1, Kirinda, TissamaharamaT. 047 2239449-52Directors: M A Perera - ChairmanK N J Balendra - Deputy Chairman J R Gunaratne, M H Singhawansa, J A DavisStated capital: LKR.319,427,600
Resort Hotels - MaldivesFantasea World Investments (Pte) Ltd. (C 143/97) (80.32%)Owner & operator of "Cinnamon Hakuraa Huraa" in MaldivesIncorporated in 19972nd Floor, H.Maizan Building, Sosun Magu, Male, Republic of MaldivesT. 00960 6720014 / 00960 6720064 / 00960 6720065Directors: J E P Kehelpannala - Managing DirectorJ R Gunaratne, K C Subasinghe M H SinghawansaStated capital: LKR. 341,573,190
John Keells Maldivian Resorts (Pte) Ltd. (C 208/96) (80.32%)Hotel holding company in the MaldivesIncorporated in 19962nd Floor, H. Maizan Building, Sosun Magu, Male, Republic of MaldivesT. 00960 3329083 / 00960 3304601 / 00960 3313738Directors: J E P Kehelpannala - Managing Director J R Gunaratne, K C Subasinghe M H SinghawansaStated capital: LKR.3,978,671,681
Tranquility (Pte) Ltd. (C 344/2004) (80.32%)Owner and operator of "Cinnamon Dhoinveli" in MaldivesIncorporated in 20042nd Floor, H. Maizan Building Sosun Magu, Male, Republic of MaldivesT. 00960 6640055 / 00960 6640012
Directors: J E P Kehelpannala - Managing Director J R Gunaratne, K C Subasinghe M H SinghawansaStated capital: LKR.552,519,608
Travel Club (Pte) Ltd. (C 121/92) (80.32%)Operator of "Ellaidhoo" in MaldivesIncorporated in 19922nd Floor, H. Maizan Building Sosun Magu, Male, Republic of MaldivesT. 00960 6660839 / 00960 6660663 / 00960 6660664Directors: J E P Kehelpannala - Managing Director J R Gunaratne, K C Subasinghe M H SinghawansaStated capital: LKR. 143,172,000
Destination ManagementCinnamon Holidays (Pvt) Ltd. (PV 101005) (80.32%)Service providers of Inbound and outbound ToursIncorporated in 2015No.117, Chittampalam A Gardiner Mawatha Colombo - 02T. 2306000Directors: J R Gunaratne, K C Subasinghe M H SinghawansaStated capital: LKR.200,000
Serene Holidays (Pvt) Ltd. (U63040MH2006PTC164985) (98.35%)Tour operatorsIncorporated in 2006110, Bldg 2, Rolex Shopping Centre PremisesCHS Ltd, STN Road, NR Prashant Hotel, Goregoan (W)Mumbai, Mumbai City, Maharashtra, 400062T. 091-22 42105210 99Directors: J R Gunaratne, K C Subasinghe K O AgrawalStated capital: LKR.6,492,000
Walkers Tours Ltd. (PB 249) (98.05%)Inbound tour operatorsIncorporated in 1969No.117,Chittampalam A,Gardiner Mawatha,Colombo - 02T. 2306306Directors: J G A Cooray - Chairman J R Gunaratne, I N AmaratungaStated capital: LKR. 51,374,200
Whittall Boustead (Travel) Ltd. (PB 112) (100%)Inbound tour operatorsIncorporated in 1977No.117,Chittampalam A,Gardiner Mawatha,Colombo - 02T. 2306746Directors: J R Gunaratne, K C Subasinghe I N AmaratungaStated capital: LKR. 250,410,000
GRI 102-45

321
SUPPLEMENTARY INFORMATION
PROPERTY Property DevelopmentAsian Hotels and Properties PLC - Crescat. Boulevard, The Monarch, The Emperor. (PQ 2) (78.56%)Developer of 'Crescat Residencies', 'The Monarch' & 'The Emperor' Residential Towers Developer and manager of 'Crescat Boulevard' shopping MallIncorporated in 1993No.89, Galle Road, Colombo 3T. 0112152100Directors: K N J Balendra - (Chairman/Managing Director)J G A Cooray, J R Gunaratne, S Rajendra R J Karunarajah, C J L Pinto, J Durairatnam A S De ZoysaStated capital: LKR. 3,345,118,012
British Overseas (Pvt) Ltd. (PV 80203) (61%)Developer of "7th Sense" Residential TowerIncorporated in 2011No.186, Vauxhall Street, Colombo - 02T. 0112152100Directors: S Rajendra, J R Gunaratne K C Subasinghe, N N MawilmadaS P G N RajapakseStated capital: LKR.1,000
Braybrooke Residential Properties (Pvt) Ltd (PV19165) (50%) **Investor of Braybrooke Residential Towers (Pvt) LtdIncorporated in 1998No.186, Vauxhall Street, Colombo - 02T. 0112152100Directors: Y S H R S Silva - Chairman D C Alagaratnam, S Rajendra K C Subasinghe, N N Mawilmada,Y S H I K Silva, A D B Thatlwatte C P PalansuriyaStated capital: LKR.1,403,970,000
Braybrooke Residential Towers (Pvt) Ltd (PV128387) (50%) **Developer of 'TRI-ZEN' Residential TowersIncorporated in 2017No.186, Vauxhall Street, Colombo - 02T. 0112152100Directors: Y S H R S Silva - Chairman K N J Balendra, J G A Cooray, S Rajendra N N Mawilmada, Y S H I K Silva A D B Thatlwatte, C P PalansuriyaStated capital: LKR. 3,636,900,000
Glennie Properties (Pvt) Ltd. (PV 84278) (100%)*Property Development Incorporated in 2012No.186, Vauxhall Street, Colombo - 02T. 0112152100Directors: D C Alagaratnam, K C Subasinghe N N MawilmadaStated capital: 163,861,400
J K Land (Pvt) Ltd.(PV 84272) (100%) *Investment Company for Property SectorIncorporated in 2012No.186, Vauxhall Street, Colombo - 02T. 0112152100
Directors: S Rajendra, K C Subasinghe N N MawilmadaStated capital: LKR. 17,047,210,230
J K Thudella Properties (Pvt) Ltd. (PV 129825) (100%) *Owner of Real EstatesIncorporated in 2018No.186, Vauxhall Street, Colombo - 02T. 0112152100Directors: S Rajendra, J R Gunaratne N N Mawilmada,Stated capital: LKR. 453,467,620
John Keells Properties Ja-Ela (Pvt) Ltd. (PV 76068) (100%)Developer & Manager of ' K-Zone Ja-Ela' Shopping MallIncorporated in 2010No.186, Vauxhall Street, Colombo - 02T. 0112152100Directors: S Rajendra, K C Subasinghe N N MawilmadaStated capital: LKR.954,360,000
John Keells Residential Properties (Pvt) Ltd. (PV 75050) (100%)Developer of "On320" Residential TowersIncorporated in 2010No.186, Vauxhall Street, Colombo - 02T. 0112152100Directors: S Rajendra, K C Subasinghe N N MawilmadaStated capital: LKR. 925,200,000
John Keells Property Development (Pvt) Ltd.(PV 130036) (100%)*Property Development Incorporated in 2018No.117, Sir Chittampalam A Gardiner Mawatha, Colombo 02T. 0112152100Directors : S Rajendra, K C Subasinghe N N MawilmadaStated capital: LKR. 1,054,056,800
Keells Realtors Ltd. (PB 90) (95.81%)*Owner of Real EstatesIncorporated in 1977No.186, Vauxhall Street, Colombo - 02T. 0112152100Directors: S Rajendra, K C Subasinghe N N Mawilmada, Stated capital: LKR.75,000,000
Mackinnons Keells Ltd. (PB 8) (100%)*Rental of office spacesIncorporated in 1952No. 4, Layden Bastian Road, Colombo 1T. 2152100Directors: S Rajendra, J R Gunaratne N N MawilmadaStated capital: LKR.327,800,000
Rajawella Holdings Ltd (PB27) (49.85%)Operates an 18 hole, Donald Street Designed Golf Course in DiganaIncorporated in 1991P O Box 7, Rajawella, KandyT. 0112152100
Directors: K N J Balendra - Chairman J G A Cooray, S Rajendra, N N Mawilmada C B Thornton (Alt. C J Holloway) G R Bostock Kirk (Alt. E C Oxlade) S E Captain (R S Captain)Stated Capital: 784,690,140
Vauxhall Land Developments (Pvt) Ltd. (PV125587) (60.28%)*Owner of Real EstatesIncorporated in 2017No.186, Vauxhall Street, Colombo - 02T. 0112152100Directors: K N J Balendra - Chairman J G A Cooray, S Rajendra, G R Chambers H A S Crawford Stated capital: LKR. 21,699,602,860
Waterfront Properties (Pvt) Ltd. (PV 82153) (96.98%)Developer of Hotels,Apartments, offices & Shopping MallsIncorporated in 2011No.186, Vauxhall Street, Colombo - 02T. 0112152100Directors: K N J Balendra - Chairman J G A Cooray, D C Alagaratnam S RajendraStated capital: LKR.39,066,738,955
Whittall Boustead (Pvt) Ltd - Real Estate Division. (PV 31) (100%)*Renting of office spaceIncorporated in1958No.186, Vauxhall Street, Colombo - 02T. 0112152100Directors: S Rajendra, K C Subasinghe N N Mawilmada, Stated capital: LKR.99,188,800
FINANCIAL SERVICES Fairfirst Insurance Ltd (PB 5180) (19.80%)**General insurance underwritersIncorporated in 2014No 33, St Michael’s Road, Colombo 03Directors: R Athappan - Chairman A D Pereira, C Ratnaswami, A S Wijesinha C D Wijegunawardene, S Malhotra, S JhaStated Capital: LKR.3,131,949,000
John Keells Stock Brokers (Pvt) Ltd. (PV 89) (90.04%)Share broking servicesIncorporated in 1979No. 186,Vauxhall street, Colombo 02T. +94(0) 11 230 6250, +94(0) 11 234 2066-7J R Gunaratne, A D Pereira, R S CaderStated capital: LKR. 57,750,000
Nations Trust Bank PLC. (PQ 118) (29.90%)**Commercial banking and leasing operationsIncorporated in 1999No. 242, Union Place, Colombo 2.T. 4313131
GRI 102-45
322 JOHN KEELLS HOLDINGS PLC | ANNUAL REPORT 2018/19
GROUP DIRECTORY
Directors: J G A Cooray - Chairman K O V S M S Wijesinghe, R S Cader R N K Fernando, M Jafferjee,D P De Silva J C A D'Souza, R D Rajapaksa, N I R De MelS Maheshwari, S I Sebastian C H A W Wickramasuriya, A R FernandoStated capital: LKR.9,408,134,000
Union Assurance PLC. (PQ 12) (90%)Providers for Life insurance solutionsIncorporated in 1987No.20, St. Michaels' Road, Colombo 3T. 2990990Directors: K N J Balendra - Chairman D C Alagaratnam, S Rajendra, A D Pereira H A J De Silva WijeyeratneD H Fernando, S A AppleyardStated capital: LKR.1,000,000,000
IT ServicesJohn Keells Information Technology (Pvt) Ltd. (PV 652) (100%)Software services Incorporated in 1998No. 148, Vauxhall Street,Colombo 2.T. 2300770-77Directors: J G A Cooray - ChairmanJ R Gunaratne, R ShanmuganathanStated capital: LKR. 96,500,000
IT Enabled ServicesInfoMate (Pvt) Ltd. (PV 921) (100%)IT enabled servicesIncorporated in 2005No.4, Leyden Bastian Road, Colombo 1 T. (94) 112149700Directors: D C Alagaratnam, J R Gunaratne R ShanmuganathanStated capital: LKR.20,000,000
John Keells BPO Holdings Private Ltd. (C 60882) (100%)*Holding company of AuxiCogent group companiesIncorporated in 2006IFS Court, 28, Cybercity, Ebene,MauritiusT. (230) 467 3000Directors: J R Gunaratne, K C Subasinghe R Shanmuganathan, P Bissoonauth Z H NiamutStated capital: LKR.1,988,300,000
John Keells BPO International (Pvt) Ltd. (C 070137) (100%)*Investment holding companyIncorporated in 2007IFS Court, 28, Cybercity,Ebene, MauritiusT. (230) 467 3000 Directors: J R Gunaratne, K C Subasinghe R Shanmuganathan, P Bissoonauth Z H NiamutStated capital: LKR.1,616,700,008
John Keells BPO Solutions Lanka (Private) Ltd. (PV 3458) (100%)*BPO operations in Sri LankaIncorporated in 2006No.4, Leyden Bastian Road, Colombo 1 T. (94) 2300770-77Directors: J R Gunaratne, K C Subasinghe R ShanmuganathanStated capital: LKR.335,797,260
Plantation ServicesJohn Keells PLC. (PQ 11) (86.90 %)Produce Broking and Real Estate OwnershipIncorporated in 1960No 186, Vauxhall street,Colombo 02T. 2306000Directors: K N J Balendra - ChairmanJ G A Cooray, J R Gunaratne A K Gunawardhana, C N Wijewardene B A I RajakarierStated capital: LKR.152,000,000
John Keells (Teas) Ltd. (PV 522) (100%)Manager seven bought leaf tea factoriesIncorporated in 1979No.117,Chittampalam A,Gardiner Mawatha,Colombo - 02T. 2306518Directors: J R Gunaratne, K C Subasinghe A Z HashimStated capital: LKR. 120,000
John Keells Warehousing (Pvt) Ltd. (PV 638) (86.90%)Warehousing of Tea and RubberIncorporated in 2001No.93,1st Avenue, Muthurajawela, Hendala, WattalaT. 4819560Directors: J R Gunaratne, K C Subasinghe A Z HashimStated capital: LKR.120,000,000
Tea Smallholder Factories PLC. (PQ 32) (37.62%)Owner and operator of Bought Leaf factoriesIncorporated in 1991No.4, Leyden Bastian Road, Colombo 1T. 2149994 / 2335880Directors: K N J Balendra - ChairmanJ G A Cooray, J R Gunaratne, E H Wijenaike A S Jayatilleke, M H D Silva, S K L ObeyesekereA K GunaratneStated capital: LKR.150,000,000
Centre & OthersFacets (Pvt) Ltd. (PV1048) (100%)*Owner of real estateIncorporated in 1974No.117, Sir Chittampalam A Gardiner Mawatha, Colombo - 02T. 2306000 Directors: D C Alagaratnam, J R GunaratneStated capital: LKR.150,000
J K Packaging (Pvt) Ltd. (PV 1265) (100%)*Printing and packaging services provider for the export marketIncorporated in 1979No 148, Vauxhall street,Colombo 02T. 2475308Directors: D C Alagaratnam, K C Subasinghe J R Gunaratne, Stated capital: LKR.14,500,000
John Keells Holdings PLC. (PQ 14)Group holding company & function based servicesIncorporated in 1979No.117, Chittampalam A Gardiner Mawatha Colombo - 02T. 2306000 Directors: K N J Balendra - Chairman J G A Cooray - Deputy ChairmanM A Omar, D A Cabraal ,A N Fonseka M P Perera, S S H Wijayasuriya R CoomaraswamyStated capital: LKR. 62,806,482,130
John Keells International (Pvt) Ltd. (PV 46) (100%)*Regional holding company providing administrative & function based servicesIncorporated in 2006No.117, Chittampalam A Gardiner Mawatha Colombo - 02T. 2306000 /2421101-9Directors: J G A Cooray- Chairman, D C AlagaratnamStated capital: LKR. 1,991,600,000
John Keells Singapore (Pte) Ltd. (199200499C) (80%)*International trading servicesIncorporated in 1992No.16 Collyer Quay, Level 21Office Suit No.21-38, Singapore 049318T. 65 63296409/ 65 68189150/ 65 96346593Directors: J G A Cooray - Chairman D C Alagaratnam, J R Gunaratne K C Subasinghe, R PonnampalamStated capital: LKR.9,638,000
Keells Consultants (Pvt) Ltd. (PB 3) (100%)Company secretarial services to the groupIncorporated in 1974No.117, Chittampalam A Gardiner Mawatha Colombo - 02T. 2421101-9Directors: D C Alagaratnam, J R Gunaratne N W Tambiah Stated capital: LKR.160,000
Mortlake (Pvt) Ltd. (PV 756) (100%)*Investment companyIncorporated in 1962No. 148, Vauxhall Street, Colombo 2.T. 2475308Directors: J R Gunaratne, K C SubasingheStated capital: LKR. 3,000
GRI 102-45
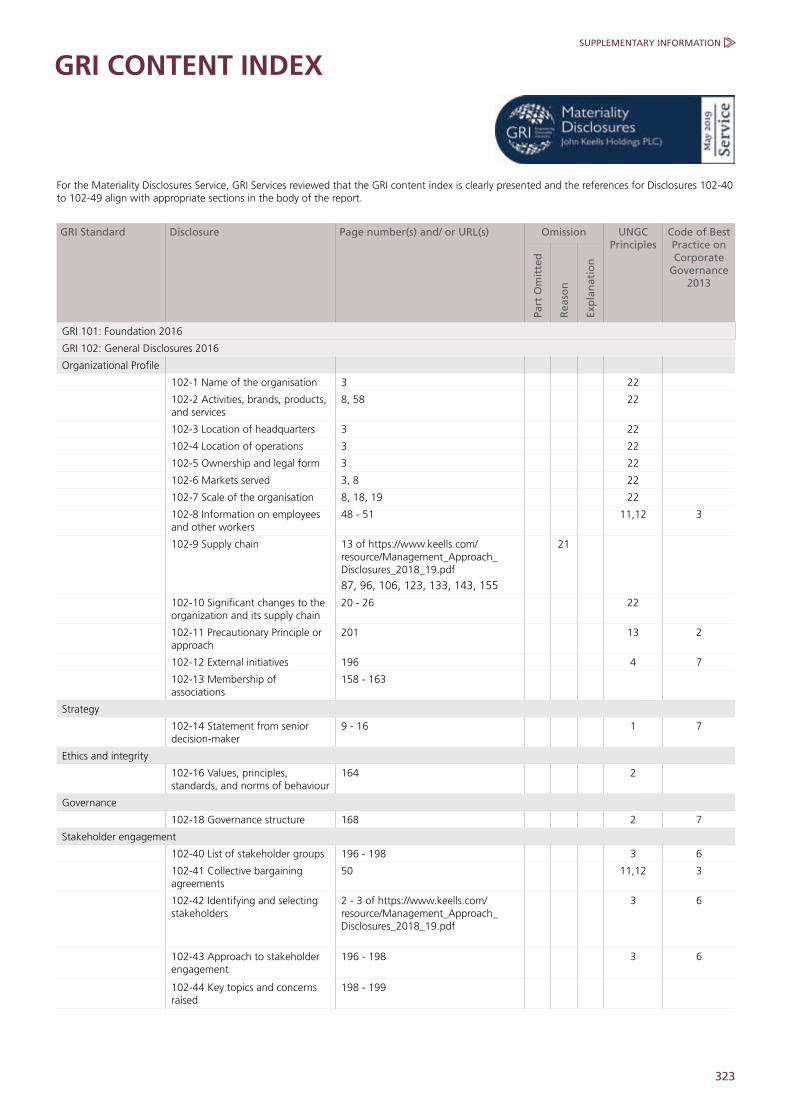
323
SUPPLEMENTARY INFORMATION
GRI CONTENT INDEX
GRI Standard Disclosure Page number(s) and/ or URL(s) Omission UNGC Principles
Code of Best Practice on Corporate
Governance 2013
Part
Om
itte
d
Rea
son
Exp
lan
atio
n
GRI 101: Foundation 2016
GRI 102: General Disclosures 2016
Organizational Profile
102-1 Name of the organisation 3 22
102-2 Activities, brands, products, and services
8, 58 22
102-3 Location of headquarters 3 22
102-4 Location of operations 3 22
102-5 Ownership and legal form 3 22
102-6 Markets served 3, 8 22
102-7 Scale of the organisation 8, 18, 19 22
102-8 Information on employees and other workers
48 - 51 11,12 3
102-9 Supply chain 13 of https://www.keells.com/resource/Management_Approach_Disclosures_2018_19.pdf
87, 96, 106, 123, 133, 143, 155
21
102-10 Significant changes to the organization and its supply chain
20 - 26 22
102-11 Precautionary Principle or approach
201 13 2
102-12 External initiatives 196 4 7
102-13 Membership of associations
158 - 163
Strategy
102-14 Statement from senior decision-maker
9 - 16 1 7
Ethics and integrity
102-16 Values, principles, standards, and norms of behaviour
164 2
Governance
102-18 Governance structure 168 2 7
Stakeholder engagement
102-40 List of stakeholder groups 196 - 198 3 6
102-41 Collective bargaining agreements
50 11,12 3
102-42 Identifying and selecting stakeholders
2 - 3 of https://www.keells.com/resource/Management_Approach_Disclosures_2018_19.pdf
3 6
102-43 Approach to stakeholder engagement
196 - 198 3 6
102-44 Key topics and concerns raised
198 - 199
For the Materiality Disclosures Service, GRI Services reviewed that the GRI content index is clearly presented and the references for Disclosures 102-40 to 102-49 align with appropriate sections in the body of the report.

324 JOHN KEELLS HOLDINGS PLC | ANNUAL REPORT 2018/19
GRI CONTENT INDEX
GRI Standard Disclosure Page number(s) and/ or URL(s) Omission UNGC Principles
Code of Best Practice on Corporate
Governance 2013
Part
Om
itte
d
Rea
son
Exp
lan
atio
n
Reporting practice
102-45 Entities included in the consolidated financial statements
318 - 322
102-46 Defining report content and topic Boundaries
195 - 196, 199 22,23 6,7
102-47 List of material topics Page 2 - 3 of https://www.keells.com/resource/Management_Approach_Disclosures_2018_19.pdf, 200
3 6
102-48 Restatements of information
196 22,23
102-49 Changes in reporting 199 22,23
102-50 Reporting period 4
102-51 Date of most recent report 196
102-52 Reporting cycle 196 22,23 7
102-53 Contact point for questions regarding the report
332 22,23
102-54 Claims of reporting in accordance with the GRI Standards
4, 14, 193, 306 22,23 7
102-55 GRI content index 323 - 330
102-56 External assurance 315 - 317 22,23 7
Material Topics
GRI 200: Economic Standard Series
Economic Performance
GRI 103 Management Approach 2016
103-1 Explanation of the material topic and its Boundary
Page 2 - 5 of https://www.keells.com/resource/Management_Approach_Disclosures_2018_19.pdf
22,23 6
103-2 The management approach and its components
Page 6 - 16 of https://www.keells.com/resource/Management_Approach_Disclosures_2018_19.pdf
103-3 Evaluation of the management approach
Page 6 - 16 of https://www.keells.com/resource/Management_Approach_Disclosures_2018_19.pdf
GRI 201: Economic Performance 2016
201-1 Direct economic value generated and distributed
306 - 307 1
201-3 Defined benefit plan obligations and other retirement plans
51 1
Indirect Economic Impacts
GRI 103 Management Approach 2016
103-1 Explanation of the material topic and its Boundary
Page 2 - 5 of https://www.keells.com/resource/Management_Approach_Disclosures_2018_19.pdf
22,23 6
103-2 The management approach and its components
Page 6 - 16 of https://www.keells.com/resource/Management_Approach_Disclosures_2018_19.pdf
103-3 Evaluation of the management approach
Page 6 - 16 of https://www.keells.com/resource/Management_Approach_Disclosures_2018_19.pdf
GRI 203: Indirect Economic Impacts 2016
203-1 Infrastructure investments and services supported
52 4

325
SUPPLEMENTARY INFORMATION
GRI Standard Disclosure Page number(s) and/ or URL(s) Omission UNGC Principles
Code of Best Practice on Corporate
Governance 2013
Part
Om
itte
d
Rea
son
Exp
lan
atio
n
Procurement Practices
GRI 103 Management Approach 2016
103-1 Explanation of the material topic and its Boundary
Page 2 - 5 of https://www.keells.com/resource/Management_Approach_Disclosures_2018_19.pdf
22,23 6
103-2 The management approach and its components
Page 6 - 16 of https://www.keells.com/resource/Management_Approach_Disclosures_2018_19.pdf
103-3 Evaluation of the management approach
Page 6 - 16 of https://www.keells.com/resource/Management_Approach_Disclosures_2018_19.pdf
GRI 204: Procurement Practices 2016
204-1 Proportion of spending on local suppliers
52
Anti-corruption
GRI 103 Management Approach 2016
103-1 Explanation of the material topic and its Boundary
Page 2 - 5 of https://www.keells.com/resource/Management_Approach_Disclosures_2018_19.pdf
22,23 6
103-2 The management approach and its components
Page 6 - 16 of https://www.keells.com/resource/Management_Approach_Disclosures_2018_19.pdf
103-3 Evaluation of the management approach
Page 6 - 16 of https://www.keells.com/resource/Management_Approach_Disclosures_2018_19.pdf
GRI 205: Anticorruption 2016
205-1 Operations assessed for risks related to corruption
52 19,20
GRI 300: Environment Standard Series
Energy
GRI 103 Management Approach 2016
103-1 Explanation of the material topic and its Boundary
Page 2 - 5 of https://www.keells.com/resource/Management_Approach_Disclosures_2018_19.pdf
22,23 6
103-2 The management approach and its components
Page 6 - 16 of https://www.keells.com/resource/Management_Approach_Disclosures_2018_19.pdf
103-3 Evaluation of the management approach
Page 6 - 16 of https://www.keells.com/resource/Management_Approach_Disclosures_2018_19.pdf
GRI 302: Energy 2016
302-1 Energy consumption within the organisation
43 - 44 3 2
302-4 Reduction of energy consumption
44 3 2
Water and Effluents
GRI 103 Management Approach 2016
103-1 Explanation of the material topic and its Boundary
Page 2 - 5 of https://www.keells.com/resource/Management_Approach_Disclosures_2018_19.pdf
22,23 6
103-2 The management approach and its components
Page 6 - 16 of https://www.keells.com/resource/Management_Approach_Disclosures_2018_19.pdf
103-3 Evaluation of the management approach
Page 6 - 16 of https://www.keells.com/resource/Management_Approach_Disclosures_2018_19.pdf
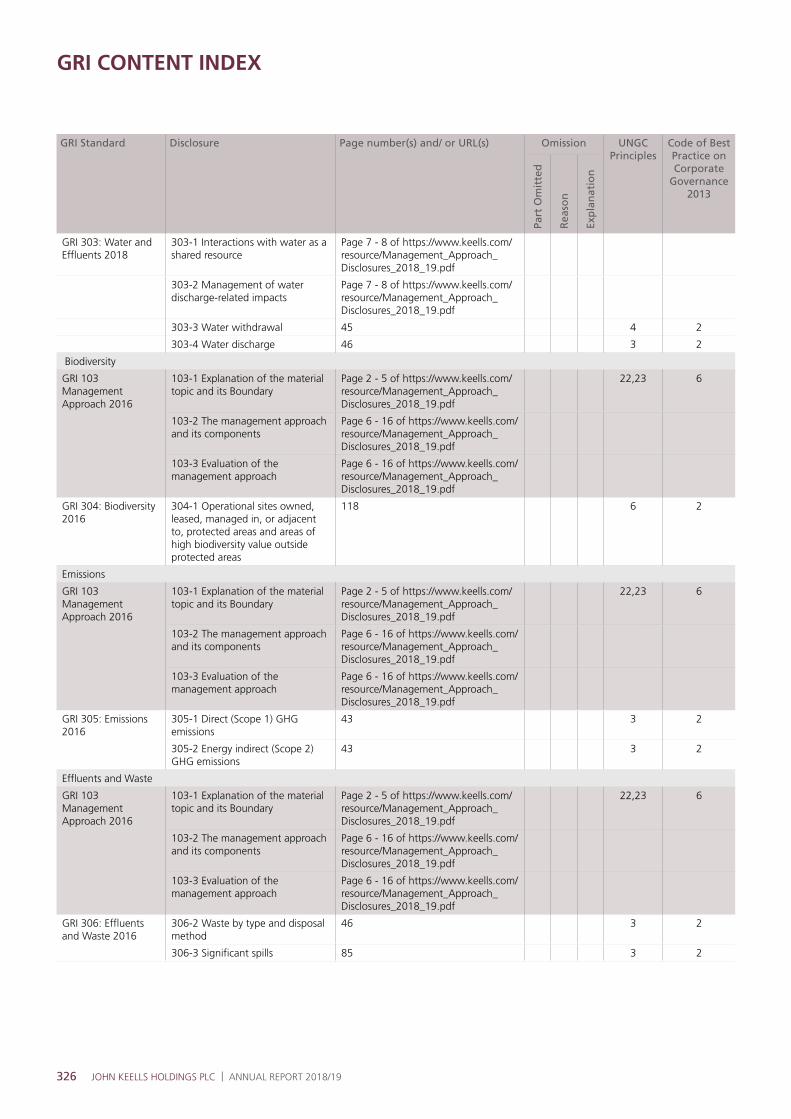
326 JOHN KEELLS HOLDINGS PLC | ANNUAL REPORT 2018/19
GRI CONTENT INDEX
GRI Standard Disclosure Page number(s) and/ or URL(s) Omission UNGC Principles
Code of Best Practice on Corporate
Governance 2013
Part
Om
itte
d
Rea
son
Exp
lan
atio
n
GRI 303: Water and Effluents 2018
303-1 Interactions with water as a shared resource
Page 7 - 8 of https://www.keells.com/resource/Management_Approach_Disclosures_2018_19.pdf
303-2 Management of water discharge-related impacts
Page 7 - 8 of https://www.keells.com/resource/Management_Approach_Disclosures_2018_19.pdf
303-3 Water withdrawal 45 4 2
303-4 Water discharge 46 3 2
Biodiversity
GRI 103 Management Approach 2016
103-1 Explanation of the material topic and its Boundary
Page 2 - 5 of https://www.keells.com/resource/Management_Approach_Disclosures_2018_19.pdf
22,23 6
103-2 The management approach and its components
Page 6 - 16 of https://www.keells.com/resource/Management_Approach_Disclosures_2018_19.pdf
103-3 Evaluation of the management approach
Page 6 - 16 of https://www.keells.com/resource/Management_Approach_Disclosures_2018_19.pdf
GRI 304: Biodiversity 2016
304-1 Operational sites owned, leased, managed in, or adjacent to, protected areas and areas of high biodiversity value outside protected areas
118 6 2
Emissions
GRI 103 Management Approach 2016
103-1 Explanation of the material topic and its Boundary
Page 2 - 5 of https://www.keells.com/resource/Management_Approach_Disclosures_2018_19.pdf
22,23 6
103-2 The management approach and its components
Page 6 - 16 of https://www.keells.com/resource/Management_Approach_Disclosures_2018_19.pdf
103-3 Evaluation of the management approach
Page 6 - 16 of https://www.keells.com/resource/Management_Approach_Disclosures_2018_19.pdf
GRI 305: Emissions 2016
305-1 Direct (Scope 1) GHG emissions
43 3 2
305-2 Energy indirect (Scope 2) GHG emissions
43 3 2
Effluents and Waste
GRI 103 Management Approach 2016
103-1 Explanation of the material topic and its Boundary
Page 2 - 5 of https://www.keells.com/resource/Management_Approach_Disclosures_2018_19.pdf
22,23 6
103-2 The management approach and its components
Page 6 - 16 of https://www.keells.com/resource/Management_Approach_Disclosures_2018_19.pdf
103-3 Evaluation of the management approach
Page 6 - 16 of https://www.keells.com/resource/Management_Approach_Disclosures_2018_19.pdf
GRI 306: Effluents and Waste 2016
306-2 Waste by type and disposal method
46 3 2
306-3 Significant spills 85 3 2
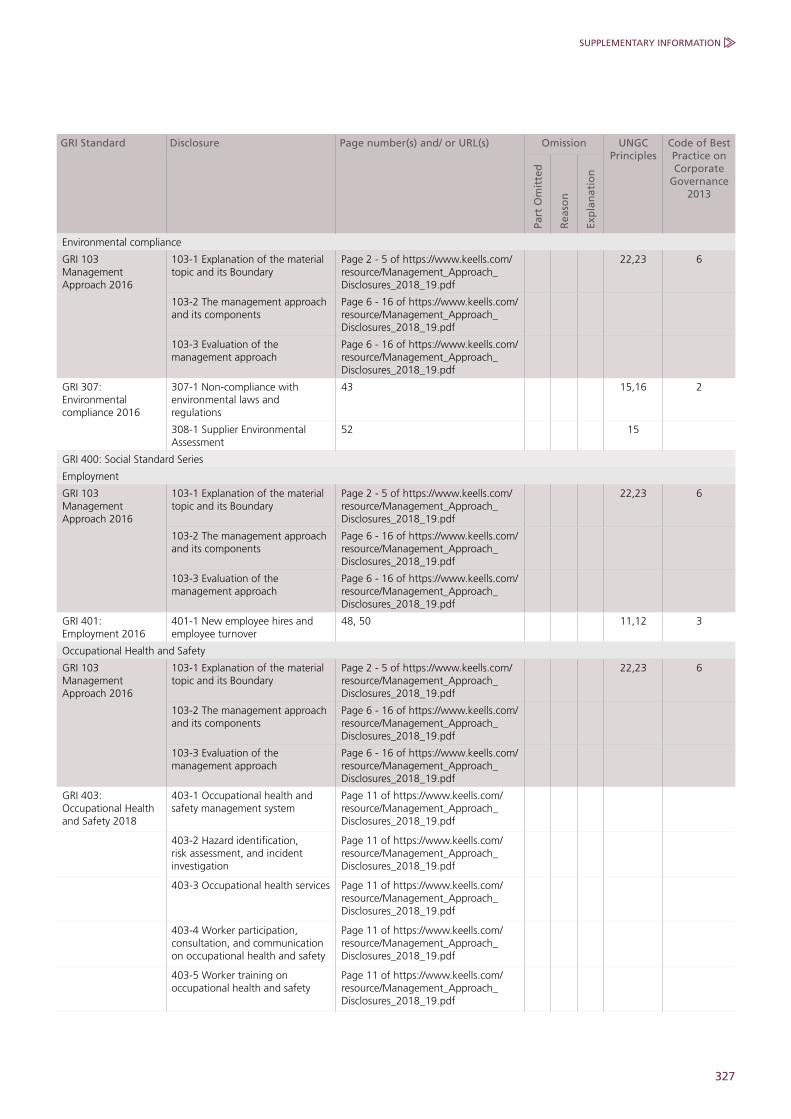
327
SUPPLEMENTARY INFORMATION
GRI Standard Disclosure Page number(s) and/ or URL(s) Omission UNGC Principles
Code of Best Practice on Corporate
Governance 2013
Part
Om
itte
d
Rea
son
Exp
lan
atio
n
Environmental compliance
GRI 103 Management Approach 2016
103-1 Explanation of the material topic and its Boundary
Page 2 - 5 of https://www.keells.com/resource/Management_Approach_Disclosures_2018_19.pdf
22,23 6
103-2 The management approach and its components
Page 6 - 16 of https://www.keells.com/resource/Management_Approach_Disclosures_2018_19.pdf
103-3 Evaluation of the management approach
Page 6 - 16 of https://www.keells.com/resource/Management_Approach_Disclosures_2018_19.pdf
GRI 307: Environmental compliance 2016
307-1 Non-compliance with environmental laws and regulations
43 15,16 2
308-1 Supplier Environmental Assessment
52 15
GRI 400: Social Standard Series
Employment
GRI 103 Management Approach 2016
103-1 Explanation of the material topic and its Boundary
Page 2 - 5 of https://www.keells.com/resource/Management_Approach_Disclosures_2018_19.pdf
22,23 6
103-2 The management approach and its components
Page 6 - 16 of https://www.keells.com/resource/Management_Approach_Disclosures_2018_19.pdf
103-3 Evaluation of the management approach
Page 6 - 16 of https://www.keells.com/resource/Management_Approach_Disclosures_2018_19.pdf
GRI 401: Employment 2016
401-1 New employee hires and employee turnover
48, 50 11,12 3
Occupational Health and Safety
GRI 103 Management Approach 2016
103-1 Explanation of the material topic and its Boundary
Page 2 - 5 of https://www.keells.com/resource/Management_Approach_Disclosures_2018_19.pdf
22,23 6
103-2 The management approach and its components
Page 6 - 16 of https://www.keells.com/resource/Management_Approach_Disclosures_2018_19.pdf
103-3 Evaluation of the management approach
Page 6 - 16 of https://www.keells.com/resource/Management_Approach_Disclosures_2018_19.pdf
GRI 403: Occupational Health and Safety 2018
403-1 Occupational health and safety management system
Page 11 of https://www.keells.com/resource/Management_Approach_Disclosures_2018_19.pdf
403-2 Hazard identification, risk assessment, and incident investigation
Page 11 of https://www.keells.com/resource/Management_Approach_Disclosures_2018_19.pdf
403-3 Occupational health services Page 11 of https://www.keells.com/resource/Management_Approach_Disclosures_2018_19.pdf
403-4 Worker participation, consultation, and communication on occupational health and safety
Page 11 of https://www.keells.com/resource/Management_Approach_Disclosures_2018_19.pdf
403-5 Worker training on occupational health and safety
Page 11 of https://www.keells.com/resource/Management_Approach_Disclosures_2018_19.pdf
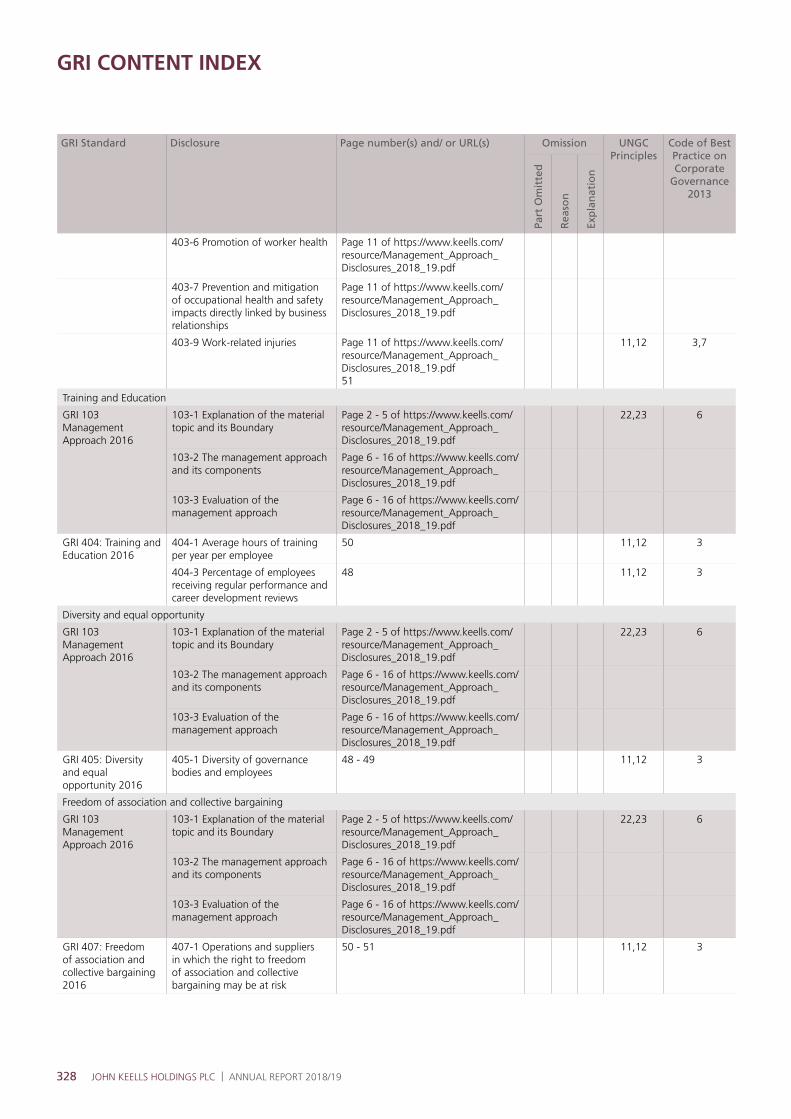
328 JOHN KEELLS HOLDINGS PLC | ANNUAL REPORT 2018/19
GRI CONTENT INDEX
GRI Standard Disclosure Page number(s) and/ or URL(s) Omission UNGC Principles
Code of Best Practice on Corporate
Governance 2013
Part
Om
itte
d
Rea
son
Exp
lan
atio
n
403-6 Promotion of worker health Page 11 of https://www.keells.com/resource/Management_Approach_Disclosures_2018_19.pdf
403-7 Prevention and mitigation of occupational health and safety impacts directly linked by business relationships
Page 11 of https://www.keells.com/resource/Management_Approach_Disclosures_2018_19.pdf
403-9 Work-related injuries Page 11 of https://www.keells.com/resource/Management_Approach_Disclosures_2018_19.pdf51
11,12 3,7
Training and Education
GRI 103 Management Approach 2016
103-1 Explanation of the material topic and its Boundary
Page 2 - 5 of https://www.keells.com/resource/Management_Approach_Disclosures_2018_19.pdf
22,23 6
103-2 The management approach and its components
Page 6 - 16 of https://www.keells.com/resource/Management_Approach_Disclosures_2018_19.pdf
103-3 Evaluation of the management approach
Page 6 - 16 of https://www.keells.com/resource/Management_Approach_Disclosures_2018_19.pdf
GRI 404: Training and Education 2016
404-1 Average hours of training per year per employee
50 11,12 3
404-3 Percentage of employees receiving regular performance and career development reviews
48 11,12 3
Diversity and equal opportunity
GRI 103 Management Approach 2016
103-1 Explanation of the material topic and its Boundary
Page 2 - 5 of https://www.keells.com/resource/Management_Approach_Disclosures_2018_19.pdf
22,23 6
103-2 The management approach and its components
Page 6 - 16 of https://www.keells.com/resource/Management_Approach_Disclosures_2018_19.pdf
103-3 Evaluation of the management approach
Page 6 - 16 of https://www.keells.com/resource/Management_Approach_Disclosures_2018_19.pdf
GRI 405: Diversity and equal opportunity 2016
405-1 Diversity of governance bodies and employees
48 - 49 11,12 3
Freedom of association and collective bargaining
GRI 103 Management Approach 2016
103-1 Explanation of the material topic and its Boundary
Page 2 - 5 of https://www.keells.com/resource/Management_Approach_Disclosures_2018_19.pdf
22,23 6
103-2 The management approach and its components
Page 6 - 16 of https://www.keells.com/resource/Management_Approach_Disclosures_2018_19.pdf
103-3 Evaluation of the management approach
Page 6 - 16 of https://www.keells.com/resource/Management_Approach_Disclosures_2018_19.pdf
GRI 407: Freedom of association and collective bargaining 2016
407-1 Operations and suppliers in which the right to freedom of association and collective bargaining may be at risk
50 - 51 11,12 3
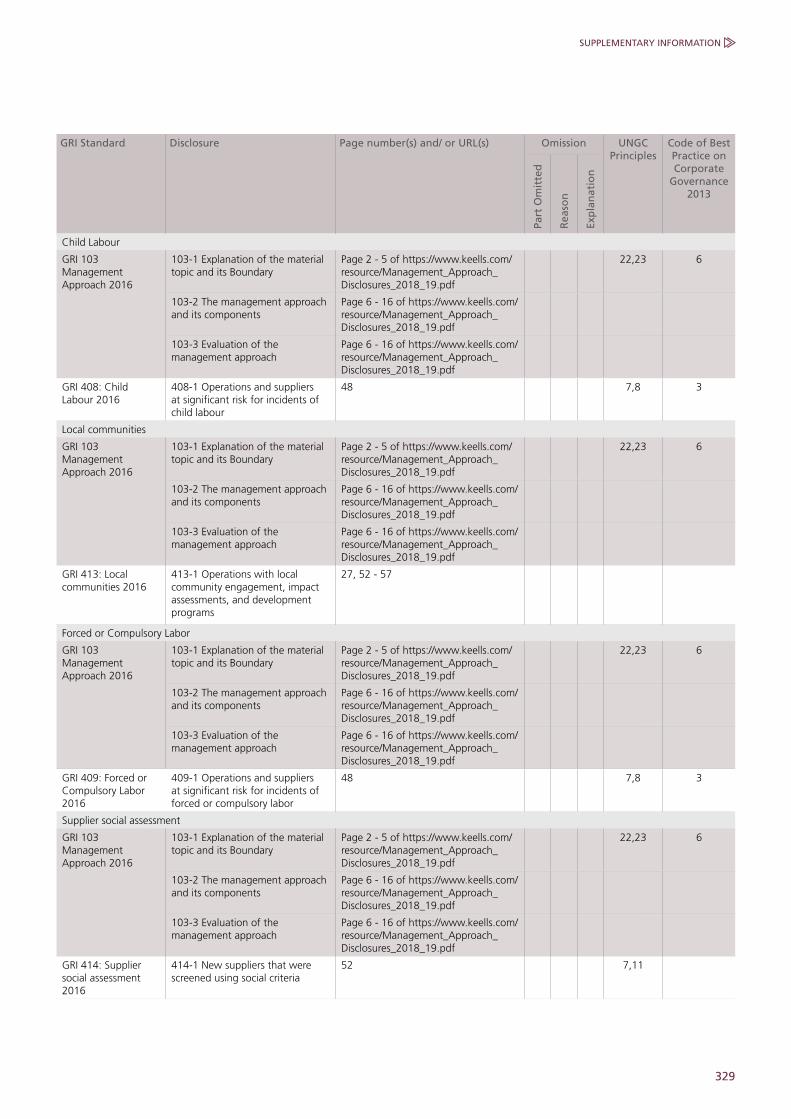
329
SUPPLEMENTARY INFORMATION
GRI Standard Disclosure Page number(s) and/ or URL(s) Omission UNGC Principles
Code of Best Practice on Corporate
Governance 2013
Part
Om
itte
d
Rea
son
Exp
lan
atio
n
Child Labour
GRI 103 Management Approach 2016
103-1 Explanation of the material topic and its Boundary
Page 2 - 5 of https://www.keells.com/resource/Management_Approach_Disclosures_2018_19.pdf
22,23 6
103-2 The management approach and its components
Page 6 - 16 of https://www.keells.com/resource/Management_Approach_Disclosures_2018_19.pdf
103-3 Evaluation of the management approach
Page 6 - 16 of https://www.keells.com/resource/Management_Approach_Disclosures_2018_19.pdf
GRI 408: Child Labour 2016
408-1 Operations and suppliers at significant risk for incidents of child labour
48 7,8 3
Local communities
GRI 103 Management Approach 2016
103-1 Explanation of the material topic and its Boundary
Page 2 - 5 of https://www.keells.com/resource/Management_Approach_Disclosures_2018_19.pdf
22,23 6
103-2 The management approach and its components
Page 6 - 16 of https://www.keells.com/resource/Management_Approach_Disclosures_2018_19.pdf
103-3 Evaluation of the management approach
Page 6 - 16 of https://www.keells.com/resource/Management_Approach_Disclosures_2018_19.pdf
GRI 413: Local communities 2016
413-1 Operations with local community engagement, impact assessments, and development programs
27, 52 - 57
Forced or Compulsory Labor
GRI 103 Management Approach 2016
103-1 Explanation of the material topic and its Boundary
Page 2 - 5 of https://www.keells.com/resource/Management_Approach_Disclosures_2018_19.pdf
22,23 6
103-2 The management approach and its components
Page 6 - 16 of https://www.keells.com/resource/Management_Approach_Disclosures_2018_19.pdf
103-3 Evaluation of the management approach
Page 6 - 16 of https://www.keells.com/resource/Management_Approach_Disclosures_2018_19.pdf
GRI 409: Forced or Compulsory Labor 2016
409-1 Operations and suppliers at significant risk for incidents of forced or compulsory labor
48 7,8 3
Supplier social assessment
GRI 103 Management Approach 2016
103-1 Explanation of the material topic and its Boundary
Page 2 - 5 of https://www.keells.com/resource/Management_Approach_Disclosures_2018_19.pdf
22,23 6
103-2 The management approach and its components
Page 6 - 16 of https://www.keells.com/resource/Management_Approach_Disclosures_2018_19.pdf
103-3 Evaluation of the management approach
Page 6 - 16 of https://www.keells.com/resource/Management_Approach_Disclosures_2018_19.pdf
GRI 414: Supplier social assessment 2016
414-1 New suppliers that were screened using social criteria
52 7,11
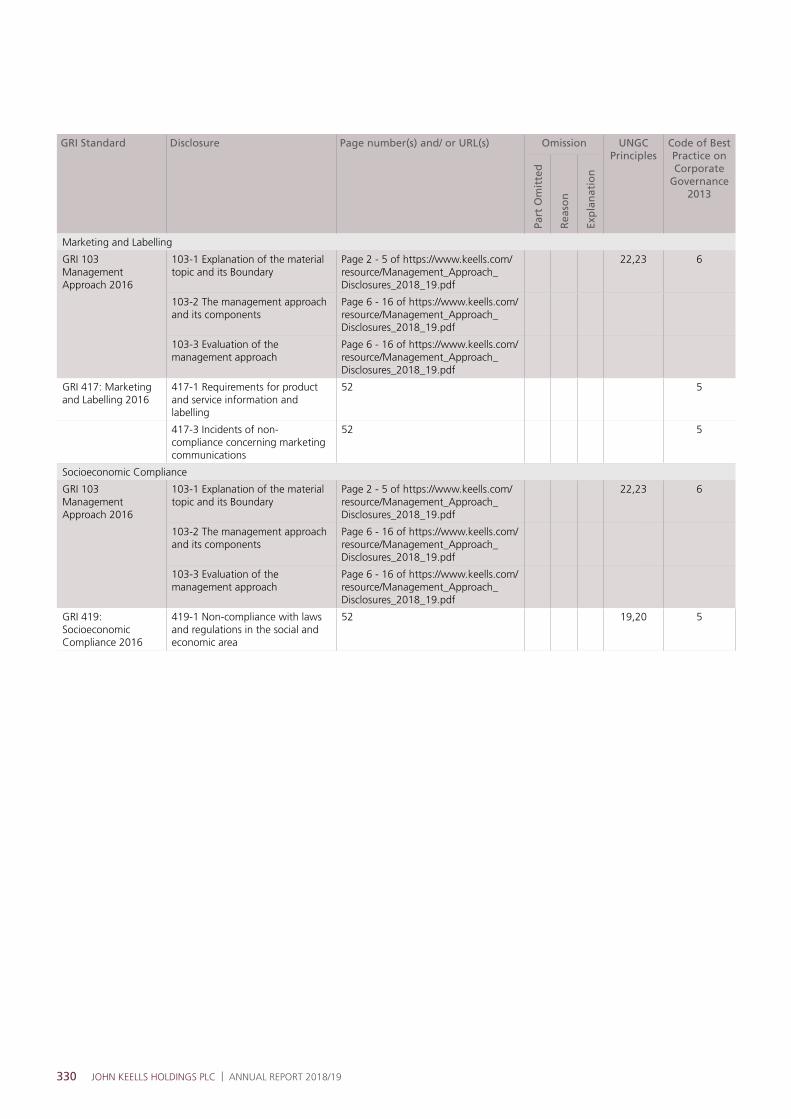
330 JOHN KEELLS HOLDINGS PLC | ANNUAL REPORT 2018/19
GRI Standard Disclosure Page number(s) and/ or URL(s) Omission UNGC Principles
Code of Best Practice on Corporate
Governance 2013
Part
Om
itte
d
Rea
son
Exp
lan
atio
n
Marketing and Labelling
GRI 103 Management Approach 2016
103-1 Explanation of the material topic and its Boundary
Page 2 - 5 of https://www.keells.com/resource/Management_Approach_Disclosures_2018_19.pdf
22,23 6
103-2 The management approach and its components
Page 6 - 16 of https://www.keells.com/resource/Management_Approach_Disclosures_2018_19.pdf
103-3 Evaluation of the management approach
Page 6 - 16 of https://www.keells.com/resource/Management_Approach_Disclosures_2018_19.pdf
GRI 417: Marketing and Labelling 2016
417-1 Requirements for product and service information and labelling
52 5
417-3 Incidents of non-compliance concerning marketing communications
52 5
Socioeconomic Compliance
GRI 103 Management Approach 2016
103-1 Explanation of the material topic and its Boundary
Page 2 - 5 of https://www.keells.com/resource/Management_Approach_Disclosures_2018_19.pdf
22,23 6
103-2 The management approach and its components
Page 6 - 16 of https://www.keells.com/resource/Management_Approach_Disclosures_2018_19.pdf
103-3 Evaluation of the management approach
Page 6 - 16 of https://www.keells.com/resource/Management_Approach_Disclosures_2018_19.pdf
GRI 419: Socioeconomic Compliance 2016
419-1 Non-compliance with laws and regulations in the social and economic area
52 19,20 5

331
SUPPLEMENTARY INFORMATION
NOTICE OF MEETING
Notice is hereby given that the Fortieth Annual General Meeting of John Keells Holdings PLC will be held on 28 June 2019 at 10:00 a.m. at The Auditorium (Ground Floor), The Ceylon Chamber of Commerce, 50, Navam Mawatha, Colombo 2.
The business to be brought before the meeting will be:
1. to read the notice convening the meeting.
2. to receive and consider the Annual Report and Financial Statements for the Financial Year ended 31 March 2019 with the Report of the Auditors thereon.
3. to re-elect as Director, Mr. J G A Cooray, who retires in terms of Article 84 of the Articles of Association of the Company. A brief profile of Mr. J G A Cooray is contained in the Board of Directors section of the Annual Report.
4. to re-elect as Director, Dr. S S H Wijayasuriya, who retires in terms of Article 84 of the Articles of Association of the Company. A brief profile of Dr. S S H Wijayasuriya is contained in the Board of Directors section of the Annual Report.
5. to re-elect as Director, Dr. R Coomaraswamy, who retires in terms of Article 91 of the Articles of Association of the Company. A brief profile of Dr. R Coomaraswamy is contained in the Board of Directors section of the Annual Report.
6. to re-appoint Auditors and to authorise the Directors to determine their remuneration.
7. to consider any other business of which due notice has been given in terms of the relevant laws and regulations.
By Order of the BoardJOHN KEELLS HOLDINGS PLC
Keells Consultants (Private) LimitedSecretaries24 May 2019
Notes:i. A member unable to attend is entitled
to appoint a Proxy to attend and vote in his/her place.
ii. A Proxy need not be a member of the Company.
iii. A member wishing to vote by Proxy at the Meeting may use the Proxy Form enclosed herein.
iv. In order to be valid, the completed Proxy Form must be lodged at the Registered Office of the Company not less than 48 hours before the meeting.
v. If a poll is demanded, a vote can be taken on a show of hands or by a poll. Each share is entitled to one vote. Votes can be cast in person, by proxy or corporate representatives. In the event an individual member and his/her proxy holder are both present at the meeting, only the member’s vote is counted. If the proxy holder’s appointor has indicated the manner of voting, only the appointor’s indication of the manner to vote will be used.
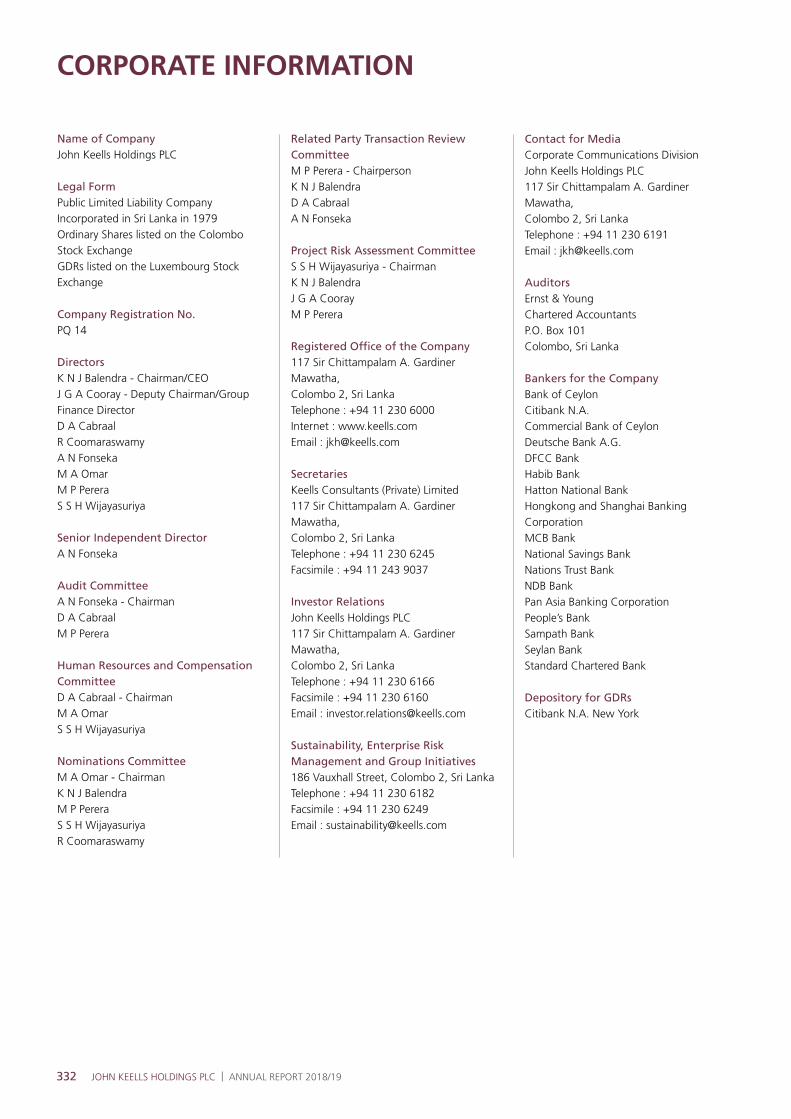
332 JOHN KEELLS HOLDINGS PLC | ANNUAL REPORT 2018/19
CORPORATE INFORMATION
Name of CompanyJohn Keells Holdings PLC
Legal FormPublic Limited Liability CompanyIncorporated in Sri Lanka in 1979Ordinary Shares listed on the Colombo Stock ExchangeGDRs listed on the Luxembourg Stock Exchange
Company Registration No.PQ 14
DirectorsK N J Balendra - Chairman/CEOJ G A Cooray - Deputy Chairman/Group Finance DirectorD A CabraalR CoomaraswamyA N FonsekaM A OmarM P PereraS S H Wijayasuriya
Senior Independent DirectorA N Fonseka
Audit CommitteeA N Fonseka - ChairmanD A CabraalM P Perera
Human Resources and Compensation CommitteeD A Cabraal - ChairmanM A OmarS S H Wijayasuriya
Nominations CommitteeM A Omar - ChairmanK N J BalendraM P PereraS S H WijayasuriyaR Coomaraswamy
Related Party Transaction Review CommitteeM P Perera - ChairpersonK N J BalendraD A CabraalA N Fonseka
Project Risk Assessment CommitteeS S H Wijayasuriya - ChairmanK N J BalendraJ G A CoorayM P Perera
Registered Office of the Company117 Sir Chittampalam A. Gardiner Mawatha,Colombo 2, Sri LankaTelephone : +94 11 230 6000Internet : www.keells.comEmail : [email protected]
SecretariesKeells Consultants (Private) Limited117 Sir Chittampalam A. Gardiner Mawatha,Colombo 2, Sri LankaTelephone : +94 11 230 6245Facsimile : +94 11 243 9037
Investor RelationsJohn Keells Holdings PLC117 Sir Chittampalam A. Gardiner Mawatha,Colombo 2, Sri LankaTelephone : +94 11 230 6166Facsimile : +94 11 230 6160Email : [email protected]
Sustainability, Enterprise Risk Management and Group Initiatives186 Vauxhall Street, Colombo 2, Sri LankaTelephone : +94 11 230 6182Facsimile : +94 11 230 6249Email : [email protected]
Contact for MediaCorporate Communications DivisionJohn Keells Holdings PLC117 Sir Chittampalam A. Gardiner Mawatha,Colombo 2, Sri LankaTelephone : +94 11 230 6191Email : [email protected]
AuditorsErnst & YoungChartered AccountantsP.O. Box 101Colombo, Sri Lanka
Bankers for the CompanyBank of CeylonCitibank N.A.Commercial Bank of CeylonDeutsche Bank A.G.DFCC BankHabib BankHatton National BankHongkong and Shanghai Banking CorporationMCB BankNational Savings BankNations Trust BankNDB BankPan Asia Banking CorporationPeople’s BankSampath BankSeylan BankStandard Chartered Bank
Depository for GDRsCitibank N.A. New York
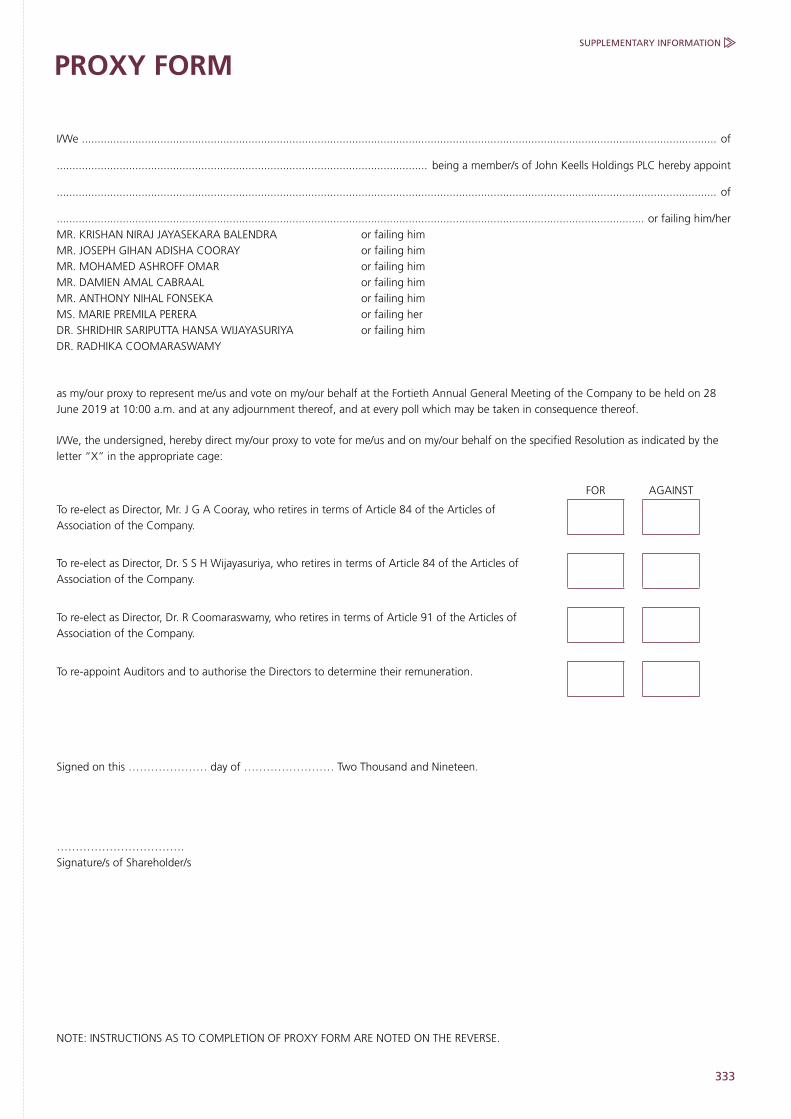
333
SUPPLEMENTARY INFORMATION
PROXY FORM
I/We .......................................................................................................................................................................................................... of
...................................................................................................................... being a member/s of John Keells Holdings PLC hereby appoint
.................................................................................................................................................................................................................. of
........................................................................................................................................................................................... or failing him/herMR. KRISHAN NIRAJ JAYASEKARA BALENDRA or failing himMR. JOSEPH GIHAN ADISHA COORAY or failing himMR. MOHAMED ASHROFF OMAR or failing himMR. DAMIEN AMAL CABRAAL or failing himMR. ANTHONY NIHAL FONSEKA or failing himMS. MARIE PREMILA PERERA or failing herDR. SHRIDHIR SARIPUTTA HANSA WIJAYASURIYA or failing himDR. RADHIKA COOMARASWAMY
as my/our proxy to represent me/us and vote on my/our behalf at the Fortieth Annual General Meeting of the Company to be held on 28 June 2019 at 10:00 a.m. and at any adjournment thereof, and at every poll which may be taken in consequence thereof.
I/We, the undersigned, hereby direct my/our proxy to vote for me/us and on my/our behalf on the specified Resolution as indicated by the letter “X” in the appropriate cage:
FOR AGAINST
To re-elect as Director, Mr. J G A Cooray, who retires in terms of Article 84 of the Articles of Association of the Company.
To re-elect as Director, Dr. S S H Wijayasuriya, who retires in terms of Article 84 of the Articles of Association of the Company.
To re-elect as Director, Dr. R Coomaraswamy, who retires in terms of Article 91 of the Articles of Association of the Company.
To re-appoint Auditors and to authorise the Directors to determine their remuneration.
Signed on this ………………… day of …………………… Two Thousand and Nineteen.
…………………………….Signature/s of Shareholder/s
NOTE: INSTRUCTIONS AS TO COMPLETION OF PROXY FORM ARE NOTED ON THE REVERSE.

334 JOHN KEELLS HOLDINGS PLC | ANNUAL REPORT 2018/19
INSTRUCTIONS AS TO COMPLETION OF PROXY
1. Please perfect the Form of Proxy by filling in legibly your full name and address, signing in the space provided and filling in the date of signature.
2. The completed Form of Proxy should be deposited at the Registered Office of the Company at No. 117, Sir Chittampalam A Gardiner Mawatha, Colombo 2, not later than 48 hours before the time appointed for the holding of the Meeting.
3. If the Form of Proxy is signed by an Attorney, the relevant Power of Attorney should accompany the completed Form of Proxy for registration, if such Power of Attorney has not already been registered with the Company.
4. If the appointor is a company or corporation, the Form of Proxy should be executed under its Common Seal or by a duly authorised officer of the company or corporation in accordance with its Articles of Association or Constitution.
5. If this Form of Proxy is returned without any indication of how the person appointed as Proxy shall vote, then the Proxy shall exercise his/her discretion as to how he/she votes or, whether or not he/she abstains from voting.
Please fill in the following details:
Name : ……………………………………………………………………………………
Address : ……………………………………………………………………………………
…………………………………………………………………………………….
…………………………………………………………………………………….
Jointly with : ……………………………………………………………………………………
Share Folio No. : ……………………………………………………………………………………

335
Notes

336 JOHN KEELLS HOLDINGS PLC | ANNUAL REPORT 2018/19

Designed & produced by
Digital Plates & Printing by Softwave Printing and Publishing (Pvt) LtdPhotography by Dhanush De Costa

www.keells.com