gold - data.daff.gov.audata.daff.gov.au/brs/data/warehouse/pe_abarebrs99000447/pr11497.pdf · ......
TRANSCRIPT

GOLDAUSTRALIA IN THE WORLD
MARKET
Authors
Chris Allen Taron Brearley Antony Clarke Julie Harman Peter Berry
ABARE Research Report 99.8

© Commonwealth of Australia 1999
This work is copyright. The Copyright Act 1968permits fair dealing forstudy, research, news reporting, criticism or review. Selected passages, tablesor diagrams may be reproduced for such purposes provided acknowledg-ment of the source is included. Major extracts or the entire document maynot be reproduced by any process without the written permission of theExecutive Director, ABARE.
ISSN 1037-8286ISBN 0 642 266 468
Allen, C., Brearley, T., Clarke, A., Harman, J. and Berry, P. 1999, Australiain the World Gold Market, ABARE Research Report 99.8, Canberra.
Australian Bureau of Agricultural and Resource EconomicsGPO Box 1563 Canberra 2601
Telephone +61 2 6272 2000 Facsimile +61 2 6272 2001Internet www.abare.gov.au
ABARE is a professionally independent government economic researchagency.
ABARE project 1527

Foreword
The future direction of the world gold market is of considerable importanceto both the Australian gold industry and the national economy. Gold is nowAustralia’s second largest commodity export, generating nearly $5 billionin annual export revenue and providing an estimated 15 000 direct and 49 000 indirect jobs throughout Australia.
Following substantial falls in world gold prices, ABARE was commissionedby the former Department of Primary Industries and Energy to examine theoutlook for the world gold market in detail, and to focus on other key factorslikely to influence the Australian gold industry over the medium term. Inaddition to developing a medium term outlook for the industry, some esti-mates of the sensitivity of the Australian industry to changes in gold priceshave been developed.
Domestic and international issues — including the nature and scope of bar-riers to international gold trade — that could constrain the Australian goldindustry have been attracting the close attention of policy makers. The scopefor enhancing returns to Australian gold producers by liberalising interna-tional trade in gold and jewellery is examined in this report. In addition, esti-mates of the potential benefits to Australia from removing the main tradebarriers in world markets are provided.
BRIAN S. FISHER
Executive Director
June 1999
iiiAustralia in the world gold market

Acknowledgments
Funding for this project was provided by the Minerals Development Branch,Department of Industry, Science and Resources.
The authors would like to thank their ABARE colleagues who assisted inthe production of this report, particularly Tom Waring for his input to theorganisation and drafting of the report, Nico Klijn for his help with the tariffmodeling and Siobhan Davies for the background analysis of domestic policyissues and exploration trends. Sally Thorpe and Roger Rose also providedhelpful referee comments and suggestions.
The authors also wish to acknowledge officers of the Department of ForeignAffairs and Trade in the main gold importing countries, and the World GoldCouncil who provided up-to-date details on barriers to gold trade. Thanksare also provided to Kamal Naqvi of Macquarie Equities for providing in-sights on the Indian gold market, and to Jessica Cross of Virtual Gold forproviding historical data on the gold leasing market. The authors are alsograteful to the Australian gold producers who provided information abouttheir operations.
iv ABARE research report 99.8

Contents
Summary 1
1 Introduction 5
2 Gold market outlook 7Historical perspective 7Market overview 8Specific market influences 13
3 Australian gold industry outlook 26Industry background 26Factors influencing Australian production 30Australian gold supply projections 39
4 International barriers to gold trade 43Why gold trade barriers exist 43Trade barriers and recent reforms 44Benefits of world gold trade liberalisation 49Other distortions in the world gold market 51Australia’s perspective 52
AppendixesA Projecting Australian gold supply in the medium term 56B Illustrative model – effect on the world gold price of
removing tariffs on gold jewellery imports 69
References 77
vAustralia in the world gold market

Boxes1 Gold stocks and flows 92 Key official sector events with implications for the gold
market 183 Official sector loans and producer hedging 224 Financial liberalisation and gold bullion 46
Figures1 US dollar gold prices 72 Trends in world gold holdings 83 Gold consumption and the mine supply ‘gap’ 104 Net bullion investment and the gold price 155 Composition of official sector gold reserves 176 Net gold sales from the official sector 207 World borrowing and lending of gold 218 Australian gold production, exploration and price 269 World gold production, by region 28
10 Australian exports of gold, by destination, 1996 and 1997 2811 Distribution of major primary gold producers in Australia,
1997 2912 Gold cash margins in Australia 3013 Australian one year forward gold prices 3114 Size and cost structure of the Australian gold industry, 1997 3215 Overseas exploration expenditure by Australian companies 3616 Trends in global gold exploration 3617 Rates of return and effective tax rates for gold mining 3818 Australian gold production – short term 4019 Medium term projections of Australian gold production 4220 Indian gold imports and price premiums 4721 Australian gold production and capital stock 5822 Impact elasticity of a change in the Australian dollar
gold price 6223 Actual and fitted values – production 6524 Actual and fitted values – capital investment 6625 Actual and fitted values – exploration expenditure 67
vi ABARE research report 99.8

Tables1 World gold outlook 112 Gold consumption (per person) in selected countries 133 Economic impacts of Australian gold mining, 1997 294 Major new projects/expansions, 1999–2000 405 Projections of Australian gold production 426 Major international gold import tariffs 457 Estimated changes in the world gold price from the removal
of world gold jewellery import tariffs 548 Model data and notation 589 Diagnostic tests – production 65
10 Diagnostic tests – capital investment 6711 Diagnostic tests – exploration expenditure 6812 Model’s parameter estimates 7313 Model’s initial market conditions 7414 Change in domestic jewellery consumption and prices
following tariff removal 75
viiAustralia in the world gold market

Summary
The global conditions that produced strong growth in the Australian goldindustry during the 1980s have substantially changed. Significantly differentinvestment conditions now face the industry. Rapid growth in the Australiangold sector during the 1980s followed historically unprecedented rises in theprice of gold during the 1970s, and important technological advances in goldore processing in the early 1980s.
A number of factors contributed to the sharp rise in gold prices during the1970s. Most important was the global ‘deregulation’ of the gold market:central banks stopped fixing the price (the gold price was fixed at US$35 anounce from 1934 to 1971) and restrictions on private individuals trading inbullion were largely removed. This freeing up of private gold trade, togetherwith high levels of inflation, led to large increases in private investmentdemand. On the supply side, world mine production began to respond to thehigher prices. Despite gold’s reduced monetary role, central banks generallymaintained their large reserve holdings, allaying fears in the market that theycould become a major source of supply.
After the price increases of the 1970s real prices assumed a declining trendand the structure of the market gradually changed. Jewellery manufacturehas grown to become the overwhelmingly dominant component of golddemand, now accounting for around 90 per cent of annual net gold use. Stronggrowth in jewellery demand and moderate mine production growth haveresulted in an expanding gap between total gold use and mine production —by itself suggesting upward pressure on prices. However, the progressivedecline in real prices in the market largely reflects increasing mine produc-tivity and expanding sales of aboveground gold stocks (from both privateand official sources) to meet this expanding production/use deficit.
The factors underlying the evolution of the gold market over the past twodecades appear set to continue over the medium term. Strong growth injewellery demand over the medium term will continue to reflect rising in-comes associated with sustained economic growth. Mine production contin-ues to be important in the total world supply, but with productivity gainscontinuing, production is expected to respond slowly to easing real prices.As a result, changes in mine production are not expected to be an important
1Australia in the world gold market

influence on the gold price over the medium term. Increasing supply fromcentral banks (through both sales and loans) and private disinvestment areexpected to remain the key supply side price influences into the next decade.
Divestment of official sector gold reserves (through both sales and lendingby central banks) has been a feature of the market over the past two decades,but has accelerated in recent years. Easing real prices for gold, and the avail-ability of higher returns with comparatively low risks from holding basketsof major international currencies, underpin this trend in developed countries.Moreover, recent developments in Europe have resulted in large volumes ofcentral bank reserves that would appear to be ‘earmarked’ for disposal overthe medium and longer term. The likelihood of continued high levels of offi-cial sector sales and low inflation over the medium term underpins ABARE’sassessment that real gold prices will continue their easing trend over mostof the outlook period to 2005.
An important objective in this study was to examine the implications of thisworld market outlook and other factors for the Australian gold industry overthe medium term. In addition to expected world market outcomes, a numberof nonprice factors may affect the Australian industry over the medium term.Qualitative examination of such factors in this study found that they are likelyto be secondary to price in determining the size of the Australian industryover the medium term.
Advances in gold mining and exploration technology have in the past andmay again in the future lead to input cost reductions over the medium term.However, major technological changes are inherently difficult to forecast.Assessments of current research into gold processing suggest that steadyrefinements (resulting in gradual cost reductions) are more likely than majorchanges to the cost structure of the industry over the medium term. Offsettingsuch cost reductions, to some degree, is the likelihood of the average depthof gold mines and the proportion of sulfide ore continuing to increase, therebyraising costs. Other factors influencing the industry in the shorter term includethe hedging behavior of the industry, and the ability of some high cost produ-cers to mine higher grade ore in response to lower prices, tending to increaseoutput in the medium term.
Exploration effort is an important global issue affecting the outlook for theAustralian industry. The risk adjusted returns to gold exploration and miningin Australia compared with available returns in gold exploration investmentelsewhere are under constant review by Australian and overseas companies
2 ABARE research report 99.8

alike. Examination of trends in global exploration suggests that the increas-ing attractiveness of emerging gold producing regions (chiefly South Americaand Africa) has been the major factor behind growing offshore gold invest-ment by gold companies in Australia, the United States and Canada. Thistrend may also reflect the increasing costs and risks of gaining access to landfor exploration and mining in these developed countries, arising from exten-sions to environmental protection and recognition of native title rights.
Although a range of factors will continue to influence investment in Aus-tralia’s gold industry, gold prices are expected to be the major determinantover the medium term. To gain insight into the sensitivity of the Australiangold industry to changes in prices over the medium term, ABARE developedan econometric model of Australian gold supply. This model is based onaggregate historical relationships between gold prices, exploration expend-itures, capital investment in gold mining and gold output. It also incorpo-rates an estimate of the rates at which a new gold processing technology hasbeen adopted in Australia, because this process had a significant effect onindustry output. To develop shorter term industry production forecasts,ABARE undertook a survey of existing gold mines and major planned gold projects.
Both the shorter term surveying and econometric modeling of the Australiangold industry found that Australian gold production is reasonably insensi-tive to changes in the gold price over the shorter term, but that sustainedchanges in the gold price have a substantial effect on production over themedium to longer term. Production in 2010 is projected to be 246 tonnes —around 20 per cent below production in 1998. While major new discoveriesand/or major increases in efficiency may yet sustain output, this projectionlargely reflects the expected continuation of uncertainty in the world marketassociated with the activities of central banks, and industry/investor responsesto the 11 per cent fall in the Australian dollar gold price between 1994 and1998, and a projected further reduction in (nominal) domestic prices of around 18 per cent between 1998 and 2010.
As gold increasingly becomes a widely traded consumer product, the imped-iments to that trade become increasingly important issues for major export-ing countries such as Australia. An important objective in this report is toexamine the potential benefits to Australia from lowering barriers to inter-national gold trade, an issue that the World Gold Council — an organisationrepresenting gold producers worldwide — has raised in the past.
3Australia in the world gold market

Despite gold having one of the more sophisticated commodity markets inthe world, there are a number of restrictions on gold and jewellery trade invarious countries. There are essentially two types of restrictions on inter-national gold trade. First, some countries restrict imports of gold bullion tomaintain additional control over domestic money supply and exchange rates.However, these types of restrictions are not widespread, with most majoreconomies having deregulated their foreign exchange and capital markets.Moreover, as deregulation of foreign exchange and capital markets proceedsaround the world, such restrictions are expected to be progressively removed.
The second major type of gold trade barrier is import restrictions on manufac-tured gold products (mainly jewellery). These are designed to protect domes-tic jewellery manufacturers from world competition. Such restrictions also tendto function as de facto ‘luxury’ taxes on expensive (gold jewellery) imports.
Removal of these barriers to gold trade would produce net economic bene-fits worldwide for all the usual reasons. Liberalisation would enable con-sumers in previously restricted markets to purchase additional gold andjewellery at lower prices, thereby boosting global gold demand. In addition,resources used in protected mining and jewellery manufacturing industriescould be redirected to other more productive uses. Producers of jewelleryand gold in Australia (and throughout the world) would benefit from beingable to provide additional gold to these markets at higher prices.
Although reducing barriers to world gold trade is clearly a worthwhile policyobjective for a major producing country such as Australia, the size of thepotential benefits to gold and jewellery producers may be expected to belimited by the extent to which smuggling currently operates in restrictedmarkets. Another phenomenon that will tend to limit the gains from liberal-isation is the very low value added on jewellery manufacture in some marketsin combination with domestic competition in such manufacturing; this tendsto reduce the effect of tariffs on domestic prices.
ABARE developed an illustrative model of the world gold and jewellerymarket to estimate changes in world gold production and prices that wouldresult from the simultaneous removal of all identified gold jewellery tariffs.It is estimated that removal of all identified import tariffs would result inworld prices increasing by 2–5 per cent, and Australian gold productionincreasing by 4–12 per cent over the long term, other things unchanged.Compared with current levels, this would translate to an additional $230–750million a year in export revenues.
4 ABARE research report 99.8

Introduction
The Australian gold industry has expanded dramatically since 1980. The realvalue (in 1998 dollars) of gold exports increased from $230 million in 1980to $4.0 billion in 1990 and $7.6 billion in 1998. This growth followed higherreal prices of gold in the early 1980s and the development of new gold process-ing technologies (carbon-in-pulp and carbon-in-leach cyanide based process-ing), which increased returns to gold exploration and mining in Australia.The rise in export value also reflects the growing availability of low interestgold loans to Australian producers from central banks since the mid-1980s.
Gold was ranked as Australia’s second largest export sector in 1997-98,accounting for around 11 per cent of Australia’s total commodity exports.The sector also generates significant employment and income throughoutAustralia, accounting for an estimated 15 000 direct and 49 000 indirect jobsin 1997 (ABARE estimate based on Department of Minerals and Energy1997 and Australian Bureau of Statistics 1998b). These benefits generatedby the industry are particularly important to regional areas, where most goldmining operations are located.
However, since the widespread application of new gold processing tech-nologies to Australia during the 1980s, and the introduction of corporatetaxation in 1991, the growth of the Australian gold sector has become increas-ingly affected by world gold prices. The 27 per cent fall in the US dollargold price from January 1996 to January 1998, followed by continuing lowprices, has led to uncertainty about the future direction of the industry —and the wider implications for Australia — if gold prices remain low overthe medium term. The first changes have already occurred, with Australiangold exploration expenditure in 1997-98 seeming to show the first majordownturn for eight years.
As part of the government response to these changes, the former Departmentof Primary Industries and Energy commissioned ABARE to report on keyeconomic factors influencing the outlook for the Australian gold sector overthe medium term. A second requirement was for ABARE to examine thescope for enhancing export markets and returns available to Australian goldproducers through the liberalisation of existing barriers to international goldand jewellery trade.
5
1
Australia in the world gold market

An important objective in this study is therefore to provide a medium termoutlook for both the world gold market and the Australian gold industry. Anoverview of key world gold market influences and recent trends, and mediumterm (to 2005) world gold market projections are presented in chapter 2.Factors influencing Australian gold production and medium term Australiangold supply projections are provided in chapter 3. A simple model of Aus-tralian gold production was developed to examine the sensitivity of futurelevels of Australian gold production to a range of world gold prices, and thushelp the development of medium term projections of Australian gold supply.
Recent attention has focused on barriers to international gold trade (Bannock,Doran and Turnbull 1997). Such barriers may be expected to lower aggre-gate gold demand and thus world prices. There has been no economic analy-sis of the potential effect of international gold trade liberalisation on worldconsumption and the gold price (and thus of the benefits to gold producersworldwide). The nature and extent of impediments to trade, and their impacton global gold trade and export opportunities for Australia, are examined inchapter 4. ABARE constructed an illustrative model of the world gold andjewellery markets to examine the sensitivity of world gold prices to tradeliberalisation, alongside assumptions about the behavior of central banksand private investors.
6 ABARE research report 99.8

Gold market outlook
Historical perspectiveGold is traded globally in relatively unrestricted and competitive markets.However, governments have controlled world gold trade for much of thetwentieth century because gold underpinned mechanisms of internationaltrade. Gold remained linked to the world’s system of international trade until1973 when the major currencies were floated and their link to gold removedfollowing the breakdown of the Bretton Woods System. Reflecting the periodof gold market regulation, the world gold price remained at US$35 an ouncebetween 1934 and 1971.
Following deregulation of the world gold market in the early 1970s, many(mainly developed) countries progressively lifted restrictions on private goldownership. This freeing up of private gold trade, combined with high levelsof inflation, led to rapid growth in gold demand. The apparent ‘freezing’ ofofficial sector reserves increased confidence that the official sector wouldnot become a major source of supply. As a result, gold prices increasedsharply — up from US$42 an ounce in 1973 to over US$600 an ounce in1980 (figure 1).
Average annual gold prices have followed a downward trend since 1980,easing to US$294 an ounce in 1998 (figure 1). This trend reflects gradual
7
2
Australia in the world gold market
US dollar gold prices1
1969 1975 1981 1987 1993 1999 2005
Real (In 1998 dollars)
NominalUS$/oz
600
400
200
800
1000
1200

structural change in the market: on the demand side, the dominance ofjewellery and industrial uses of gold is growing, while on the supply side,substantial gold holdings by central banks and private investors and steadyreductions in average gold production costs are becoming important influ-ences.
Market overview
Recent trendsThe year 1980 is a useful point from which to examine the ‘modern’ goldmarket and apparent trends in the structure of this market. Holdings of goldby the official sector (largely in the form of gold bars) have declined modestlysince that year, while gold use in jewellery fabrication has increased signif-icantly (figure 2). More recently, gold holdings by private investors havealso begun to decline.
An explanation of the different categories of gold stocks, and their influenceon annual flows of gold supply and demand, is provided in box 1.
Declining levels of gold stocks held by investors and the official sector since1980 largely reflect the progressive liberalisation and increased sophistica-tion of world financial markets and, subsequently, lower incentives forgovernments to hold gold as a reserve asset. More recently, this trend hasalso been a response to the associated steady decline in world inflation(Warwick-Ching 1993).
8 ABARE research report 99.8
Trends in world gold holdings2
1980 1983 1986 1989 1992 1995 1998
kt
50
25
75
100
125Other fabricationJewelleryPrivate investment (bullion)Official sector (bullion)
Source: ABARE estimates based on data from Gold Fields Minerals Services (1998), International Monetary Fund (1998) and Warwick-Ching (1993)
9Australia in the world gold market
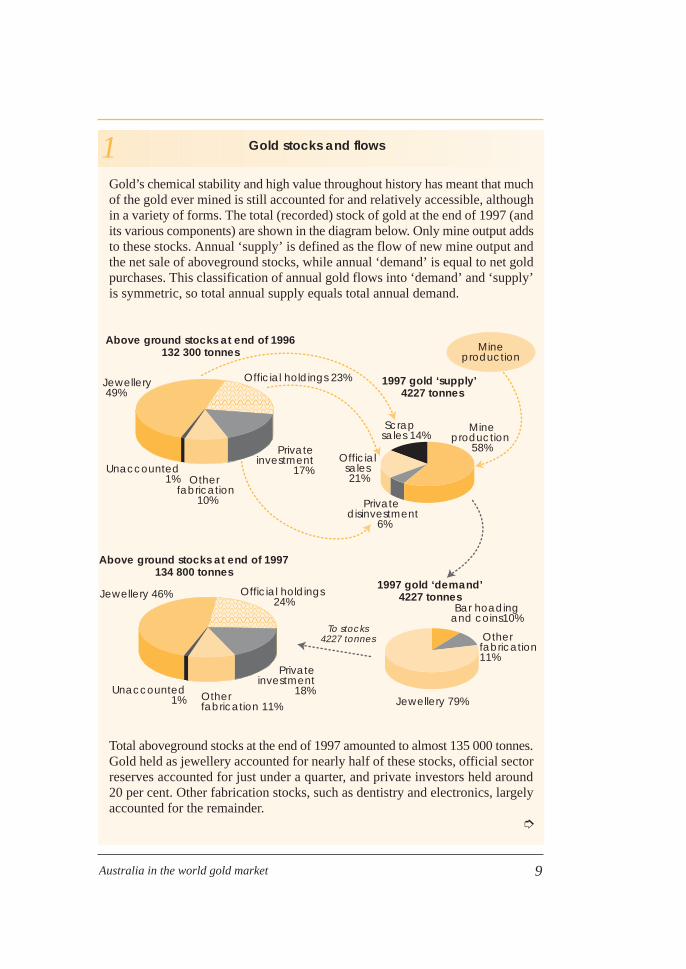
Gold’s chemical stability and high value throughout history has meant that muchof the gold ever mined is still accounted for and relatively accessible, althoughin a variety of forms. The total (recorded) stock of gold at the end of 1997 (andits various components) are shown in the diagram below. Only mine output addsto these stocks. Annual ‘supply’ is defined as the flow of new mine output andthe net sale of aboveground stocks, while annual ‘demand’ is equal to net goldpurchases. This classification of annual gold flows into ‘demand’ and ‘supply’is symmetric, so total annual supply equals total annual demand.
Total aboveground stocks at the end of 1997 amounted to almost 135 000 tonnes.Gold held as jewellery accounted for nearly half of these stocks, official sectorreserves accounted for just under a quarter, and private investors held around20 per cent. Other fabrication stocks, such as dentistry and electronics, largelyaccounted for the remainder.
➮
Official holdings 23%
Private investment
17%
Private investment
18%
Other fabrication
10%
Unaccounted1%
Above ground stocks at end of 1996132 300 tonnes
Above ground stocks at end of 1997134 800 tonnes
Jewellery 46% Official holdings 24%
To stocks4227 tonnes
Other fabrication 11%
Unaccounted1%
Mineproduction
58%
Mineproduction
Private disinvestment
6%
Official sales 21%
Scrap sales 14%
Bar hoading and coins10%
Other fabrication11%
Jewellery 79%
��������yyyyyyyy
Jewellery 49%
����������yyyyyyyyyy
1997 gold ‘demand’4227 tonnes
1997 gold ‘supply’ 4227 tonnes
1 Gold stocks and flows

On the other hand, growth in jewellery demand largely reflects growingpersonal disposable incomes, particularly within developing regions whichtraditionally have high cultural affinities for gold (see Lee 1997). This growthalso reflects progressive gold trade liberalisation (particularly in developingcountries), which has allowed the prospect of owning gold to reach anexpanding number of people, while also bringing domestic gold prices inthese regions closer to the world price. (Chapter 5 contains a detailed over-view of the trend to greater gold trade liberalisation.)
The effect of these trends on the world gold demand–supply balance can begauged from the growing gap between mine supply and total consumption(figure 3). Given the rapid growth in jewellery consumption, world gold
10 ABARE research report 99.8
The ‘mobility’ of gold stocks differs considerably. Stocks of gold held in theform of bullion, such as those held by central banks and private investors, arethe most ‘mobile’ because they can be easily released onto the gold market.Moreover, with the existence of forward markets for gold, the bullion does notnecessarily have to be physically traded. By comparison, stocks of gold held asjewellery are less mobile, as a result of the value added and personal valuesattached to such items, and the costs of recycling jewellery into gold forms thatare tradable in the market. Finally, the least mobile stocks are gold used in otherproducts (such as electronics or dentistry) because there are substantial costsand difficulties with recovery and recycling.
Source: Gold Fields Minerals Services (1998)
Gold consumption and the mine supply ‘gap’3
1987 1990 1993 1996 1999 2002 2005
Total consumption
Mine production
Private disinvestment,scrap and producer
hedging Official sales
t
3000
2000
1000
4000
Source: Historical data from Gold Fields Minerals Services (1998)
1 Gold stocks and flows Continued

consumption over the period 1980–98 increased faster than world gold mineproduction. This implied upward pressure on prices. However, the declinein real gold prices since 1980 suggests that the negative price effect (andassociated expectations) of sales of gold by the official sector and privateinvestors more than offset the positive price influence from strong jewellerydemand.
Medium term outlookThe global macroeconomic assumptions likely to affect the outlook for goldare provided in table 1. In the short term, world economic growth is assumedto decline from a recent high of 4.2 per cent in 1997 to 2.2 per cent in 1999.Over the medium term, world economic growth is assumed to strengthen toaverage 3.4 per cent a year between 2002 and 2005.
11Australia in the world gold market
1 World gold outlook
Unit 1997 1998p 1999 f 2000 z 2001 z 2002 z 2003 z 2004 z 2005 z
Net gold salesMine production t 2 480 2 555 2 560 2 568 2 577 2 577 2 564 2 538 2 508Official sector t 376 412 300 450 600 650 800 900 1 000Scrap t 629 1 098 786 682 753 786 816 841 866Other a t 742 58 215 359 249 300 245 251 263
Net gold purchasesJewellery t 3 342 3 145 3 098 3 272 3 418 3 547 3 658 3 763 3 869Other fabricated
products b t 563 564 574 575 575 576 577 577 578Bullion c t 323 415 190 212 185 190 190 190 190Total sales/
purchases t 4 228 4 123 3 862 4 058 4 178 4 313 4 424 4 530 4 636
Price– nominal US$/oz 331 294 285 285 280 280 280 280 280– real d US$/oz 343 300 285 279 267 259 252 244 237
World growth % 4.2 2.5 2.2 2.9 3.2 3.4 3.4 3.4 3.4
US inflation % 2.4 1.6 2.0 2.0 2.5 3.0 3.0 3.0 3.0
a Includes supply from forward sales, private disinvestment, option hedging and gold loans. b Includes gold used in electronics, dentistry, official coins and medals. c Includes net investmentthrough the physical and paper markets, the repayment of gold loans and net official sector purchases.d In 1999 US dollars. p Preliminary. f ABARE forecast. z ABARE projection.Sources: Gold Fields Minerals Services; ABARE

The changing patterns of gold holding and consumption behavior whichunderpin the easing real price trend since 1980 are expected to continue inthe medium term. (A detailed outlook for the main individual componentsof gold supply and demand are provided in the next section.) To summarise,while the easing trend in real prices is expected to continue over the mediumterm, three important market influences are expected to mitigate substantialreal price falls.
First, the official sectors in developed countries collectively face strong incen-tives to control the rate at which their extensive holdings of monetary goldare sold and replaced with higher yielding alternative reserve assets. Theseincentives stem from the requirements for central banks to maintain inter-national financial stability, and from the prospect of rapid disposal erodingthe prices received and therefore the value of remaining holdings.
Second, consumption of gold for jewellery is expected to continue growingstrongly, in response to lower gold prices and rising incomes in many devel-oping countries that have strong cultural affinities for gold jewellery (notwith-standing the short term financial and economic disruption in Asia).
Third, downward pressure on prices will be moderated to the extent that lowerprices slow the growth of world gold mine output. However, currency depre-ciations in some major gold producing countries and forward sales of gold,together with the gold mining industry’s cost reductions in response to lowerprices, will tend to slow the rate of downward mine supply adjustment.
Overall, a fairly stable flow of mine production, combined with increasingvolumes from official and investment sources, is expected to readily meetforecast strong growth in world demand for gold. However, this outlook ispredicated on substantial and increasing net sales from aboveground sources,particularly from the central banks. For example, ABARE’s projections envis-age net sales by central banks doubling over the next four years, to 800 tonnesa year. A slower rate of disposal, other things being equal, would tend toexert upward pressure on prices.
Periodic market imbalances and shifts in sentiment are likely, resulting inshort term price volatility, but the easing trend in real prices of the past twodecades is expected to be maintained. The real gold price is projected toaverage US$237 an ounce (in 1999 dollars) in 2005, down from US$343 anounce in 1997 and US$300 an ounce in 1998 (table 1).
12 ABARE research report 99.8

13Australia in the world gold market
Specific market influences
The projection of easing real prices is based on expectations that the broadtrends in world gold supply and demand since 1980 will continue over themedium term. The analysis underlying this expectation is detailed below forthe various components of gold supply and demand.
Fabrication demandJewellery fabrication accounts for by far the largest proportion of total worldgold consumption: it comprised around 80 per cent in 1997, up from 56 percent a decade earlier. Jewellery consumption increased at an average annualrate of just over 8 per cent over the past decade. The rapid expansion of therole of the jewellery industry as the dominant user of gold (figures 2 and 3)reflects:
• strong income growth in countries that have high cultural affinities for gold;
• falling real domestic gold prices; and
• the use of gold by consumers as a basic store of value, particularly indeveloping countries.
Other fabrication demand includes the use of gold in electronics, coins andmedals, and dentistry. Combined, these industries used an average 500 tonnesof gold a year over the past decade.However, within this category, theuse of gold in electronics has re-mained fairly stable (at around 200tonnes a year) whereas gold use hasfallen in coin and medal productionand increased in dentistry.
Given differing cultural affinities forgold, income levels, and gold andfinancial market regulations acrosscountries, gold consumption perperson can vary quite significantlybetween countries. Gold consump-tion per person in 1997, for exam-ple, was just 1 gram in the UnitedStates but was 8.2 grams in Italy(table 2).
2 Gold consumption (per person)in selected countries
1985 1990 1995 1997
g g g g
Brazil 0.1 0.1 0.2 0.3China na 0.0 0.2 0.3Egypt 1.2 1.3 1.0 1.2Germany 0.7 1.0 0.9 1.0India 0.2 0.3 0.5 0.8Indonesia 0.2 0.5 0.7 0.7Italy 4.6 6.9 8.0 8.2Turkey 1.5 2.4 2.0 2.5United States 0.8 0.9 0.9 1.0
na Not applicable.Sources: Gold Fields Minerals Services (1998);International Monetary Fund (1998); ABARE.

Fabrication consumption is projected to continue rising to 2005, at an annualaverage rate of 2.6 per cent (table 1). Most of this growth in consumption isexpected as a result of a continuation of recent growth in India and the MiddleEast and, later in the outlook period, growth in a recovering East Asian andSouth East Asia. Consumption in these regions is expected to continueexpanding as incomes grow, particularly if the gold jewellery market is furtherliberalised — such as India’s easing of gold import restrictions at the begin-ning of 1997. (Chapter 5 contains a detailed discussion of gold market liber-alisation and the policy implications for Australia.)
However, currency depreciations in some East Asian and South East Asiancountries have had the effect of increasing the domestic currency prices ofgold. This effect, together with associated lower income growth, is expectedto continue to constrain demand for gold in this region in the first half of theoutlook period. An assumed steady recovery in these economies in the secondhalf of the outlook period, along with the stabilisation of their currencies,will be positive for gold demand.
Investment demand‘Investment demand’ is defined here as net purchases of gold bullion throughboth the physical and paper markets. Purchases of official gold coins andsome jewellery can clearly have investment dimensions, but these productsare not nearly as mobile as bullion because they have intrinsic value (usuallyabove the value of their gold content).
Given that gold bullion is highly mobile, levels of net investment (net bullionpurchases) or disinvestment (net bullion sales) are highly sensitive to changesin the gold price, the strength of the share market, changes in the value ofkey currencies and levels of inflation. Thus levels of bullion investment havefluctuated considerably from year to year. There was no apparent trend inlevels of net investment for 1980–98, although price sometimes appears tohave been linked with levels of such investment (figure 4).
The historical fluctuations in levels of bullion investment suggest that netinvestment demand serves to accentuate changes in the gold price broughtabout through other more fundamental influences, such as changes in levelsof jewellery demand for levels of official sector sales. Thus investmentdemand is not expected to be a major influence on the fundamental trend ingold prices over the medium term. If anything, investment demand isexpected to be a slight net negative influence on the underlying trend in the
14 ABARE research report 99.8

gold price over the outlook period. The assumption of slightly declininginvestment demand is based on the likelihood of low global inflation andinvestor uncertainty about levels of official sales of gold over the mediumterm.
Mine productionThe largest producers of gold are South Africa, the United States, Australia,Canada and China. Over the past decade, these five countries accounted for60–65 per cent of total world gold mine production. However, South Africa’sgold production as a proportion of world output fell over the period — downfrom 35 per cent in 1987 to 20 per cent in 1997 — while Australia’s shareof world gold mine production rose — up from just over 6 per cent to almost13 per cent.
World mine supply accounted for almost 60 per cent of total gold supply in1997, down from an average of 67 per cent in the first half of the 1990s and73 per cent in 1987. This trend reflects lower annual average growth in worldmine production in the 1990s (1.6 per cent) compared with that of the1985–90 period (5.3 per cent) and parallel growth in central bank sales andlending. The slower expansion of gold mining in the 1990s primarily reflectsthe trend in the world price of gold.
Key factors expected to determine future rates of growth in mine supplyinclude trends in gold price and mining costs. Mining profitability and thusthe price of gold will be the main influences on levels of exploration effort.Trends in input costs, improvements in exploration and mining technology,
15Australia in the world gold market
Net bullion investment and the gold price4
1980 1983 1986 1989 1992 1995 1998Investment includes Western investment and bar hoarding in markets outside Europe and the United States (Gold Fields Mineral Services, 1998).
t200
400
600
800
1000
1200
–1001999
US$/oz
100
200
300
400
500Net investmentgold purchases right axis
Gold priceleft axis

and the continuing liberalisation of mining and related laws in developingcountries will also affect the rate of future expansion of gold mining.
However, in aggregate, global mine production is not expected to be a majorinfluence on changes in price over the medium term. This is because a numberof factors are serving to moderate the effect of the recent price falls on worldgold output — for example, world mine supply increased by 4 per cent in1997, despite prices falling by 15 per cent. Over the medium term, worldmine supply growth is projected to continue its easing trend, with gold mineoutput increasing slightly over the next few years before slowly decliningover the later half of the outlook period. World gold mine production in 2005is projected to be around the same level as that in 1998.
The past and expected lagged production response partly reflects scope forhigher cost operators to adjust mine plans to increase average ore grades,lowering per unit costs and raising output (but effectively shortening minelives). It also reflects the significant hedging portfolios held by some keyproducers, and the support of domestic prices received in some producingcountries (such as Australia, Indonesia and South Africa) by currency depre-ciations. Lags have also occurred because operators of higher cost mineshave resisted pressures to incur the disruption and costs of mine closuresuntil they are confident that a significant downturn in gold prices (and theresulting financial losses) will be sustained for a considerable period.
Developing countries, particularly in Asia and South America, are expectedto account for the majority of mine supply growth. The United States,Australia and Canada are projected to maintain gold output at around levelsof the mid-1990s, as output from new and expanded mines offsets produc-tion lost from the closures of depleted and higher cost mines. In contrast,production is projected to ease further in South Africa (still the world’s largestgold producer). That country’s falling gold production, both past andprojected, reflects factors such as progressively lower grades, higher laborcosts and the increasing costs of extraction from deepening mines.
Official sector salesThe pattern of official sector holdings has remained largely unchanged sincethe exchange of gold for US dollars in the official market ceased in 1971(figure 5) (Smeeton 1998). This has occurred despite the gradually declin-ing gold stocks held by governments and other official international organ-isations since 1970. The gradual easing trend in official sector gold holdings
16 ABARE research report 99.8

reflects two opposing factors. First, the incentives for governments to holdgold as a reserve asset have declined considerably in the past two decadesas other reserve asset options have demonstrated their relative attractiveness.Second, despite these incentives, various economic and political constraintsappear to be limiting the pace and extent to which governments lower theirgold holdings.
Gold has had a diminishing role in the world’s international financial systemsince the early 1970s as liberalisation and globalisation of the world’s finan-cial markets have presented governments with a range of strong currenciesto use as reserve assets (Warwick-Ching 1993). These reforms, along withthe increasing economic and political stability of developing nations, havealso lowered the need to hold gold as a ‘war chest’ or ‘asset of last resort’.Further, while the reserve asset options (other than gold) available to centralbanks have been expanding, the value of the banks’ gold holdings has de-clined significantly (in real terms) since 1980. Thus managers of interna-tional currency (and gold) reserves have been under increasing pressure toimprove the returns on their gold holdings (Smeeton 1998).
Lower returns from gold appear to underpin recent growth in official sectorgold sales and lending, but other incentives facing the official sector haveserved to limit the pace and extent of such activity. Perhaps the most power-ful of these influences is the sheer size of official sector holdings in relationto annual supply and demand. Official sector gold holdings equalled around32 000 tonnes in 1997, or equivalent to around thirteen years of annual minesupply. The large volume of official sector gold, along with the market reac-tion to a number of sales in 1997, suggests that the official sector cannot
17Australia in the world gold market
Composition of official sector gold reserves5
1970 1980 1990 1998(September)
kt
15
10
5
20
25
35
30 Other
International organisations
United States
Europe
Source: International Monetary Fund (1998)

18 ABARE research report 99.8
1997
January: The Netherlands announces that it has sold 300 tonnes of its gold inthe previous year.
June: The US Federal Treasury releases a discussion paper analysing the impactsof alternative sales strategies for US Federal Reserve Holdings.
July: Australia and Argentina undertake sales totaling 292 tonnes. Their reservesare exchanged for higher yielding baskets of major currencies.
November: Switzerland and Germany officially enter the gold leasing market.
1998
March: Belgian and Czech central banks announces sales (undertaken on aforward basis) of 299 tonnes and 25 tonnes respectively in late 1997.
May: The Swiss Parliament passes legislation that removes gold backing of theSwiss franc (the last gold backed currency in the world). The Swiss governmentthen proposes to sell around half of the nation’s gold reserves (1300 tonnes). Inearly 1999 Swiss voters approved amendments to the constitution to enable thesesales to proceed.
June: The European Central Bank is formed, leaving around 12 000 tonnes ofgold in EU national central banks with a limited monetary role aside from beinga ‘strategic’ national reserve asset in case of emergencies. It is unclear to whatextent the European Central Bank will regulate any future sales of this surplusby EU national central banks.
1999
March: A former International Monetary Fund proposal to sell 150–300 tonnesof gold to finance debt relief of poor nations (which was rejected in late 1996by Germany) resurfaces, with supportive statements from Germany, France, theUnited Kingdom, the United States and Japan.
May: The UK Treasury announces a plan to sell 415 tonnes (around 60 per cent)of UK gold reserves over the medium term. The Bank of England states thatinitial sales of 125 tonnes over 1999-2000 will be undertaken through a seriesof auctions every two months.
Sources: Macquarie Equities (1997); Gold Fields Minerals Services (1998); World GoldCouncil (1999).
2 Key official sector events with implications for the gold market

quickly dispose of a major proportion of its holdings without pushing downthe gold price received and, equally importantly, the value of its remainingreserves.
Political or even cultural reasons may also underpin government reluctanceto liquidate excess gold holdings. Gold has demonstrated its worth as a usefulreserve asset for governments to hold in times of emergency (such as warand, more recently, the collapse of domestic currencies in Asia) because itsvalue (unlike paper currencies) partly derives from gold’s use as a commod-ity. The United States, which holds the world’s largest stocks of bullion (8200tonnes), continues to maintain a policy of not lending or selling any of thisbullion to the market.
Constraints on official sector activity in the market undoubtedly remain, butthe recent acceleration in gold lending and selling by the official sectorsuggests that overall they are becoming less important. It appears that 1997and early 1998 was a watershed period for defining change in the attitudeand behavior of central banks. This is evidenced by the number and volumeof significant official sector sales and loans, and by other announcements onthe gold policy of the official sector (box 2).
Particularly important were: the Australian and Argentine sales, in whichthe two governments replaced their gold holdings with other governmentsecurities; announcements by the Swiss and German governments of theextent of their gold lending activity; and the release by the US Board ofGovernors of the Federal Reserve System of a discussion paper examiningalternative sales strategies for US gold reserves (Henderson et al. 1997).
More recently, the European Central Bank (established in June 1998) an-nounced that it will hold 15 per cent of its reserves as gold. This representsa share for gold that is well below that generally held by European centralbanks. In effect, it leaves a substantial tonnage notionally ‘surplus’ to therequirements of EU central banks.
The market is presently uncertain about the European Central Bank’s poli-cies for the regulation of gold selling and lending activities by individualcentral banks in the European Union. The nature and strength of these poli-cies are expected to ultimately affect the amount of gold that the EuropeanUnion sells onto the market (in exchange for other monetary assets); theywill probably also affect the manner by and rate at which member countriesconduct such sales.
19Australia in the world gold market

The recent higher rate of official sector net sales (figure 6) is likely to continueover the medium term. This direction is indicated by: the Swiss plan to sellaround 1300 tonnes; the relatively small proportion of gold held in theEuropean Central Bank; the recent proposal by the International MonetaryFund to sell up to 300 tonnes to finance debt relief of poor nations; and therecent announcement by the UK Treasury that it intends to sell 415 tonnes(over half their gold reserves) over the next three years. However, futurelarge scale official sector sales may increasingly occur in a more orderedand transparent fashion, as indicated by the recent UK proposal in which aprogram of future gold auctions was provided to the market (box 2).
Those central banks with the largest holdings of gold appear to have a strongincentive to refrain from major sales over short time periods, but this is notnecessarily the case for central banks with smaller holdings. In 1997 eighteencentral banks had holdings of 100–500 tonnes, accounting for a total of over3200 tonnes (International Monetary Fund 1998). These central banks withsmall to medium sized gold holdings may be less likely than banks withlarger holdings to sell in a gradual and transparent manner. This is becausethey may have a greater chance of obtaining higher prices by pursuing a ‘sellfirst and announce later’ strategy. Thus their future selling behavior is, atbest, a significant uncertainty and, at worst, a negative risk factor facing themarket over the medium term.
Official sector lending and producer hedgingWhile official sector sales have been the focus of popular attention and haveincreased gradually since 1980, official sector lending has increased dramat-
20 ABARE research report 99.8
Net gold sales from the official sector6
1988 1990 1992 19961994 1998
kt
15
10
5
20
25
30
Source: Gold Fields Minerals Services (1998)

ically during the 1990s. From an estimated 600 tonnes at the end of 1988,official sector gold loans to the market increased to over 3800 tonnes by theend of 1997 (figure 7). Most of this increase was effectively borrowed byproducers to finance their gold price hedging transactions.
As with outright sales, the increase in gold lending activity by the officialsector over the 1990s reflects globalisation of the world’s financial marketsand the resulting pressures on central bankers to improve the return on theirgold holdings (Smeeton 1998, p. 255). However, unlike sales, lending enablescentral bankers to derive a return on the asset while retaining ownership.This difference, along with the apparent market and nonmarket constraintsfacing official sector sales (described above), perhaps explains why officialsector lending has increased by far more than official sector sales (figures 6and 7).
As noted above, most gold loaned to the market by the official sector isborrowed by producers to finance hedging transactions (figure 7). Gold pricehedging is the process whereby producers reduce their exposure to the riskof lower gold prices, using mechanisms such as forward sales contracts andoptions. The manner in which borrowed gold (or liquidity) from the officialsector is used to finance forward sales (the most common form of hedgingused by gold producers) is explained in box 3.
A producer effectively borrows gold from the official sector (through anintermediary), then sells the gold to obtain the current spot price and investsthe proceeds in an interest bearing account. The producer subsequently paysback the official sector gold loan (plus interest in the form of additional gold)
21Australia in the world gold market
World borrowing and lending of gold7
1989 1991 19951993 1997Source: Gold Fields Minerals Service (1998)
kt
–5–4–3
–2–1
34
21
��������
����
���
�����
����
���
��
������
����
�������
������
�Borrowing for producer hedgingOther borrowing
Official sector lendingPrivate lending

22 ABARE research report 99.8
The acceleration of producer hedging during the 1990s has been made possibleby the increase in gold lending by the official sector (figure 7). The manner inwhich official sector gold lending (or liquidity) is used to finance a gold forwardsale (the most common form of hedging used by producers) is shown above. Aforward contract provides an agreement between gold producers and the writerof the contract to deliver a certain quantity of gold at an agreed price before aspecified date.
First, gold loaned by the central bank to an intermediary (a bullion bank) for theforward sales is sold onto the spot (immediate delivery) market by the bullionbank, and the proceeds are invested in an interest bearing account. At the endof the transaction, gold from the producer is sold to the bullion bank at thecontracted forward price. The bullion bank then repays the central bank with anamount of gold equal to the amount borrowed plus interest (Gold Fields MineralsServices 1996).
The forward premium over the current spot gold price reflects the differencebetween the rate at which central banks are willing to lend gold to producers forsuch transactions, and the interest rates available on cash deposits, referred to
($)
Source: Gold Fields Minerals Services (1996)
Gold market
delivers gold(Au)
lends gold(Au)(Au)
returns gold(Au + LR)
Central bank
Bullion bank
Producer
Interest earning account closes
account($ + int)
pays producer($ + int – LR – LF)Au = physical gold
$ = cashint = interest earned on cash depositLR = gold leasing rateF = bullion bank fee
= start of forward sale= end of forward sale
3 Official sector loans and producer hedging

from mine production on the delivery date specified by the contract. Theeffective forward price received by the producer derives from the differencebetween the rate at which central banks are prepared to loan gold to produc-ers for such transactions, and the market rate of interest that producers canobtain from investing the proceeds for the duration of the contract (box 3).
The twelve month gold lease rate (representing the market rate at whichcentral banks are willing to lend gold to producers for hedging) averagedaround 1.6 per cent from 1990 to mid-1998, while twelve month world indi-cator borrowing rates (US dollar LIBOR) averaged around 6 per cent (VirtualGold 1998). The substantial difference between leasing rates of gold andborrowing costs of dollars is unusual, because leasing rates for other metalcommodity markets in competitive equilibrium are forced (through arbitrage)
23Australia in the world gold market
as the ‘contango’. The attainable forward price of gold increases with the spotprice of gold, the contango and the duration of the contract.
Producers are not restricted to delivering their mine production against theforward contract, because there are usually mechanisms (depending on the typeof arrangement) by which producers can close out the forward contact and takea profit or loss (Gold Fields Minerals Services 1996).
Another instrument used by producers to hedge against price falls is gold ‘put’or sell options. These provide producers with the right (but not the obligation)to sell a specific quantity of gold at an agreed price before a specified date.However, the grantor of these options (usually a bullion bank) undertakes forwardselling to hedge against the risk of the option being exercised when the strikeprice is above the spot price. This process is referred to as ‘delta hedging’ (Cross1994). Options therefore have an effect similar to that of producer hedging interms of accelerating supply onto the market as forward sales (through thehedging activities of the option counterparties). As reflected in high contangosfor forward prices, the availability of options at ‘low’ prices to producers reflectsincreasing official sector liquidity to finance these transactions.
Hedging through instruments such as forward sales agreements can reduce pricerisk but it will always involve some risk to the producer. If a producer undertakesa forward agreement to deliver a specific quantity of gold for a certain price ata future date, the producer may be unable to benefit from any future rises in theprice of gold (Grieg 1997). Similarly, when producers buy put options, the optionprice includes a premium (above the intrinsic value of the option, were it to beexercised); thus the reduction in downward price risk for the buyer of a putoption comes at a price.
3 Official sector loans and producer hedging Continued

24 ABARE research report 99.8
to a rate around cash interest rates, depending on the change in the lender’scosts of storing and transporting the commodity.
Official sector gold lending has almost exclusively been directed to goldproducers and not to speculators (figure 7). These patterns in lending andthe historically low interest rates for gold lending suggest that the officialsector, in limiting its lending to producers for hedging purposes, has obtaineda below-market rate of return. This low rate of return also reflects the rela-tively small size of demand for nonspeculative forms of borrowing (mainlyhedging by producers and fabricators) relative to the potential size of goldstocks available for lending.
Effect of hedging on the world marketGiven that the gold loaned by the official sector for a producer forward saleis immediately sold on the spot market (then later repaid to the central bankfrom mine production), this activity effectively brings forward mine supplyto the market. However, if in the future the central banks return gold loansto their vaults as they are repaid without undertaking new loans, there wouldbe a relative reduction in supplies to the market (compared with what wouldhave occurred without forward selling).
This ‘drawback’ of official sector loaned gold, in net terms, has not yetoccurred, with net lending to the market for producer hedging increasing inthe 1990s (figure 7). Further, with lending continuing to expand, no signif-icant drawback is envisaged over the medium term.
Another implication of the official sector providing producers with signifi-cant forward price premiums has been that the profitability of gold mininghas increased above the level that would have been achieved given the declinein real gold prices since 1980. Thus, in addition to the direct effect of accel-erating supply described above, the loaning activity of the official sectormay be sustaining higher levels of gold production than would occur other-wise. This also serves to sustain downward pressure on world gold prices.
Outlook for official sector lending and producer hedgingThe supply of official sector gold lending is forecast to continue to increaseto 2005. Both the Swiss and German central banks officially entered theworld gold leasing market in 1997; together, these countries held around5550 tonnes of gold (more than the 3800 tonnes of official sector gold onloan to the market at the end of 1997). Further, if the evolving policies ofthe new European Central Bank tighten the flexibility of the EU central banks

to sell their gold reserves, EU central banks may have further incentive toloan more of their reserves as an alternative to disposal.
Increasing gold lending by the official sector over the medium term isexpected to be associated with sustained producer hedging and, therefore,continued high levels of supply onto the market from that source. Theseeffects will tend to depress prices. However, demand for producer hedgingmay decline in the medium to long term as mine production declines andthus ore reserves available for hedging decrease. On balance, producer hedg-ing is likely to remain a net negative influence on gold prices over the mediumterm, although the size of this influence is expected to decline as world mineproduction falls.
25Australia in the world gold market

Australian gold industry outlook
The gold industry, Australia’s second largest export industry, is consideringthe implications of the substantial falls in the world gold spot price in the pasttwo and a half years and continuing uncertainty in world markets. Given thiscritical period for the market and for the development of the Australian indus-try, it is timely to look at the likely direction of the industry over the next fiveyears and beyond in terms of profitability, exploration and production.
This chapter is divided into three sections: first, a general overview of theAustralian gold industry and recent trends; second, the major factors likelyto affect Australian gold production levels over the medium to longer term(including Australia’s relative attractiveness as a location for gold explo-ration and mining); and finally, projections of Australian gold mining produc-tion.
Industry backgroundThe Australian gold industry has expanded rapidly in the past fifteen years,with the value of exports rising from $270 million in 1983 to $4.91 billionin 1997. This rapid growth followed high real prices of gold during the early1980s (figure 8). Higher gold prices reinforced the positive impact of thedevelopment of new gold processing technologies, the absence of companytaxation on gold mining, and the availability of attractive gold loan facilities.
26
3
ABARE research report 99.8
Australian gold production, exploration and price8
1977 1980 19861983 1989 1992 1995 1998
0
200
400
600
800
1000
1200
t
50
100
150
200
250
300Gold price1998 A$/oz
Exploration1998 A$m
Productionright axis

The advent of carbon-in-pulp and carbon-in-leach cyanide based recoveryprocesses in the early 1980s enabled profitable mining of gold at much lowergrades. Moreover, this technology is particularly well suited to shallowoxidised gold deposits, which are relatively common in Australia as a resultof the extensive weathering of the continent. Thus, with high real prices,new technology, a favorable taxation regime and available development fund-ing, exploration activity and gold production rose significantly in the secondhalf of 1980s.
Following the rapid rise in Australian gold output in the 1980s, growth inthe first half of the 1990s was negligible. The slowing production growthwas linked with a period of declining exploration activity between 1989 and1992 (figure 8). The downturn in exploration activity appears to have partlyreflected the sharp fall in the Australian dollar gold price in the period1988–92. Other significant contributors to the slowdown in industry growthin the early 1990s were the stock market crash of late 1987 (coinciding withthe fall in the world gold price), which reduced the availability of equityfunding for a period, and the introduction of corporate taxation for goldmining companies in 1991.
After 1995, gold production again increased rapidly, with output rising sharplyin 1996, 1997 and the first half of 1998. The recent production increase is alagged response to a modest upturn in the Australian dollar gold price in1993 and sustained high prices until mid-1996. Exploration expenditure rosein response, increasing at an annual average rate of almost 16 per cent in theperiod 1992–97.
The industry todayAustralia is currently the world’s third largest gold producer, after SouthAfrica and the United States (figure 9), and accounted for an estimated 13 per cent (around 314 tonnes) of world gold mine production in 1997.Approximately 342 tonnes of gold were exported in 1997. The differencebetween exports and production reflects re-exporting of gold imported forprocessing (primarily from gold mining operations of Australian firms inthe Asian region and from imports of gold scrap from Asia).
The bulk of Australia’s gold production is exported as bullion, of which mostis shipped to Asian markets (figure 10). However, following the recenteconomic problems in Asia, some output is being diverted to regional marketsin Europe and the Middle East.
27Australia in the world gold market

Given the increase in economic activity in the gold sector, flow-on effectsto the rest of the Australian economy (such as the generation of indirectemployment and output) increased in the 1980s and the second half of the1990s. Using input–output multipliers for the Australian economy (AustralianBureau of Statistics 1997), it is possible to derive estimates of the direct and indirect output and employment effects of the Australian gold industry(table 3).
Most of Australia’s gold mining operations are located in remote areas ofAustralia (figure 11). Thus the industry is indirectly important to regionalincome and employment opportunities in those areas. Also, most ofAustralia’s gold mines (figure 11) are located in Western Australia: in 1997,that state accounted for 76 per cent of Australia’s gold mine output, while
28 ABARE research report 99.8
World gold production, by region9
1988 1989 19911990 1992 1993 1994 1995 1996 1997
t
500
1000
1500
2000
South America
Asia (including China)Australia
South Africa
United States
Other
Source: Gold Fields Minerals Service (1998)
Australian exports of gold, by destination, 1996 and 199710
South Korea
Singapore
1996
1997
HongKong
ThailandMalaysiaOtherJapanSwitzer-land
UnitedKingdom
A$b
1.5
1.0
0.5
2.0
2.5

Queensland, the Northern Territoryand New South Wales accounted for9 per cent, 8 per cent and 4 per centrespectively, and Victoria, Tasmaniaand South Australia combinedaccounted for around 3 per cent.Most of Australia’s gold productioncomes from a relatively small num-ber of large mines, and numeroussmall scale operations contributelittle to total output. Australia’s top20 per cent of mines (by size) pro-duced an estimated 60 per cent ofproduction in 1997, while thebottom 20 per cent of gold minesaccounted for less than 1 per cent(figure 11).
29Australia in the world gold market
3 Economic impacts of Australiangold mining, 1997 a
Gross value of production Employment
Direct s $5 billion 15 000
Indirect $8.5 billion 56 000
a Type IIB full time employment and outputmultipliers from Australian Bureau of Statistics(1997). Input–output multipliers are based onaverage (not marginal) effects, so they tend tooverstate indirect economic effects (AustralianBureau of Statistics 1996, p. 24). Thus the valuesshown here are only indicative, not absolute. sABARE estimate.
Distribution of major primary gold producers in Australia, 1997Based on ounces of gold produced11
Mine
Share of Producer Production Australian quartile range output
% 000' oz/year %20 0–15 140 15–40 660 40–75 1480 75–130 23100 130–680 56

Factors influencing Australian production
Like other major world gold producers, Australia produces an annual outputthat is modest compared with annual global supply (13 per cent) and negli-gible in its share of aboveground bullion stocks. Australia’s relatively modestcontribution to total market global supply means that Australian producers(like their overseas counterparts) have no ‘market power’ over world goldprices (Sjaastad and Scacciavillani 1996, p. 887).
Australian gold producers therefore seek to maximise profits from miningsubject to a number of constraints, including current and expected futureworld prices, mining costs and Australia’s attractiveness for gold miningrelative to other locations.
Returns to gold mining in AustraliaAustralia’s real gold cash margins (real price less real cash costs) have exhib-ited a declining trend in recent years (figure 12). The US dollar gold priceis forecast to remain low in 1999, averaging US$285 an ounce. Reflectingan assumed stable exchange rate in 1999, the Australian gold price is alsoexpected to remain steady across the year, averaging A$437 an ounce.
Over the medium term, the real US dollar gold price is forecast to fall, whilethe Australian dollar is forecast to strengthen against the US dollar. Theseassumptions underpin the projection that the Australian gold price will fallover most of the outlook period to average A$317 an ounce (in 1998 Aus-tralian dollars) in 2005 (figure 12).
30 ABARE research report 99.8
Gold cash margins in Australia12
1985 1990 2005
200
1998A$/oz
800
600
400
1995 2000
Price
Cash cost

Gold revenuesThe Australian dollar price represents the notional price that Australianproducers receive, but the effective price received by producers has gener-ally been somewhat above the prevailing spot price in recent years. This hasresulted from the industry’s extensive use of forward sales and other hedg-ing techniques. Over the period July 1990 to June 1998, the monthly oneyear forward price (that is, the price that producers could contract to deliveragainst in twelve months) was estimated to average A$531 an ounce (figure13). (This forward price was estimated using ‘GOFO’ one year lease ratesas quoted by Reuters [Virtual Gold 1998] and the Reserve Bank of Australiaone year bond rate.) This compares (for each of these months) with an aver-age spot price at maturity of A$489 an ounce.
The existence of this significant premium, along with the extensive use ofhedging by Australian gold producers, has enabled significantly greaterreturns than would have been realised at the prevailing spot prices. Lonergan(1997) estimated that 40 per cent of before-tax profits of Australia’s top 20 gold producers was attributable to hedging activities in 1995, rising to 60 per cent in 1996.
Official sector gold lending at low rates of interest for producer hedging isexpected to continue to expand over the medium term (see chapter 2). Giventhis behavior of the official sector, and the relatively small proportion of goldborrowing in relation to total consumption, the forward premium over spotprices available to producers (as seen over the past decade) is expected tocontinue.
31Australia in the world gold market
Australian one year forward gold pricesMonthly13
July1990
June1991
June1992
June1993
June1998
June1994
June1995
June1996
June1997
Spot
Forward600
500
400
A$/oz

However, the trend in the forward price attainable by producers is alsosubstantially influenced by the price impact of market fundamentals. RealAustralian gold prices are projected to decline by around 18 per cent overthe outlook period to 2005, thus attainable forward prices can also be expectedto decline.
Gold industry costsSpot and forward prices have significantly influenced the cash marginsachieved by Australian gold producers in recent years, but changes in realcosts have played a relatively minor role in determining changes in margins.Having declined modestly over the period (figure 12), real cash costs areexpected to continue an easing trend (in line with real prices over the outlookperiod). However, in addition to responding to pressures from easing realprices, Australian cash costs will also respond to changes in technology, deci-sions on ore grades, and geological conditions.
It is likely that the falling real costs (figure 12) largely reflect continualimprovements in the application of carbon-in-pulp and carbon-in-leach pro-cessing technology since its introduction to Australia in the early 1980s, andthe more recent contraction in Australia’s high cost gold mining activitiesin response to lower real prices. Higher cost mines in Australia tend to besmaller sized operations (figure 14).
This trend is expected to continue over the medium term, with prices fore-cast to remain low. A recent study of the Western Australian gold industry(Greig 1997) found that the top 25 per cent of producers in that state hadaverage reserve–production ratios of eleven years, compared with five years
32 ABARE research report 99.8
Size and cost structure of the Australian gold industry, 199714
100 90 80 70 60Producer decile
50 40 30 20 10
Proportion of total output produced by decile
Production cost of producer decile 25
20
30
15
10
5
250
200
300
150
100
50
%US$/oz

for the rest of the mines. Bigger mines also typically have a larger propor-tion of their anticipated future production sold forward using hedging mech-anisms (such as forward contracts and option strategies). This difference islikely to partly reflect the significant treasury costs involved in building andmaintaining sophisticated hedge portfolios.
The lower hedging levels and smaller reserve–production ratios of smallerproducers, in addition to their higher costs (on average), are likely to resultin faster closures of smaller operations in response to lower prices.
The industry has also reduced costs by amalgamating gold mining opera-tions within close proximity. The Australian gold industry has undergone asignificant degree of ‘regional centralisation’ in recent years, and the numberof companies within specific gold mining regions has decreased sharply.Only two of the previously twenty plus companies still operate within theGolden Mile in Western Australia, for example, and similar reductions haveoccurred in other gold mining regions across Australia (Baker 1997).
Such amalgamations appear to enable companies to tap the synergies ofcentralising several operations within one gold mining region. These bene-fits include the external gains from consolidating exploration within a geolog-ically similar area, as well as the potential cost savings of processing oresfrom different mines at central milling locations.
Further, during the current period of share price weakness (which has partic-ularly affected smaller companies), larger companies have faced increasedincentives to amalgamate with exploration focused ‘juniors’ as a means ofmaintaining access to new resources. Others have noted that ‘juniors’ aregenerally willing to form such alliances in the currently depressed marketso as to obtain necessary exploration support (Hextall and Dixon 1998).
It is assumed for the cash cost projections shown in figure 12, and the supplymodeling in the next section, that no major technological or geoscientificbreakthroughs in the near future will substantially alter the productivity ofgold exploration, processing and mining in Australia. Such productivityincreases have occurred in the past: the introduction of carbon-in-pulp (CIP)and carbon-in-leach (CIL) gold processing technologies to Australia in theearly 1980s dramatically lowered the economic cutoff grades of mining goldore (particularly oxide ores) and thereby provided impetus for the rapidgrowth in the modern gold industry in Australia.
33Australia in the world gold market
Houchin and Staunton (1998) suggest that CIP–CIL based technology islikely to remain the major means of gold ore processing in Australia overthe medium term, given that the process has remained the most economicand reliable of the many alternative processes investigated in recent years.Further, in a period of low prices, the research investment funds availablefor developing new gold processing technologies may be reduced. Processingcost improvements are likely to continue to be derived from refinements ofthe CIP–CIL process, with subsequent savings via reduced reagent consump-tion (mainly cyanide) and higher recovery rates.
However, such cost savings from operational improvements may be offsetby the changing geological and mineralogical conditions facing gold miningand processing in Australia. Many of the shallow oxide deposits in Australiahave been depleted, so the average depth of mining and the proportion ofsecondary (sulfide) ore to be processed have been increasing, thereby rais-ing costs. This trend is expected to continue.
Effect of the changing profitability of Australian goldminingThe decline in returns achieved by the Australian gold mining industry viachanges in prices and other economic conditions will tend to affect produc-tion in two ways. First, gold producers will respond to changed economicconditions by adjusting future production and investment plans (includingexploration). Second, falling profitability often leads, where feasible, to once-off cost cutting through revised mine planning, which can maintain the returnsto the sector in the short term. The likelihood of technological change andimprovements in geoscientific understanding of the magnitude seen in theearly 1980s is assumed to be negligible over the outlook period.
This profitability outlook is expected to result in lower levels of Australiangold production over the medium to longer term. The extent of this reduc-tion and the sensitivity of Australia’s future gold production to alternativeworld price scenarios are examined in more detail in the next section. Butfirst it is useful to consider some influences that will tend to sustain produc-tion in the short term, despite lower profits and increased uncertainty.
Dynamics of Australian gold supplyHistorically, changes in Australian gold production in response to pricechanges (and other factors affecting profits) have been delayed for a numberof reasons. The delay in production increases following sustained price
34 ABARE research report 99.8

increases generally reflects the lead times of exploration and subsequentmine development or expansion. Shutting down or scaling back mine produc-tion in response to price falls usually involves significant adjustment costs,and such decisions are costly to reverse. These adjustment costs also lead toinertia during periods of price uncertainty (such as occurred throughout 1997)as producers wait until prices stabilise or sentiment becomes clearer beforethey fundamentally change production plans (Dixit and Pindyck 1994).
Hedging tends to lower the opportunity costs to producers of waiting foradditional information during periods of price uncertainty. This allows delaysin committing to changing production, and therefore accentuates lags betweenprice and production changes. In terms of open hedging positions, an esti-mated 590 tonnes of Australian production had been sold forward in May1998 at an average price of A$575 an ounce. Further, approximately 600tonnes of production was hedged by means of put and call options at an aver-age price of A$598 an ounce.
This hedging provides a buffer to Australian producers, adding flexibilityfor miners to continue production despite falls in the spot price of gold. Butit cannot protect the industry from longer term fundamental changes in worldgold prices.
Another influence on the dynamics of gold supply responses to changedeconomic conditions is the option of mining higher grade ore. Temporarilyincreasing the ore grade in response to lower prices has the paradoxical resultof simultaneously lowering per unit costs and raising output (if ore volumesremain constant). High grading decisions raise the per unit cost of miningthe remaining gold or reduce reserves and mine life. In their annual reviewof the world gold market, Gold Fields Minerals Services (1998) suggest thathigh grading in 1997 was one reason that world mine supply increased by 4per cent in that year despite prices falling by around 15 per cent.
Returns to Australian gold exploration and mining in aglobal contextThe increasingly global nature of mining investment has meant that the levelof gold exploration in Australia now significantly depends on the relativereturns of such investment in Australia compared with the return on goldexploration investment elsewhere. Overseas exploration expenditure byAustralian companies has increased significantly in recent years (figure 15):it rose from around $120 million in 1990-91 to $360 million in 1996-97, and
35Australia in the world gold market

its share increased from 26 per cent to 43 per cent. In principle, increasingoverseas exploration by Australian companies can reflect a fall in expectedreturns to gold investment in Australia, a rise in expected returns to goldinvestment overseas, or a combination of the two.
However, trends in global gold exploration suggest that the increasing attrac-tiveness of emerging gold producing regions has been the major factor behindgrowing levels of overseas gold investment by Australian companies. Globalexploration expenditures in the past five years have increasingly been directedtoward new gold producing regions in developing countries, notably SouthAmerica, Africa and parts of Asia (figure 16). Conversely, exploration spend-ing in developed producer regions such as Canada, the United States andAustralia has begun to decline.
36 ABARE research report 99.8
Overseas exploration expenditure by Australian companies15
1988-89
1989-90
1990-91
1991-92
1992-93
1993-94
1994-95
1995-96
1996-97
1997-98
Expenditure
Proportion of Australian explorationexpenditure right axis400
300
200
100
30
40
20
10
A$m %
Source: Minerals Council of Australia (1998)
Trends in global gold exploration16
1992 1993 1994 1995 1996 1997 1998
A$b
3
1
2
4
5
6
���yyy����yyyy����yyyy���
���yyyyyy
���������
yyyyyyyyy
����yyyy
���yyy
����
yyyy
����
yyyy
���yyy
���yyy �
��yyy���yyy
���yyy
����yyyyAustralia
AfricaUnited StatesCanada
Rest of worldLatin AmericaSouth East Asia�y
Source: Metal Economics Group

Growth in gold exploration activity in South America, Africa and Asia largelyreflects the economic and political reforms undertaken in these regions overthe past decade (Middleton, Huggan and Clarke 1996). Further, many ofthese countries have implemented policies specifically aimed at encourag-ing foreign mining investment: for example, Argentina’s 1993 MiningInvestment Law guarantees that mining companies will not be subject to anincrease in their total tax exposure for thirty years (Albarracin 1997);Zimbabwe’s 1994 amendment to its Mines and Minerals Actguaranteesmining title to foreign investors for 25 years (Holloway 1997); and Egypthas offered a foreign gold mining company guaranteed title and exemptionfrom a range of taxes (Dixon 1998).
Economic and political reforms have provided the necessary macroeconomicstability, while various legislative reforms in areas such as taxation andmineral law have served to lower the risks and costs facing investors in thesecountries. Moreover, before such reforms and the recent influx of explo-ration activity from established gold producing nations, vast areas withinthese regions with favorable geology remained relatively underexploredusing modern scientific methods. The geological potential of these regionsand the scope for further liberalisation of foreign investment and minerallaw within a number of such countries suggest these trends are likely tocontinue into the foreseeable future.
Linked with the liberalisation of foreign investment regulations in emerg-ing producer regions, countries in these regions have introduced more favor-able mining taxation arrangements (often explicitly designed to encourageforeign investment). A recent study in comparative mineral taxation systems(Otto et al. 1997) used hypothetical copper and gold mine models to evalu-ate the effective tax rate payable in various countries if these hypotheticaldeposits were developed. The main results for gold mine models are presentedin figure 17 as effective tax rates and internal rates of return for the hypo-thetical gold project in different countries.
The effective tax rates shown in figure 17 are equal to the net present valueof all payments to government, divided by the net present value of taxablecash flows generated by the project. The internal rate of return is defined asthe discount rate at which the net present value of the project is zero. It is arate of return that can be directly compared with a company’s ‘hurdle rate’(used to decide whether the project is worthwhile undertaking). Otto et al.(1997) note that effective tax rates provide a useful way of comparing alter-native taxation systems, but that the study’s results are sensitive to the
37Australia in the world gold market

assumptions underlying the hypothetical gold mine model. The tax ratescould change depending on the type of ore body, specified cost structures,discount rates and other model assumptions (Otto et al. 1997, p. 33). Thus,the effective tax rates are ‘indicative’ rather than absolute.
Subject to these caveats, lower effective tax rates are only one of many factorsthat may be considered in a decision about where to undertake global min-erals exploration. Sweden has one of the lowest effective tax rates, yet itsrelatively low prospectivity means that it accounts for a low share of globalgold exploration expenditures. However, many developing countries areusing lower effective tax rates to encourage greater foreign investment andto generate higher government taxation revenues over the longer term.
Economic and political reforms, and associated liberalisation of foreigninvestment and minerals taxation laws, have been a feature of policy trendsin many developing countries in the past decade. As a result, these countrieshave increased their relative attractiveness as locations for exploration. Thistrend has been paralleled by increasing costs and uncertainty about landaccess and environmental regulations in developed mining countries (suchas Australia, the United States and Canada) as the implied societal value ofenvironmental services has risen with incomes in these countries.
The fall in gold exploration activity in the United States, for example, inrecent years (figure 16) may reflect concurrent pressures to amend the 1872Mining Law to enable stricter environmental controls on mining on federallands and the levying of higher royalties. Similarly, recognition of nativetitle rights and extensions of environmental protection in Canada and
38 ABARE research report 99.8
Rates of return and effective tax rates for gold mining17
12020% 40 60 80 100Source: Otto et al. (1997)
Tax ratesRates of return
ChinaIndia
TanzaniaUnited States (Nev.)
Australia (WA)Canada (Ont.)
Papua New GuineaGhanaMexico
BrazilIndonesia
South AfricaSweden
PhilippinesArgentina
Chile
Australia have affected, to differing degrees, the risks and costs of gainingaccess to land for exploration and mining.
Australian gold supply projectionsThe various factors influencing the outlook for Australian gold productionhave been outlined above in qualitative terms. This section contains the quan-titative derivation of short term and medium term projections for Australiangold production, and a discussion of the results.
In summary, given recent low Australian gold prices and projected easingreal prices over the outlook period, Australia’s gold production is expectedto decline over the medium to longer term (table 5). Production is projectedto remain largely unchanged over the shorter term, but then decline beyond2001. Aggregate production of 246 tonnes is projected for 2010 — around21 per cent lower than production in 1998.
Short term outlookTo derive the shorter term outlook, ABARE aggregated expected produc-tion profiles from existing mines and committed new projects. This methodis useful for deriving short term forecasts because Australian gold produc-tion tends to be rather unresponsive to changes in the gold price and otherfactors affecting returns to mining in the short term. The survey approachalso allows factors specific to the operation of individual mines (such asimpending closures as a result of poorer than expected ore grades, or likelyadditional output from committed expansions) to be included into the totalforecast.
Production estimates have been largely derived from existing reserves, exceptwhere there was sufficient information to forecast the proportion of resourceslikely to be upgraded to reserves (and thus mined) over the period. For newprojects, production forecasts have been developed only for those on whichconstruction has begun, or for which upcoming construction has been publiclyannounced. Given the projected Australian dollar gold prices, judgment wasexercised in estimating start up dates for some of these projects.
A number of operating gold mines were closed and new projects weredeferred in 1997 and 1998, pending improved gold prices: for example, Sonsof Gwalia’s Frasers mine closed in March 1998, and its Copperhead opera-tion closed in June 1998. Other mines forced into closure in 1998 included
39Australia in the world gold market

Woodlawn in New South Wales andthe Reedy mine in WesternAustralia. Important project defer-rals related to lower gold pricesincluded the proposed $25 millionexpansion at Rustlers Roost in theNorthern Territory and WesternMining Corporation’s proposed$157 million expansion of St Ives inWestern Australia.
Counteracting these closures anddeferrals are a number of medium tolarge projects that either enteredproduction in 1998 or are expectedto start up in 1999-2000 (table 4).Important projects that are sustain-ing Australia’s high levels of goldoutput in the short term include theCadia Hill gold mine in New SouthWales (expected to produce around 9 tonnes of gold in 1999) and the GoldenFeather project in Western Australia (expected to produce around 3 tonnesin 1999) (table 4).
In aggregate, Australian gold production is forecast to remain quite stableover the short term, rising from 311 tonnes in 1998 to 312 tonnes in 2000(figure 18).
40 ABARE research report 99.8
4 Major new projects/expansions,1999–2000
AdditionalProject annual capacitys
t
Cadia 9.0Golden Feather 3.0Beaconsfield 3.0Vera–Nancy 3.0Jundee–Nimary 2.5St Ives 2.0Paraburdoo 2.0Fosterville 1.5Tanami Operations 1.5Maud Creek Gold Project 1.5Marvel Loche 1.5
Total 30.5
sABARE estimates.
Australian gold production – short term18
t
100
50
150
200
250
300
Production from mines existing in 1998
Production from known new projects
1996 1997 1998 20001999

Australian gold production in the medium termBeyond the short term, the ability of producers to change their level ofreserves and mine capacity in response to changed economic circumstanceslimits the suitability of the disaggregated survey approach. Time lags betweenexploration, reserve delineation, mine development and production meanthat current decisions about levels of exploration spending and gold minedevelopment will affect the capacity of the Australian industry in comingyears. Thus, medium term projections of Australian gold production requireanalysis of the investment in gold exploration and mine development.
To incorporate these dynamic aspects of the Australian gold supply into theprojections, ABARE developed an econometric model of Australian goldsupply. Using aggregate Australian data, the model is based on the histori-cal relationships between gold prices, exploration expenditures and capitalinvestment in gold mining and gold output. It is based on an observed rela-tionship between production and capital stock in the Australian gold miningindustry. The model also uses estimated relationships between price, explora-tion and capital investment to forecast the level of exploration and capitalinvestment (and thus production) over the medium term.
An important limitation of the medium term modeling approach adoptedhere is that it does not explicitly consider short term influences on produc-tion (such as the reaction of producers to changes in price, when the costsof adjusting capacity quickly are high). Thus the production forecasts wasused to guide the medium to longer term trend in output, while the minesurvey data presented earlier was used to derive the shorter term trend. Therationale and method of the medium term production modeling are detailedin appendix B.
The Australian dollar price assumptions (corresponding to the US dollarprice projections outlined in chapter 2) that underpin the baseline mediumterm production projections are provided in table 5. To project productionlevels beyond the world outlook period to 2005, nominal gold prices wereheld constant from 2006 to 2010 (thereby implying that real gold prices willcontinue their declining trend).
The baseline price assumptions, and the resulting production forecasts fromthe model, are shown in table 5 and figure 19. Under the baseline pricescenario, Australian gold production is projected to decline from 311 tonnesin 1998 to 246 tonnes in 2010.
41Australia in the world gold market

The sensitivity of the model’s production projections to different profiles offuture prices is illustrated in table 5 and figure 19. To assess the effect oflower prices, ABARE used a profile of nominal gold prices falling by A$15an ounce a year from mid-2000; conversely, to assess the effect of higherprices, ABARE used a profile of nominal gold prices increasing by A$15an ounce a year from mid-2000.
42 ABARE research report 99.8
5 Projections of Australian gold production
Baseline price Low price scenario High price scenario
Price Production Price Production Price Production
A$/oz t A$/oz t A$/oz t
1997 446 314 446 314 446 3141998 469 311 469 311 469 3111999 437 310 437 310 437 3102000 419 312 412 312 427 3122001 402 309 397 309 442 3092002 395 305 382 305 457 3052003 390 298 367 297 472 2982004 385 285 352 283 487 2872005 384 277 337 272 502 2852006 384 272 322 265 517 2892007 384 266 307 255 532 2962008 384 259 292 243 547 3032009 384 252 277 230 562 3122010 384 246 262 219 577 325
Medium term projections of Australian gold production19High production
Low price scenarioHistorical and baseline production
Price (A$/oz) Production (t)
Historical and baseline price
Low production
1985 19951990 2000 2005 2010
100
200
300
400
500
600
50
100
150
200
250
300
High price scenario

International barriers to gold trade
Despite gold being one of the most actively and widely traded commoditiesin the world, there are a number of restrictions on gold and jewellery tradein various countries. Reduction of these barriers to gold trade would be ofbenefit from a global industry perspective.
Better market access would benefit Australian gold producers because itwould tend to increase demand for gold bullion exports, Australian goldjewellery and other manufactured gold products.
Why gold trade barriers existGovernments erect barriers to trade for many reasons; however, historicalmotivations for restricting gold trade can be classified into two broad cate-gories.
First, some gold trade regulations are linked with gold’s now dominant andgrowing role as a commodity used in jewellery, electronics, dentistry andother specialist industrial applications (figure 2). These restrictions largelytake the form of barriers (typically tariffs, but quotas in some instances) toimports of gold jewellery or other semimanufactured gold products; theygenerally serve to protect domestic manufacturing industries from worldcompetition. Such restrictions often function as de facto ‘luxury’ taxes onexpensive gold jewellery imports. Substantial barriers to such imports remainin a number of important markets.
Second, some gold trade regulations (generally applied to gold bullion orcoin) are linked with gold’s historical role as a medium of exchange. Afterthe collapse of the Bretton Woods gold–dollar exchange system in 1973,many economies in the world adopted some form of floating exchange ratesystem and liberalised (but to differing degrees) their foreign exchange andcapital markets, including liberalising restrictions on international gold bulliontrade. Significant barriers to gold bullion trade only remain in countries wheredomestic currency and capital markets are relatively highly regulated. Flowsof gold to these countries are restricted as a form of government control overthe domestic money supply and exchange rates.
43
4
Australia in the world gold market

Trade barriers and recent reforms
Tariffs on imports of gold bullion, jewellery and other semimanufacturedgold products account for the majority of barriers to gold trade in the world,and there appear to be few cases where quotas are used to regulate trade inthese products. There are also other (generally minor) import tariffs on othergold products: South Korea, for example, levies an 8 per cent import tariffon gold used for manufacturing semiconductors.
Compared with the numerous and widespread tariffs on gold imports, non-tariff barriers to gold trade are less common and are concentrated in a fewcountries. India has banned imports of gem-set gold jewellery, but not importsof plain gold jewellery and gems (separately subject to various import tariffs).Vietnam and China impose various nontariff barriers on gold imports, reflect-ing the highly regulated foreign exchange and capital markets in these coun-tries. All gold imported to China must be authorised by the People’s Bankof China, and similarly all gold imports to Vietnam require approval of theState Bank of Vietnam (which set a 34 tonne quota on allowable gold importsin 1996) (World Gold Council 1997).
The People’s Bank of China also heavily regulates gold production and distri-bution within its country. Gold producers in China are required to sell theiroutput to the bank at the official Chinese price, which in the past year or sohas been slightly higher than world prices. The People’s Bank of China isthe only legitimate source of bullion for gold manufacturers, and it has previ-ously sold bullion at a premium of around 10 per cent above the official price(Bannock, Doran and Turnbull 1997). Foreign manufacturers (through aChinese partner) are allowed to operate in China (mainly for exporting), butforeign owned gold retailers face an effective ban in China (Bannock, Doranand Turnbull 1997).
The People’s Bank of China recently adjusted the country’s official bullionselling price (the price at which the bank sells gold to fabricators) closer tothe world gold price, to discourage smuggling and increase revenues fromauthorised gold imports.
Patterns in gold trade liberalisationImport tariffs on gold jewellery are more widespread and larger (in nominalterms) than import tariffs on gold bullion (table 6). To indicate the signifi-cance of these tariffs to the market, ABARE calculated weighted average
44 ABARE research report 99.8

jewellery and bullion import tariff rates. Jewellery tariffs have been weightedby each country’s share of world gold in jewellery consumption, while bullionimport tariffs have been similarly weighted by an estimate of each country’sshare of gold bullion imports.
Like the size and frequency of tariffs on gold and jewellery, the weightedaverage tariff rates indicate the relative importance of these restrictions. Theworld weighted average import tariff on gold in jewellery (10.5 per cent) isaround four times larger than the world weighted average import tariff ongold bullion (2.2 per cent). The fact that import tariffs on gold jewellery are
45Australia in the world gold market
6 Major international gold import tariffs a
Gold import tariff
Jewellery Bullion Market shareb
% % %
Australia 5 0 1Brazil 21 5 2China 40 8 6Dubai 4 0 2European Union 4 1 9India c 15 6 22Indonesia d 25 0 1Malaysia 10 0 3Philippines 20 3 0Saudi Arabia 12 0 6South Korea 30 3 3Thailand 22 0 1Turkey e 2 0 6United States 6 0 11Vietnam f 40 5 1Other 0 0 25
Total (weighted average) g 10.5 2.2 100
a There are tariffs on various other gold products, but jewellery and bullion represent the mostwidespread tariffs here. Tariff rates are approximate and may include numerous subcategory tariffs.Jewellery includes Australian Harmonised Export Commodity Classification Codes (AHICC) 7113–7115; bullion includes AHICC 7108 (ABS 1996b). b Market share is based on a country’s share ofworld gold fabrication in 1997 (Gold Fields Minerals Services 1998) c Applies to plain gold jewelleryitems only. Gem set jewellery to India is banned. Tariff is calculated on the basis of a 6 per centimport duty and a 4.5 per cent premium for purchasing a Special Import Licence through an Indianresident partner. d A 40 per cent rate applies to ASEAN countries eApplies to non-EU countries only;60 per cent applies elsewhere. f Bullion imports to Vietnam are subject to authorisation of the StateBank of Vietnam, which set a quota of 34 tonnes on imports in 1996 (World Gold Council 1997). g Averages weighted by market shares.

46 ABARE research report 99.8
The modern world gold ‘market’ only came into existence following the abolitionof the Bretton Woods gold–US dollar exchange system in 1973. Given the USgovernment’s concern over controlling the value of gold under the Bretton Woodssystem, private US citizens were not allowed to buy or sell bullion. After thecollapse of the Bretton Woods system in 1973 and a move to a managed floatingexchange regime, this concern for controlling private gold holdings disappeared.The restrictions were formally removed in 1975. Similar restrictions wereremoved in other countries such as Japan (1973) and the United Kingdom (1979)following the deregulation of ‘Bretton Woods era’ foreign exchange tradingregulations (Warwick-Ching 1993).
Following these reforms in developed countries during the 1970s, similarliberalisation of gold bullion trade has proceeded in developing countries duringthe 1980s and 1990s. The liberalisation of Turkey’s gold trade in the 1980sresulted from broader financial and economic liberalisation of the Turkisheconomy during that time (Ertuna 1994). Prior to these reforms, gold importsinto Turkey were banned, although annual (illegal) imports of around 80 tonneswere smuggled into the country. Following Turkey’s liberalisation of gold trade,domestic gold price premiums rose by around 85 per cent, contributing to sig-nificant growth in Turkey’s gold jewellery export industry (Ertuna 1994).
Similar gold trade liberalisation measures have recently been undertaken in India(as part of broader economic liberalisation since 1991) after the economy suffereda major balance of payments crisis (Baru 1991). Prior to 1991 private gold bullionownership and imports were banned in India, leading to significant domesticprice premiums over world prices (reflecting the additional costs of smugglinggold into India). After removing the Gold Control Actin 1991, India progres-sively liberalised importation controls on gold. Over the period 1992–94, schemeswere enacted to allow nonresident Indians to import up to 10 kilograms a year,and similar Special Import Licence schemes were set up for gold jewellery andother products exporters. Unofficial (smuggled) imports have since fallendramatically (table 7), as have local price premiums (down from US$200 anounce in 1990 to less than US$20 an ounce in 1998) (figure 20).
In 1997 a group of experts brought together by the Ministry of Finance and theReserve Bank of India outlined plans for full capital account convertibility of therupee (Baru 1997). Following this, the Open General Licence importing schemewas introduced in October 1997, whereby eight banks and three authorisedimporting agencies are allowed to freely import gold bullion subject to the currentrate of 250R/10g imports, equivalent to a 6 per cent import tariff at current rates.The tariff rate was originally set at 225R/10g in 1997, then raised in May 1998(following depreciation of the rupee and the threat of economic sanctions followingIndia’s nuclear detonations) as a means of increasing foreign exchange revenues.The tariff was again raised in January 1999 to 400R/10g (equivalent to a 10 percent import tariff).
4 Financial liberalisation and gold bullion

generally larger and more widespread than those on gold bullion reflects thedifferent economic policy and industry protection objectives of these tariffs.
Gold bullionSince the breakdown of the Bretton Woods system in 1973, rapid financialliberalisation in many economies has been accompanied by liberalisation ofthe gold bullion trade (see box 4 for an overview). The latter has tended tofollow broader financial and economic liberalisation because a governmentthat opens up its foreign exchange and capital markets to global trade nolonger has an incentive to control bullion trade (that is, allowing a country’scitizens to buy and sell foreign exchange freely is analogous to allowingthem to buy and sell gold bullion freely) (Frankel 1994).
Gold bullion trade was liberalised in most developed countries during the1970s. Important reforms occurred in Turkey during the 1980s and in Indiaduring the 1990s. Policy on gold bullion trade in India changed from anoutright ban on imports in 1990 to a modest 6 per cent import tariff. As aresult, domestic gold premiums (the difference between the domestic goldprice and the world gold price expressed in domestic currency terms at offi-cial exchange rates) have fallen dramatically in that country, smuggling hasdeclined, and domestic prices have approached equivalent world prices aslegal import volumes have increased (figure 20).
The extent of these recent reforms to gold bullion trade in India, Turkey andother important gold consuming economies has significantly reduced bar-riers to world gold bullion trade, with modest imports tariffs remaining inIndia, China, Vietnam and Brazil (table 6). (As discussed earlier, China and
47Australia in the world gold market
Indian gold imports and price premiums20
1990 1991 1992 1997
t
300
200
100
400
500
700
600
US$/oz
120
80
40
160
200
280
240
1993 1994 1995 1996
Source: Gold Fields Minerals Services (1998)
Unofficial imports
Official imports
Domestic premiums

Vietnam also impose nontariff barriers on gold bullion imports, but the equiv-alent tariff of these restrictions has not been determined.) These historicaltrends in financial and gold bullion trade liberalisation, and the prospect ofprogressive foreign exchange and capital market deregulation in China,Vietnam and other developing countries in the next decade, suggest goldbullion trade liberalisation is likely to continue over the medium to longerterm.
Jewellery and other semimanufactured gold productsDespite the progress made on the liberalisation of gold bullion trade, restric-tions on trade in gold jewellery and other gold products remain widespread.This reflects the domestic industry interests and other socioeconomic factorsthat influence trade policies for such manufactured products.
It is apparent that significant jewellery import tariffs occur in some coun-tries with substantial local jewellery manufacturing industries, such as India,Thailand, Saudi Arabia, the United Arab Emirates and the United States.Protection appears to be concentrated in markets where gold manufacturing(such as jewellery making) is particularly labor intensive. This associationsuggests that gold-using manufacturing industries that sustain high levels ofregional employment may exert considerable influence over levels of protec-tion from competitive gold imports.
A good example of this is the ban of gem-set jewellery imports to India(where the manufacture of gem-set items is fairly labor intensive). Companieswanting to import plain gold jewellery into India must find a resident part-ner to obtain a special import licence (which sells at a premium of over 4 per cent). The importer then has to pay an import duty of around 6 per cent,leading to an equivalent import tariff (ignoring the transaction costs of obtain-ing the licence) of around 11 per cent (table 5).
Gem-set imports are also highly restricted in Thailand, where such jewelleryis both exported and part of the tourism trade.
Government support of tariffs on gold jewellery imports in some develop-ing countries may also reflect the de facto ‘luxury tax’ nature of these restric-tions. In India, China and other ‘eastern style’ jewellery markets, domesticprices of high carat, traditional style jewellery items may not be maintainedat levels that reflect the full extent of import tariffs because there are highlevels of domestic price competition. On the other hand, domestic prices atthe ‘higher end’ of the jewellery market in these countries (which typically
48 ABARE research report 99.8

includes ‘western’ style jewellery items that have a higher fabrication valueadded component and per unit cost) are likely to be increased by the fullextent of import tariffs.
Thus, import tariffs may effectively discriminate against the high value endof jewellery markets, and thereby serve as a form of ‘luxury taxation’ onexpensive ‘western’ style jewellery imports. From an economic perspective,a single tax on expensive gold jewellery items — rather than an import tariffthat affects both consumption and domestic production decisions and distortsjewellery trade — could achieve this objective more effectively.
Benefits of world gold trade liberalisation
Trade protection related restrictionsGold is traded competitively in an extensive network of global spot andforward markets (O’Callaghan 1993), which have been found to be efficient(that is, when the gold price fully reflects market information) using stan-dard tests (see Sjaastad and Scacciavillani 1996). The evident ability ofcompetitive world markets to efficiently provide gold and jewellery commod-ities and products means, from a global perspective, that social welfare wouldbe maximised by liberalising remaining barriers to gold and jewellery tradeand enabling open and competitive markets for that trade. (This assumes thatthe hoarding of gold by central banks does not create [removable] distor-tions in world gold trade.)
Removal of trade barriers would mean that consumers in previously restrictedmarkets would benefit by being able to purchase additional gold and jewelleryat lower domestic prices. Social gains would also be realised where resourcespreviously used in protected gold mining and manufacturing industries wereredirected to other more socially valued uses. Producers of jewellery andgold in the rest of the world would benefit from being able to provide addi-tional output to these markets. These effects would be of net benefit to soci-ety over the longer term, although the recipients of protection would faceadjustment costs in the short term.
Monetary policy and exchange control related restrictionsA few countries retain restrictions on gold trade for monetary reasons, andthere may be some justification for continuing these restrictions until widereconomic reforms proceed. These restrictions may be valid if it is likely that
49Australia in the world gold market

private gold bullion ownership and trade (without subsequent removal ofrestrictions on foreign exchange transactions) could destabilise the domes-tic currency (and lead to associated economic losses) through citizens prefer-ring to use gold. The magnitude of these costs would clearly depend on anumber of factors, including the stocks of gold in relation to domestic moneysupply, citizens’ preferences for holding wealth in gold, and the transactionscosts involved.
In principle, the optimum order of liberalisation is to remove all trade, foreignexchange and capital distortions immediately (Caves, Frankel and Jones1993). However, where all barriers cannot be removed at once, research hasfound that international capital market liberalisation should follow domes-tic trade and capital market liberalisation (McKinnon 1991).
It is beyond the scope of this report to ascertain whether the few remainingbarriers to gold bullion trade may be justifiable under these conditions.However, the issue of gold bullion trade liberalisation is of secondary impor-tance to liberalisation of world gold jewellery trade for two reasons. First,tariffs on gold bullion are not large or widespread compared with tariffs ongold jewellery (table 6). Second, it is apparent that tariffs on world goldbullion trade are progressively being eliminated as broader economic andfinancial liberalisation proceeds in developing countries.
Smuggling and domestic competition issuesThe existence of smuggling can reduce the economic efficiency losses fromtrade restrictions, and subsequently reduce the potential net benefits of liber-alisation (Pitt 1981). Given gold’s high per unit value, it is easily smuggled:black markets for gold have operated widely in the past, and continue incountries that impose substantial trade restrictions.
Prior to India’s removal of the Gold Control Act in 1990, ownership andtrade of gold bullion was prohibited. However, the unofficial gold flow intoIndia was 222 tonnes in 1989 — equivalent to 9 per cent of world fabrica-tion demand in that year (figure 20). Similarly, domestic gold consumptionin Vietnam was estimated at around 20 tonnes in 1997, yet no gold wasimported through the official State Bank of Vietnam quota scheme (GoldFields Minerals Services 1998, p. 16). Market analysts also suggest, despitethe restrictions on gold jewellery and bullion imports to China, that signif-icant volumes of gold jewellery are smuggled into China from Hong Kongand Singapore (Gold Fields Minerals Services 1998, p. 49).
50 ABARE research report 99.8

Another factor that may reduce the effect on domestic gold prices of goldtrade import restrictions is the extent to which domestic competition inprotected gold manufacturing industries undermines any price advantagesderived from such restrictions. The average making charge on plain goldjewellery in India, for example, is around US$4 an item (Naqvi 1998).Moreover, domestic competition (among over 250 000 jewellery stores withinIndia) keep these costs low. Thus, it is unlikely that tariffs on plain goldjewellery in India significantly affect the domestic prices of items with lowfabrication content.
However, the removal of existing barriers to jewellery imports would beexpected to benefit importers at the ‘higher value end’ of the jewellery market— that is, importers of lower carat ‘western style’ jewellery (which gener-ally has a higher value added component and per unit cost). For jewellerythat has a higher value added component, and that is diverse and differenti-ated from local products by virtue of its origin (for example, Italian designerjewellery), local prices tend to fully reflect the costs of import tariffs andother trade restrictions.
While the existence of black markets for gold and domestic competition forsome jewellery products may reduce the effect on domestic prices of goldjewellery trade restrictions, this does not mean that trade liberalisation willnot be beneficial. Given that black markets and smuggling reduce the effec-tiveness of barriers to trade, they undermine the value of setting high bar-riers and thus add to the argument for liberalisation.
Other distortions in the world gold marketDespite barriers to international gold trade being the most important formof distortion in the world gold market, Bannock, Doran and Turnball (1997)found numerous other regulatory policies that affect gold ownership andproduction in various countries. Some of these policies are generally consid-ered beneficial to the efficiency of the world gold market. Standards on goldand jewellery hallmarking, for example, ensure that all market participantshave equal information about the quality of products — a condition requiredfor markets to work efficiently.
Other gold regulations found by Bannock et al. (1997) that are likely to bedistortionary (that is, they lower economic efficiency) are restrictions onownership and production in China and Italy. In addition to the barriers togold trade in China, all gold producers in China are required to sell their
51Australia in the world gold market

output to the People’s Bank of China at the official price (which has beenabove the international market price); this amounts to a domestic produc-tion subsidy which leads to higher levels of gold production in China thanwould occur at world prices. However, deregulation of these policies affect-ing gold production, ownership and trade in China is likely to proceed aswider economic and financial liberalisation progresses.
Similarly, Italy has recently revoked laws restricting private investmentpurchases of gold bullion, and there is an amendment before the Italian parlia-ment to enable private investors to also sell bullion.
Gold taxationBannock et al. (1997) cited various domestic taxes on gold consumption aspossibly being discriminatory. However, the optimal (or efficient) level oftaxation on consumption of gold will tend to vary from country to country.It is difficult to identify aspects of gold taxation policies (for consumers) indifferent countries that may be economically inefficient. Moreover, the dif-ferent consumption taxation arrangements in various countries would makeit difficult to consider taxation reform issues as part of international nego-tiations.
One possible exception relates to the differential treatment of taxation onfinancial transactions from gold sales for ‘commercial’ purposes. TheEuropean Union Commission released a directive in July 1998 to harmoniseall existing value added gold taxes in EU member states and to set the taxat zero on gold used for purely ‘financial’ transactions. It has not been ascer-tained whether this differentiation occurs in other economies, but it wouldappear to be appropriate (from an economic perspective) to tax purely ‘finan-cial’ transactions in gold in the same manner as similar transactions usingother forms of exchange.
Australia’s perspectiveFor Australia, two major groups are likely to benefit from further liberal-isation of international barriers to gold trade. First, Australian gold jewellerymanufacturers are likely to gain through increased access to overseas exportmarkets, and through higher prices (than otherwise may occur) for existingexports as world gold and jewellery consumption rises. Australian goldproducers also stand to gain through higher world gold prices, other thingsequal, given that they are price takers in the world gold market.
52 ABARE research report 99.8

The nature of gold jewellery markets with trade restrictions suggests thatAustralian jewellery manufacturers are unlikely to gain significantly fromadditional access to plain gold, high carat jewellery markets in parts of Asia,the Middle East and India, because domestic jewellery prices are unlikelyto fully reflect jewellery import tariffs. However, Australian jewellery manu-facturers would be expected to benefit from such tariff reductions throughgreater access to the ‘higher end’ of these markets (such as 14 and 16 caratjewellery items with a significant fabrication component), particularly wherespecific ‘Australian origin’ jewellery has a premium.
The benefits to Australian jewellery manufacturers from increased access tothe restricted jewellery markets (table 6) could be expected to increase overtime as incomes in these regions increase. Benefits are especially likely toincrease if jewellery tastes shift toward more ‘western style’ products. Recentanalysis has found rising consumption of gem-set jewellery in China andgrowing levels of 14 carat jewellery manufacture in Turkey — two marketsthat have traditionally sold 22 carat, plain gold items (Gold Fields MineralsServices 1998).
Presently, the Australian government is pursuing the issues of gold jewellerytrade liberalisation through the Asia Pacific Economic Cooperation (APEC)forum’s Early Voluntary Sectoral Liberalisation Process, and various othermultilateral and bilateral negotiations through APEC. Future negotiationsthrough the World Trade Organisation may also provide a forum for pursu-ing these trade liberalisation issues.
Unlike Australian jewellery manufacturers, which face differentiated poten-tial markets, Australian gold producers essentially operate in a global,homogenous product market — that is, world gold demand for bullion.Australian gold producers may benefit from further gold trade liberalisationwhere such reforms result in lower domestic jewellery prices in restrictedmarkets, leading to higher gold jewellery consumption in these markets andtherefore higher world gold consumption and prices than would otherwiseoccur.
Import tariffs on gold jewellery represent the most widespread and signifi-cant barrier to world gold trade. ABARE used a simple model of the worldgold and jewellery markets (appendix B) to estimate changes in world goldprices that would result from the simultaneous removal of all of the goldjewellery tariffs shown in table 6. The results of this analysis are presentedin table 7.
53Australia in the world gold market

The impact on the world gold price of removing existing import tariffs ongold jewellery is sensitive to the price responsiveness of gold supply fromboth mine production and aboveground stock sales. The more responsivethese sources of supply, the smaller the increase in the world gold price whentariffs on gold jewellery imports are removed.
Given considerable uncertainty about investor and central bank market behav-ior over the medium term, ABARE used a wide range of price elasticitiesfor sales of aboveground stocks. Values from zero to 10 were tested to illus-trate a feasible range of potential (long term) price increases (table 7).
A price elasticity of zero for sales of aboveground stocks (which producesthe largest increase in the equilibrium price of gold — 5.4 per cent) repre-sents a scenario in which sales of such stocks do not change when worldgold prices increase. A price elasticity of 10 represents a scenario in whichannual sales of aboveground stocks increase by 26 per cent (or around 510tonnes) when world gold prices increase by 2.6 per cent following liberali-sation. Despite using this range in potential supply responses from above-ground stocks, the range of resulting world gold price increases flowing fromthe removal of tariffs is reasonably limited: from ranging from 1.7 to 5.4 percent (table 7).
The long term price elasticity of gold production in Australia was found tobe 2.15 (chapter 2). Thus, given the future removal of current tariffs on goldjewellery imports shown in table 6, Australian gold production could increaseby an estimated 4–12 per cent.
54 ABARE research report 99.8
7 Estimated changes in the world gold price from the removal of worldgold jewellery import tariffs a
Elasticity of aboveground stock sales
Zero Mid High(0.0) (5.0) (10.0)
Change in world gold price on tariff removal (%) b 5.4 2.6 1.7
Other assumptionsPrice elasticity of world gold production 2.15 2.15 2.15Price elasticity of gold jewellery demand c –0.85 –0.85 –0.85
a See appendix B for a detailed explanation of the method and assumptions underpinning theseresults. b This is a long term equilibrium price increase, and prices may increase by more or less thanthis amount initially. c Elasticity of gold in jewellery demand with respect to the gold price.

The modeling approach used to derive these estimates is necessarily sim-plified. Issues with these simplifications and their effect on the overall analysis are discussed in appendix B. Nevertheless, the results show a rangeof price increases that suggests that gold jewellery trade liberalisation is aworthwhile policy objective, not only for exporters of Australian jewellery,but also for Australian gold producers (via the indirect price and volumebenefits).
55Australia in the world gold market

Projecting Australian gold supply inthe medium term
ABARE developed a model of Australian gold supply based on an observedrelationship between production and capital stock in the Australian goldmining industry. This model also uses estimated relationships between price,exploration expenditures and capital investment to project the level of capi-tal stock (and thus production) over the medium term. This appendix containsthe method and key assumptions underpinning the structure and estimationof the model.
Harris (1984) provides an overview of various means of forecasting mineralsupply, ranging from geostatistical to purely econometric. The approachtaken here is econometric: production is determined by economic variablesalone. This approach is appropriate for the medium term projections under-taken in this report; it may not be as appropriate for long term projecting,because the likelihood of significant changes in geological factors (such asthe quantity and quality of available resources) and technological factorstends to increase as the projection period increases (Harris 1984).
Selvanathan and Selvanathan (1996) estimated a long run price elasticity forthe gold mining industry in Western Australia using a model specified inlevels that directly related price to production. The model developed in thisstudy breaks the gold production process into three stages, with price havingdifferent influences on the various stages. Further, ABARE specificallyaddressed the nonstationarity of the data series and incorporated an estimateof the rate of technological change in the 1980s in the model specification.
Model structureIt is assumed that demand for the output of Australian gold producers isperfectly elastic at any point in time. This assumption is valid given thatAustralian producers (like their overseas counterparts) have been found tohave no market power over world gold prices (Sjaastad and Scacciavillani1996), and that annual gold production in Australia is small compared withworld production and the supply from aboveground stocks.
Given an exogenous gold price, Australian producers are expected to seekto maximise profits subject to constraints, including current and expected
56
A
ABARE research report 99.8
Appendix

future world gold prices, mining costs and technology. Production theory isused to specify a simplified gold supply function.
Modeling productionA relationship is postulated to exist between Australian gold mine produc-tion in the medium to longer term and the capital stock (the value of goldmining plant and equipment in constant dollars) in gold mining. This assump-tion is based on there being a close relationship between the capital stockand Australian gold production (figure 21).
The ratio of capital (in dollars) to output in the gold mining industry declinedduring the 1980s (figure 21). This period of change coincides with the intro-duction of carbon-in-pulp and carbon-in-leach technology to gold ore process-ing in Australia, which led to significant increases in exploration, capitalinvestment and production.
To account for this important influence, the model incorporates the rate atwhich this technology was adopted in Australia (TM) in the estimated produc-tion equation. The general form of the production equation is shown in equa-tion 1.
Gold production – general form(1) Qt = f(Kt, Tt
M)
where
Qt = gold production in year t
Kt = gold mining capital stock in period t
TtM = gold mining technology at t
The gold mining capital stock shown in figure 21 was derived from histor-ical gold mining capital investment expenditure series, using the perpetualinventory method (see Walters and Dippelsman 1985). In calculating levelsof the capital stock, it was assumed that capital expenditure takes two yearsto become productive capacity, and that the rate of depreciation (15 per centa year) is constant over the estimation period. This method is shown in equa-tion 2 and the data are shown in table 8.
57Australia in the world gold market
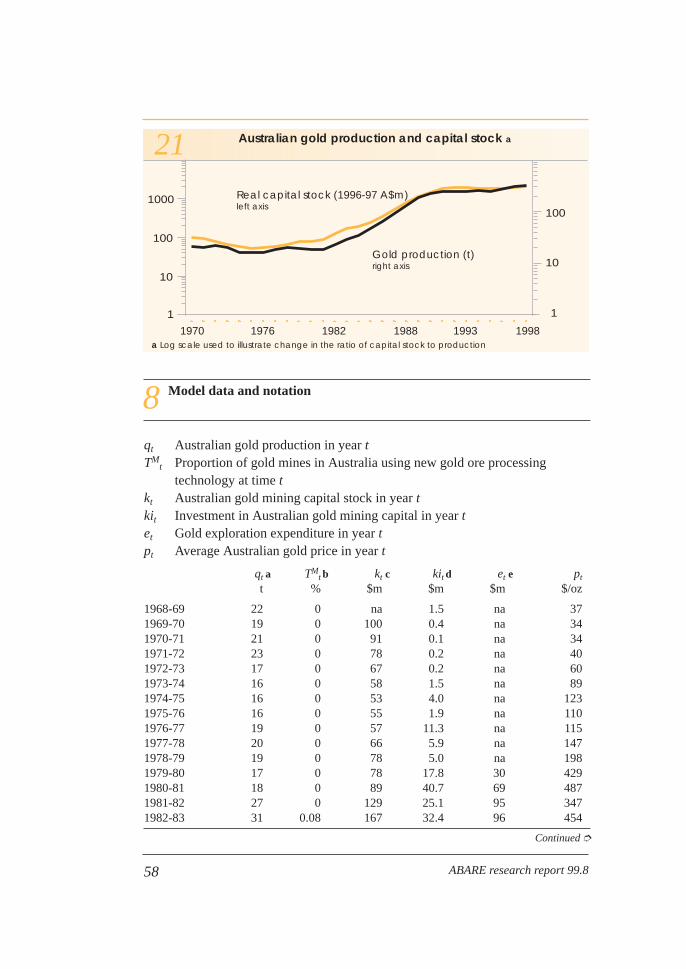
58 ABARE research report 99.8
8 Model data and notation
qt Australian gold production in year tTM
t Proportion of gold mines in Australia using new gold ore processing technology at time t
kt Australian gold mining capital stock in year tkit Investment in Australian gold mining capital in year tet Gold exploration expenditure in year tpt Average Australian gold price in year t
qt a TMt b kt c kit d et e pt
t % $m $m $m $/oz
1968-69 22 0 na 1.5 na 371969-70 19 0 100 0.4 na 341970-71 21 0 91 0.1 na 341971-72 23 0 78 0.2 na 401972-73 17 0 67 0.2 na 601973-74 16 0 58 1.5 na 891974-75 16 0 53 4.0 na 1231975-76 16 0 55 1.9 na 1101976-77 19 0 57 11.3 na 1151977-78 20 0 66 5.9 na 1471978-79 19 0 78 5.0 na 1981979-80 17 0 78 17.8 30 4291980-81 18 0 89 40.7 69 4871981-82 27 0 129 25.1 95 3471982-83 31 0.08 167 32.4 96 454
Continued ➮
Australian gold production and capital stock a21
1970 1976 1982 19981988 1993
Real capital stock (1996-97 A$m)left axis
1
10
100
1000
1
10
100
Gold production (t)right axis
a Log scale used to illustrate change in the ratio of capital stock to production

59Australia in the world gold market
8 Model data and notation Continued
1983-84 40 0.15 186 81.4 152 4331984-85 59 0.29 239 120.3 177 4231986-87 110 0.59 521 362.0 357 6211987-88 157 0.73 787 482.8 581 6291988-89 204 0.88 1116 559.5 449 4951989-90 244 1.00 1482 491.7 341 4991990-91 236 1.00 1784 331.3 301 4771991-92 244 1.00 1916 252.1 305 4571992-93 248 1.00 1909 239.0 320 4891993-94 255 1.00 1854 267.0 454 5501994-95 253 1.00 1808 398.5 555 5201995-96 289 1.00 1842 479.7 547 5161996-97 314 1.00 1974 359.7 728 4661997-98 311 1.00 2083 na 648 451
a Production is in calendar years — that is, 1968-69 = 1969. b ABARE estimate of the proportion ofgold mines in Australia that had adopted new CIP–CIL technology where such technology wasappropriate for ore extraction. Based on historical mine production databases and the number of minesthat were using Merill-Crowe/Gravity processing techniques compared with those using the newtechnology. c Real capital stock calculated using ABS capital investment series deflated with the costof capital index and the capital accumulation identity (equation 1). The starting value of the goldmining capital stock in 1966-67 was estimated on the basis of ABS estimates of total mining capitalstock–output ratios (Walters and Dippelsman 1985) applied to the gold industry’s share of miningoutput in 1969-70. d Capital investment on mine development and plant and equipment (ABS 1998b).Observations for 1984-85 and 1985-86 are missing from the ABS series and are interpolated on astraight line between the 1983-84 and 1986-87 values. ePrivate mineral exploration expenditure in thegold mining industry (ABS 1998a). na Not available.
Calculation of the capital stock
(2) Kt = (KIt–1 + KIt–2)/2 + (1–0.15) Kt–1
where
KIt = investment in gold mining capital stock in period t (see table 8 for data)
Kt = capital stock in period t
Other factors (such as the cost of inputs other than capital to gold mining)may have affected past levels of gold mine production. The costs and produc-tivity of these other factors of production are assumed to remain unchangedand, because this model is used to generate medium to longer term forecasts,the effects of factors that may influence production in the short term (whilethe level of mining capacity is fixed) are ignored.

Modeling capital investment and explorationGiven the capital accumulation identity (equation 2) used to calculate thecapital stock and the relationship between production and the capital stock(equation 1), projections of the level of capital investment in gold miningare required for projecting Australian gold production. The level of capitalinvestment undertaken to develop identified economic resources largelydepends on the expected returns to such investment; in turn, expectations offuture gross revenue per unit of gold production (gold output price lessmarginal production cost) and the costs and productivity of gold mining capi-tal are assumed to be the major determinants of expected returns to capitalinvestment in gold mining (equation 3).
Further, given that capital investment to extract identified resources willfollow from exploration to find such resources, levels of capital investmentare expected to be related to the amount of recent discoveries. However,exploration expenditures (rather than recent discoveries) were used in thismodel because it is difficult to obtain consistent time series data on recentadditions to gold resources (equation 3).
Capital investment – general form
(3) KIt = f(rE, e, TM, k)
where
KIt = capital investment
rE = expected gross revenue per unit of gold mine production
e = exploration expenditure
TM = productivity of gold mining capital
k = cost of gold mining capital
Given that past levels of exploration expenditure are relevant to the capitalinvestment decision in gold mining, it is necessary to project levels of ex-ploration expenditure in this model to project production. As with capitalinvestment, it is postulated that expected returns to exploration expenditureare the major determinant of levels of such expenditure in Australia.Intuitively, expected returns to exploration will partly reflect expected returnsto capital investment in gold mining, but also the expected costs and risksof searching for new deposits. Given the complexities raised by these risks
60 ABARE research report 99.8

with exploration, ABARE used a simple empirical approach in estimate thegeneral form of the exploration equation (equation 4).
Exploration expenditure – general form
(4) Et =
Et = exploration expenditure
= expected returns to exploration
Key resultsABARE derived medium term projections in chapter 3 (figure 19) by initiallyprojecting future exploration expenditure (equation 4) based on the priceassumptions in table 10. Capital investment (equation 3) was subsequentlyprojected using the projected exploration expenditure series and price assump-tions. Future capital stock values were then calculated using the capital stockidentity (equation 2), with capital stock used in forecasting production (equa-tion 1). The final forms of the estimated equations are presented in the nextsection as equations 6, 7 and 8.
Prices, which enter the final model specification via the capital investmentand exploration equations (equations 7 and 8 respectively) have a positiveand significant effect on production. A once-off 1 per cent increase in thenominal Australian dollar gold price (presuming no changes in nominal capi-tal investment or gold mining costs in Australia) has a long term impact of2.15 per cent on the level of production. For comparison, Selvanathan andSelvanathan (1996) derived a long term price elasticity of 2.47 per cent (basedon Western Australian gold production and constant dollar gold export unitvalues for 1915–94).
The production projections tends to fluctuate more in the short term than dothe production projections derived from mine survey data (figure 18), butthey stabilise over the medium to long term as the relationship between capi-tal stock and production comes to dominate the short term fluctuations. Thisresult is acceptable given that the purpose of this model is to project theunderlying trend in the medium to long term.
The rate at which production responds to price changes is shown in figure22. The medium term focus of the model is explained by the fact that an
r lE
exp
f r lE( )exp
61Australia in the world gold market

impact elasticity of unity (a 1 per cent change in production in response toa 1 per cent change in price) is only achieved after five years.
Empirical specification and estimation of the model
DataThe data used in estimating the model equations are shown in table 8. Priceand capital investment were available in fiscal years for the past 30 years,but the production series data were in calendar years. To estimate the produc-tion equation, the fiscal year level of capital stock is taken to be the levelfrom half a year later — for example, 1997-98 was set to 1998. Further detailson the series are provided as footnotes in table 8.
Approach to estimationEstimation of nonstationary series by the ordinary least squares method(OLS) will generally bias the inference that there is a relationship betweentwo variables when one does not exist (Pindyck and Rubinfeld 1991). Allseries in this model were tested for nonstationarity using the augmentedDickey-Fuller (ADF) testing procedure, and they were determined to benonstationary over the relevant sample periods.
The production equation is estimated using an error correction model (ECM)specification. The ECM format is a convenient representation that combinesshort term and long term dynamics. The exploration and capital investment
62 ABARE research report 99.8
Impact elasticity of a change in the Australian dollar gold price a22
0 5 10 30
%
1.5
1.0
0.5
2.0
15 20 25a Calculated for a once-off, infinitesimal change in the US dollar gold price at time t.
Asymptotic impact elasticity at time t+i

equations were estimated separately using OLS with differenced variables.Both methods are econometrically valid when applied to nonstationary series.
Model estimation, testing and projecting was undertaken using the TSP statis-tical package (Hall and Cummins 1997). Specifications in both levels andlogarithms were tested, with logarithms generally favored in terms of regres-sion statistics. To facilitate forecasting, intercepts (equivalent to a trend inlevels) were excluded from all equations in differences.
Price expectations, technological change and adjustment mechanismsPrice expectations, being unobserved, are assumed to be related to recentlyobserved prices. Two or three lags on the gold price were used in each equa-tion in place of a price expectations variable. The coefficients on the pricevariables were estimated, and significant (positive) lags were included in thefinal specification and estimation of the exploration and capital investmentequations.
To capture the effect of the technological change in the 1980s on gold miningcosts (and thus profitability), ABARE constructed a technology index (table8) based on the estimated proportion of gold mines in Australia that hadadopted the new CIP–CIL technology, where this process was viable. Theimpact or dissemination of technology often follows a sinusoidal path overtime (Shah, Zilberman and Chakravorty 1995). To allow for this possibility,the technology index (with a cubic form) was introduced into the originalspecification of the production equation. (The cubed term, (TM)3, was subse-quently determined to be insignificant and dropped from the final specifi-cation.)
Some delays in adjustment toward the desired levels of expenditure andproduction are expected. The implementation of capital investment programs,for example, typically occurs over a number of years. Thus it can be expectedthat some lagged values of the variables may also be significant indicatorsof the current level. To allow for some adjustment over time, two or threelags of the appropriate variables were included in the general specificationof each equation. The coefficients on the lagged variables were estimated,and significant lags were included in the final specification.
Equation estimation and diagnostic statisticsIn the equation notation, variables expressed in lower case are in naturallogarithms and ∆ is the difference operator. A list of model variables and
63Australia in the world gold market

data are provided in table 8. While price and capital investment were avail-able in fiscal years for the past thirty years, the production series data are incalendar years. For the purposes of estimating the production equation, thefiscal year level of the capital stock is taken to be the level at half a year later— for example, 1997-98 is set to 1998. Further details are provided as foot-notes in table 8.
Production–capital stock relationshipA long term relationship is postulated to exist between the level of the capi-tal stock, gold mining technology and the level of production. A two lagvector autoregression was constructed to estimate and test for the existencethis relationship, and a long term relationship was found to be statisticallysignificant (equation 5).
Long term relationship between production and capital stock(5) qt = 0.95 + 0.45kt
(0.36) (0.083)
Coefficients estimated and testing using Johansen techniques (Johansen and Juselius1990) for the analysis of cointegrating relationships. Asymptotic standard errors arein parentheses.
The coefficient on the capital stock variable is highly significant in the longterm and indicates a positive relationship between the levels of capital stockand production.
The final specification of the OLS production equation included the esti-mated long term relationship in the form of an error correction term, alongwith a lagged (differenced) production variable and the technological changevariables to capture short term dynamics (equation 6). The adjustment co-efficient on the error correction component of equation 6 (–1.12) is statis-tically significant and of the expected sign.
Production(6) ∆q = 0.45 ∆qt–1 –1.12 (qt–1 – 0.5kt–1 –1) + 2.2 TM
t – 0.9 (TMt)2
(2.7) (–4.3) (5.9) (–2.8)
Sample 1972 –1998; R2 0.71; F statistic 18.3
t statistics are in parentheses. The 5 per cent critical value is ±2.07. The 5 per centcritical value is 3.03.
64 ABARE research report 99.8

All variables in the final equation are statistically significant at 5 per cent.The signs and magnitudes of both technology coefficients, TM and (TM)2,indicate that the new technology had a larger impact in the earlier years ofthe period of technological change. The model appears adequate for esti-mating production, both in terms of fit and capturing a number of turn-ing points in the series (figure 23). The effect of new technology over the1982–90 period is well represented.
Diagnostic tests on the residuals ofthe estimated production equationdid not reveal any potential prob-lems (table 9).
Capital investment As outlined above, two equationswere estimated to project capitalinvestment. Projections from theexploration expenditure equation(equation 4) feed into the capitalinvestment equation (equation 3).In estimating these equations, itbecame apparent that there were dif-ferent relationships between their variables in the periods before and afterthe technological change. Hence, the estimation of these two equations wasrestricted to observations after 1982-83, presuming that new investment inexploration, plant and equipment over this period was undertaken largely onthe basis of the new technology.
65Australia in the world gold market
Actual and fitted values – production23
1974 1978 1982 1998
dqt
–0.25
–0.50
0.25
1986 1990 1994
Actual
Fitted
9 Diagnostic tests – production
Test 5% criticalDiagnostic test statistica value
Autocorrelation b 0. 007 3.8Heteroscedasticity c 1.2 3.8Functional form d 0.1 3.8Normality e 0.6 5.9
a Lagrangian multiplier versions of each test. b Lagrangian multiplier test for first orderautocorrelation. c Lagrangian multiplier test forfirst order heteroscedasticity. d Ramsey’s RESETtest of functional form. eJarque–Bera test ofnormality of residuals.

An index of gold mining technology and the cost of gold mining capital(proxied by the fixed capital investment deflator of the Australian Bureauof Statistics) were available, but not suitable data on marginal gold miningproduction costs. (The Australian consumer price index was initially includedas a possible indicator of changes in per unit gold mining costs, but it wasfound to be insignificant.) Similarly, the gold mining capital cost variablewas not included in the final specification because it was not statisticallysignificant.
In the final estimated form, capital investment in gold mining in Australiawas estimated as a function of lagged values of exploration, ∆et–1 and theAustralian dollar gold price, ∆pt (equation 5).
Capital investment(7) ∆kit = 0.9 ∆et–1 + 1.3 ∆pt
(5.7) (3.4)
Sample 1984-85 to 1996-97; R2 0.76; F statistic 34.4
t statistics are in parentheses. The 5 per cent critical value is ±2.201. The 5 per centcritical value is 4.84.
The coefficients on all variables are significant at 5 per cent and of theexpected sign. The results of the estimation suggest that the capital invest-ment process is adequately represented, and that the model reasonablycaptures the major changes in capital investment (figure 24).
66 ABARE research report 99.8
Actual and fitted values – capital investment24
1974 1978 1982 1998
dkit
–0.25
–0.50
0.75
0.50
0.25
1986 1990 1994
Actual
Fitted

Diagnostic tests on the residuals donot reveal any potential problems(table 10).
Estimating explorationThere are significantly higher risks,additional costs and longer timeframes with investment in gold ex-ploration than with investment ingold mining capital. For this reason,it may be expected that the estimatedform of the exploration equation willdiffer from the capital investmentequation.
Given the complexities raised by the different costs and risks of exploration,ABARE used a simple empirical approach to estimate the relationshipbetween exploration and the gold price.
In the final equation (equation 8) exploration expenditure was estimated asa function of lagged exploration expenditure, ∆et–1, and the current and laggedAustralian dollar gold prices, ∆pt and ∆pt–1. To account for the unexpectedincrease in exploration in 1996-97 (which could not be adequately capturedby the price variable), a dummy variable, D96-97, was incorporated in theestimation.
67Australia in the world gold market
10Diagnostic tests – capitalinvestment
Test 5% criticalDiagnostic test statistica value
Auto-correlation b 0.03 3.84Heteroscedasticity c 0.2 3.84Functional form d 1.3 3.84Normality e 3.8 5.99
a Lagrangian multiplier versions of each test. b Lagrangian multiplier test for first order auto-correlation. c Lagrangian multiplier test for firstorder heteroscedasticity. d Ramsey’s RESET testof functional form. eJarque–Bera test of normalityof residuals.
Actual and fitted values – exploration expenditure25
1986 1988 1990 1998
dkit
–0.25
–0.50
0.50
0.25
1992 1994 1996
Actual
Fitted

Exploration expenditure(8) ∆et = 0.3 ∆et–1 +1.5 ∆pt + 1.05 ∆pt–1 + 0.45Dt
96-97
(3.5) (7.3) (4.9) (5.5)
Sample 1984-85 to 1997-98; R2 0.93; F statistic 41.5
t statistics are in parentheses. The 5 per cent critical value is ±2.23. The 5 per centcritical value is 3.71.
The coefficient on the price vari-ables are significant and of theexpected sign. The model resultsand the fitted values show that themodel is a reasonable representationof the changes in exploration expen-diture (figure 25).
Diagnostic tests on the residuals donot reveal any potential problems(table 11).
68 ABARE research report 99.8
11 Diagnostic tests – explorationexpenditure
Test 5% criticalDiagnostic test statistica value
Auto-correlation b 0.04 3.84Heteroscedasticity c 0.2 3.84Functional form d 0.01 3.84Normality e 0.3 5.99
a Lagrangian multiplier versions of each test. b Lagrangian multiplier test for first order auto-correlation. c Lagrangian multiplier test for firstorder heteroscedasticity. d Ramsey’s RESET testof functional form. eJarque–Bera test of normalityof residuals.

Illustrative model – effect on the worldgold price of removing tariffs on goldjewellery imports
ABARE developed a simple model to examine the effect on the world goldprice of removing all the import tariffs on gold jewellery (which werepresented in table 6). The results of this analysis are shown in table 7.
Key assumptions and model structureIn principle, the effect of removing all import tariffs on gold jewellery wouldbe a lower domestic price of gold jewellery in restricted markets, leading tohigher gold jewellery consumption in these markets and therefore a higherworld gold price. The illustrative model developed here estimates the magni-tude of the potential world gold price increase and examines the sensitivityof this result to key assumptions.
World jewellery marketFor the purposes of the illustrative model, gold jewellery was treated as aglobally homogeneous product, using estimated world averages for theproportion of gold in jewellery (caratage) and jewellery manufacturing costs.Annual gold jewellery consumption in a country was assumed to depend ongold jewellery prices in that country. For simplicity, price elasticities of goldjewellery consumption were assumed to be the same in all markets. (Notethat Batchelor and Gulley [1995] found that price elasticities of gold jewelleryconsumption in the United States, Germany, France, Italy, Japan and theUnited Kingdom were not significantly different.)
Further, it was assumed that the technology in jewellery manufacture usesinputs (including gold) in fixed proportions to output, and that prices of theseinputs are given and independent of volumes used. Domestic jewellery priceswere assumed to fully reflect the effect of any import tariffs on gold jewellery.
World gold marketGold jewellery accounted for around 80 per cent of world gold consump-tion in 1997, with industrial uses and (to a lesser extent) purchases of gold
69
B
Australia in the world gold market
Appendix
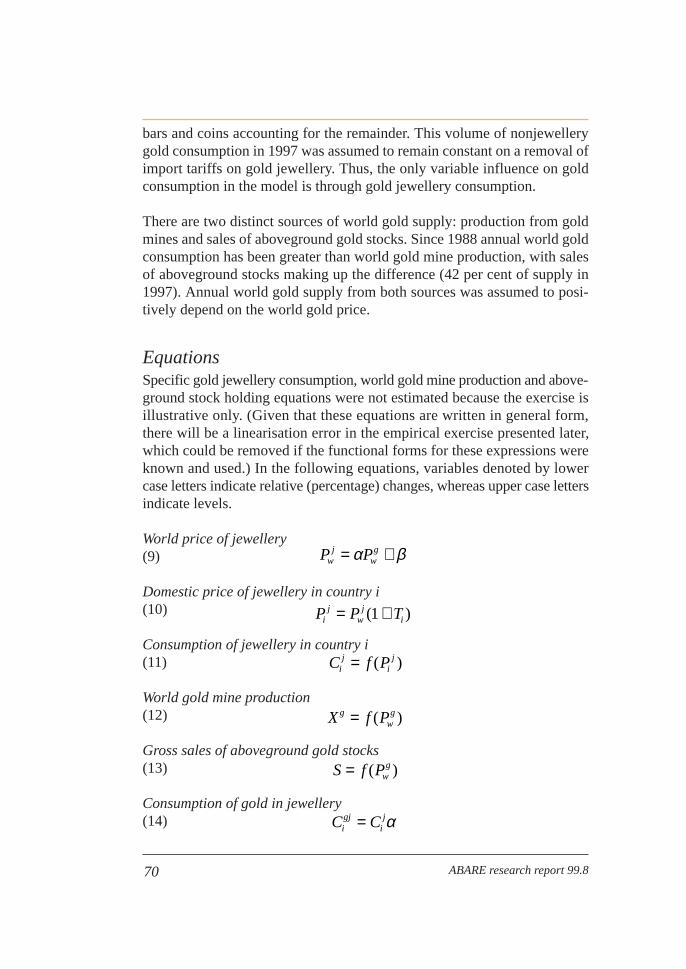
bars and coins accounting for the remainder. This volume of nonjewellerygold consumption in 1997 was assumed to remain constant on a removal ofimport tariffs on gold jewellery. Thus, the only variable influence on goldconsumption in the model is through gold jewellery consumption.
There are two distinct sources of world gold supply: production from goldmines and sales of aboveground gold stocks. Since 1988 annual world goldconsumption has been greater than world gold mine production, with salesof aboveground stocks making up the difference (42 per cent of supply in1997). Annual world gold supply from both sources was assumed to posi-tively depend on the world gold price.
EquationsSpecific gold jewellery consumption, world gold mine production and above-ground stock holding equations were not estimated because the exercise isillustrative only. (Given that these equations are written in general form,there will be a linearisation error in the empirical exercise presented later,which could be removed if the functional forms for these expressions wereknown and used.) In the following equations, variables denoted by lowercase letters indicate relative (percentage) changes, whereas upper case lettersindicate levels.
World price of jewellery(9)
Domestic price of jewellery in country i(10)
Consumption of jewellery in country i(11)
World gold mine production(12)
Gross sales of aboveground gold stocks(13)
Consumption of gold in jewellery(14) C Ci
gjij= α
S f Pwg= ( )
X f Pgwg= ( )
C f Pij
ij= ( )
P P Tij
wj
i= +( )1
P Pwj
wg= +α β
70 ABARE research report 99.8

World gold market clearing condition
(15)
If equations 9–15 are converted to linear equations in variables expressed interms of percentage changes from base year levels, then the following equa-tion can be obtained for the percentage change in the world gold price, ,on percentage changes in gold jewellery import tariffs, ti for each country i(equation 16).
(16)
where X(0) indicates the base level of variable X.
Endogenous variables= world jewellery price
= world gold price
= price of jewellery in country i
= annual consumption of jewellery in country i
= annual consumption of gold in jewellery in country i
= annual world production of gold
S = annual (gross) sales of aboveground gold stocks
Exogenous variables and parametersα = proportion of gold in jewellery
note:α = caratagex
= annual rate of nonjewellery gold consumption
β = manufacturing cost per ounce of jewellery
ηi = price elasticity of world jewellery consumption
Cog
10024
Xwg
Cigj
Cij
Pij
Pwg
Pwj
p
C tT
TX S P
PC
wg
igj
ii
ii
n
wg
jwg
wj i
gj
i
n= ++
=
=
∑
∑
( )( )
( )( ) ( )
–( )( )
( )
00
1 00 0 0
00
1
1
ε ση
α
Pwg
C C X Sigj
og
i
n
wg+ = +
=∑
1
71Australia in the world gold market

ε = price elasticity of world gold mine production
σ = price elasticity of aboveground gold stock sales
Ti = ad valoremimport tariff rate (expressed as a fraction) on goldjewellery in country i
Model estimation and resultsEquation 16 was used to calculate the effect on the world gold price of remov-ing all gold jewellery import tariffs shown in table 6. Key values for theinitial market conditions and parameters are shown in tables 12 and 13. Theresult of this analysis for the world gold price was shown in table 7, whilethe effects on jewellery prices and consumption in individual countries areshown in table 14.
Estimates of the price elasticity of gold jewellery consumption were takenfrom a recent study by Batchelor and Gulley (1995), who applied a seem-ingly unrelated regression model to data on gold in retail jewellery purchasesacross a range of developed countries. Batchelor and Gulley (1995) founddirect long term price elasticities of gold in jewellery (as a function of thegold price) in the range of –0.25 (France) to –1.1 (Japan). The weighted (bygold in jewellery consumption) average of the elasticities reported byBatchelor and Gulley for developed countries is –0.85.
Given that the price elasticity estimated by Batchelor and Gulley (1995) isthe elasticity of consumption of gold in jewellery with respect to the worldgold price, it is necessary to convert this to the elasticity of jewelleryconsumption with respect to the jewellery price (ηj), which is used in equa-tion 16. The relationship between these two elasticities (derived using equa-tions 9, 10 and 14) is shown in equation 17. The price elasticity of goldjewellery consumption of –1.5 was therefore derived from the weighted aver-age elasticity from Batchelor and Gulley (1995), and from estimates of theaverage markup of the jewellery price over gold content (300 per cent) andthe average gold in jewellery content (70 per cent) for the countries studiedby Batchelor and Gulley (after Warwick-Ching 1993).
(17)
where = elasticity of consumption of gold in jewellery with respect to
the world gold price.
ηp
j
wg
η η ηα
j
p
j wj j
wg g p
j wj
wgw
gwg
P C
P C
P
P= =
72 ABARE research report 99.8

Other key parameters used include the proportion of gold in gold jewellery(α in equation 9), which is related to plain gold jewellery caratage. An esti-mate of the weighted world average (by jewellery consumption) gold contentin jewellery of 82 per cent was used (table 14). This is close to 18 caratjewellery (24 carat gold jewellery has 100 per cent gold content, 18 carathas 75 per cent gold content, and so on), which has long been the standardin a number of leading jewellery manufacturing countries (Warwick-Ching1993). The average fabrication cost per ounce of gold jewellery was assumedto equal US$200 an ounce.
73Australia in the world gold market
12 Model’s parameter estimates
Parameter Description Value
Initial world gold price US$300/oz
α Proportion of gold in gold jewellery 82% (table 14)(by weight)
β World cost of gold jewellery manufacture US$200/ozper ounce of jewellery
Initial world price of gold jewellery US$346/oz
Initial annual consumption of gold in jewellery see table 14in country i
Initial annual world consumption of gold in 3328 tonnesjewellery
Annual rate of nonjewellery gold consumption 926 tonnesjewellery
S(0) Initial annual sales of aboveground stocks 1790 tonnes
Initial world gold mine production 2464 tonnes
η j Price elasticity of gold jewellery consumption –1.5
ε Price elasticity of world gold mine production 2.15
σ Price elasticity of aboveground stock sales 0–10
Ti(0) Gold jewellery import tariff in country i see table 14
ti(0) Percentage change in the import tariff in –100% for allcountryi countries
Xwg ( )0
Cog
Cigi
i
n
=∑
1
0( )
Cigj ( )0
Pwj ( )0
Pwg( )0

These assumptions imply an average 81 per cent mark-up of the jewelleryprice over the value of the gold content per unit of jewellery. This value waschosen as the weighted average of the markups that Warwick-Ching (1993)suggests are typical in eastern jewellery markets (10–20 per cent) and Europeor North America (200–400 per cent).
The impact on the gold price of removing existing import tariffs on goldjewellery is sensitive to the assumed value of the price elasticity of goldsupply from both mine production and aboveground stock sales. The moreprice elastic these sources of supply, the smaller the increase in the worldgold price following the removal of tariffs on gold jewellery imports.However, mine production takes time to respond to significant price changes,given the decision timing and development delays affecting gold producers.Thus, the price elasticity of world mine production would increase over time,to approach a long term value. In appendix A, the long term price elasticityof gold production in Australia was found to be 2.15, and this value was usedto proxy for the price elasticity of world gold mine production (table 13).
74 ABARE research report 99.8
13 Model’s initial market conditions
Ti a α b
t % %
Australia 5 0 1Brazil 21 5 2China 40 8 6Dubai 4 0 2European Union 4 1 9India c 15 6 22Indonesia d 25 0 1Malaysia 10 0 3Philippines 20 3 0Saudi Arabia 12 0 6South Korea 30 3 3Thailand 22 0 1Turkey e 2 0 6United States 6 0 11Vietnam f 40 5 1Other 0 0 25
Total (weighted average) g 10 2 100)
a See footnote to table 6 for detail. b α is assumed to be equal across markets because gold is treatedas a homogeneous product, but this column shows how the average value of α was determined.Estimate of caratage is derived from Warwick-Ching (1993, p. 205). c Weighted by share of jewelleryconsumption.
Cig

Compared with the price responsiveness of mine supply (which wouldincrease over time), the price responsiveness of aboveground stocks is likelyto decline over time (assuming aboveground holdings are gradually reducedto desirable levels). These contrasting supply responses, and the apparentwillingness of the official sector and private investors to significantly reducetheir large gold holdings (as outlined in chapter 2), suggest that the priceelasticity of aboveground stocks would be greater than the price elasticityof world gold mine production over the short term, but that this differencewould decline and possibly reverse over the longer term. It is not clear towhat extent these countervailing influences will affect the aggregate goldsupply elasticity over time, and therefore whether the price increasing effectof liberalisation increases or decreases over time.
Given the uncertainty surrounding the responsiveness of aboveground stocksales to higher prices, a range of price elasticities for aboveground stocks
75Australia in the world gold market
14 Change in domestic jewellery consumption and prices followingtariff removal a
JewelleryJewellery consumption b price
1997 Tariff reduction Increase Increase
t t % %
Australia 17 18 5.13 –3.33Brazil 58 72 24.54 –15.92China 214 304 41.82 –27.14Dubai 72 75 3.72 –2.41European Union 292 301 3.00 –1.95India 734 865 17.89 –11.61Indonesia 30 39 28.61 –18.57Malaysia 114 127 11.80 –7.66Philippines 3 4 23.48 –15.23Saudi Arabia 199 227 14.30 –9.28South Korea 114 152 33.36 –21.64Thailand 31 39 25.58 –16.60Turkey 202 204 0.81 –0.53United States 362 386 6.52 –4.23Vietnam 45 64 41.82 –27.14Other 841 822 –2.21 1.43
Total (weighted average) 3328 3698 (11.12)
a These results correspond to the world gold supply elasticity of 5 in table 7. b Gold in gold jewellery.See footnote to table 6 for detail.

was used (from zero to 10) to illustrate a feasible range of potential (longterm) price increases (table 7). A price elasticity of zero for sales of above-ground stocks (which produces the largest increase in the equilibrium priceof gold — 5.5 per cent) represents the case in which sales of abovegroundstocks do not change following an increase in world gold prices. Similarly,the highest price elasticity of 10 represents the case in which annual salesof aboveground stocks increase by 17 per cent (or around 300 tonnes) follow-ing an increase of 1.7 per cent in world gold price after liberalisation.
Despite this range in potential supply responses from aboveground stocks,the range of resulting world gold price increases is reasonably limited —from 5.4 to 1.7 per cent (table 14).
ConclusionsThe results presented in table 14 suggest that removing all import tariffs ongold jewellery would lead the world gold price to increase by 1.7–5.4 percent. Under the midpoint elasticity scenario (price elasticity of abovegroundstocks equal to 5), the world gold price would increase by 2.6 per cent. Thechange in domestic gold jewellery prices and jewellery consumption for thevarious countries that impose gold import tariffs and all other countries usingthis midpoint elasticity are shown in table 14. Total world gold in jewelleryconsumption would increase by 11.2 per cent (373 tonnes) but consumptionin currently unrestricted markets (and also in some countries with quite lowjewellery tariffs) would fall — a result of the world gold price increasingthe cost of gold jewellery by more than the price reducing effect of remov-ing any gold jewellery tariff.
However, given the simplifications of the analysis, the results generated areillustrative only. Perhaps most importantly, the effects of smuggling anddomestic competition in jewellery manufacture (chapter 4) — which implylower effective import tariffs — were not considered here, but would lowerthe resulting price increase.
76 ABARE research report 99.8

References
Albarracin, S.F. 1997, ‘The new Argentine mining framework’, ResourcesPolicy, vol. 23, June, pp. 33–43.
Australian Bureau of Statistics 1996a, Information Paper: AustralianNational Accounts, Introduction to Input–Output Multipliers, cat. no.5246.0, Canberra.
—— 1996b, Australian Harmonised Export Commodity ClassificationScheme, Canberra.
—— 1997, Australian National Accounts: 1993-94 Input–Output Tables,cat. no. 5209.0, Canberra.
—— 1998a, Actual and Expected Private Mineral Exploration, Australia,December Quarter 1997, cat. no. 8412.0, Canberra.
—— 1998b, Australian Mining Industry, 1996-97, cat. no. 8414.0, Canberra(previously cat. no. 8402.0).
—— 1998c, National Income, Expenditure and Product, cat. no. 5206.0,Canberra.
Baker, C. 1997, ‘Rationalisation and expansion of the Australian gold sector:a challenge for the late 1990s’, in The Australian Gold Conference, Pro-ceedings of the 10th Australian Gold Conference, Chamber of Mineralsand Energy of Western Australia, Perth, pp. 87–108.
Bannock, G., Doran, A. and Turnbull, D. 1997, An Overview of RegulatoryBarriers to the World Gold Trade, World Gold Council Research Studyno. 17, London.
Baru, S. 1997, ‘India – economy’, The Far East and Australasia 1998, 29thedn, Europa Publications, London, pp. 335–43.
Batchelor, R. and Gulley, D. 1995, ‘Jewellery demand and the price of gold’,Resources Policy, vol. 21, no. 1, pp. 37–42.
77Australia in the world gold market

Caves, R.E., Frankel, J.A. and Jones, R.W. 1993, World Trade and Payments,6th edn, HarperCollins, New York.
Cross, J. 1994, New Frontiers in Gold: The Derivatives Revolution, RosendalePress, London.
Department of Minerals and Energy 1997, 1996 Statistics Digest, Mineralsand Petroleum Production, Perth.
Dixit, A.K. and Pindyck, R.S. 1994, Investment under Uncertainty, PrincetonUniversity Press, New Jersey.
Dixon, M. 1998, ‘New life for ancient gold mines’, Australian FinancialReview, 6 April, p. 23.
Ertuna, O. 1994, Liberalisation of Turkey’s Gold Market, World Gold CouncilResearch Study no. 7, Geneva.
Frankel, J.A. 1994, Advantages of Liberalising a Nation’s Gold Market,World Gold Council Research Study no. 6, Geneva.
Gold Fields Minerals Services 1996, Gold Update, London, 1 September.
—— 1998, Gold, London (various issues).
Greig, R.A. 1997, The Western Australian Gold Study, Volume 1: Descriptionand Analysis, Economic Research Centre, University of Western Australia,Perth.
Hall, B.H. and Cummins, C. 1997, TSP: User’s Guide, Version 4.4, TSPInternational, Palo Alto, California.
Harris, D.P. 1984, Mineral Resources Appraisal, Clarendon Press, Oxford.
Henderson, D.W., Irons, J.S., Salant, S.W. and Thomas, S. 1997, ‘Can govern-ment gold be put to better use? Qualitative and quantitative effects of alter-native policies’, International Finance Discussion Paper no. 582, Board ofGovernors of the Federal Reserve System, Washington DC.
Hextall, B. and Dixon, M. 1998, ‘Investors polish up gold sector as qualityshines’, Australian Financial Review, 14 January, p. 13.
78 ABARE research report 99.8

Holloway, J. 1997, ‘Mineral policy in Zimbabwe: its evolution, achieve-ments and challenges’, Resources Policy, vol. 23, pp. 27–32.
Houchin, M. and Staunton, B. 1998, ‘Current and future technologies forgold processing in Australia’, Joint submission by the AJ Parker Cooper-ative Research Centre for Hydrometallurgy to the Gold Roundtable, Parlia-ment House, Canberra, 5 February.
International Monetary Fund 1998, International Financial Statistics,Washington DC, December.
Johansen, S. and Juselius, K. 1990, ‘Maximum likelihood estimation andinference on cointegration’, Oxford Bulletin of Economics and Statistics,vol. 52, no. 2, pp. 169–210.
Lee, R. 1997, ‘The demand for physical gold – the impact of Asia’, in Outlook97, Proceedings of the National Agricultural and Resources OutlookConference, Canberra, 4–6 February, vol. 3, Minerals and Energy, ABARE,Canberra, pp. 342–5.
Lonergan, W. 1997, ‘Tomorrow’s gold, today’s profit’, JASSA – Journal ofthe Securities Institute of Australia, Spring, pp. 2–10.
Macquarie Equities 1997, ‘Dreaming of a silver Christmas’, Gold andPrecious Metals Report, London, 22 December, p. 1.
McKinnon, R. 1991, The Order of Economic Liberalisation: FinancialControl in the Transition to a Market Economy, Johns Hopkins UniversityPress, Baltimore.
Middleton, S., Huggan, K. and Clarke, A. 1996, ‘South America: the newminerals frontier?’, Australian Commodities, vol. 3, no. 1, pp. 81–98.
Minerals Council of Australia 1998, Minerals Industry 1998 Survey Report,Canberra.
Naqvi, K. 1998, ‘Gold and silver: India – wedded to gold’, MacquarieEquities Research Paper, London.
O’Callaghan, G 1993, The Structure and Operation of the World Gold Market,Occasional Paper no. 105, International Monetary Fund, Washington DC.
79Australia in the world gold market

Otto, J., Byrne, P., Cordes, J. Stermole, J. and Stevens, N. 1997, GlobalMining Taxation Comparative Study, Institute for Global Resources Policyand Management, Colorado School of Mines, Boulder.
Pindyck, R.S. and Rubinfeld, D.L. 1991, Econometric Models and EconomicForecasts, 3rd edn, McGraw-Hill, Singapore.
Pitt, M.M 1981, ‘Smuggling and price disparity’, Journal of InternationalEconomics, vol. 11, no. 4, pp. 447–58.
Selvanathan, S. and Selvanathan, E.A. 1996, ‘An econometric study of goldproduction and prices’, in Economic Research Centre, Department ofEconomics (ed.), The Western Australian Gold Study Volume 2, Universityof Western Australia, Perth, pp. 1–29.
Shah, F.A., Zilberman, D. and Chakravorty, U. 1995, ‘Technology adoptionin the presence of an exhaustible resource’, American Journal of Agricul-tural Economics, vol. 77, pp. 291–9.
Sjaastad, L.A. and Scacciavillani, F. 1996, ‘The price of gold and theexchange rate’, Journal of International Finance and Money, vol. 15, no. 6, pp. 879–98.
Smeeton, T. 1998, ‘Some influences on the future role of central banks inthe gold market’, in Outlook 98, Proceedings of the National Agriculturaland Resources Outlook Conference, Canberra, 3–5 February, vol. 3,Minerals and Energy, ABARE, Canberra, pp. 254–9, .
Virtual Gold 1998, website: http://www.virtual-gold.com/ [cited July 1998].
Walters, R. and Dippelsman, R. 1985, Estimates of Depreciation and CapitalStock, Australia, Occasional Paper no. 1985/3, Australian Bureau ofStatistics, Canberra.
Warwick-Ching, T. 1993, The International Gold Trade, WoodheadPublishing, Cambridge.
World Gold Council 1997, Annual Report 1996, Geneva.
—— 1999, Gold in the Official Sector, January, no. 6.
80 ABARE research report 99.8