gold market & m&a review and outlook
TRANSCRIPT
Gold Market & M&A Review and Outlook Tom Brady, Chief Economist
June 2016

Newmont Mining Corporation – Confidential I Strategy Refresh I Tab X – Slide 2 June 2016
Cautionary statement
Cautionary statement regarding forward looking statements:
This presentation contains “forward-looking statements” within the meaning of Section 27A of the Securities Act of 1933, as amended, and
Section 21E of the Securities Exchange Act of 1934, as amended, and are intended to be covered by the safe harbor provided for under
such sections. Such forward-looking statements may include, without limitation, expectations regarding future price assumptions, financial
performance and other outlook or guidance. Estimates or expectations of future events or results are based upon certain assumptions,
which may prove to be incorrect. Where the Company expresses an expectation or belief as to future events or results, such expectation
or belief is expressed in good faith and believed to have a reasonable basis. However, such statements are subject to risks, uncertainties
and other factors, which could cause actual results to differ materially from future results expressed, projected or implied by the “forward-
looking statements”. Such risks include, but are not limited to, gold and other metals price volatility, currency fluctuations, increased
production costs and variances in ore grade or recovery rates from those assumed in mining plans, political and operational risks,
community relations, conflict resolution and outcome of projects or oppositions and governmental regulation and judicial outcomes. For a
more detailed discussion of such risks and other factors, see the Company’s 2015 Annual Report on Form 10-K, filed on or about February
17, 2016, with the Securities and Exchange Commission (the “SEC”), as well as the Company’s other SEC filings. The Company does not
undertake any obligation to release publicly revisions to any “forward-looking statement,” including, without limitation, outlook, to reflect
events or circumstances after the date of this presentation, or to reflect the occurrence of unanticipated events, except as may be required
under applicable securities laws. Investors should not assume that any lack of update to a previously issued “forward-looking statement”
constitutes a reaffirmation of that statement. Continued reliance on “forward-looking statements” is at investors' own risk.

Newmont Mining Corporation – Slide 3 June 2016
Agenda: “Gold Market & M&A Review and Outlook”
• Brief Introduction
• Gold Market Review
– Macroeconomic drivers
– Near-term factors
– Longer-term factors
• Review of M&A Trends and Outlook
Long Canyon
Twin Creeks, Nevada
Merian, Suriname

Newmont Mining Corporation – Slide 4 June 2016
Tom Brady: brief background
• 1996 PhD in Mineral Economics from Colorado School of Mines
• JPM Commodity Research Desk
• 1996 – 1998: Mining
• Newmont Mining – Corporate Development
• 1998 – 2007: Energy / Oil & Gas
• Risk Capital Advisors
• Arthur Andersen
• 2007 – Present: Mining
• Newmont Mining –
• Treasury: Financial Risk Management
• Investor Relations
• Strategic Planning
• Chief Economist

Newmont Mining Corporation – Slide 5 June 2016
$1,000
$1,050
$1,100
$1,150
$1,200
$1,250
$1,300
$1,350
Jan Feb Mar Apr May Jun
-20%
-10%
0%
10%
20%
30%
2016201220082004200019961992198819841980
2016 YTD gold price increase highest since 2006
• Renewed investor interest in gold
– Sluggish U.S. dollar, weak equity markets, heightened recessionary fears and the
spreading threat of negative interest rates policies
– Gold continues to trade on Fed interest rate speculation
– …e.g., gold increased $30/oz. from the recently released May employment report
– Gold closed up ~$60/oz. on Friday after Brexit vote
Gold price increase is 2nd best since 1980 2016 prices continue to hold Jan/Feb gains

Newmont Mining Corporation – Slide 6 June 2016
95
105
115
125
135
2014 2015 2016 2017 2018 2019
Analyst Expectations (current)
Analyst Expectations (Jan 1st)
U.S. dollar has “rolled over” sooner than expected
Market anticipates the U.S. dollar to moderately appreciate1
• U.S. dollar strengthened on improved outlook for economic conditions
– Up nearly 25% from July, 2014 – January 2016
• Market expects the U.S. dollar index to moderately climb through 2016 Q2
– Commodities priced in U.S. dollars and becomes relatively more expensive with dollar strength
U.S. Dollar Strength Up ~25%
(July 2014 - Jan. 2016)
1 Fed Reserve Broad (Trade-weighted) dollar index: currencies weighted based on international trade (China: 20%, Euro Area: ~17%, Canada: 13%, Mexico: 11%, Japan: 7%,
UK: ~3%, South Korea: ~4%, Brazil: 2%, Others: 23%)

Newmont Mining Corporation – Slide 7 June 2016
-3.0
-2.0
-1.0
0.0
1.0
2.0
3.0
4.0
5.0
6.0
2007 2008 2009 2010 2011 2012 2013 2014 2015 2016 2017 2018
CPI - Headline
CPI - Core
PCE - Core
Inflation still weak but climbing
Inflation still less than 2%1
1Source: MacroBond, Bloomberg
U.S. Fed Target = 2%
• Multiple measures of US inflation remain low
– Headline CPI (most often quoted): currently ~1.0%
– Core CPI (excludes volatile food & energy costs): currently ~2.0%
– Personal consumption expenditure (monitored by Fed): currently ~1.6%
• Strong consumer demand, wages and higher oil prices driving inflation up

Newmont Mining Corporation – Slide 8 June 2016
U.S. equities have been weak
1Source: MacroBond, Bloomberg
• Since Jan. 1st, S&P 500 is slightly down currently, but was down over 10% in February
• More risk aversion driving investors to gold (and other safe-haven instruments)
U.S. equity and gold price trends
$1,000
$1,100
$1,200
$1,300
$1,400
$1,500
$1,600
$1,700
$1,800
1,400
1,500
1,600
1,700
1,800
1,900
2,000
2,100
2,200
2013 2014 2015 2016
LM
BA
P.M
. F
ix (
$/o
z.)
S&
P 5
00
In
de
x
S&P 500Gold Price
2013
S&P 500: +30%
Gold: - ~30%
2014
S&P 500: + ~10%
Gold: 0%
2015
S&P 500: ~0%
Gold: - ~10%
2016 YTD
S&P 500: - ~2%
Gold: + 25%

Newmont Mining Corporation – Slide 9 June 2016
0.00
0.50
1.00
1.50
2.00
2.50
3.00
3.50
1-D
ay
7-D
ay
1-M
on
th
3-M
on
th
6-M
on
th
1-Y
ea
r2
-Yea
r3
-Yea
r4
-Yea
r5
-Yea
r6
-Yea
r7
-Yea
r8
-Yea
r
10-Y
ea
r
20-Y
ea
r
30-Y
ea
r
Yie
ld (
%)
Dec. 31, 2015
Current
Risk aversion showing up in the U.S. bond markets
1Source: MacroBond, Bloomberg
U.S. bond yield curves
• Since December, bond yields have decreased
– Safe-haven investors buying U.S. Treasuries
• Results in higher bond prices (and lower yields)
• Lower bond yields can be bullish for gold

Newmont Mining Corporation – Slide 10 June 2016
$0
$200
$400
$600
$800
$1,000
$1,200
$1,400
$1,600
$1,800
-
10
20
30
40
50
60
70
80
90
2004 2006 2008 2010 2012 2014 2016YTD
Go
ld P
ric
e (
$/o
z.)
Go
ld E
TF
Ho
ldin
gs
(M
ozs
. e
nd
of
ye
ar)
ETF Holdings
Gold Price
Gold ETF holdings have increased by >13Moz.
1Source: Bloomberg
Gold ETF holdings historical trends1
• Global gold ETF volumes decreased by ~30M ounces in 2013 and by ~5M ounces in both
2014 and 2015
• Holdings have increased by over 13M ounces in 2016 YTD (nearly 30%)
– Over 550K ounces since Friday

Newmont Mining Corporation – Slide 11 June 2016
Central banks remain net purchasers of gold
12016 additions through 1st 3 months of year; Source: WGC; Note, through April, China has added ~1.5Moz as well
Globally, banks added nearly 4Moz. during 1Q161
• Low prices and reserve diversification driving oil producing countries to acquire gold
– Russia added over 6Moz in 2015 (~2Moz in 1Q 2016)
– Kazakhstan purchased ~1Moz in 2015 (and ~300Koz in 1Q 2016)
• To balance strained fiscal budgets, economically stressed countries selling gold reserves
– Venezuela sold nearly 3Moz in 2015 (and nearly 1.5Moz in 1Q 2016)
– Turkey has sold over 1Moz in 2016 YTD.
-10
0
10
20
2008 2009 2010 2011 2012 2013 2014 2015 2016YTD
Notable buyers and sellers (Moz)
(10)
(5)
-
5
10
15
2008 2009 2010 2011 2012 2013 2014 2015 2016YTD
Kazakhstan Turkey ChinaRussia Europe Venezuela

Newmont Mining Corporation – Slide 12 June 2016
Economic Guidelines: example data sources
Gold price data sources
$1,000
$1,100
$1,200
$1,300
$1,400
$1,500
$1,600
$1,700
$1,800
2010 2012 2014 2016E 2018E 2020E 2022E 2024E
Near-Term (2016 – 2020)•Bloomberg (Analyst Median)
•Bloomberg (Forward Prices)
•GFMS & Oxford Economics (Scenario Forecasts)
Longer-Term (2020+)• GFMS (Scenario Forecasts)
• Newmont view of macroeconomic
and market fundamentals
Bloomberg(Analyst Median)
Bloomberg(Forward Prices)
Oxford Scenarios(Probability Weighted)
Internal view of longer-term
market conditions
• Decreasing mine supply
• Weakening U.S. dollar
• Heightened inflation
• Increasing wealth trends
GFMS Scenarios(Probability Weighted)

Newmont Mining Corporation – Slide 13 June 2016
-2.0%
-1.0%
0.0%
1.0%
2.0%
3.0%
4.0%
5.0%
Jan Feb Mar Apr May Jun Jul Aug Sep Oct Nov Dec
Gold near-term outlook: Seasonal trend pressures
Monthly Gold price gains/losses (median price gain/loss: 2000 to present)1
1Source: Macrobond
Physical buying in Asia can drive gold price seasonality
• Nov. – Jan./Feb.: Buying ahead of Chinese New Year and Valentine’s Day • Aug – Sep.: Buying ahead of Indian Festival and Wedding seasons

Newmont Mining Corporation – Slide 14 June 2016
Gold longer-term outlook: decreasing mine supply
60
65
70
75
80
85
90
95
100
1051
99
0
199
5
200
0
200
5
201
0
201
5
202
0
2001 - 2008
-1%/year
2008 - 2015
+~4%/year
2016 – 2020E
-1%/year1990 - 2001
+2%/year
• Mine supply flattened in 2015 (<1% growth)
– From recent low in 2008, supply grew by over ~4%/year through 2014
• Expecting global mine supply to begin a downward trend in 2016
1Source: GFMS and internal expectations
Gold mine supply (Moz)1

Newmont Mining Corporation – Slide 15 June 2016
Gold longer-term outlook: lower growth spending
• Global exploration spending down over 50% since 2011 (nearly $4.5B)
– Spending down over 55% at Newmont (by ~$200M to ~$160M in 2015)
• Development capex down ~80%, sustaining capex down 30% since 2012 for top 10
producers
Exploration Budget Trends ($M)1
$0
$2,000
$4,000
$6,000
$8,000
$10,000
$12,000
201
6
201
3
201
0
200
7
200
4
200
1
199
8
199
5
199
2
Sustaining ($M) Development ($M)
Capital Expenditure Trends ($M)2
$0
$2,000
$4,000
$6,000
$8,000
$10,000
199
7
200
0
200
3
200
6
200
9
201
2
201
5
1Source: SNL 2Source: Wood Mackenzie (top10 gold producers)

Newmont Mining Corporation – Slide 16 June 2016
Gold longer-term outlook: increasing Asia demand
• “Gold moving from West to East”
– Gold jewelry, bars and coin demand is up ~80% since 2005
• In 2015, China accounted for >30% of consumer demand (India = 25%)
1Source: WGC: G7 includes the US, Canada, UK, Italy, France, Germany, EU and Japan; Asia includes China, India, Indonesia, Thailand, Vietnam and S. Korea
Consumer gold demand trends1
-
10
20
30
40
50
60
70
80
90
2005
2006
2007
2008
2009
2010
2011
2012
2013
2014
2015
Co
ns
um
er
Go
ld D
em
an
d (
Mo
zs.)
AsiaG7

Review & Outlook for M&A
* Past M&A activities reviewed in this section reference books by former Rio Tinto Chief Economists: Phillip Crowson, “Mining Unearthed” (2008) and David Humphries, “The Remaking of the Mining Industry” (2014)

Newmont Mining Corporation – Slide 18 June 2016
Late 70s/Early 80s: “Oil Co. Buys Mining Co.”
• Oil Co’s acquire mining companies to diversify portfolios
– Premiums justified as companies could be better managed under centralized control, uniform
systems, standards, processes, …
• Recessions during 70s resulted in significant declines in base metal demand
Significant Acquisitions
• Arco acquires Anaconda
• Amoco acquires Cyprus
1IMF Metals Index: Aluminum = 36%, Copper = 26%, Iron Ore = 12%; Nickel = 10%; Zinc = 6%; Uranium = 5%, Tin = 2% and Lead = 2%
Overall decline in base metal demand1
$10
$15
$20
$25
$30
$35
$40
$45
1978 1979 1980 1981 1982 1983
Oil prices climb over 150%
40
50
60
70
80
90
100
1980 1981 1982 1983
• Chevron acquires Amax
• Standard Ohio acquires Kennecott
• BP acquires SelTrust

Newmont Mining Corporation – Slide 19 June 2016
40
50
60
70
80
90
100
110
120
1983 1984 1985 1986 1987 1988 1989$10
$15
$20
$25
$30
$35
1983 1984 1985 1986 1987 1988 1989
80s: Return to Core “Oil Co. Sells Mining Co.”
• Oil Co’s divest from mining
– Different operating models, sustaining capital requirements, exploration techniques result in
limited efficiencies
Significant Divestitures
• Amoco floats Cyprus Minerals (1985)
• Mobile sells Falconbridge (1985)
• BP sells Australian mining assets (1985)
• NEM fights off T. Boone Pickens leveraged buyout attempt ($33/share special dividend)
1IMF Metals Index: Aluminum = 36%, Copper = 26%, Iron Ore = 12%; Nickel = 10%; Zinc = 6%; Uranium = 5%, Tin = 2% and Lead = 2%
“…The Death of Mining…”1 Oil prices drop to near $10 per barrel
• Standard Ohio/BP sells Kennecott (1989)
• Exxon sells mining assets to Anglo (1992)
• Shell sells Billiton (1994)

Newmont Mining Corporation – Slide 20 June 2016
40
50
60
70
80
90
1990 1992 1994 1996 1998 2000 2002$200
$250
$300
$350
$400
$450
-30
-20
-10
0
10
20
1990 1995 2000
Central Bank Net Additions (Mozs. LHS)
Gold Price ($/oz. RHS)
90s/early 00s: Restructuring and Consolidation
• Objective of M&As to reduce costs and benefits from scale in exploration and technical skills
– Capacity of Caterpillar trucks increases from ~150t (1970s) to ~300t (1990s)
• Tech Boom leads to mining stocks being sidelined on stock markets – Only the largest companies are noticed by financial institutions
– Wide-spread forward-selling and Bre-X scandal lead to credibility crisis for gold miners
Significant M&As
• RTZ (Rio) buys Kennecott (1989) / merges with CRA (1995)
• Cyprus and Amax merge (1993) / acquired by Phelps (1999)
• Grupo Mex buys Asarco (1993)
Lack of an investment thesis for gold Base metals trend downward
• Newmont buys Santa Fe (1998)
• Barrick buys Homestake (1999)
• BHP and Billiton merge (2001)

Newmont Mining Corporation – Slide 21 June 2016
40
80
120
160
200
240
280
2003 2005 2007 2009 2011
2000s: Rise of the Global Diversified Miner
• Large diversifieds investment premise to deliver “corporate-wide economies of scale”
– Ability to disseminate best practices and management across a broad range of commodities and
countries to provide more stable earnings
– Many middle-size, single commodity producers swept up (Inco, Alcan, Phelps Dodge, …)
• Gold miners generally off diversifieds acquisition target radars – Gold valuation multiple, relatively short mine life and capital requirements
Significant M&As
• 2003 - Xstrata buys MIM Holdings (coal, copper, lead, zinc)
• 2005 – BHP acquires WMC Resources (nickel, copper, uranium)
• 2005 – Vale acquires Inco (nickel)
• 2007 – Rio acquires Alcan (aluminum)
“gold multiple” keeps seniors out of fray (P/E ratio) China infrastructure drives base metals
• 2003 Newmont/Normandy/Franco
• 2004 - Anglogold/Ashanti Goldfields
• 2006 - Barrick acquires Placer Dome
0
20
40
60
80
100
120
2000 2002 2004 2006 2008 2010 2012
Gold Seniors Diversifieds

Newmont Mining Corporation – Slide 22 June 2016
$0
$4
$8
$12
$16
2015201320112009200720052003
Development ($M) Sustaining ($M)
$0
$10
$20
$30
$40
$50
$60
$70
20152014201320122011
2010s: “Mining Co. Buys Oil Co.” & “Return to the Core”
• Prior to big price declines, Mining Co’s still hungry for growth, acquire oil and gas assets
• 2011 – BHP acquires Chesapeake Shale Gas (nearly $5B)
• 2011 – BHP acquires Petrohawk (~$12B)
• 2012 – FCX acquires Plains Energy ($9B)
• With lower metal prices, miners return to focus on core businesses (value vs. growth)
• BHP spins off South 32 (alumina, aluminum, coal manganese, nickel, silver, lead assets) (2015)
• Vale announces intent to divest Inco (2014)
• Newmont sells: Midas (2013), Jundee (2014), Waihi (2015)
• Barrick sells: Zaldivar, Cowel and Porgera (2015)
Top miners still writing off prior investments ($B)1 Capital discipline returns to gold sector2
Nearly $200B in write-offs over last 5 years
1 Source: Annual PWC Mine reports that summarize top 40 global mining companies 2 Source: Wood Mackenzie – capital spending by top 10 gold mining companies

Newmont Mining Corporation – Slide 23 June 2016
0%
10%
20%
30%
40%
50%
60%
70%
1 2 3 4 5 6 7 8 9 10
Pe
rce
nt
of
Ind
us
try T
ota
l M
ine
Su
pp
ly
Cumulative # of Producers
0%
10%
20%
30%
40%
50%
1 2 3 4 5 6 7 8 9 10
Pe
rce
nt
of
Ind
us
try T
ota
l M
ine
Su
pp
ly
Cumulative # of Producers
Mining Sector M&A Themes
• Mining industry is currently less concentrated than in past
• Trading ‘psychology’ inherent with M&A decisions
– Short, ‘frenzy-type’, acquisition periods followed by drawn-out divestments
– The best traders limit emotion from their buy/sell activities
• “Limited” synergies realized across and within commodity sectors
– Corporate-wide economies of scale not realized
• Centralized control, standard systems and procedures
– Investors want to make their own portfolio diversification decisions
Concentration of Gold Mine Supply (% of total)1 Concentration of Copper Mine Supply (% of total)1
1 Source: GFMS
2000
2005
2015
2000
2005
2015

Newmont Mining Corporation – Slide 24 June 2016
-20%
-10%
0%
10%
20%
30%
40%
3-Month 6-Month 1-Year 2-YearPost Closing
Goldcorp HUI Gold Index Gold Price
0%
20%
40%
60%
80%
100%
120%
3-Month 6-Month 1-Year 2-YearPost Closing
Barrick HUI Gold Index Gold Price
0%
50%
100%
150%
200%
250%
300%
3-Month 6-Month 1-Year 2-YearPost Closing
Newmont HUI Gold Index Gold Price
-70%
-60%
-50%
-40%
-30%
-20%
-10%
0%
10%
3-Month 6-Month 1-Year 2-YearPost Closing
Newmont HUI Gold Index Gold Price
Gold Seniors: Select M&A - Share Price Performance
NEM Announces Santa Fe Acquisition (Dec. 4, 1996) NEM Announces Normandy/Franco Merger (Nov. 14, 2001)
ABX Announces Placer Dome Acquisition (Oct. 31, 2006)
1 Highlighted cells indicate superior performance to NYSE ARCA Gold Bug Index (HUI) which currently includes: Newmont, Goldcorp, Barrick, AngloGold, Goldfields, Kinross, Agnico Eagle, Harmony, Yamana,
Buenaventura, Eldorado, New Gold, Randgold and Alamos
GG Announces Glamis Gold Takeover (Oct. 31, 2006)
• Large acquisitions/mergers in with Gold Sr.s have failed to generate superior price returns1

Newmont Mining Corporation – Slide 25 June 2016
100
300
500
700
900
200
0
200
1
200
2
200
3
200
4
200
5
200
6
200
7
200
8
200
9
201
0
201
1
201
2
201
3
201
4
201
5
Total Debt
Gold Seniors: Shares, Debt and Share Prices
Sr. Avg. Shares Outstanding have increased ~3x
Senior Avg. Share prices…flat and lag gold prices
1 Source: WoodMac, GFMS and Bloomberg: Gold Senior Average (weighted on annual gold production) and includes Newmont, Goldcorp, Barrick, AngloGold, Goldfields, Kinross, Agnico Eagle, Yamana, Randgold, and Newcrest
Randgold stands out, share price still up ~40x
• Since 2000, lots of shares issued and debt raised… sector average share prices ~ flat1
• Randgold stands out = limited share increase (~94M vs 66M in 2000) and debt (~$0 vs. ~$100M in 2000)
Sr. Avg. Total debt has increased ~8x
-
100
200
300
400
500
600
700
200
0
200
1
200
2
200
3
200
4
200
5
200
6
200
7
200
8
200
9
201
0
201
1
201
2
201
3
201
4
201
5Sr. Avg. Share Price
Gold Price
100
200
300
400
200
0
200
1
200
2
200
3
200
4
200
5
200
6
200
7
200
8
200
9
201
0
201
1
201
2
201
3
201
4
201
5
Shares Outstanding
-
1,000
2,000
3,000
4,000
5,000
6,000
200
0
200
1
200
2
200
3
200
4
200
5
200
6
200
7
200
8
200
9
201
0
201
1
201
2
201
3
201
4
201
5
Randgold SharePriceGold Price
Newmont Mining Corporation – Slide 26 June 2016
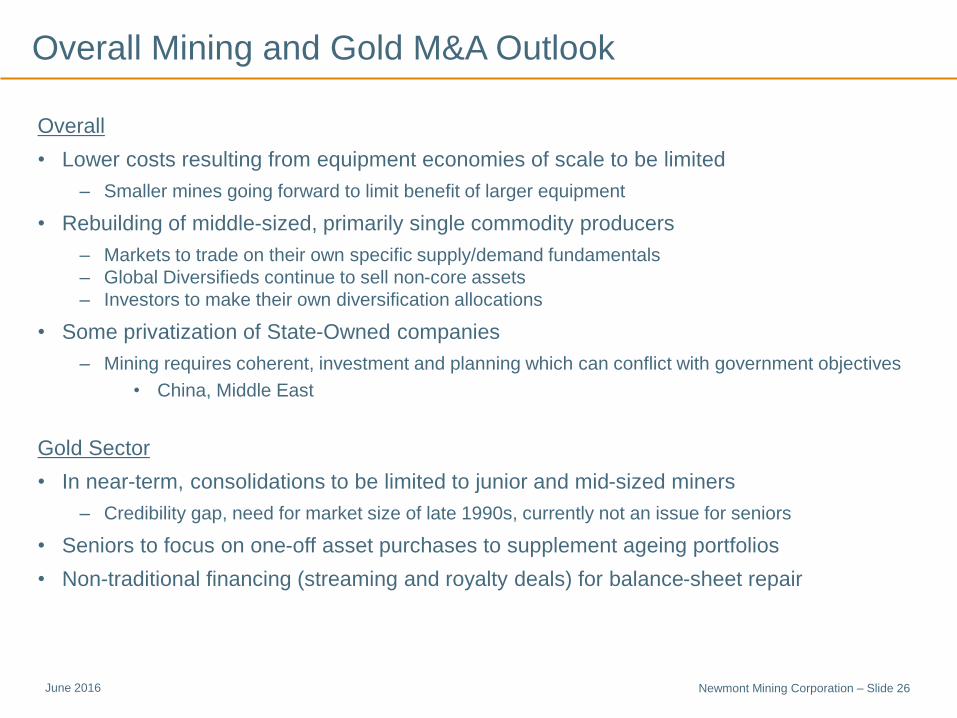
Overall Mining and Gold M&A Outlook
Overall
• Lower costs resulting from equipment economies of scale to be limited
– Smaller mines going forward to limit benefit of larger equipment
• Rebuilding of middle-sized, primarily single commodity producers
– Markets to trade on their own specific supply/demand fundamentals
– Global Diversifieds continue to sell non-core assets
– Investors to make their own diversification allocations
• Some privatization of State-Owned companies
– Mining requires coherent, investment and planning which can conflict with government objectives
• China, Middle East
Gold Sector
• In near-term, consolidations to be limited to junior and mid-sized miners
– Credibility gap, need for market size of late 1990s, currently not an issue for seniors
• Seniors to focus on one-off asset purchases to supplement ageing portfolios
• Non-traditional financing (streaming and royalty deals) for balance-sheet repair
Questions ?
Newmont Mining Corporation Slide 27 June 2016

Appendix

Newmont Mining Corporation – Slide 29 June 2016
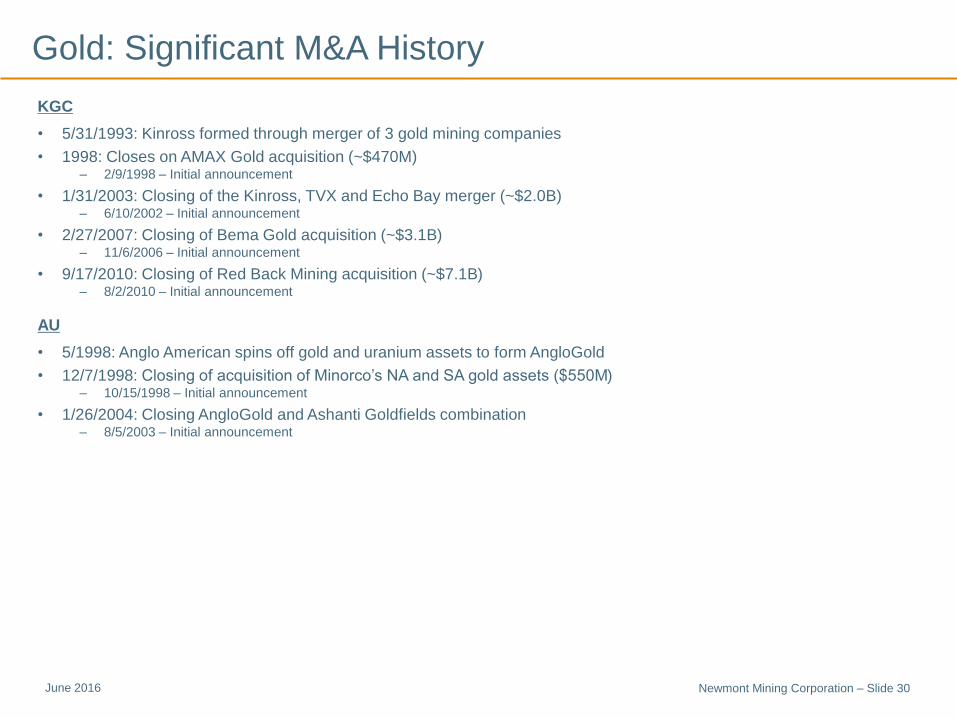
Gold: Significant M&A History
NEM
• 3/11/1997: Wins bid for Santa Fe Gold (~$2.5B) (includes $65M breakup fee to Homestake) – 1/7/1997 – Increases bid (to $0.40/share) or $2.2B
– 12.4/1996 – Announces initial offer (0.33/share) ~13% higher than Homestake’s
• 1/5/2001: Closes on Battle Mountain Gold acquisition (~$560M) – 6/21/2000 – Initial announcement
• 1/18/2002: Wins bid for Normandy Mining and Franco Nevada (~$4.4B) – 11/14/2001 – Announcement to acquire Normandy and its largest shareholder Franco-Nevada
ABX
• 12/14/2001: Completes merger with Homestake ($2.2B) – 6/29/2001 – Announces offer
• 1/20/2006: Closes on Placer Dome acquisition (~$9.2B) – 10/31/2005 – Initial announcement
• 12/14/1998 – Placer announces acquisition of Getchell Gold Corp. (~$1.1B)
• 6/2/2011: Closes acquisition of Equinox Minerals (~$704B) – 11/14/2011 – Initial announcement to acquire Equinox Minerals Ltd.
GG
• 4/18/2005: Completes acquisition of Wheaton River ($2.2B) – 12/6/2004 – Initial announcement
• 11/14/2006: Closes on Glamis Gold acquisition (~$8.6B) – 8/31/2006 – Initial announcement
– 12/15/2004 – Glamis announces bid to take over Goldcorp ($2.9B) (2/5/2005 - increases offer)
Newmont Mining Corporation – Slide 30 June 2016
Gold: Significant M&A History
KGC
• 5/31/1993: Kinross formed through merger of 3 gold mining companies
• 1998: Closes on AMAX Gold acquisition (~$470M) – 2/9/1998 – Initial announcement
• 1/31/2003: Closing of the Kinross, TVX and Echo Bay merger (~$2.0B) – 6/10/2002 – Initial announcement
• 2/27/2007: Closing of Bema Gold acquisition (~$3.1B) – 11/6/2006 – Initial announcement
• 9/17/2010: Closing of Red Back Mining acquisition (~$7.1B) – 8/2/2010 – Initial announcement
AU
• 5/1998: Anglo American spins off gold and uranium assets to form AngloGold
• 12/7/1998: Closing of acquisition of Minorco’s NA and SA gold assets ($550M) – 10/15/1998 – Initial announcement
• 1/26/2004: Closing AngloGold and Ashanti Goldfields combination – 8/5/2003 – Initial announcement
Newmont Mining Corporation – Slide 31 June 2016
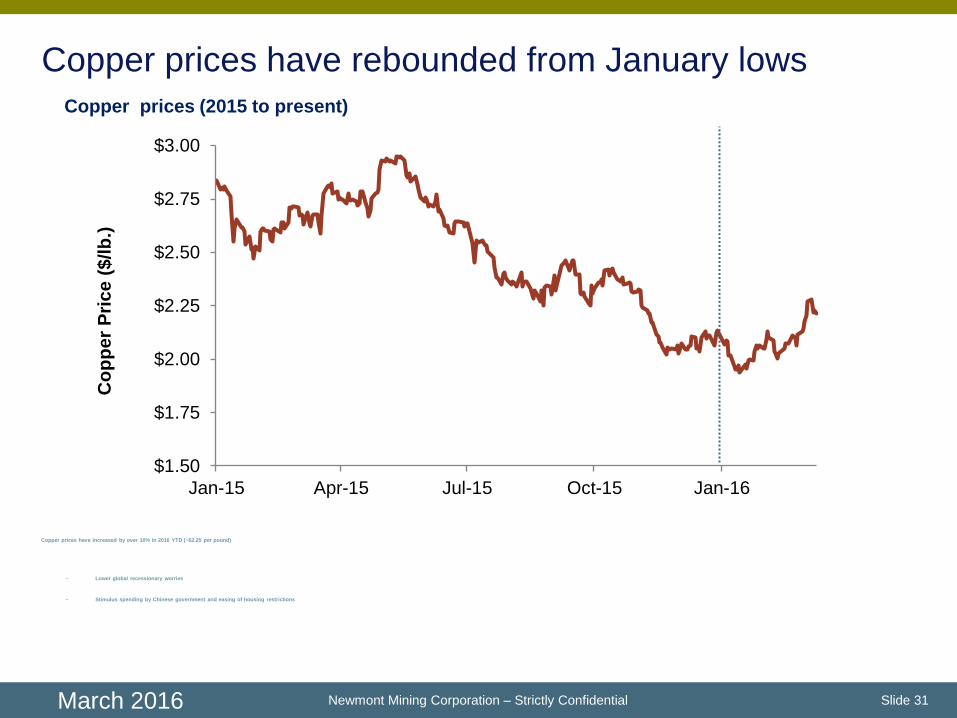
Copper prices have rebounded from January lows
Newmont Mining Corporation – Strictly Confidential Slide 31
Copper prices (2015 to present)
Copper prices have increased by over 10% in 2016 YTD (~$2.25 per pound)
− Lower global recessionary worries
− Stimulus spending by Chinese government and easing of housing restrictions
$1.50
$1.75
$2.00
$2.25
$2.50
$2.75
$3.00
Jan-15 Apr-15 Jul-15 Oct-15 Jan-16
Co
pp
er
Pri
ce (
$/lb
.)
March 2016

Newmont Mining Corporation – Slide 32 June 2016
-20%
0%
20%
40%
60%
80%
$0.00
$1.00
$2.00
$3.00
$4.00
$5.00
2000 2002 2004 2006 2008 2010 2012 2014 2016
Ch
ina F
ixed
In
vestm
en
t (a
nn
ual g
row
th)
Co
pp
er
Pri
ce (
$/lb
.)
Copper Price ($/lb.)
China Fixed Investment (growth)
• Copper prices strongly tied to demand in China (represents ~40% of global total)
• Growth rate in fixed asset investments continues to slow (as economy transitions)
Investment in China a key driver for copper Chinese fixed asset investment1
Newmont Mining Corporation – Strictly Confidential Tab I – Slide 32
1Source: Macrobond; Data smoothed over a moving 4-month period to demonstrate trends
March 2016

Newmont Mining Corporation – Slide 33 June 2016
-10%
0%
10%
20%
30%
40%
50%
60%
201
0
201
1
201
2
201
3
201
4
201
5
201
6
Fix
ed
In
vestm
en
t A
nn
ual
Gro
wth
(%
)
• Total fixed asset investment (black line) trending lower under lower investment in real estate
• Real estate expected to remain low through next ~2 years as surplus housing normalizes
• Investment in transportation and electricity remain steady (= 60% of copper demand2)
However, investment trends require closer review Chinese investment by sector (annual growth %)
Newmont Mining Corporation – Strictly Confidential Tab I – Slide 33
Transportation
Electricity
Total
Real Estate
1 Data smoothed over 12 month rolling average period to demonstrate trends 2 Source: GFMS , 2015 Copper Survey
March 2016

Newmont Mining Corporation – Slide 34 June 2016
$20
$40
$60
$80
$100
$120
Jan-14 May-14 Sep-14 Jan-15 May-15 Sep-15 Jan-16
WT
I P
ric
e (
$/b
bl.
)
Oil prices have rebounded from recent lows
WTI have increased over 40% since lows in February 2016 (currently over $40/barrel)
U.S. shale production continues to decline
• Drill rig counts at lowest levels since 2010
• Production down nearly 500K barrels per day since peak output in April 2015
OPEC supply growth curtailed by geopolitical disruptions in Middle East and Africa
Newmont Mining
Corporation
1Source: GaveKel Research and Bloomberg.
Slide 34
WTI oil prices (Jan 2016 to present)1
March 2016
OPEC (Saudi Arabia)
announce it will not
curtail production
Both OPEC & Non-OPEC
continues to expand
production

Newmont Mining Corporation – Slide 35 June 2016
Shale oil has transformed the industry
The U.S. remains the world’s largest oil consumer, accounting for ~20% of global demand
From 2011 to mid-2015, U.S. production has increased ~1M barrels/day
• Production peaked in April 2015 (nearly 10M barrels per day)
• EIA anticipates U.S. production to decline by another 500M+ barrels per day by end 2016
Newmont Mining
Corporation
Slide 35
U.S. crude oil production and imports1
1 Source: Macrobond
3.0
4.0
5.0
6.0
7.0
8.0
9.0
10.0
11.0
12.0
2004 2006 2008 2010 2012 2014 2016
Barr
els
/ D
ay (
millio
ns)
U.S. Crude Oil Production
U.S. Crude Oil Imports
March 2016

Copper near-term: High inventories but lower surplus
• Purchases by State Reserve Bureau adding to elevated inventory levels in China may
pressure prices in the near term
• Lower global market surplus conditions expected than previously forecast
– Higher cost mine closures (including Freeport’s Sierrita operation) eliminated nearly
4% of global production in 2015
Newmont Mining Corporation
1Source: Macrobond
Slide 36
Chinese copper inventory levels1 Market surplus lower than previously expected2
0
100,000
200,000
300,000
400,000
500,000
600,000
Jan-11 Jan-12 Jan-13 Jan-14 Jan-15 Jan-16
Ch
ine
se
Co
pp
er
Inv
en
tory
('0
00 t
on
ne
s)
March 2016

Copper longer-term outlook: Chinese electricity demand
• China accounts for over 40% of global copper demand (Power sector = 50% of this)
• Government’s latest 5-Year Plan calls for doubling investment in power infrastructure
• The average Chinese citizen consumes:
– 25% of what the average person in the United States consumes
– Usage expected to double over next decade
Newmont Mining Corporation
1Source: GaveKel Research and Bloomberg.
Slide 37
Electric power consumption – China vs. developed world1
U.S.
South Korea
Japan
China
March 2016

Copper longer-term outlook: urbanization in China
• Current ~50% urbanization rate expected to exceed 70% by 2030
– Another ~250M people moving to cities!
Newmont Mining Corporation Slide 38
China’s urban population trends and commodity prices1
0
50
100
150
200
250
-
5.0
10.0
15.0
20.0
25.0
30.0
1990 1995 2000 2005 2010 2015 2020 2025 2030
IMF
Me
tals
In
de
x
Inc
rea
se
in
Ch
ine
se
Urb
an
Po
pu
lati
on
(M
illio
ns
)China urban population growth
IMF Metals Index
1 IMF Metals index weightings: Aluminum = 36%, Copper = 26%, Iron Ore = 12%; Nickel = 10%; Zinc = 6%; Uranium = 5%, Tin = 2% and Lead = 2%
March 2016

$0
$20
$40
$60
$80
$100
$120
$140
$160
1970 1975 1980 1985 1990 1995 2000 2005 2010 2015
Real
WT
I P
rice (
$/b
arr
el)
OPEC cartel
pricing
OPEC cartel
pricing
Competitive
market
pricing
U.S. “shale band”
Competitive
market
pricing
Oil longer-term outlook: market competition
• Oil markets have migrated between periods of competition and where OPEC flexed power
– Competition: prices heavily influenced by marginal costs within industry
– OPEC Monopolistic: Saudi Arabia primarily restricting output
Newmont Mining Corporation Slide 39
Inflation-adjusted WTI prices1
1Source: Gavekal
March 2016

Oil longer-term outlook: Saudi FX reserves
• Saudi FX reserves down nearly $150B during last 1.5 years
– Kingdom needs oil prices of near $100 per barrel for government to balance budget
Newmont Mining Corporation Slide 40
Saudi Arabia’s Foreign Exchange Reserve Balance1
1Source: Macrobond
$300
$400
$500
$600
$700
$800
2010 2011 2012 2013 2014 2015 2016
Sau
di
Off
icia
l R
eserv
es
($B
)
March 2016
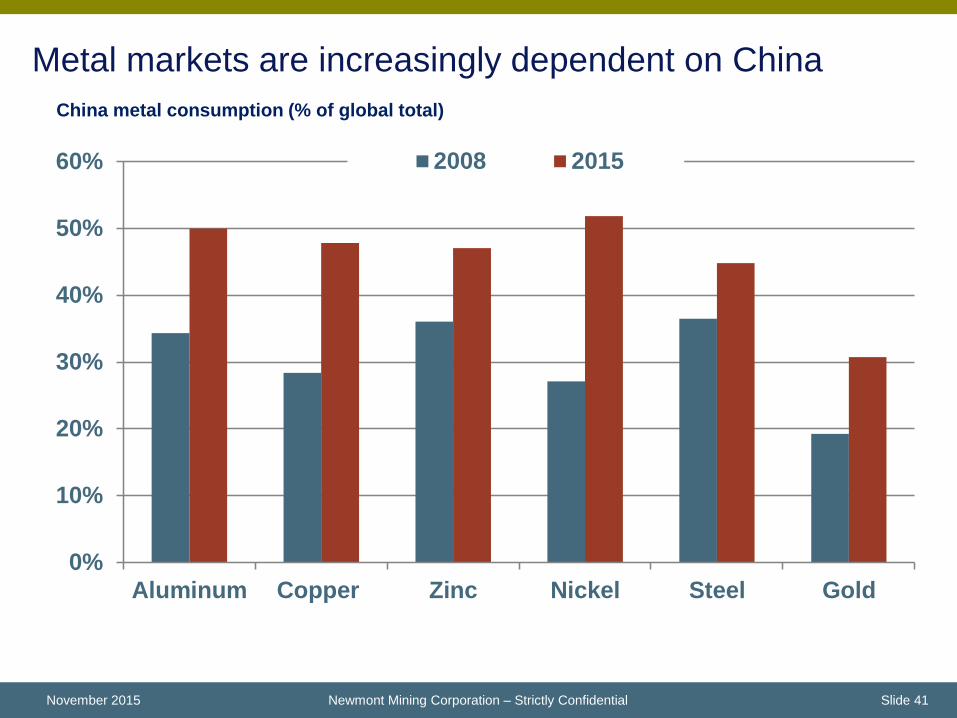
Metal markets are increasingly dependent on China
November 2015 Newmont Mining Corporation – Strictly Confidential Slide 41
China metal consumption (% of global total)
0%
10%
20%
30%
40%
50%
60%
Aluminum Copper Zinc Nickel Steel Gold
2008 2015