golden agri-resources ltdgoldenagri.com.sg/wp-content/uploads/2016/01/gar-ppt-1q-2017-ma… · this...
TRANSCRIPT
Golden Agri-Resources LtdCompany Presentation
May 2017
2slide
Disclaimer
This presentation has been prepared by Golden Agri-Resources Ltd. (“GAR” or “Company”) forinformational purposes, and may contain projections and forward looking statements that reflect theCompany’s current views with respect to future events and financial performance. These views arebased on current assumptions which are subject to various risks and which may change over time. Noassurance can be given that future events will occur, that projections will be achieved, or that theCompany’s assumptions are correct. Actual results may differ materially from those projected. Aprospective investor must make its own independent decision regarding investment in securities.
Opinions expressed herein reflect the judgement of the Company as of the date of this presentation andmay be subject to change without notice if the Company becomes aware of any information, whetherspecific to the Company, its business, or in general, which may have a material impact on any suchopinions.
The information is current only as of its date and shall not, under any circumstances, create anyimplication that the information contained therein is correct as of any time subsequent to the datethereof or that there has been no change in the financial condition or affairs of GAR since such date.This presentation may be updated from time to time and there is no undertaking by GAR to post anysuch amendments or supplements on this presentation.
The Company will not be responsible for any consequences resulting from the use of this presentationas well as the reliance upon any opinion or statement contained herein or for any omission.
© Golden Agri-Resources Ltd. All rights reserved.
3slide
Contents
Corporate Overview 41
Key Competitive Strengths 72
Growth Strategy 173
Financial Performance 194
4slide
Corporate Overview

5slide
• Listed on SGX since 1999 • A leading Indonesian plantation group with integrated operations for the production of palm oil-based
edible oil and fat products• It has also operations in China and India including a deep sea port, soybean crushing plants, and
production of refined edible oil products as well as other food products such as noodles
Planted Area (as of 31 Mar 2017)1 : 488,276 haOutput of Palm Products (CPO and PK)
YTD Mar 2017 : 696,000 MTFY 2016 : 2,510,000 MT
Overview of GAR
Plantation Profile
Key Products• Cooking Oil• Margarine• Shortening• Specialty Fats• Stearin• Oleochemicals
• Crude palm oil (CPO)• Palm Kernel (PK)• Palm Kernel Oil (PKO)• Palm Kernel Meal• Soybean Oil and Meal• Biodiesel
Financial Statistics (in US$ million)
Notes:1. Including plasma2. Earnings before tax, non-controlling interests, interest on borrowings,
depreciation and amortisation, net gain/loss from changes in fair value of biological assets, foreign exchange gain/loss and exceptional item.
1Q 2017 FY 2016Revenue : 2,046 7,209EBITDA2 : 183 572Underlying Profit3 : 84 186Equity4 : 4,085 4,054
3. Net profit attributable to owners of the Company, excluding net effect of net gain or loss from changes in fair value of biological assets and depreciation of bearer plants, foreign exchange gain or loss, and other non-operating items (deferred tax income or expenses and exceptional item).
4. Attributable to owners of the Company.
6slide
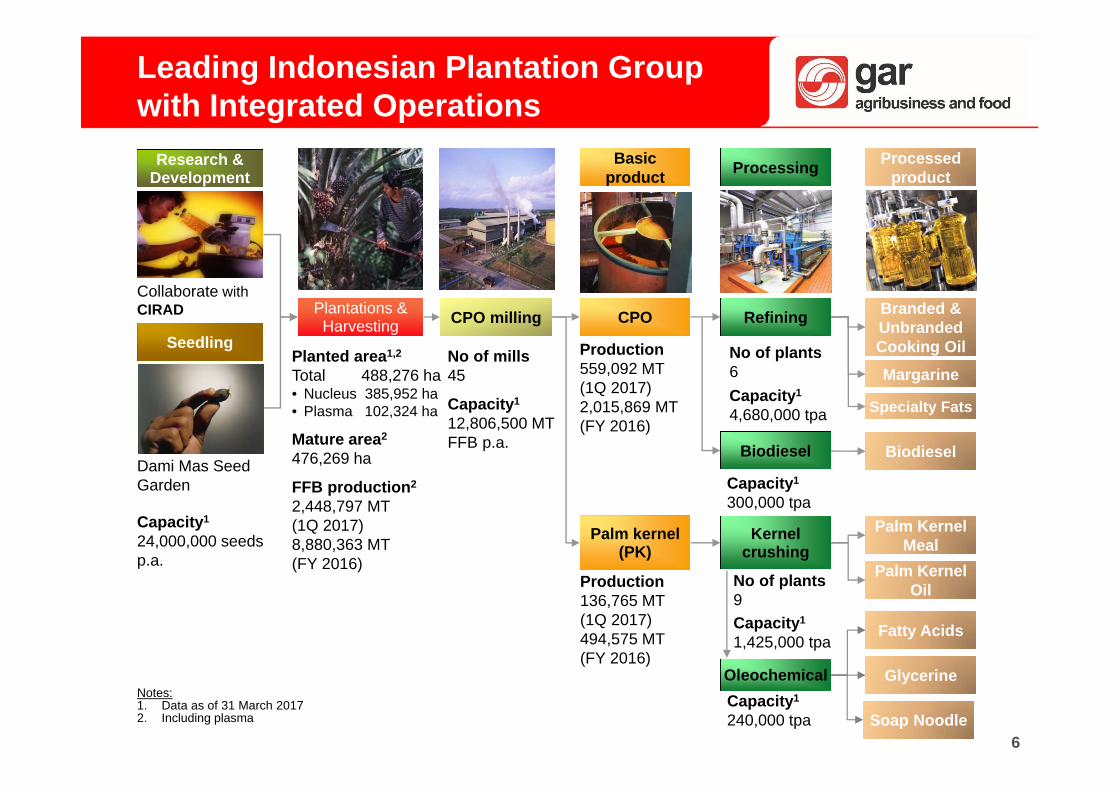
Leading Indonesian Plantation Group with Integrated Operations
Plantations & Harvesting CPO milling
Basic product Processing Processed
product
CPO Refining Branded & Unbranded Cooking Oil
Margarine
Specialty Fats
Palm kernel (PK)
Kernel crushing
Palm Kernel Meal
Planted area1,2
Total 488,276 ha• Nucleus 385,952 ha• Plasma 102,324 ha
Mature area2
476,269 ha
FFB production2
2,448,797 MT (1Q 2017)8,880,363 MT (FY 2016)
No of mills45
Capacity1
12,806,500 MT FFB p.a.
Palm Kernel Oil
Production559,092 MT (1Q 2017)2,015,869 MT (FY 2016)
No of plants6Capacity1
4,680,000 tpa
Production136,765 MT (1Q 2017) 494,575 MT (FY 2016)
No of plants9Capacity1
1,425,000 tpa
Notes:1. Data as of 31 March 20172. Including plasma
Research & Development
Seedling
Collaborate with CIRAD
Dami Mas Seed Garden
Capacity1
24,000,000 seeds p.a.
Capacity1
240,000 tpa
Oleochemical
Fatty Acids
Glycerine
Biodiesel
Capacity1
300,000 tpa
Biodiesel
Soap Noodle
7slide
Key Competitive Strengths
8slide
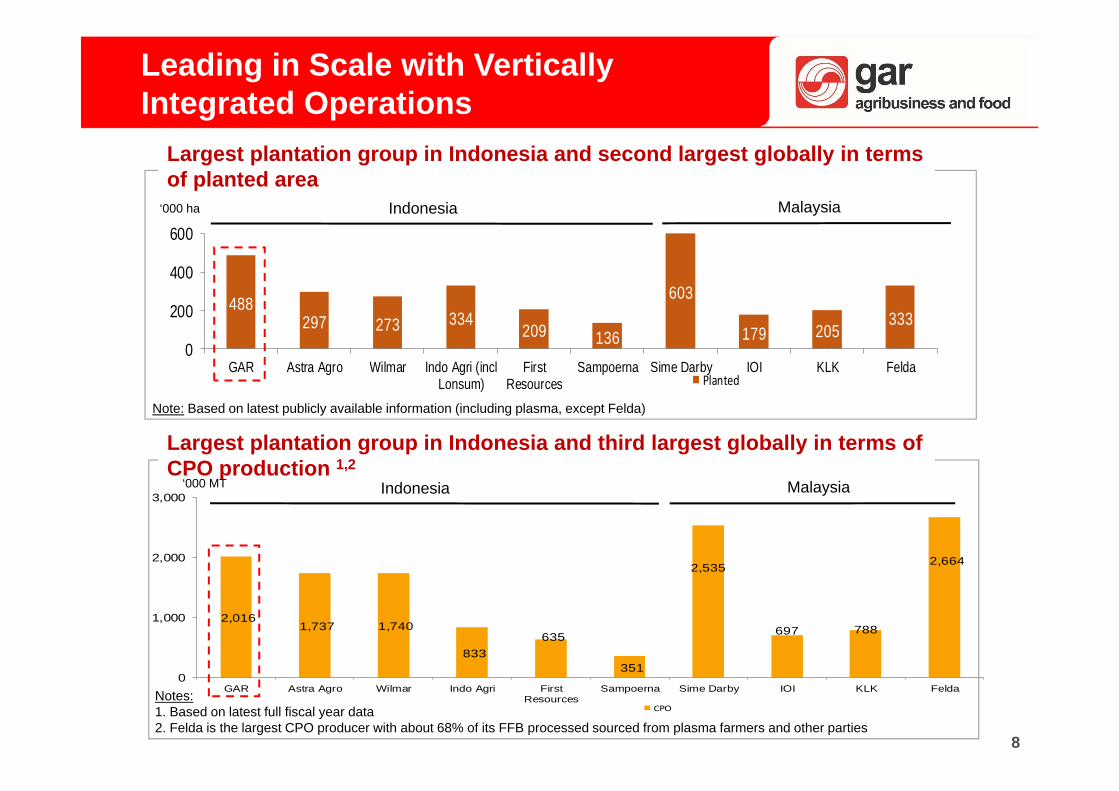
488297 273 334
209 136
603
179 205333
0
200
400
600
GAR Astra Agro Wilmar Indo Agri (inclLonsum)
FirstResources
Sampoerna Sime Darby IOI KLK FeldaPlanted
2,016 1,737 1,740
833 635
351
2,535
697 788
2,664
0
1,000
2,000
3,000
GAR Astra Agro Wilmar Indo Agri FirstResources
Sampoerna Sime Darby IOI KLK Felda
CPO
Largest plantation group in Indonesia and third largest globally in terms of CPO production 1,2
Notes:1. Based on latest full fiscal year data2. Felda is the largest CPO producer with about 68% of its FFB processed sourced from plasma farmers and other parties
Leading in Scale with Vertically Integrated Operations
Largest plantation group in Indonesia and second largest globally in terms of planted area
Indonesia Malaysia
Indonesia Malaysia
Note: Based on latest publicly available information (including plasma, except Felda)
‘000 MT
‘000 ha
9slide
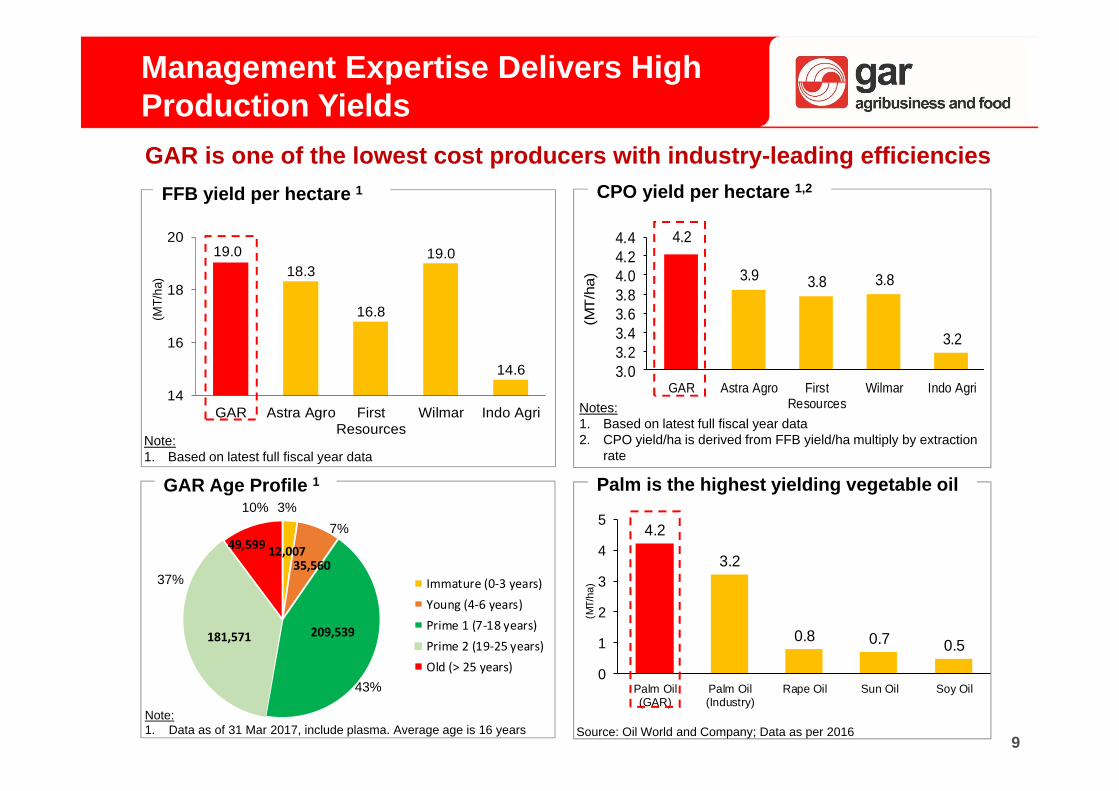
4.2
3.9 3.8 3.8
3.2
3.03.23.43.63.84.04.24.4
GAR Astra Agro FirstResources
Wilmar Indo Agri
(MT
/ha)
19.018.3
16.8
19.0
14.6
14
16
18
20
GAR Astra Agro FirstResources
Wilmar Indo Agri
(MT/
ha)
Palm is the highest yielding vegetable oil
Management Expertise Delivers High Production YieldsGAR is one of the lowest cost producers with industry-leading efficiencies
Note:1. Based on latest full fiscal year data
CPO yield per hectare 1,2FFB yield per hectare 1
Notes:1. Based on latest full fiscal year data2. CPO yield/ha is derived from FFB yield/ha multiply by extraction
rate
Source: Oil World and Company; Data as per 2016
GAR Age Profile 1
4.2
3.2
0.8 0.7 0.5
0
1
2
3
4
5
Palm Oil(GAR)
Palm Oil(Industry)
Rape Oil Sun Oil Soy Oil
(MT/
ha)
Note:1. Data as of 31 Mar 2017, include plasma. Average age is 16 years
10% 3%7%
43%
37%
12,00735,560
209,539181,571
49,599
Immature (0‐3 years)Young (4‐6 years)Prime 1 (7‐18 years)Prime 2 (19‐25 years)Old (> 25 years)
10slide
0
500
1000
1500
2000
2500
3000
2000
2001
2002
2003
2004
2005
2006
2007
2008
2009
2010
2011
2012
2013
2014
2015
2016
CPO PK
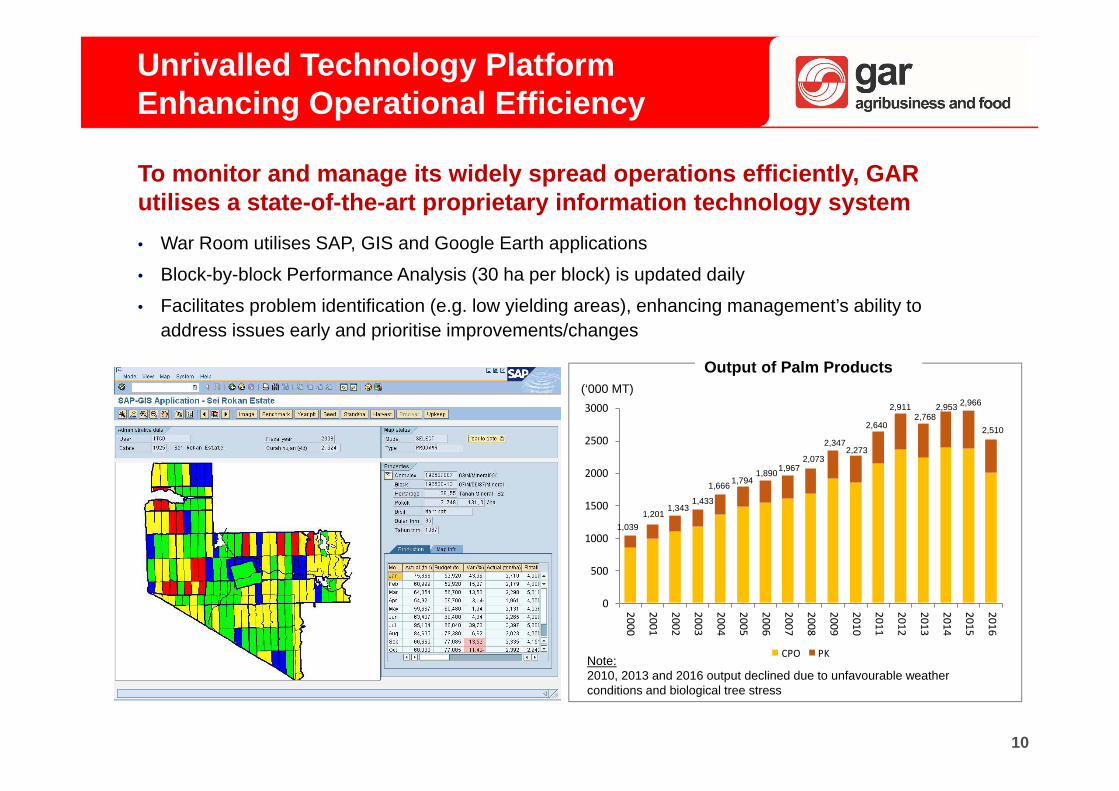
Unrivalled Technology Platform Enhancing Operational Efficiency
• War Room utilises SAP, GIS and Google Earth applications
• Block-by-block Performance Analysis (30 ha per block) is updated daily
• Facilitates problem identification (e.g. low yielding areas), enhancing management’s ability to address issues early and prioritise improvements/changes
To monitor and manage its widely spread operations efficiently, GAR utilises a state-of-the-art proprietary information technology system
Output of Palm Products(‘000 MT)
Note:2010, 2013 and 2016 output declined due to unfavourable weather conditions and biological tree stress
1,0391,201
1,3431,433
1,666 1,7941,8901,967
2,073
2,3472,273
2,640
2,9112,768
2,953 2,966
2,510
11slide
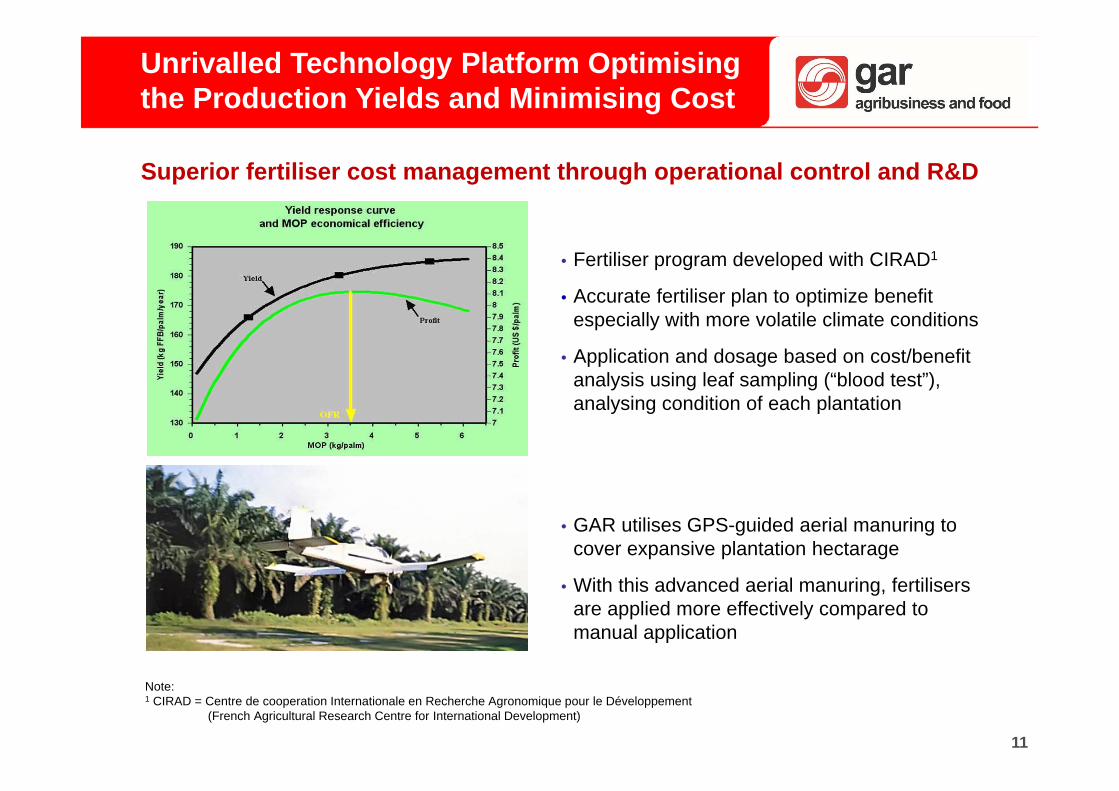
Superior fertiliser cost management through operational control and R&D
• GAR utilises GPS-guided aerial manuring to cover expansive plantation hectarage
• With this advanced aerial manuring, fertilisersare applied more effectively compared to manual application
• Fertiliser program developed with CIRAD1
• Accurate fertiliser plan to optimize benefit especially with more volatile climate conditions
• Application and dosage based on cost/benefit analysis using leaf sampling (“blood test”), analysing condition of each plantation
Note:1 CIRAD = Centre de cooperation Internationale en Recherche Agronomique pour le Développement
(French Agricultural Research Centre for International Development)
Unrivalled Technology Platform Optimising the Production Yields and Minimising Cost
12slide
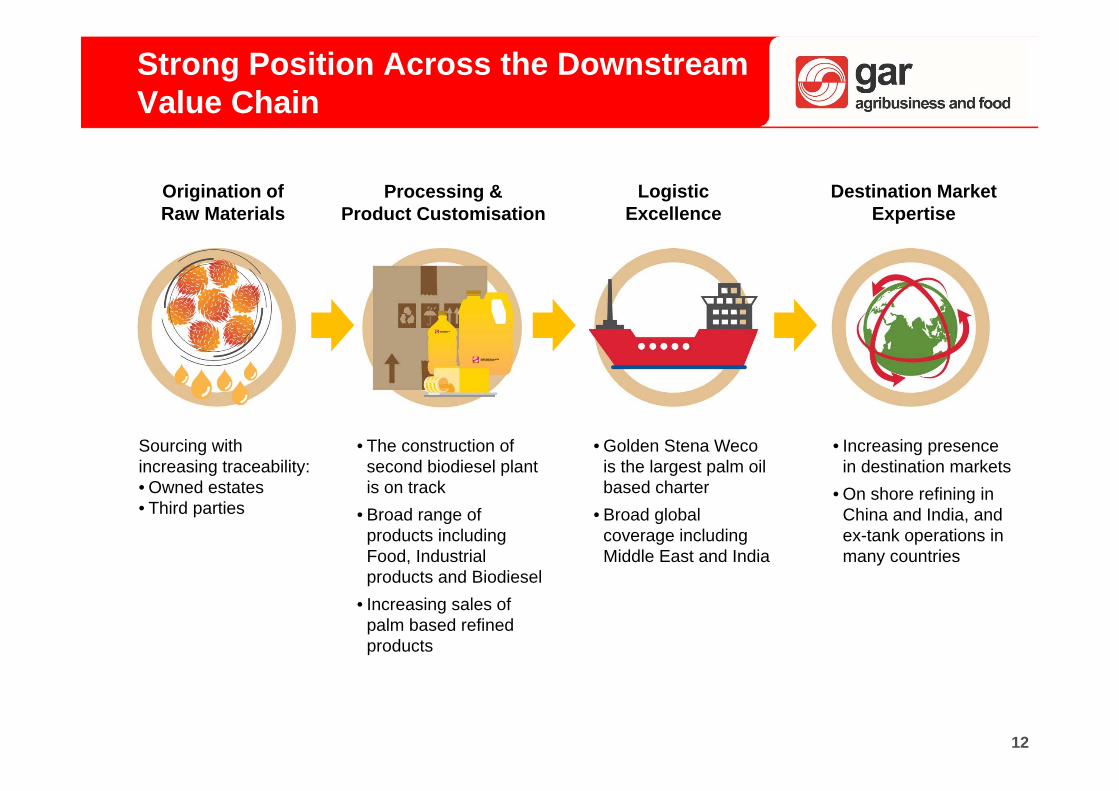
Strong Position Across the Downstream Value Chain
• The construction of second biodiesel plant is on track
• Broad range of products includingFood, Industrial products and Biodiesel
• Increasing sales of palm based refined products
• Golden Stena Weco is the largest palm oil based charter
• Broad globalcoverage includingMiddle East and India
• Increasing presence in destination markets
• On shore refining in China and India, and ex-tank operations in many countries
Origination of Raw Materials
Processing & Product Customisation
Logistic Excellence
Sourcing with increasing traceability:• Owned estates• Third parties
Destination Market Expertise

13slide
Strong Commitment to the Environment and Community for Sustainable Palm Oil
Sustainable Practices for Existing Plantations Zero waste policy by recycling of mill wastes
(Empty Fruit Bunch and Palm Oil Mill Effluent) Precise dosage in fertiliser application plan to
minimise risk of pollution Integrated pest management by deploying
biological controls to minimise and mitigate the impact of chemical pesticides
No deforestation footprint in our palm oil operations by not developing on: High carbon stock (HCS) forests High conservation value (HCV) forest areas Peat lands of any depth
Enhanced Planting Procedures
Continuous yield improvement in nucleus and plasma plantations managed by the Company Zero burning policy in land clearing Ensure free, prior and informed consent for indigenous and local communities Comply with all relevant laws and National Interpretation of RSPO Principles and Criteria
14slide
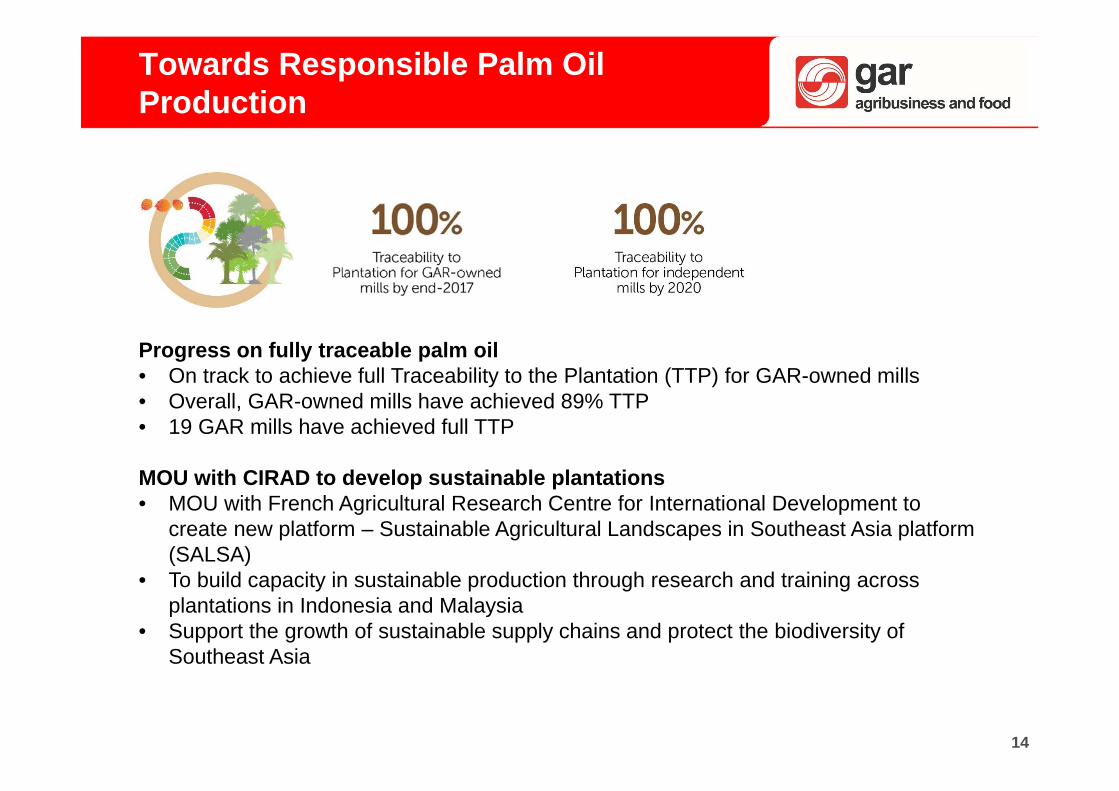
Towards Responsible Palm Oil Production
Progress on fully traceable palm oil • On track to achieve full Traceability to the Plantation (TTP) for GAR-owned mills• Overall, GAR-owned mills have achieved 89% TTP • 19 GAR mills have achieved full TTP
MOU with CIRAD to develop sustainable plantations• MOU with French Agricultural Research Centre for International Development to
create new platform – Sustainable Agricultural Landscapes in Southeast Asia platform (SALSA)
• To build capacity in sustainable production through research and training across plantations in Indonesia and Malaysia
• Support the growth of sustainable supply chains and protect the biodiversity of Southeast Asia
15slide
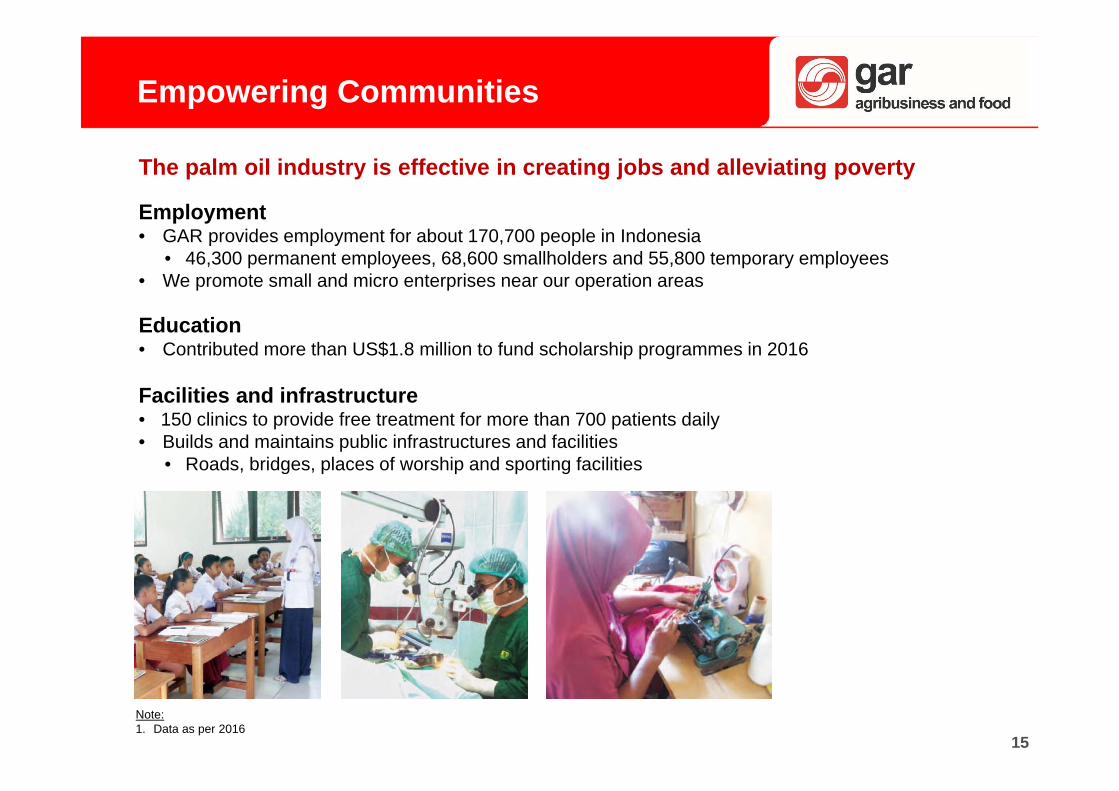
Empowering Communities
Employment• GAR provides employment for about 170,700 people in Indonesia
• 46,300 permanent employees, 68,600 smallholders and 55,800 temporary employees• We promote small and micro enterprises near our operation areas
Education• Contributed more than US$1.8 million to fund scholarship programmes in 2016
Facilities and infrastructure• 150 clinics to provide free treatment for more than 700 patients daily • Builds and maintains public infrastructures and facilities
• Roads, bridges, places of worship and sporting facilities
The palm oil industry is effective in creating jobs and alleviating poverty
Note:1. Data as per 2016

16slide
Growth Strategy
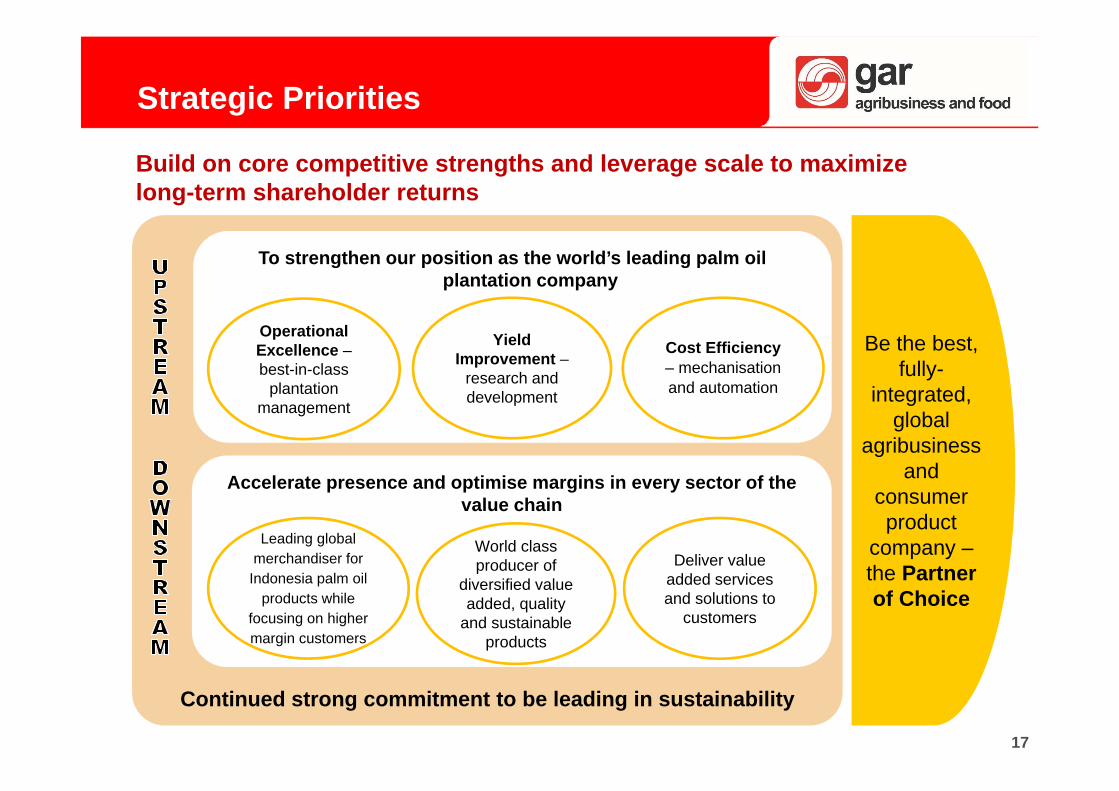
17slide
Build on core competitive strengths and leverage scale to maximize long-term shareholder returns
Continued strong commitment to be leading in sustainability
To strengthen our position as the world’s leading palm oil plantation company
Accelerate presence and optimise margins in every sector of the value chain
Be the best, fully-
integrated, global
agribusiness and
consumer product
company –the Partner of Choice
Leading global merchandiser for
Indonesia palm oil products while
focusing on higher margin customers
Deliver value added services and solutions to
customers
Cost Efficiency – mechanisation and automation
Yield Improvement –
research and development
Operational Excellence –best-in-class
plantation management
Strategic Priorities
World class producer of
diversified value added, quality
and sustainable products
18slide
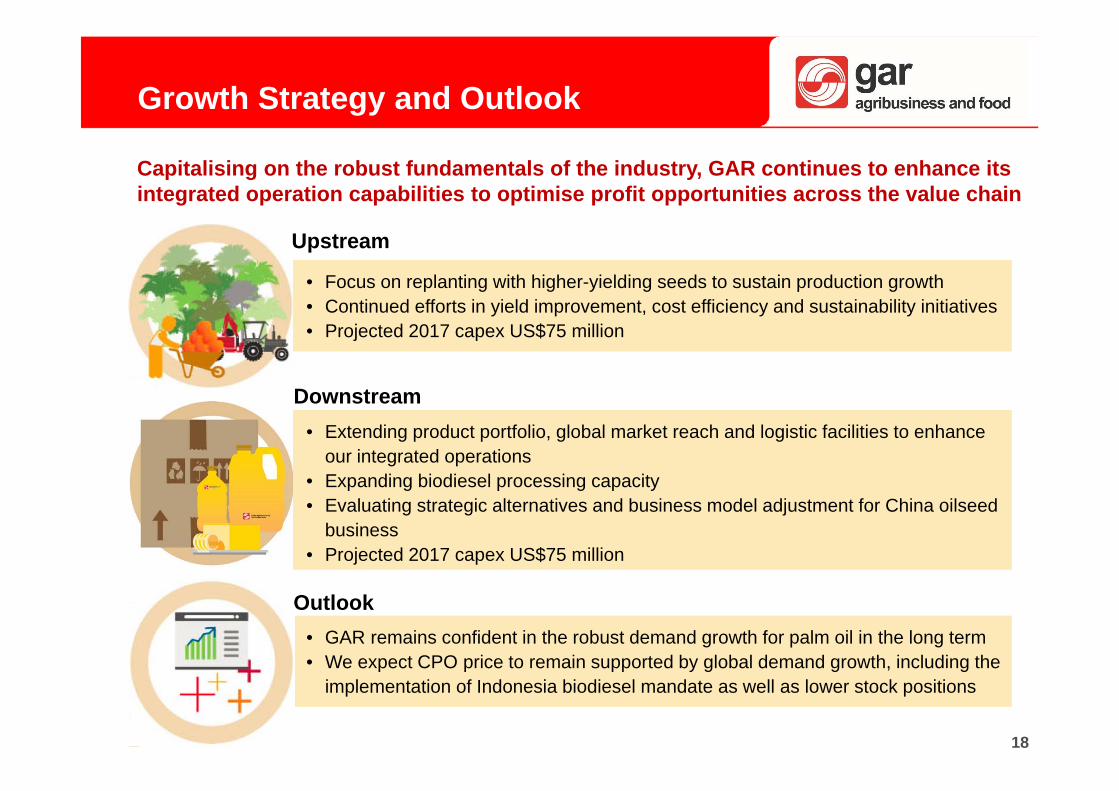
• Focus on replanting with higher-yielding seeds to sustain production growth• Continued efforts in yield improvement, cost efficiency and sustainability initiatives• Projected 2017 capex US$75 million
Growth Strategy and Outlook
• Extending product portfolio, global market reach and logistic facilities to enhance our integrated operations
• Expanding biodiesel processing capacity• Evaluating strategic alternatives and business model adjustment for China oilseed
business• Projected 2017 capex US$75 million
• GAR remains confident in the robust demand growth for palm oil in the long term • We expect CPO price to remain supported by global demand growth, including the
implementation of Indonesia biodiesel mandate as well as lower stock positions
Capitalising on the robust fundamentals of the industry, GAR continues to enhance its integrated operation capabilities to optimise profit opportunities across the value chain
Upstream
Outlook
Downstream

19slide
Financial Performance
20slide
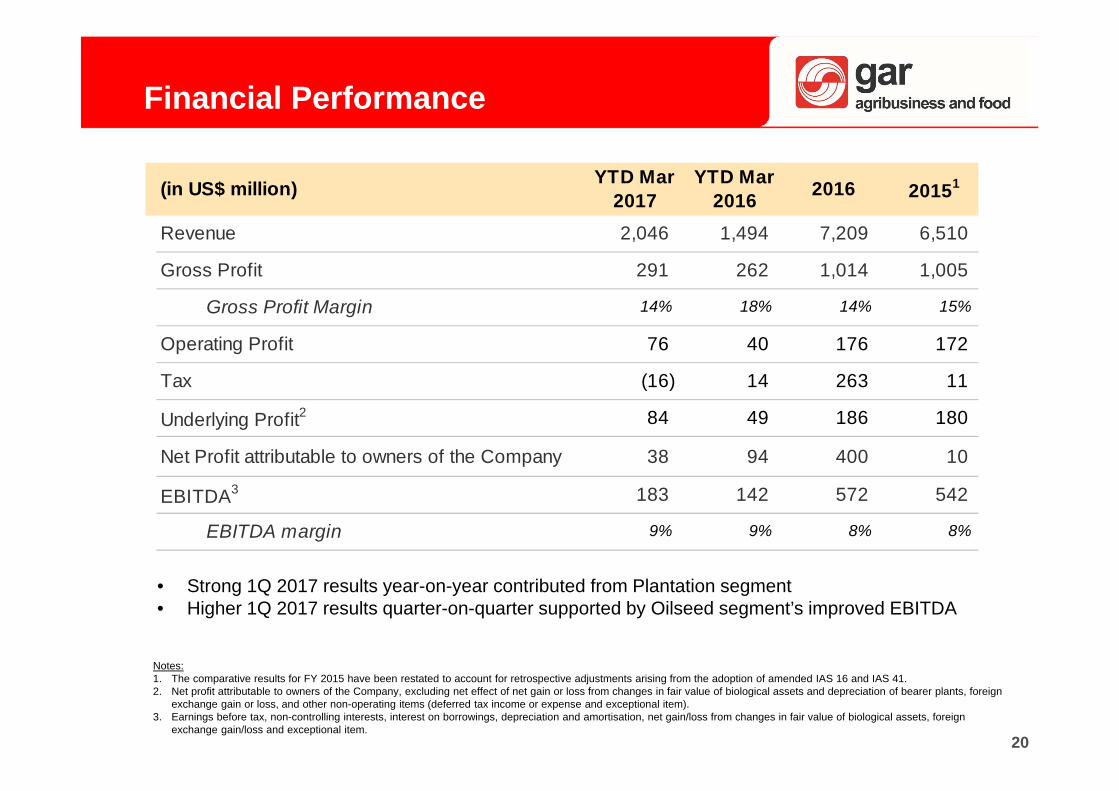
Financial Performance
Notes:1. The comparative results for FY 2015 have been restated to account for retrospective adjustments arising from the adoption of amended IAS 16 and IAS 41.2. Net profit attributable to owners of the Company, excluding net effect of net gain or loss from changes in fair value of biological assets and depreciation of bearer plants, foreign
exchange gain or loss, and other non-operating items (deferred tax income or expense and exceptional item).3. Earnings before tax, non-controlling interests, interest on borrowings, depreciation and amortisation, net gain/loss from changes in fair value of biological assets, foreign
exchange gain/loss and exceptional item.
(in US$ million) YTD Mar 2017
YTD Mar 2016 2016 20151
Revenue 2,046 1,494 7,209 6,510
Gross Profit 291 262 1,014 1,005
Gross Profit Margin 14% 18% 14% 15%
Operating Profit 76 40 176 172
Tax (16) 14 263 11
Underlying Profit2 84 49 186 180
Net Profit attributable to owners of the Company 38 94 400 10
EBITDA3 183 142 572 542
EBITDA margin 9% 9% 8% 8%
• Strong 1Q 2017 results year-on-year contributed from Plantation segment• Higher 1Q 2017 results quarter-on-quarter supported by Oilseed segment’s improved EBITDA
21slide
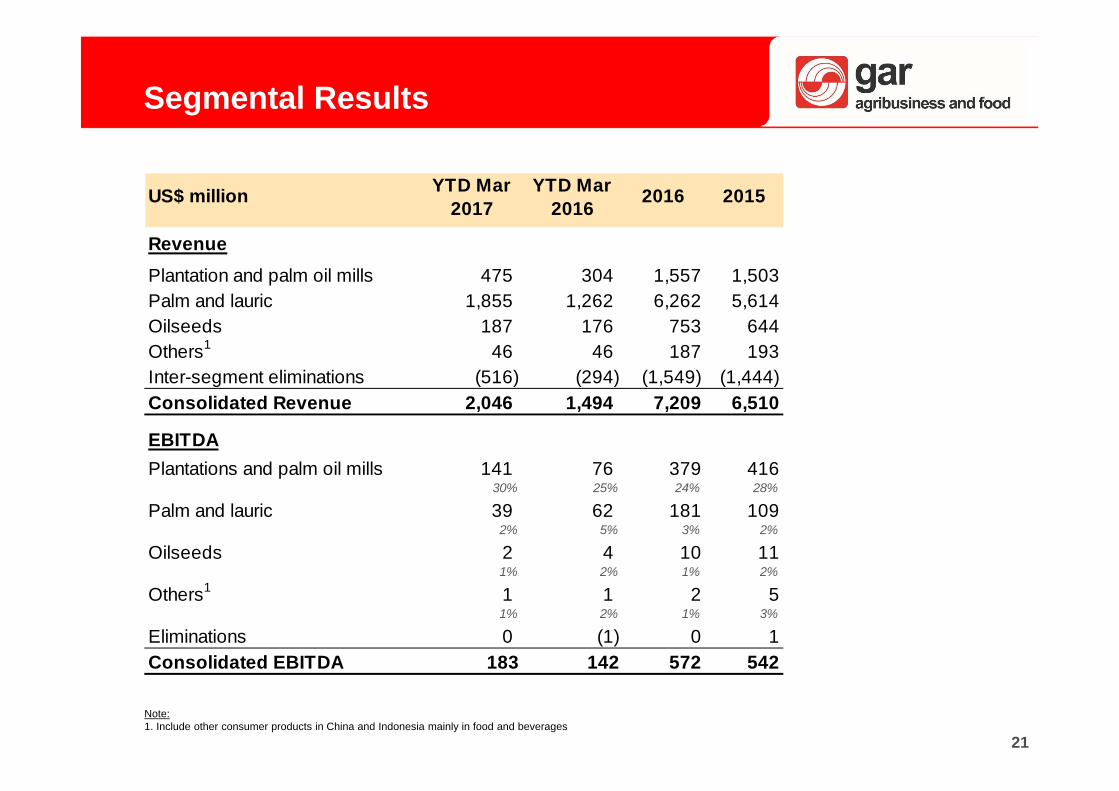
Segmental Results
Note:1. Include other consumer products in China and Indonesia mainly in food and beverages
US$ million YTD Mar 2017
YTD Mar 2016 2016 2015
RevenuePlantation and palm oil mills 475 304 1,557 1,503Palm and lauric 1,855 1,262 6,262 5,614Oilseeds 187 176 753 644Others1 46 46 187 193Inter-segment eliminations (516) (294) (1,549) (1,444) Consolidated Revenue 2,046 1,494 7,209 6,510
EBITDAPlantations and palm oil mills 141 76 379 416
30% 25% 24% 28%
Palm and lauric 39 62 181 1092% 5% 3% 2%
Oilseeds 2 4 10 111% 2% 1% 2%
Others1 1 1 2 51% 2% 1% 3%
Eliminations 0 (1) 0 1Consolidated EBITDA 183 142 572 542
22slide
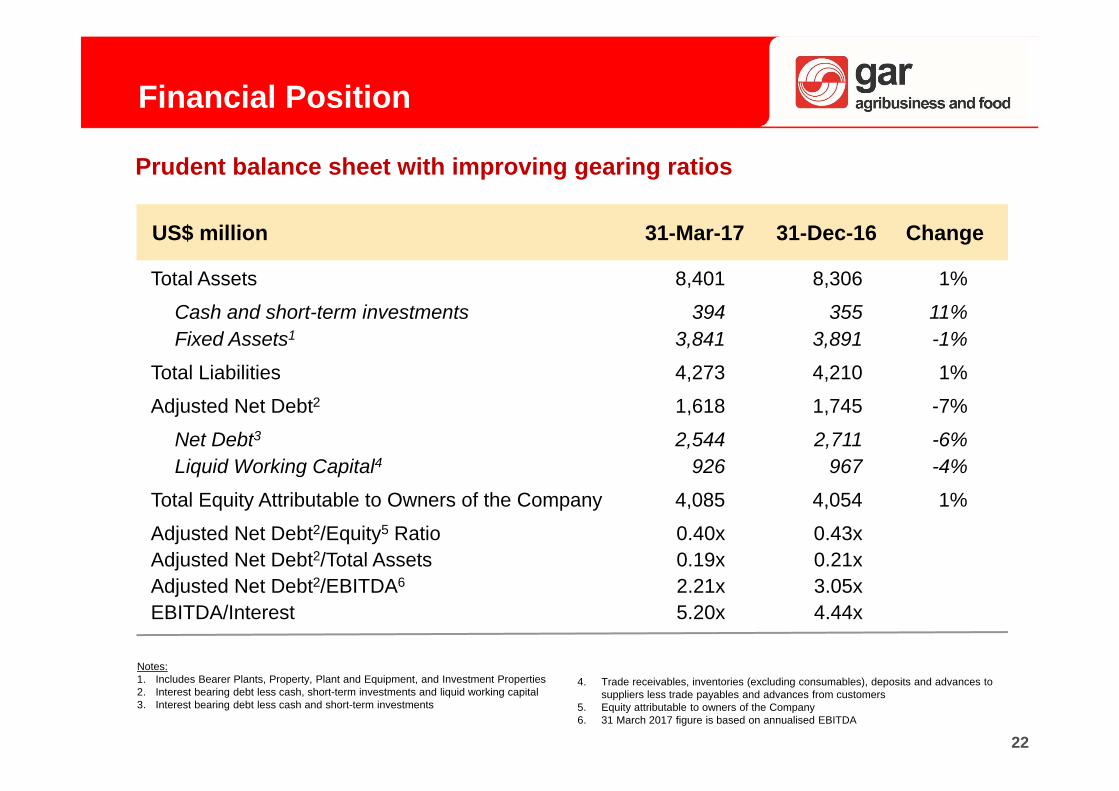
Financial Position
Prudent balance sheet with improving gearing ratios
US$ million 31-Mar-17 31-Dec-16 Change
Total Assets 8,401 8,306 1%
Cash and short-term investments 394 355 11%Fixed Assets1 3,841 3,891 -1%
Total Liabilities 4,273 4,210 1%
Adjusted Net Debt2 1,618 1,745 -7%
Net Debt3 2,544 2,711 -6%Liquid Working Capital4 926 967 -4%
Total Equity Attributable to Owners of the Company 4,085 4,054 1%
Adjusted Net Debt2/Equity5 Ratio 0.40x 0.43xAdjusted Net Debt2/Total Assets 0.19x 0.21xAdjusted Net Debt2/EBITDA6 2.21x 3.05xEBITDA/Interest 5.20x 4.44x
Notes:1. Includes Bearer Plants, Property, Plant and Equipment, and Investment Properties2. Interest bearing debt less cash, short-term investments and liquid working capital3. Interest bearing debt less cash and short-term investments
4. Trade receivables, inventories (excluding consumables), deposits and advances to suppliers less trade payables and advances from customers
5. Equity attributable to owners of the Company6. 31 March 2017 figure is based on annualised EBITDA
23slide
Contact Us
Golden Agri-Resources Ltdc/o 108 Pasir Panjang Road#06-00 Golden Agri PlazaSingapore 118535
Telephone : +65 65900800Facsimile : +65 65900887
www.goldenagri.com.sg
Contact Person : Richard Fung [email protected]
If you need further information, please contact: