goldman sachs annual global healthcare conference...safe harbor statement this presentation contains...
TRANSCRIPT

Goldman Sachs Annual Global Healthcare Conference
Frankfurt stock exchange: FRE │ US ADR program: FSNUY │ www.fresenius.com/investors
12 / 13 June 2018
Safe Harbor Statement
This presentation contains forward-looking statements that are subject to various risks and uncertainties. Future results could differ materially from those described in these forward-looking statements due to certain factors, e.g. changes in business, economic and competitive conditions, regulatory reforms, results of clinical trials, foreign exchange rate fluctuations, uncertainties in litigation or investigative proceedings, and the availability of financing. Fresenius does not undertake any responsibility to update the forward-looking statements contained in this presentation.
Goldman Sachs Annual Global Healthcare Conference 2018 © Fresenius SE & Co. KGaA Investor Relations 2
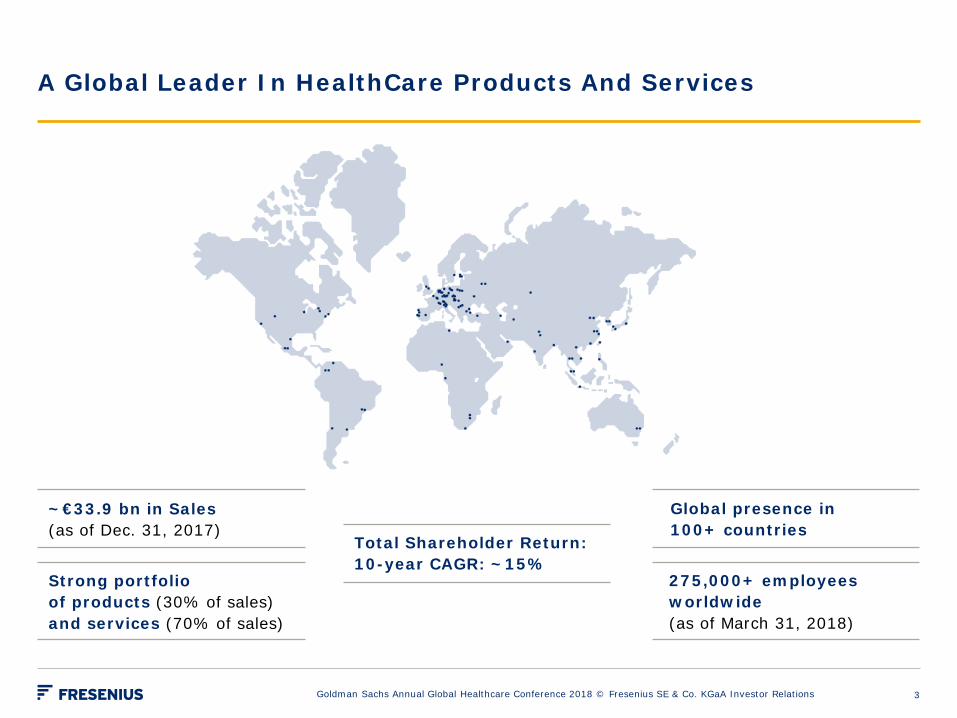
~€33.9 bn in Sales (as of Dec. 31, 2017)
Total Shareholder Return: 10-year CAGR: ~15%
Strong portfolio of products (30% of sales) and services (70% of sales)
Global presence in 100+ countries
275,000+ employees worldwide (as of March 31, 2018)
A Global Leader In HealthCare Products And Services
Goldman Sachs Annual Global Healthcare Conference 2018 © Fresenius SE & Co. KGaA Investor Relations 3
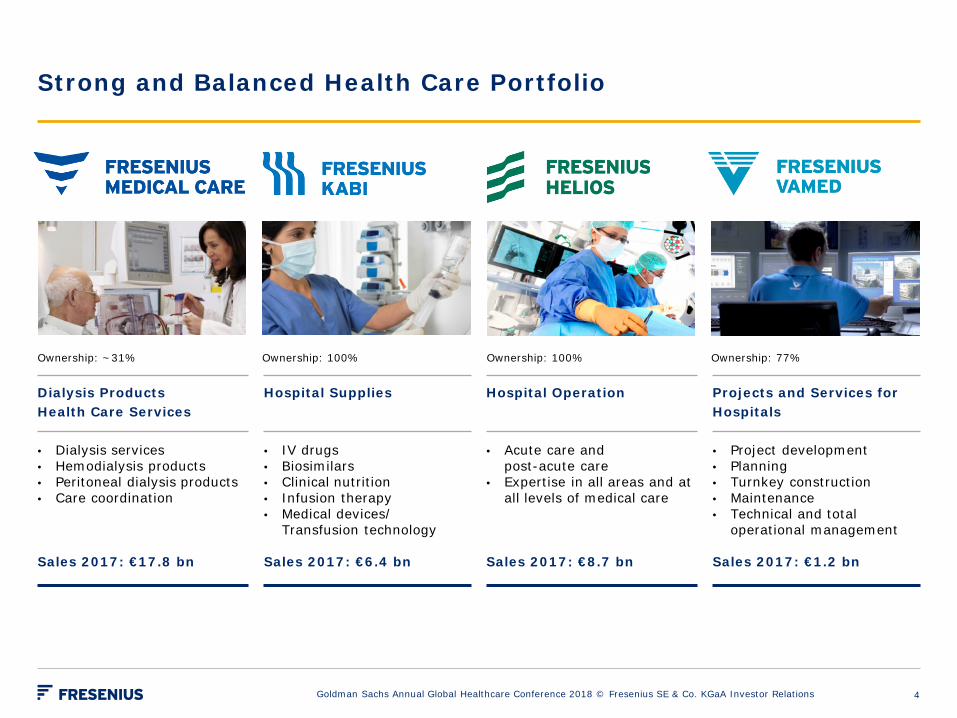
Strong and Balanced Health Care Portfolio
Goldman Sachs Annual Global Healthcare Conference 2018 © Fresenius SE & Co. KGaA Investor Relations
Ownership: ~31% Ownership: 100% Ownership: 100% Ownership: 77%
Dialysis Products Health Care Services
Hospital Supplies Hospital Operation Projects and Services for Hospitals
• Dialysis services • Hemodialysis products • Peritoneal dialysis products • Care coordination
Sales 2017: €17.8 bn
• IV drugs • Biosimilars • Clinical nutrition • Infusion therapy • Medical devices/
Transfusion technology Sales 2017: €6.4 bn
• Acute care and post-acute care
• Expertise in all areas and at all levels of medical care
Sales 2017: €8.7 bn
• Project development • Planning • Turnkey construction • Maintenance • Technical and total
operational management Sales 2017: €1.2 bn
4
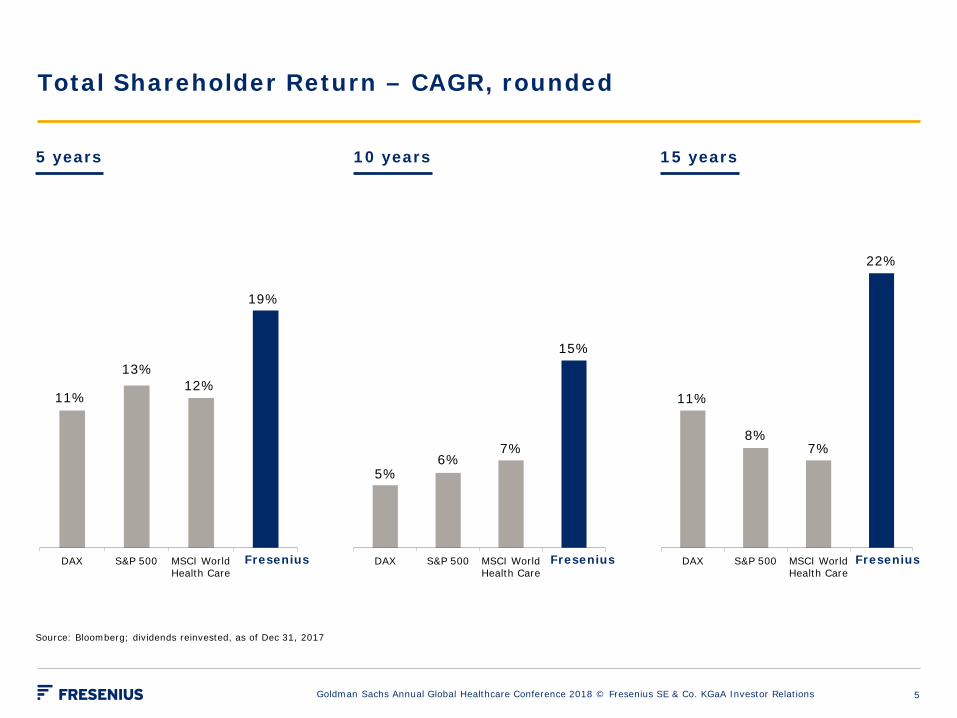
Source: Bloomberg; dividends reinvested, as of Dec 31, 2017
DAX S&P 500 MSCI WorldHealth Care
Fresenius
19%
11%
DAX S&P 500 MSCI WorldHealth Care
Fresenius DAX S&P 500 MSCI WorldHealth Care
Fresenius
15%
5%
22%
11%
13% 12%
6% 7%
8% 7%
Fresenius Fresenius Fresenius
Total Shareholder Return – CAGR, rounded
5 years 10 years 15 years
Goldman Sachs Annual Global Healthcare Conference 2018 © Fresenius SE & Co. KGaA Investor Relations 5

6.2 6.2
4.8 4.8 4.8 5.2 5.3
5.8 5.5 5.5 5.4
4
5
6
7
8
2007 2008 2009 2010 2011 2012 2013 2014 2015 2016 2017
5.6
2.7
6.3
7.4
5.6
7.6
6.2 5.2
6.7 6.7 6.6
2
4
6
8
10
2007 2008 2009 2010 2011 2012 2013 2014 2015 2016 2017
11.4
8.7
11.0
12.0
10.3
12.6
11.4 10.9
12.0 12.2 11.6
8
9
10
11
12
13
14
2007 2008 2009 2010 2011 2012 2013 2014 2015 2016 2017
Fresenius Group Consistent Cash Generation
% %
%
Capex gross, in % of sales
FCF margin (before acquisitions & dividends) CFFO margin
Net Debt / EBITDA1
1 Net debt at year-end exchange rate; EBITDA at LTM average exchange rates; before special items; pro forma acquisitions
Goldman Sachs Annual Global Healthcare Conference 2018 © Fresenius SE & Co. KGaA Investor Relations
2.6
3.6
3.0
2.6 2.8
2.5 2.5
3.4
2.7
2.4
2.8
2.0
2.5
3.0
3.5
4.0
2007 2008 2009 2010 2011 2012 2013 2014 2015 2016 2017
6
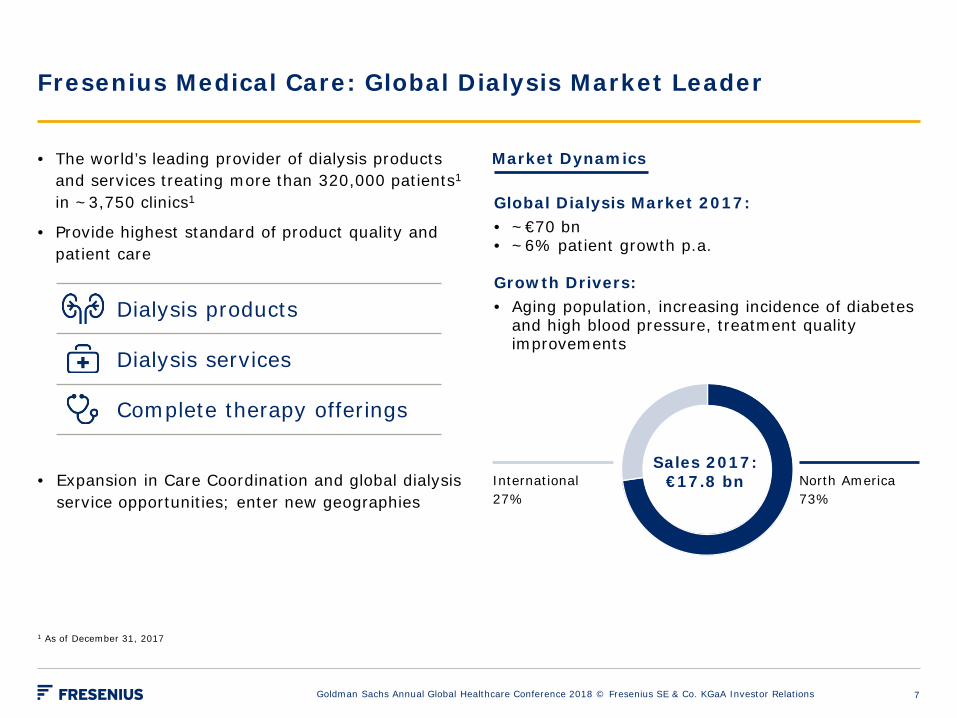
Fresenius Medical Care: Global Dialysis Market Leader
• The world’s leading provider of dialysis products and services treating more than 320,000 patients1 in ~3,750 clinics1
• Provide highest standard of product quality and patient care
• Expansion in Care Coordination and global dialysis service opportunities; enter new geographies
Global Dialysis Market 2017: • ~€70 bn • ~6% patient growth p.a. Growth Drivers: • Aging population, increasing incidence of diabetes
and high blood pressure, treatment quality improvements
International 27%
Sales 2017: €17.8 bn North America
73%
Dialysis products
Dialysis services
Complete therapy offerings
1 As of December 31, 2017
Market Dynamics
Goldman Sachs Annual Global Healthcare Conference 2018 © Fresenius SE & Co. KGaA Investor Relations 7

Fresenius Kabi: A Leading Global Hospital Supplier
• Comprehensive product portfolio for critically and chronically ill patients
• Strong Emerging Markets presence
• Leading market positions in four product segments
• Focus on organic growth through geographic product rollouts and new product launches
• Development of biosimilars with a focus on oncology and autoimmune diseases
Global Addressable Market 2017: • ~€81 bn Growth Drivers: • Patent expirations, rising demand for health care
services, higher health care spending in Emerging Markets
Market Dynamics
Emerging Markets 29%
Sales 2017: €6.4 bn Europe 35%
North America 36%
Generic IV Drugs
Clinical Nutrition
Infusion Therapy
Medical Devices / Transfusion Technology
Goldman Sachs Annual Global Healthcare Conference 2018 © Fresenius SE & Co. KGaA Investor Relations 8
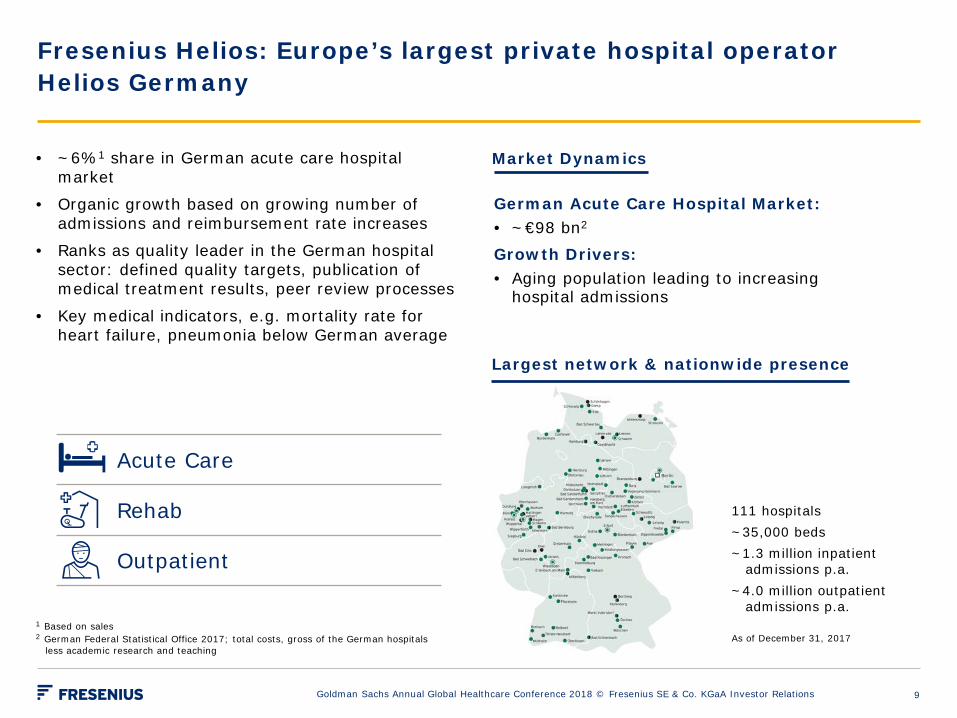
• ~6%1 share in German acute care hospital market
• Organic growth based on growing number of admissions and reimbursement rate increases
• Ranks as quality leader in the German hospital sector: defined quality targets, publication of medical treatment results, peer review processes
• Key medical indicators, e.g. mortality rate for heart failure, pneumonia below German average
111 hospitals ~35,000 beds ~1.3 million inpatient admissions p.a. ~4.0 million outpatient admissions p.a.
1 Based on sales 2 German Federal Statistical Office 2017; total costs, gross of the German hospitals
less academic research and teaching As of December 31, 2017
Fresenius Helios: Europe’s largest private hospital operator Helios Germany
German Acute Care Hospital Market: • ~€98 bn2 Growth Drivers: • Aging population leading to increasing
hospital admissions
Largest network & nationwide presence
Acute Care
Rehab
Outpatient
Market Dynamics
Goldman Sachs Annual Global Healthcare Conference 2018 © Fresenius SE & Co. KGaA Investor Relations 9
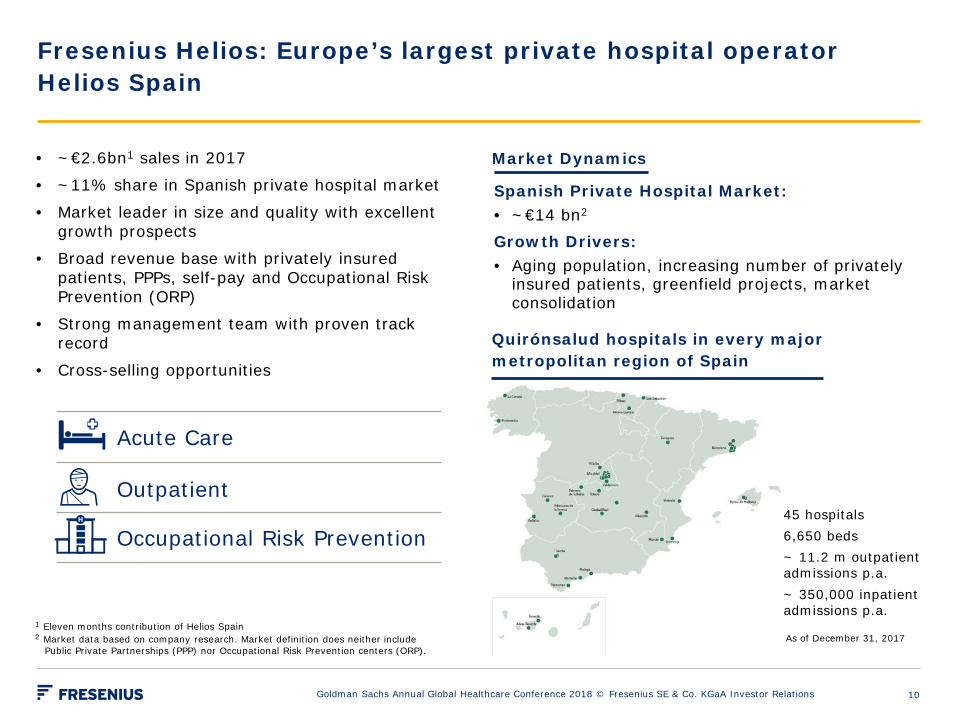
• ~€2.6bn1 sales in 2017
• ~11% share in Spanish private hospital market
• Market leader in size and quality with excellent growth prospects
• Broad revenue base with privately insured patients, PPPs, self-pay and Occupational Risk Prevention (ORP)
• Strong management team with proven track record
• Cross-selling opportunities
Fresenius Helios: Europe’s largest private hospital operator Helios Spain
Spanish Private Hospital Market: • ~€14 bn2 Growth Drivers: • Aging population, increasing number of privately
insured patients, greenfield projects, market consolidation
Quirónsalud hospitals in every major metropolitan region of Spain
Acute Care
Occupational Risk Prevention
Outpatient
1 Eleven months contribution of Helios Spain 2 Market data based on company research. Market definition does neither include Public Private Partnerships (PPP) nor Occupational Risk Prevention centers (ORP).
Market Dynamics
Goldman Sachs Annual Global Healthcare Conference 2018 © Fresenius SE & Co. KGaA Investor Relations
As of December 31, 2017
45 hospitals 6,650 beds ~ 11.2 m outpatient admissions p.a. ~ 350,000 inpatient admissions p.a.
10
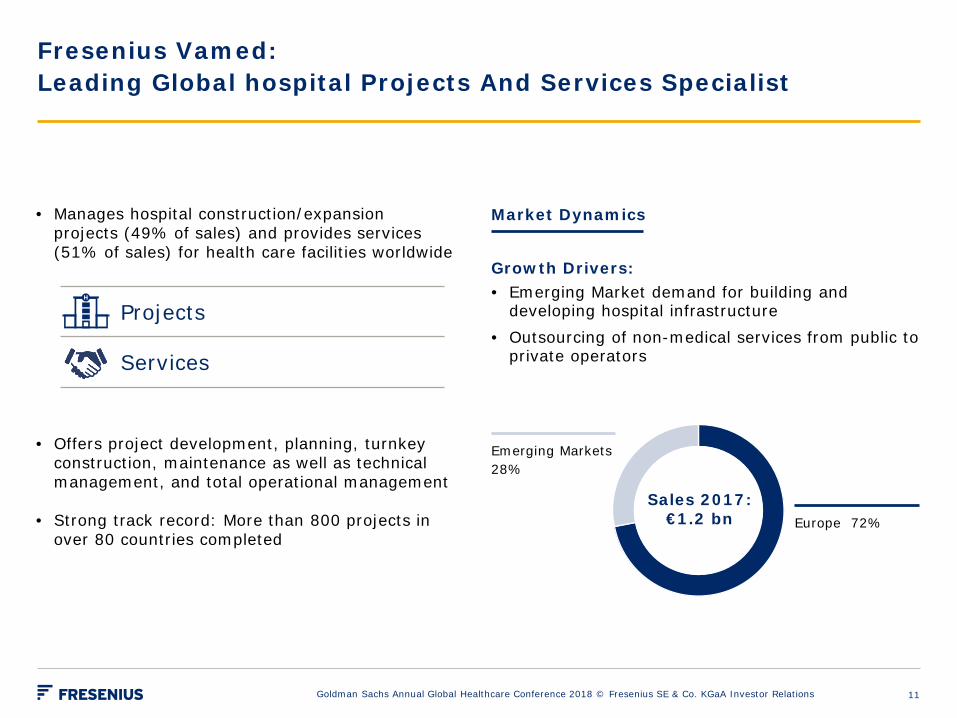
• Manages hospital construction/expansion projects (49% of sales) and provides services (51% of sales) for health care facilities worldwide
• Offers project development, planning, turnkey construction, maintenance as well as technical management, and total operational management
• Strong track record: More than 800 projects in over 80 countries completed
Fresenius Vamed: Leading Global hospital Projects And Services Specialist
Market Dynamics
Growth Drivers: • Emerging Market demand for building and
developing hospital infrastructure • Outsourcing of non-medical services from public to
private operators
Emerging Markets 28%
Sales 2017: €1.2 bn Europe 72%
Projects
Services
Goldman Sachs Annual Global Healthcare Conference 2018 © Fresenius SE & Co. KGaA Investor Relations 11
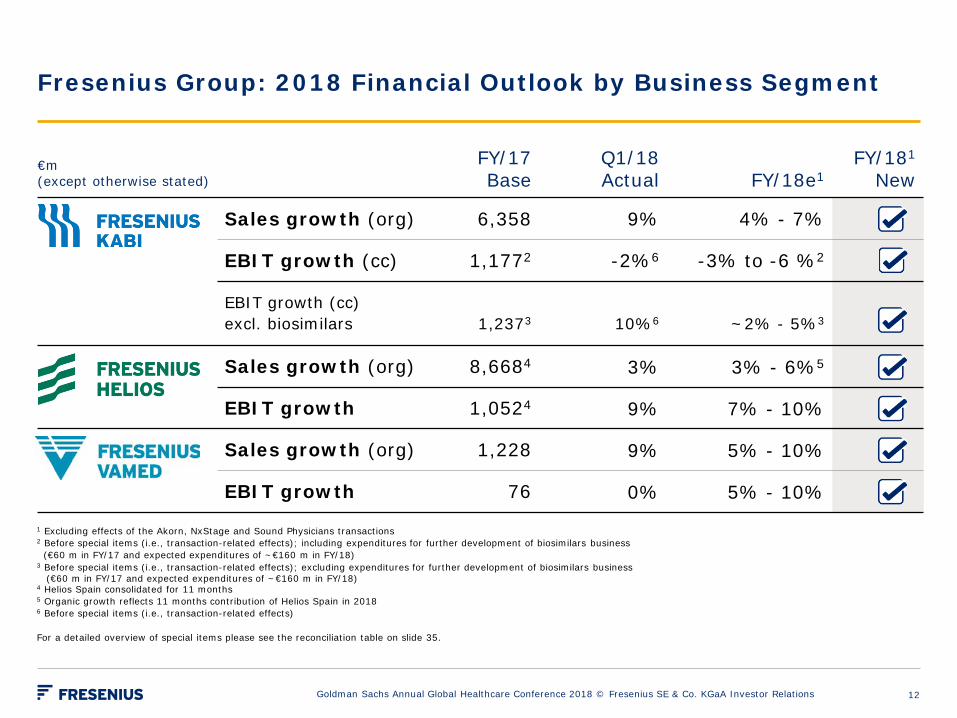
€m (except otherwise stated)
FY/17 Base
Q1/18
Actual FY/18e1 FY/181
New
Sales growth (org) 6,358 9% 4% - 7%
EBIT growth (cc) 1,1772 -2%6 -3% to -6 %2
EBIT growth (cc) excl. biosimilars
1,2373
10%6
~2% - 5%3
Sales growth (org) 8,6684 3% 3% - 6%5
EBIT growth 1,0524 9% 7% - 10%
Sales growth (org) 1,228 9% 5% - 10%
EBIT growth 76 0% 5% - 10%
1 Excluding effects of the Akorn, NxStage and Sound Physicians transactions 2 Before special items (i.e., transaction-related effects); including expenditures for further development of biosimilars business (€60 m in FY/17 and expected expenditures of ~€160 m in FY/18) 3 Before special items (i.e., transaction-related effects); excluding expenditures for further development of biosimilars business
(€60 m in FY/17 and expected expenditures of ~€160 m in FY/18) 4 Helios Spain consolidated for 11 months 5 Organic growth reflects 11 months contribution of Helios Spain in 2018 6 Before special items (i.e., transaction-related effects) For a detailed overview of special items please see the reconciliation table on slide 35.
Fresenius Group: 2018 Financial Outlook by Business Segment
Goldman Sachs Annual Global Healthcare Conference 2018 © Fresenius SE & Co. KGaA Investor Relations 12
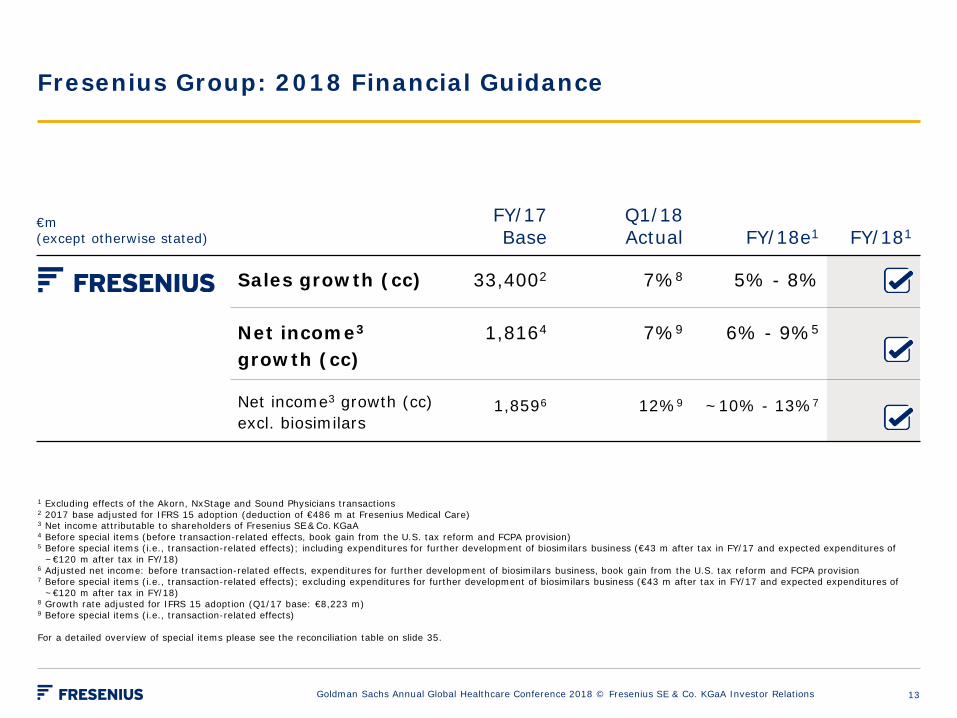
€m (except otherwise stated)
FY/17
Base Q1/18
Actual FY/18e1 FY/181
Sales growth (cc) 33,4002 7%8 5% - 8%
Net income3 growth (cc)
1,8164 7%9 6% - 9%5
Net income3 growth (cc) excl. biosimilars
1,8596 12%9 ~10% - 13%7
Fresenius Group: 2018 Financial Guidance
Goldman Sachs Annual Global Healthcare Conference 2018 © Fresenius SE & Co. KGaA Investor Relations
1 Excluding effects of the Akorn, NxStage and Sound Physicians transactions 2 2017 base adjusted for IFRS 15 adoption (deduction of €486 m at Fresenius Medical Care) 3 Net income attributable to shareholders of Fresenius SE & Co. KGaA 4 Before special items (before transaction-related effects, book gain from the U.S. tax reform and FCPA provision) 5 Before special items (i.e., transaction-related effects); including expenditures for further development of biosimilars business (€43 m after tax in FY/17 and expected expenditures of
~€120 m after tax in FY/18) 6 Adjusted net income: before transaction-related effects, expenditures for further development of biosimilars business, book gain from the U.S. tax reform and FCPA provision 7 Before special items (i.e., transaction-related effects); excluding expenditures for further development of biosimilars business (€43 m after tax in FY/17 and expected expenditures of
~€120 m after tax in FY/18) 8 Growth rate adjusted for IFRS 15 adoption (Q1/17 base: €8,223 m) 9 Before special items (i.e., transaction-related effects) For a detailed overview of special items please see the reconciliation table on slide 35.
13
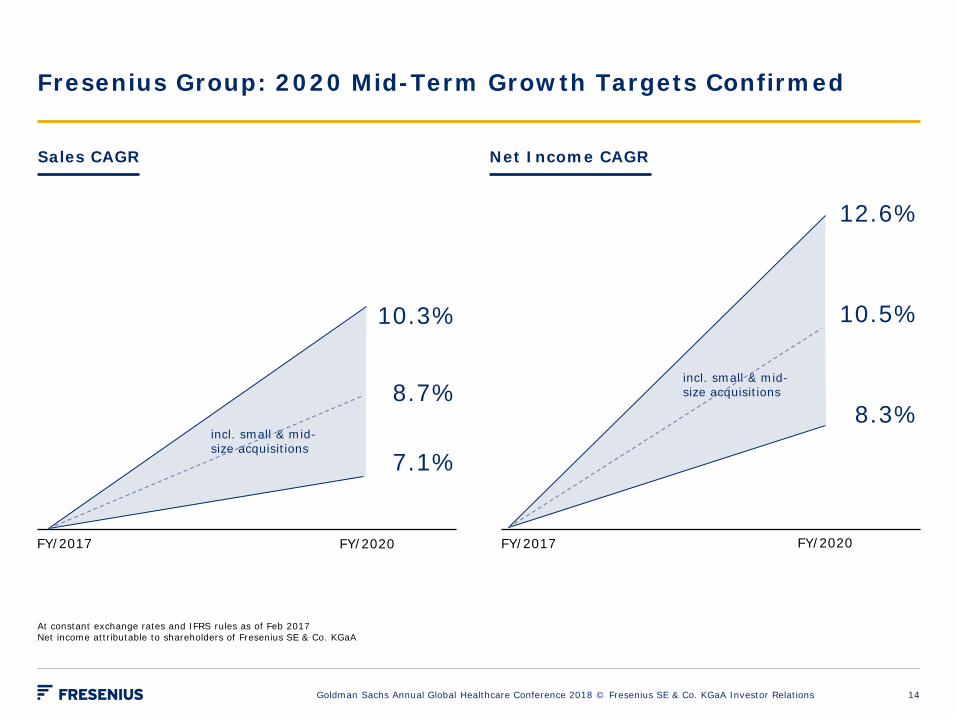
Fresenius Group: 2020 Mid-Term Growth Targets Confirmed
Goldman Sachs Annual Global Healthcare Conference 2018 © Fresenius SE & Co. KGaA Investor Relations
Sales CAGR Net Income CAGR
At constant exchange rates and IFRS rules as of Feb 2017 Net income attributable to shareholders of Fresenius SE & Co. KGaA
FY/2017
10.3%
7.1%
FY/2020
8.7%
FY/2017
12.6%
8.3%
FY/2020
10.5%
incl. small & mid-size acquisitions
incl. small & mid-size acquisitions
14
Financial Review Q1/18
Goldman Sachs Annual Global Healthcare Conference 2018 © Fresenius SE & Co. KGaA Investor Relations 15
Fresenius Group: Q1/18 Highlights
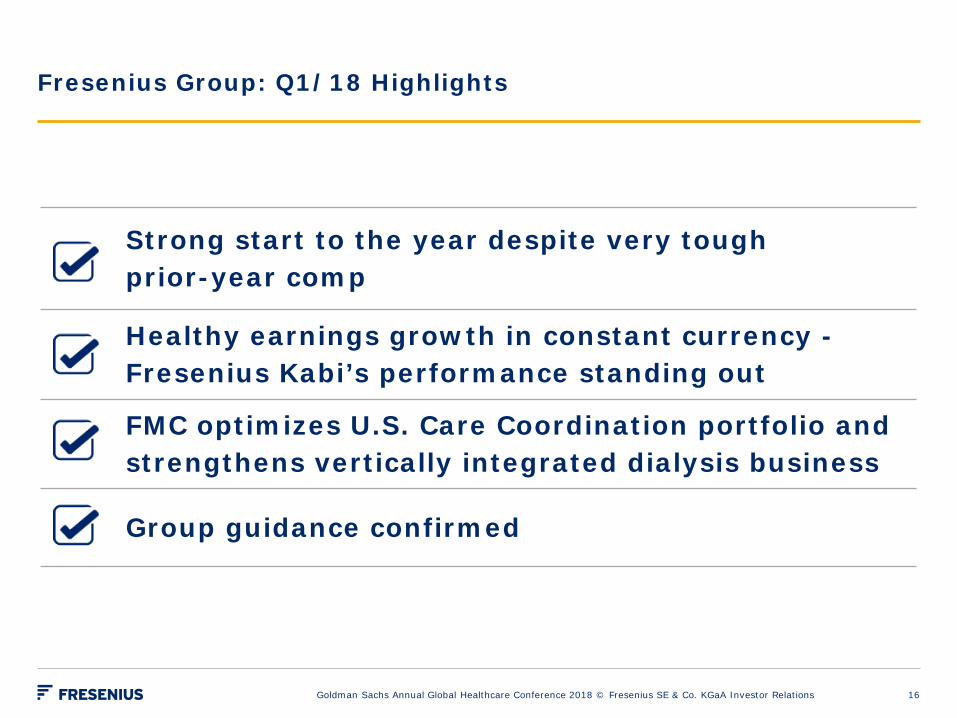
Strong start to the year despite very tough prior-year comp
Healthy earnings growth in constant currency - Fresenius Kabi’s performance standing out
FMC optimizes U.S. Care Coordination portfolio and strengthens vertically integrated dialysis business
Group guidance confirmed
Goldman Sachs Annual Global Healthcare Conference 2018 © Fresenius SE & Co. KGaA Investor Relations 16
Fresenius Group: Current Topics (1/2)
Goldman Sachs Annual Global Healthcare Conference 2018 © Fresenius SE & Co. KGaA Investor Relations
• Fresenius terminated merger agreement with Akorn, due to Akorn’s failure to fulfill several closing conditions
• Akorn filed a lawsuit against Fresenius in Delaware, USA, for consummation of the merger agreement
• Fresenius filed a counterclaim on April 30, 2018 • Strategic rationale for expanding product offering
in North America was and remains valid
HES
• EU Commission (EC) suspended decision to withdraw HES from the market in Europe
• Several Member States raised concerns on draft decision of EC due to lack of full consideration of all medical & technical arguments
• The procedure has now been referred back to PRAC for further consideration
• Kabi’s FY/18 outlook still considers meaningful risk adjustment
17
Fresenius Group: Current Topics (2/2)
Goldman Sachs Annual Global Healthcare Conference 2018 © Fresenius SE & Co. KGaA Investor Relations
Biosimilars • Improving political environment:
− France aims to have 80% biosimilars penetration by 2022
− US: All biosimilars of reference product will now be eligible for pass-through status as part of the 340b program
Pricing Environment North America
• Strong Q1/18 financial performance of Fresenius Kabi NA
• Continued low single-digit price decline for base business in 2018
• Nothing ‘out of the ordinary’ in generic injectables market
Helios • Preparatory measures for minimum nursing
staff levels • Clustering and digitalization efficiencies will
have a more mid-term effect
18
Fresenius Group: Q1/18 Profit and Loss Statement
Goldman Sachs Annual Global Healthcare Conference 2018 © Fresenius SE & Co. KGaA Investor Relations
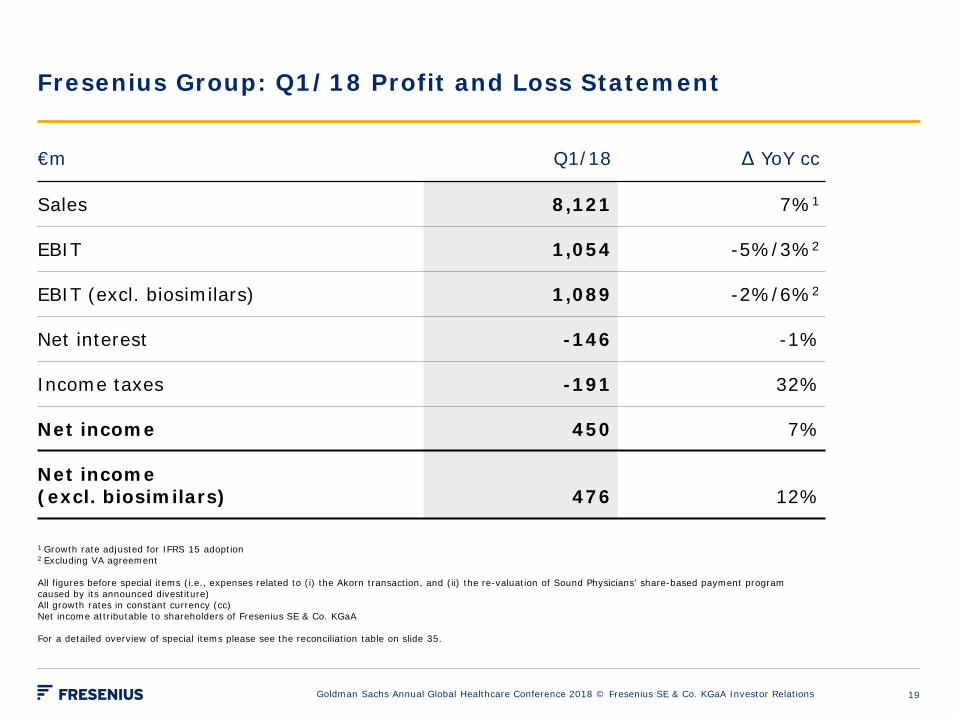
€m Q1/18 Δ YoY cc
Sales 8,121 7%1
EBIT 1,054 -5%/3%2
EBIT (excl. biosimilars) 1,089 -2%/6%2
Net interest -146 -1%
Income taxes -191 32%
Net income 450 7%
Net income (excl. biosimilars) 476 12%
1 Growth rate adjusted for IFRS 15 adoption 2 Excluding VA agreement All figures before special items (i.e., expenses related to (i) the Akorn transaction, and (ii) the re-valuation of Sound Physicians’ share-based payment program caused by its announced divestiture) All growth rates in constant currency (cc) Net income attributable to shareholders of Fresenius SE & Co. KGaA For a detailed overview of special items please see the reconciliation table on slide 35.
19
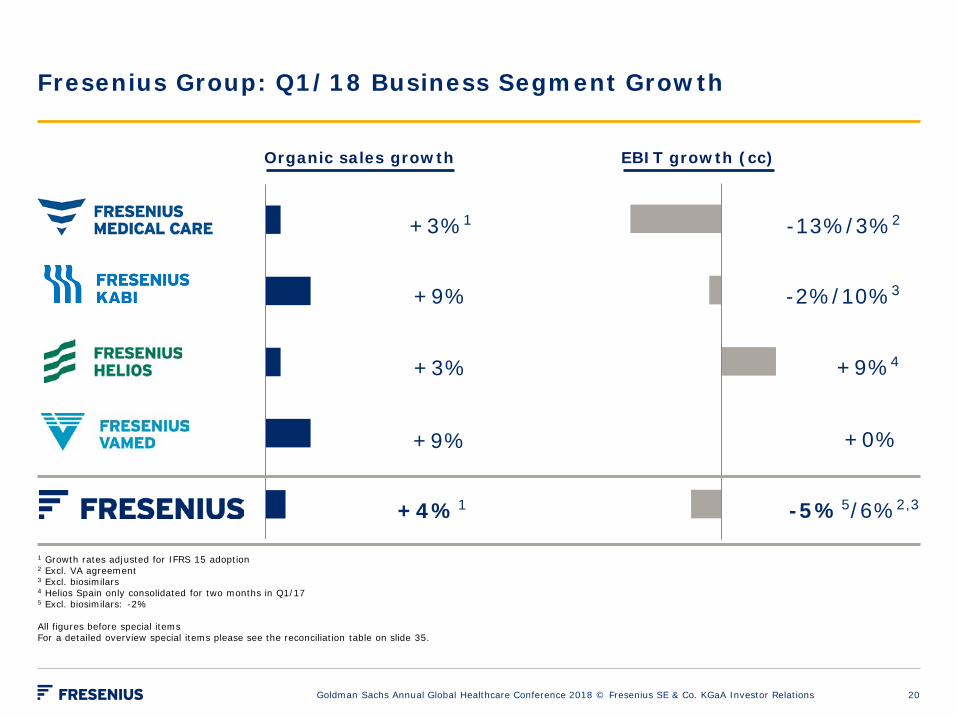
Fresenius Group: Q1/18 Business Segment Growth
Organic sales growth
Goldman Sachs Annual Global Healthcare Conference 2018 © Fresenius SE & Co. KGaA Investor Relations
EBIT growth (cc)
+3%1
+9%
+3%
+9%
-13%/3%2
-2%/10%3
+9%4
+0%
+4%1 -5%5/6%2,3
1 Growth rates adjusted for IFRS 15 adoption 2 Excl. VA agreement 3 Excl. biosimilars 4 Helios Spain only consolidated for two months in Q1/17 5 Excl. biosimilars: -2% All figures before special items For a detailed overview special items please see the reconciliation table on slide 35.
20
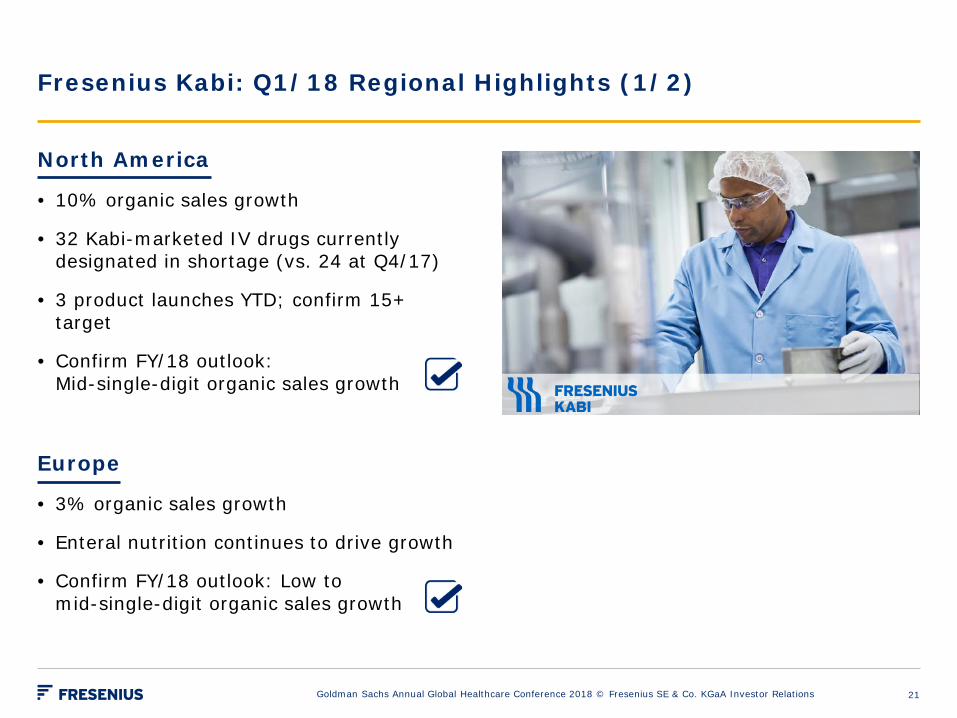
Fresenius Kabi: Q1/18 Regional Highlights (1/2)
Goldman Sachs Annual Global Healthcare Conference 2018 © Fresenius SE & Co. KGaA Investor Relations
North America
• 10% organic sales growth
• 32 Kabi-marketed IV drugs currently designated in shortage (vs. 24 at Q4/17)
• 3 product launches YTD; confirm 15+ target
• Confirm FY/18 outlook: Mid-single-digit organic sales growth
Europe
• 3% organic sales growth
• Enteral nutrition continues to drive growth
• Confirm FY/18 outlook: Low to mid-single-digit organic sales growth
21
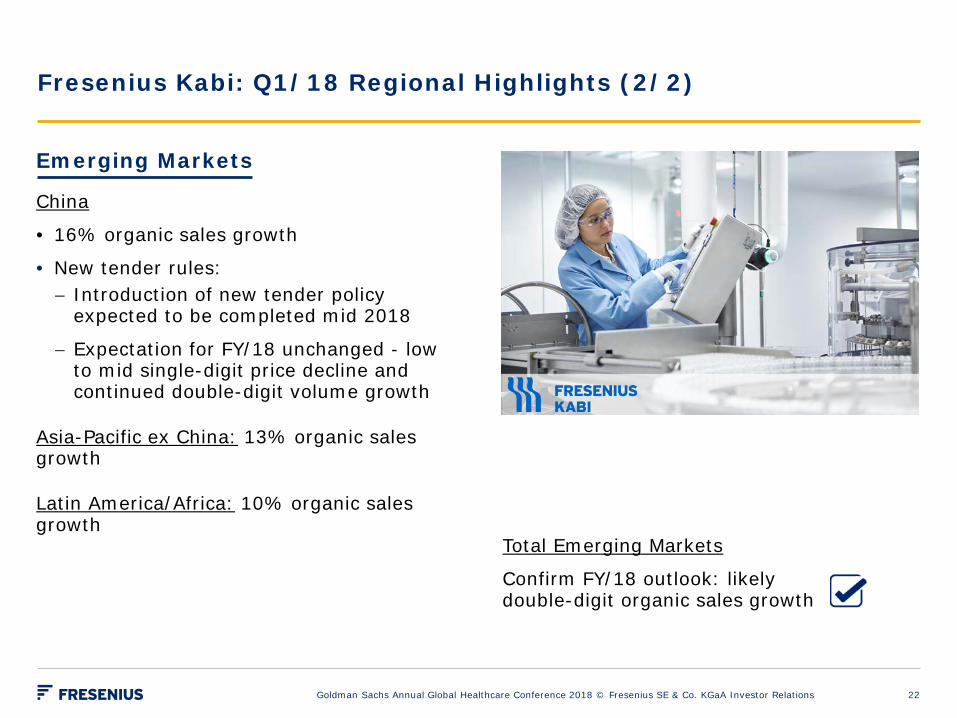
Fresenius Kabi: Q1/18 Regional Highlights (2/2)
Emerging Markets
China
• 16% organic sales growth
• New tender rules: − Introduction of new tender policy
expected to be completed mid 2018
− Expectation for FY/18 unchanged - low to mid single-digit price decline and continued double-digit volume growth
Asia-Pacific ex China: 13% organic sales growth
Latin America/Africa: 10% organic sales growth
Total Emerging Markets
Confirm FY/18 outlook: likely double-digit organic sales growth
Goldman Sachs Annual Global Healthcare Conference 2018 © Fresenius SE & Co. KGaA Investor Relations 22
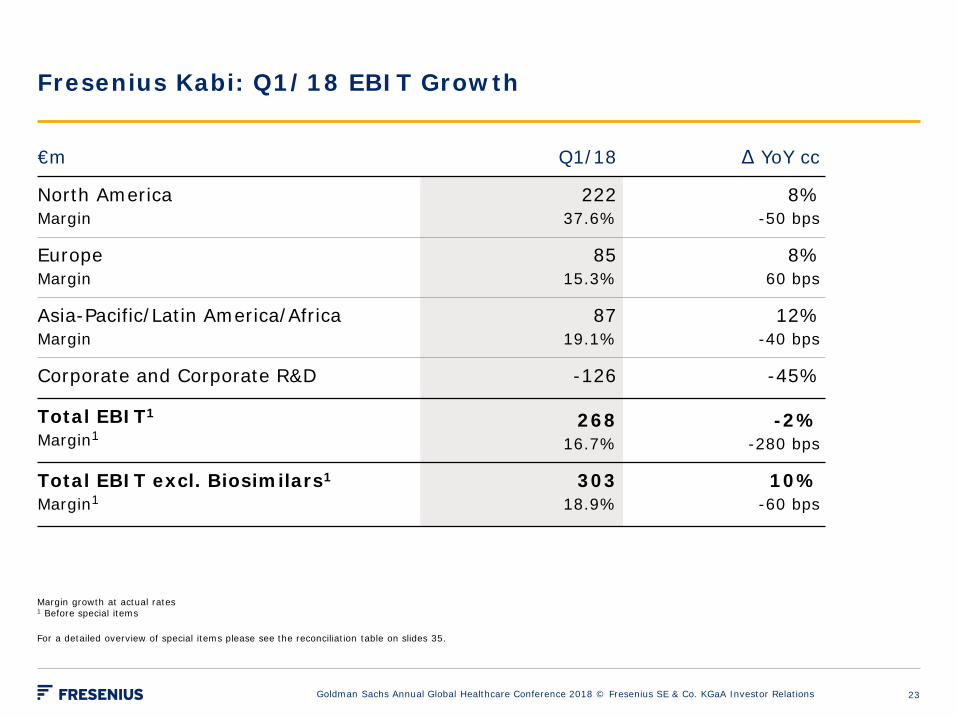
Fresenius Kabi: Q1/18 EBIT Growth
Goldman Sachs Annual Global Healthcare Conference 2018 © Fresenius SE & Co. KGaA Investor Relations
€m Q1/18 Δ YoY cc
North America Margin
222 37.6%
8% -50 bps
Europe Margin
85 15.3%
8% 60 bps
Asia-Pacific/Latin America/Africa Margin
87 19.1%
12% -40 bps
Corporate and Corporate R&D -126 -45%
Total EBIT1 Margin1
268 16.7%
-2% -280 bps
Total EBIT excl. Biosimilars1
Margin1 303
18.9% 10%
-60 bps
Margin growth at actual rates 1 Before special items For a detailed overview of special items please see the reconciliation table on slides 35.
23
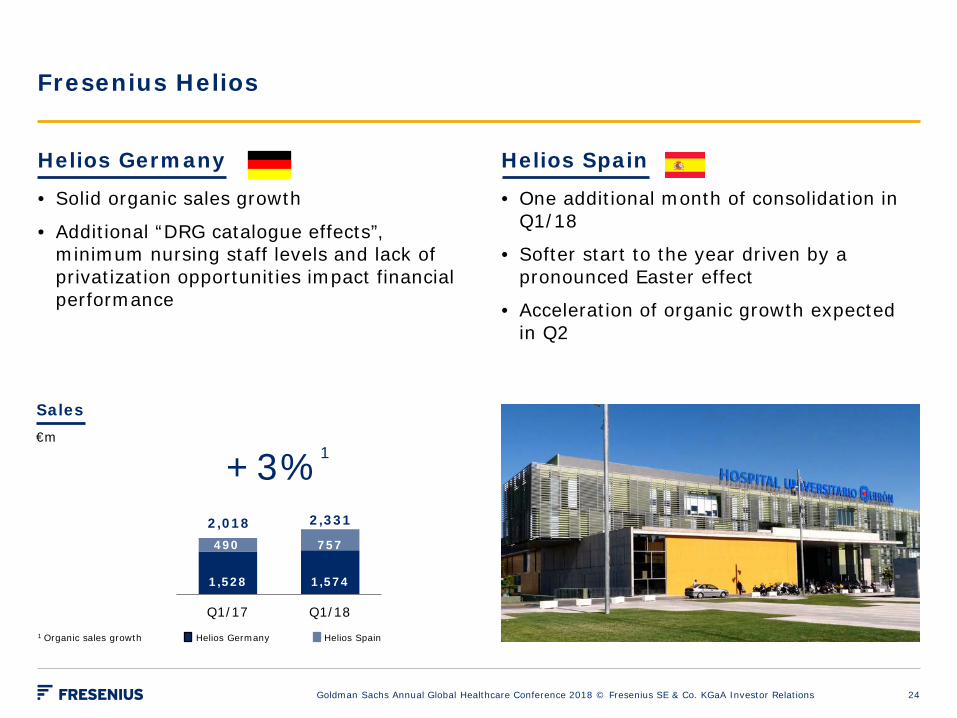
1,528
1,574
490 757
Q1/17 Q1/181 Organic sales growth
+3%1
2,331
Helios Germany Helios Spain
Fresenius Helios
Helios Germany
• Solid organic sales growth
• Additional “DRG catalogue effects”, minimum nursing staff levels and lack of privatization opportunities impact financial performance
Helios Spain
• One additional month of consolidation in Q1/18
• Softer start to the year driven by a pronounced Easter effect
• Acceleration of organic growth expected in Q2
Sales
€m
Goldman Sachs Annual Global Healthcare Conference 2018 © Fresenius SE & Co. KGaA Investor Relations
2,018
24
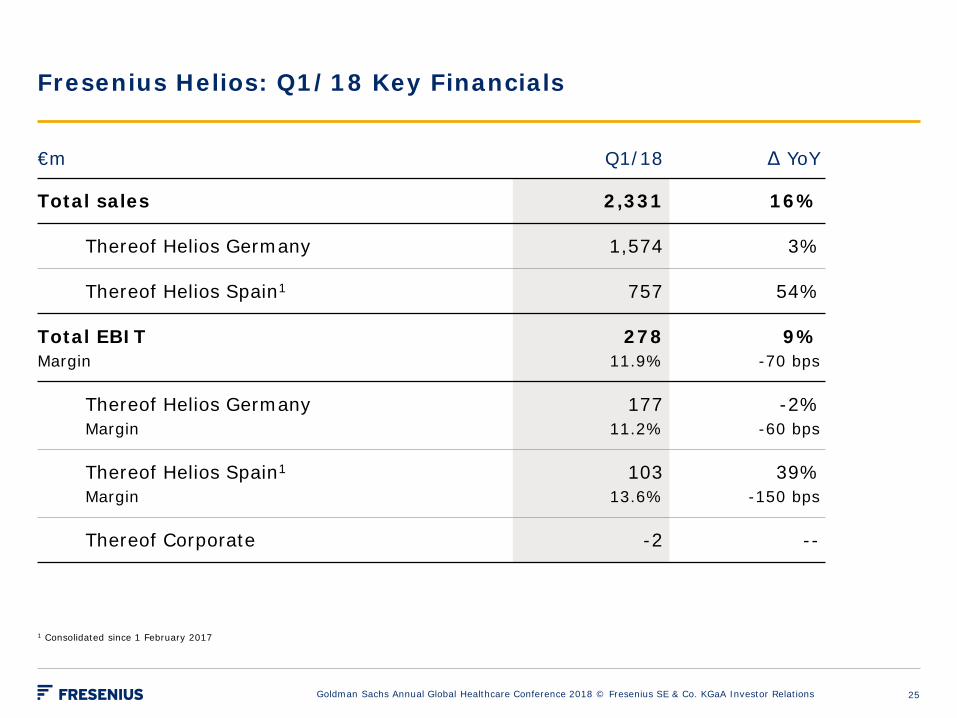
Fresenius Helios: Q1/18 Key Financials
Goldman Sachs Annual Global Healthcare Conference 2018 © Fresenius SE & Co. KGaA Investor Relations
€m Q1/18 Δ YoY
Total sales 2,331 16%
Thereof Helios Germany 1,574 3%
Thereof Helios Spain1 757 54%
Total EBIT Margin
278 11.9%
9% -70 bps
Thereof Helios Germany Margin
177 11.2%
-2% -60 bps
Thereof Helios Spain1 Margin
103 13.6%
39% -150 bps
Thereof Corporate -2 --
1 Consolidated since 1 February 2017
25
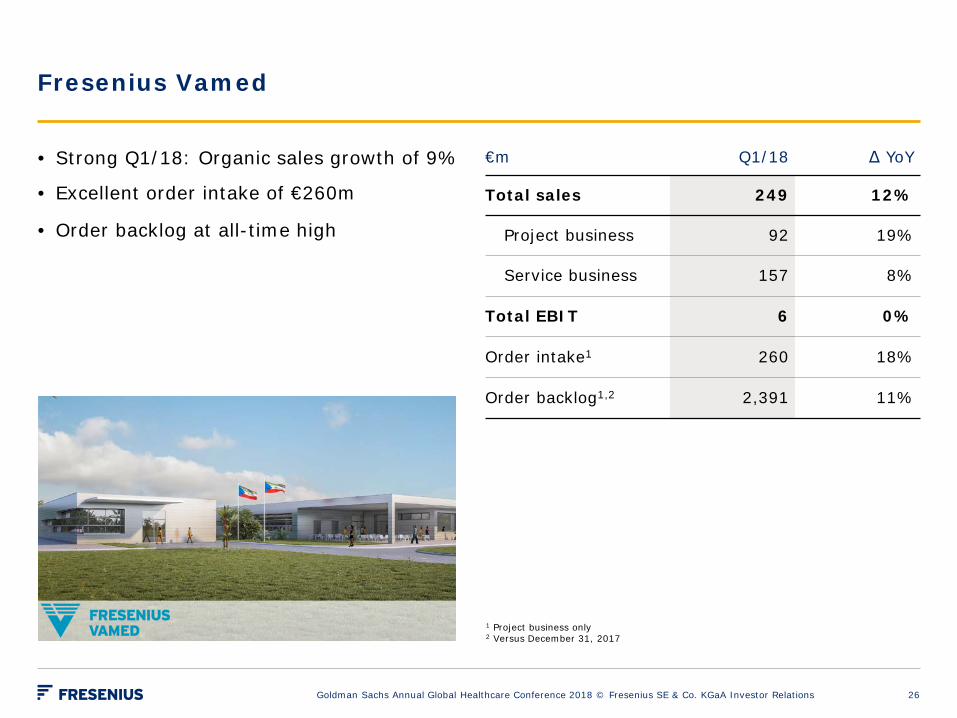
Fresenius Vamed
1 Project business only 2 Versus December 31, 2017
• Strong Q1/18: Organic sales growth of 9%
• Excellent order intake of €260m
• Order backlog at all-time high
€m Q1/18 Δ YoY
Total sales 249 12%
Project business 92 19%
Service business 157 8%
Total EBIT 6 0%
Order intake1 260 18%
Order backlog1,2 2,391 11%
Goldman Sachs Annual Global Healthcare Conference 2018 © Fresenius SE & Co. KGaA Investor Relations 26
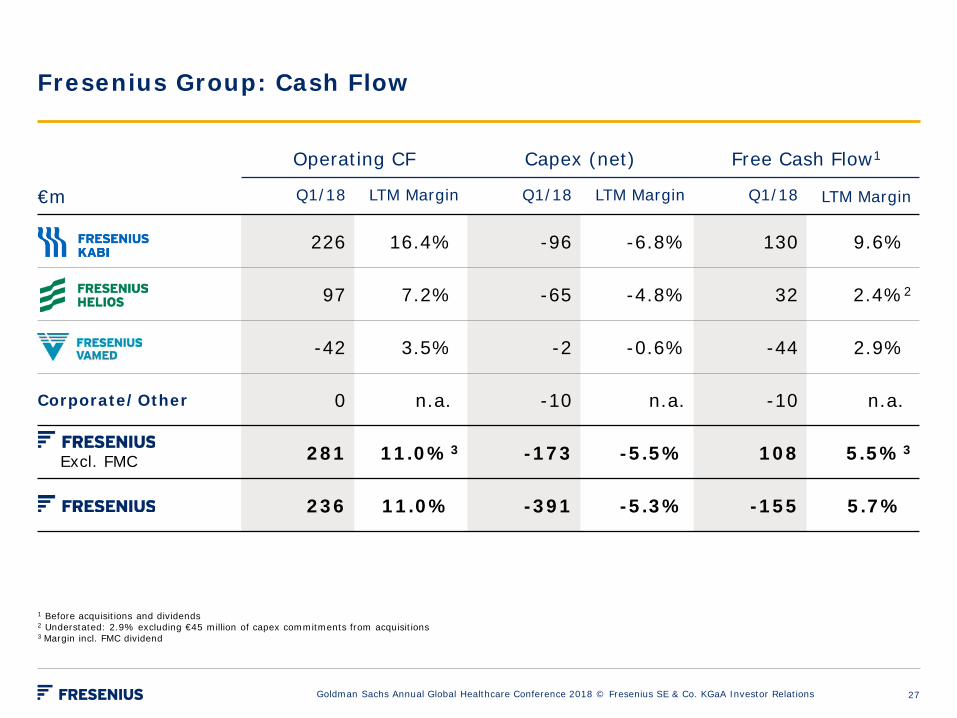
Fresenius Group: Cash Flow
Goldman Sachs Annual Global Healthcare Conference 2018 © Fresenius SE & Co. KGaA Investor Relations
Operating CF Capex (net) Free Cash Flow1
€m Q1/18 LTM Margin Q1/18 LTM Margin Q1/18 LTM Margin
226 16.4% -96 -6.8% 130 9.6%
97 7.2% -65 -4.8% 32 2.4%2
-42 3.5% -2 -0.6% -44 2.9%
Corporate/Other 0 n.a. -10 n.a. -10 n.a.
281 11.0%3 -173 -5.5% 108 5.5%3
236 11.0% -391 -5.3% -155 5.7%
1 Before acquisitions and dividends 2 Understated: 2.9% excluding €45 million of capex commitments from acquisitions 3 Margin incl. FMC dividend
Excl. FMC
27
Attachments
Goldman Sachs Annual Global Healthcare Conference 2018 © Fresenius SE & Co. KGaA Investor Relations 28
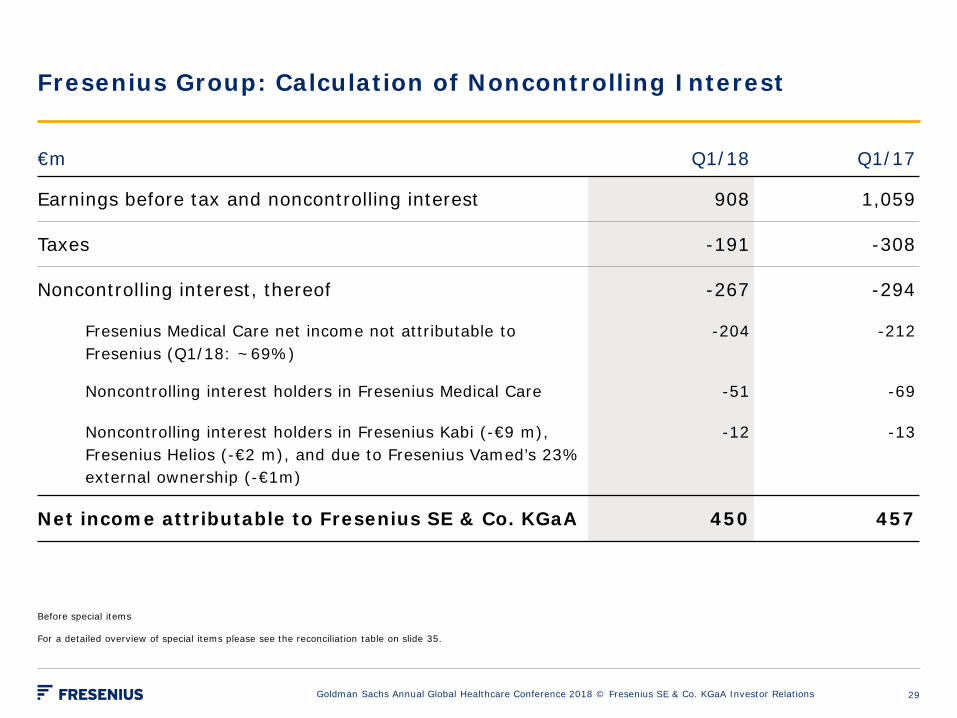
Fresenius Group: Calculation of Noncontrolling Interest
Goldman Sachs Annual Global Healthcare Conference 2018 © Fresenius SE & Co. KGaA Investor Relations
€m Q1/18 Q1/17
Earnings before tax and noncontrolling interest 908 1,059
Taxes -191 -308
Noncontrolling interest, thereof -267 -294
Fresenius Medical Care net income not attributable to Fresenius (Q1/18: ~69%)
-204 -212
Noncontrolling interest holders in Fresenius Medical Care -51 -69
Noncontrolling interest holders in Fresenius Kabi (-€9 m), Fresenius Helios (-€2 m), and due to Fresenius Vamed’s 23% external ownership (-€1m)
-12 -13
Net income attributable to Fresenius SE & Co. KGaA 450 457
Before special items For a detailed overview of special items please see the reconciliation table on slide 35.
29
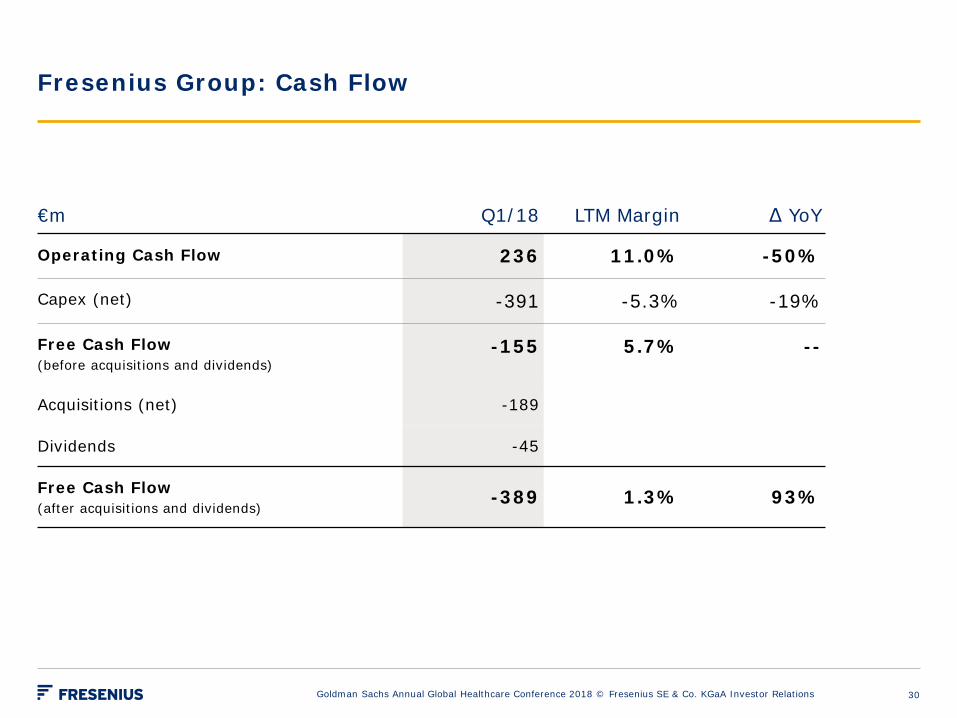
Fresenius Group: Cash Flow
Goldman Sachs Annual Global Healthcare Conference 2018 © Fresenius SE & Co. KGaA Investor Relations
€m Q1/18 LTM Margin Δ YoY
Operating Cash Flow 236 11.0% -50%
Capex (net) -391 -5.3% -19%
Free Cash Flow (before acquisitions and dividends)
-155 5.7% --
Acquisitions (net) -189
Dividends -45
Free Cash Flow (after acquisitions and dividends)
-389 1.3% 93%
30

Before special items; pro forma closed acquisitions At LTM average FX rates for both EBITDA and net debt
1 Pro forma excluding advances made for the acquisition of hospitals from Rhön-Klinikum AG 2 Calculated at expected annual average exchange rates, for both net debt and EBITDA; excluding effects of the Akorn, NxStage and Sound Physicians transactions; excluding further
potential acquisitions; at current IFRS rules 3 Excluding Akorn, NxStage and Sound Physicians transactions
3.44
3.02
2.59 2.67
2.55 2.53
3.23
3.38 3.30
3.22
3.07 3.03
2.85
2.65 2.65 2.59
2.48
2.33
2.98
3.00 2.97
2.84
2.98
2.00
2.50
3.00
3.50
4.00
2008 2009 2010 2011 2012 2013 Q1 Q2 Q3 Q4 Q1 Q2 Q3 Q4 Q1 Q2 Q3 Q4 Q1 Q2 Q3 Q4 Q1
Fresenius Group: Leverage Ratio
Goldman Sachs Annual Global Healthcare Conference 2018 © Fresenius SE & Co. KGaA Investor Relations
Net Debt/EBITDA target 2018
Further deleveraging expected
1
4.0
3.5
3.0
2.5
2
2014 2015 2016 2017 2018
3
31
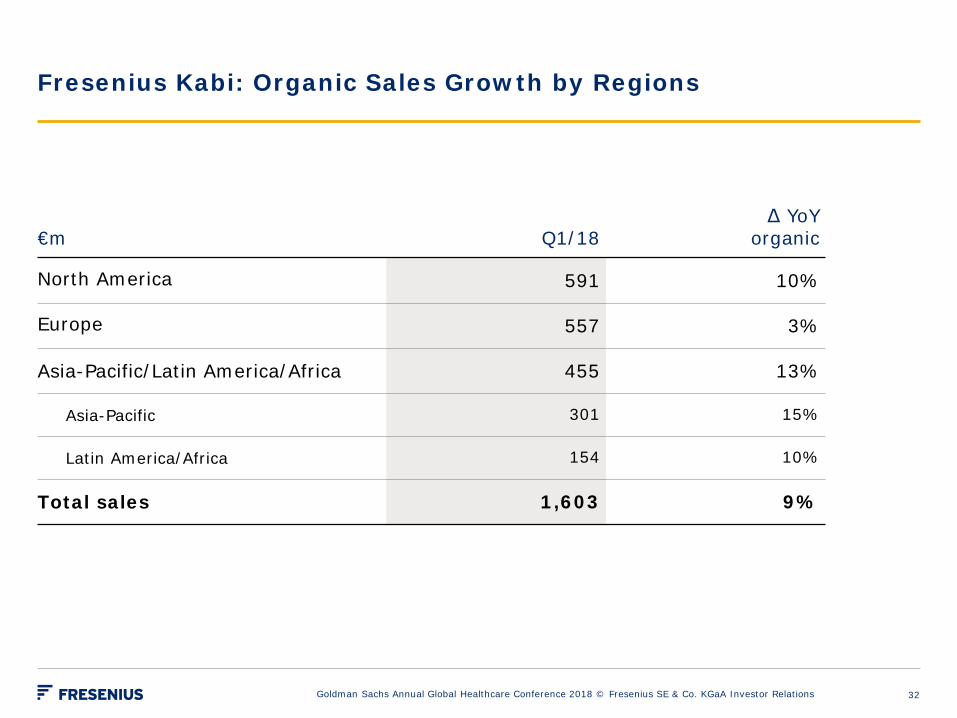
Fresenius Kabi: Organic Sales Growth by Regions
Goldman Sachs Annual Global Healthcare Conference 2018 © Fresenius SE & Co. KGaA Investor Relations
€m Q1/18 Δ YoY
organic
North America 591 10%
Europe 557 3%
Asia-Pacific/Latin America/Africa 455 13%
Asia-Pacific 301 15%
Latin America/Africa 154 10%
Total sales 1,603 9%
32
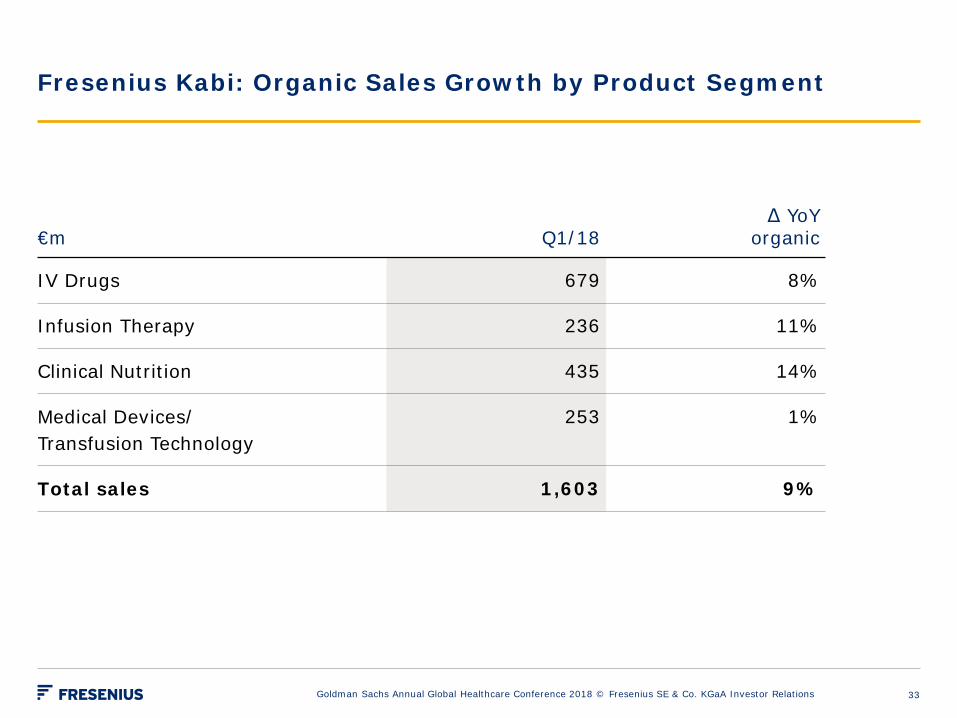
Fresenius Kabi: Organic Sales Growth by Product Segment
Goldman Sachs Annual Global Healthcare Conference 2018 © Fresenius SE & Co. KGaA Investor Relations
€m Q1/18 Δ YoY
organic
IV Drugs 679 8%
Infusion Therapy 236 11%
Clinical Nutrition 435 14%
Medical Devices/ Transfusion Technology
253 1%
Total sales 1,603 9%
33
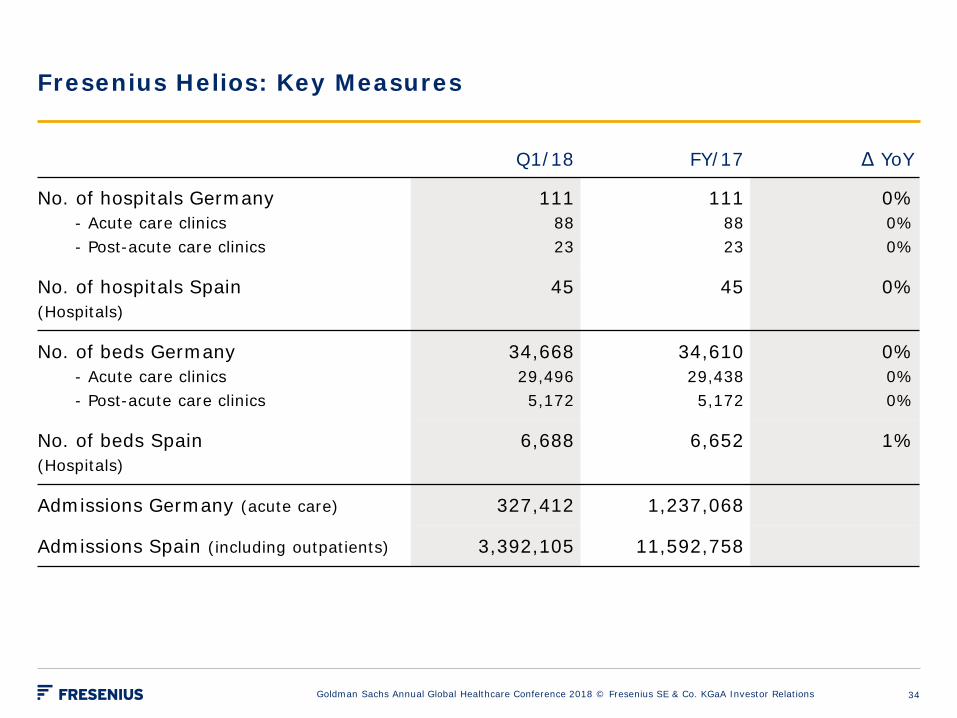
Fresenius Helios: Key Measures
Goldman Sachs Annual Global Healthcare Conference 2018 © Fresenius SE & Co. KGaA Investor Relations
Q1/18 FY/17 Δ YoY
No. of hospitals Germany
- Acute care clinics - Post-acute care clinics
111 88 23
111 88 23
0% 0% 0%
No. of hospitals Spain (Hospitals)
45 45 0%
No. of beds Germany - Acute care clinics - Post-acute care clinics
34,668 29,496 5,172
34,610 29,438 5,172
0% 0% 0%
No. of beds Spain (Hospitals)
6,688
6,652 1%
Admissions Germany (acute care) 327,412 1,237,068
Admissions Spain (including outpatients) 3,392,105 11,592,758
34
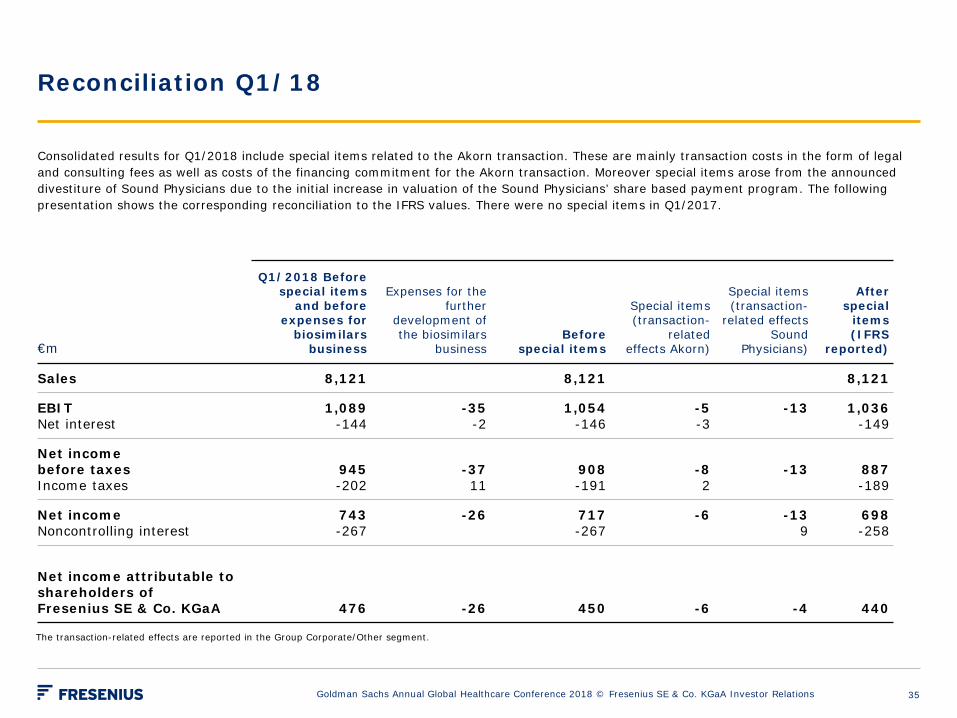
Reconciliation Q1/18
Goldman Sachs Annual Global Healthcare Conference 2018 © Fresenius SE & Co. KGaA Investor Relations
Consolidated results for Q1/2018 include special items related to the Akorn transaction. These are mainly transaction costs in the form of legal and consulting fees as well as costs of the financing commitment for the Akorn transaction. Moreover special items arose from the announced divestiture of Sound Physicians due to the initial increase in valuation of the Sound Physicians’ share based payment program. The following presentation shows the corresponding reconciliation to the IFRS values. There were no special items in Q1/2017.
€m
Q1/2018 Before special items
and before expenses for
biosimilars business
Expenses for the further
development of the biosimilars
business Before
special items
Special items (transaction-
related effects Akorn)
Special items (transaction-
related effects Sound
Physicians)
After special
items (IFRS
reported)
Sales 8,121 8,121 8,121
EBIT Net interest
1,089 -144
-35 -2
1,054 -146
-5 -3
-13
1,036 -149
Net income before taxes Income taxes
945 -202
-37 11
908 -191
-8 2
-13
887 -189
Net income Noncontrolling interest
743 -267
-26
717 -267
-6
-13 9
698 -258
Net income attributable to shareholders of Fresenius SE & Co. KGaA
476 -26
450
-6
-4
440
The transaction-related effects are reported in the Group Corporate/Other segment.
35
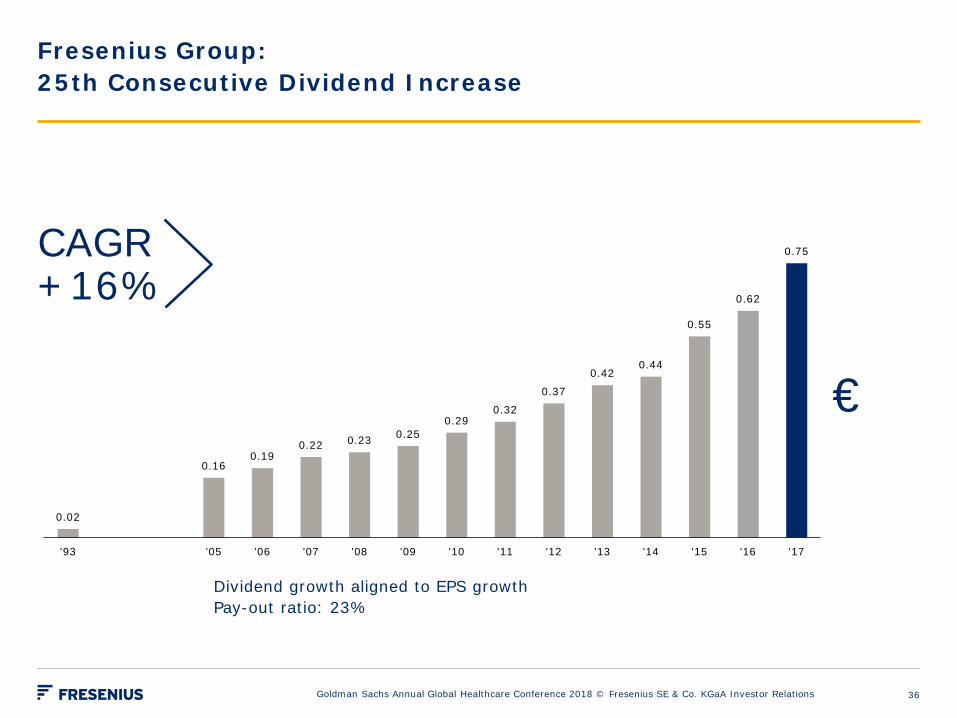
Fresenius Group: 25th Consecutive Dividend Increase
Goldman Sachs Annual Global Healthcare Conference 2018 © Fresenius SE & Co. KGaA Investor Relations
Dividend growth aligned to EPS growth Pay-out ratio: 23%
0.02
0.16 0.19
0.22 0.23 0.25 0.29
0.32
0.37
0.42 0.44
0.55
0.62
0.75
'93 '05 '06 '07 '08 '09 '10 '11 '12 '13 '14 '15 '16 '17
CAGR +16%
€
36
Financial Calendar / Contact
Financial Calendar 31 July 2018 Results Q2/2018
30 October 2018 Results Q3/2018
Please note that these dates could be subject to change.
Contact Investor Relations Fresenius SE & Co. KGaA phone: +49 6172 608-2485 e-mail: [email protected] For further information and current news: www.fresenius.com Follow us on Twitter www.twitter.com/fresenius_ir and LinkedIn: www.linkedin.com/company/fresenius-investor-relations
Goldman Sachs Annual Global Healthcare Conference 2018 © Fresenius SE & Co. KGaA Investor Relations 37