goldman sachs global energy conference … · goldman sachs . global energy conference 2018 ....
TRANSCRIPT

CRZO
GOLDMAN SACHS GLOBAL ENERGY CONFERENCE 2018 Carrizo Oil & Gas January 9-10, 2018
CRZO 2 2 2
Forward Looking Statements / Note Regarding Reserves This presentation contains statements concerning the Company’s intentions, expectations, beliefs, projections, assessments of risks, estimations, plans or predictions for the future,
objectives, goals, strategies, future events or performance and underlying assumptions and other statements that are not historical facts. These statements are “forward-looking statements” within the meaning of the Private Securities Litigation Reform Act of 1995. The forward-looking statements in this presentation include, but are not limited to, statements relating to the Company’s business and financial outlook, cost and risk profile of oil and gas exploration and development activities, quality and risk profile of Company’s assets, liquidity and the ability to finance exploration and development activities, including accessibility of borrowings under the Company’s revolving credit facility, commodity price risk management activities and the impact of our average realized prices, growth strategies, ability to explore for and develop oil and gas resources successfully and economically, estimates and forecasts of the timing, number, profitability and other results of wells we expect to drill and other exploration activities, drilling inventory, downspacing, infill drilling and completion optimization results, estimates regarding timing and levels of production or reserves, estimated ultimate recovery, the Company’s capital expenditure plan and allocation by area, cost reductions and savings, efficiency of capital, the price of oil and gas at which projects break-even, future market conditions in the oil and gas industry, ability to make, integrate and develop acquisitions and realize any expected benefits or effects of completed acquisitions, midstream arrangements and agreements, gas marketing strategy, lease terms, expected working or net revenue interests, the ability to adhere to our drilling schedule, acquisition of acreage, including number, timing and size of projects, planned evaluation of prospects, probability of prospects having oil and gas, working capital requirements, liquids weighting, rates of return, net present value, 20167exploration and development plans, any other statements regarding future operations, financial results, business plans and cash needs and all other statements that are not historical facts. Statements in this presentation regarding availability under our revolving credit facility are based solely on the current borrowing base commitment amount and amounts outstanding on such date. The amounts we are able to borrow under the revolving credit facility are subject to, and may be less due to, compliance with financial covenants and other provisions of the credit agreement governing our revolving credit facility.
You generally can identify forward-looking statements by the words “anticipate,” “believe,” budgeted,” “continue,” “could,” “estimate,” “expect,” “forecast,” “goal,” “intend,” “may,” “objective,” “plan,” “potential,” “predict,” “projection,” “scheduled,” “should,” or other similar words. Such statements rely on assumptions and involve risks and uncertainties, many of which are beyond our control, including, but not limited to, those relating to a worldwide economic downturn, availability of financing, the Company’s dependence on its exploratory drilling activities, the volatility of and changes in oil and gas prices, the need to replace reserves depleted by production, operating risks of oil and gas operations, the Company’s dependence on key personnel, factors that affect the Company’s ability to manage its growth and achieve its business strategy, results, delays and uncertainties that may be encountered in drilling, development or production, interpretations and impact of oil and gas reserve estimation and disclosure requirements, activities and approvals of our partners and parties with whom we have alliances, technological changes, capital requirements, the timing and amount of borrowing base determinations (including determinations by lenders) and availability under our revolving credit facility, evaluations of us by lenders under our revolving credit facility, other actions by lenders, the potential impact of government regulations, including current and proposed legislation and regulations related to hydraulic fracturing, oil and natural gas drilling, air emissions and climate change, regulatory determinations, litigation, competition, the uncertainty of reserve information and future net revenue estimates, acquisition risks, availability of equipment and crews, actions by midstream and other industry participants, weather, our ability to obtain permits and licenses, the results of audits and assessments, the failure to obtain certain bank and lease consents, the existence and resolution of title defects, new taxes and impact fees, delays, costs and difficulties relating to our joint ventures, actions by joint venture parties, results of exploration activities, the availability and completion of land acquisitions, cost of oilfield services and equipment, completion and connection of wells, and other factors detailed in the “Risk Factors” and other sections of the Company’s Annual Report on Form 10-K for the year ended December 31, 2016 and other filings with the Securities and Exchange Commission (“SEC”). Should one or more of these risks or uncertainties materialize, or should underlying assumptions prove incorrect, actual outcomes may vary materially from those indicated.
Each forward-looking statement speaks only as of the date of the particular statement or, if not stated, the date printed on the cover of the presentation. When used in this presentation, the word “current” and similar expressions refer to the date printed on the cover of the presentation. Each forward-looking statement is expressly qualified by this cautionary statement and the Company undertakes no obligation to update or revise any forward-looking statement, whether as a result of new information, future events or otherwise. All subsequent written and oral forward-looking statements attributable to us or persons acting on our behalf are expressly qualified in their entirety by reference to these risks and uncertainties. You should not place undue reliance on forward-looking statements. The information contained in this presentation does not purport to be all-inclusive or to contain all information that potential investors may require.
We may use certain terms such as “Resource Potential” that the SEC’s guidelines strictly prohibit us from including in filings with the SEC. Our Probable (2P) and Possible (3P) reserves do not meet SEC rules and guidelines (including those relating to pricing) for such reserves. These terms include reserves with substantially less certainty, and no discount or other adjustment is included in the presentation of such reserve numbers. U.S. investors are urged to consider closely the disclosure in our Form 10-K for the year ended December 31, 2016, File No. 000-29187-87, and in our other filings with the SEC, available from us at 500 Dallas, Suite 2300, Houston, Texas, 77002. These forms can also be obtained from the SEC by calling 1-800-SEC-0330.
CRZO 3 3 3
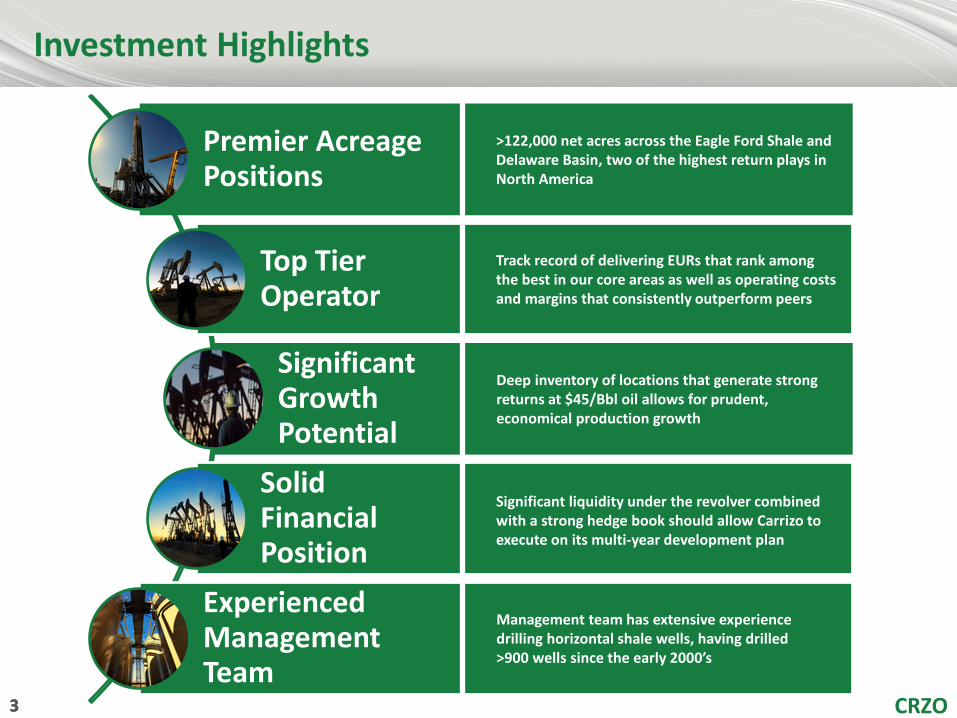
Investment Highlights
Premier Acreage Positions
Top Tier Operator
Significant Growth Potential
Solid Financial Position
Experienced Management Team
>122,000 net acres across the Eagle Ford Shale and Delaware Basin, two of the highest return plays in North America
Track record of delivering EURs that rank among the best in our core areas as well as operating costs and margins that consistently outperform peers
Deep inventory of locations that generate strong returns at $45/Bbl oil allows for prudent, economical production growth
Significant liquidity under the revolver combined with a strong hedge book should allow Carrizo to execute on its multi-year development plan
Management team has extensive experience drilling horizontal shale wells, having drilled >900 wells since the early 2000’s
CRZO 4 4 4
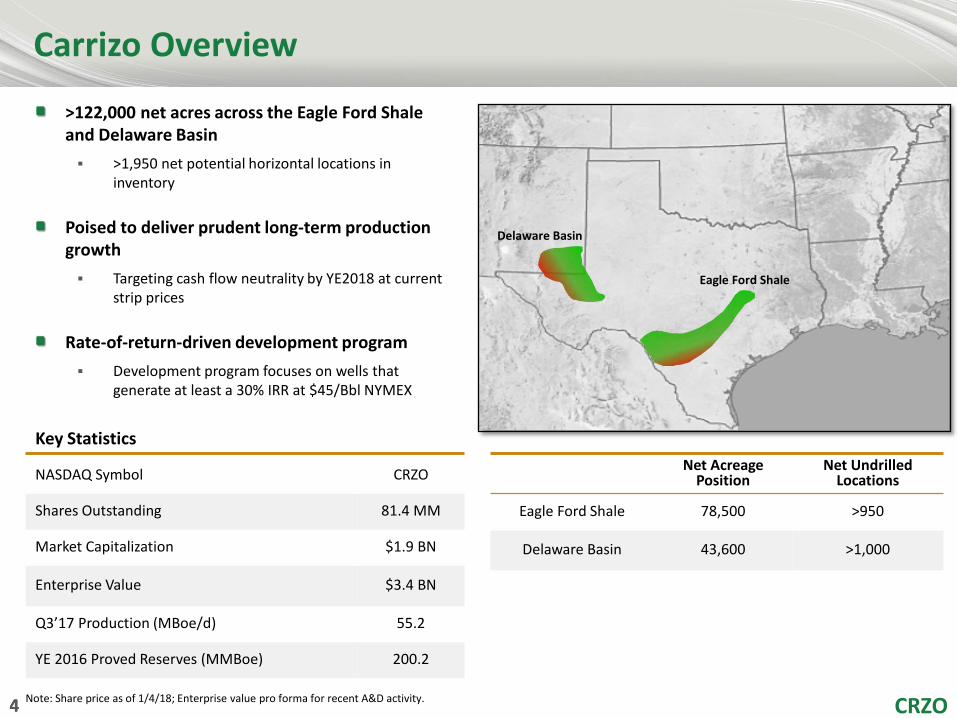
Carrizo Overview
>122,000 net acres across the Eagle Ford Shale and Delaware Basin >1,950 net potential horizontal locations in
inventory
Poised to deliver prudent long-term production growth Targeting cash flow neutrality by YE2018 at current
strip prices
Rate-of-return-driven development program Development program focuses on wells that
generate at least a 30% IRR at $45/Bbl NYMEX
Delaware Basin
Eagle Ford Shale
Note: Share price as of 1/4/18; Enterprise value pro forma for recent A&D activity.
Net Acreage Position
Net Undrilled Locations
Eagle Ford Shale 78,500 >950
Delaware Basin 43,600 >1,000
NASDAQ Symbol CRZO
Shares Outstanding 81.4 MM
Market Capitalization $1.9 BN
Enterprise Value $3.4 BN
Q3’17 Production (MBoe/d) 55.2
YE 2016 Proved Reserves (MMBoe) 200.2
Key Statistics
CRZO 5 5 5
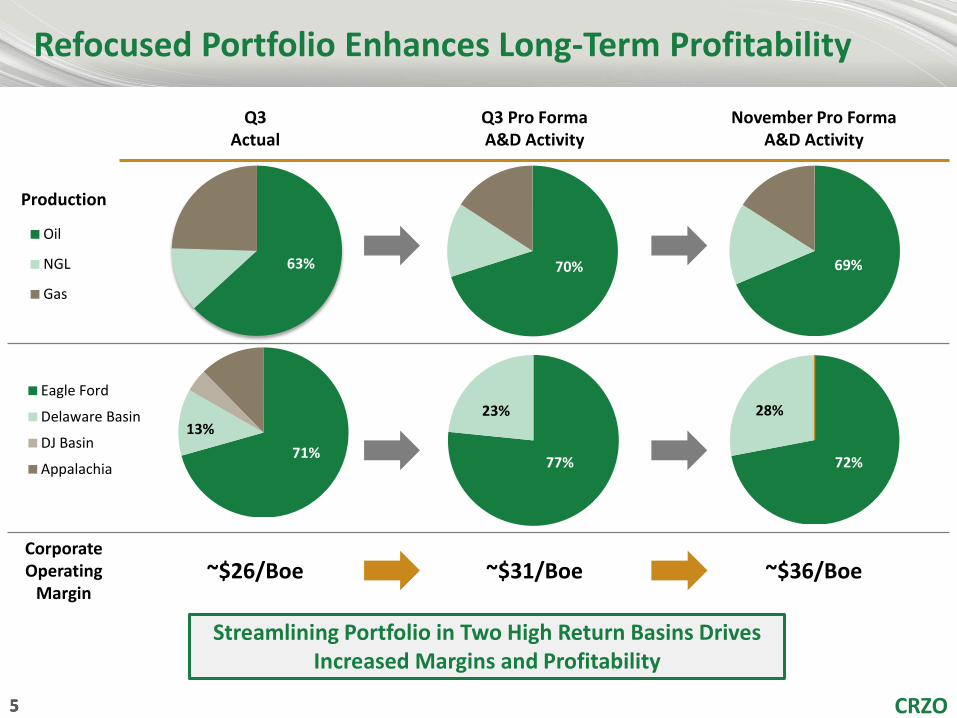
Q3 Actual
Q3 Pro Forma A&D Activity
November Pro Forma A&D Activity
Production
Corporate Operating
Margin ~$26/Boe ~$31/Boe ~$36/Boe
63%
Oil
NGL
Gas
Refocused Portfolio Enhances Long-Term Profitability
70% 69%
71% 13%
Eagle Ford
Delaware Basin
DJ Basin
Appalachia 77%
23%
72%
28%
Streamlining Portfolio in Two High Return Basins Drives Increased Margins and Profitability
CRZO 6 6 6
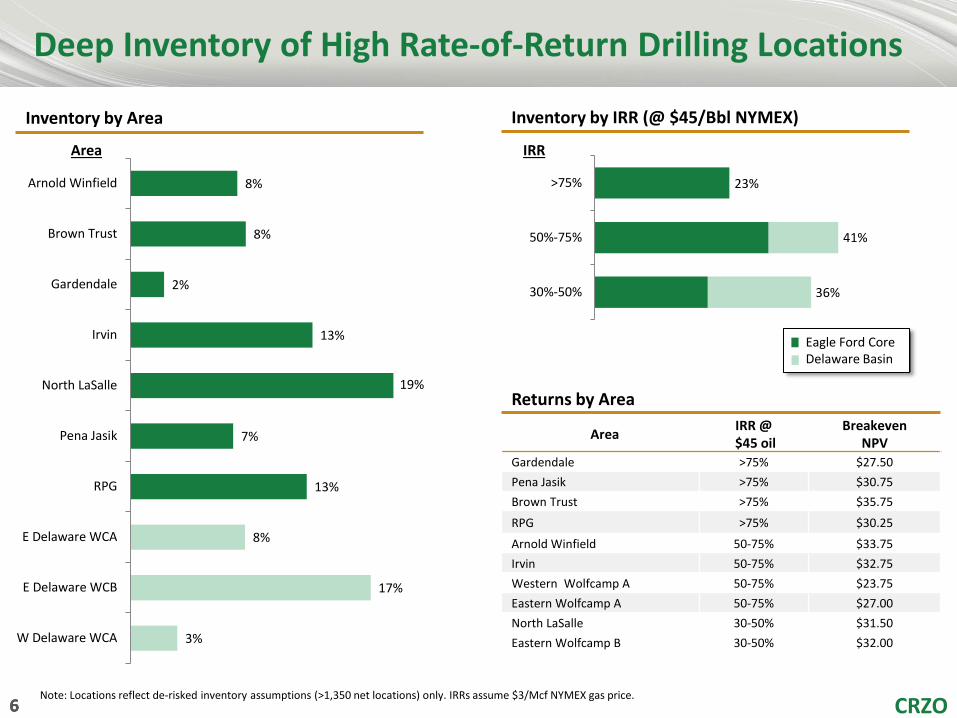
8%
8%
2%
13%
19%
7%
13%
8%
17%
3%
Arnold Winfield
Brown Trust
Gardendale
Irvin
North LaSalle
Pena Jasik
RPG
E Delaware WCA
E Delaware WCB
W Delaware WCA
>75%
50%-75%
30%-50%
Deep Inventory of High Rate-of-Return Drilling Locations
Note: Locations reflect de-risked inventory assumptions (>1,350 net locations) only. IRRs assume $3/Mcf NYMEX gas price.
IRR Area
Eagle Ford Core Delaware Basin
23%
41%
36%
Inventory by Area Inventory by IRR (@ $45/Bbl NYMEX)
Area IRR @ $45 oil
Breakeven NPV
Gardendale >75% $27.50 Pena Jasik >75% $30.75 Brown Trust >75% $35.75
RPG >75% $30.25
Arnold Winfield 50-75% $33.75 Irvin 50-75% $32.75 Western Wolfcamp A 50-75% $23.75 Eastern Wolfcamp A 50-75% $27.00 North LaSalle 30-50% $31.50 Eastern Wolfcamp B 30-50% $32.00
Returns by Area

CRZO 7 7 7
2017 Development Program
Eagle Ford D&C
Delaware Basin D&C
Other D&C
Pipeline & Infra.
Continued focus on high-return oily plays
2-3-rig development program in the Eagle Ford
4-5-rig development program in the Delaware Basin post ExL acquisition
Funded non-operated activity
Results in strong year-over-year production growth in 2017 and sets up for strong growth in future years
~90% Drilling &
Completion
Note: 2017 capital program estimates represent the midpoint of guidance range.
DC&I Capital Program Detail
Eagle Ford D&C $400
Delaware Basin D&C $115
Other D&C $25
Pipeline & Infrastructure $70
(All figures in $MM)
2017 DC&I Capital Program - $610 MM Program Highlights
CRZO 8 8 8
0
5
10
15
20
25
30
35
40
FY14 FY15 FY16 FY17E
Net
Dai
ly P
rod.
(MBo
e/d)
0
10
20
30
40
50
60
FY14 FY15 FY16 FY17E
Net
Dai
ly P
rod.
(MBo
e/d)
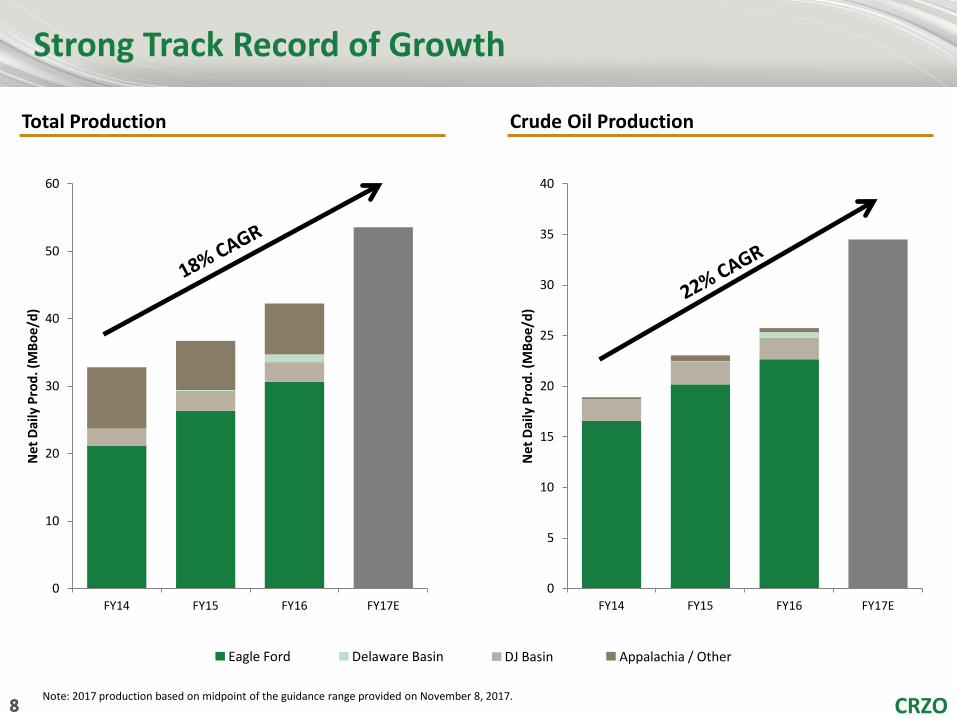
Strong Track Record of Growth
Appalachia / Other DJ Basin Delaware Basin Eagle Ford
Note: 2017 production based on midpoint of the guidance range provided on November 8, 2017.
Total Production Crude Oil Production
CRZO 9 9 9
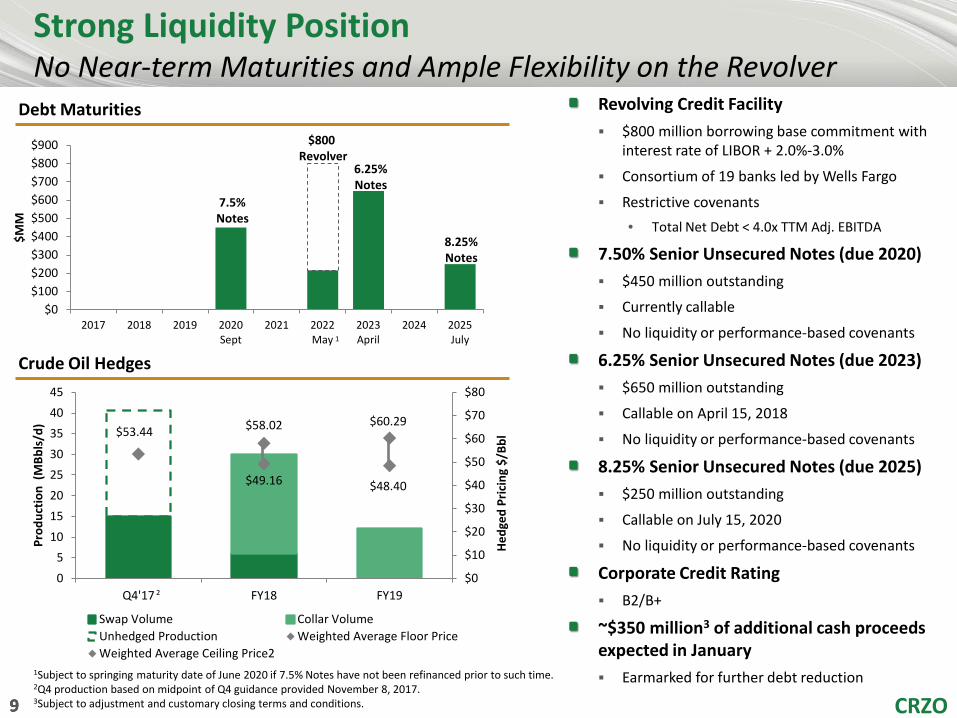
Strong Liquidity Position No Near-term Maturities and Ample Flexibility on the Revolver
$0$100$200$300$400$500$600$700$800$900
2017 2018 2019 2020Sept
2021 2022May
2023April
2024 2025July
$MM
7.5% Notes
6.25% Notes
$800 Revolver
$53.44
$49.16 $48.40
$58.02 $60.29
$0
$10
$20
$30
$40
$50
$60
$70
$80
05
1015202530354045
Q4'17 FY18 FY19
Hedg
ed P
ricin
g $/
Bbl
Prod
uctio
n (M
Bbls
/d)
Swap Volume Collar VolumeUnhedged Production Weighted Average Floor PriceWeighted Average Ceiling Price2
Revolving Credit Facility $800 million borrowing base commitment with
interest rate of LIBOR + 2.0%-3.0%
Consortium of 19 banks led by Wells Fargo
Restrictive covenants • Total Net Debt < 4.0x TTM Adj. EBITDA
7.50% Senior Unsecured Notes (due 2020) $450 million outstanding
Currently callable
No liquidity or performance-based covenants
6.25% Senior Unsecured Notes (due 2023) $650 million outstanding
Callable on April 15, 2018
No liquidity or performance-based covenants
8.25% Senior Unsecured Notes (due 2025) $250 million outstanding
Callable on July 15, 2020
No liquidity or performance-based covenants
Corporate Credit Rating B2/B+
~$350 million3 of additional cash proceeds expected in January Earmarked for further debt reduction
8.25% Notes
1Subject to springing maturity date of June 2020 if 7.5% Notes have not been refinanced prior to such time. 2Q4 production based on midpoint of Q4 guidance provided November 8, 2017. 3Subject to adjustment and customary closing terms and conditions.
Debt Maturities
Crude Oil Hedges 1
2
CRZO 10 CRZO 10 10 CRZO 10 10 CRZO 10
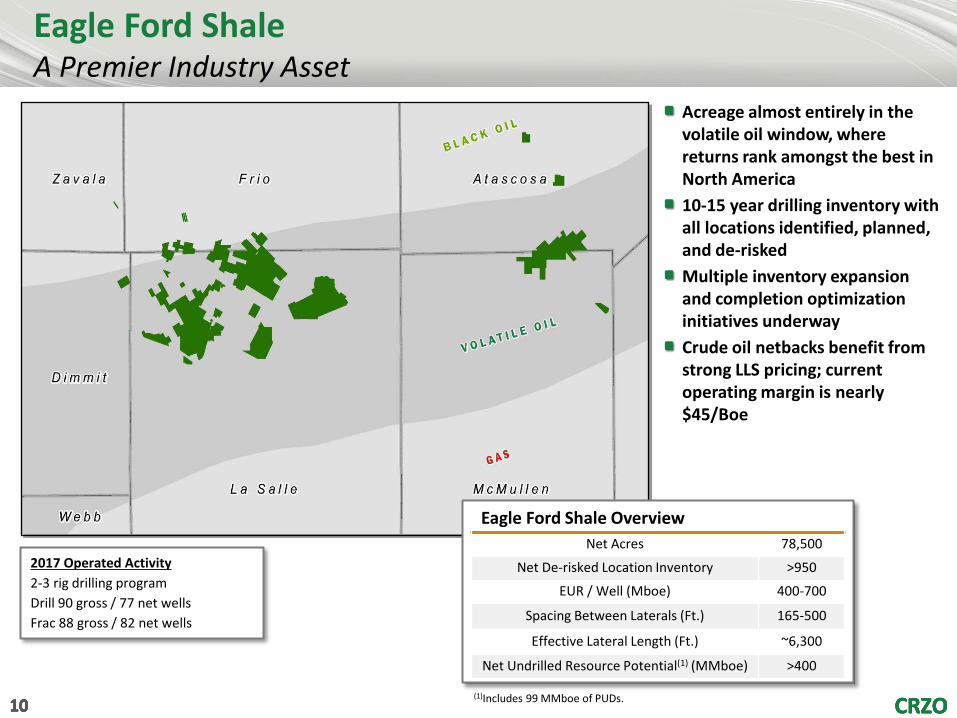
Acreage almost entirely in the volatile oil window, where returns rank amongst the best in North America 10-15 year drilling inventory with all locations identified, planned, and de-risked Multiple inventory expansion and completion optimization initiatives underway Crude oil netbacks benefit from strong LLS pricing; current operating margin is nearly $45/Boe
Eagle Ford Shale A Premier Industry Asset
Eagle Ford Shale Overview Net Acres 78,500
Net De-risked Location Inventory >950
EUR / Well (Mboe) 400-700
Spacing Between Laterals (Ft.) 165-500
Effective Lateral Length (Ft.) ~6,300
Net Undrilled Resource Potential(1) (MMboe) >400
(1)Includes 99 MMboe of PUDs.
2017 Operated Activity 2-3 rig drilling program Drill 90 gross / 77 net wells Frac 88 gross / 82 net wells
CRZO 11 CRZO 11 11 CRZO 11 11 CRZO 11
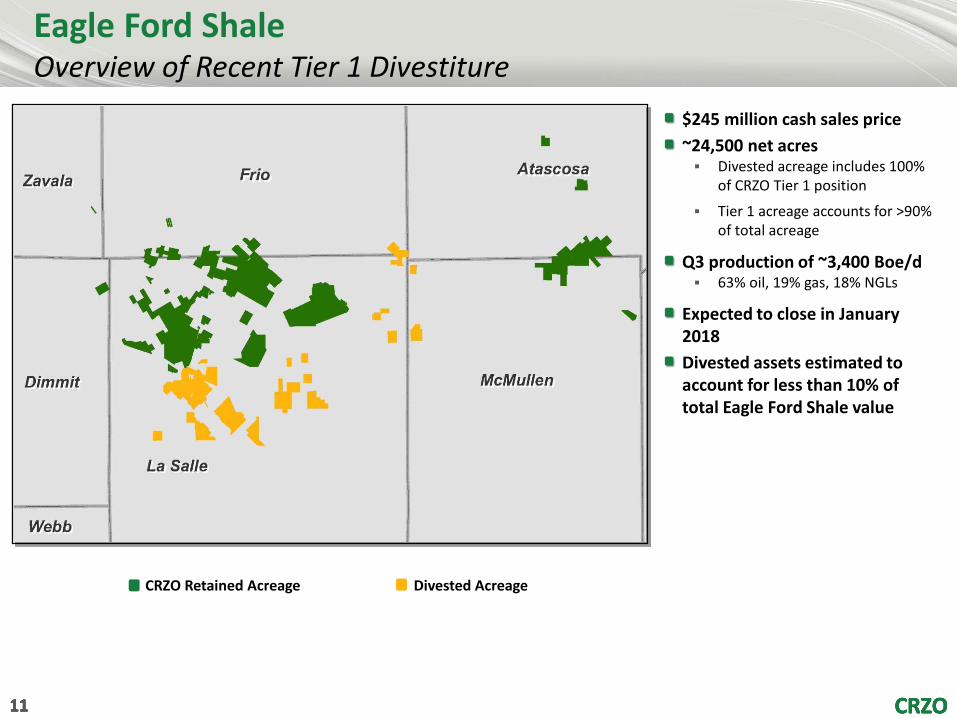
$245 million cash sales price ~24,500 net acres Divested acreage includes 100%
of CRZO Tier 1 position
Tier 1 acreage accounts for >90% of total acreage
Q3 production of ~3,400 Boe/d 63% oil, 19% gas, 18% NGLs
Expected to close in January 2018 Divested assets estimated to account for less than 10% of total Eagle Ford Shale value
CRZO Retained Acreage Divested Acreage
Eagle Ford Shale Overview of Recent Tier 1 Divestiture
CRZO 12
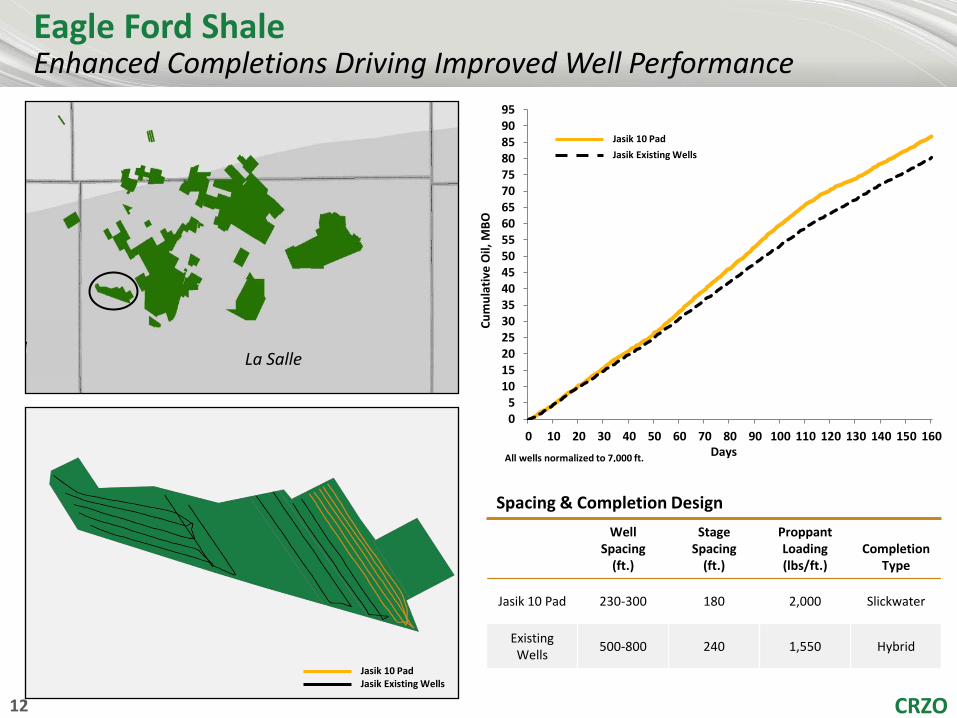
Eagle Ford Shale Enhanced Completions Driving Improved Well Performance
Jasik 10 Pad
Well Spacing
(ft.)
Stage Spacing
(ft.)
Proppant Loading (lbs/ft.)
Completion Type
Jasik 10 Pad 230-300 180 2,000 Slickwater
Existing Wells 500-800 240 1,550 Hybrid
05
101520253035404550556065707580859095
0 10 20 30 40 50 60 70 80 90 100 110 120 130 140 150 160
Cum
ulat
ive
Oil,
MBO
Days All wells normalized to 7,000 ft.
Jasik 10 Pad Jasik Existing Wells
Spacing & Completion Design
Jasik Existing Wells
La Salle
CRZO 13 CRZO 13 13 CRZO 13 13 CRZO 13
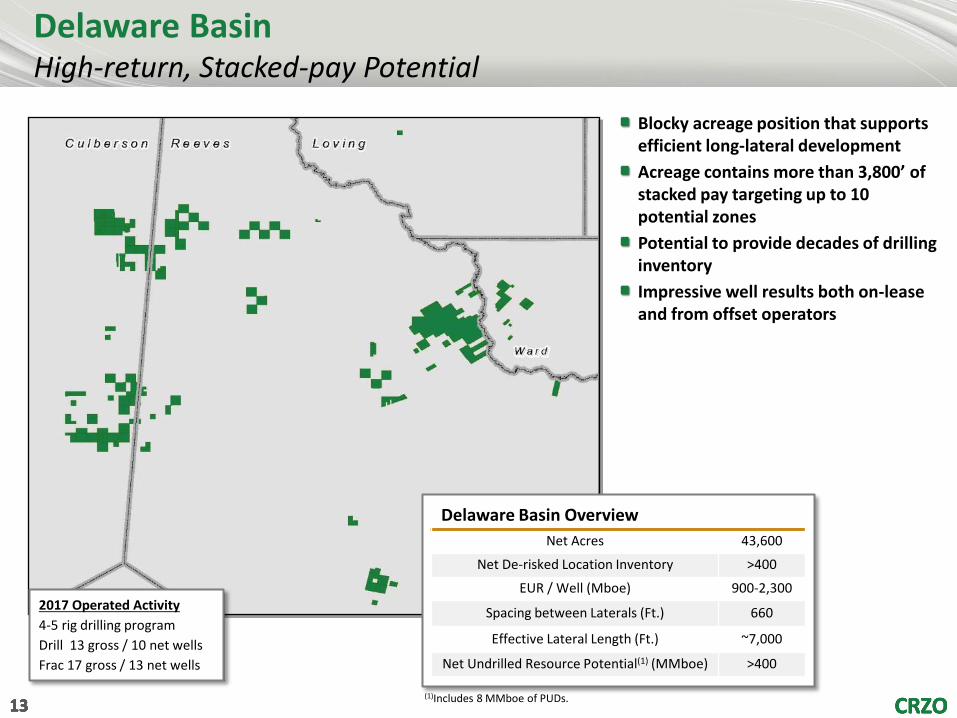
Delaware Basin High-return, Stacked-pay Potential
Blocky acreage position that supports efficient long-lateral development Acreage contains more than 3,800’ of stacked pay targeting up to 10 potential zones Potential to provide decades of drilling inventory Impressive well results both on-lease and from offset operators
Delaware Basin Overview Net Acres 43,600
Net De-risked Location Inventory >400
EUR / Well (Mboe) 900-2,300
Spacing between Laterals (Ft.) 660
Effective Lateral Length (Ft.) ~7,000
Net Undrilled Resource Potential(1) (MMboe) >400
(1)Includes 8 MMboe of PUDs.
2017 Operated Activity 4-5 rig drilling program Drill 13 gross / 10 net wells Frac 17 gross / 13 net wells

CRZO 14
Delaware Basin High-Quality Stacked Pay with Large Inventory Upside
*Formations not drawn to scale.
Producing Horizon
Upside Horizon
1st Bone Spring
2nd Bone Spring
3rd Bone Spring
Wolfcamp X/Y
Wolfcamp A
Upper Wolfcamp B
Wolfcamp C
Wolfcamp D
Lower Wolfcamp B
Avalon
70 - 120
200 - 225
190 - 230
200 - 260
150 - 170
225 - 300
Gross Section Thickness
(ft.)
550 - 600
600 - 700
350 - 450
650 - 750
Up to 10 potential targets across a 3,800’ section from the Avalon through the Wolfcamp D
4 of 6 target Wolfcamp horizons have been successfully tested with horizontal drilling
Offset production has been established in the 3rd Bone Spring, Wolfcamp X/Y, and Wolfcamp C
More than 400 net potential de-risked locations identified across the Wolfcamp A and B zones with the most well control
Significant inventory expansion potential from additional zones and future downspacing
Derisked Drilling
Locations
>400 >700 Unrisked
300 Unrisked

CRZO 15
11000
10000
11000
10000
11000
10000
11000
10000
11000
10000
11000
11000
BS3_MID_SHALE [PCF]
BS_SAND_3 [PCF]
BS_MK5 [PCF]
WOLFCAMP [PCF]
WOLFCAMP_A [PCF]
WOLFCAMP_B [PCF]
MIDDLE_B [PCF]
WOLFCAMP_C [PCF]
WOLFCAMP_D [PCF]
7 IN615 Sacks of Cement
9 5/8 IN2060 Sacks of Cement9 5/8 IN2060 Sacks of Cement
9 5/8 IN2100 Sacks of Cement
9 5/8 IN2585 Sacks of Cement
Delaware Basin Successful Wells in Four Out of Six Wolfcamp Horizons
BHP Well 1
ExL Well 1
ExL Well 2
ExL Well 3
ExL Well 4
ExL Well 5
J Cleo Well 1
WCA
WCBU
WCBL
WCC
WCD
BS3
X/Y
Producing Horizontal Wells
A
A’
CRZO 16
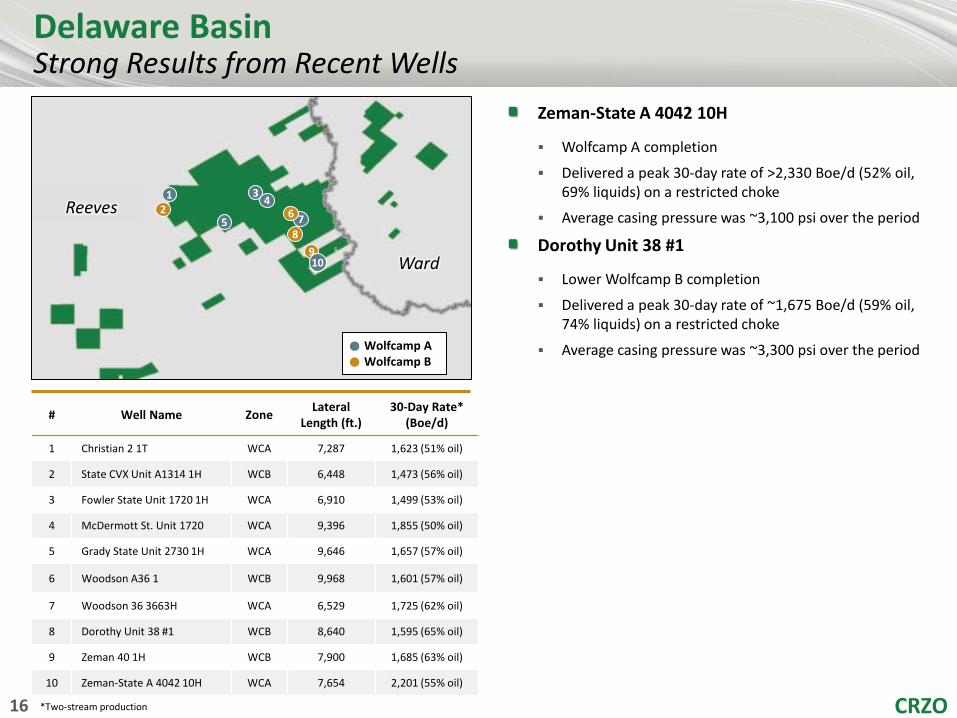
Delaware Basin Strong Results from Recent Wells
# Well Name Zone Lateral Length (ft.)
30-Day Rate* (Boe/d)
1 Christian 2 1T WCA 7,287 1,623 (51% oil)
2 State CVX Unit A1314 1H WCB 6,448 1,473 (56% oil)
3 Fowler State Unit 1720 1H WCA 6,910 1,499 (53% oil)
4 McDermott St. Unit 1720 WCA 9,396 1,855 (50% oil)
5 Grady State Unit 2730 1H WCA 9,646 1,657 (57% oil)
6 Woodson A36 1 WCB 9,968 1,601 (57% oil)
7 Woodson 36 3663H WCA 6,529 1,725 (62% oil)
8 Dorothy Unit 38 #1 WCB 8,640 1,595 (65% oil)
9 Zeman 40 1H WCB 7,900 1,685 (63% oil)
10 Zeman-State A 4042 10H WCA 7,654 2,201 (55% oil)
Zeman-State A 4042 10H
Wolfcamp A completion
Delivered a peak 30-day rate of >2,330 Boe/d (52% oil, 69% liquids) on a restricted choke
Average casing pressure was ~3,100 psi over the period
Dorothy Unit 38 #1
Lower Wolfcamp B completion
Delivered a peak 30-day rate of ~1,675 Boe/d (59% oil, 74% liquids) on a restricted choke
Average casing pressure was ~3,300 psi over the period
*Two-stream production
1 2
8
Wolfcamp A Wolfcamp B
5 7
9
3
6 4
10
Reeves
Ward
CRZO 17
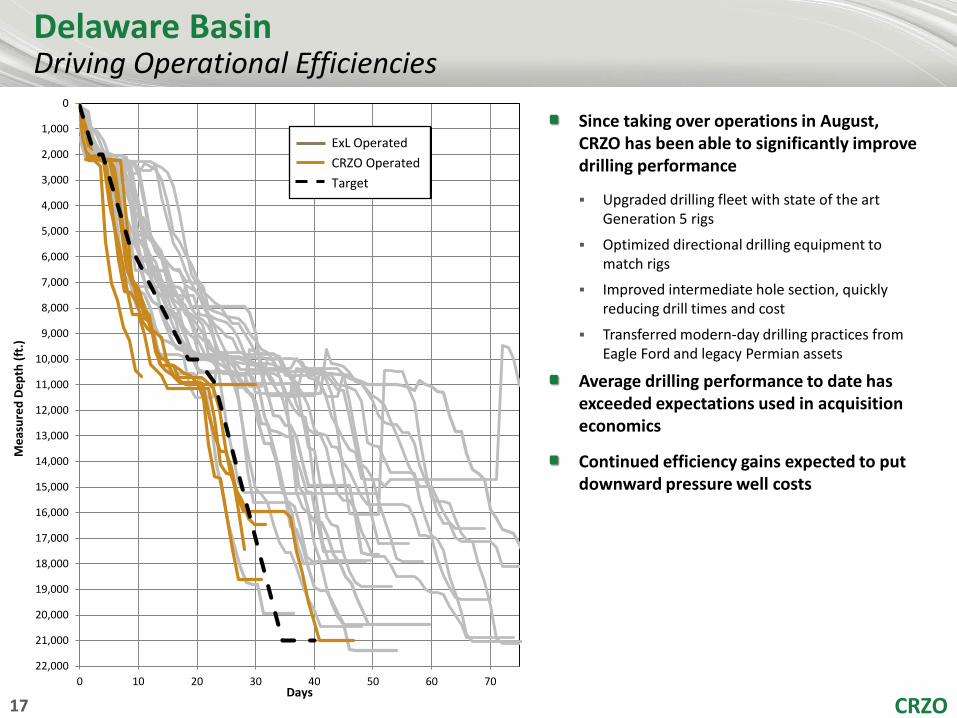
Delaware Basin Driving Operational Efficiencies
0
1,000
2,000
3,000
4,000
5,000
6,000
7,000
8,000
9,000
10,000
11,000
12,000
13,000
14,000
15,000
16,000
17,000
18,000
19,000
20,000
21,000
22,0000 10 20 30 40 50 60 70
Mea
sure
d De
pth
(ft.)
Days
Langford B89 1
Zeman-StateAllocation A 404210H
Exl Operated
CRZO Operated
Since taking over operations in August, CRZO has been able to significantly improve drilling performance
Upgraded drilling fleet with state of the art Generation 5 rigs
Optimized directional drilling equipment to match rigs
Improved intermediate hole section, quickly reducing drill times and cost
Transferred modern-day drilling practices from Eagle Ford and legacy Permian assets
Average drilling performance to date has exceeded expectations used in acquisition economics
Continued efficiency gains expected to put downward pressure well costs
ExL Operated CRZO Operated Target

CRZO 18 18 18
Summary
Premier Acreage Positions
Top Tier Operator
Significant Growth Potential
Experienced Management Team
Strong Financial Position
CRZO 19
Appendix
CRZO 20
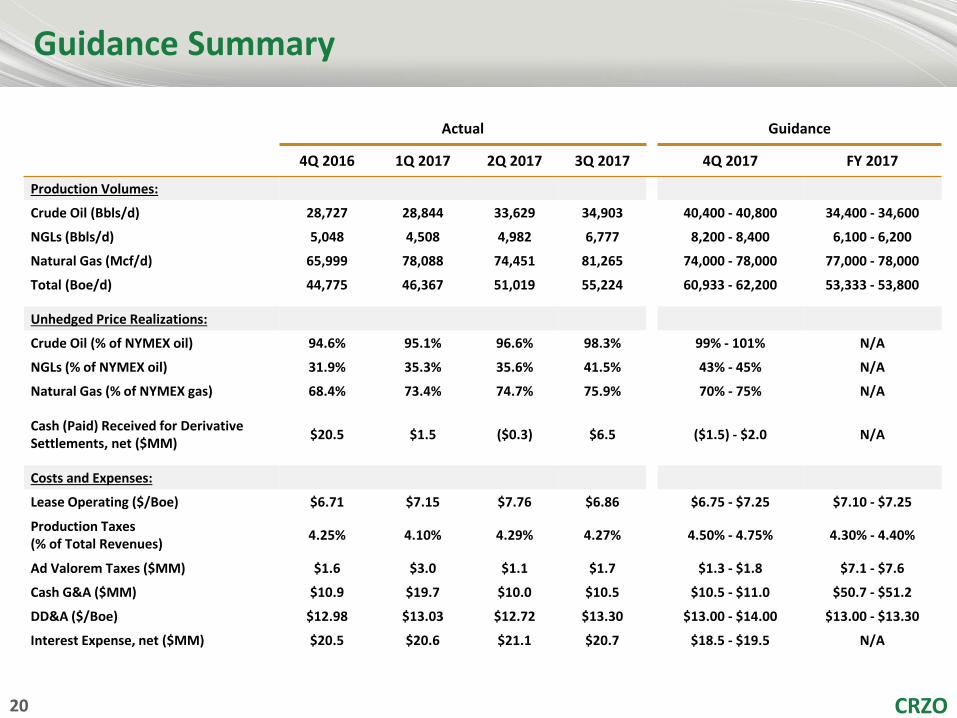
Guidance Summary
Actual Guidance
4Q 2016 1Q 2017 2Q 2017 3Q 2017 4Q 2017 FY 2017
Production Volumes:
Crude Oil (Bbls/d) 28,727 28,844 33,629 34,903 40,400 - 40,800 34,400 - 34,600
NGLs (Bbls/d) 5,048 4,508 4,982 6,777 8,200 - 8,400 6,100 - 6,200
Natural Gas (Mcf/d) 65,999 78,088 74,451 81,265 74,000 - 78,000 77,000 - 78,000
Total (Boe/d) 44,775 46,367 51,019 55,224 60,933 - 62,200 53,333 - 53,800
Unhedged Price Realizations:
Crude Oil (% of NYMEX oil) 94.6% 95.1% 96.6% 98.3% 99% - 101% N/A
NGLs (% of NYMEX oil) 31.9% 35.3% 35.6% 41.5% 43% - 45% N/A
Natural Gas (% of NYMEX gas) 68.4% 73.4% 74.7% 75.9% 70% - 75% N/A
Cash (Paid) Received for Derivative Settlements, net ($MM) $20.5 $1.5 ($0.3) $6.5 ($1.5) - $2.0 N/A
Costs and Expenses:
Lease Operating ($/Boe) $6.71 $7.15 $7.76 $6.86 $6.75 - $7.25 $7.10 - $7.25
Production Taxes (% of Total Revenues) 4.25% 4.10% 4.29% 4.27% 4.50% - 4.75% 4.30% - 4.40%
Ad Valorem Taxes ($MM) $1.6 $3.0 $1.1 $1.7 $1.3 - $1.8 $7.1 - $7.6
Cash G&A ($MM) $10.9 $19.7 $10.0 $10.5 $10.5 - $11.0 $50.7 - $51.2
DD&A ($/Boe) $12.98 $13.03 $12.72 $13.30 $13.00 - $14.00 $13.00 - $13.30
Interest Expense, net ($MM) $20.5 $20.6 $21.1 $20.7 $18.5 - $19.5 N/A
CRZO 21 21 21
Period Type of Contract Daily Volume (Bbl/d) Floor Price Ceiling Price Sub-floor Price
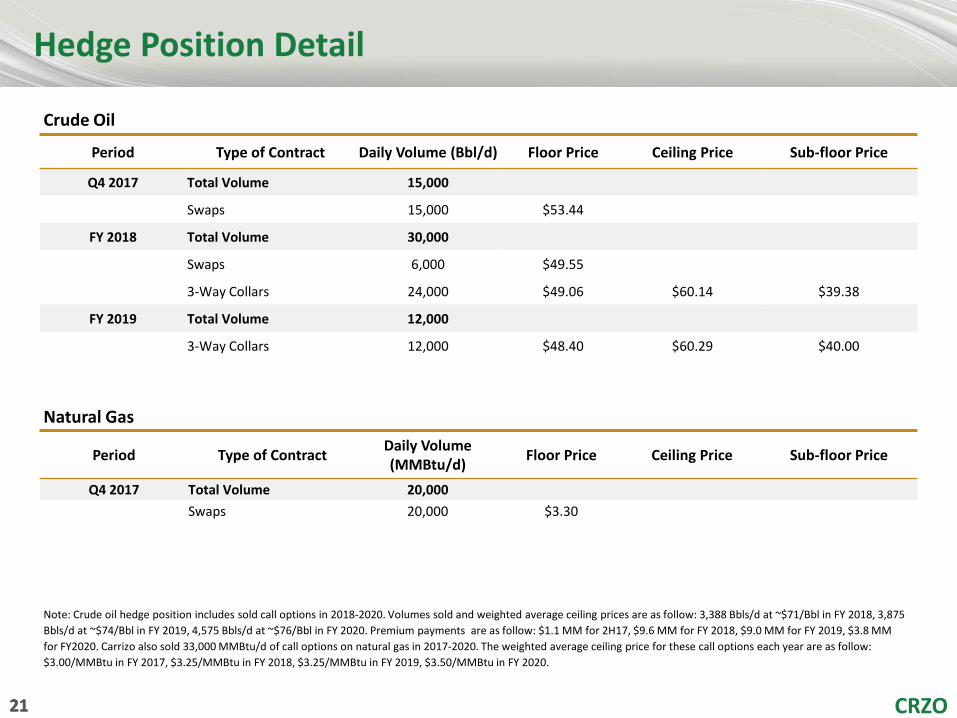
Q4 2017 Total Volume 15,000
Swaps 15,000 $53.44
FY 2018 Total Volume 30,000
Swaps 6,000 $49.55
3-Way Collars 24,000 $49.06 $60.14 $39.38
FY 2019 Total Volume 12,000
3-Way Collars 12,000 $48.40 $60.29 $40.00
Hedge Position Detail
Note: Crude oil hedge position includes sold call options in 2018-2020. Volumes sold and weighted average ceiling prices are as follow: 3,388 Bbls/d at ~$71/Bbl in FY 2018, 3,875 Bbls/d at ~$74/Bbl in FY 2019, 4,575 Bbls/d at ~$76/Bbl in FY 2020. Premium payments are as follow: $1.1 MM for 2H17, $9.6 MM for FY 2018, $9.0 MM for FY 2019, $3.8 MM for FY2020. Carrizo also sold 33,000 MMBtu/d of call options on natural gas in 2017-2020. The weighted average ceiling price for these call options each year are as follow: $3.00/MMBtu in FY 2017, $3.25/MMBtu in FY 2018, $3.25/MMBtu in FY 2019, $3.50/MMBtu in FY 2020.
Period Type of Contract Daily Volume (MMBtu/d) Floor Price Ceiling Price Sub-floor Price
Q4 2017 Total Volume 20,000 Swaps 20,000 $3.30
Crude Oil
Natural Gas

CRZO 22 22 22
Eagle Ford Shale API Gravity
Source: DrillingInfo initial completion reports.
90%
5%
5%
Oil
Gas
NGL
2%
98%
≥ 50
46-49
35-45
Zavala Frio Atascosa
Dimmit La Salle McMullen
3Q17 Net Sales Revenue by Product
3Q17 Volumes by API Gravity
CRZO 23 23 23
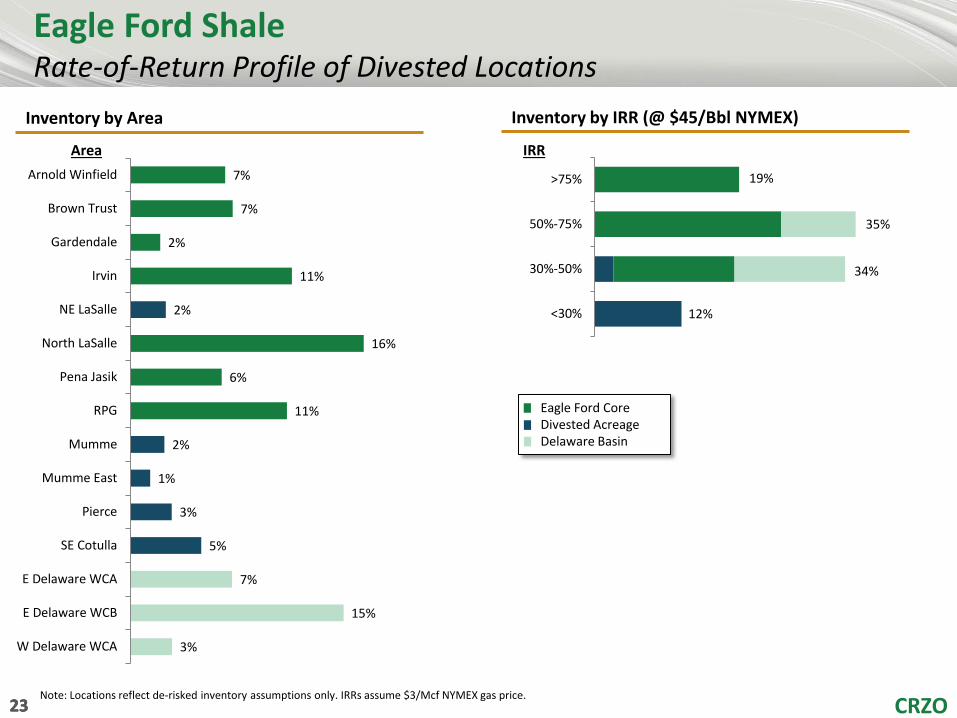
7%
7%
2%
11%
2%
16%
6%
11%
2%
1%
3%
5%
7%
15%
3%
Arnold Winfield
Brown Trust
Gardendale
Irvin
NE LaSalle
North LaSalle
Pena Jasik
RPG
Mumme
Mumme East
Pierce
SE Cotulla
E Delaware WCA
E Delaware WCB
W Delaware WCA
>75%
50%-75%
30%-50%
<30%
Eagle Ford Shale Rate-of-Return Profile of Divested Locations
Note: Locations reflect de-risked inventory assumptions only. IRRs assume $3/Mcf NYMEX gas price.
IRR Area
Eagle Ford Core Divested Acreage Delaware Basin
19%
35%
34%
12%
Inventory by Area Inventory by IRR (@ $45/Bbl NYMEX)
CRZO 24 CRZO 24 24 CRZO 24 24 CRZO 24
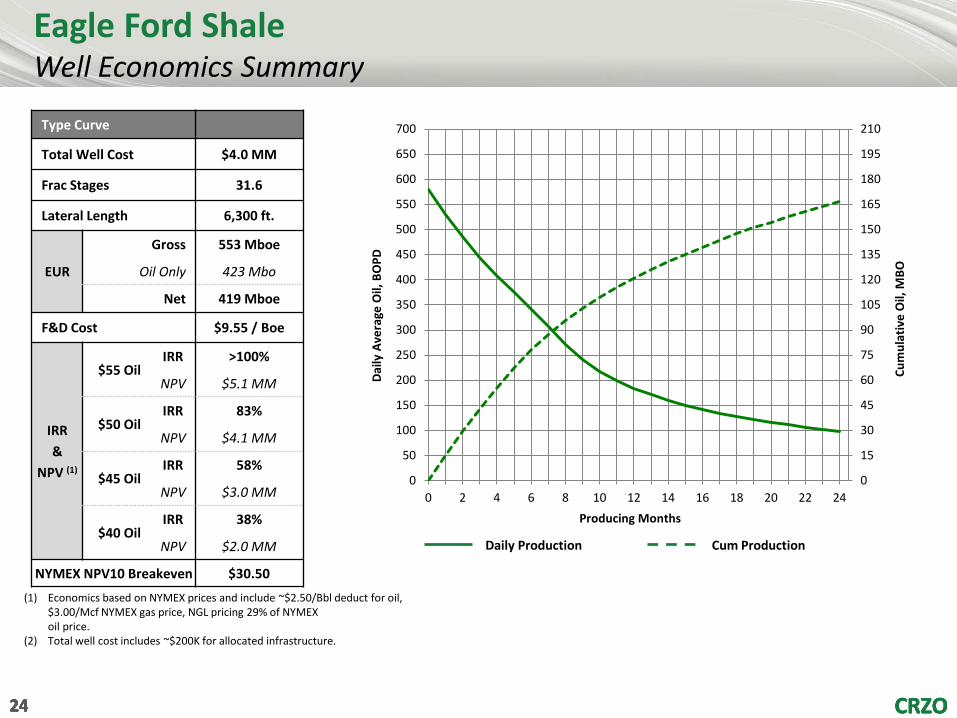
Eagle Ford Shale Well Economics Summary
(1) Economics based on NYMEX prices and include ~$2.50/Bbl deduct for oil, $3.00/Mcf NYMEX gas price, NGL pricing 29% of NYMEX oil price.
(2) Total well cost includes ~$200K for allocated infrastructure.
Daily Production Cum Production
0
15
30
45
60
75
90
105
120
135
150
165
180
195
210
0
50
100
150
200
250
300
350
400
450
500
550
600
650
700
0 2 4 6 8 10 12 14 16 18 20 22 24
Cum
ulat
ive
Oil,
MBO
Daily
Ave
rage
Oil,
BO
PD
Producing Months
Type Curve
Total Well Cost $4.0 MM
Frac Stages 31.6
Lateral Length 6,300 ft.
EUR
Gross 553 Mboe
Oil Only 423 Mbo
Net 419 Mboe
F&D Cost $9.55 / Boe
IRR &
NPV (1)
$55 Oil IRR >100%
NPV $5.1 MM
$50 Oil IRR 83%
NPV $4.1 MM
$45 Oil IRR 58%
NPV $3.0 MM
$40 Oil IRR 38%
NPV $2.0 MM
NYMEX NPV10 Breakeven $30.50
CRZO 25
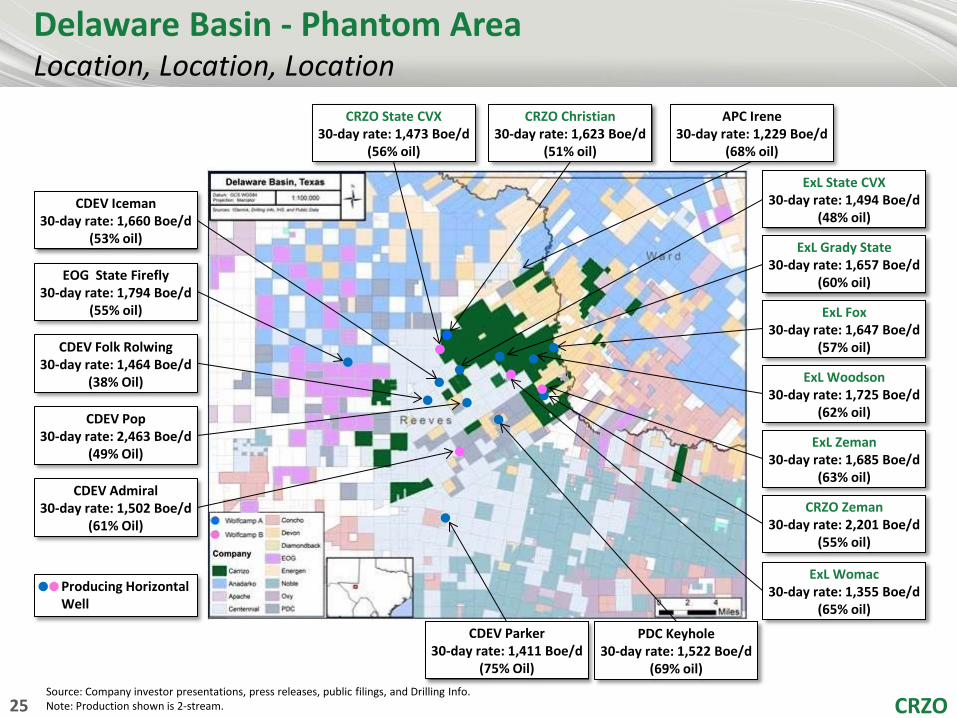
Delaware Basin - Phantom Area Location, Location, Location
Source: Company investor presentations, press releases, public filings, and Drilling Info. Note: Production shown is 2-stream.
CDEV Parker 30-day rate: 1,411 Boe/d
(75% Oil)
EOG State Firefly 30-day rate: 1,794 Boe/d
(55% oil)
CDEV Pop 30-day rate: 2,463 Boe/d
(49% Oil)
CDEV Admiral 30-day rate: 1,502 Boe/d
(61% Oil)
ExL Fox 30-day rate: 1,647 Boe/d
(57% oil)
ExL State CVX 30-day rate: 1,494 Boe/d
(48% oil)
ExL Womac 30-day rate: 1,355 Boe/d
(65% oil)
CDEV Iceman 30-day rate: 1,660 Boe/d
(53% oil)
CRZO State CVX 30-day rate: 1,473 Boe/d
(56% oil)
CRZO Christian 30-day rate: 1,623 Boe/d
(51% oil)
APC Irene 30-day rate: 1,229 Boe/d
(68% oil)
ExL Woodson 30-day rate: 1,725 Boe/d
(62% oil)
ExL Zeman 30-day rate: 1,685 Boe/d
(63% oil)
PDC Keyhole 30-day rate: 1,522 Boe/d
(69% oil)
CDEV Folk Rolwing 30-day rate: 1,464 Boe/d
(38% Oil)
ExL Grady State 30-day rate: 1,657 Boe/d
(60% oil)
Producing Horizontal Well
CRZO Zeman 30-day rate: 2,201 Boe/d
(55% oil)

CRZO 26 26 26
Delaware Basin - Western Area Strong Well Results Along the Culberson/Reeves Border
CRZO Liberator State 1H (30-day rate: 1,400 Boe/d
(35% oil, 25% gas, 40% NGL)
CRZO Corsair State 3H 30-day rate: 1,227 Boe/d
(40% oil, 25% gas, 35% NGL)
CRZO Fortress State 1H 30-day rate: 1,520 Boe/d
(25% oil, 36% gas, 39% NGL)
BHP 113-24x1 1H 30-day rate: 961 Boe/d
(52% oil)
BHP 113-23x14 1H 30-day rate: 2,022 Boe/d
(32% oil)
3ROC Wise West State 703WA 30-day rate: 1,399 Boe/d
(40% oil)
XEC Venetian Way 38 1H 30-day rate: 1,573 Boe/d
(51% oil)
EOG Harrison Ranch 306H 30-day rate: 959 Boe/d
(54% oil)
EOG Harrison Ranch 1504H 30-day rate: 3,975 Boe/d
(78% oil)
Capitan Dorothy St. 12 1H 30-day rate: 1,021 Boe/d
(50% oil) Capitan Cliff Fee 4 1H
30-day rate: 1,667 Boe/d (47% oil)
3ROC Smither State 47-38 30-day rate: 1,476 Boe/d
(41% oil) Source: Company investor presentations, press releases, public filings, and Drilling Info. Note: Production shown is 2-stream, unless otherwise noted.
3ROC Wise Unit 103WA 30-day rate: 737 Boe/d
(40% oil)
XEC California Chrome 39 1H 30-day rate: 1,404 Boe/d
(48% oil)
BHP 113-10 1H 30-day rate: 1,110 Boe/d
(48% oil)
Producing Horizontal Well
Wolfcamp A Company
CRZO 27
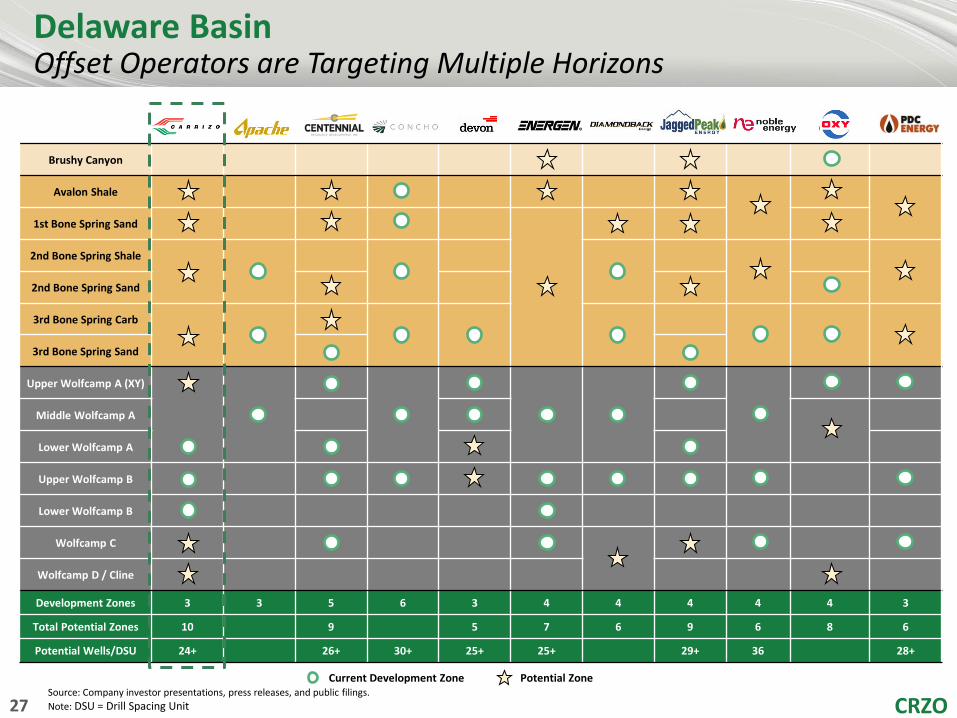
Source: Company investor presentations, press releases, and public filings. Note: DSU = Drill Spacing Unit
Delaware Basin Offset Operators are Targeting Multiple Horizons
APC CDEV CXO DVN EGN FANG JAG NBL OXY PDCE
Brushy Canyon P P Y
Avalon Shale Y P P P
P P
1st Bone Spring Sand P Y
P
P P P
2nd Bone Spring Shale Y Y Y P P
2nd Bone Spring Sand P P Y
3rd Bone Spring Carb Y
P Y Y Y Y Y P
3rd Bone Spring Sand Y Y
Upper Wolfcamp A (XY)
Y
Y
Y
Y
Y Y
Y
Y
Y Y
Middle Wolfcamp A Y P
Lower Wolfcamp A Y P Y
Upper Wolfcamp B Y Y P Y Y Y Y Y
Lower Wolfcamp B Y
Wolfcamp C Y Y P
P Y Y
Wolfcamp D / Cline P
Development Zones 3 3 5 6 3 4 4 4 4 4 3
Total Potential Zones 10 9 5 7 6 9 6 8 6
Potential Wells/DSU 24+ 26+ 30+ 25+ 25+ 29+ 36 28+
Current Development Zone Potential Zone

CRZO 28 28 28
Delaware Basin - Phantom Area Well Economics Summary
(1) Economics are three stream and based on NYMEX prices and include $3.00/Mcf gas price, $3.00/Bbl deduct for oil, $0.25/Mcf deduct for gas, NGL pricing 43% of oil price.
(2) Water disposal is assumed to be $0.75/bbl. (3) Total well cost includes ~$450K for allocated infrastructure.
Type Curve Wolfcamp A Wolfcamp B
Total Well Cost $8.1 MM $8.1 MM
Frac Stages 42 42
Lateral Length 7,000 ft. 7,000 ft.
EUR
Gross 1,539 Mboe 1,272 Mboe
Oil Only 833 Mbo 648 Mbo
Net 1,154 Mboe 954 Mboe
F&D Cost $7.02 / Boe $8.49 / Boe
IRR &
NPV (1)
$55 Oil IRR 86% 58%
NPV $10.9 MM $7.3 MM
$50 Oil IRR 67% 44%
NPV $8.9 MM $5.7 MM
$45 Oil IRR 50% 33%
NPV $7.0 MM $4.1 MM
$40 Oil IRR 36% 23%
NPV $5.0 MM $2.6 MM
NYMEX NPV10 Breakeven $27.00 $32.00
0
50
100
150
200
250
300
0
200
400
600
800
1,000
1,200
0 2 4 6 8 10 12 14 16 18 20 22 24
Cum
ulat
ive
Oil
– M
BO, G
as -
MBO
E
Oil
– BO
PD, G
as -
BOEP
D
Producing Months
Daily Oil Daily Wet GasCumulative Oil Cumulative Wet Gas
0
50
100
150
200
250
300
0
200
400
600
800
1,000
1,200
0 2 4 6 8 10 12 14 16 18 20 22 24
Cum
ulat
ive
Oil
– M
BO, G
as -
MBO
E
Oil
– BO
PD, G
as -
BOEP
D
Producing Months
Wolfcamp A
Wolfcamp B

CRZO 29 29 29 29
Delaware Basin – Western Area Well Economics Summary
Type Curve Wolfcamp A
Total Well Cost $7.0 MM
Frac Stages 31
Lateral Length 7,000 ft.
EUR
Gross 1,862 Mboe
Oil Only 712 Mbo
Net 1,396 Mboe
F&D Cost $5.01 / Boe
IRR &
NPV (1)
$55 Oil IRR 92%
NPV10 $11.1 MM
$50 Oil IRR 73%
NPV10 $9.4 MM
$45 Oil IRR 57%
NPV10 $7.6 MM
$40 Oil IRR 43%
NPV10 $5.8 MM
NYMEX NPV10 Breakeven $23.75
(1) Economics based on NYMEX prices and include $3.00/Mcf gas price, $4.00/Bbl deduct for oil, $0.97/Mcf deduct for gas, NGL pricing 30% of oil price.
(2) Water disposal is assumed to be $0.75/bbl. (3) Total well cost includes ~$500K for allocated infrastructure.
0
50
100
150
200
250
300
350
0
100
200
300
400
500
600
700
0 2 4 6 8 10 12 14 16 18 20 22 24
Cum
ulat
ive
Oil
- MBO
, Gas
- M
BOE
Oil
- BO
PD, G
as -
BOEP
D
Producing Months
Daily Oil Daily Wet GasCumulative Oil Cumulative Wet Gas