goldsmith’s teachers lecture 2011 medical statistics joan morris professor of medical statistics
TRANSCRIPT
Goldsmith’s teachers lecture 2011
Medical statisticsJoan Morris
Professor of Medical Statistics
Aims
• To describe medical statistics
• To give examples of where medical statistics has contributed to society
• Use of statistics in screening
• To mention some novel statistical methods

Statistics - definition
Statistics is a mathematical science pertaining to the collection, analysis, interpretation or explanation, and
presentation of data.
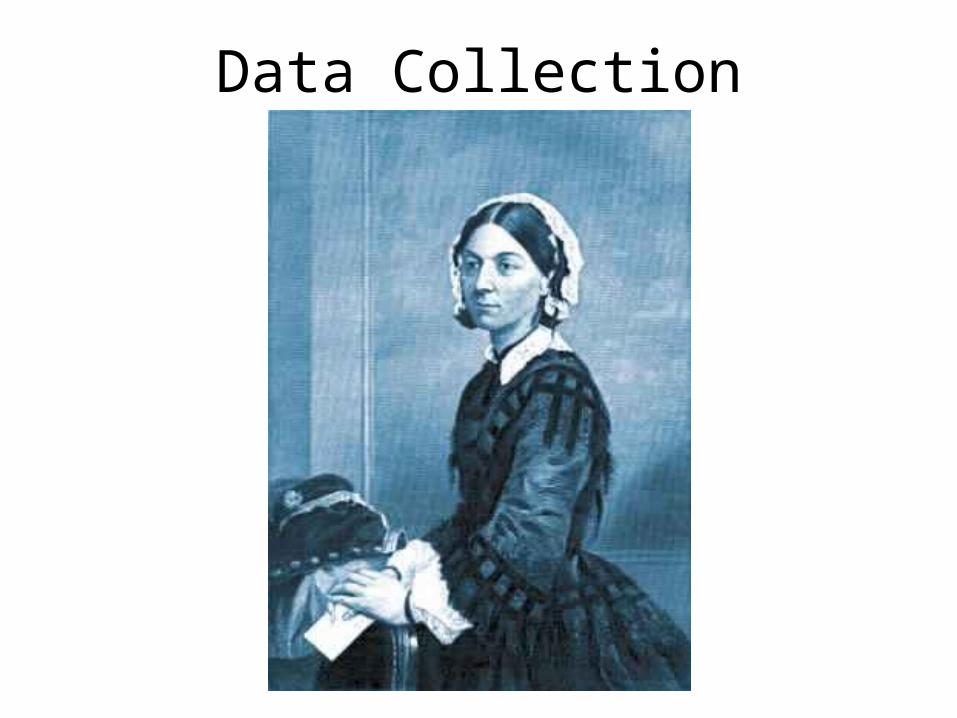
Data Collection
Data Collection
• Florence Nightingale
– She realised that soldiers were dying from malnutrition, poor sanitation, and lack of activity.
– She kept meticulous records of the death toll in the hospitals as evidence of the importance of patient welfare.

Polar Area Diagrams
National Data Collection
• National Mortality Statistics
• Health survey for England and Wales
• Population statistics …..
• Large amounts of data are available on the web

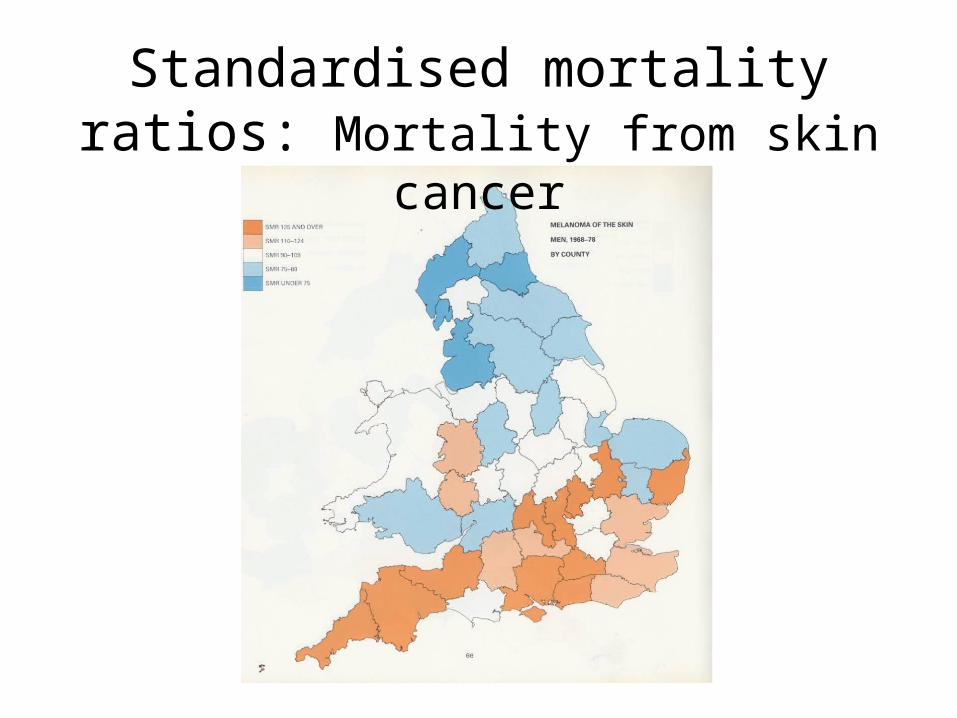
Standardised mortality ratios: Mortality from skin cancer
0
50
100
150
200
All
birt
hs (
in t
ho
usa
nds)
15 20 25 30 35 40 45 50Maternal age at birth (years)
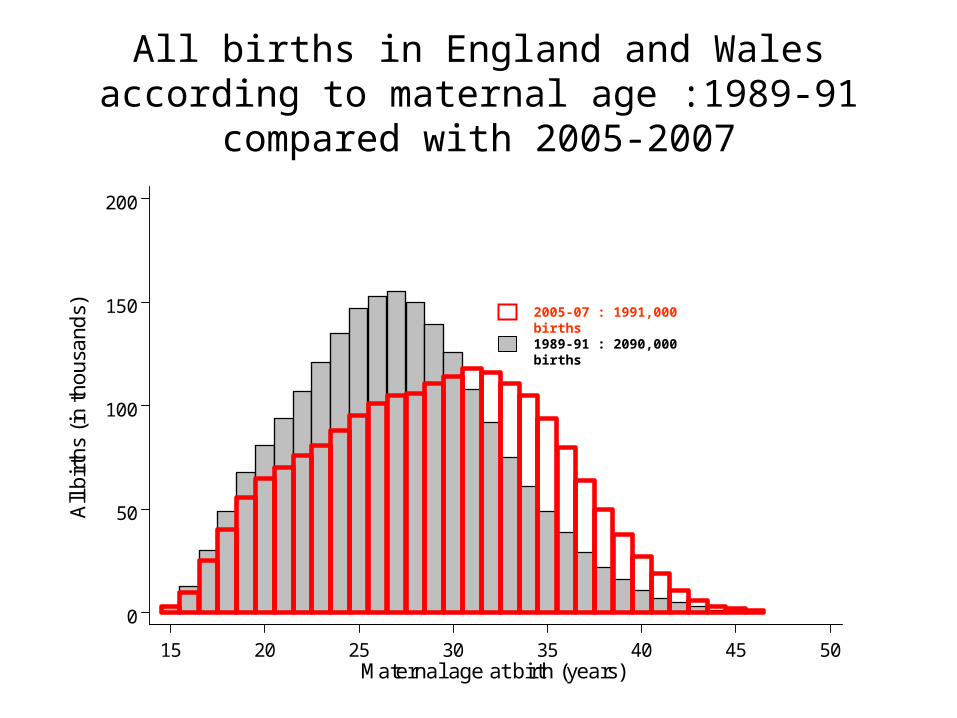
All births in England and Wales according to maternal age :1989-91 compared with 2005-2007
1989-91 : 2090,000 births
2005-07 : 1991,000 births

Comparisons of individuals
Observationalcross-sectionalcase-control studiescohort studies
InterventionalRandomised controlled trials
Comparisons of populations
Time trends
Ecological studies:Geographical variationsAge/sex patternsSocial variations
EpidemiologyEpidemiology
Comparison of Individuals
• Study Design– Ensure “valid” data is collected – Ensure enough data is collected
• Main designs– Case control studies– Cohort studies– Clinical trials
Richard Doll (doctor) and Austin Bradford Hill (statistician)
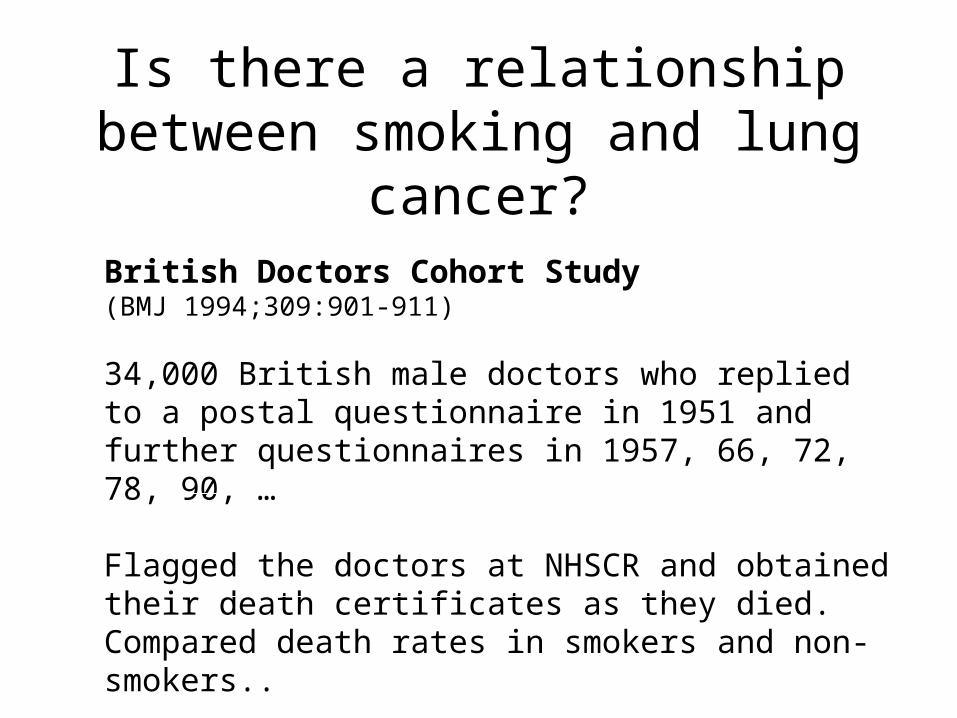
Is there a relationship between smoking and lung cancer?
British Doctors Cohort Study(BMJ 1994;309:901-911)
34,000 British male doctors who replied to a postal questionnaire in 1951 and further questionnaires in 1957, 66, 72, 78, 90, …
Flagged the doctors at NHSCR and obtained their death certificates as they died. Compared death rates in smokers and non-smokers..
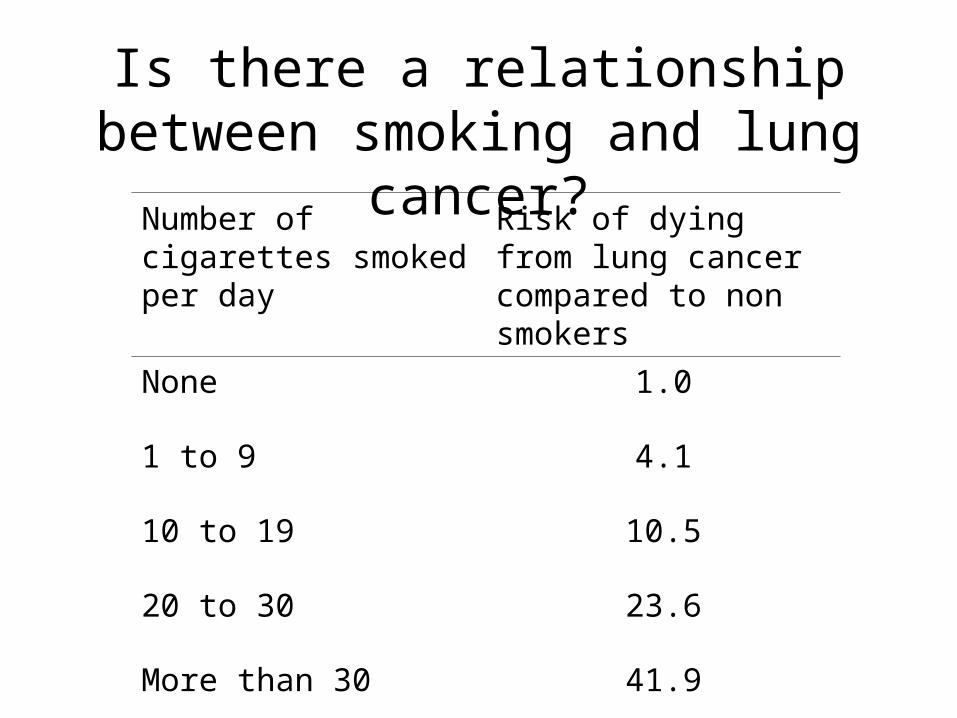
Number of cigarettes smoked per day
Risk of dying from lung cancer compared to non smokers
None 1.0
1 to 9 4.1
10 to 19 10.5
20 to 30 23.6
More than 30 41.9
Is there a relationship between smoking and lung cancer?
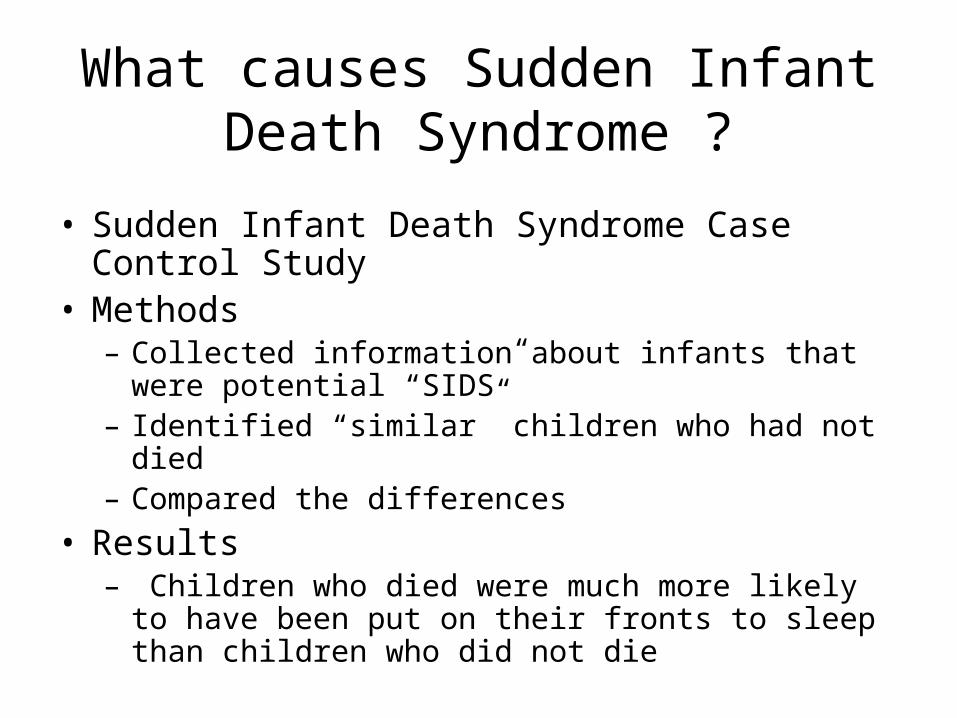
What causes Sudden Infant Death Syndrome ?
• Sudden Infant Death Syndrome Case Control Study
• Methods– Collected information about infants that were potential
“SIDS”– Identified “similar” children who had not died – Compared the differences
• Results– Children who died were much more likely to have
been put on their fronts to sleep than children who did not die

Randomised Controlled Trial
• A clinical trial is an experiment in which a
treatment is administered to humans in order to
evaluate its efficacy and safety
• Randomised = allocated to groups on basis of
chance e.g. tossing a coin (ensures fair
comparison)
• Controlled = a comparison group
Can folic acid reduce neural tube defects (e.g. spina bifida)?
• MRC Vitamin trial - randomised controlled trial
• Large: 1817 women who had had a previous NTD, 33 centres, 7 countries
Can folic acid reduce neural tube defects (e.g. spina bifida)?
• Results : Women who did not receive folic acid were 3 times more likely to have a second NTD pregnancy
• Impact : Women are advised to take folic acid prior to becoming pregnant
• Majority of countries around the world fortify flour with folic acid

Collection of Data
• Study Design– Cohort– Case Control– Clinical Trial
Analysis
• Could the observed results have arisen by chance ?
• Given that we have a sample what can we say about the population from which the sample comes
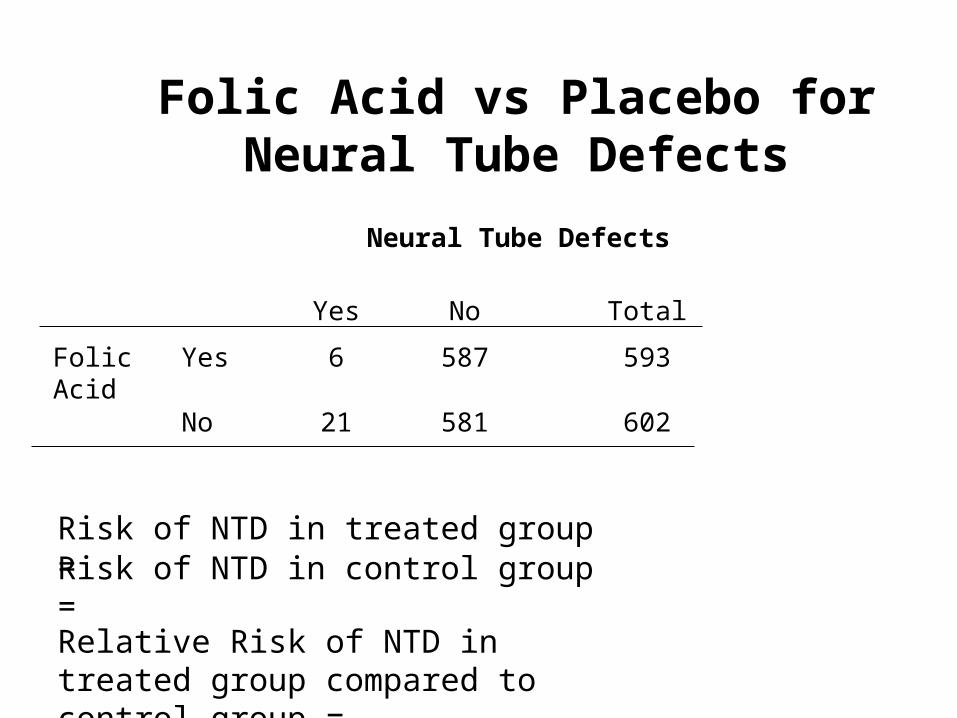
Folic Acid vs Placebo forNeural Tube Defects
Neural Tube Defects
Yes No Total
Folic Acid
Yes 6 587 593
No 21 581 602
Risk of NTD in treated group =Risk of NTD in control group =
Relative Risk of NTD in treated group compared to control group =
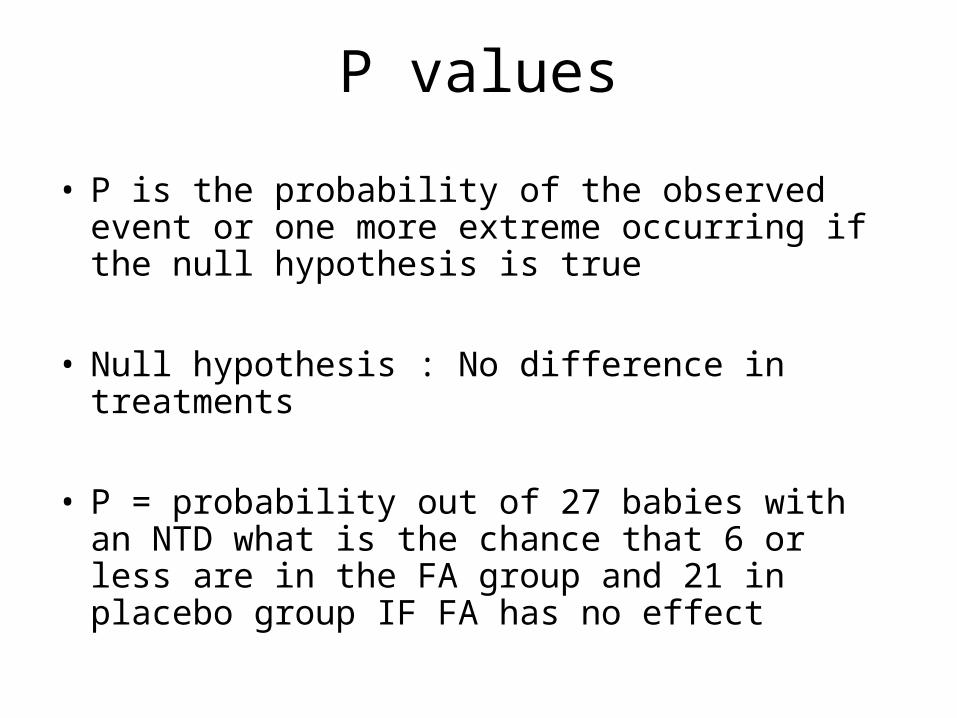
P values
• P is the probability of the observed event or one more extreme occurring if the null hypothesis is true
• Null hypothesis : No difference in treatments
• P = probability out of 27 babies with an NTD what is the chance that 6 or less are in the FA group and 21 in placebo group IF FA has no effect
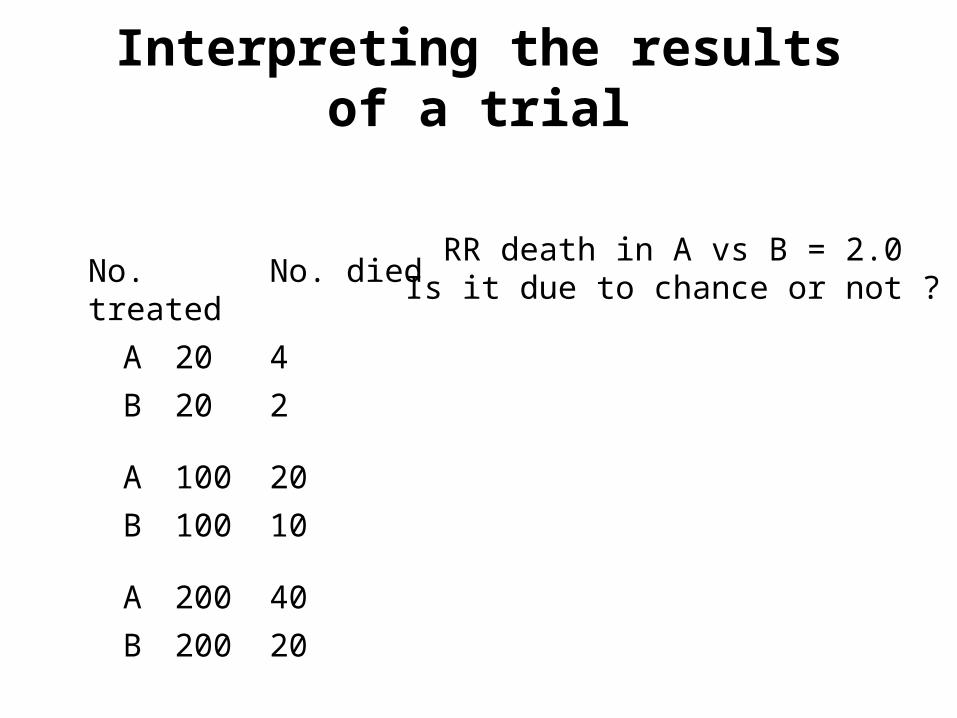
No. treated No. died
A 20 4
B 20 2
A 100 20
B 100 10
A 200 40
B 200 20
RR death in A vs B = 2.0Is it due to chance or not ?
Interpreting the results of a trial
P values
• P < 0.05 is taken to mean statistical significance
• This means if there is no difference between treatments, and you do 20 trials one will be statistically significant
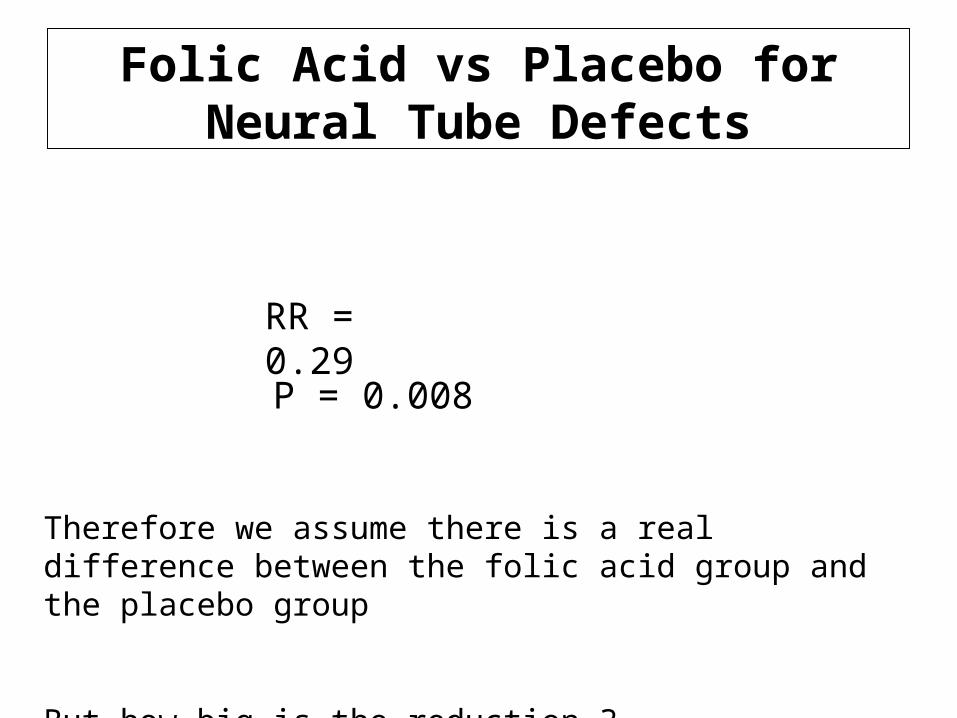
Folic Acid vs Placebo forNeural Tube Defects
RR = 0.29
P = 0.008
Therefore we assume there is a real difference between the folic acid group and the placebo group
But how big is the reduction ?
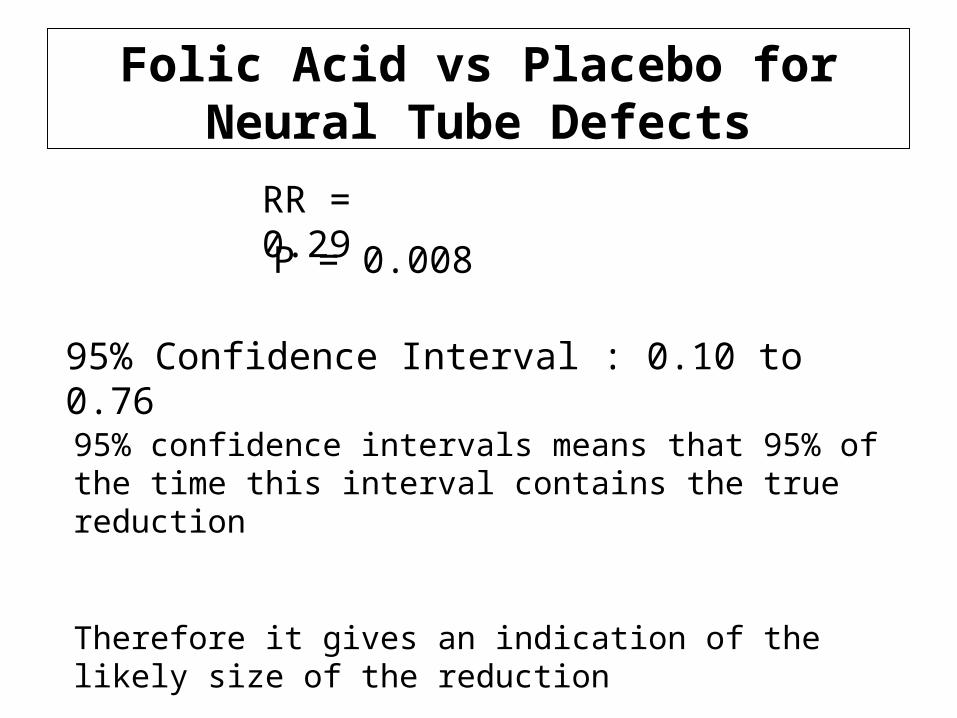
Folic Acid vs Placebo forNeural Tube Defects
RR = 0.29
95% Confidence Interval : 0.10 to 0.76
P = 0.008
95% confidence intervals means that 95% of the time this interval contains the true reduction
Therefore it gives an indication of the likely size of the reduction
01
23
45
67
8N
TD
pre
vale
nce
per
10
00 b
irths
0 2 4 6 8 10Plasma folate (ng/ml)
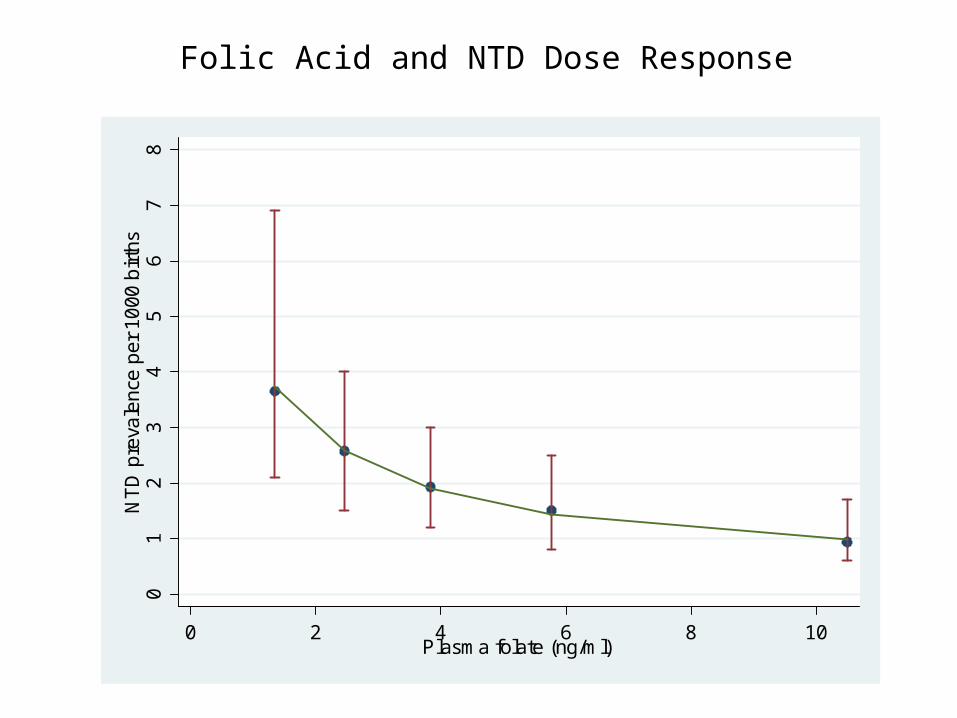
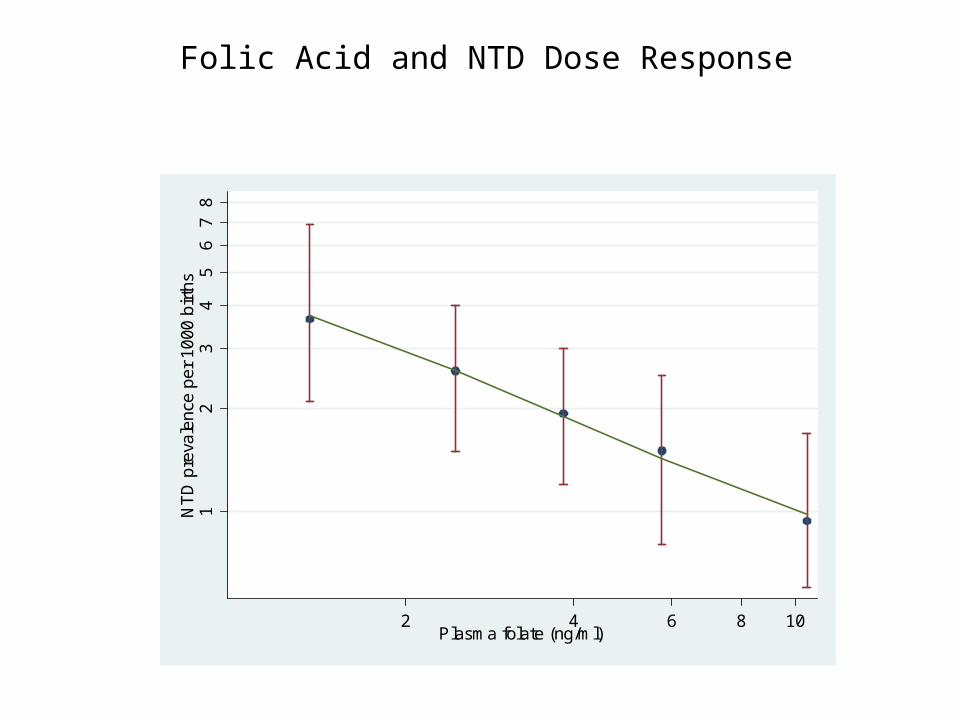
Folic Acid and NTD Dose Response
Folic Acid and NTD Dose Response01
23
45
67
8N
TD
pre
vale
nce
per
10
00 b
irths
0 2 4 6 8 10Plasma folate (ng/ml)
Interpretation
• The same proportional increase in serum folate has the same proportional reduction in NTD
• All women benefit from taking folic acid. There is not a threshold effect

So far….
• Collection– Nightingale– National statistics– Study design
• Presentation – Estimates and confidence intervals
• Analysis – Vital to interpretation
Use of Statistics in Screening
Screening is the identification, among apparently healthy individuals, of those who are sufficiently at risk from a specific disorder to benefit from a subsequent diagnostic test, procedure or direct preventive action.
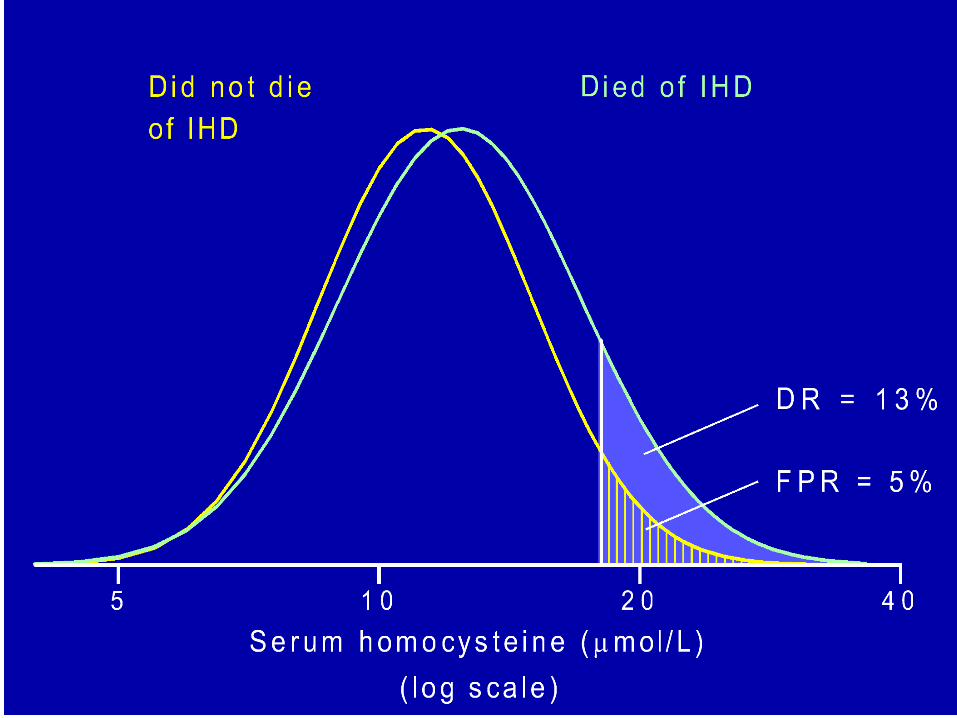
Screening for Heart Disease
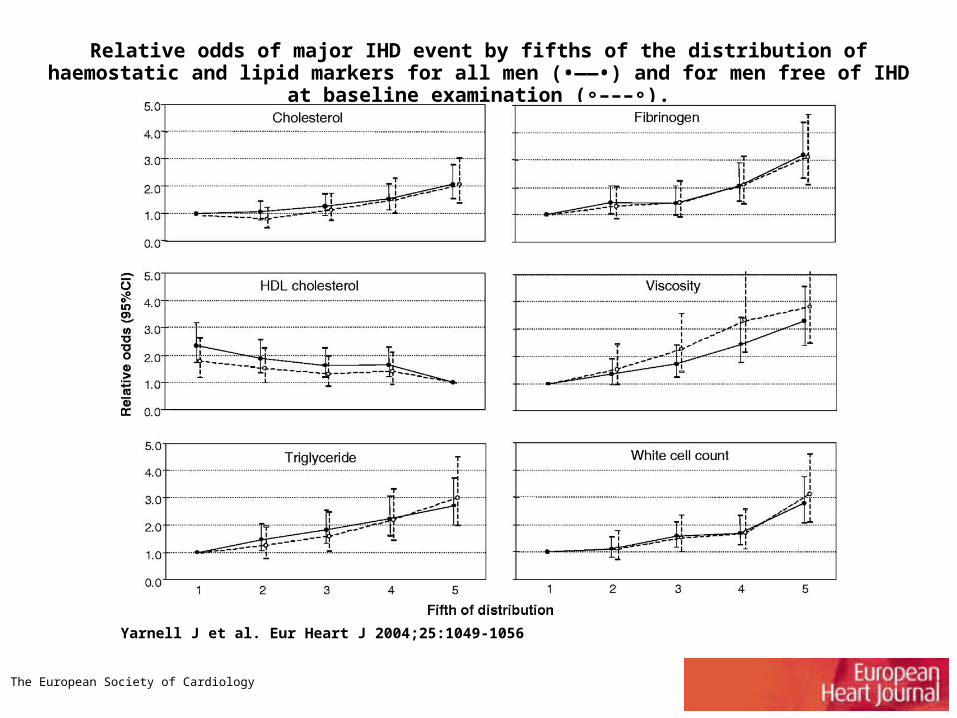
Relative odds of major IHD event by fifths of the distribution of haemostatic and lipid markers for all men (•——•) and for men free of IHD at baseline examination ( ––– ).∘ ∘
Yarnell J et al. Eur Heart J 2004;25:1049-1056
The European Society of Cardiology
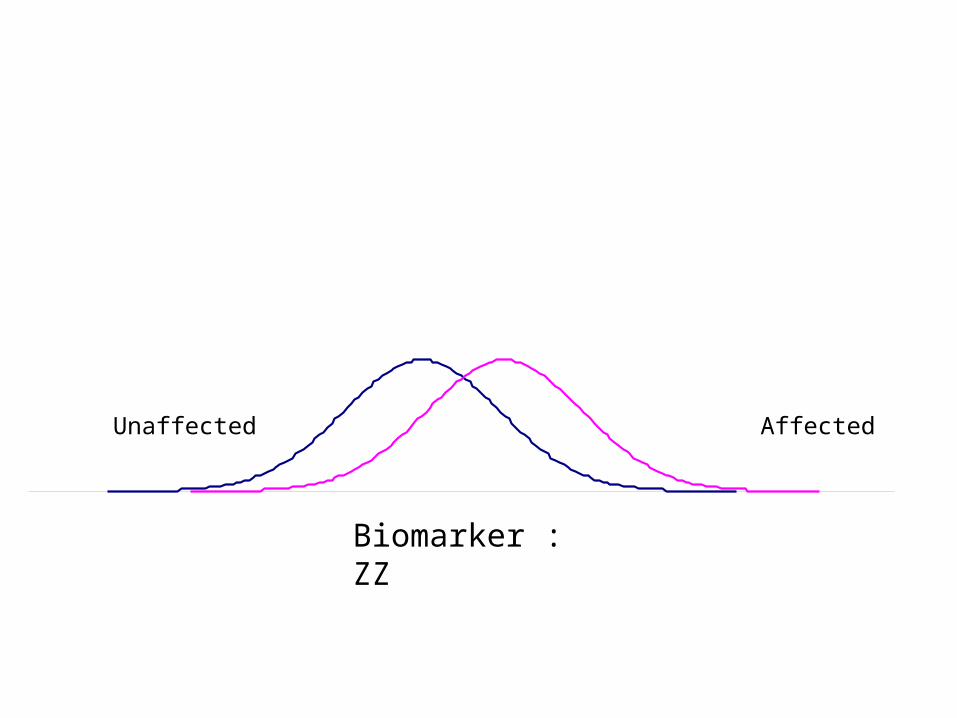
AffectedUnaffected
Biomarker : ZZ
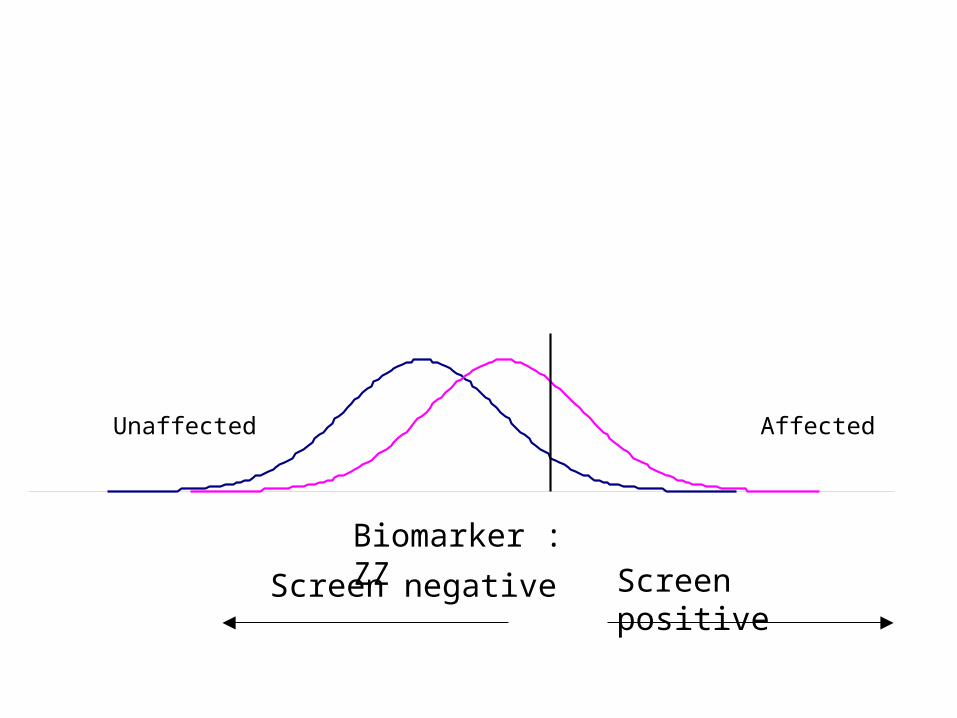
AffectedUnaffected
Screen negative Screen positive
Biomarker : ZZ
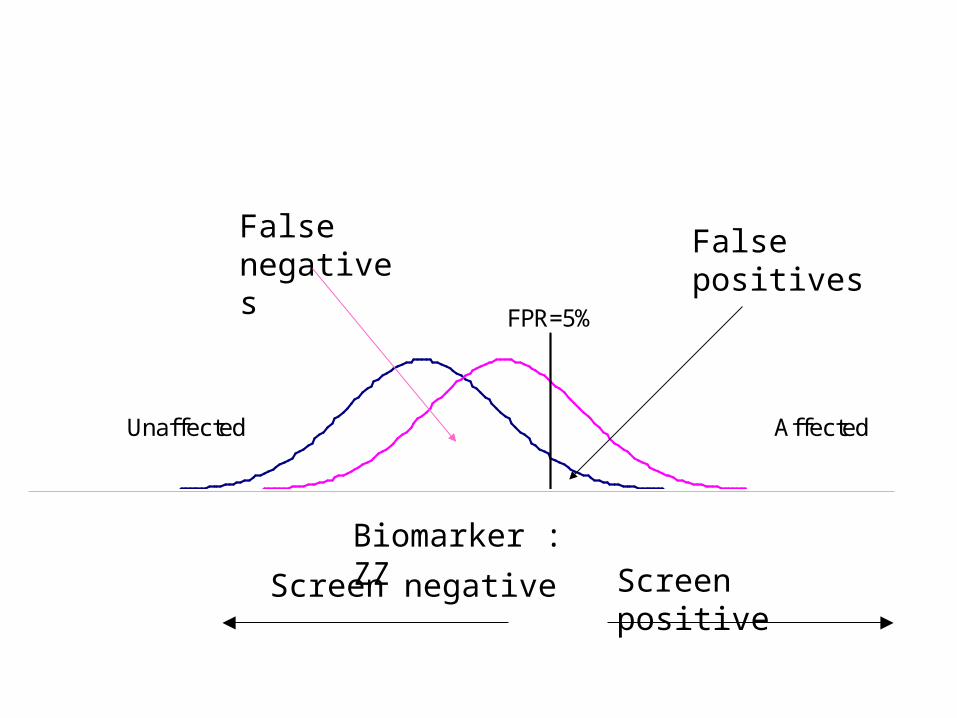
Affected
FPR=5%
Unaffected
Screen negative Screen positive
Biomarker : ZZ
False positives
False negatives
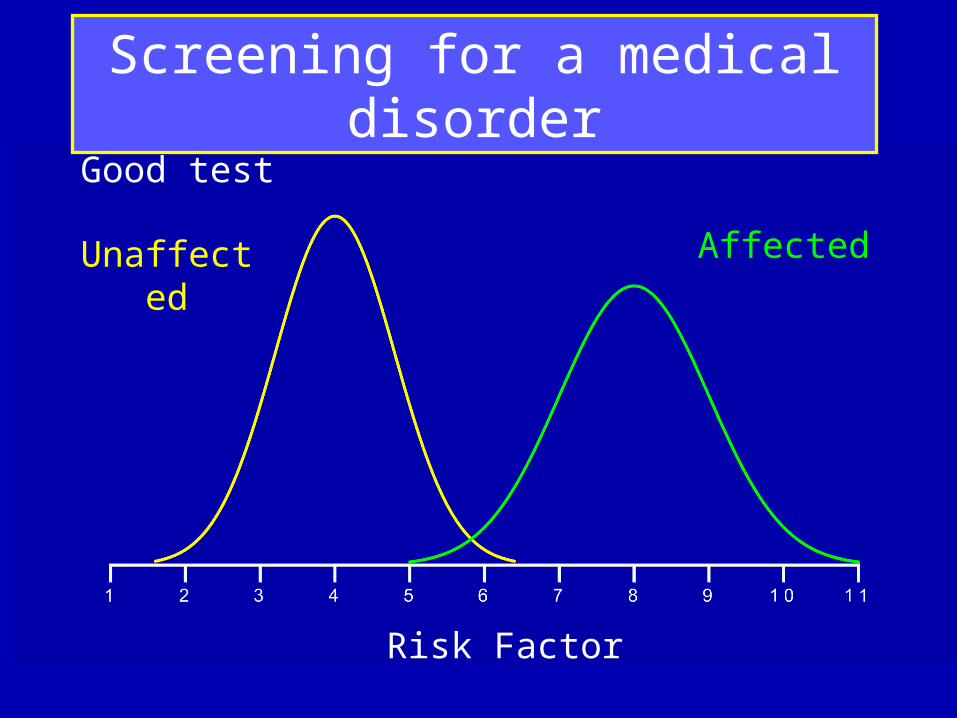
Risk Factor
Unaffected Affected
Good test
Screening for a medical disorder
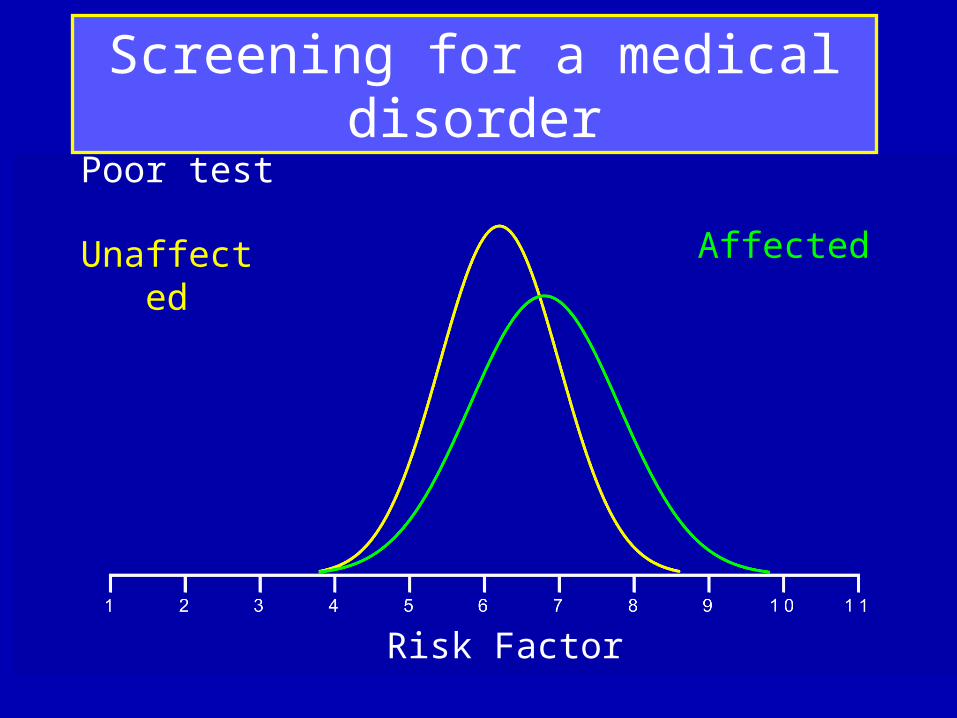
Risk Factor
Unaffected Affected
Poor test
Screening for a medical disorder
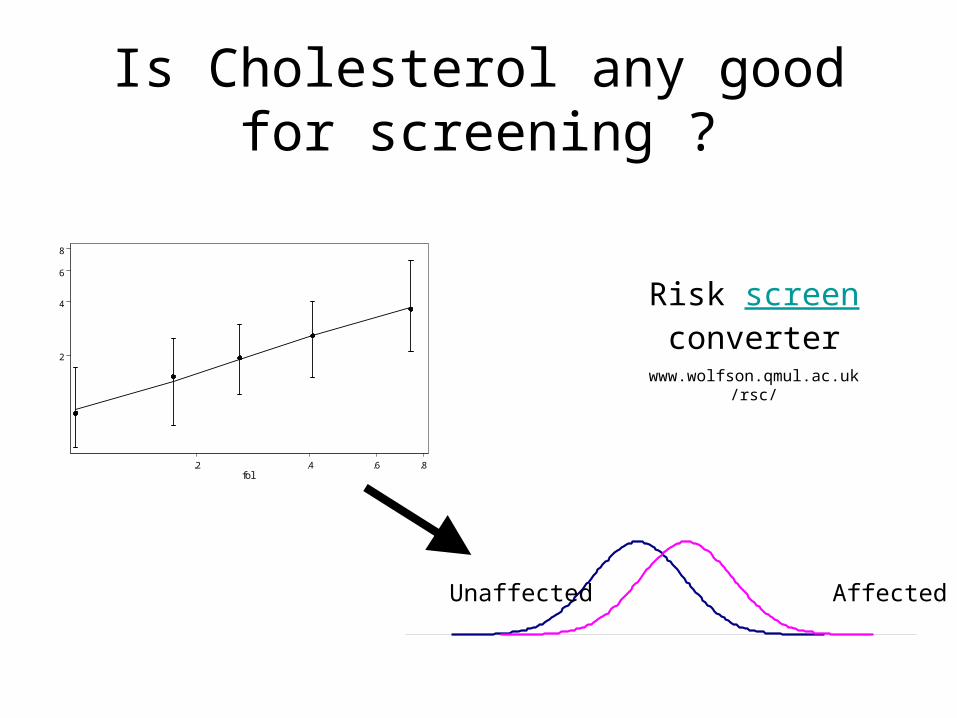
Is Cholesterol any good for screening ?
2
4
6
8
.2 .4 .6 .8fol
AffectedUnaffected
Risk screen converter
www.wolfson.qmul.ac.uk/rsc/
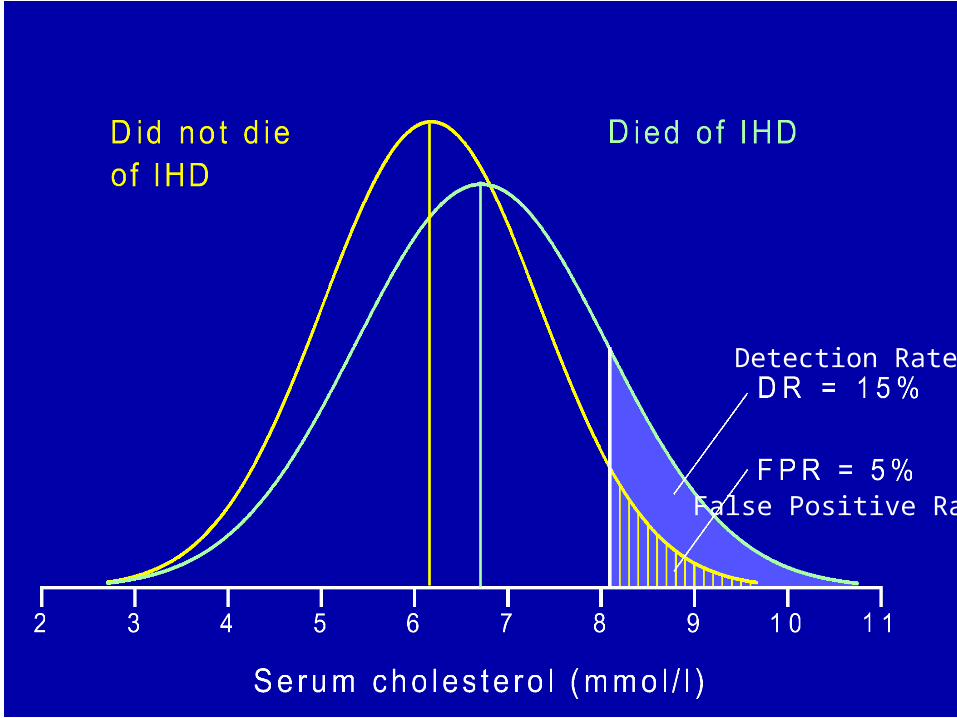
Detection Rate
False Positive Rate
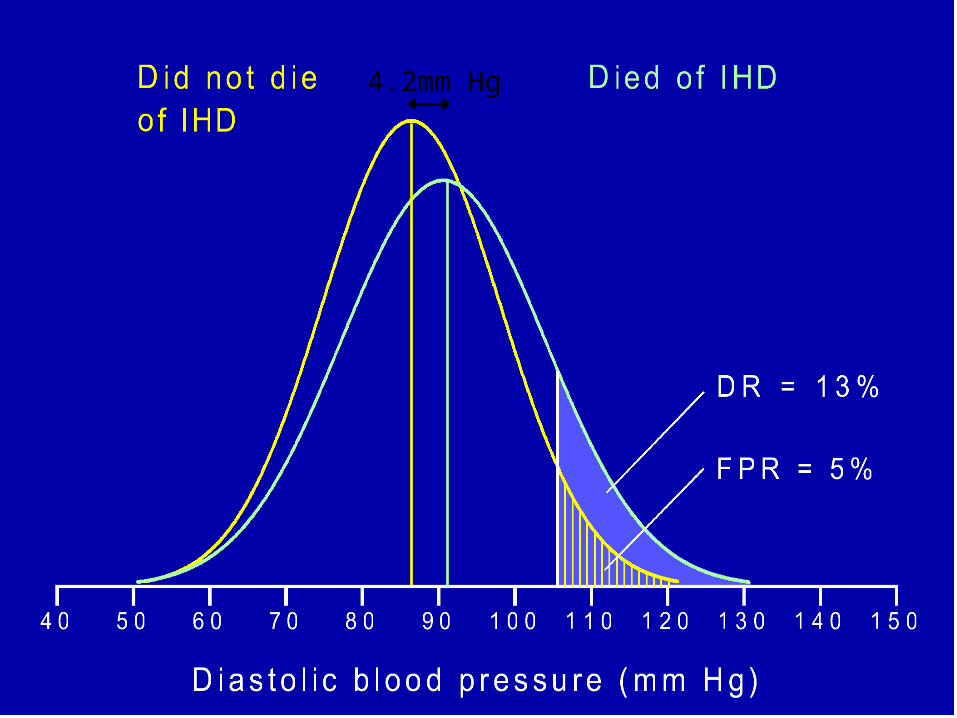
4.2mm Hg
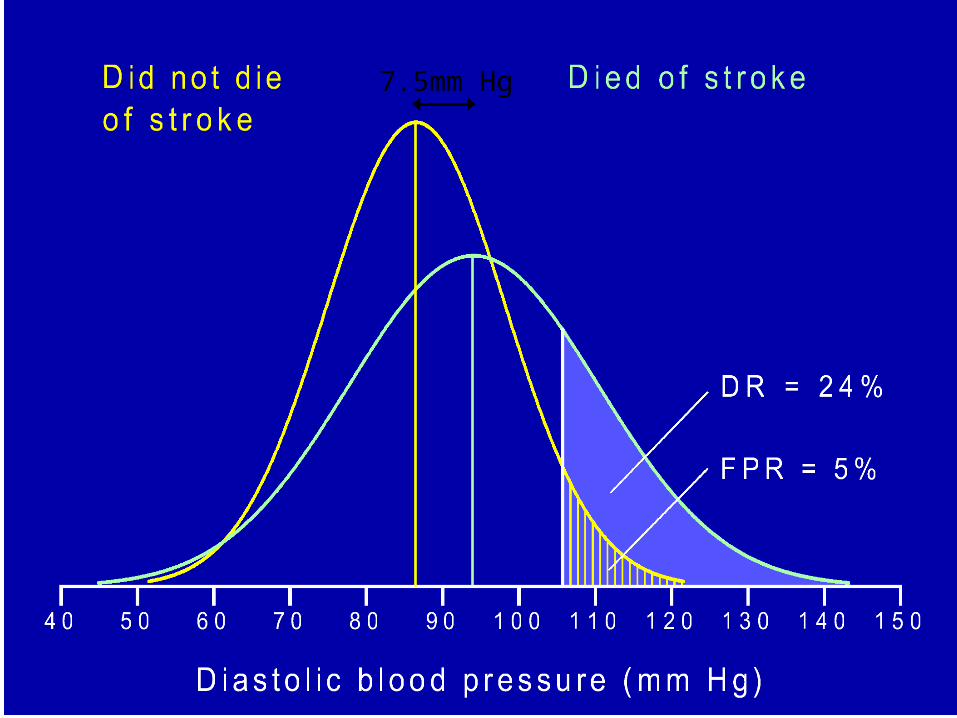
7.5mm Hg
• Are there any good screening tests ?
Antenatal screening for Down’s syndrome
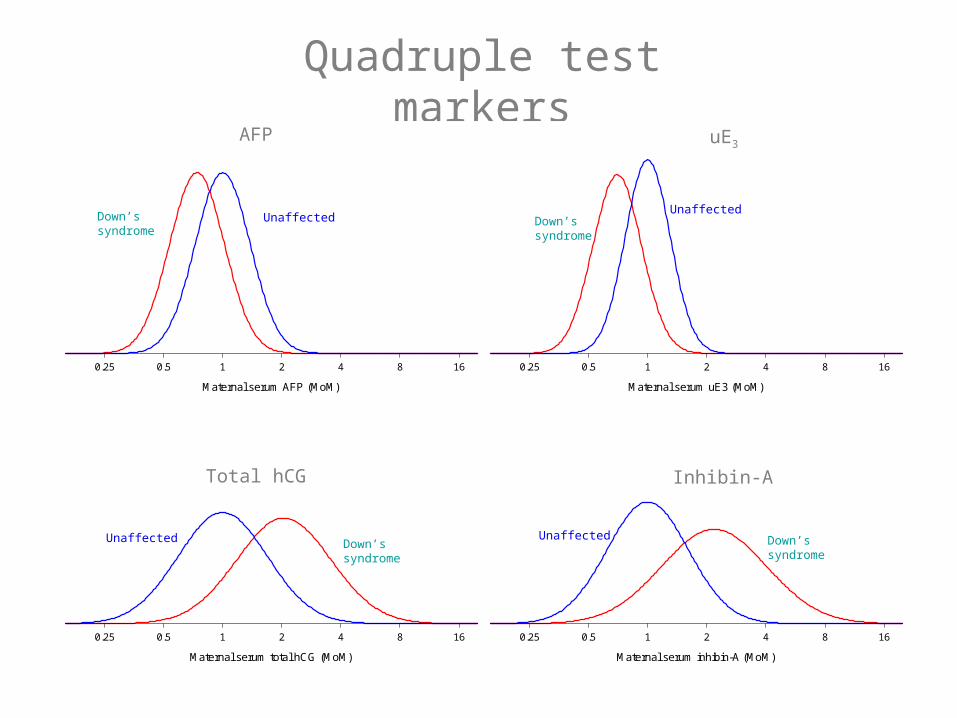
Quadruple test markers
0.25 0.5 1 2 4 8 16
Maternal serum total hCG (MoM)
0.25 0.5 1 2 4 8 16
Maternal serum inhibin-A (MoM)
Total hCG Inhibin-A
0.25 0.5 1 2 4 8 16
Maternal serum AFP (MoM)
0.25 0.5 1 2 4 8 16
Maternal serum uE3 (MoM)
AFP uE3
Down’s syndrome
Unaffected Down’s syndrome
Unaffected
Down’s syndrome
Down’s syndrome
Unaffected Unaffected
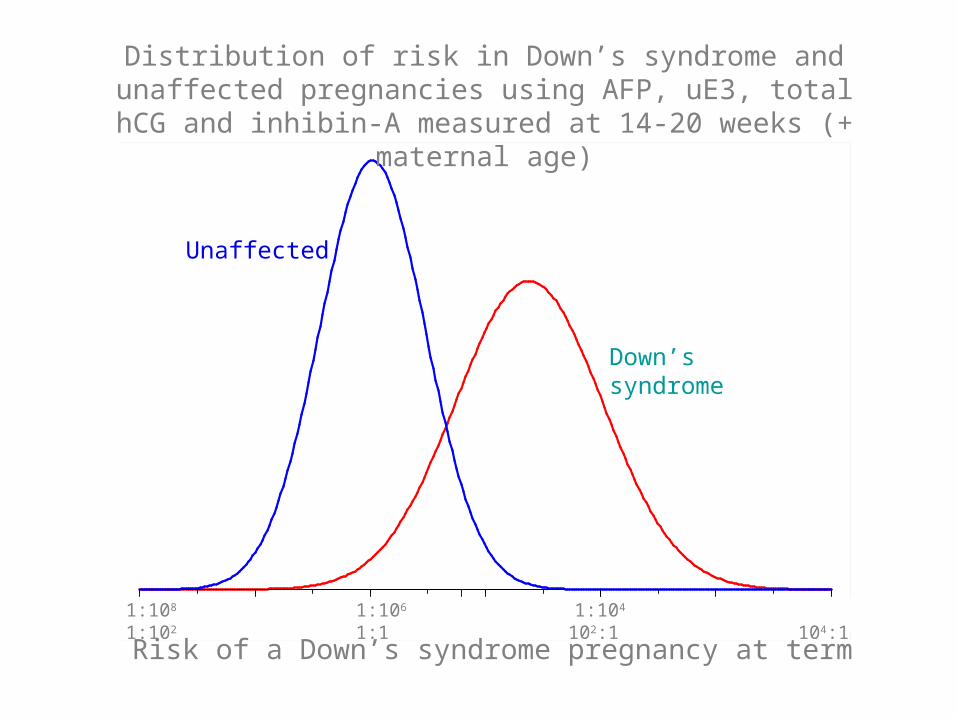
01:108 1:106 1:104 1:102 1:1 102:1 104:1
Down’s syndrome
Unaffected
Distribution of risk in Down’s syndrome and unaffected pregnancies using AFP, uE3, total hCG and inhibin-A
measured at 14-20 weeks (+ maternal age)
Risk of a Down’s syndrome pregnancy at term
Recent Developments
• Collection
• Analysis
• Interpretation or explanation
• Presentation
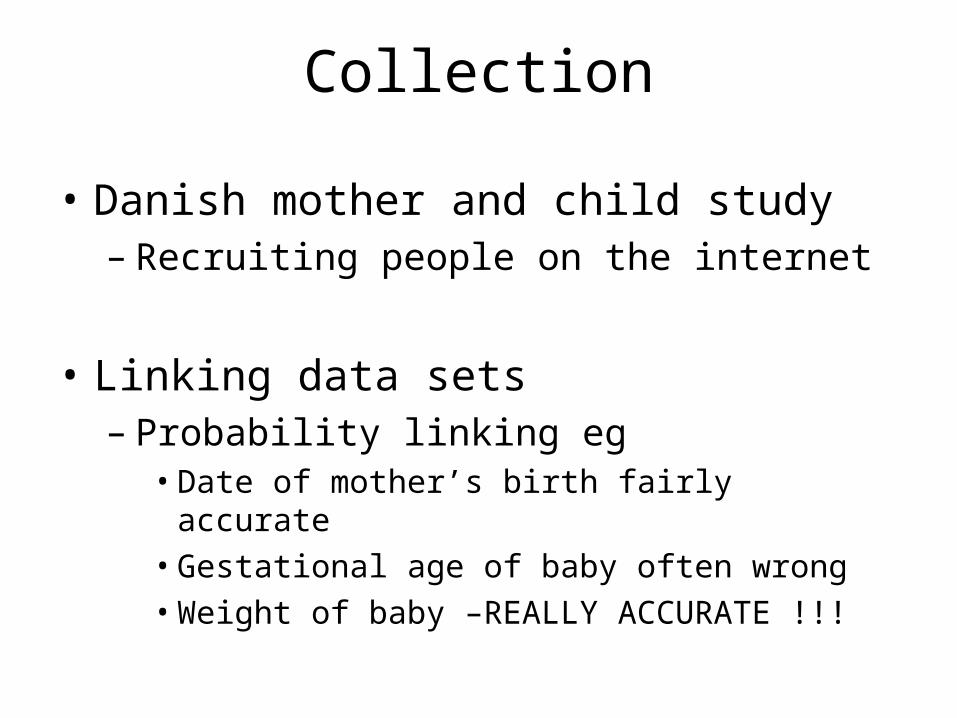
Collection
• Danish mother and child study – Recruiting people on the internet
• Linking data sets– Probability linking eg
• Date of mother’s birth fairly accurate• Gestational age of baby often wrong• Weight of baby –REALLY ACCURATE !!!
Analysis
• Meta-analysis
• Monte-carlo simulations
• Bayesian analysis
• Analysis of micro-arrays
Several studies looking at the same thing
• Each study may be relatively inconclusive because of too much uncertainty (too small)
• Statistical (mathematical) method of combining and presenting results from several studies
• Can indicate more robust results
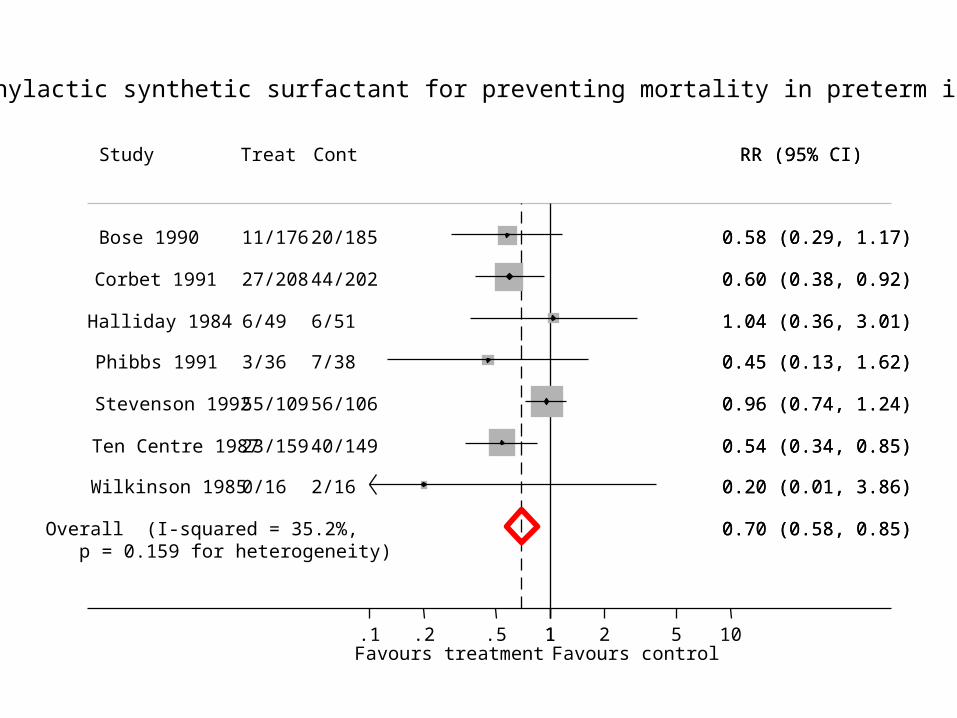
Overall (I-squared = 35.2%, p = 0.159 for heterogeneity)
Phibbs 1991
Corbet 1991
Halliday 1984
Study
Stevenson 1992
Ten Centre 1987
Bose 1990
Wilkinson 1985
3/36
27/208
6/49
Treat
55/109
23/159
11/176
0/16
7/38
44/202
6/51
Cont
56/106
40/149
20/185
2/16
0.70 (0.58, 0.85)
0.45 (0.13, 1.62)
0.60 (0.38, 0.92)
1.04 (0.36, 3.01)
RR (95% CI)
0.96 (0.74, 1.24)
0.54 (0.34, 0.85)
0.58 (0.29, 1.17)
0.20 (0.01, 3.86)
0.70 (0.58, 0.85)
0.45 (0.13, 1.62)
0.60 (0.38, 0.92)
1.04 (0.36, 3.01)
RR (95% CI)
0.96 (0.74, 1.24)
0.54 (0.34, 0.85)
0.58 (0.29, 1.17)
0.20 (0.01, 3.86)
Favours treatment Favours control 1.1 .2 .5 1 2 5 10
Prophylactic synthetic surfactant for preventing mortality in preterm infants

Comparing institutions, individual doctors and identifying outliers
• What’s the problem?– Lots of variables important– Random variation– Random variation greater for smaller units or
institutions
• Way of presenting the values for units so that this is taken into account
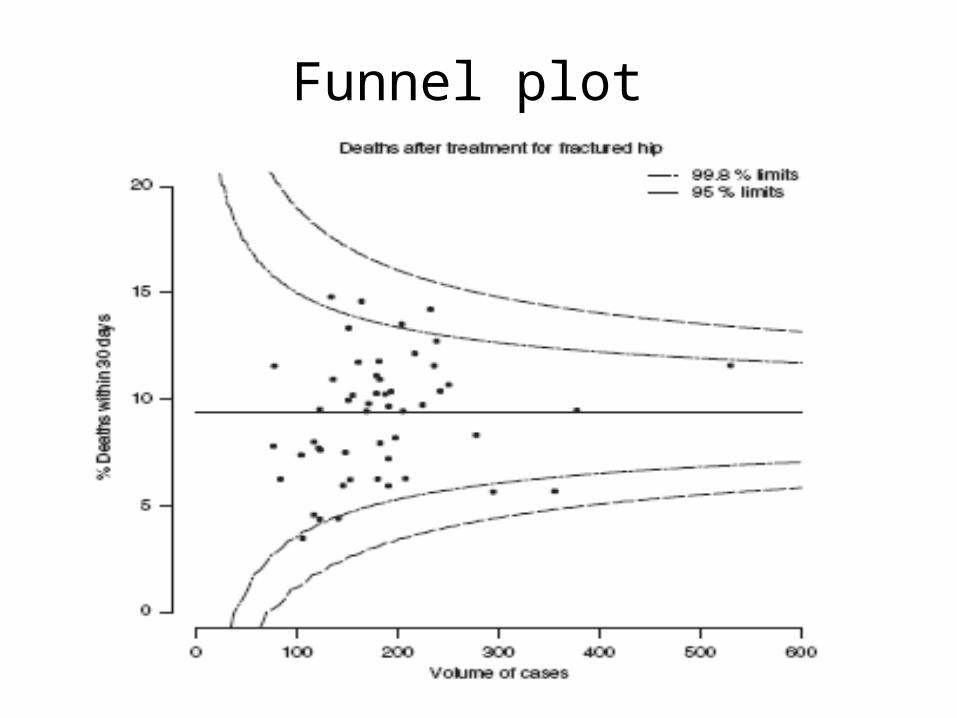
Funnel plot
Conclusion
• As much about collection, interpretation and presentation as calculation
• Making sense out of uncertainty