golightly, r. t., t. f. penland, w. j. zielinski, and j. m. higley. 2006
TRANSCRIPT

Fisher Diet in the Klamath/North Coast Bioregion
By
Richard T. Golightly, Talitha F. Penland, William J. Zielinski, and J. Mark Higley.
FINAL REPORT TO
U.S. Fish and Wildlife Service Contract #113334J025 and
Scotia Pacific Contract # 8355
SUBMITTED BY
Humboldt State Sponsored Programs Foundation Arcata, California 95521
Principal Investigator: Richard T. Golightly
June 2006
Suggested citation: Golightly, R. T., T. F. Penland, W. J. Zielinski, and J. M. Higley. 2006. Fisher diet in the Klamath/North Coast Bioregion. Unpublished report, Department of Wildlife, Humboldt State University, Arcata, California.

Golightly et al. 2006 2
Abstract: We characterized the diet of fisher in the Klamath/North Coast Bioregion of
northern California by collecting 388 fecal remains at four distinct study areas within the
Klamath Bioregion and analyzing differences between the warmer and drier interior sites
and the marine influenced coastal sites. Mammals, especially Sciuridae, were the most
frequent food items (98.0% and 26.8% frequency of occurrence, respectively), which
differed from previous reports of fisher diet from outside of California. Also, unlike
fishers in other parts of their range, reptiles (24.5%), amphibians (2.1%) and insects
(55.2%) were found in the diet. The diet was relatively diverse compared to other fisher
diet studies, both within California and elsewhere in their continental range. Interior
areas had more use of lizards, members of the family Talpidae, and deer (probably from
carrion). On coastal sites, tree squirrels were used less, but woodrats (Neotoma sp.) were
used more. Foodstuffs varied with season at interior sites, which was coincidental with
more extreme weather change between seasons. Coastal areas had the greatest overall
diversity. Fisher in the Klamath/North Coast Bioregion, and probably elsewhere in
California, did not extensively use porcupines or members of the Leporidae family as
reported elsewhere in their continental range. Fishers in the Klamath/North Coast
Bioregion appeared to forage opportunistically, but mostly used prey within an optimal
body-size range (woodrats and tree-squirrels). This body size selection probably resulted
from the inability to make prolonged use of larger prey items and the inefficient energetic
acquisition associated with smaller prey.
Dietary issues may influence wildlife management decisions. Consideration of
fisher reintroductions into regions where they have been extirpated may have an affect on

Golightly et al. 2006 3
other medium to small body-sized carnivores. Further, forest management practices,
such as wildfire and fuels reduction, or vegetative changes at stand or landscape scales
may impact prey populations, and consequently produce changes in fisher populations.

Golightly et al. 2006 4
Introduction
The quality of habitat and subsequent population effects on fishers is in part
dependent on adequate food resources (Bulmer 1975, Powell and Zielinski 1994,
Bowman et al. 2006). Fishers in the western United Sates are missing from former
portions of their range, especially in California and the Pacific Northwest (Zielinski et al.
1995, Aubry and Lewis 2003). In 2004, fishers in the 3 west-coast states were identified
as potentially needing protection provided by the Federal Endangered Species Act (see
Federal Register 69 FR 18770). Strategies to conserve fishers require knowledge of diet
and nutrition as a part of habitat assessment and protection.
Fishers have been described as generalist predators (Powell 1981, Zielinski et al.
1999, Bowman et al. 2006), yet they have also been specifically associated with
snowshoe hare (Lepus americanus; Bulmer 1975, Powell 1981, Kuehn 1989) and
porcupine as prey (Erethizon dorsatum; Schoonmaker 1938, Powell 1981, Arthur et al.
1989). Bowman et al. (2006) reported a positive numerical response of fisher populations
to these two prey items, but noted that alternative prey may have been important in years
when hare populations were reduced. Fishers may be true generalists (eat everything
they encounter) or simply have the ability to subsist by switching prey when primary or
desirable food sources are not abundant. Implicit in prey switching is that the nutritional
returns are better for some prey types (Powell 1979), consequently we would predict
population level responses to availability of these more profitable prey items (see Bulmer
1975, Křivan and Sikder 1999). Thus it is important to distinguish between being a true-
generalist and switching from favored prey.

Golightly et al. 2006 5
Season may be expected to influence predation patterns. Prey use may differ
between seasons with seasonal variations in prey availability, changing capture effort, or
changes in energy demand of fishers. Many studies (Arthur et al. 1989, Kuehn 1989) of
diet have not had adequate samples to investigate seasonal effects, while others (Zielinski
et al. 1999) have made some seasonal inferences.
Fisher diet in the southern Sierra Nevada Mountains of California differed from
fishers elsewhere in their continental range (Zielinski et al. 1999). The southern Sierra
Nevada are at the most southern extent of the fisher’s range. Diet in California should be
expected to differ given that prey availability, prey distribution, weather and habitat also
differ. Although still near the southern extent of the fisher’s range, our study areas in
northwestern California are approximately 600 km north of the southern Sierra Nevada
(where Zielinski et al. [1999] studied diet) and represents a different ecological region
(see Mayer and Laudenslayer 1988).
Habitat use by fishers in northwestern California differed with distance from the
ocean (up to 150 km; Beyer and Golightly 1996, Dark 1997) and potential prey may also
vary coincidentally with habitat changes. We had an opportunity to assess diet
coincidental with 4 spatially explicit studies of fisher habitat in northwestern California.
By using 4 separate sites within the same eco-region and at different distances from the
coast, we examined variation in diet at a very fine scale within the region, but could also
amalgamate our samples for a courser scale than most studies at a single site. We divided
the eco-region into two areas that differed in habitat characteristics: one subject to marine
influence and a second more mesic area inland from the coast (hereafter interior).
Combined with the previous work of Zielinski et al.(1999) this regional scale comparison

Golightly et al. 2006 6
may be useful for understanding the influence of prey on the absence of fishers where
they previously existed (Grinell et al. 1937, Zielinski et al. 1995), and to evaluate
management actions to return fishers to these areas (see Lewis and Hayes 2004).
Although detailed prey availability across the region was not known, the variation in diet
across the sites within the region could also allow inferences as to whether fishers
appeared to forage as opportunistic generalists, prey specialists, foraged consistent with
optimal foraging theory, or a combination of these characteristics.
Methods
Our investigation of fisher diet was conducted at 4 areas within a region of
northwestern California known broadly as the Klamath/North Coast Bioregion (as
defined by the California Biodiversity Council; hereafter Klamath Bioregion). Each of
the four sites was separated by 24 to 70 km from its nearest neighbor site. Fisher fecal
samples were collected from 1992 to 1997 on private timberland near the coast in
Humboldt County (hereafter Green Diamond lands), the Coffee Creek and Castle Crags
areas of Shasta-Trinity National Forest in Shasta and Trinity Counties (hereafter Shasta-
Trinity), the Pilot Creek and Cedar Gap areas of Six Rivers National Forest in Humboldt
and Trinity Counties (hereafter Six Rivers), and the Hoopa Indian Reservation in
Humboldt County. We collected scats between June 1994 and May 1997 at the Shasta-
Trinity study area, between March 1994 and March 1997 at the Hoopa Indian
Reservation, between July 1993 and April 1996 at the Six Rivers study area, and only
during April and May of 1994 and March and May of 1996 on Green Diamond lands.
The Shasta-Trinity site (40º55’N 122º54’W) was furthest from the ocean (110 to
150 km), on lands managed by the U.S. Forest Service and Sierra Pacific Industries.

Golightly et al. 2006 7
Predominant vegetation was conifer forests dominated by Douglas-fir (Pseudotsuga
menziesii) and incense cedar (Libocedrus decurrens), and woodland communities
dominated by oaks (Quercus spp.), big leaf maple (Acer macrophyllum), and gray pine
(Pinus sabiana; Dark 1997). The Trinity Mountains were between this site and the
Pacific Ocean, blocking marine-coastal weather influences. The elevation ranged from
610-1500 m, temperature ranged between -6° C in the winter to 40° C in the summer
(Dark 1997), and annual rainfall varied between 60 – 170 cm (Seglund 1995).
The Six Rivers site (40º39’N 123º46’W) was closer to the ocean, at 69 to 100 km
from the coast. This site ranged in elevation from 600 to 1800 m (Zielinski et al. 2004)
The Six Rivers study area was vegetated by Douglas-fir, white fir (Abies concolor),
Oregon white oak (Quercus garryana), tanoak (Lithocarpus densiflora) and red fir (A.
magnifica) along with some dry grasslands (Zielinski et al. 2004). Temperatures at this
site ranged from -7° in the winter to 41° in the summer, and precipitation ranged from
150-200 cm/year (unpublished data, National Weather Service).
The Hoopa site (41º5’N 123º45’W) was approximately 42 km from the coast and
ranged in elevation from 100-1075 m (Yaeger 2005). Temperature in Hoopa averaged 7°
C in the winter and 21° C in the summer, and yearly average rainfall was 156 cm (Yaeger
2005).
Green Diamond lands (40º50’N 123º40’W) extended from the coast to 30 km
inland and were subject to marine influences (Klug 1997). Coast redwood (Sequoia
sempervirens) and Douglas-fir characterized the vegetation (Klug 1997). Elevation
ranged from near sea level to 1400 m (Klug 1997). Average temperatures ranged
between 8º C in the winter and 15º C in the summer (Klug 1997) and annual rainfall

Golightly et al. 2006 8
averaged 95 cm and 150 cm on the coast and coastal mountains respectively (Thompson
pers. comm.).
Shasta-Trinity and Six Rivers were distant from marine influences and for some
analyses were combined to describe more xeric areas of the Klamath Bioregion. Both
Hoopa and Green Diamond were closer to the coast, more subject to marine influences,
and were combined for some analyses to represent coastal portions of the bioregion.
Fecal remains (hereafter scat) were collected opportunistically at den and rest
sites, at occupied traps coincidental with other studies, or were encountered when
following radio-marked fishers (Table 1). All 4 studies used radio telemetry, which
enhanced our opportunity for finding scats and associating scats with known individual
fishers (e.g. at rest sites). Individual scats were assessed in the field based on shape,
cooberating evidence, and odor for inclusion in analyses. Scats from traps, at capture
sites, rest sites or den sites were not blindly accepted as fisher scat, although their
likelihood as being classified as originating from a fisher was great. Scats were also
reassessed for correct taxon upon arrival in the lab and evaluated consistently by the same
two personnel. Only scat that could reasonably be identified as fisher were included in
the analyses. The scats were stored individually in sealed and labeled plastic bags in a
freezer until they were processed.
Each scat was assigned a unique lab-identification number. Each scat was
weighed (± 0.1 g) and placed into a knee-high nylon stocking into which unique
combinations of colored plastic beads were used as identifying markers. To separate
compacted fecal material, the stockings containing scats were soaked overnight in a
dilute bleach solution (5 ml of bleach / 3 l of water) and then agitated in a mechanical

Golightly et al. 2006 9
Table 1. Fisher fecal remains were collected from five sources within the four study sites in the Klamath Bioregion in northern California.
Site nRest or Den
Site aCapture or Trap Site b
Telemetered Individual c
Road or Path d
Unknown
Shasta-Trinity 148 50 17 24 4 5
Six Rivers 152 61 33 2 0 4
Hoopa 64 25 73 0 0 2
Green Diamond 23 70 30 0 0 0a Scat collected at rest or den sites of known fishers that were radio-marked. Although synchrony between use of the site by the marked fisher and the scat deposition were uncertain, these co-occurred within a period as short as a few hours or as long as a few days.
Source (%)
c Scat was obtained while following individuals with radio transmitters and were usually very fresh. These scat may have been associated with an undetected rest site. d Scat collected on roads or paths within the study area coincidental with searches for fisher with radio-transmitters.
b Scat from inside or on traps visited by fisher, or from sooted track plates coincidental with identified fisher tracks.

Golightly et al. 2006 10
washing machine for approximately 10 min (Johnson and Hansen 1977). The washed
contents of each stocking were placed into aluminum pie tins and oven-dried at 70° C for
24 hours in a gravity convection oven (Precision Scientific Inc., Chicago Illinois). After
oven drying, the samples were stored in glass desiccators until analyzed. Beginning with
large items, the contents of the washed and dried scats were sorted into categories (e.g.,
bones, hair, and plant material). Using a dissecting microscope (Baush and Lomb
Stereozoom 5; 0.8x-4x magnification), the remaining material was searched for a
maximum of two hours to remove smaller fragments that could be categorized (Southern
and Watson 1941, Golightly et al. 1994). All categorized items, as well as items that
were not initially identifiable, were stored in airtight glass vials, labeled and reserved for
later identification.
Identification of Fecal Contents
Items removed from scats were identified using reference collections at the
Humboldt State University (Arcata, California) Vertebrate and Wildlife Museums.
Additionally, we had local collections of skeletons, seeds, hair, and feather samples
gathered from within the study areas. Reference carcasses were cleaned in total with
dermestid beetles (Dermestes sp.). Reference texts (Hall and Kelson 1959, Ingles 1965,
Stebbins 1966, Borror and White 1970, Goin et al. 1978, Milne and Milne 1980, Proctor
and Lynch 1993) and identification keys (Mayer 1952, Day 1966, Adorjan and
Kolenosky 1969, Brunner and Coman 1974, Moore et al. 1974, Schopmeyer 1974,
Hickman 1993) were used to confirm identification. With the exception of mammalian
hair, a dissecting microscope was sufficient to aid in the identification of items removed
from scats.

Golightly et al. 2006 11
In addition to macroscopic characteristics (e.g., length, color, overall shape),
positive identification of mammalian hair often required the examination of a hair’s
microscopic features. These features included the hair core or medulla and the outer
sheath of scales comprising the cuticle (Mayer 1952, Day 1966, Adorjan and
Kolenosky1969, Moore 1974). To observe patterns formed by cuticular scales, we used
clear fingernail polish applied to 50-mm cover slips to make an impression of the hair’s
surface. First, a single coat of polish was allowed to dry at room temperature until no
longer “tacky” when touched. A sample of hair removed from a scat was then placed on
the polished surface of the cover slip. Turning the cover slip over so that the polished
surface was in contact with the top of the microscope slide and examining it under a
compound microscope yielded a positive impression of the hair’s cuticular scale pattern.
Impressions made from hairs found in scats were compared to a collection of impressions
we made using the same technique from known specimens and photographs and keys in
Mayer (1952), Adjoran and Kolenosky (1969), and Moore (1974).
Mammals were identified primarily by the presence of bone, hair, and teeth. As
investigators gained knowledge of identified parts and digits with associated nails,
mammalian nails could be distinguished from bird feet. Birds were identified primarily
by the presence of feather and bone and, to a lesser extent, by toes and skin from the foot
region. When eggshell was encountered in a scat, it was included as a single category.
Reptiles and amphibians were primarily identified by the presence of bones, teeth, and/or
scales. Vertebrae were used to distinguish between reptile and amphibian when scales
were not also present in a scat. Both scales and vertebrae were used to distinguish
between lizard and snake. Intact lizard feet or toes were also commonly encountered.

Golightly et al. 2006 12
Insects and other arthropods were identified from undigested exoskeleton. Mollusks
(Gastropoda) were identified from the presence of a spiral shell, which was readily
distinguishable from that of avian eggshell. Identifiable plant material encountered in
scats was separated into two categories: seed and vegetative material. Whenever
possible, all items found in scats were identified to species.
Analyses
Species-level identification was not always possible. We amalgamated counts of
all identifiable material at each taxonomic level. For example, a scat containing a tree
squirrel identified to species would be included in the count of scats contributing to the
appropriate species, family, order, and class. Consequently, sample sizes of scats for
identified items would be larger at higher levels of taxonomy. For each identified species
or taxonomic level, we counted all scats containing the item and reported frequency of
occurrence. Frequency of occurrence was reported as a percentage (number of scats
containing a food item divided by the total number of available scats in the sample strata
and then multiplied by 100).
Statistical analyses were conducted between study sites and seasons, but not
between consumed taxa. Cross-taxa comparisons were not possible due to problems with
differential digestibility, variation in body parts consumed, and animal mass (Lockie
1959, Golightly et al. 1994). Further, not all taxa or taxonomic levels had adequate
counts to allow statistical analysis. Using counts of scats, we used Chi-square to compare
between seasons or sites (expected values were adjusted to reflect the appropriate number
of available scats within a site or season for all categories, but not for categories with
empty cells). Chi-square was used to compare between coastal and interior areas for

Golightly et al. 2006 13
selected prey. We also ranked taxa at similar levels to identify most frequently used
foods. We chose the 4 most frequently observed families to characterize each site. When
we ranked families to determine the 4 most frequently used, we excluded insects and
plant material and required the item be among the 4 most frequent taxa in at least 3 of the
sites. Finally, we graphically plotted prey use in the families Leporidae (hereafter
leporid), Canidae (hereafter canid), and Mustelidae (hereafter mustelid) across season and
site in order to compare these items to important foods elsewhere in the range of the
fisher, or because of special management considerations regarding these taxa. Seasons
were defined as spring for 21 March - 20 June, as summer for 21 June - 20 September, as
autumn for 21 September - 20 December, and as winter for 21 December - 20 March.
For comparison of diet diversity to the southern Sierra Nevada we computed a
niche-breadth index (Levins index; Colwell and Futuyma 1971). Zielinski and Duncan
(2004) provided their raw data so that we could recalculate their estimates of Levins
index using criteria and assumptions consistent with our investigation. Calculations were
based on the number of occurrences of each food item (Serafini and Lovari 1993). One
difference between the data from the southern Sierra Nevada and our investigation was
the older classification of Cricetidae used in Zielinski et al. (1999). We restructured their
classifications within Muridae and ensured that occurrences were not double counted in
any case. Additionally, we removed items in the scats that were probably incidentally
ingested (vegetation associated with Pinaceae). Finally we provided separate calculations
of niche breadth when all vegetative matter was removed from the calculations.

Golightly et al. 2006 14
Results
Of the 388 fisher scats examined, 39% came from the Shasta-Trinity area, 39%
were from Six Rivers, 17% were from the Hoopa Indian Reservation and 6% were from
Green Diamond lands. The four most common classes of animal matter found in the
scats were Mammalia (hereafter mammal), Aves (hereafter bird), Reptilia (hereafter
reptile), and Insecta (hereafter insect). Of these four, remains of mammals and insects
were more consistently found in scats throughout all seasons at all sites than were
remains of reptiles and birds (Figure 1). Mammals were present in 88-98% of all scats at
all sites (Table 2). Vegetation, especially the family Pinaceae (Table 2), was common at
all sites.
The four families that we used for comparisons between seasons and between
sites (determined by ranking of food items; Appendix A) were Sciuridae (hereafter
sciurids), Cervidae (hereafter cervids), Muridae (hereafter murids), and Talpidae
(hereafter talpids) (Figure 2). Family frequencies were less than class frequencies due to
fewer identifications to family than to class (Table 2). Leporids, canids, and mustelids
were less consistently found in scats at all sites during all seasons than the 4 highest
ranked families (Figure 3). Leporids were consumed at all sites during the spring, and
only scats from Six River contained small amounts of leporids in all seasons. Canids and
mustelids were found in scats from the Shasta-Trinity, Six Rivers and Hoopa study areas.
The Shasta-Trinity study area had the greatest number of significant differences in
diet across seasons for class and family (Table 3). Birds, reptiles and insects were
consumed at significantly different frequencies between seasons at Shasta-Trinity, but

Golightly et al. 2006 15
Mammals
020406080
100
Shasta-Trinity Six Rivers Hoopa Green
Freq
uenc
y (%
) . Winter
Spring
Summer
Autumn
Diamond
Birds
020406080
100
Shasta-Trinity Six Rivers Hoopa Green
Freq
uenc
y (%
) .
Reptiles
0
20
40
60
80
100
Shasta-Trinity Six Rivers Hoopa Green
Freq
uenc
y (%
) .
Diamond
Diamond
Insects
0
20
40
60
80
100
Shasta-Trinity Six Rivers Hoopa GreenStudy sites
Freq
uenc
y (%
) .
Diamond
Figure 1. Relative frequency of major taxonomic groups in the diet of fisher from 4 study areas in the Klamath Bioregion of northern California varied across study sites. Mammals were consistently important in the diet across season and site. Only spring data was collected at the Green Diamond study area.

G
olightly
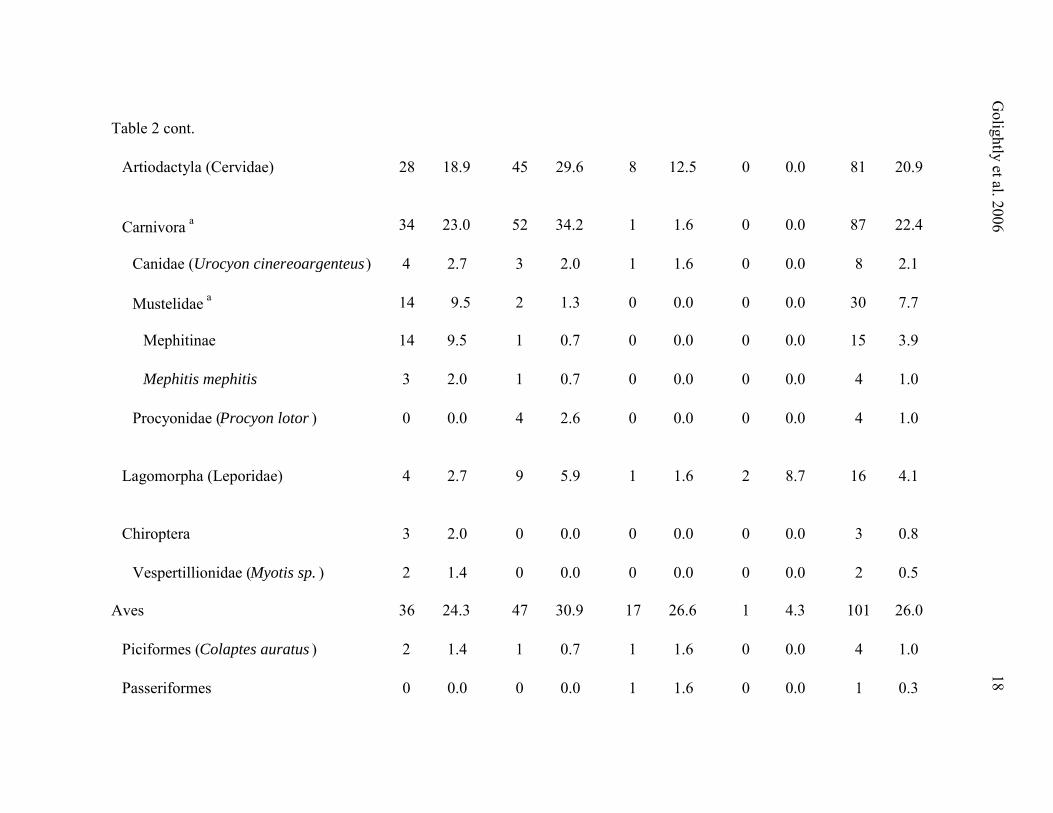
Table 2. Components of fecal remains were identified to the lowest taxonomic group possible. The total number of scats that contained the taxonomic group and the frequency of this taxonomic group were calculated for each study area. The frequency was calculated by taking the number of scats (n) containing the taxonomic component in each study area and dividing it by the total number of scats within that study area.
et al. 2006
16
n % n % n % n % n %
Mammalia 131 88.5 149 98.0 59 92.2 22 95.7 361 93.0
Rodentia 61 41.2 83 54.6 33 51.6 16 69.6 193 49.7
Sciuridae 42 28.4 43 28.3 12 18.8 7 30.4 104 26.8
Sciurinae 35 23.6 39 25.7 10 15.6 1 4.3 85 21.9
Sciurus griseus 12 8.1 5 3.3 1 1.6 1 4.3 19 4.9
Tamiasciurus douglasii 1 0.7 6 3.9 6 9.4 0 0.0 13 3.4
Eutamias sp. 20 13.5 21 13.8 3 4.7 0 0.0 44 11.3
Spermophilus sp. 3 2.0 1 0.7 0 0.0 0 0.0 4 1.0
Pteromyinae (Glaucomys sabrinus ) 5 3.4 5 3.3 2 3.1 4 17.4 16 4.1
(n=148)
Green Diamond (n=23) (n=64) ( n=152)
Taxa
Total(n=388)
Shasta-Trinity Six Rivers Hoopa

G
olightly et al. 2006
17
Table 2 cont.
Muridae 15 10.1 36 23.7 17 26.6 10 43.5 78 20.1
Sigmodontinae 7 4.7 6 3.9 11 17.2 7 30.4 31 8.0
Peromyscus sp. 4 2.7 1 0.7 6 9.4 0 0.0 11 2.8
Neotoma sp. 2 1.4 4 2.6 7 10.9 7 30.4 20 5.2
Arvicolinae 3 2.0 23 15.1 6 9.4 4 17.4 36 9.3
Clethrionomys sp. 1 0.7 0 0.0 1 1.6 0 0.0 2 0.5
Microtus sp. 2 1.4 5 3.3 4 6.3 2 8.7 13 3.4
Arborimus sp. 0 0.0 14 9.2 1 1.6 0 0.0 15 3.9
Geomyidae (Thomomys sp .) 1 0.7 4 2.6 0 0.0 0 0.0 5 1.3
Insectivora 38 25.7 31 20.4 6 9.4 6 26.1 81 20.9
Talpidae 36 24.3 31 20.4 4 6.3 6 26.1 77 19.8
Scapanus sp. 28 18.9 22 14.5 3 4.7 4 17.4 57 14.7
Neurotrichus gibbsii 11 7.4 8 5.3 1 1.6 2 8.7 22 5.7
Soricidae (Sorex sp.) 4 2.7 0 0.0 2 3.1 0 0.0 6 1.5
G
olightly et al. 2006
18
Table 2 cont.
Artiodactyla (Cervidae) 28 18.9 45 29.6 8 12.5 0 0.0 81 20.9
Carnivora a 34 23.0 52 34.2 1 1.6 0 0.0 87 22.4
Canidae ( Urocyon cinereoargenteus ) 4 2.7 3 2.0 1 1.6 0 0.0 8 2.1
Mustelidae a 14 9.5 2 1.3 0 0.0 0 0.0 30 7.7
Mephitinae 14 9.5 1 0.7 0 0.0 0 0.0 15 3.9
Mephitis mephitis 3 2.0 1 0.7 0 0.0 0 0.0 4 1.0
Procyonidae ( Procyon lotor ) 0 0.0 4 2.6 0 0.0 0 0.0 4 1.0
Lagomorpha (Leporidae) 4 2.7 9 5.9 1 1.6 2 8.7 16 4.1
Chiroptera 3 2.0 0 0.0 0 0.0 0 0.0 3 0.8
Vespertillionidae ( Myotis sp. ) 2 1.4 0 0.0 0 0.0 0 0.0 2 0.5
Aves 36 24.3 47 30.9 17 26.6 1 4.3 101 26.0
Piciformes ( Colaptes auratus ) 2 1.4 1 0.7 1 1.6 0 0.0 4 1.0
Passeriformes 0 0.0 0 0.0 1 1.6 0 0.0 1 0.3

G
olightly et al. 2006
19
Table 2 cont.
Reptilia 53 35.8 30 19.7 6 9.4 6 26.1 95 24.5
Squamata 52 35.1 30 19.7 6 9.4 6 26.1 94 24.2
Sauria 30 20.3 21 13.8 3 4.7 2 8.7 56 14.4
Serpentes 5 3.4 4 2.6 1 1.6 4 17.4 14 3.6
Amphibia (Caudata) 2 1.4 2 1.3 3 4.7 1 4.3 8 2.1
Unknown Vertebrate 7 4.7 21 13.8 10 15.6 2 8.7 40 10.3
Insecta 97 65.5 82 53.9 26 40.6 9 39.1 214 55.2
Hymenoptera 64 43.2 54 35.5 10 15.6 0 0.0 128 33.0
Vespidae (Vespula sp. ) 29 19.6 31 20.4 4 6.3 0 0.0 64 16.5
Formicidae 46 31.1 24 15.8 4 6.3 0 0.0 74 19.1

G
olightly et al. 2006
20
Table 2 cont.
Orthoptera 13 8.8 6 3.9 0 0.0 0 0.0 19 4.9
Gryllacrididae (Stenopelmatus fuscus ) 11 7.4 1 0.7 0 0.0 0 0.0 12 3.1
Acrididae 1 0.7 5 3.3 0 0.0 0 0.0 6 1.5
Coleoptera 38 25.7 23 15.1 17 26.6 3 13.0 81 20.9
Mallophaga 1 0.7 3 2.0 0 0.0 0 0.0 4 1.0
Diptera 0 0.0 0 0.0 0 0.0 1 4.3 1 0.3
Other Invertebrates 3 2.0 7 4.6 3 4.7 4 17.4 17 4.4
Acarina (tick) 1 0.7 2 1.3 3 4.7 2 8.7 8 2.1
Araneida (spider) 1 0.7 1 0.7 0 0.0 0 0.0 2 0.5
(snail) 1 0.7 3 2.0 0 0.0 0 0.0 4 1.0

G
olightly et al. 2006
21
Table 2 cont.
Seed: 26 17.6 51 33.6 51 79.7 3 13.0 131 33.8
Ericaceae 4 2.7 5 3.3 10 15.6 0 0.0 19 4.9
Vaccinium sp. 0 0.0 4 2.6 10 15.6 0 0.0 14 3.6
Arctostaphylus sp. 4 2.7 1 0.7 0 0.0 0 0.0 5 1.3
Rosaceae (Rubus sp. ) 6 4.1 10 6.6 5 7.8 0 0.0 21 5.4
Vitaceae (Vitus sp. ) 0 0.0 0 0.0 2 3.1 0 0.0 2 0.5
Poaceae 0 0.0 0 0.0 0 0.0 1 4.3 1 0.3
Unk. Tiny, oblong seed 9 6.1 0 0.0 20 31.3 2 8.7 31 8.0
Misc. unknown seed 5 3.4 0 0.0 1 1.6 0 0.0 6 1.5
Vegetation (e.g., leaves): 133 89.9 129 84.9 41 64.1 17 73.9 320 82.5
Pinaceae 126 85.1 125 82.2 32 50.0 13 56.5 296 76.3
Cupressaceae 19 12.8 6 3.9 0 0.0 0 0.0 25 6.4
Poaceae 13 8.8 8 5.3 1 1.6 0 0.0 22 5.7

G
olightly
et al. 2006
22
Table 2 cont.
Other Materials:
Eggshell 7 4.7 8 5.3 0 0.0 0 0.0 15 3.9
Rock 64 43.2 34 22.4 30 46.9 1 4.3 129 33.2
Artificial 16 10.8 20 13.2 17 26.6 2 8.7 55 14.2
fragment and teeth from an adult animal). It was assumed that the presence of these remains resulted from one fisher scavenging on the carcassof another fisher.
a Does not include fisher (Martes pennanti ). Fisher guard hairs were often found in fisher scats. It was assumed that their presence in the scatsresulted from the animal grooming itself. Only one scat from the Pilot Creek sample contained identifiable fisher remains other than hair (a lower jaw

Golightly et al. 2006 23
Sciuridae
020406080
100
Winter Spring Summer Autumn
Freq
uenc
y (%
)
.Shasta-Trinity
Six Rivers
Hoopa
Green Diamond
Cervidae
0
20
40
60
80
100
Winter Spring Summer Autumn
Freq
uenc
y (%
)
Muridae
0
20
40
60
80
100
Winter Spring Summer Autumn
Freq
uenc
y (%
) .
Talpidae
0
20
40
60
80
100
Winter Spring Summer Autumn
Freq
uenc
y (%
) .
Figure 2. The four most frequent family l
study areas in the Klamath Bioracross seasons. Only spring dataarea.
Season
evel diet components of fishers from four egion of northern California were compared was collected at the Green Diamond study

Golightly et al. 2006 24
Leporidae
0
20
40
60
80
100
Winter Spring Summer Autumn
Freq
uenc
y (%
) Shasta-TrinitySix RiversHoopaGreen Diamond
Canidae
0
20
40
60
80
100
Winter Spring Summer Autumn
Freq
uenc
y (%
)
Mustelidae
0
20
40
60
80
100
Winter Spring Summer Autumn
Freq
uenc
y (%
)
Season
Figure 3. Three taxonomic groups of low frequency in the diet of fishers in the Klamath
Bioregion were examined because of their significance to management or for comparison to other fisher populations. Only spring data was collected at the Green Diamond study area.

Golightly et al. 2006 25
Table 3. Fisher diet was analyzed seasonally within taxa (chi-square tests) at each of three sites within the Klamath Bioregion in northwestern California. P values ≤ 0.10 are bolded.
χ2 P n χ2 P n χ2 P n
Class
Mammalia 2.58 0.46 126 0.35 0.95 57 0.19 0.98 146
Aves 10.65 0.01 34 a 0.85 0.84 15 8.48 0.01 46 a
Reptilia 9.80 0.02 51 4.02 0.26 5 2.94 0.23 30 a
Insecta 9.01 0.03 92 6.07 0.11 25 3.85 0.28 79
Family
Sciuridae 9.60 0.02 42 0.38 0.94 12 1.62 0.44 42 a
Cervidae 6.85 0.08 28 0.06 0.82 8 b 0.38 0.94 43
Muridae 1.70 0.64 14 0.84 0.84 15 3.87 0.14 35 a
Talpidae 8.76 0.03 35 1.32 0.25 2 b 6.65 0.04 31 a
a Only 3 seasons were analyzed due to zeros in the data set.b Only 2 seasons were analyzed due to zeros in the data set.
Shasta-Trinity Hoopa Six Rivers

Golightly et al. 2006 26
frequency of mammals did not significantly vary between seasons (Table 3). Seasonal
effects were also apparent in the sciurid and talpid frequencies at Shasta-Trinity (Figure
4). The Hoopa site did not have any apparent significant seasonal variations in diet. No
seasonal differences occurred for cervid consumption at any site based on statistical
analyses. However, only autumn and winter seasons could be compared statistically
because zeros were present in the dataset for spring and summer. When considering
seasons that had zeros for cervid presence in scats (spring and summer at Hoopa), it was
apparent that cervids were used more in the autumn and winter seasons (Figure 4).
Mammals were the most consistently used food item at all sites (Figure 1). Birds
were less consistently used. Although found at all sites, birds were used significantly
more at Six Rivers in the spring than at other sites in spring, and tended to be used more
at Hoopa in the autumn. Reptiles were used at all sites, but were most prevalent in spring
and summer, with the greatest use occurring at Shasta-Trinity in spring (Table 4). Insects
were prevalent across sites, but more in the summer and autumn.
Among mammals, there was no difference in the use of sciurids across sites
(Table 4), but the species of sciurid did appear to vary across sites (Table 2). There was a
tendency for greater cervid use at Shasta-Trinity in the summer (Table 3, Figure 4), and
cervids were absent from Hoopa in both spring and summer (Figures 2, 4). Murids were
consumed most on Green Diamond lands, and least at Shasta-Trinity (Table 4, Figure 2).
Talpids tended to be consumed most at Shasta-Trinity in the autumn (Table 4), but were
consumed at all sites in the spring, and were absent from Hoopa in summer (Figure 2).

G
olightly
et al. 2006
27
0
10
20
30
40
50
Spring Summer Autumn Winter
Freq
uenc
y in
Sca
t .
Shasta-TrinitySix RiversHoopa
Sciuridae
0
10
20
30
40
50
Spring Summer Autumn Winter
Freq
uenc
y in
Sca
t
. Muridae
0
10
20
30
40
50
Spring Summer Autumn Winter
Freq
uenc
y in
Sca
t .
Talpidae
0
10
20
30
40
50
Spring Summer Autumn Winter
Freq
uenc
y in
Sca
t
Cervidae
Figure 4. Four selected taxa of fisher prey varied seasonally at 3 sites in the Klamath Bioregion of northern California.

G
olightly
Table 4. Four sites were compared to determine regional differences in fisher diet within each season. Spring comparisons included
the Green Diamond site as well as Six Rivers, Shasta-Trinity, and Hoopa. Summer, autumn and winter seasons included all sites except Green Diamond.
et al. 2006
28
χ 2 P n χ 2 P n χ 2 P n χ 2 P n
Class
Mammalia 0.10 0.99 141 1.98 0.37 86 0.05 0.98 68 0.40 0.82 55
Aves 12.48 0.01 31 0.95 0.62 43 3.62 0.06 11 0.03 0.86 11
Reptilia 8.71 0.03 52 0.07 0.97 27 0.62 0.73 6 3.21 0.07 7
Insecta 1.28 0.73 62 2.58 0.28 78 0.99 0.61 44 1.94 0.38 21
Family
Sciuridae 4.15 0.25 48 1.53 0.47 31 0.68 0.71 16 0.23 0.63 7
Cervidae 2.62 0.11 26 3.33 0.07 20 1.66 0.44 19 1.75 0.42 14
Muridae 9.67 0.02 36 2.39 0.30 13 1.02 0.60 14 1.92 0.17 10
Talpidae 0.69 0.88 47 0.05 0.82 19 5.76 0.06 7 - - -
Spring Summer Autumn Winter

Golightly et al. 2006 29
Table 5. Fisher diet was compared within selected taxa between interior and coastal study areas using chi-square analysis.
χ 2 P
Observed Expected Observed Expected
Mammals 280 280.1 81 80.9 0.001 0.994
Sciurids 85 80.7 19 23.3 1.03 0.310
Sciurinae 74 65.9 11 19.1 4.39 0.036
Cervids 73 62.8 8 18.2 7.33 0.007
Murids 51 60.5 27 17.5 6.67 0.010
Sigmodontinae 13 24.1 18 7.0 22.6 0.001
Neotoma sp. 6 15.5 14 4.5 26.1 0.001
Talpids 67 59.7 10 17.3 3.95 0.047
Birds 83 78.4 18 22.7 1.23 0.267
Reptiles 83 73.7 12 21.3 5.23 0.022
Squamata 82 72.9 12 21.1 5.04 0.025
Sauria 51 43.4 5 12.6 5.87 0.015
Insects 179 166.0 35 48.0 4.53 0.033
Hymenoptera 118 99.3 10 28.7 15.7 0.001
Vespids 60 49.7 4 14.0 9.62 0.002
Formicids 70 57.4 4 16.6 12.3 0.001
Interior Coastal ≤

Golightly et al. 2006 30
When we compared the two coastal sites with the two interior sites, insects and
reptiles were used more than expected (Table 5) at the interior sites and less than
expected at the coastal sites. At more specific levels of taxonomic resolution sciurids
differed between coastal and interior sites. Sciurids were used less than expected at
coastal sites. Cervids and talpids were used more at interior sites. Conversely murids,
and specifically Sigmodontinae and woodrats (Neotoma sp.), were used more than
expected on the coastal sites when compared to interior sites. Among reptiles, Sauria
(lizards) were used more than expected at interior sites. Among insects, Hymenoptera,
Vespidae, and Fomicidae were used more than expected at interior sites.
At interior sites, insects and reptiles were used most in the spring (χ2 = 10.9, p =
0.012; χ 2 = 11.1, p = 0.011; respectively) while birds were used most in summer (χ 2 =
17, p = 0.001). Cervids were used less than expected in the spring (χ 2 = 11.1, p = 0.011).
Sciurids and talpids were used as expected across seasons.
At coastal sites there were no statistically significant differences between
seasons. However, we could not statistically test cervids due to the small sample.
Cervids were absent at coastal sites in the fall and winter, unlike the interior sites.
The recalculated niche breadth (Levins index) for the southern Sierra Nevada was
0.26. The interior area of the Klamath Bioregion was 0.38, while the coastal area was
0.55. Overall niche breadth for the Klamath Bioregion was 0.39. We used 30 food
categories for the southern Sierra Nevada and 41 food categories for the Klamath
Bioregion. When the coastal and interior areas were considered separately, there were 37
and 29 categories respectively. When all vegetation was removed, the diversity in the

Golightly et al. 2006 31
niche breadth for animal matter was 0.40 in the Klamath Bioregion (0.38 interior, 0.54
coastal) and 0.29 in the southern Sierra Nevada.
Discussion
The 388 scats from 4 sites provided adequate numeric and spatial separation to
characterize the entire Klamath Bioregion. Adequate numbers (see Hanson and Graybill
1956 for discussion) of positively identified scats were analyzed to characterize the diet
of fishers at Shasta-Trinity and Six Rivers sites in all seasons, in the spring on the Green
Diamond site, and to strongly suggest patterns of diet at the Hoopa site in autumn and
winter. The stratification by site and season sometimes resulted in small and unequal
sample sizes, so we made inferences based upon sample sizes and statistics, but not from
percentages alone. Further, non-fisher scat was probably excluded before analysis, and
each sample was carefully scrutinized and were from relatively certain sources (traps and
rest sites on short temporal scale).
Fishers in the Klamath Bioregion consumed a wide variety of prey that varied
between seasons and specific sites. Mammals were the most frequent diet item at all sites
and all seasons. Mammals that were consumed varied from small rodents and moles to
cervids. Sciurids were a dominant and consistent taxa. Other small carnivores (e.g.
spotted skunks, Spilogale gracilis; gray fox, Urocyon cinereoargenteus), although not
consumed at great frequency, were found in samples from all 4 seasons and 3 of the sites;
we assumed these were likely the result of predation by fishers.
Surprisingly, there was a relatively low occurrence of lagomorphs in the diet of
fishers in the Klamath Bioregion. The distribution of snowshoe hare in California was
not coincidental with our study sites or elevations. However, the brush rabbit (Sylvilagus

Golightly et al. 2006 32
bachmani) and California black-tailed jackrabbit (Lepus californicus) were distributed
across the region. Brush rabbits have been found in brushy areas with edible grasses
(Chapman 1974). Black-tailed jackrabbits are more common in open areas (Best 1996)
and this habitat would not have provided the overhead cover necessary for fisher habitat
(Seglund 1995, Dark 1997, Zielinski et al. 2004). Mullis (1985) reported that a fisher
took a brush rabbit (0.5 – 0.9 kg body weight, Chapman 1974), which was substantially
smaller than a snowshoe hare (1.3 kg; Murray 2003). Also notable by its absence was the
porcupine. The porcupine’s distribution overlapped all 4 sites (see Ingles 1965), but
porcupine was not detected in a single scat. Across the range of fishers, porcupine
frequency in the diet has ranged from very low (Giuliano et al. 1989) to 12-34% (deVos
1952, Powell 1981, Rego 1984). Absence of porcupine in the scats was reflective of very
little consumption.
Fishers in the Klamath Bioregion also regularly consumed birds, but less
consistently than mammals. It was not generally possible to identify species of bird.
Blue grouse (Dendragapus obscurus) are found throughout the bioregion and ruffed
grouse (Bonasa umbellus) were present at two of the collection sites (Leopold et al.
1981). Both mountain quail (Oreortyx pictus) and California quail (Callipepla
californica) are present in the Klamath Bioregion. Elsewhere (Zielenski et al. 1999),
fishers have been reported to consume passerines as well. Additionally fishers regularly
consumed snakes, lizards, and amphibians at all sites. Insects were also frequent in the
scats. Although some insects (e.g.: Coleoptera and Formicidae) may have been
inadvertently consumed with older carrion, others appeared to be actively consumed

Golightly et al. 2006 33
(e.g.: Vespidae and Orthoptera) and we had anecdotal observations of insect nests being
consumed.
Some vegetation was probably consumed incidentally with carrion (especially
Pinaceae) or in stomachs, cheek pouches, and crops of prey. However, at sites with
huckleberry (Vaccinium spp.), fishers may have actively consumed the fruits. Rocks
were found in many scats and may have been consumed with decomposing carrion.
Anthropogenic material was also common across sites and probably represented use of
human refuse and possibly packaging associated with bait used for trapping.
Interestingly, the greatest encounter of anthropogenic materials was in Hoopa scats where
illegal dumping of human trash was considered a problem (Higley et al. 2005). Although
Zielinski et al. (1999) reported spores of fungi in fisher scats, we did not do this lab
analysis and cannot exclude possible fungi consumption by fishers at our sites.
Fisher Diet Comparison Across Scale
Comparisons between Klamath Bioregion and other regions. Diet of fishers in
the southern Sierra Nevada (Zielinski et al. 1999) had several similarities to the Klamath
Bioregion. In the southern Sierra Nevada, mammals were the most common diet item
(especially sciurids), but included birds and reptiles as additional vertebrate prey
(Zielinski et al. 1999). Deer were apparently available to fishers in the Sierra Nevada,
primarily in winter. Large portions of the Sierra Nevada study site (Zielinski et al. 1999)
were adjacent to National Parks (which may provide refuge), and deer migrate to higher
elevations in spring. The deer in the Klamath Bioregion could neither move into the
protection of parks nor seasonally move off the study area to higher elevations. Similar
to our results, fishers in the southern Sierra Nevada did not consume many leporids. Like

Golightly et al. 2006 34
the Klamath Bioregion, birds were used most in summer in the southern Sierra Nevada,
but variation may have been detected if samples had been stratified by elevation just as
bird use varied across sites in the Klamath Bioregion. Similar to the southern Sierra
Nevada, insects were consumed year round in the Klamath Bioregion, including during
winter. Rocks were detected in the feces more frequently in the Klamath Bioregion than
in the southern Sierra Nevada; we speculate that greater scavenging (e.g. use of deer)
may have caused earthen substrate to be contributed to the fecal remains.
Like other regions in the continental range of the fisher (Martin 1994), deer, birds,
and vegetation were similarly consumed by fishers in the Klamath Bioregion and in the
southern Sierra Nevada. Unlike fishers elsewhere, reptiles were a regular part of the diet
in both the Klamath Bioregion and in the southern Sierra Nevada (Brown and Will 1979,
Giuliano et al. 1989, Kuehn 1989). All other investigations of diet have included some
tree-squirrel sized or larger prey including flying squirrels, gray squirrels and red
squirrels (Brown and Will 1979, Arthur et al. 1989), and leporids, (especially snowshoe
hare; Clem 1977, Raine 1987, Powell 1997) or porcupines (Clem 1977, Powell 1981,
Powell 1993). Compared to other sites in the continental range of the fisher, both
California investigations had low occurrences of lagomorphs and lacked porcupine in the
diet.
Zielinski and Duncan (2004) reported that fisher diet in the southern Sierra
Nevada was more diverse than elsewhere in the continental range of the fisher (see deVos
1952, Rego 1984, Arthur et al. 1989, Giuliano et al. 1989, Kuehn 1989, Powell et al.
1997). Using laboratory methods that were similar to our methods, Zielinski et al. (1999)
identified at least 30 food categories from the 201 scats collected in the southern Sierra

Golightly et al. 2006 35
Nevada. We identified at least 40 food categories as well as anthropogenic foodstuffs
among the 388 scats from the Klamath Bioregion. Our recalculation of the niche breadth
based on occurrences in the southern Sierra Nevada was 0.26 (B-standard as defined in
Colwell and Futuyma 1971). The difference between the original reported value
(Zielinski and Duncan 2004) and our recalculation resulted from the control of potentially
double counted taxa and removal of items in the scats that were probably ingested
incidentally to the foodstuffs. The niche breadth for the interior area of the Klamath
Bioregion was 44% greater than the southern Sierra Nevada. The coastal area was even
more diverse than the southern Sierra Nevada (more than double). Some of these
differences may have resulted from the wider scale and larger sample sizes from the
Klamath Bioregion. However, it also appears that the diet of fishers in California is very
diverse, and relatively more so in the Klamath Bioregion, especially in the coastal areas.
Interestingly, fisher abundance has been described as being greater in the coastal areas
(Truex et al. 1998, Thompson in prep; see coastal surveys by Beyer and Golightly 1996
and Klug 1997: in contrast to the interior surveys reported in Dark 1997).
In calculation of niche-breadth when only animal matter was considered as food,
the relative estimates were very similar to those containing all food categories. Although
fishers can eat berries and other vegetative matter, most of the diversity of food was
animal matter.
Martin (1994) speculated that there was a negative relationship between diet
diversity and the use of large prey. It could be argued that large prey in a small sample
could by itself decrease the apparent diet diversity. However, with 388 scats from 4 sites,
and 201 scats with similar finding from the southern Sierra Nevada, the absence of

Golightly et al. 2006 36
porcupine and leporids in California cannot be simply a sampling artifact. Further, some
larger prey (e.g.: deer and other carnivores) did occur in our samples while the diversity
in the diet was also high.
Zielinski and Duncan (2004) proposed that the diversity of prey in the diet of
fishers in California could possibly be explained by the variety of prey that was available
to fishers in the southern Sierra Nevada. This would suggest that these fishers were
opportunistic. However, habitat and energetics also affect prey selection (see below) and
these complicated the categorization of fisher as simply opportunistic. Regardless,
fishers in California and probably the Pacific States have a more diverse diet than
reported elsewhere in the continental range of the fisher (see Martin 1994).
Comparisons of fisher diet between coastal and interior regions of the Klamath
Bioregion. At a smaller spatial scale within the Klamath Bioregion, we could stratify the
diet of fishers from the drier interior sites (Shasta-Trinity and Six Rivers) and those sites
influenced by marine conditions (Hoopa and Green Diamond). These two broad habitats
contained different plant species (e.g.: redwood, tanoak, and huckleberry in the coastal
forests and more pines with less understory in the drier sites; see contrasting description
between Hoopa and Shasta-Trinity in Yaeger 2005). Diet in coastal areas included more
woodrats and amphibians and less deer, other carnivores, and insects (especially
Orthoptera, primarily Jerusalem crickets). Sciurids appeared to replace the woodrats in
the diet of fishers at interior sites. In spite of temperature and vegetative differences,
reptile use occurred across both habitat types although significantly more on the interior
sites. Again, this suggests that fishers were opportunistic while being influenced by
habitat and energetic issues.

Golightly et al. 2006 37
Seasons appeared to affect the interior sites, but not the coastal sites. There were
seasonal patterns for birds, reptiles, and deer at interior sites, but not at coastal sites. This
would be consistent with the stronger seasonal variation at the interior sites and more
moderating effect of the marine climate on the coastal areas. One exception was the
consistent use of sciurids throughout the year at interior sites.
Fisher diet comparisons between sites within the Klamath Bioregion. At class
and order levels of taxonomy, the overall characterization of the Klamath Bioregion did
not differ from the general pattern obtained at any of the 4 sites. However, at lower
levels of taxonomy, such as sciurid rodents, the species of consumed prey was not the
same. Sciurids were consumed at all sites, but the prevalent sciurid species consumed
differed between sites. Moreover, while there was relatively high use of sciurids at
Shasta-Trinity and Six Rivers, there was a higher relative use of woodrats (similar mass)
at Hoopa and Green Diamond (11 and 30%, respectively) and less use of sciurids.
Woodrats were probably more available at Hoopa and Green Diamond due to the greater
understory complexity in the coastal study area and the greater aridity at the interior sites
(see Carraway and Verts 1991). Thus, this pattern of use probably reflected species
availability (density), predominant habitat, site differences in weather, and abundance of
other prey types of similar mass.
Cervids (probably black-tailed deer; Odocoileus hemionus) were common in all
seasons at Six Rivers and most common in autumn and winter at Hoopa and Shasta-
Trinity. Autumn use of cervids coincided with the state hunting-season at Shasta-Trinity
(which was the site nearest to a large human population center). Although spring use of
deer at Six Rivers and Shasta-Trinity may have included fawns, it is reasonable to assume
Golightly et al. 2006 38
that summer, autumn, and winter use was scavenged from carrion. In autumn, carrion
may have been enhanced by hunters who failed to recover killed deer (see Miller et al.
2003) and in winter by kills associated with inclement weather (Unsworth et al. 1999).
Notably, the occurrence of cervids in the winter diet at Shasta-Trinity was coincidental
with greatest distance from the moderating effects of the coastal climate.
Birds were used at all sites, but the season of most frequent use varied by site.
Fishers at Hoopa used birds in all seasons. Fishers at Six Rivers used birds in spring and
summer, and fishers at Shasta-Trinity used birds in summer only. Sample sizes for birds
were adequate to ensure that assignment of absence to a season at a site was probably a
result of little to no use during that season. Bird migratory patterns and seasonal
vulnerability due to migration may explain these site variations. Fishers also consumed
eggs from nests in the spring.
Prey Preference or Generalist
Based on the variety of prey items (at least 20 species of mammals plus birds,
reptiles, insects, and fruits) and the changes in use with changes in availability (e.g.:
seasons, carrion, etc.), we concluded that fishers in the Klamath Bioregion and in
California probably consumed all potential prey they encountered, and appeared to do so
opportunistically. As seasons changed, those potential prey items were included or
excluded in the diet. In our investigation we did not detect any apparent species-level
specialization in the diet.
In our investigation in the Klamath Bioregion, fishers probably consumed
porcupine only infrequently. Although porcupine range extends through the southern
Sierra Nevada (Ingles 1965), porcupine was absent in the data from Zielinski et al. (1999)

Golightly et al. 2006 39
as well. Conversely, Powell (1981, 1993) suggested that fishers specifically sought
porcupine as prey. Consistent with Powell’s (1981, 1993) description of porcupine,
Bulmer (1975) and Bowman et al. (2006) suggested that fishers were able to switch prey
when snowshoe hare populations were reduced.
Our description of a highly diverse diet was in contrast to the described
specialization on porcupine and snowshoe hare elsewhere in the range. The apparent low
use of leporids and porcupine in our investigation provided uncertainty as to foraging
strategies used by fishers. Some selection did appear to occur (sciurids on the interior
sites through all seasons and woodrats at coastal sites) and the characterization of fisher
diet as simply opportunistic may be inadequate to describe how fishers forage, nor does
simple opportunism explain that high use of porcupine and hare elsewhere. Křivan and
Sikder (1999) modeled a 1-predator 2-prey system and suggested three possible scenarios
for predator foraging behavior: 1) predators specialize on the more profitable prey, 2)
predators are generalists and feed on every encountered prey item, and 3) predators
forage adaptively following rules of optimal foraging theory (adaptive generalists).
Martin (1994) speculated that fishers might select larger prey types (e.g.: simply
characterized by porcupine or snowshoe hares when available). In diverse ecosystems
there may be different prey that would be consistent with the optimal body size that could
be captured and were profitable to hunt. If fishers are adaptive generalists, they would
eat what they encountered, but where possible select more profitable prey (presumably
larger body size when available in adequate numbers). If fishers did exhibit selection for
that profitability, prey or prey body size should be consistent across sites. Such selection

Golightly et al. 2006 40
may be more generic than a specific species as was suggested by Martin (1994) (e.g.:
body size).
By examining energetic return based upon body size, we can infer which species
fishers might select. Powell (1979) estimated the daily caloric needs of fishers in
Michigan in winter. Estimated daily energy expended based on field measurements was
862 kJ/day for a 2.4 kg female and averaged 1471 kJ/day for males weighing 5 kg. We
used Powell’s (1979) figures to estimate the number of kills necessary to sustain a fisher.
We assumed that a small to medium sized mammal had a metabolizable energy of 86%
(Litvaitis and Mautz 1980, Ball and Golightly 1992), and that energy content of
mammalian prey in summer is about 21.8 kJ/g dry weight (Petrusewicz and MacFadyen
1970). The lean dry matter for lab mice was 42% (Ball and Golightly 1992) and 28% for
jackrabbits (Nagy et al. 1976). Using these estimates, a gm wet-weight of prey (assume
30% dry matter) that was 86% metabolizable would provide 5.6 kJ/g (21.8 kJ/g
multiplied by 0.3 multiplied by 0.86). At this rate of energy return, 263g and 154g of
prey/day wet-weight would be needed for the male and female fishers respectively.
Fishers in the Klamath Bioregion have been reported to weigh slightly less (Seglund
1995, Dark 1997) than those observed by Powell (1979), and consequently, daily energy
needs may be slightly less. An average-weight Douglas squirrel (approximately 250g;
Hall 1981) would supply a female fisher with a 1.6-day supply of energy, or a male with
almost a 1-day supply. Similarly a woodrat (N. fuscipes males averaged 315 g; Hamm
1995) could supply 2 days of energy for a female and more than one day for a male. At
warm ambient temperatures in summer, a large-bodied kill would not be useable beyond
a few days. Scavengers and decomposers would degrade a carcass. Conversely, if

Golightly et al. 2006 41
consuming small rodents (e.g. Peromyscus maniculatus, 15-25 g; Chappell et al. 2003) or
lizards (e.g. western fence lizard, Sceloporus occidentalis, 3.65-19.02 g; Roe et al. 2005),
the fisher would need to find and consume 10-26 mice or lizards (assuming each
individual weighed 10 g) per day for male or female fisher, respectively. Consequently,
we argue that although fishers can consume a variety of prey to meet their daily energy
demand, larger prey may be more profitable than smaller prey when available (250g-1kg
size in summer; in winter larger sizes may persist longer after killed if fishers can defend
their kill). It is important to note that there may be inherent risk associated with prey
such as porcupine and that fishers consuming porcupine have been reported to have
porcupine quills imbedded in their faces and elsewhere (see Kuehn 1989). Further, as
noted by Powell (1979), competition with other predators may reduce the available
energy in kills that are consumed over days. It should be noted that carrion in the form of
deer would be more efficient because they could forage almost exclusively on flesh, and
the profitability would be high, so long as they were not damaged by other predators.
The idea that fishers may select prey of tree squirrel or bigger size when available
is consistent with inferences of selection for porcupine or hare. However, rather than
switching prey we argue that they use what they encounter, but satisfy their caloric need
quickest with larger items. Consistent with this hypothesis, the regular ingestion of
sciurids at interior sites could be replaced with more numerous woodrats at coastal sites,
in spite of sciurids still being available. Additionally, gray fox, spotted skunk, or other
small/medium-sized carnivores could be energetically profitable and potentially be
selected if they could be acquired at low risk.

Golightly et al. 2006 42
Management Conclusions
Fishers can utilize a variety of prey, but adequate energy is most efficiently
gathered when consuming tree squirrels, woodrats or larger prey (0.250-1kg) in
California. Consequently highly productive habitats with available prey in this size class
may produce numerical responses (Bowman et al. 2006) in fisher abundance. Where a
diversity of prey types in this size class exists, apparent switching may occur when one of
these prey types declines. This could occur without an apparent change in fisher
numbers, which would be consistent with the models of Křivan and Sikder (1999).
It is important to recognize that many small mammalian carnivores are also in the
prey size class used by fisher in California (e.g.: marten, Martes americana, 0.85 kg, Hall
1981; gray fox, 3.0-7.0 kg, Ball and Golightly 1992, Cypher 2003; spotted skunk, 0.5-1.8
kg, Rosatte and Larivière 2003) and we found the latter two among the prey. Because
many small carnivores are at relatively low density (e.g. marten, Buskirk et al. 1994) and
because fishers will opportunistically consume what they encounter, there is a potential
for fishers to influence populations of these other carnivores. This influence may occur
because of direct interaction (being consumed) or due to competition for overlapping
food resources (see Zielinski and Duncan 2004). Other forest carnivores consume many
of the same small mammals, birds, and reptiles that fishers may consume.
Reintroduction of fishers has been considered in areas of its range where it has
been extirpated (see Lewis and Hayes 2004). It would be overly simplistic to consider
only that fishers were once a component of that ecosystem and that their reintroduction
will have only positive consequences. The status of other small carnivores in these
ecosystems has also changed and the relationship to reintroduced fishers may differ from

Golightly et al. 2006 43
the conditions when they previously occurred at the site. Thus, care must be taken to
consider potential impacts on sympatric carnivores that have similar or smaller body size,
or consume similar prey. Conversely, the broad character of the diet of fishers suggests
that they may readily find food when introduced onto productive lands with a variety of
small mammals, especially with tree squirrels or woodrats.
Anthropogenic influences may also affect fishers (especially over winter).
Grenfell and Fasenfest (1979) reported that fishers would consume bovid carrion. The
availability of carrion would also be related to deer management. The effect of carrion
from any source on reproduction and survival of fishers is unknown. Although illegal
since 1972, carrion was historically used in “meat baits” to attract and poison other
predators in some regions within the fisher range (U.S. Fish and Wildlife Service 1979),
and we caution that where fishers are present, such use of a predacide may have the
potential to negatively affect fishers.
The productivity of a habitat, especially as it affects small mammal abundance,
may influence fisher persistence and abundance. Fisher habitats in California do not
experience the prolonged winters characteristic of more northern parts of the fisher’s
range. Thus the role of large-bodied prey was less important in California (it does not
persist), and consisted mostly of scavenged deer when available.
Timber management activities in California forests may change the existing
availability and type of prey. As these altered forests proceed through succession, there
will be dynamic alterations of fisher food. Some of our observed differences in diet
between sites may be reflective of different seral stages. Fishers often use large trees as
rest sites and areas with relatively closed canopies (Seglund 1995, Dark 1997, Zielinski et

Golightly et al. 2006 44
al. 2004, Yaeger 2005), which explains why some research has associated fishers with
late seral forest (see Rosenberg and Raphael 1984). However, some important prey
species increase in numbers in logged forests (Hamm 1995, Waters and Zabel 1998).
Although cover and good resting or denning sites will ultimately constrain which forest-
habitats support fishers, prey may be more associated with conifer-forest openings and
edges with greater productivity (Murcia 1995). Examples would include woodrats,
which are more abundant in areas post timber harvest (Hamm 1995) or tree squirrels in
areas of abundant oak mast. Anecdotally, fisher abundance in the Klamath Bioregion
seems to be correlated with the highly productive coastal forests (Beyer and Golightly
1996, Klug 1997, Truex et al. 1998, Yaeger 2005, Thompson et al. in prep.). Although
California ground squirrels (Spermophilus beecheyi) can be very abundant in clear-cut
and early seral forests (pers. obs.), they were not prevalent in diet (these seral stages were
available in the study area); their absence probably resulted from them occupying areas
that also lacked cover for fishers. Conversely, tree squirrels and chipmunks (Tamias sp.)
were abundant in the diet and are associated with forest cover.
There are several forest practices in managed timer lands that have the potential to
influence prey populations and availability. Concern about wildfire has initiated
programs to control fuel (removal of downed woody materials and under story
vegetation). Within forests, numerous small mammals use the downed woody material
(Loeb 1999, Menszel et al. 1999, Ucitel et al. 2003). Removal of these materials has
potential to reduce prey abundance that may cause fishers to hunt elsewhere, or reduce
overall abundance of fishers if the fuel treatments are on a wide scale. Assessments of

Golightly et al. 2006 45
fuel-reduction planning should consider potential changes in small mammal abundance
that may affect food supply for fishers.
Another forest practice that has potential to change the fisher’s prey base is the
conversion of vegetation from one habitat type or vegetative composition to another.
Sometimes this is intentional through planting new seedlings, selective removal (e.g.:
hardwoods), or vegetation manipulation to improve forest growth (e.g.: thinning and
herbicide treatment; see Whitaker 2003). At other times this conversion of habitat or
vegetation change is an inadvertent consequence of forest management considerations
(e.g.: stream-side protection zones). It is important to recognize that these practices may
alter which prey is available, and although fishers can switch prey, they may not always
be able to use the new habitat in the converted landscape. For example, most sciurids use
conifers and oaks as a food base, and the riparian habitat associated with stream
protection zones may not provide this food without addition of uplands containing the
appropriate tree species.
Acknowledgments
We thank S. Elliot for detailed hours of sorting and identifying fecal remains. We
thank S. Dark, J. Dayton, N. Duncan, P. Hapmann, R. Klug, A. Pole, R. Schlexer, G.
Schmidt, K. Schmidt, A. Seglund, R. Truex and S. Yaeger for collecting scat. Several
fecal remains used from the Shasta-Trinity site were provided by Sierra Pacific
Industries. Early support for analyses were provided by the California Department of
Fish and Game. Funding for the completion of this report came from U.S. Fish and
Wildlife Service and Pacific Lumber Company.

Golightly et al. 2006 46
Literature Cited
Adjoran, A. S. and G. B. Kolenosky. 1969. A manual for the identification of hairs of
selected Ontario mammals. Research Report (Wildlife) 90, Department of Lands
and Forests, Ontario, Canada.
Arthur, S. M., W. B. Krohn, J. R. Gilbert. 1989. Habitat use and diet of fishers. Journal of
Wildlife Management 53: 680-688.
Aubry, K. B., and J. C. Lewis. 2003. Extirpation and reintroduction of fishers (Martes
pennanti) in Oregon: implications for their conservation in the Pacific states.
Biological Conservation 114: 79-90.
Ball, L. C., and R. T. Golightly Jr. 1992. Energy and nutrient assimilation by gray foxes
on diets of mice and Himalaya berries. Journal of Mammalogy 73: 840-846.
Best, T. L. 1996. Lepus californicus. Mammalian Species 530: 1-10.
Beyer, K. M. and R. T. Golightly 1996. Distribution of pacific fisher and other forest
carnivores in coastal northwestern California. Unpublished report, Wildlife
Department, Humboldt State University, Arcata, California, USA.
Boror, D. J. and R. E. White. 1970. A field guide to insects. Houghton Mifflin, Boston,
Massachussetts, USA.
Bowman, J., D. Donovan, and R. C. Rosatte. 2006. Numerical response of fishers to
synchronous prey dynamics. Journal of Mammalogy 87: 480-484.
Brown, M. K., and G. Will. 1979. Food habits of the fisher in northern New York. New
York Fish and Game 26: 87-92.

Golightly et al. 2006 47
Brunner, H. and B. J. Coman. 1974. The identification of mammalian hair. Inkata Press,
Melbourne, Australia.
Bulmer, M. G. 1975. Phase relations in the ten-year cycle. Journal of Animal Ecology 44:
609-621.
Buskirk, S. W., and L. F. Ruggiero. 1994. American Marten. Pages 7-37 in L. F.
Ruggiero, K. B. Aubry, S. W. Buskirk, L. J. Lyon, and W. J. Zielinski, editors.
The scientific basis for conserving forest carnivores: American marten, fisher,
lynx, and wolverine in the Western United States. U. S. Forest Service General
Technical Report RM 254.
Carraway, L. N., and B. J. Verts. 1991. Neotoma fuscipes. Mammalian Species 386: 1-10.
Chapman, J. A. 1974. Sylvilagus bachmani. Mammalian Species 34: 1-4.
Chappell, M. A., E. L. Rezende, and K. A. Hammond. 2003. Age and aerobic
performance in deer mice. Journal of Experimental Biology 206: 1221-1231.
Clem, M. K. 1977. Interspecific relationship of fishers and martens in Ontario during
winter. Pages 165-183 in R. L. Phillips, and C. Jonkel, editors. Proceedings of the
1975 Predator Symposium. Montana Forest Conservation Experimental Station,
University of Montana, Missoula, Montana, USA.
Colwell, R. K., and D. J. Futuyma. 1971. On the measurement of niche breadth and
overlap. Ecology 52: 567-576.
Cypher, B. L. 2003. Foxes (Vulpes species, Urocyon species and Alopex lagopus). Pages
511-546 in G. A. Feldhamer, B. C. Thompson, and J. A. Chapman, editors. Wild
mammals of North America: biology, management, and conservation. Second
edition. John Hopkins University Press, Baltimore, Maryland, USA.

Golightly et al. 2006 48
Day, M. G. 1966. Identification of hair and feather remains in the gut and feces of stoats
and weasels. Journal of Zoology 148: 201-217.
Dark, S. 1997. A landscape-scale analysis of mammalian carnivore distribution and
habitat use by fisher. Thesis, Humboldt State University, Arcata, California, USA.
deVos, A. 1952. Ecology and management of fisher and marten in Ontario. Technical
Bulletin, Ontario Department of Lands and Forestry, Ontario, Canada.
Giuliano, W. M., J. A. Litvaitis, and C. L. Stevens. 1989. Prey selection in relation to
sexual dimorphism of fishers (Martes pennanti) in New Hampshire. Journal of
Mammalogy 70: 639-641.
Goin, C. J., O. B. Goin, and G. R. Zug. 1978. Introduction to herpetology. Third edition.
W. H. Freeman and Company, San Francisco, California, USA.
Golightly, R. T., Jr., M. R. Faulhaber, K. L. Sallee, and J. C. Lewis. 1994. Food habits
and management of introduced red fox in Southern California. Pages 15-20 in W.
S. Halverson and A. C. Crabb, editors. Proceedings of the Sixteenth Vertebrate
Pest Conference. University of California, Davis, California, USA.
Grenfell, W. E. and M. Fasenfest. 1979. Winter food habits of fishers, Martes pennanti,
in northwestern California. California Fish and Game 65: 186-189
Grinnell, J., J. S. Dixon, and J. M. Linsdale. 1937. Furbearing mammals of California.
University of California Press, Berkeley, California, USA.
Hall, E. R. 1981. The mammals of North America. Second edition. John Wiley, New
York, New York, USA.
Hall, E. R. and K. R. Kelson. 1959. The mammals of North America. Ronald Press, New
York, New York, USA.

Golightly et al. 2006 49
Hamm, K. A. 1995. Abundance of dusky-footed woodrat in managed forests of north
coastal California. Thesis, Humboldt State University, Arcata, California, USA.
Hanson, W. R. and F. Graybill. 1956. Sample size in food-habits analyses. Journal of
Wildlife Management 20: 64-68.
Higley, J. M., D. V. Masters, and J. L. Sajecki. 2005. Black bear management plan,
Hoopa Valley Tribe. Hoopa Tribal Forestry, Hoopa, California, USA.
Ingles, L. G. 1965. Mammals of the Pacific States: California, Oregon, and Washington.
Stanford University Press, Stanford, California, USA.
Hickman, J. C., editor. 1993. The Jepson manual: higher plants of California. University
of California Press, Berkeley, California, USA.
Johnson, M. K. and R. M. Hansen. 1977. Comparison of point frame and hand separation
of coyote scats. Journal of Wildlife Management 41: 319-320.
Klug, R. R. 1997. Occurrence of Pacific Fisher (Martes pennanti pacifica) in the
redwood zone of northern California and the habitat attributes associated with
their detections. Thesis, Humboldt State University, Arcata, California, USA.
Křivan, V. and A. Sikder. 1999. Optimal foraging and predator-prey dynamics, II.
Theoretical Population Biology 55: 111-126.
Kuehn, D. W. 1989. Winter foods of fishers during a snowshoe hare decline. Journal of
Wildlife Management 53: 688-692.
Leopold, A. S., R. J. Gutierrez, M. T. Bronson. 1981. North American game birds and
mammals. Charles Scribner’s Sons, New York, New York, USA.

Golightly et al. 2006 50
Lewis, J. C. and G. E. Hayes. 2004. Feasibility assessment for reintroducing fishers to
Washington. Washington Department of Fish and Wildlife, Olympia,
Washington, USA.
Litvaitis, J. A. and W. M. Mautz. 1980. Food and energy use by captive coyotes. Journal
of Wildlife Management 44: 56-61.
Lockie, J. D. 1959. The food of the pine marten Martes martes in west Ross-Shire,
Scotland. Nature Conservancy 12: 187-195.
Loeb, S. C. 1999. Responses of small mammals to coarse woody debris in a southeastern
pine forest. Journal of Mammalogy 80: 460-471.
Martin, S. K. 1994. Feeding ecology of American martens and fishers. Pages 297-315 in
S. W. Buskirk, A. S. Harestad, M. G. Raphael, R. A. Powell, editors. Martens,
sables, and fishers: biology and conservation. Cornell University Press, Ithaca,
New York, USA.
Mayer, K. E. and W. F. Laudenslayer Jr. 1988. A guide to wildlife habitats of California.
California Department of Forestry and Fire Protection, Sacramento, California,
USA.
Mayer, W. V. 1952. The hair of California mammals with keys to the dorsal guard hairs
of California mammals. The American Midland Naturalist 48: 480-512.
Menzel, M. A., W. M. Ford, J. Laerm, and D. Krishon. 1999. Forest to wildlife opening:
habitat gradient analysis among small mammals in the southern Appalacians.
Forest Ecology and Management 114: 227-232.
Miller, K. V., L. I. Muller, and S. Demarais. 2003. White-tailed deer (Odocoileus
virginianus). Pages 906-930 in G. A. Feldhamer, B. C. Thompson, and J. A.

Golightly et al. 2006 51
Chapman, editors. Wild mammals of North America: biology, management, and
conservation. Second edition. John Hopkins University Press, Baltimore,
Maryland, USA.
Milne, L. and M. Milne. 1980. The Audubon society guide to North American insects
and spiders. Alfred A. Knopf, New York, New York, USA.
Moore, T. D., L. E. Spence, and C. E. Dugnolle. 1974. Identification of the dorsal guard
hairs of some mammals of Wyoming. Wyoming Game and Fish Department
Bulletin 14, Cheyenne, Wyoming, USA.
Mullis, C. 1985. Habitat utilization by fisher (Martes pennanti) near Hayfork Bally,
California. Thesis, Humboldt State University, Arcata, California, USA.
Murcia, C. 1995. Edge effects in fragmented forests: implications for conservation. Tree
10: 58-62.
Murray, D. L. 2003. Snowshoe hares and other hares (Lepus americanus and allies).
Pages 147-178 in G. A. Feldhamer, B. C. Thompson, and J. A. Chapman, editors.
Wild mammals of North America: biology, management, and conservation.
Second edition. John Hopkins University Press, Baltimore, Maryland, USA.
Nagy, K. A., V. H. Shoemaker, and W. R. Costa. 1976. Water, electrolyte and nitrogen
budgets of jackrabbits (Lepus californicus) in the Mojave Desert. Physiological
Zoology 49: 351-363.
Petrusewicz, K., and A. MacFadyen. 1970. Productivity of terrestrial animals, principles
and methods. International Biological Programme Handbook 13. F. A. Davis,
Philadelphia, Pennsylvania, USA.

Golightly et al. 2006 52
Powell, R. A. 1979. Ecological energetics and foraging strategies of the fisher (Martes
pennanti). Journal of Animal Ecology 48: 195-212.
Powell, R. A. 1981. Hunting behavior and food requirements of the fisher (Martes
pennanti). Pages 883-917 in J. A. Chapman and D. Pursley, editors. Worldwide
Furbearer Conference Proceedings. Worldwide Furbearer Conference, Inc., 3-11
August 1980, Frostburg, Maryland, USA.
Powell, R. A. 1993. The Fisher: life history, ecology, and behavior. Second Edition.
University of Minnesota Press, Minneapolis, Minnesota, USA.
Powell, R. A., and W. J. Zielinski. Fisher. 1994. Pages 38-73 in L. F. Ruggiero, K. B.
Aubry, S. W. Buskirk, L. J. Lyon, W. J. Zielinski, editors. The scientific basis for
conserving forest carnivores: American marten, fisher, lynx, and wolverine in the
Western United States. U. S. Forest Service General Technical Report RM 254.
Powell, S. M., E. C. York, and T. K. Fuller. 1997. Seasonal food habits of fishers in
central New England. Pages 279-305 in G. Proulx, H.N. Bryant and P.M.
Woodard, editors. Martes: taxonomy, ecology, techniques and management.
Provincial Museums of Alberta, Edmonton, Alberta, Canada.
Proctor, N. S., and P. J. Lynch. 1993. Manual ornithology, avian structure and function.
Yale University Press, New Haven, Connecticut, USA.
Raine, R. M. 1987. Winter food habits and foraging behavior of fishers (Martes pennanti)
and martens (Martes americana) in southeastern Manitoba. Canadian Journal of
Zoology 65: 745-747.
Rosenberg, K. V. and M. G. Raphael. 1984. Effects of forest fragmentation on vertebrates
in Douglas-fir forests. Pages 263-272 in J. Verner, M. L. Morrison, and C. J.

Golightly et al. 2006 53
Ralph, editors. Wildlife 2000: modeling habitat relationships of terrestrial
vertebrates. University of Wisconsin Press, Madison, Wisconsin, USA.
Rego, P. W. 1984. Factors influencing harvest levels of fisher in south central and south
eastern Maine. Thesis, University of Maine, Orona, Maine, USA.
Roe, J. H., W. A. Hopkins, and L. G. Talent. 2005. Effects of body mass, feeding, and
circadian cycles on metabolism in the lizard Sceloporus occidentalis. Journal of
Herpetology 39: 595-603.
Rosatte, R., and S. Larivière. 2003. Skunks (Genera Mephitis, Spilogale, and Conepatus).
Pages 692-707 in G. A. Feldhamer, B. C. Thompson, and J. A. Chapman, editors.
Wild mammals of North America: biology, management, and conservation.
Second edition. John Hopkins University Press, Baltimore, Maryland, USA.
Schopmeyer, C. S. 1974. Seeds of woody plants in the United States. Agriculture
Handbook 450. USDA Forest Service, Washington, D.C., USA.
Schoonmaker, W. J. 1938. The fisher as a foe of the porcupine in New York State.
Journal of Mammalogy 19: 373-374.
Seglund, A. E. 1995. The use of resting sites by the Pacific fisher. Thesis, Humboldt
State University, Arcata, California, USA.
Serafini, P., and S. Lovari. 1993. Food habits and trophic niche overlap of the red fox and
the stone marten in a Mediterranean rural area. Acta Theriologica 38: 233-244.
Southern, H. N. and J. S. Watson. 1941. Summer food of the red fox (Vulpes vulpes) in
Great Britain: a preliminary report. Journal of Animal Ecology 10: 1-11.
Stebbins, R. C. 1966. A field guide to western reptiles and amphibians. Houghton Mifflin
Company, Boston, Massachusetts, USA.

Golightly et al. 2006 54
Truex, R. L., W. J. Zielinski, R. T. Golightly, R. H. Barrett, and S. M. Wisely. 1998. A
meta-analysis of regional variation in fisher morphology, demography, and
habitat ecology in California. Draft report, California Department of Fish and
Game, Wildlife Management Division, Nongame Bird and Mammal Section,
Sacramento, California, USA.
Ucitel, D., D. P. Christian, and J. M Graham. 2003. Vole use of coarse woody debris and
implications for habitat and fuel management. Journal of Wildlife Management
67: 65-72.
Unsworth, J. W., D. F. Pac, G. C. White, and R. M. Bartmann. 1999. Mule deer survival
in Colorado, Idaho and Montana. Journal of Wildlife Management 63: 315-326.
U. S. Fish and Wildlife Service. 1979. Mammalian predator damage management for
livestock protection in the western United States. Final Environmental Impact
Statement. Department of the Interior, Washington D.C., USA
Waters, J. R., and C. J. Zabel. 1998, Abundances of small mammals in fir forests in
northeastern California. Journal of Mammalogy 79: 1244-1253.
Whitaker, D. A. 2003. Relation of thin and release timber management practices to
abundance of woodrats, chipmunks, mice, and ticks within the Hoopa Valley
Indian Reservation. Thesis, Humboldt State University, Arcata, California, USA.
Yaeger, J. S. 2005. Habitat at fisher resting sites in the Klamath Province of Northern
California. Thesis, Humboldt State University, Arcata, California, USA.
Zielinski, W. J., T. E. Kucera, and R. H. Barret. 1995. Current distribution of the fisher,
Martes pennanti, in California. California Fish and Game 81: 104-112.

Golightly et al. 2006 55
Zielinski, W. J., R. L. Truex, G. A. Schmidt, F. V. Schlexer, K. N. Schmidt, and R. H.
Barrett. 2004. Resting habitat selection by fishers in California. Journal of
Wildlife Management 68: 475-492.
Zielinski, W. J., N. P. Duncan, E. C. Farmer, R. L. Truex, A. P. Clevenger, and R. H.
Barrett. 1999. Diet of fishers (Martes pennanti) at the southernmost extent of their
range. Journal of Mammalogy 80: 961-971.
Zielinski, W. J., and N. P. Duncan. 2004. Diets of sympatric populations of American
martens (Martes americana) and fishers (Martes pennanti) in California. Journal
of Mammalogy 85: 470-477.

Golightly et al. 2006 56
Appendix A. Taxonomic groups in the fisher diet at 4 sites in the Klamath Bioregion of northern California were ranked. Rank was determined as the most frequent (1) to least frequent diet item within each site. Vegetation and insects were excluded from ranking.
Family Shasta-Trinity Six Rivers Hoopa Green Diamond
Amphibia 8 9 5 6
Canidae 7 8 7 0
Cervidae 4 1 3 0
Geomyidae 8 7 0 0
Leporidae 7 6 7 5
Muridae 6 3 1 1
Mustelidae 5 8 0 0
Passeriformes 0 0 7 0
Piciformes 8 9 7 0
Procyonidae 0 7 0 0
Sauria 3 5 5 5
Sciuridae 1 2 2 2
Serpentes 7 7 7 4
Soricidae 7 0 6 0
Talpidae 2 4 4 3
Vespertillionidae 8 0 0 0
Rank