gond, and e. bartholomé - · pdf filesar (ers-sar, radarsat) and optical ... the lowest...
TRANSCRIPT

1
Detection and mapping of burnt areas and active fires in tropical woodland ecosystems withthe VEGETATION sensor: the SMOKO-FRACTAL case study over Northern Australia
D. Stroppiana, M. Maggi, J-M. Pereira, D. Graetz, J-M. Grégoire, J. Silva, A. Sà, P. Henry, V.Gond, and E. Bartholomé
Abstract. The SMOKO-FRACTAL field campaign was conducted during the 1999 dry seasonin Australia (Northern Territory). The objective of the experiment was to collect ground andsatellite data to develop and test methodologies for burnt area detection from low resolutionsatellite imageries in a tropical woodland ecosystem. In this work we present burnt area mapsderived from VEGETATION and AVHRR images. The methodology applied is based onclassification rules extracted from decision trees. In order to map burnt areas, classification ruleswere directly implemented in the case of VGT images. A different approach was used with theAVHRR images for which classification rules and active fire positions were used in a seed-growing algorithm. The accuracy of the results was evaluated using high resolution Landsat-TMimages. Active fire detection was also performed using daytime and nighttime VGT images andresults were compared to active fire positions provided by the World Fire Web System.
IntroductionThe SMOKO-FRACTAL field campaign was conducted in Kakadu National Park, NorthernTerritory, Australia in June 1999. It was organized in the framework of a scientific collaborationbetween the Australian Commonwealth Scientific and Industrial Research Organisation (CSIRO),the Centre National d’Etudes Spatiales (CNES), the Technical University of Lisbon (TUL) andthe Space Applications Institute (SAI) of the European Commission Joint Research Centre (JRC).The short-term objective of the experiment was to collect data to develop and test burnt areadetection algorithms using low resolution satellite images (SPOT-VEGETATION and NOAA-AVHRR) in the tropical woodland ecosystem in a long-term perspective of mapping burnt areasusing the same sensors at a global level. The burnt area product will also contribute to thequantitative assessment of carbon and CO2 budget, as well as to studies related to emissions ofother greenhouse gases and aerosols globally. This type of information is of key importance in thecontext of the Kyoto Protocol to the Framework Convention on Climate Change (FCCC) andBiodiversity and Desertification Conventions.The experimental site (figure 1) covers an area of about 300,000 km2 (129o-134o E, 11o-16o S)where tropical woodland savannah is the predominant ecosystem. There is a marked wet and dryseason (November-March and April-October respectively) and vegetation fires are extensive andfrequent during the dry season (Graetz et al. 1992, Russell-Smith et al. 1997). During the fieldcampaign ground and satellite data were collected. The ground data concern the extension of themain burns (collected using a portable Global Position System instrument and helicoptersurveys), characteristics of the vegetation cover (species, tree density, height and crowncharacteristics for the commonest species) and fire behaviour (smouldering or flaming fires). Thesatellite data set is composed of imageries acquired by low resolution orbital (SPOT-VGT,NOAA-AVHRR-HRPT, ERS-ATSR) and geostationary (GMS-VISSR) systems, high resolutionSAR (ERS-SAR, Radarsat) and optical (SPOT-HRIV, Landsat-TM) systems. In this work wefocused on the use of VGT and AVHRR images for burnt area mapping. High resolution Landsat-TM images were used to evaluate the accuracy of the results. An algorithm was also developed toextract active fires from VGT daytime and nighttime images. Among the ground data we used theinformation concerning position and extension of the main burns in order to extract their spectralsignature. The analysis of spectral behaviour of burnt areas in different vegetation cover typeswas used as a basis for the development of the burnt detection algorithm. This part of the work isnot presented in this paper. In this paper we present the characteristics of the remotely sensed dataset (section 1), the methodology applied to detect burnt areas from VGT and AVHRR (section 2)
2
and active fires from VGT (section 3) imageries. In section 4 we draw some conclusions andunderline which could be the future developments for a multi-satellite approach to firemonitoring.
1. The remotely sensed data setTime series acquired by the VGT sensor (S1 product) are composed of daily images of groundreflectance from May, 15th to July, 15th 1999. A limited data set of nighttime images was alsomade available by CNES. The NOAA-AVHRR data set is composed of daily Top Of Atmospherereflectance (afternoon pass) for the period May, 19th to June, 14th 1999. Temporal compositingwas applied to daily VGT and AVHRR images to reduce noise due to cloud cover andatmospheric effects, and to stabilise the variability produced by daily changes in illumination andviewing geometry. Among the high resolution images available, we used two Landsat-TM scenes(105/69 and 105/70) from the 9th of June 1999.
2. Burnt area mapping from VGT and AVHRR
2.1 Mapping burnt area from VGTTen day composites were produced from daily images with a minimum near infrared (NIR)criterion. In order to minimise the risk of selecting cloud shadows the simple minimum valuetechnique was adjusted with a condition that looks at the temporal trend in the NIR reflectance ineach pixel during the compositing period. The steps of the temporal compositing can besummarised as follows:a) During a ten day period the four days with the lower values in NIR are selected.b) The lowest value is kept as potential “best composite day”. From the remaining three days themean and range are computed.c) The potential “best composite day” is confirmed only if it is contained in the interval mean ±range. If it is not, the second lowest value of the four values chosen in a) is selected.
The Global Environment Monitoring Index (GEMI) (Pinty and Verstraete, 1992) was computedfrom the red and NIR bands.The methodology used to map burnt area is based on classification trees (Breiman et al. 1984)and it is summarised by the following steps:1. Choice of the number of classes (burnt, unburnt and clouds).2. Extraction of a training data set by visual inspection of the daily images.3. Choice of the predictor variables (NIR and SWIR bands and the GEMI index, in this case).4. Output: a decision tree (set of binary decisions). Each decision involves a predictor variable
and a threshold value.5. A classification rule can be extracted as a set of consecutive binary decisions and the
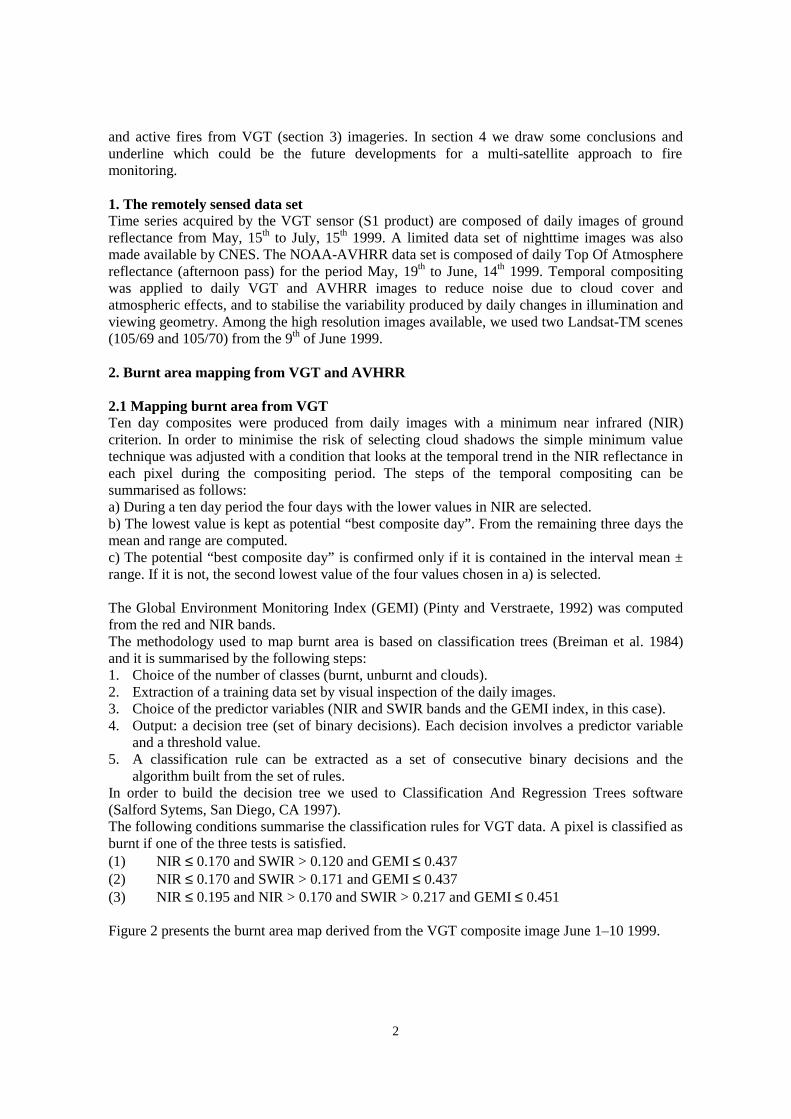
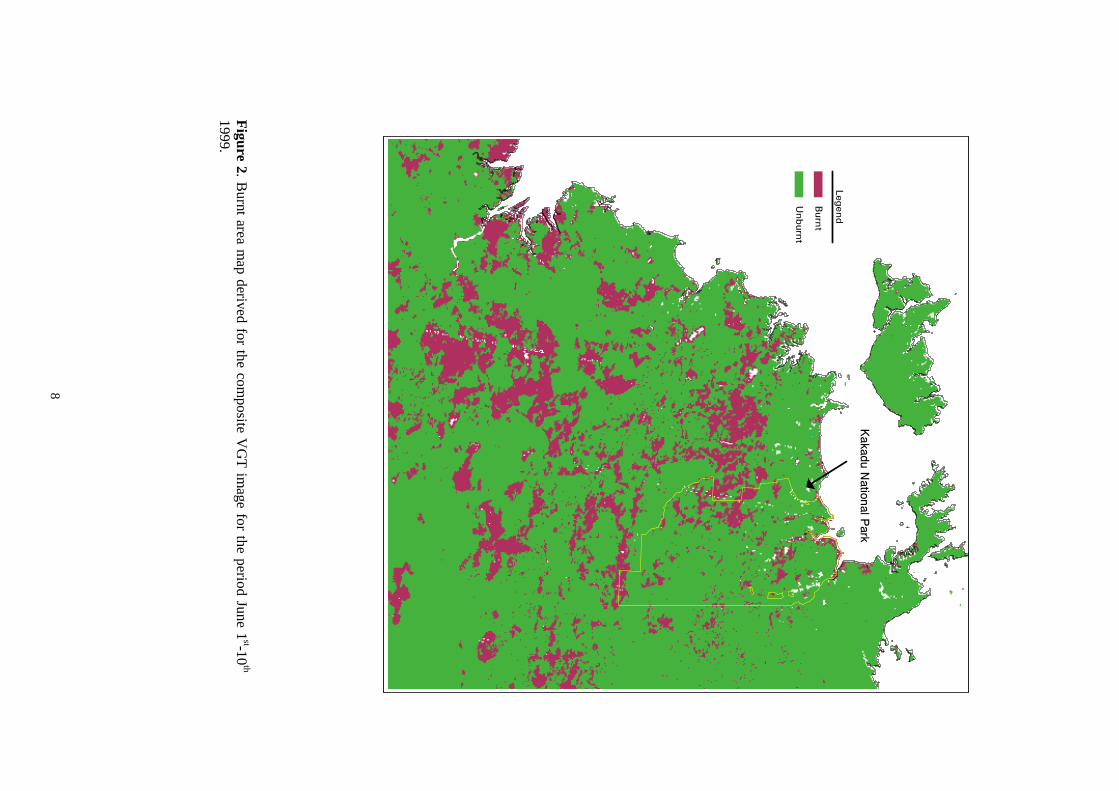
algorithm built from the set of rules.In order to build the decision tree we used to Classification And Regression Trees software(Salford Sytems, San Diego, CA 1997).The following conditions summarise the classification rules for VGT data. A pixel is classified asburnt if one of the three tests is satisfied.(1) NIR ≤ 0.170 and SWIR > 0.120 and GEMI ≤ 0.437(2) NIR ≤ 0.170 and SWIR > 0.171 and GEMI ≤ 0.437(3) NIR ≤ 0.195 and NIR > 0.170 and SWIR > 0.217 and GEMI ≤ 0.451
Figure 2 presents the burnt area map derived from the VGT composite image June 1–10 1999.

3
2.2 Mapping burnt area from AVHRRNine day composites were derived from daily AVHRR images with a two steps compositingcriterion: within the compositing period the four days with the lower channel 2 are selected and,among these dates, the day with the highest brightness temperature in channel 4 is chosen. Thiscompositing criterion showed to perform well in minimising the risk of selecting cloud shadows(Pereira 1999). Although temporal compositing reduces noise from cloud cover, a cloud detectionalgorithm was applied before the compositing (Saunders and Kriebel 1998, Stowe et al. 1991). Apixel is flagged as cloud if:i. ρ1 > 44% and BT4 < 293KORii. 0.9 < ρ2 / ρ1 < 1.1 and BT4 < 293KORiii. BT4 < 294K
Active fire maps were derived from daily images by applying a contextual algorithm (Flasse andCeccato 1996).In order to map burnt areas the methodology described in section 2.1 provided the classificationrules, which were applied in a seed-growing technique using the information on active firepositions. The rule extracted for the burnt class in based on the values in channel 2 (TOAreflectance) and channel 3 (brightness temperature). A pixel is classified as burnt if it satisfies thefollowing condition:
ρ2 ≤ 0.12 and BT3 > 305KThe seed-growing algorithm is an iterative procedure. At a first step the condition is tested for theeight pixels surrounding a pixel labeled as active fire (seed). Those pixels that satisfy thecondition are classified as burnt and they constitute the seeds for the next iteration. The processstops when the number of pixels classified as burnt in two consecutive iterations is constant.Figure 3 the results obtained from the AVHRR composite image June 5–13 1999.
2.3 Accuracy of the resultsThe accuracy of the results was evaluated using two Landsat-TM frames (June, 9th 1999) thatwere geo-located with ground control points and digital topographic maps (scale 1;250,000).Burnt areas were visually extracted from the TM images. Thirty validation windows (14 km by14 km) were randomly extracted in the study area. The percentage of area classified as burnt ineach window was calculated for burnt area maps derived from VGT, AVHRR, and TM images.The scatter plots (VGT vs. TM and AVHRR vs. TM) qualitatively show the accuracy of theresults (figure 4).The graphs show that classifications derived from both VGT and AVHRR tend to overestimatethe area burnt. The rate of overestimation increases with the proportion of the window that isburnt. Yet results derived from VGT are more accurate especially for lower percentages (less than30%). Two interesting cases can be pointed out. The first one is a misclassification in the burntarea map derived from VGT images. Visual inspection of VGT and AVHRR spectral bandsshowed that this burnt area is clearly visible only in AVHRR channels 3, 4 and 5. Neither inAVHRR channel 1 and 2 nor in VGT NIR and SWIR bands the window’s burnt portion can bedistinguished against the unburnt vegetation. Probably a fire burnt only the grass layer and did notaffect the upper tree layer. The second point, that is present in both the graphs, corresponds to acase where the same area classified as burnt in VGT and AVHRR is not present in the TMinterpretation. This specific case shows the limitation of the visual interpretation performed onthe Landsat-TM data.

4
3. Active fire detection from VGTThe feasibility of detecting active fires from VGT images was tested and the results evaluated bythe comparison with the active fire maps provided by the World Fire Web System (section 3.2)(http://www.gvm.sai.jrc.it) (Grégoire and Pinnock, 2000).
3.1 MethodologyThe algorithm used to detect active fires was elaborated empirically and it is based on a localcontrast distinction technique for the daytime data set and on a simple thresholding for thenighttime images. The algorithm used with daytime images is based on the value of the NDVI,the Normalised Difference Water Index (NDWI; Gao 1996) and the reflectance in the SWIRband. NDWI was computed using Eq. 2.
NDWI = ( ρNIR – ρSWIR ) / ( ρNIR + ρSWIR ) (Eq. 2)
The algorithm works on a pixel basis. First the average SWIR reflectance in a window 45 by 45pixels was computed. Then the SWIR reflectance was subtracted to the average image tohighlight those pixels contrasting against the background. A threshold (-1 to -0.06) was applied tothe difference image to extract pixels identified as active fires. To confirm this first identificationa second threshold (0.6 to 1) was applied on the image NDVI-NDWI.The inspection of nighttime images confirmed that the features clearly visible in the SWIR bandwere active fires. A simple thresholding on the SWIR band allowed the extraction of active fires.
3.2 Evaluation of the resultsActive fires detected from VGT images were overlaid to those provided by the World Fire Webnetwork. Figure 5 shows the good spatial correspondence between active fires detected withnighttime VGT images and active fires detected using daytime AVHRR images. The area burntby the fire is also clearly visible. VGT sensor has some potentialities for active fire detection evenif the number of fires detected was only a small fraction of those detected with AVHRR.
4. Conclusions and perspectivesThe methodology applied to derive burnt area maps from VGT and AVHRR images performedquite well in terms of overall accuracy. Results obtained from both systems show anoverestimation of the area burnt. Yet results were more accurate for VGT images probably due tothe better geometry of the sensor, compared to AVHRR. This characteristic is also very importantwhen temporal compositing is applied. From a spectral point of view, the presence of a SWIRband in the VGT sensor might be useful for burnt area mapping in this type of ecosystem(tropical woodland savannah) even though the burnt signal in this band is not as persistent in timeas in the NIR band. The usefulness of the SWIR band is strongly dependent on the vegetationcover type and on the age of the burnt area. The accuracy assessment also underlined theimportance of the information brought by AVHRR channels 3, 4 and 5. Hence the lack of athermal channel is the main drawback for the use of VGT data for burnt area mapping. Resultsobtained from AVHRR images using the seed-growing technique confirmed the importance ofthe information on active fire positions as a guide in burnt area mapping. The presence of adetected active fire can help in mapping small burnt areas and in avoiding commission errors inthose cases where the burnt signal is not easily separable from the unburnt one.The methodology applied to detect active fires from VGT images performed quite well. Firescannot be extracted by simple threshold from the daytime images, but rather by taking advantageof their local contrast. On the contrary a simple thresholding on the SWIR band can be appliedwith the nighttime images. Nevertheless due to the small size of the study area it is difficult todraw conclusions on the accuracy in term of fire count.

5
This work highlighted some advantages and drawbacks of both VGT and AVHRR sensors forburnt area mapping purposes. As a perspective, a multi-satellite approach might combine theunique and positive aspects of each sensor and the detection of both active fires and burnt areas.Active fires, as detected by the World Fire Web network based on NOAA-AVHRR, could beused to guide burnt area mapping from SPOT-VEGETATION imagery. An improved procedurefor geo-location of the active fires is being developed to make this approach feasible. From anoperational point of view, the CTIV could consider the systematic production of VGT compositeimages using the criterion tested in this study.

6
REFERENCESBreiman L., J.H. Friedman, R.A. Olshen, and C.J. Stone, Classification and Regression Trees.Belmont, CA: Wadsworth Int., 1984.
Flasse, S. and Ceccato, P. (1996), A contextual algorithm for AVHRR fire detection,International Journal of Remote Sensing, 17(2):419-424.
Gao, B.-C. (1996), NDWI-A Normalized Difference Water Index for Remote Sensing ofVegetation Liquid Water From Space. Remote Sens. Environ. 58:257-266.
Graetz, R.D., Fisher R.P., Wilson M.A., and Campbell S. (1998). Looking back: the changingface of the Australian continent 1972-1992. CSIRO. Canberra, Australia.
Grégoire, J-M. and S. Pinnock (2000). The World Fire Web network-A satellite based system forglobally mapping fires in vegetation. Publication of the European Communities, S.P.I.00.11, 6 p.
Pereira, J.M.C. (1999), A comparative evaluation of NOAA/AVHRR vegetation indices forburned area detection and mapping in a Mediterranean-type region, IEEE Transactions onGeoscience and Remote Sensing, Vol.37, NO.1, pp.217-226.
Pinty, B. and Verstraete, M. (1992), GEMI: a non-linear index to monitor global vegetation fromsatellites. Vegetatio, 101:15-20.
Russell-Smith, J., Ryan P.G., and Durieu R. (1997), A LANDSAT-MSS-derived fire history ofKakadu National Park, monsoonal Australia, 1980-94: seasonal effect, frequency and patchiness.J. Appl. Ecol. 34, 748-66.
Saunders, R.W. and Kriebel, K.T. (1988), An improved method for detecting clear sky andcloudy radiances from AVHRR data. International Journal of Remote Sensing, 9:123-150
Stowe, L.L., McClain, E.P., Carey, R., Pellegrino, P., Gutman, G.G., Davis, P., Long, C. andHart, S. (1991), Global Distribution of cloud cover derived from NOAA/AVHRR operationalsatellite data. Advanced Space Research, 11(3): 51-54.

7
Figure 1. Vegetation map derived from the Atlas of Australian Resources (Australian Surveying and Land Information Group, Department of AdministrationServices, Canberra 1990) representing the spatial distribution of the present vegetation in the study area.
Kakadu National ParkLegend
Open forestWoodlandOpen woodlandLow woodlandLow open woodlandShrublandGrassland and PastureLitoral complexPermanent lake
8
Kakadu
NationalP
ark
Legen
d
Burn
t
Unburn
t
Figure 2. B
urnt are
a m
ap
derive
d for th
e co
mp
osite
VG
T im
age
for th
e pe
riod
Jun
e 1
st-10th
1999.

9
Figure 3. B
urnt area ma
p derived for the com
posite AV
HR
R im
age for the period June 5th-
13th 1999.

10
��
���
���
���
���
����
��
���
���
���
���
����
����������� ��
����� ���� ������ �
����������
a)
b)Figure 4. S
catter plots th
at qu
alitatively sh
ow
the
accuracy o
f the
bu
rnt area
ma
ps de
rived
from
AV
HR
R (p
an
el a) an
d V
GT
(pa
nel b) im
age
s usin
g visual interp
retatio
n o
f Lan
dsat-T
Ma
s reference
. ��
���
���
���
���
����
��
���
���
���
���
����
������������
����� ���� ������ �
����������
�� ������� �����

11
Figure 5. A
ctive fires d
etecte
d u
sing VG
T n
ighttime
ima
ges fro
m th
e 1
5th of June 1999 and
AV
HR
R d
aytim
e im
age
s from
the
15
th and 16 th of June
19
99. A
ctive fires a
re o
verlaid a
VG
Tim
age
(R-G
-B =
SW
IR-N
IR-re
d).
Active fires from
VG
T (June 15 th 1999) - nighttim
e
Active fires from
AV
HR
R (June 16 th 1999) - daytim
e
Active fires from
AV
HR
R (June 15 th 1999) - daytim
e