gone with the wind: estimating hurricane and climate ... · wp/16/199 gone with the wind:...
TRANSCRIPT

WP/16/199
Gone with the Wind: Estimating Hurricane and Climate Change Costs in the Caribbean
By Sebastian Acevedo
IMF Working Papers describe research in progress by the author(s) and are published to elicit comments and to encourage debate. The views expressed in IMF Working Papers are those of the author(s) and do not necessarily represent the views of the IMF, its Executive Board, or IMF management.

2
© 2016 International Monetary Fund WP/16/199
IMF Working Paper
Western Hemisphere Department
Gone with the Wind: Estimating Hurricane Climate Change Costs in the Caribbean
Prepared by Sebastian Acevedo*
Authorized for distribution by Trevor Alleyne
October 2016
Abstract
This paper studies the economic costs of hurricanes in the Caribbean by constructing a novel dataset that combines a detailed record of tropical cyclones’ characteristics with reported damages. I estimate the relation between hurricane wind speeds and damages in the Caribbean; finding that the elasticity of damages to GDP ratio with respect to maximum wind speeds is three in the case of landfalls. The data show that hurricane damages are considerably underreported, particularly in the 1950s and 1960s, with average damages potentially being three times as large as the reported average of 1.6 percent of GDP per year. I document and show that hurricanes that do not make landfall also have considerable negative impacts on the Caribbean economies. Finally, I estimate that the average annual hurricane damages in the Caribbean will increase between 22 and 77 percent by the year 2100, in a global warming scenario of high CO2 concentrations and high global temperatures.
JEL Classification Numbers: Q51, Q54, D81, O54
Keywords: Hurricane, tropical cyclone, climate change, climate impact, Caribbean.
Author’s E-Mail Address: [email protected]
* I would like to thank Arun Malik, Fred Joutz, Tara Sinclair, Trevor Alleyne, and participants at the TI/ERCConference “Combating Climate Change, Lessons from Macroeconomics, Political Economy and Public Finance” for useful comments and suggestions. Any remaining errors are my own.
IMF Working Papers describe research in progress by the author(s) and are published to elicit comments and to encourage debate. The views expressed in IMF Working Papers are those of the author(s) and do not necessarily represent the views of the IMF, its Executive Board, or IMF management.

I. INTRODUCTION
Hurricanes in the Caribbean are a major source of macroeconomic vulnerability. Intense hurricanes can cause damages that wipe out an entire year of GDP output (see Table 2), leaving countries with a fractured infrastructure, thousands of people affected, and governments scrambling to put together the necessary resources to finance emergency assistance and relief, recovery, and reconstruction. Yet, there are large information gaps in quantifying the magnitude of the historical damages, which is a critical first step to i) recognize and internalize1 the costs that hurricanes currently cause in Caribbean economies, and ii) prepare for the intensification of hurricanes that is expected to come with climate change. The Caribbean is one of the most vulnerable regions in the world to natural disasters (Rasmussen, 2004). In particular, to disasters caused by tropical cyclones; 15 Caribbean islands are in the top-25 positions of most tropical cyclone disasters per km2, and another 7 rank in the top-50.2 However, only 62 percent of the natural disasters caused by tropical cyclones over the last 65 years have data on the damages they caused. Furthermore, there is evidence that there is underreporting of disasters themselves, particularly in the 1950s and 1960s, because systematic recording of disasters only started in 1988 with the International Disaster Database (EM-DAT; Guha-Sapir, Below, and Hoyois, 2015). Therefore, this paper examines the economic costs of hurricanes in the Caribbean by constructing a novel dataset that combines a detailed record of tropical cyclones’ characteristics with reported damages. I estimate the relation between hurricane wind speeds and damages, that is, the damage function of tropical cyclones. This then allows me to estimate the historical costs of hurricanes that have no recorded information on damages, and to estimate future potential increase in damages in a climate change scenario of high CO2 concentrations. The paper makes three main contributions to the literature. First, the paper documents the underreporting of disasters and damages, and offers estimates of the missing damages. That is important because the first step to designing better policies to mitigate damages and adapt to future climate change is to have a good idea of the magnitude of the problem that Caribbean islands face.3 Second, I show that tropical cyclones that do not make landfall can
1 Internalize the costs refers to the need for the private and public sectors to properly insure or budget (e.g. rainy day fund) for the costs of natural disasters.
2 “A tropical cyclone is the generic term for a non-frontal synoptic scale low-pressure system over tropical or sub-tropical waters with organized convection (i.e. thunderstorm activity) and definite cyclonic surface wind circulation (Holland, 1993)” (NOAA, 2015d). Tropical cyclones are classified according to their wind speed as shown in the bottom table of Figure 1.
3 To design effective insurance schemes, it is important to know the frequency and the magnitude of damages, and having a better measure of those damages is a first step in the right direction. Also, having a more complete estimate of historical damages can help governments decide on the size and structure of the buffers they need to build to address the costs that natural disasters cause.

4
also cause extensive damages, and I explicitly account for the effect of distance between storms and the islands, while most of the literature either disregards non-landfall events or deals with the distance factor implicitly.4 Third, I estimate the wind-damage elasticity which is an important parameter for the literatures on atmospheric science and environmental economics. The parameter that links tropical cyclones wind speeds and economic damages has only been studied in a couple of papers, and most of them only do so for hurricane damages in the US (Schmidt et al, 2009; Nordhaus, 2010; Bouwer and Botzen, 2011; Mendelsohn et al 2012; Hsiang and Narita 2012; and Strobl, 2012).5 Given that the Caribbean is one of the most hurricane prone regions in the world, having a better understanding of the wind-damage relation in this region is an important benchmark for future research. Finally, this type of regional study benefits the macroeconomic literature that investigates the impact of climate change, and in particular provides important parameters to the damage function of Integrated Assessment Models (IAMs) that seek to estimate the social cost of carbon (SCC).6 These models have weaknesses that make policy analysis with them a challenging task. Two of the main criticisms highlighted by Stern (2013) and Pindyck (2013) is that IAM’s damage function (i.e. the impact of climate change) is ad hoc “with no theoretical or empirical foundation” (Pindyck, 2013); and that they almost exclude the possibility of catastrophic outcomes (Stern, 2013), which is one of the main drivers of the SCC.7 In this regard, this paper not only provides empirical evidence for the construction of better damage functions in IAMs, but it also illustrates cases of catastrophic outcomes (e.g., storms that cause damages well in excess of a 100 percent of GDP) and estimates the parameters that can generate those type of outcomes in Caribbean islands. The main results of the paper show that economic damages to the capital stock could be underestimated between 38 and 72 percent in the Caribbean, and could be as high as 5.7 percent of GDP annually, on average.8 The elasticity of damages to tropical cyclone’s wind speed is found to range between 2 and 3, depending on whether the storm makes landfall (elasticity of 3) or not. Finally, I also find that in a global warming scenario of high CO2
4 Section III.A explains in detail how the literature treats distance in regards to storms.
5 Hsiang and Narita (2012) are the only ones that have attempted to estimate the relation between wind and damages on a global sample. Section III provides a detailed description of this literature.
6 The main IAMs are PAGE, DICE and FUND. Chris Hope developed the Policy Analysis of the Greenhouse Effect (PAGE) model at the University of Cambridge, William Nordhaus developed the Dynamic Integrated Climate-Economy (DICE) model at Yale University, and Richard Tol developed the Climate Framework for Uncertainty, Negotiation and Distribution (FUND) model.
7 Despite simulating large increases in temperature IAMs do not generally produce large (i.e. catastrophic) damages from climate change, because the models do not capture well non-linearities that could result in very large damages.
8 A higher rate of capital depreciation will in turn have a negative impact on long term growth. Furthermore, frequent disasters where a country is unable to fully recover before the next one strikes have a pernicious effect on growth as shown by Hallegatte et al (2007).

5
concentrations and high global temperatures, storm damages could increase between 22 and 77 percent by the year 2100. The rest of the paper is structured as follows; Section II presents the data and stylized facts for the last 65 years of hurricane activity in the Caribbean; Section III estimates the wind-damage function and calculates the missing damages from the historical record. Section IV estimates the potential increase in storm damages due to climate change, and simulates damages in a climate change scenario with high global temperatures, and Section V concludes and discusses some policy recommendations. Finally, the appendix explains in detail the different data sources and the construction of the database.
II. DATA AND STYLIZED FACTS
The Caribbean sample studied in this paper includes 20 islands; and all references to the Caribbean throughout the paper are limited to them.9 There are three main data sources for disasters and tropical cyclones used in this paper; i) the International Disaster Database (EM-DAT; Guha-Sapir, Below, and Hoyois, 2015), ii) the Caribbean Hurricane Network (CHN; Van Dijken, 2015), and iii) the National Oceanic and Atmospheric Administration (NOAA, 2015a,b,c). The first source was used to obtain information on natural disasters caused by tropical cyclones and their corresponding damages, while the other two sources were used to obtain information on tropical cyclones’ characteristics (wind speed and distance to the island). Throughout the paper the terms tropical cyclone, hurricane, or storm are used interchangeably. The wind speeds prior to 1970 have been adjusted as in Emanuel (2015). The wind speeds reported by NOAA are the sustained one-minute average speeds at an altitude of 10 meters; however, the techniques and methods to estimate those winds have evolved over time resulting in lower wind speed estimates after 1970 (Emanuel, 2005). Therefore, Emanuel (2005, and 2015) devised an adjustment to correct wind speeds prior to 1970 based on Landsea’s (1993) work. The adjustment is only for winds between 45 and 120 knots:
1 0.1445
75 ( 1 )
where v is the original wind speed and v’ is the adjusted one. The information from EM-DAT suggests that there is a positive trend in disasters caused by tropical cyclones both globally and in the Caribbean (Figure 1, top charts). However, either globally or in the Caribbean there appears to be a deceleration in the number of disasters over the last 7 years. What these charts do not show, though, is that at least in the case of the Caribbean the trend is partly caused by better reporting of natural disasters, as is shown in the bottom right chart of Figure 1. The EM-DAT database started to record disasters in 1988, so 9 Some of the islands included in this study are not independent states; nonetheless, throughout the paper they will be indistinctly referred to as islands or countries. A complete list of the islands included in the paper as well as a detailed description of the data sources are in the Data Appendix.

6
all the disasters that happened before that year had to be extracted from news or official reports. Therefore, it is likely that the database underreports the frequency of older events, particularly smaller ones that are less likely to generate official reports or extensive news coverage.
Figure 1. Disasters Caused by Tropical Cyclone Activity, 1950-2014
EM-DAT has 238 records of disasters in the Caribbean caused by tropical cyclones between 1950 and 2014 (Table 2A in the Appendix). However, during the same period there were 581 tropical cyclones (298 tropical storms, and 283 hurricanes) that either made landfall or passed within 69 miles of Caribbean islands. This suggests that the number of disasters in EM-DAT might be underreported, particularly in the earlier years (1950s and 60s), as can be seen in the bottom right chart of Figure 1. Nevertheless, it must be noted that not all tropical cyclones that pass close to an island in the Caribbean should result in a natural disaster as the threshold for that classification requires at least 100 people affected, or at least 10 people killed, or a state of emergency to be declared.10
10 See Data Appendix for the exact definition of a natural disaster according to EM-DAT.
0
10
20
30
40
50
60
70
80
1950
1954
1958
1962
1966
1970
1974
1978
1982
1986
1990
1994
1998
2002
2006
2010
2014
Disasters5-year moving avg.
World: Disasters from Tropical Cyclone Activity(Number of disasters)
Sources: EM-DAT; and author's calculations.
0
5
10
15
20
25
1950
1954
1958
1962
1966
1970
1974
1978
1982
1986
1990
1994
1998
2002
2006
2010
2014
Disasters5-year moving avg.
Caribbean: Disasters from Tropical Cyclone Activity (Number of disasters)
Sources: EM-DAT; and author's calculations.
min. max. min. max. min. max.Tropical depression 39 34 63Tropical storm 39 73 34 63 63 117Hurricane
Category 1 74 95 64 83 119 153Category 2 96 110 83 96 154 177Category 3 111 129 96 112 179 208Category 4 130 156 113 136 209 251Category 5 157 136 253
Saffir-Simpson Hurricane Wind Speed Scale
m/h kts/h km/h
0
5
10
15
20
25
1954
1958
1962
1966
1970
1974
1978
1982
1986
1990
1994
1998
2002
2006
2010
Disasters
Tropical clyclones
Caribbean: Disaster and Tropical Cyclon Activity(Number of disasters and storms, 5-year moving averages)
Sources: EM-DAT; CHN; NOAA; and author's calculations.

7
The weakest component of EM-DAT, however, is the paucity of damages’ recording, as the information is not always available from reliable sources. Of the 238 Caribbean disasters due to storms, only 140 had information on damages (this data is complemented with other sources, see Appendix for details). Furthermore, small damages only appear in the 1990s (see Figure 2) suggesting that in the previous four decades disasters that caused small damages were underreported.
Figure 2. Tropical Cyclone Damages in the Caribbean, 1950-2014
The total damages experienced in the Caribbean over the past 65 years amount to US$52 billion (in constant 2010 US$) for the 148 disasters with information on damages.11 The average disaster caused damages of US$352 million (in constant 2010 US$), with damages from more intense storms, normally causing larger damages as expected. Although, there appears to be an increasing trend in damages in Table 1, after controlling for GDP the trend disappears as seen in Figure 2.
Table 1. Damages per Decade, 1950-2014 (2010 constant US$ millions)
11 The main source of the damages is EM-DAT and some supplementary sources as discussed in the Appendix.
Tropical storm 98 567 186 214 1,054 2,119 32 66Hurricane
Category 1 390 125 174 965 3,761 2,631 535 8,582 28 306Category 2 202 23 5,118 155 284 5,782 17 340Category 3 7 2,998 3,459 3,701 4,467 14,633 22 665Category 4 1,714 111 2,910 2,626 9,958 17,319 44 394Category 5 2,487 1,020 228 3,734 5 747
Total 397 5,137 3,338 8,563 15,421 18,494 819 52,169 148 352
2010-14
Sources: EM-DAT; CHN; NOAA; and author's calculations.
# ofDisasters
AverageDamages
Total1950s 1960s 1970s 1980s 1990s 2000s

8
Almost half of the damages (US$24.3 billion) were the result of the largest disaster in each island (Table 2). Those storms caused on average damages of 82 percent of GDP, and for most islands account for more than half of all the damages they have experienced over the last 65 years. Some of the largest disasters in each island, particularly for the smaller islands, caused damages well above 100 percent of GDP; with Montserrat leading the pack with 434 percent of GDP in damages after hurricane Hugo hit the country in 1989. The impact of a natural disaster is felt mostly in the destruction of the capital stock; that is, damages to housing, agricultural crops, roads, buildings, etc. Since the capital stock, in monetary terms, is usually larger than the total production of a country on any given year, it is possible to have disasters that destroy more than a 100 percent of GDP.
Table 2. Damages per Island, 1950-2014 (2010 constant US$ millions)
It must be noted that half of the largest disasters were caused by storms that did not make landfall in one of the islands, highlighting the importance of not limiting the study of tropical cyclones to only those that make landfall. On average, hurricanes in the north Atlantic generate winds of tropical storm strength (34 knots) that extend for 150 miles, but the largest
Storm Year Wind SS Distance Landfall Damages % of GDPAnguilla1 3 209 Donna 1960 120 H4 2 Yes 205Antigua and Barbuda 6 809 Luis 1995 120 H4 4 Yes 470 60.1Bahamas 10 3,185 Frances 2004 120 H4 7 Yes 1,136 14.1Bermuda 3 449 Fabian 2003 105 H3 23 350 7.2Barbados 4 178 Emily 1987 40 TS 48 169 5.8British Virgin islands 2 16 Marilyn 1995 95 H2 32 13 2.5Cuba1 19 15,054 Flora 1963 104 H3 21 Yes 2,825Cayman Islands 5 3,976 Ivan 2004 135 H4 28 3,896 128.9Dominica 8 715 Lenny 1999 120 H4 228 272 67.8Dominican Republic 14 6,084 Georges 1998 105 H3 27 Yes 2,543 9.7Grenada 3 1,141 Ivan 2004 115 H4 7 1,010 148.4Haiti 14 2,898 Flora 1963 125 H4 66 Yes 1,017 74.1Jamaica 20 5,556 Gilbert 1988 110 H3 4 Yes 3,266 49.7Montserrat 2 404 Hugo 1989 125 H4 14 377 434.1Puerto Rico 11 8,637 Georges 1998 95 H2 15 Yes 4,493 6.0St. Kitts and Nevis 4 1,416 Georges 1998 100 H3 4 Yes 1,027 220.5St. Lucia 8 626 Allen 1980 115 H4 11 536 155.2St. Vincent and the Grenadines 6 113 Allen 1980 115 H4 34 37 23.3Trinidad and Tobago 4 188 Flora 1963 97 H3 6 Yes 169 4.5Turks and Caicos 2 513 Ike 2008 115 H4 23 510 58.0Total / Average2 148 52,169 109 30 24,322 81.7
Sources: EM-DAT; CHN; NOAA, UN; and author's calculations.Notes: Wind speed in knots per hour, data before 1970 adjusted for changes in measurement techniques, as in Emanuel (2015). SS is the Saffir-Simpson Hurricane Wind Speed Scale. Distance from country's weather station (usually at the airport) in miles.For most countries, the storm with the largest damages in 2010 constant US$ and the one with the largest damages in percent of GDP coincide; however, in Anguilla hurricane Klaus in 1984 created the largest damges (9.8% of GDP, or US$4 million). In Cuba it was hurricane Georges in 1998 the one that created the largest damages in percent of GDP (7.8% of GDP, or US$2,567 million). Hurricne David in 1979 created the largest damages in percent of GDP in both Dominica and the Dominican Republic (85.1% of GDP or US$111 million, and 14.7% of GDP or US$2,487 million, respectively).1 GDP data not available in 1960 for Anguilla nor in 1963 for Cuba. 2 Total for the columns Disasters and Damages, and averages for the columns Wind, Distance and % of GDP (in blue).
DisastersTotal
DamagesTropical Cyclone with Largest Damages in 2010 constant US$ millions
9
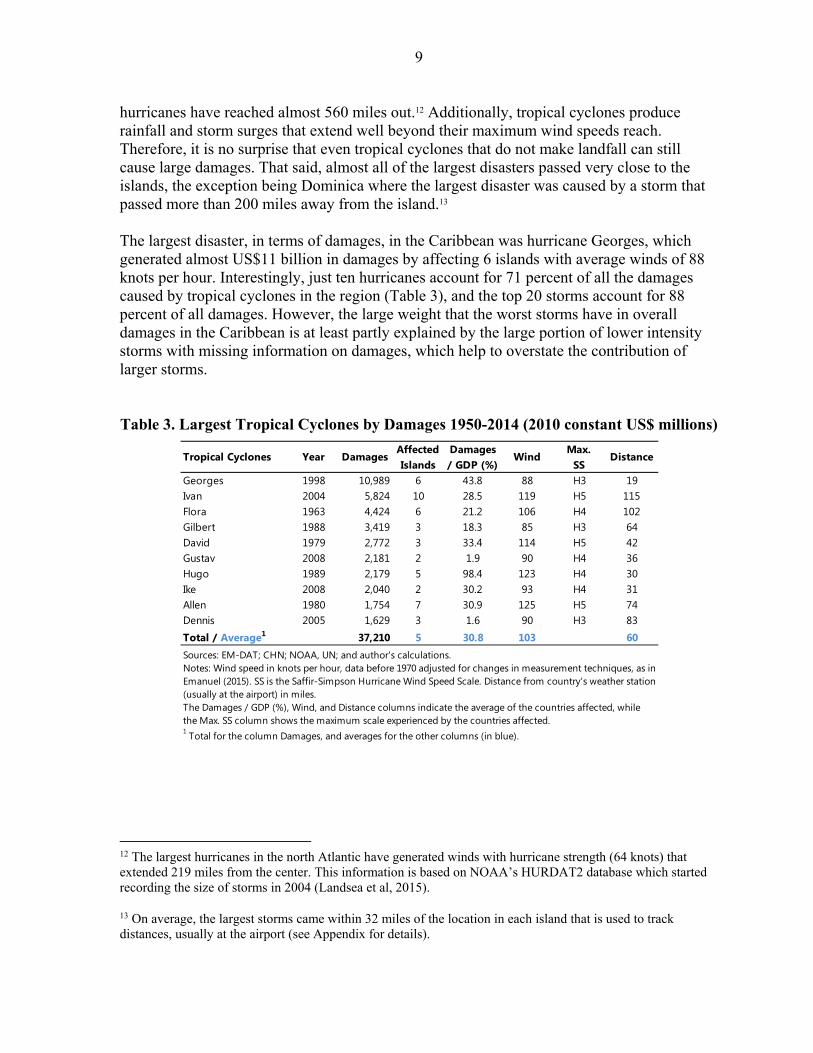
hurricanes have reached almost 560 miles out.12 Additionally, tropical cyclones produce rainfall and storm surges that extend well beyond their maximum wind speeds reach. Therefore, it is no surprise that even tropical cyclones that do not make landfall can still cause large damages. That said, almost all of the largest disasters passed very close to the islands, the exception being Dominica where the largest disaster was caused by a storm that passed more than 200 miles away from the island.13 The largest disaster, in terms of damages, in the Caribbean was hurricane Georges, which generated almost US$11 billion in damages by affecting 6 islands with average winds of 88 knots per hour. Interestingly, just ten hurricanes account for 71 percent of all the damages caused by tropical cyclones in the region (Table 3), and the top 20 storms account for 88 percent of all damages. However, the large weight that the worst storms have in overall damages in the Caribbean is at least partly explained by the large portion of lower intensity storms with missing information on damages, which help to overstate the contribution of larger storms. Table 3. Largest Tropical Cyclones by Damages 1950-2014 (2010 constant US$ millions)
12 The largest hurricanes in the north Atlantic have generated winds with hurricane strength (64 knots) that extended 219 miles from the center. This information is based on NOAA’s HURDAT2 database which started recording the size of storms in 2004 (Landsea et al, 2015).
13 On average, the largest storms came within 32 miles of the location in each island that is used to track distances, usually at the airport (see Appendix for details).
Tropical Cyclones Year DamagesAffected Islands
Damages / GDP (%)
WindMax.
SSDistance
Georges 1998 10,989 6 43.8 88 H3 19Ivan 2004 5,824 10 28.5 119 H5 115Flora 1963 4,424 6 21.2 106 H4 102Gilbert 1988 3,419 3 18.3 85 H3 64David 1979 2,772 3 33.4 114 H5 42Gustav 2008 2,181 2 1.9 90 H4 36Hugo 1989 2,179 5 98.4 123 H4 30Ike 2008 2,040 2 30.2 93 H4 31Allen 1980 1,754 7 30.9 125 H5 74Dennis 2005 1,629 3 1.6 90 H3 83Total / Average1 37,210 5 30.8 103 60Sources: EM-DAT; CHN; NOAA, UN; and author's calculations.Notes: Wind speed in knots per hour, data before 1970 adjusted for changes in measurement techniques, as in Emanuel (2015). SS is the Saffir-Simpson Hurricane Wind Speed Scale. Distance from country's weather station (usually at the airport) in miles.The Damages / GDP (%), Wind, and Distance columns indicate the average of the countries affected, while the Max. SS column shows the maximum scale experienced by the countries affected. 1 Total for the column Damages, and averages for the other columns (in blue).

10
III. ESTIMATING THE WIND-DAMAGE FUNCTION
There are only a handful of papers that have estimated the relationship between wind speed and tropical cyclones damages, and most of them have done so only for the US (Schmidt et al, 2009; Nordhaus, 2010; Bouwer and Botzen, 2011; Mendelsohn et al 2012; Hsiang and Narita 2012; and Strobl, 2012). Initially, the climate and atmospheric science literature (Emanuel, 1999) established that the kinetic energy generated by tropical cyclones increases to the cubic power of wind speeds. For example, the relation between the potential power generation of wind turbines and wind velocity is given by the cube of wind speed. Therefore, Emanuel (2005) based on the work of Southern (1979) suggests that monetary loses generated by storms also increase to the cube of wind speeds.14 Nordhaus (2006, 2010)15 was the first to estimate the wind-damages relation using rigorous statistical techniques. Using data on US tropical cyclone landfalls and damages, Nordhaus found what he called the “ninth-power law of damages” because the elasticity of damages to wind speeds he estimated was about 9. Later Bouwer and Botzen (2011) estimated the same specification used by Nordhaus (2010) but with a different set of data on US damages based on Pielke et al (2008)16, and found that the wind-damages relation had an elasticity of between 6 and 8. Strobl (2012) using the same Pielke et al (2008) data found that damages increase to the 3.8 power of wind speed.17 Schmidt et al (2009) constructed a capital stock index for each US county affected by tropical cyclones and estimated that the elasticity of damages to wind speed is about 2.8. More recently, Mendelsohn et al (2012) estimated the elasticity to be almost 5 for the US. The only paper that explores the wind-damages relation outside the US is Hsiang and Narita (2012). They use the EM-DAT database and a wind-field model to search for indications of adaptation to tropical cyclones, and in the process they estimate that the semi-elasticity of damages to wind speed is 0.10, indicating that an increase in wind speed of 1.9 knots increases damages by 10 percent.18 A weakness of their paper is that they aggregate the data at an annual frequency (instead of a storm by storm level) and in their preferred measure of storm intensity they use the maximum wind speed experienced in a year. The problem is that countries in some years can experience multiple storms that create damages and Hsiang and 14 Strobl (2012) indicates that Emanuel’s (2005) “cubic” relation between damages and wind speed was based on a few figures found in Southern (1979). However, Pielke and Landsea (1999) had also suggested that damages increased at least to the square of wind speeds.
15 Nordhaus’ (2006) NBER working paper was later published as Nordhaus (2010).
16 Pielke et al (2008) normalize hurricane damages accounting for changes in inflation, per capital wealth and population.
17 Strobl does not show the exact specification used in his estimation because it is not central to his paper, he only mentions that he includes a “set of time dummies”.
18 Hsiang and Narita is also the only paper that uses a log-lin functional form to estimate the relation between damages and wind speed. All the other papers estimate log-log models.

11
Narita are attributing all those damages to the maximum wind speed of the most intense storm.19 In an alternative measure of storm intensity they use the energy released by all the storms in a year; however, this measure is also problematic when aggregating damages over a year, because there are many cases where a country suffers multiple disasters in a year but EM-DAT only has information on damages for some of them. Hence the authors are likely underestimating the effect of the total energy released by the storms on economic damages.
A. The Functional Form
Wind speed Most of the literature uses a log-log functional form to estimate the wind-damages relation. That is, the functional form assumed for the relation is the following:
( 2 )
where D are the damages for storm i, in country j, in year t; Y is country’s j nominal GDP, and Wind is the maximum wind speed for each storm. Taking logs on both sides of (1) we end up with a linear relationship in the parameters that can be estimated using standard econometric techniques;
. ( 3 )
However, as mentioned before, Hsiang and Narita (2012) use a different functional form, because they find that a log-lin relationship between damages and wind speeds fits their data better, and because they believe that some of the estimates found previously with the log-log functional form (Nordhaus, 2010; and Mendelsohn, 2012) were too high.20 In this paper I use the log-log relation most commonly found in other papers because I find that it minimizes the root mean square error (RMSE) of the damages to GDP ratio compared to the log-lin specification used by Hsiang and Narita.21 Using the log-log functional form has some advantages; i) the interpretation of the coefficient is intuitive as it indicates the elasticity of damages to an increase in wind speed; ii) the comparison with most other studies is straight forward; iii) it has a theoretical background in the physics and atmospheric
19 In the Caribbean alone there are 16 cases where an island has two or more disasters with reported damages in the same year.
20 Mendelsohn et al, find that the log-log functional form fits their data better than semi-log or linear functional forms.
21 Nevertheless, it must be said, that the log-lin specification shows a better fit in some of the estimations, although the differences tend to be small.
12
literature (Emanuel 1999 and 2005). The theoretical background, however, refers only to the relation between wind speed and energy generation, and its extrapolation to the wind-damages relation is not necessarily correct. Distance The previous literature has dealt with the effect of distance, that is, how close a storm passes to a country, by either focusing only on tropical cyclones that make landfall (that is the case for all the studies that focus only on the US), or by using wind-field models.22 Using a wind-field model has the advantage of providing a more precise measure of the wind speeds that affected each grid-cell; however, the quality and accuracy of those estimates depend on how good the wind-field model is in incorporating the atmospheric and climatological characteristics of tropical cyclones.23 In this paper, I use a simpler approach, dealing with distance in an explicit manner in the estimations by introducing the distance between a fixed location in each island (usually the weather station at the airport) and the tropical cyclone at its closest point of approach to that location. Alternatively, I could concentrate only on storms that make landfall, but as I have shown in the previous section, half of the largest disasters in each country were caused by non-landfall storms. Additionally, only about a third of the tropical cyclone disasters in EM-DAT were caused by landfalls, and only 20 percent of tropical cyclones passing within 69 miles of the islands actually make landfall in one of them. Therefore, to have a good measure of the costs that tropical cyclones cause in the Caribbean it is important to understand and study the effects of non-landfall storms as well. It must be noted, however, that the measure of distance used in this paper is not necessarily the best one, particularly for larger countries (as discussed in detail in the Appendix). Ideally, the distance measure would be constructed as a weighted average of the closest point of approach of the storm to the main cities in each island, using regional output or population as the weights. Such a measure of distance would better capture the economic impact of tropical cyclones on the capital stock. The model specification Figure 3 illustrates the basic relation estimated below; with damages in percent of GDP as a function of wind speeds and distance. The chart on the left nicely shows that as wind speed increases, and the distance to the storm declines the damages that tropical cyclones cause increase. The chart on the right shows the contour of the surface chart on the left indicating where the different observations fall (black dots).
22 Wind-field models estimate the maximum wind speeds experienced in each geographic location within reach of the center of the storm by dividing the world into a fine grid (for example, a 0.1° × 0.1° grid as in Hsiang and Narita, 2012). Schmidt et al (2009) also use a wind-field model for their estimations.
23 For example, the wind speed a particular grid-cell is exposed to depends not only on the distance between that cell and the center of the storm, but also on how fast the storm is moving, and the angle at which the storm is approaching, or moving away from the cell.

13
Figure 3. Tropical Cyclone Damages as a Function of Wind and Distance
Sources: EM-DAT; CHN; NOAA; and author's calculations. Note: Wind speed in knots per hour, data before 1970 adjusted for changes in measurement techniques, as in Emanuel (2015). Distance from country's weather station (usually at the airport) in miles. The benchmark wind-damage function I estimate is:
( 4 )
where Damages/GDP for each storm i, in island j, at year t, is regressed on the maximum Wind speed achieved by the storm within 138 miles of the island measured in knots per hour, Distance which is the closest point of approach of the storm to the weather station (usually the airport), and is measured in miles, and a time trend Year. j captures time-invariant country fixed effects, such as, geological or geographical vulnerabilities to storms, and ijt is the error term. The sample includes 20 countries, with data from 1963 to 2012 for a total of 135 observations, and the equation is estimated using panel fixed-effects. The model specification is similar to the one used by Nordhaus (2010); the main difference is that I control for the effect of distance in the specification, and that my model is a panel for Caribbean islands. Nordhaus includes the time trend to identify if damages are increasing over time, which could be evidence that global warming has intensified the effects of tropical cyclones. He finds that damages have been growing at a rate of 3.5 percent per year; however, Bouwer and Botzen (2011) find no trend in their estimations. I include the time trend not only to test if there is a trend in damages in the Caribbean, but also to control for the reporting of smaller disasters in the 1990s, and for potential stationarity problems with the dependent variable.24 I also tried an alternative specification with time-fixed-effects which shows result consistent with the ones in Table 4. However, for the estimations with
24 A formal test of stationarity of the variables is not possible given that those tests require time series without gaps, which is not possible in a dataset of tropical cyclone damages that do not occur on a constant frequency. However, Figure 2 suggests that there is no trend in the log of the Damages to GDP ratio.

14
smaller samples the time-fixed-effects rapidly consume degrees of freedom and the results are counterintuitive and inconsistent with some of the ones presented below.25 Hence, the time trend specification is the one used throughout the paper, but the results with time-fixed-effects are available upon request. Different functional forms for the three main variables in the estimation (Damages/GDP, Wind and Distance) were tried to find the best fit; including splines of the Wind and Distance variables, as well as different combinations of the log-log, and log-lin model. A quadratic term for the Wind variable, and an interaction term between Wind and Distance were also explored, but both the quadratic and interaction terms were not statistically significant. The specification presented in (4) had a better fit than all the specifications (except the one with Wind not in logs); however, specification (4) turned out to have the lowest RMSE when comparing the predicted Damages/GDP with the actual values.26 Since the paper seeks to estimate the historical under-reported damages in the Caribbean and to simulate the potential costs of climate change, having a low RMSE was an important consideration in determining the benchmark model to be estimated.
B. The results
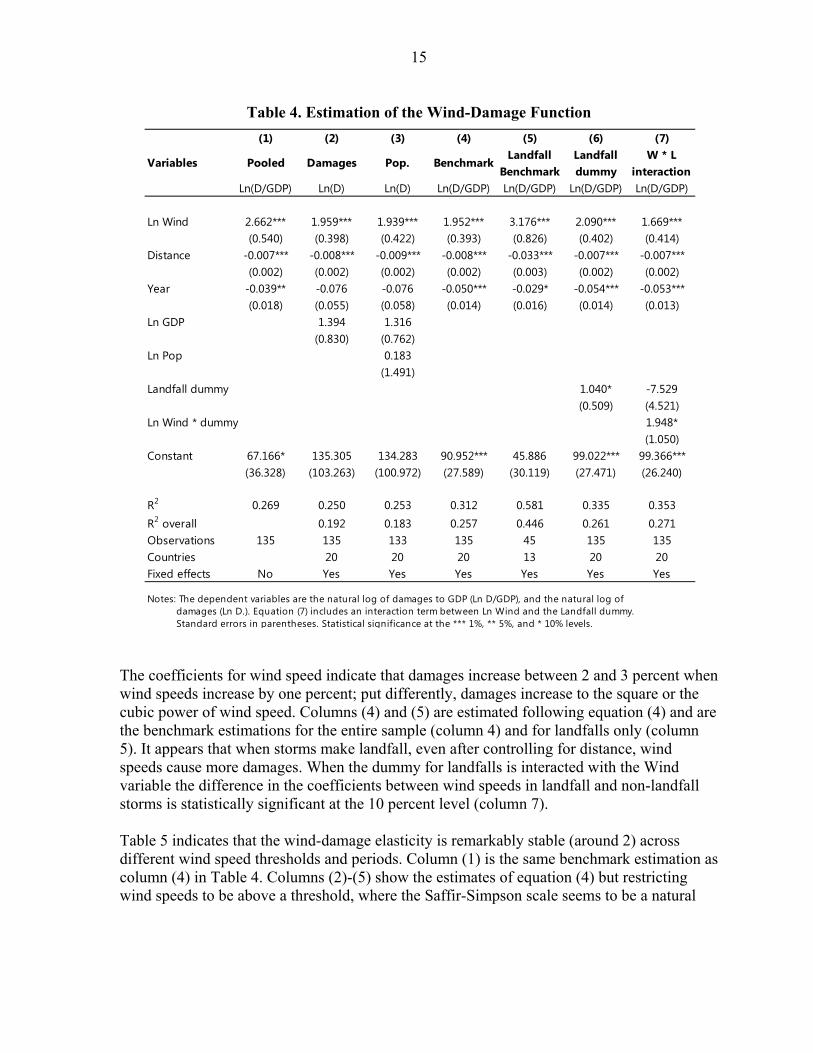
The main estimation results are presented in Table 4. The first column shows the results for a pooled estimation (column 1); that is without treating each island independently, and estimating their corresponding fixed effects, which shows a higher elasticity of wind speed to damages. Column (2) shows that when regressing the log of damages on Wind, Distance, and nominal GDP, the coefficient for GDP is borderline significant (at the 11 percent level); however, column (3) shows that Population is not a relevant control for the wind-damages function.27 This last result is consistent with the findings of Mendelsohn et al (2012) who also find population to be insignificant in their estimations for the US. This suggests that it is not necessary to normalize tropical cyclone damages by population as some of the literature does (Pielke and Landsea, 1998; Pielke et al, 2003; and Pielke et al, 2008). It is enough to control for inflation and economic growth as done in this paper, or to control for wealth or for the capital stock as some other papers have done. Neumayer and Barthel (2011) also make a similar point in their paper suggesting that normalizing for population might be redundant if one is already normalizing for total wealth.
25 With time-fixed-effects the wind coefficient for the estimation with hurricanes category 4 and above (column (5) of Table 5) is no longer statistically significant. And in the corresponding estimations with time-fixed-effects to those of landfalls (Table 6) most of the coefficients for wind are not significant with the exception of the one in column (1) which is still significant.
26 The overall R square of the alternative estimation with Wind not in logs (0.2573) is only marginally higher than the estimation of equation (4) which is 0.2569.
27 A test of the hypothesis : 1 for the estimations in columns (2) and (3) finds that the null hypothesis cannot be rejected in both cases. This indicates that it makes economic sense to divide the dependent variable (Damages) by GDP, as is done in the rest of the models.
15
Table 4. Estimation of the Wind-Damage Function
The coefficients for wind speed indicate that damages increase between 2 and 3 percent when wind speeds increase by one percent; put differently, damages increase to the square or the cubic power of wind speed. Columns (4) and (5) are estimated following equation (4) and are the benchmark estimations for the entire sample (column 4) and for landfalls only (column 5). It appears that when storms make landfall, even after controlling for distance, wind speeds cause more damages. When the dummy for landfalls is interacted with the Wind variable the difference in the coefficients between wind speeds in landfall and non-landfall storms is statistically significant at the 10 percent level (column 7). Table 5 indicates that the wind-damage elasticity is remarkably stable (around 2) across different wind speed thresholds and periods. Column (1) is the same benchmark estimation as column (4) in Table 4. Columns (2)-(5) show the estimates of equation (4) but restricting wind speeds to be above a threshold, where the Saffir-Simpson scale seems to be a natural
(1) (2) (3) (4) (5) (6) (7)
Ln(D/GDP) Ln(D) Ln(D) Ln(D/GDP) Ln(D/GDP) Ln(D/GDP) Ln(D/GDP)
Ln Wind 2.662*** 1.959*** 1.939*** 1.952*** 3.176*** 2.090*** 1.669***(0.540) (0.398) (0.422) (0.393) (0.826) (0.402) (0.414)
Distance -0.007*** -0.008*** -0.009*** -0.008*** -0.033*** -0.007*** -0.007***(0.002) (0.002) (0.002) (0.002) (0.003) (0.002) (0.002)
Year -0.039** -0.076 -0.076 -0.050*** -0.029* -0.054*** -0.053***(0.018) (0.055) (0.058) (0.014) (0.016) (0.014) (0.013)
Ln GDP 1.394 1.316(0.830) (0.762)
Ln Pop 0.183(1.491)
Landfall dummy 1.040* -7.529(0.509) (4.521)
Ln Wind * dummy 1.948*(1.050)
Constant 67.166* 135.305 134.283 90.952*** 45.886 99.022*** 99.366***(36.328) (103.263) (100.972) (27.589) (30.119) (27.471) (26.240)
R2 0.269 0.250 0.253 0.312 0.581 0.335 0.353R2 overall 0.192 0.183 0.257 0.446 0.261 0.271Observations 135 135 133 135 45 135 135Countries 20 20 20 13 20 20Fixed effects No Yes Yes Yes Yes Yes Yes
W * Linteraction
Notes: The dependent variables are the natural log of damages to GDP (Ln D/GDP), and the natural log of damages (Ln D.). Equation (7) includes an interaction term between Ln Wind and the Landfall dummy. Standard errors in parentheses. Statistical significance at the *** 1%, ** 5%, and * 10% levels.
LandfallBenchmark
Variables Pooled Damages Pop. BenchmarkLandfall dummy

16
candidate.28 The last two columns restrict the period included in the sample to make sure that the correction made to wind speeds before 1970 was not driving the results, and it is not; and to assess the effect of the recording of smaller damages starting in the 1990s. Regarding this last point, it is interesting to note that the trend coefficient which is negative and statistically significant for most of the estimations in Tables 4 and 5, is no longer significant and in fact changes sign if the sample is restricted to storms that happened after 1990. Therefore, the damages to GDP ratio in the Caribbean does not seem to have a trend as the negative sign is consistent with the fact that smaller damages only started to be systematically reported in the 1990s.
Table 5. Estimation of the Wind-Damage Function (for different wind speeds and periods)
The results in Table 6 show that the wind coefficient is less stable when estimating the results only for landfalls. Given that the sample is considerably smaller in the case of landfalls, and that it is further restricted with the Saffir-Simpson wind thresholds, it is not surprising that results are less stable. Nonetheless, the coefficients remain within reasonable values when compared to the literature. Column (1) presents the same specification as column (5) in Table 4. Column (2) shows the importance of controlling for distance even in the case of landfalls, because tropical cyclones can make landfall in remote areas where they can cause lower economic damages. Given that the distance variable measures how close the storm passed
28 The estimation could not be performed for hurricanes category 5 because there were not enough observations.
(1) (2) (3) (4) (5) (6) (7)
≥ H1 ≥ H2 ≥ H3 ≥ H4 > 1980 > 1990Ln(D/GDP) Ln(D/GDP) Ln(D/GDP) Ln(D/GDP) Ln(D/GDP) Ln(D/GDP) Ln(D/GDP)
Ln Wind 1.952*** 1.937** 2.083*** 1.654*** 1.890*** 2.045*** 2.256***(0.393) (0.889) (0.565) (0.468) (0.214) (0.430) (0.619)
Distance -0.008*** -0.010*** -0.010*** -0.011*** -0.009*** -0.009*** -0.009***(0.002) (0.002) (0.002) (0.002) (0.001) (0.002) (0.003)
Year -0.050*** -0.043** -0.049*** -0.056*** -0.053*** -0.043* 0.019(0.014) (0.015) (0.016) (0.018) (0.014) (0.021) (0.043)
Constant 90.952*** 77.980** 90.075** 105.590*** 99.565*** 76.876* -48.512(27.589) (32.510) (32.505) (34.819) (27.293) (43.071) (84.087)
R2 0.312 0.310 0.411 0.477 0.466 0.263 0.235R2 overall 0.257 0.226 0.252 0.264 0.243 0.251 0.220Observations 135 107 84 68 49 120 94Countries 20 20 20 19 16 20 20Fixed effects Yes Yes Yes Yes Yes Yes Yes
Saffir-Simpson Hurricane Wind Scale YearVariables Benchmark
Notes: The dependent variable is the natural log of damages to GDP (Ln D/GDP). Model (1) is the same as model (4) in Table 4. Standard errors in parentheses. Statistical significance at the *** 1%, ** 5%, and * 10% levels.

17
from the weather station at the airport, the model controls for how close the storm passed to an important center of economic activity. When the variable Distance is excluded from the estimation in column (2), the coefficient for Wind is lower as a consequence of a misspecified model that biases it.
Table 6. Estimation of the Wind-Damage Function for Landfalls (for different wind speeds and periods)
Estimating historical tropical cyclone damages in the Caribbean Given the incomplete record on tropical cyclone damages in the Caribbean a logical next step is to use the estimations done here to construct a more complete record of historical tropical cyclone damages in the region. I use the estimations in columns (4) and (5) of Table 4, including the time-trend, to estimate the damages caused by tropical cyclones that did not make landfall (column 4), and for those that made landfall (column 5) for each island with the data on wind speeds and distance of the storms collected in the database. It is safe to assume that all disasters caused by tropical cyclones in the EM-DAT database should have caused at least some damages. Given that those events killed at least 10 people, or affected at least 100 people, or triggered a state of emergency declaration or a call for international assistance, it seems reasonable that they should have also caused some economic damages. Table 7 shows the annual average damages, in percent of GDP, for each country for the period 1950-2014; the first column shows the actual damages in the EM-DAT
(1) (2) (3) (4) (5) (6) (7)
≥ H1 ≥ H2 ≥ H3 > 1980 > 1990Ln(D/GDP) Ln(D/GDP) Ln(D/GDP) Ln(D/GDP) Ln(D/GDP) Ln(D/GDP) Ln(D/GDP)
Ln Wind 3.176*** 2.713** 1.915*** 4.006*** 5.791*** 3.270*** 2.995***(0.826) (0.927) (0.611) (0.931) (1.655) (1.019) (0.937)
Distance -0.033*** -0.037*** -0.028*** -0.022*** -0.033*** -0.032***(0.003) (0.003) (0.003) (0.001) (0.003) (0.002)
Year -0.029* -0.037** -0.054 0.003 0.119*** -0.039 -0.043(0.016) (0.014) (0.043) (0.032) (0.022) (0.023) (0.032)
Constant 45.886 63.091** 100.789 -21.957 -261.234*** 64.949 74.540(30.119) (27.177) (85.449) (64.651) (51.766) (42.181) (60.984)
R2 0.581 0.371 0.555 0.613 0.761 0.562 0.516R2 overall 0.446 0.383 0.433 0.551 0.0261 0.415 0.400Observations 45 45 35 24 17 42 36Countries 13 13 12 9 8 13 12Fixed effects Yes Yes Yes Yes Yes Yes Yes
Saffir-Simpson Hurricane Wind Scale YearVariables
Exlc. Distance
LandfallBenchmark
Notes: The dependent variable is the natural log of damages to GDP (Ln D/GDP). Model (1) is the same as model (5) in Table 4. Standard errors in parentheses. Statistical significance at the *** 1%, ** 5%, and * 10% levels.

18
database29, while the second column shows the estimated damages for all disasters (including the damages in column 1). One could even go further, and assume that additional to the disasters recorded in EM-DAT any tropical cyclone that passed within 60 miles of each island with hurricane strength winds would also likely cause economic damages. Column 3 shows those damages (including the ones in the previous two columns). These straightforward assumptions suggest that tropical cyclone damages in the Caribbean could be underestimated by between 38 and 72 percent. If we were to limit damages to only storms that were recorded as disasters in EM-DAT, average Caribbean damages would be 1.6 times higher than what is actually recorded, and would have caused average damages of 2.5 percent of GDP each year among the countries in the sample. However, this number might still be underestimating the historical costs of hurricanes in the Caribbean. As shown above, the recording of disasters themselves might be underreported in the 1950s and 1960s in EM-DAT, and meeting the conditions to be classified as a disaster might be too restrictive in regards to damages. For example, in October 2014 hurricane Gonzalo passed right on top of Antigua and Barbuda, but it was not recorded as a disaster in EM-DAT; however, it was estimated that Gonzalo (a category 1 hurricane when passing Antigua) caused damages assessed at US$8.2 million (about 0.7 percent of GDP) according to news reports (Johnson, 2014). Assuming that all storms with hurricane strength winds that passed within 60 miles of the islands caused damages (335 storms including the 238 disasters in EM-DAT), the average island in the sample would have sustained annual damages of 5.7 percent of GDP over the past 65 years. Table A3 in the Appendix, shows the actual and estimated damages by decade, and corroborates that it is in the 1950s and 1960s were most of the underreporting of damages occurs. However, in the 1990s there is also a large discrepancy between reported damages (3.2 percent of GDP on average), and estimated damages (5 percent of GDP). The large difference between the simple and weighted averages for the Caribbean presented in Table 7 is due to the fact that the smaller islands in the eastern Caribbean (Antigua and Barbuda, Dominica, Grenada, Montserrat and St. Kitts and Nevis) suffer bigger damages when hurricanes strike. Given their small land area a hurricane strike is more likely to affect the entire country when compared to bigger islands such as Cuba or the Dominican Republic. The islands where the damages information from EM-DAT are more underestimated are Antigua and Barbuda, Grenada, and Cuba; that is, comparing columns 2 and 3 in Table 7. But, the islands with most underestimated damages in total (comparing columns 2 and 4 of Table 7) are the British Virgin Islands, Grenada, Antigua and Barbuda, Montserrat, and St. Kitts and Nevis. In both cases, with the exception of Cuba, these are islands with small populations, which might explain the lack of information on damages. Smaller islands have capacity constraints making them less likely to have the time and resources to prepare damage assessment reports after a disaster, and they are also less likely to attract attention after small natural disasters, resulting in some of the disasters going unnoticed and not-recorded.
29 Including the corrections and additional information collected as explained in the Appendix.

19
Table 7. Estimated Damages from the Historical Record, Annual Average 1950-2014 (in percent of GDP)
While the model underestimates the actual damages caused by disasters by 27 percent, it is possible that including the time trend with its negative effect results in an overestimation of damages in the earlier periods. The negative time trend punishes the estimates in the later period and results in large estimated damages in the 1950s and 1960s for which there is no data to compare the goodness of fit of the model. However, it is plausible that storms in the earlier periods caused more damages as infrastructure has improved over time and the Caribbean economies have diversified from its earlier concentration in agriculture which could also result in lower damages in recent times. When the time trend is omitted the average annual damages for disasters and hurricanes is 2.8 percent of GDP, instead of the 5.7 percent of GDP shown in Table 7. Therefore, it is important to interpret the results in Table 7 carefully, in light of the possible overestimation of damages in the earlier period. However, it
Anguilla 0.2 0.3 0.5Antigua and Barbuda 1.5 6.8 8.4Bahamas 0.6 1.1 2.0Bermuda 0.2 0.2 0.6Barbados 0.1 0.1 0.2British Virgin islands 0.0 0.0 0.6Cuba 0.4 1.0 1.1Cayman Islands 2.0 2.1 2.4Dominica 3.8 6.3 15.0Dominican Republic 0.5 0.5 0.6Greneda 2.8 9.3 15.8Haiti 2.0 2.7 3.0Jamaica 1.0 1.1 1.1Montserrat 7.2 7.4 31.7Puerto Rico 0.2 0.3 0.4St. Kitts and Nevis 5.0 6.7 21.8St. Lucia 2.5 2.8 3.1St. Vincent and the Grenadines 0.5 0.7 1.1Trinidad and Tobago 0.1 0.1 0.1Turks and Caicos 0.9 1.2 4.9Average 1.6 2.5 5.7Weighted average 0.4 0.7 0.9Tropical Cyclones (events) 135 238 335
All Disasters
Disasters &Hurricanes3
Estimates2
CountriesActual
(EM-DAT)1
Sources: EM-DAT; and author's calculations.1 Includes corrections and additions to EM-DAT as described in the Appendix.2 The estimates include the actual damages in the first column.3 Includes hurricanes that passed within 60 miles of the country.4 Weighted by nominal GDP in US$.
20
must be noted that the model without the time trend underestimates the actual damages in percent of GDP by 32 percent.
IV. CLIMATE CHANGE COSTS
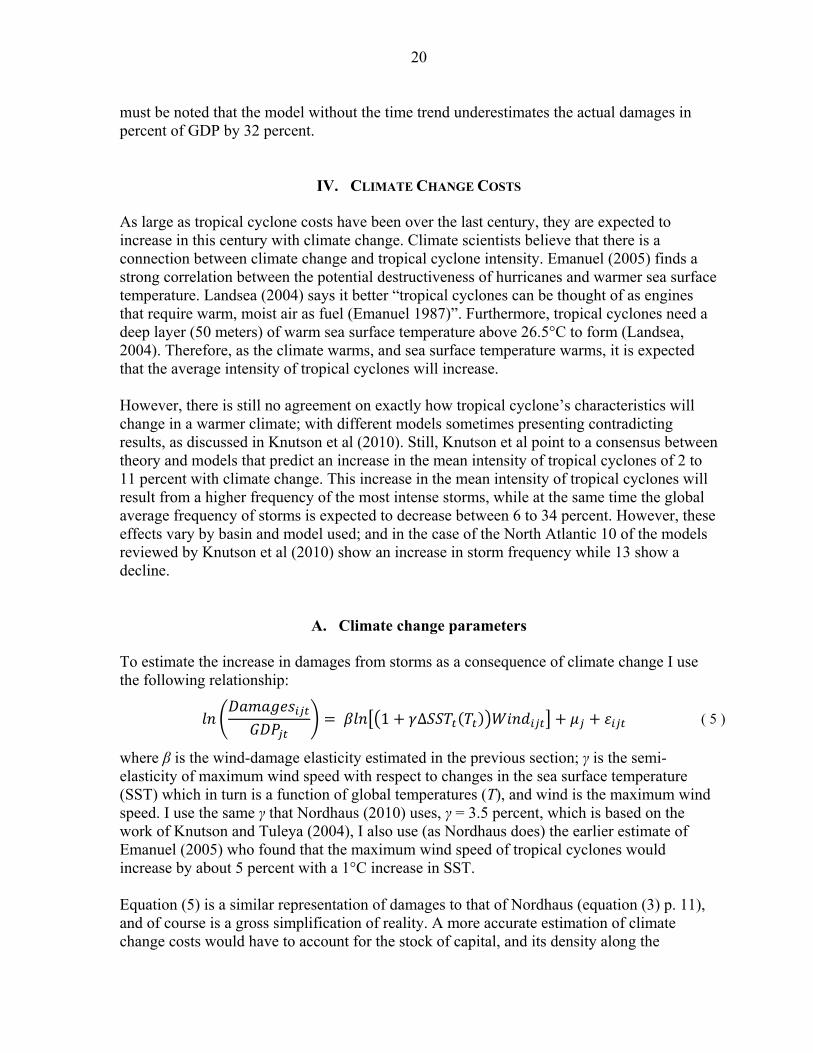
As large as tropical cyclone costs have been over the last century, they are expected to increase in this century with climate change. Climate scientists believe that there is a connection between climate change and tropical cyclone intensity. Emanuel (2005) finds a strong correlation between the potential destructiveness of hurricanes and warmer sea surface temperature. Landsea (2004) says it better “tropical cyclones can be thought of as engines that require warm, moist air as fuel (Emanuel 1987)”. Furthermore, tropical cyclones need a deep layer (50 meters) of warm sea surface temperature above 26.5°C to form (Landsea, 2004). Therefore, as the climate warms, and sea surface temperature warms, it is expected that the average intensity of tropical cyclones will increase. However, there is still no agreement on exactly how tropical cyclone’s characteristics will change in a warmer climate; with different models sometimes presenting contradicting results, as discussed in Knutson et al (2010). Still, Knutson et al point to a consensus between theory and models that predict an increase in the mean intensity of tropical cyclones of 2 to 11 percent with climate change. This increase in the mean intensity of tropical cyclones will result from a higher frequency of the most intense storms, while at the same time the global average frequency of storms is expected to decrease between 6 to 34 percent. However, these effects vary by basin and model used; and in the case of the North Atlantic 10 of the models reviewed by Knutson et al (2010) show an increase in storm frequency while 13 show a decline.
A. Climate change parameters
To estimate the increase in damages from storms as a consequence of climate change I use the following relationship:
1 ∆ ( 5 )
where β is the wind-damage elasticity estimated in the previous section; γ is the semi-elasticity of maximum wind speed with respect to changes in the sea surface temperature (SST) which in turn is a function of global temperatures (T), and wind is the maximum wind speed. I use the same γ that Nordhaus (2010) uses, γ = 3.5 percent, which is based on the work of Knutson and Tuleya (2004), I also use (as Nordhaus does) the earlier estimate of Emanuel (2005) who found that the maximum wind speed of tropical cyclones would increase by about 5 percent with a 1°C increase in SST. Equation (5) is a similar representation of damages to that of Nordhaus (equation (3) p. 11), and of course is a gross simplification of reality. A more accurate estimation of climate change costs would have to account for the stock of capital, and its density along the

21
coastline, it would also need to account for higher damages due to storm surge in a world with rising sea levels, and for damages caused by higher rainfall rates, as well as for adaptation measures that will reduce damages. Nonetheless, equation (5) provides a valuable approximation of what climate change costs might be in the future, particularly given that factors like storm surge or higher rainfall are correlated with maximum wind speed and are hence embedded in the estimate of β.30 For the simulations on climate change I use the Representative Concentration Pathways (RCP) scenario RCP8.5 of the IPCC (2014) report. This is a high greenhouse gas (GHG) emissions scenario where there is still a large dependency on fossil fuels and there are no additional efforts to constraint emissions. The large increase in CO2 concentrations in this scenario results, according to the IPCC, in a mean increase in global temperatures (T) of 2°C over the period 2046-2065, with a likely range between 1.4° and 2.6°, and a mean temperature increase in the period 2081-2100 of 3.7° within a likely range of 2.6° to 4.8°.31 Unfortunately, the IPCC does not project the corresponding increase in sea surface temperature (SST) of the RCP scenarios, and there is no rule of thumb, or elasticity, of how much an increase in SST is expected after a 1°C increase in T. The change in SST will vary by basin and depending on the climate model, as changes in sea currents and other atmospheric factors will affect the outcome. Therefore, Nordhaus (2010) uses a change in SST of 2.5°C for the Atlantic basin based on Knutson and Tuleya (2004).32 For comparability purposes I use the same SST as Nordhaus, but I also use the change in temperature projected by the IPCC in scenario RCP8.5, as this is the most extreme of the RCP scenarios and assumes a higher increase in CO2 concentrations and temperatures than what has been usually assumed in the literature (Nordhaus, 2010; Knutson and Tuleya, 2004; Knutson et al, 2010, and Mendelsohn et al, 2012). Most of these papers use the IPCC (2007) A1B scenario for their projections; however, the new IPCC (2014) report does not have a
30 As pointed by Nordhaus (2010), not including variables such as rainfall, and storm surge in the estimation of β results in a higher coefficient of the wind-damage elasticity. Therefore, partially, those factors are being implicitly accounted for.
31 The RCP8.5 scenario assumes CO2 concentrations will increase 2.5 times with respect to 2005 (Riahi et al, 2007). To construct the temperature path of the RCP8.5 scenario (IPCC, Figure 2.1.a, p. 59, 2014) I assume that the mean temperature in the scenario is reached in the mid-year of each period; then I construct the time series of temperatures using a geometric growth rate between 2005 and 2055, and between 2055 and 2090, extending it to 2100. I assume that the initial temperature in 2005 is 0.3°C. Hence, the mean temperature in 2100 is 4.3°C with a likely range between 3° and 5.6°. These are increases in temperature relative to mean temperatures in 1986-2005.
32 Knutson and Tuleya use a combination of 9 models that assume at least a doubling of CO2 concentrations, which increase SST by 0.8° to 2.4°, and cause maximum tropical cyclone wind speeds to increase by about 6 percent.

22
comparable scenario to that of A1B.33 For simplicity I assume that a change in T translates one to one to a change in SST; however, this is an unlikely case as SST generally varies less than air temperature. A sensitivity analysis is performed assuming that the elasticity of SST to a change in T (denoted by θ) is 0.6.34
B. Estimates of climate change damages
Table 8 presents the increase in mean storm damages with climate change, using the same methodology as Nordhaus (2010).35 In his paper Nordhaus finds that a 2.5°C increase in SST will result in an increase in damages of 113 percent. The large increase is due to the fact that Nordhaus estimates a large wind-damage elasticity of 9 for the US. Given that the coefficients of wind in the previous section were statistically different for landfalls and non-landfalls I calculate the increase in damages with climate change for both cases. Using the exact same parameters as Nordhaus I find that by the end of the century climate change will increase damages due to tropical cyclones in the Caribbean by 18 percent in the case of no landfalls, and by 30 percent for landfalls. However, that increase in damages is on the lower end considering that projections of inaction on CO2 emissions have increased the likelihood of higher temperatures. Using the RCP8.5 scenario mean projection of temperature (4.3°C), by mid-century damages would increase in the Caribbean by 12 to 20 percent, for non-landfalls and landfalls, respectively. And by the end of the century damages would climb to 31 percent for non-landfalls, and 56 percent for landfalls. If temperatures on the high end of the distribution of the RCP8.5 scenario are reached by 2100 (5.6°C), damages could be as much as 77 percent higher than what they are nowadays. The last four rows of Table 8 are sensitivity checks showing the impact of using a higher γ (Emanuel, 2005) and a lower θ. A higher semi-elasticity (γ ) of wind to changes in SST increases damages by almost 30 percentage points in the case of landfalls (compared to the 4.3 increase in SST), while a lower elasticity (θ) of SST to changes in global temperatures (T) results in lower damages of 13 to 24 percentage points compared to the case of a 4.3 increase in SST.
33 Knutson et al’s (2010) summary corresponds to climate change projections based on the IPCC (2007) A1B scenario. The models evaluated by Knutson et al typically indicate increases of SST between 1.5° and 2° causing an increase in storm intensity of 2-11 percent. Similarly, Mendelsohn et al (2012) based their models on the A1B emissions scenario; which then project global warming of between 2.7° and 4.5°. The A1B scenario assumes that the concentration of GHG peaks at 720 ppm in 2100 and is constant thereafter, reaching temperature increases of 2.8° (in a likely range of 1.7° to 4.4°).
34 The value of 0.6 for θ is chosen so that an increase of 4.3°C in T, in the RCP8.5 scenario, results in an increase in SST of more than the 2.5°C used by Nordhaus (2010). Given that Nordhaus’ SST change is based on studies that use the A1B scenario that has lower CO2 emissions than the RCP8.5 scenario, one would expect that the SST change would be higher under the RCP8.5 scenario.
35 Nordhaus calculates the increase in damages as [(1+γΔSST)β -1]·100 (see Table 8).

23
Table 8. Estimated Increase in Mean Damages in a High CO2 Climate Change Scenario
A less extreme climate change scenario (RCP6.0) still results in a considerable increase in damages in this century. The RCP6.0 is an intermediate scenario, what the IPCC (2014) calls a ‘baseline scenario’ where there are no additional efforts to constrain CO2 emissions. In this scenario mean temperatures are expected to increase by 2.5C in 2100 (in a likely range of 1.6 to 3.6) which results in higher tropical cyclone damages of 18 to 31 percent (for non-landfalls, and landfalls) in the mean temperature case, and higher damages of 26 to 46 percent in the high temperature case. The estimated increases in damages are presented in Table A4 in the Appendix. Another way to visualize the potential future costs of climate change in the Caribbean due to tropical cyclones is presented in Table 9. I calculate what would have been the damages of the tropical cyclones that have actually hit each island if they had happened in the warmer climate expected in the year 2100 in the RCP8.5 scenario. Using the same 335 storms36 as in column 4 of Table 7, and using the specifications estimated in columns (4) and (5) of Table 4 for the parameters of non-landfalls, and landfalls, respectively; I calculate what the damages would have been under low, mean, and high temperatures that could be reached in 2100 if 36 The storms include the 238 disasters recorded in the EM-DAT database, plus the 97 hurricanes that passed within 60 miles of the islands.
2050 2100Nordhaus (SST = 2.5°C)
Nordhaus (2010) 9.0 0.035 2.5 112.7No landfall 2.0 0.035 2.5 17.8Landfalls 3.2 0.035 2.5 30.5
Mean (T = 4.3°C)No landfall 2.0 0.035 1.0 4.3 11.9 31.5Landfalls 3.2 0.035 1.0 4.3 20.1 56.1
Low (T = 3°C)No landfall 2.0 0.035 1.0 3.0 8.4 21.5Landfalls 3.2 0.035 1.0 3.0 14.0 37.3
High (T = 5.6°C)No landfall 2.0 0.035 1.0 5.6 15.6 41.8Landfalls 3.2 0.035 1.0 5.6 26.6 76.6
Mean (T = 4.3°C) and higher γNo landfall 2.0 0.05 1.0 4.3 17.3 46.2Landfalls 3.2 0.05 1.0 4.3 29.6 85.6
Mean (T = 4.3°C) and lower θNo landfall 2.0 0.035 0.6 2.6 7.1 18.4Landfalls 3.2 0.035 0.6 2.6 11.8 31.6
Sources: Nordhaus (2010); and author's calculations.Notes: β is the elasticity of damages with respect to wind speed.γ is the semi-elasticity of maximum wind speed with respect to sea surface temperature (SST).θ is the elasticity of sea surface temperature (SST) with respect to global temperature (T ).SST is the change in tropical sea surface temperature in 2100 relative to the 1986-2005 period.
β γ SST (°C)Cases θIncrease in mean damages (%)

24
CO2 emissions are not curtailed.37 The first important thing to note is that the average damages for the Caribbean under the “No Climate Change” column of 5.3 percent of GDP are lower than the estimated damages in Table 7 of 5.7 percent of GDP (last column). The difference is because the estimates in Table 7 include the actual damages for 135 of the storms, while the damages presented in Table 9 are purely predicted by the estimated models in the previous section.38 Given that the models underestimate the actual damages, the predicted damages presented in this thought-experiment are conservative approximations (Table 9).
Table 9. Estimated Annual Damages with Climate Change Temperatures (in percent of GDP)
37 First, I calculate the higher wind speeds that would have resulted for each storm in a warmer world and then use those wind speeds to estimate the corresponding damages in percent of GDP.
38 This is done so that the comparison between damages with and without climate change is actually comparing apples to apples, as both sets of numbers are estimated from the models in section III.
Mean (4.3°C) Low (3°C) High (5.6°C)Anguilla 14 0.3 0.4 0.4 0.5Antigua and Barbuda 17 8.2 11.7 10.6 12.9Bahamas 28 1.9 2.7 2.5 3.0Bermuda 13 0.6 0.8 0.7 0.8Barbados 8 0.1 0.1 0.1 0.1British Virgin islands 13 0.6 0.8 0.7 0.8Cuba 31 1.2 1.7 1.5 1.9Cayman Islands 13 0.5 0.6 0.6 0.6Dominica 15 16.0 21.9 20.0 23.8Dominican Republic 29 0.5 0.7 0.6 0.8Greneda 7 15.9 20.9 19.3 22.5Haiti 34 2.3 3.0 2.8 3.3Jamaica 24 0.3 0.4 0.4 0.4Montserrat 12 28.5 37.6 34.8 40.5Puerto Rico 20 0.4 0.5 0.5 0.6St. Kitts and Nevis 16 22.5 30.5 28.0 33.1St. Lucia 13 0.8 1.0 1.0 1.1St. Vincent and the Grenadines 10 1.1 1.5 1.3 1.6Trinidad and Tobago 7 0.0 0.0 0.0 0.0Turks and Caicos 11 4.3 5.7 5.3 6.1Total / Average1 335 5.3 7.1 6.5 7.7Weighted average2 0.8 1.2 1.0 1.3Sources: Author's calculations.1 Total for the column Tropical Cyclones, and averages for all other the columns (in blue).2 Weighted by nominal GDP in US$.
Climate ChangeNo Climate Change
Tropical Cyclones
Countries
25
The results in Table 9 indicate that if all the disasters over the last 65 years had happened in a warmer world with more intense storms, damages would have been between 24 and 46 percent higher.39 These damages would have been caused by storms with wind speeds 15 percent higher. It is important to note that these higher damages assume that there is no adaptation to climate change. The countries which would have seen a larger increase in damages are the Dominican Republic, Jamaica, Cuba, and the Bahamas, all with damage increases above 58 percent in the high temperature scenario (5.6). Alternatively, we could assume that the historical storms take place in a world with the temperatures expected in the year 2050 under the RCP8.5 scenario (1.7, 1.2, and 2.2 for low, mean, and high ranges respectively). In this case, damages in the Caribbean would be 5.7, 6, and 6.2 percent of GDP pear year, on average, respectively.
C. Climate change simulations and storm damages
So far, I have used the wind-damage elasticity to estimate the missing damages in the historical record, to calculate the likely increase in damages (as in Nordhaus, 2010), and to illustrate what the historical damages could have been in a warmer world. This section will present some simulations of storm damages under climate change using the rich information collected for each country in terms of the frequency, intensity, and distance of tropical cyclones. Previous attempts at estimating the increase in climate change costs due to tropical cyclones have relied in the use of AIMs simulations (Narita, Tol, and Anthoff, 2009), or by using tropical cyclone models to simulate individual ‘synthetic’ tropical cyclone paths (Hallegatte, 2007; and Mendelsohn et al, 2012) and assess their impact based on storm frequency, intensity and location. I use a different approach in this paper; assuming that the frequency and geographic paths of storms remains unchanged in a warmer world and that the only change is due to the effect of higher SST on tropical cyclone intensities. In this subsection I run climate change simulations for each island. First I calculate the frequency at which landfall and non-landfall storms strike the islands, as well as the average distance at which they pass (Table 10).40 With the data on frequency I calculate the rate of arrival () of a Poisson distribution for landfalls and non-landfall storms to each island. The Poisson distribution for each country and for each type of storm is then used to randomly simulate tropical cyclone arrivals to each country.
39 These numbers result from comparing the simple average damages under climate change scenarios (columns 4-6 in Table 9) to the 5.3 percent of GDP in average damages (column 3 in Table 9).
40 To calculate the parameters of the storms that do not make landfall I use data from CHN from 1900 to 2010. For the ones that make landfall I use data from NOAA for the period 1946-1955 and 1983-2014.

26
Table 10. Parameters Used for the Climate Change Simulations
I then estimate equation (4), without the time trend, and use those coefficients for the simulations.41 The results of these new estimations show that the wind speed coefficient for storms that do not make landfall is slightly lower (1.9) than the one in column (4) of Table 4, while the wind-damage elasticity for landfalls is slightly higher (3.3) than the one in column (5). The fixed effects of these estimations are presented in Table 10, and give an idea of which countries have a greater vulnerability to storms. The higher the fixed effect value is, the more vulnerable that island is compared to the rest. It is clear from the table that the smaller islands (Montserrat, Grenada, St. Kitts and Nevis, Turks and Caicos, and St. Vincent and the Grenadines) show greater vulnerabilities than the larger islands (the Bahamas, Jamaica, Cuba, and Puerto Rico). Size itself can be a factor since storms in smaller islands usually affect the whole country or a large portion of it. Geographic and atmospheric characteristics also play a role, as more mountainous islands like Dominica and St. Vincent
41 I do this because the time trend parameter is insignificant after the year 1990 as it is capturing the improvement in reporting smaller damages in EM-DAT. And, given that the coefficient of the time trend was negative it could considerably bias downwards simulations that expand over a century.
Distance# of TCs
Fixed
effectsDistance
# of TCs
Fixed
effectsAnguilla1 28 42 0.38 -0.9 2 1 0.02 -0.9Antigua and Barbuda 31 43 0.39 0.8 7 7 0.17 1.2Bahamas 30 151 1.36 -4.8 21 14 0.33 0.0Bermuda 34 42 0.38 0.0 11 4 0.10 0.1Barbados1 44 39 0.35 -1.5 12 1 0.02 -1.5British Virgin islands 33 52 0.47 0.4 2 3 0.07 -1.8Cuba 41 39 0.35 -0.9 32 27 0.64 0.5Cayman Islands 27 62 0.56 -0.3 10 2 0.05 -3.6Dominica 39 35 0.32 2.8 4 1 0.02 3.0Dominican Republic 37 44 0.40 -2.4 25 8 0.19 -0.4Grenada1 30 24 0.22 3.5 19 4 0.10 3.5Haiti1 35 25 0.23 1.0 27 5 0.12 1.0Jamaica 32 40 0.36 -1.0 10 5 0.12 -1.1Montserrat1 41 42 0.38 3.9 16 2 0.05 3.9Puerto Rico 35 54 0.49 -0.8 10 6 0.14 -0.6St. Kitts and Nevis 39 47 0.42 2.4 4 1 0.02 3.5St. Lucia1 35 36 0.32 0.2 11 1 0.02 0.2St. Vincent and the Grenadines 41 34 0.31 1.2 24 3 0.07 1.2Trinidad and Tobago 41 17 0.15 -1.7 9 1 0.02 -6.1Turks and Caicos1 31 49 0.44 1.9 6 3 0.07 1.9
Tropical Cyclones (non-landfall) Tropical Cyclones (landfall)Countries
Sources: CHN; NOAA; and author's calculations.Note: is the rate of arrival of tropical cyclones, base on data from CHN, and NOAA.1 For countries that were not in the landfalls estimation, the fixed-effects of the non-landfall estimation were used.

27
have higher rainfall rates that cause landslides and floods with passage of nearby tropical cyclones. For the simulations, I first randomly draw from a Poisson distribution with arrival rate , the number of storms that affect each island every year between 2006 and 2100.42 This is done separately for each country and for storms that make landfall and those that do not. Then I draw 10,000 wind speeds for each of those storms from a wind distribution. I estimate the parameters of two distributions; a lognormal, and a generalized extreme value (GEV) distribution. Figure 4 shows both distributions and the histogram of actual wind speeds recorded for the period 1900 to 2010 (CHN, 2015). Overall, the GEV distribution appears to be a better fit; however, the GEV falls off faster than the lognormal, underestimating the frequency of medium intensity storms (those with hurricane category 1, 2 and 3).43 Therefore, I also use the lognormal distribution which underestimates lower intensity storms in favor of medium ones. However, it must be said that a goodness of fit test rejects the hypothesis that wind speeds are distributed as either a GEV or a lognormal.44
Figure 4. Wind Speed Distribution in the Caribbean
42 Since climate models seem to be divided over the effect that climate change will have over the frequency of storms in the North Atlantic (10 predict an increase while 13 a decline, Knutson et al, 2010), I simply assume that the frequency of storms will remain unchanged.
43 Historically, between 1900 and 2010, about 44 percent of the storms in the Caribbean fall in the range of 54 to 112 knots per hour where the GEV distribution falls below the lognormal distribution and underestimates the frequency of storms.
44 To my knowledge this is the first attempt to model the distribution of tropical cyclone wind speeds when the storms pass Caribbean islands. In the field of eolic energy generation, the Rayleigh distribution is used to simulate the frequency at which the wind blows at any particular speed; however, this distribution did not fit well tropical cyclone wind speeds, and the GEV and lognormal distributions showed a better fit.

28
The following is my attempt to model the intensification of wind speeds as a function of SST. The parameters of the wind distribution evolve over time as a function of climate change; in the case of the lognormal distribution
~ 1 ∆ , ( 6 )
where and are the location and scale parameters, respectively, of the lognormal distribution; and the location parameter increases over time as a function of SST. Similarly, for the GEV distribution
~ ; 1 ∆ , 1 ∆ ( 7 )
where and are the location and scale parameters, and k is the shape parameter. In the GEV case both the location and scale parameters increase over time as a function of SST.45 I also generate baseline simulations with no climate change by drawing wind speeds of both distributions but with constant parameters over time. Once each storm has been assigned 10,000 different wind speeds I estimate the damages in percent of GDP as in equation (4), although excluding the time trend as explained before.46 I then calculate the mean damages across the 20 islands in each year and then calculate a 10-year moving average.
Figure 5. Comparing Climate Change Scenarios’ Storm Damages
The results are presented in Figure 5, which shows that over the period 2081-2100 damages in percent of GDP will be 28 percent higher than in simulations with no global warming. The
45 The maximum wind speed permitted in each year also increases as a function of SST and γ, as in equations (6) and (7). The maximum wind speed in the first period of the simulations is 220 knots per hour, which is the maximum wind speed recorded in 1996 for tropical cyclone Olivia in Australia (Landsea, 2010). The maximum wind speed in 2100 reaches 253 knots per hour.
46 The damages are truncated at 600 percent of GDP throughout the simulations. The largest damages in the Caribbean were recorded in Montserrat with hurricane Hugo in 1989 (434 percent of GDP in damages).
Tropical Cyclone Simulations (Wind ~ lnN) Tropical Cyclone Simulations (Wind ~ GEV)

29
results for both distributions are very similar, with a slightly higher increase in damages of 29 percent for the simulations with the lognormal distribution compared to 28 percent with the GEV distribution. In a warmer world, storms are expected to increase damages by about 14 percent in the later part of the century (2081-2100) compared to the first two decades (2006-2025). The increase in damages is attributed to increasing wind intensities of about 14 percent with respect to the no climate change simulations, and of 11 percent with respect to the beginning of the century. In the case of the ‘baseline’ climate change scenario (RCP6.0) the increase in mean damages from storms, compared to no climate change, is 16.5 percent for the lognormal simulations and 16 percent for the GEV. The increase in damages would result from higher wind speeds of about 7.7 percent, on average.
Figure 6. Simulated Average Annual Storm Damages in the Caribbean
Lognormal Wind Distribution
Generalized Extreme Value Wind Distribution
Note: Average annual tropical cyclone damages (in percent of GDP) for 20 Caribbean islands under the RCP8.5 climate change scenario of an increase in temperature by 2100 of 4.3°C. The black line is the 10 year moving average of damages, and the shaded areas are the percentiles of the distribution of simulated outcomes. The darker colors indicate where the largest mass of the distribution is located.
Tropical Cyclone Simulations Without Climate Change
Tropical Cyclone Simulations Without Climate Change
Tropical Cyclone Simulations With Climate Change
Tropical Cyclone Simulations With Climate Change

30
To illustrate the uncertainty that surrounds these simulations I plot fan charts of the damages created for the 10,000 wind speed simulations. Figure 6 shows the fan charts for the lognormal and GEV distributions, with the simulation without climate change on the left, and the ones with climate change on the right. The black line depicts the average damages across the Caribbean (10-year moving average), and the darker colors indicate where the largest mass of the distribution is located. As expected, the largest mass of damages is below the mean, as we have seen that a small number of intense storms are the ones that generate most of the damages. Tropical cyclone damages are fat tail events, and the fan chart illustrates that perfectly, showing the large potential for a few events (light yellow on the top) to cause very large damages. Climate change not only increases the average damages from tropical cyclones, but also shifts upwards the distribution increasing the risk that very intense hurricanes will cause large damages in the Caribbean.
V. CONCLUSIONS AND POLICY RECOMMENDATIONS
This paper constructs a novel database that combines information on disasters caused by tropical cyclones in the Caribbean and their damages, with information on the characteristics of the storm (wind speed and distance from the islands). I document the likely underreporting of disasters in the 1950s and 1960s in the Caribbean, and the underreporting of damages for a large portion of the disasters. Also, I show that storms that do not make landfall can still cause large damages in the Caribbean, highlighting the importance of not focusing solely on the effects of landfalls. I then use the information on damages and wind speed to estimate the wind-damage elasticity, and find that the elasticity is between 2 and 3 depending on whether the storm makes landfall (elasticity of 3) or not. These numbers are much smaller than the ones found by Nordhaus (2010) for the US, but are in line with the atmospheric science literature that predicted that damages would increase to the cube of wind speeds (Emanuel, 2005). This is the first attempt to estimate this important parameter in the Caribbean, and hopefully, it will help inform future research to improve the damage functions of Integrated Assessment Models and their climate change projections. The wind-damages elasticity and the information on wind speeds collected for all 20 islands is then used to estimate the historical damages that tropical cyclones have caused over the last 65 years in the Caribbean. I find that the damages are underestimated by 38 to 72 percent, and that average annual damages in the Caribbean could be as high as 5.7 percent of GDP on average, instead of the 1.6 percent of GDP that is recorded. Finally, I estimate the potential costs of climate change in the Caribbean due to an intensification of tropical cyclone wind speed in a warmer world. Although, the potential increase is much smaller than the one estimated by Nordhaus (2010), because of the difference in elasticities, I find that climate change could pose great challenges to the Caribbean by increasing storm damages between 22 to 77 percent in the RCP8.5 scenario of global warming (IPCC, 2014) where CO2 concentrations in 2100 are 2.5 times larger than in 2005. In a baseline scenario (RCP6.0) with no additional efforts to curtail emissions, the

31
increase in damages would still be considerable, ranging from 11 to 46 percent. I also simulate the increase of damages due to global warming that highlight the large uncertainties around climate change predictions, and the potential for intense storms to cause large damages in the Caribbean. The results of this paper have shown the large impact and costs that tropical cyclones cause in the Caribbean. Storms cause on average 1.6 percent of GDP in damages every year, but that figure could be 1.6 to 3.6 times larger due to underreporting of disaster and damages. Climate change will only exacerbate these costs going forward, and if no significant efforts are carried out to limit CO2 emissions, even under the mildest of scenarios explored, damages could increase by at least 11 percent. Authorities throughout the Caribbean should start preparing for the current and future costs of storms; more efforts are needed to adapt the current infrastructure to sustain the more intense conditions that are expected with global warming. Soft adaptation measures, such as improved early warning systems, better building codes and zoning laws, accompanied by stricter enforcement will also help reduce future damages, even in the absence of climate change. It will be important to build resilience to the negative effects of storms to mitigate as much as possible the increasing costs that will come with a warmer world. Governments should build buffers, preferably in the form of a regional disaster fund that can only be accessed in the case of a disaster or for adaptation and mitigation projects. Insurance in the public and private sector will also be crucial to spread risks and reduce costs. In this regard, the results in this study, particularly the wind-damages parameter and the fixed effects that indicate the vulnerability of each island to storms, could perhaps help improve the type of insurance coverage offered by the Caribbean Catastrophe Risk Insurance Facility (CCRIF) and other insurance companies, to better account for the damages that different wind speeds are likely to cause in each island.

32
VI. REFERENCES
Bouwer, Laurens; and Botzen, Wouter (2011). “How Sensitive are US Hurricane Damages to Climate? Comment on a Paper by W. D. Nordhaus”. Climate Change Economics, Vol. 2, pp. 1-7. Caribbean Disaster News (1988). “Gilbert in the Caribbean”. Issue No. 15-16, p. 3. Emanuel, Kerry (1987). “The dependence of hurricane intensity on climate”. Nature, Vol. 326, pp. 483-485. Emanuel, Kerry (1999). “The power of a hurricane: An example of reckless driving on the information superhighway”. Weather, Vol. 54, pp. 107-108. Emanuel, Kerry (2005). “Increasing Destructiveness of Tropical Cyclones Over the past 30 years”. Nature, Vol. 436, pp. 686-688. Emanuel, Kerry (2015). “Readme” in Global Tropical Cyclone Data and Plotting Routines for MATLAB. Available: ftp://texmex.mit.edu/pub/emanuel/HURR/tracks//readme.pdf Guha-Sapir, Debarati; Below, Regina; and Hoyois, Philippe (2015). EM-DAT: The CRED/OFDA International Disaster Database – www.emdat.be – Université Catholique de Louvain – Brussels – Belgium. Hallegatte, Stéphane (2007). “The use of synthetic hurricane tracks in risk analysis and climate change damage assessment”. Journal of Applied Meteorology and Climatology, Vol. 46, pp. 1956-1966. Hallegatte, Stéphane; Hourcadec, Jean-Charles; and Dumas, Patrice (2007). “Why economic dynamics matter in assessing climate change damages: Illustration on extreme events.” Ecological Economics, Vol. 62, pp. 330-340. Herbert, Paul (1980). “Atlantic Hurricane Season of 1979”. Monthly Weather Review, Vol. 108, pp. 973-990. Holland, G.J. (1993). "Ready Reckoner". In: Global Guide to Tropical Cyclone Forecasting, WMO/TC-No. 560, Report No. TCP-31, (Geneva, Switzerland: World Meteorological Organization). Hsiang, Solomon; and Narita, Daiju (2012). “Adaptation to Cyclone Risk: Evidence From the Global Cross-Section”. Climate Change Economics, Vol. 3, pp. 1-28. IMF (2015). “World Economic Outlook”. (Washington: International Monetary Fund).

33
IPCC (2007). “Climate Change 2007: Synthesis Report. An Assessment of the Intergovernmental Panel on Climate Change”., (Geneva, Switzerland: Intergovernmental Panel on Climate Change). IPCC (2014). “Climate Change 2014: Synthesis Report. Contribution of Working Groups I, II and III to the Fifth Assessment Report of the Intergovernmental Panel on Climate Change”. Core Writing Team, R.K. Pachauri and L.A. Meyer (eds.), (Geneva, Switzerland: Intergovernmental Panel on Climate Change). Johnson, Martina (2014). "Homes Suffered Greatest Gonzalo damage, Report Says". The Antigua Observer, December 16, 2014. Available: http://antiguaobserver.com/homes-suffered-greatest-gonzalo-damage-report-says/ Knutson, Thomas; McBride, John; Chan, Johnny; Emanuel, Kerry; Holland, Greg; Landsea, Chris; Held, Isaac; Kossin, James; Srivastava, A.; and Sugi, Masato (2010). “Tropical Cyclones and Climate Change”. Nature Geoscience, Vol. 3, pp.157-163. Knutson, Thomas; and Tuleya, Robert (2004). “Impact of CO2-Induced Warming on Simulated Hurricane Intensity and Precipitation: Sensitivity to the Choice of Climate Model and Convective Parametrization”. Journal of Climate, Vol. 17, pp. 3477-3495. Landsea, Christopher (1993). “A climatology of intense (or major) Atlantic hurricanes”. Monthly Weather Review, Vol. 121, pp. 1703-1714. Landsea, Christopher (2004). “Hurricane FAQ: Why do tropical cyclones require 80°F (26.5°C) ocean temperatures to form?” (Miami: NOAA, Hurricane Research Division of the Atlantic Oceanographic and Meteorological Laboratory). Available: http://www.aoml.noaa.gov/hrd/tcfaq/A16.html Landsea, Christopher (2010). “Hurricane FAQ: Which is the most intense tropical cyclone on record?” (Miami: NOAA, Hurricane Research Division of the Atlantic Oceanographic and Meteorological Laboratory). Available: http://www.aoml.noaa.gov/hrd/tcfaq/E1.html Landsea, Christopher; Franklin, James; and Beven, Jack (2015). “The revised Atlantic hurricane database (HURDAT2)”. (Miami: NOAA, Hurricane Research Division of the Atlantic Oceanographic and Meteorological Laboratory). Available: http://www.aoml.noaa.gov/hrd/hurdat/Data_Storm.html Lawrence, Miles; and Gross, James (1989). “Atlantic Hurricane Season of 1988”. Monthly Weather Review, Vol. 117, pp. 2248-2259. Mendelsohn, Robert; Emanuel, Kerry; Chonabayashi, Shun; and Bakkensen, Laura (2012). “The Impact of Climate Change on Global Tropical Cyclone Damage”. Nature Climate Change, Vol. 2, pp. 205-209.

34
Narita, Daiju; Tol, Richard; and Anthoff, David (2009). “Damage costs of climate change through intensification of tropical cyclone activities: an application of FUND”. Climate Research, Vol. 39, pp. 87-97. NOAA (1989). “Preliminary Report: Hurricane Dean”. (Miami: NOAA, National Hurricane Center). Available: http://www.nhc.noaa.gov/archive/storm_wallets/atlantic/atl1989-prelim/dean/prelim02.gif NOAA (2015a). “Historical Hurricane Tracks v4.0”. (Charleston, South Carolina: NOAA, Office for Coastal Management). Available: http://coast.noaa.gov/hurricanes/ NOAA (2015b). “Non-US Landfalls Hurricanes: 1946-1955, 1969 and 1983-2014”. (Miami: NOAA, Hurricane Research Division of the Atlantic Oceanographic and Meteorological Laboratory). Available: http://www.aoml.noaa.gov/hrd/hurdat/International_Hurricanes_2014_may15.html NOAA (2015c). “Non-US Landfalls Tropical Storms: 1946-1955 and 1983-2014”. (Miami: NOAA, Hurricane Research Division of the Atlantic Oceanographic and Meteorological Laboratory). Available: http://www.aoml.noaa.gov/hrd/hurdat/International_Storms_2014_may15.html NOAA (2015d). “Hurricane FAQ: What is a hurricane, typhoon, or tropical cyclone?” (Miami: NOAA, Hurricane Research Division of the Atlantic Oceanographic and Meteorological Laboratory). Available: http://www.aoml.noaa.gov/hrd/tcfaq/A1.html Neumayer, Eric; and Barthel, Fabian (2011). “Normalizing economic loss from natural disasters: A global analysis”. Global Environmental Change, Vol. 21, pp. 13-24. Nordhaus, William (2006). “The Economics of Hurricanes in the United States”. NBER Working Paper 12813 (Cambridge: National Bureau of Economic Research). Nordhaus, William (2010). “The Economics of Hurricanes and Implications of Global Warming”. Climate Change Economics, Vol. 1, pp. 1-20. Pielke, Roger; and Lansea, Christopher (1998). Normalized Hurricane Damages in the United States: 1925–95”. American Meteorological Society, Vol. 13, pp. 621-631. Pielke, Roger; and Lansea, Christopher (1999). “La Niña, El Niño, and Atlantic Hurricane Damages in the United States,” Bulletin of the American Meteorological Society, Vol. 80, pp. 2027-2033. Pielke, Roger; Gratz, Joel; Landsea, Christopher; Collins, Douglas; Saunders, Mark; and Musulin, Rade (2008). “Normalized Hurricane Damage in the United States: 1900–2005”. Natural Hazards Review, Vol. 29, pp. 29-42.

35
Pielke, Roger; Rubiera, Jose; Landsea, Christopher; Fernandez, Mario; and Klein, Roberta (2003). “Hurricane Vulnerability in Latin America and The Caribbean: Normalized Damage and Loss Potentials”. Natural Hazards Review, Vol. 4, pp. 101-114. Pindyck, Robert. (2013). “Climate Change Policy: What Do the Models Tell Us?” Journal of Economic Literature, Vol. 51, pp. 860–872. Rasmussen, Tobias (2004). “Macroeconomic Implications of Natural Disasters in the Caribbean”. IMF Working Paper 04/224 (Washington: International Monetary Fund). Riahi, Keywan; Gruebler, Arnulf; and Nakicenovic, Nebojsa (2007). “Scenarios of long-term socio-economic and environmental development under climate stabilization”. Technological Forecasting and Social Change, Vol. 74, pp. 887-935. Schmidt, Silvio; Kemfert, Claudia; and Höppe, Peter (2009). “The Impact of Socio-Economics and Climate Change on Tropical Cyclone Losses in the USA”. Regional Environmental Change, Vol. 10, pp. 13-26. Southern, R. (1979). “The Global Socio-Economic Impact of Tropical Cyclones”. Australian Meteorological Magazine, Vol. 27, pp. 175-195. Stern, Nicholas (2013). “The Structure of Economic Modeling of the Potential Impacts of Climate Change: Grafting Gross Underestimation of Risk onto Already Narrow Science Models.” Journal of Economic Literature, Vol. 51, pp. 838–859. Strobl, Eric (2012). “The Economic Growth Impact of Natural Disasters in Developing Countries: Evidence from Hurricane Strikes in the Central American and Caribbean Regions”. Journal of Development Economics, Vol. 97, pp.130-141. UN-Habitat (1989). Human Settlements and Natural Disasters. (Nairobi: United Nations Human Settlements Program). UN (2015). “National Accounts Main Aggregates Database. (New York: United Nations). Available: http://unstats.un.org/unsd/snaama/Introduction.asp USAID (2000). “Hurricane Lenny Recovery in the Eastern Caribbean”. (Washington: United States Agency for International Development). Van Dijken, Gert (2015). “Climatology of Caribbean Storms”. Available: http://stormcarib.com/climatology

36
VII. DATA APPENDIX
The Caribbean sample studied in this paper includes 20 islands: Anguilla, Antigua and Barbuda, Bahamas, Bermuda, Barbados, British Virgin Islands, Cuba, Cayman Islands, Dominica, Dominican Republic, Grenada, Haiti, Jamaica, Montserrat, Puerto Rico, St. Kitts and Nevis, St. Lucia, St. Vincent and the Grenadines, Turks and Caicos, and Trinidad and Tobago.47 All references to the Caribbean throughout the paper are limited to this list of islands. There are three main data sources used in this paper; i) the International Disaster Database (EM-DAT; Guha-Sapir, Below, and Hoyois, 2015), ii) the Caribbean Hurricane Network (CHN; Van Dijken, 2015), and iii) the National Oceanic and Atmospheric Administration (NOAA, 2015a,b,c). The first source was used to obtain information on natural disasters caused by tropical cyclones and their corresponding damages, while the other two sources were used to get the information of the tropical cyclones characteristics (wind speed and distance to the island) of storms that have passed close to each Caribbean island. Below there is a detailed description of each dataset and its limitations, and how they were combined to construct a database, as comprehensive as possible, of damages and storm characteristics in the Caribbean.
A. International Disaster Database (EM-DAT)
The EM-DAT database records disasters throughout the world; for a disaster to be included in the database at least one of the following criteria must be met: i) ten or more people reported killed, ii) hundred or more people reported affected, or iii) there was a declaration of a state of emergency, or a call for international assistance was made. EM-DAT classifies the disaster (drought, earthquake, storm, etc) and records the number of people killed and affected, the estimated damages, the dates and geographic location, and when available the disaster magnitude (e.g. wind speed for storms, Richter scale for earthquakes, etc). The focus on this paper is only on storms, in particular tropical cyclones in the Caribbean. EM-DAT has two main limitations; the data on damages is not exhaustively recorded for each disaster, and the information on disaster magnitude is absent for most tropical storms and it is not clear how, when or where the wind speeds were measured. Of the 238 tropical cyclones recorded in the Caribbean between 1950 and 2014, only 140 had data on damages. The data on damages was complemented from Pielke et al (2003), UN-Habitat (1989), Caribbean Disaster News (1988), Herbert (1980), Lawrence and Gross (1989), USAID (2000) , and NOAA (1989). In eight cases the data on damages from EM-DAT was replaced by data from one of the sources above as the discrepancies between these sources and EM-DAT were considerable (see Table A1). The results presented in Tables 4 to 6 in the estimations section were also done with the original EM-DAT data on damages (with the
47 Bermuda is technically not part of the Caribbean Sea; however, it shares many of the characteristics of Caribbean islands, in terms of size, dependence on tourism and vulnerability to tropical cyclones. Therefore, for the purpose of this paper it will be treated as part of the Caribbean region.
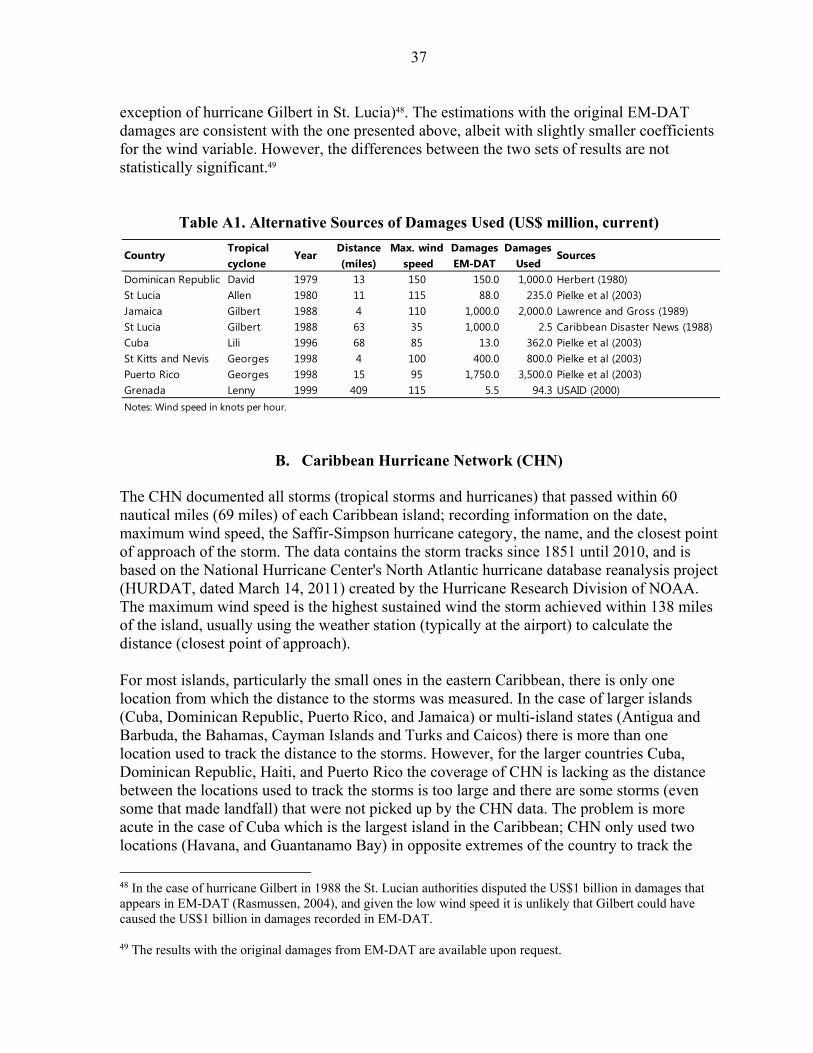
37
exception of hurricane Gilbert in St. Lucia)48. The estimations with the original EM-DAT damages are consistent with the one presented above, albeit with slightly smaller coefficients for the wind variable. However, the differences between the two sets of results are not statistically significant.49
Table A1. Alternative Sources of Damages Used (US$ million, current)
B. Caribbean Hurricane Network (CHN)
The CHN documented all storms (tropical storms and hurricanes) that passed within 60 nautical miles (69 miles) of each Caribbean island; recording information on the date, maximum wind speed, the Saffir-Simpson hurricane category, the name, and the closest point of approach of the storm. The data contains the storm tracks since 1851 until 2010, and is based on the National Hurricane Center's North Atlantic hurricane database reanalysis project (HURDAT, dated March 14, 2011) created by the Hurricane Research Division of NOAA. The maximum wind speed is the highest sustained wind the storm achieved within 138 miles of the island, usually using the weather station (typically at the airport) to calculate the distance (closest point of approach). For most islands, particularly the small ones in the eastern Caribbean, there is only one location from which the distance to the storms was measured. In the case of larger islands (Cuba, Dominican Republic, Puerto Rico, and Jamaica) or multi-island states (Antigua and Barbuda, the Bahamas, Cayman Islands and Turks and Caicos) there is more than one location used to track the distance to the storms. However, for the larger countries Cuba, Dominican Republic, Haiti, and Puerto Rico the coverage of CHN is lacking as the distance between the locations used to track the storms is too large and there are some storms (even some that made landfall) that were not picked up by the CHN data. The problem is more acute in the case of Cuba which is the largest island in the Caribbean; CHN only used two locations (Havana, and Guantanamo Bay) in opposite extremes of the country to track the
48 In the case of hurricane Gilbert in 1988 the St. Lucian authorities disputed the US$1 billion in damages that appears in EM-DAT (Rasmussen, 2004), and given the low wind speed it is unlikely that Gilbert could have caused the US$1 billion in damages recorded in EM-DAT.
49 The results with the original damages from EM-DAT are available upon request.
CountryTropical cyclone
YearDistance(miles)
Max. wind speed
DamagesEM-DAT
Damages Used
Sources
Dominican Republic David 1979 13 150 150.0 1,000.0 Herbert (1980)St Lucia Allen 1980 11 115 88.0 235.0 Pielke et al (2003)Jamaica Gilbert 1988 4 110 1,000.0 2,000.0 Lawrence and Gross (1989)St Lucia Gilbert 1988 63 35 1,000.0 2.5 Caribbean Disaster News (1988)Cuba Lili 1996 68 85 13.0 362.0 Pielke et al (2003)St Kitts and Nevis Georges 1998 4 100 400.0 800.0 Pielke et al (2003)Puerto Rico Georges 1998 15 95 1,750.0 3,500.0 Pielke et al (2003)Grenada Lenny 1999 409 115 5.5 94.3 USAID (2000)Notes: Wind speed in knots per hour.
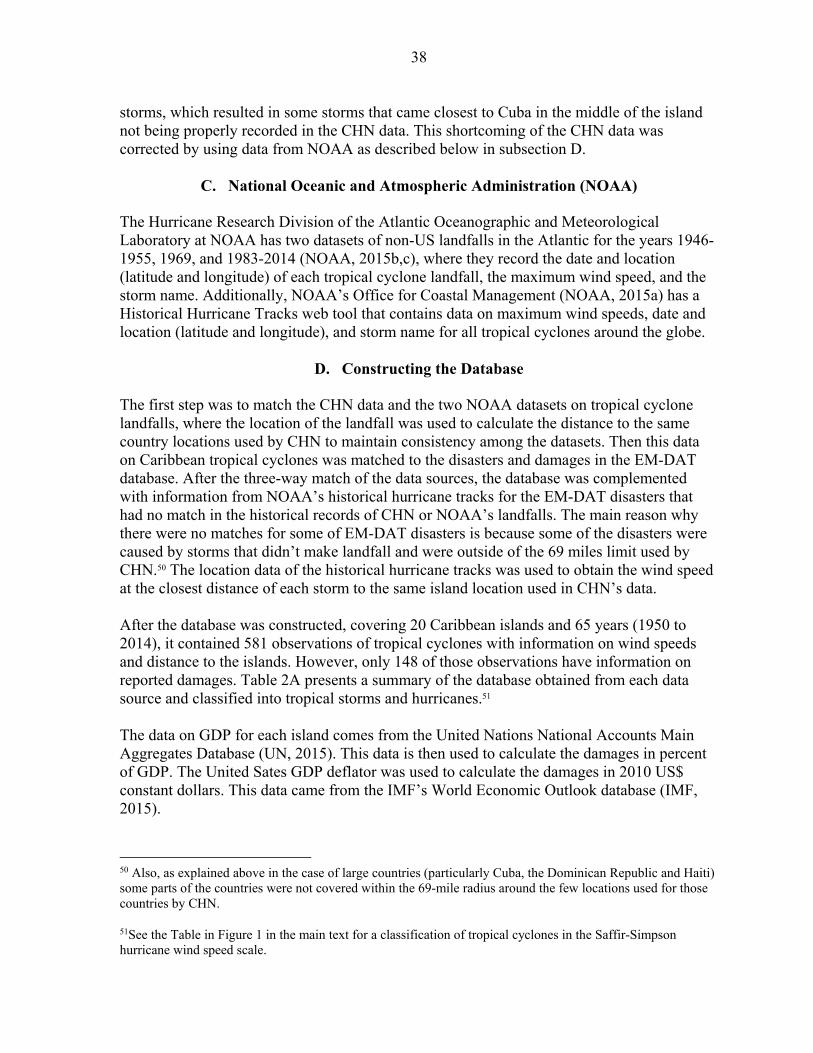
38
storms, which resulted in some storms that came closest to Cuba in the middle of the island not being properly recorded in the CHN data. This shortcoming of the CHN data was corrected by using data from NOAA as described below in subsection D.
C. National Oceanic and Atmospheric Administration (NOAA)
The Hurricane Research Division of the Atlantic Oceanographic and Meteorological Laboratory at NOAA has two datasets of non-US landfalls in the Atlantic for the years 1946-1955, 1969, and 1983-2014 (NOAA, 2015b,c), where they record the date and location (latitude and longitude) of each tropical cyclone landfall, the maximum wind speed, and the storm name. Additionally, NOAA’s Office for Coastal Management (NOAA, 2015a) has a Historical Hurricane Tracks web tool that contains data on maximum wind speeds, date and location (latitude and longitude), and storm name for all tropical cyclones around the globe.
D. Constructing the Database
The first step was to match the CHN data and the two NOAA datasets on tropical cyclone landfalls, where the location of the landfall was used to calculate the distance to the same country locations used by CHN to maintain consistency among the datasets. Then this data on Caribbean tropical cyclones was matched to the disasters and damages in the EM-DAT database. After the three-way match of the data sources, the database was complemented with information from NOAA’s historical hurricane tracks for the EM-DAT disasters that had no match in the historical records of CHN or NOAA’s landfalls. The main reason why there were no matches for some of EM-DAT disasters is because some of the disasters were caused by storms that didn’t make landfall and were outside of the 69 miles limit used by CHN.50 The location data of the historical hurricane tracks was used to obtain the wind speed at the closest distance of each storm to the same island location used in CHN’s data. After the database was constructed, covering 20 Caribbean islands and 65 years (1950 to 2014), it contained 581 observations of tropical cyclones with information on wind speeds and distance to the islands. However, only 148 of those observations have information on reported damages. Table 2A presents a summary of the database obtained from each data source and classified into tropical storms and hurricanes.51 The data on GDP for each island comes from the United Nations National Accounts Main Aggregates Database (UN, 2015). This data is then used to calculate the damages in percent of GDP. The United Sates GDP deflator was used to calculate the damages in 2010 US$ constant dollars. This data came from the IMF’s World Economic Outlook database (IMF, 2015).
50 Also, as explained above in the case of large countries (particularly Cuba, the Dominican Republic and Haiti) some parts of the countries were not covered within the 69-mile radius around the few locations used for those countries by CHN.
51See the Table in Figure 1 in the main text for a classification of tropical cyclones in the Saffir-Simpson hurricane wind speed scale.
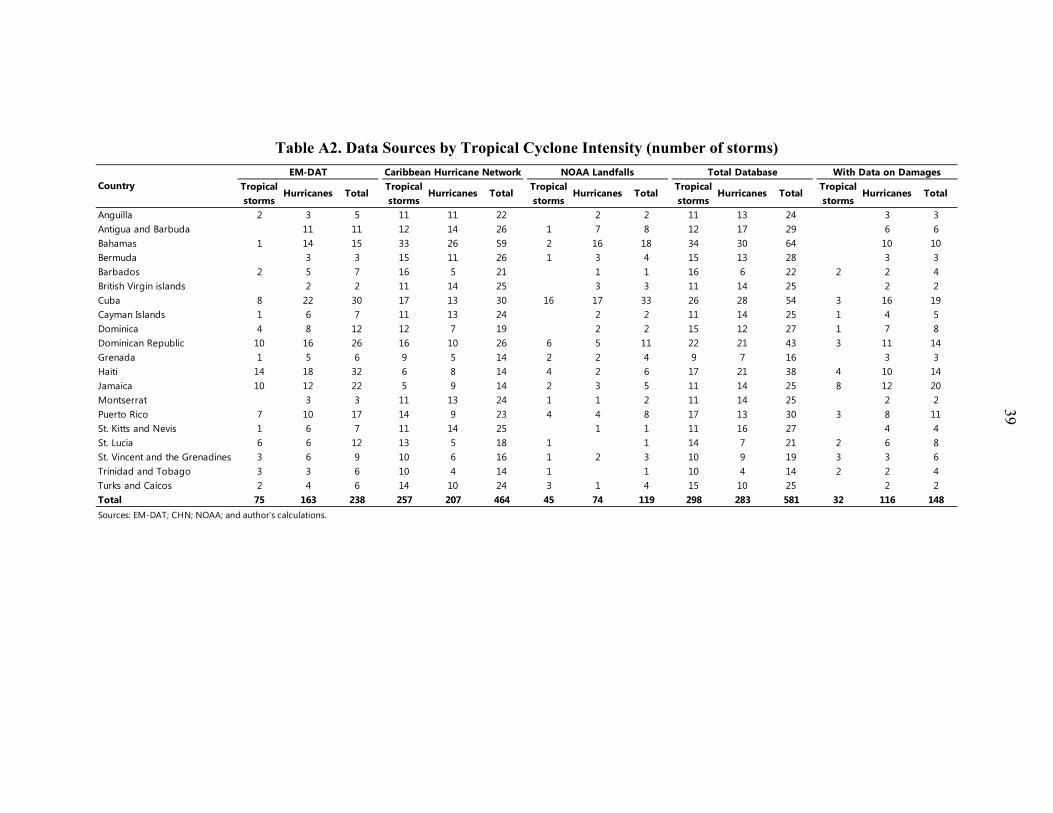
39
Table A2. Data Sources by Tropical Cyclone Intensity (number of storms)
Anguilla 2 3 5 11 11 22 2 2 11 13 24 3 3Antigua and Barbuda 11 11 12 14 26 1 7 8 12 17 29 6 6Bahamas 1 14 15 33 26 59 2 16 18 34 30 64 10 10Bermuda 3 3 15 11 26 1 3 4 15 13 28 3 3Barbados 2 5 7 16 5 21 1 1 16 6 22 2 2 4British Virgin islands 2 2 11 14 25 3 3 11 14 25 2 2Cuba 8 22 30 17 13 30 16 17 33 26 28 54 3 16 19Cayman Islands 1 6 7 11 13 24 2 2 11 14 25 1 4 5Dominica 4 8 12 12 7 19 2 2 15 12 27 1 7 8Dominican Republic 10 16 26 16 10 26 6 5 11 22 21 43 3 11 14Grenada 1 5 6 9 5 14 2 2 4 9 7 16 3 3Haiti 14 18 32 6 8 14 4 2 6 17 21 38 4 10 14Jamaica 10 12 22 5 9 14 2 3 5 11 14 25 8 12 20Montserrat 3 3 11 13 24 1 1 2 11 14 25 2 2Puerto Rico 7 10 17 14 9 23 4 4 8 17 13 30 3 8 11St. Kitts and Nevis 1 6 7 11 14 25 1 1 11 16 27 4 4St. Lucia 6 6 12 13 5 18 1 1 14 7 21 2 6 8St. Vincent and the Grenadines 3 6 9 10 6 16 1 2 3 10 9 19 3 3 6Trinidad and Tobago 3 3 6 10 4 14 1 1 10 4 14 2 2 4Turks and Caicos 2 4 6 14 10 24 3 1 4 15 10 25 2 2Total 75 163 238 257 207 464 45 74 119 298 283 581 32 116 148
CountryEM-DAT Caribbean Hurricane Network NOAA Landfalls Total Database With Data on Damages
Tropical storms
TotalTropical storms
TotalTropical storms
Total
Sources: EM-DAT; CHN; NOAA; and author's calculations.
Hurricanes Hurricanes Hurricanes HurricanesTotalTropical storms
HurricanesTotalTropical storms
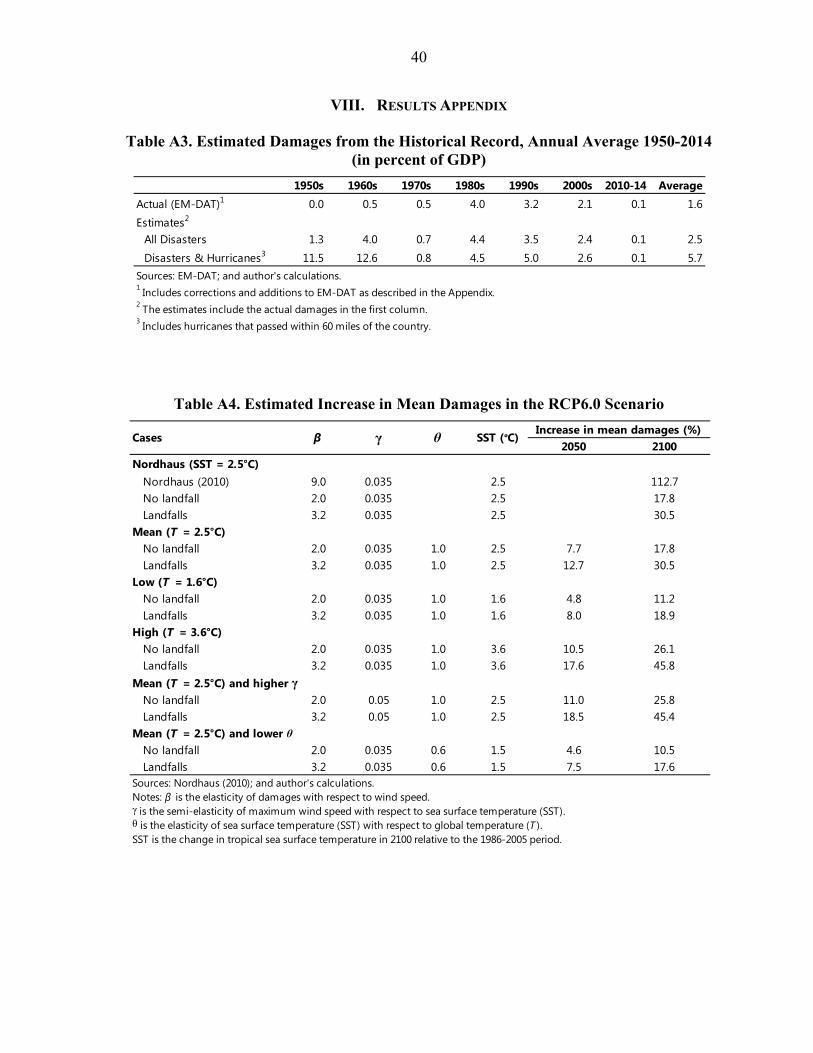
40
VIII. RESULTS APPENDIX
Table A3. Estimated Damages from the Historical Record, Annual Average 1950-2014 (in percent of GDP)
Table A4. Estimated Increase in Mean Damages in the RCP6.0 Scenario
1950s 1960s 1970s 1980s 1990s 2000s 2010-14 AverageActual (EM-DAT)1 0.0 0.5 0.5 4.0 3.2 2.1 0.1 1.6Estimates2
All Disasters 1.3 4.0 0.7 4.4 3.5 2.4 0.1 2.5Disasters & Hurricanes3 11.5 12.6 0.8 4.5 5.0 2.6 0.1 5.7
Sources: EM-DAT; and author's calculations.1 Includes corrections and additions to EM-DAT as described in the Appendix.2 The estimates include the actual damages in the first column.3 Includes hurricanes that passed within 60 miles of the country.
2050 2100Nordhaus (SST = 2.5°C)
Nordhaus (2010) 9.0 0.035 2.5 112.7No landfall 2.0 0.035 2.5 17.8Landfalls 3.2 0.035 2.5 30.5
Mean (T = 2.5°C)No landfall 2.0 0.035 1.0 2.5 7.7 17.8Landfalls 3.2 0.035 1.0 2.5 12.7 30.5
Low (T = 1.6°C)No landfall 2.0 0.035 1.0 1.6 4.8 11.2Landfalls 3.2 0.035 1.0 1.6 8.0 18.9
High (T = 3.6°C)No landfall 2.0 0.035 1.0 3.6 10.5 26.1Landfalls 3.2 0.035 1.0 3.6 17.6 45.8
Mean (T = 2.5°C) and higher γNo landfall 2.0 0.05 1.0 2.5 11.0 25.8Landfalls 3.2 0.05 1.0 2.5 18.5 45.4
Mean (T = 2.5°C) and lower θNo landfall 2.0 0.035 0.6 1.5 4.6 10.5Landfalls 3.2 0.035 0.6 1.5 7.5 17.6
Sources: Nordhaus (2010); and author's calculations.Notes: β is the elasticity of damages with respect to wind speed.γ is the semi-elasticity of maximum wind speed with respect to sea surface temperature (SST).θ is the elasticity of sea surface temperature (SST) with respect to global temperature (T ).SST is the change in tropical sea surface temperature in 2100 relative to the 1986-2005 period.
Cases β γ θ SST (°C)Increase in mean damages (%)