goochland county public schools enrollment projections ... · pdf filegoochland county public...
TRANSCRIPT

GOOCHLAND COUNTY PUBLIC SCHOOLS
ENROLLMENT PROJECTIONS REPORT
MAY 31, 2017
PREPARED FOR:
Goochland County Public Schools
PO Box 169
Goochland, VA 23063
T 804.556.5630
PREPARED BY:
Cooperative Strategies
3325 Hilliard Rome Road
Hilliard, OH 43026
T 614.798.8828
DRAFT

DRAFT

Table of Contents
Acknowledgements ...................................................................................................................................... 2
Executive Summary ..................................................................................................................................... 3
Enrollment Projection Methodology ......................................................................................................... 5
U.S. Census .................................................................................................................................................... 8
General Demographics ................................................................................................................................ 9
Housing Data ................................................................................................................................................ 11
Live Birth Data .............................................................................................................................................. 12
Survival Ratios .............................................................................................................................................. 13
Historical Enrollment ................................................................................................................................... 14
Projected Enrollment .................................................................................................................................... 16
Enrollment by School ................................................................................................................................... 23
Conclusion ..................................................................................................................................................... 29
DRAFT

GOOCHLAND COUNTY PUBLIC SCHOOLS
ENROLLMENT PROJECTIONS REPORT
PAGE 2
5/31/2017
ACKNOWLEDGMENTS
On behalf of Cooperative Strategies, we would like to extend our appreciation to the
Goochland County Public Schools for the opportunity to assist them in developing this
Enrollment Projections Report. As a planning team, we hope that this document will serve the
Goochland County Public Schools for years to come.
COOPERATIVE STRATEGIES
Tracy Richter, President
Ann Hoffsis, REFP, Director of Enrollment Projection Services
Matt Sachs, GIS Analyst
3325 Hilliard Rome Road
Hilliard, OH 43026
P. 614-798-8828
www.coopstrategies.com
DRAFT

GOOCHLAND COUNTY PUBLIC SCHOOLS
ENROLLMENT PROJECTIONS REPORT
PAGE 3
5/31/2017
EXECUTIVE SUMMARY
The enrollment projections for the Goochland County Public Schools included
in this report were developed using the cohort survival methodology and
Cooperative Strategies’ custom enrollment projection software, S.T.E.P.
[Student Trends & Enrollment Projections]. This custom software was
developed in collaboration with The Ohio State University and is based on
industry best practices as well as the national experience Cooperative
Strategies has with schools, school districts, and state agencies.
The projections presented in this report are meant to serve as a planning tool for the future,
and represent the most likely direction of the Division. Enrollment projections were
developed by analyzing the following data:
• Live birth data
• Historical enrollment by school, by grade
• Census data
• Building permits
The Goochland County Public Schools’ enrollment has increased by 183 students since the
2007-08 school year. Based on the cohort survival methodology, enrollment is projected to
increase over the next ten years.
0
500
1,000
1,500
2,000
2,500
3,000
3,500
Historical & Projected Enrollment - Goochland County Public Schools
Historical Projected - Moderate/Recommended Projected - Low Projected - High
DRAFT

GOOCHLAND COUNTY PUBLIC SCHOOLS
ENROLLMENT PROJECTIONS REPORT
PAGE 4
5/31/2017
As with any projection, the Division should pay close attention to the variables associated with
determining enrollment projections discussed in this document. Any one or more of these
factors can increase or decrease enrollment within the Goochland County Public Schools. It is
recommended that the data contained in this report be reviewed on an annual basis to
determine how more recent trends will impact both the enrollment and any new housing
development.
DRAFT

GOOCHLAND COUNTY PUBLIC SCHOOLS
ENROLLMENT PROJECTIONS REPORT
PAGE 5
5/31/2017
ENROLLMENT PROJECTION METHODOLOGY
Introduction
Tracing the landscape of the country’s
public school enrollment back over
the past fifty years reveals
demographic, economic, and social
changes. The United States as a
whole continues to undergo major
shifts in public student enrollment,
due in large part to past events
including the baby boom, the
availability and use of birth control,
and the development of suburbs. The
baby boom of the late 1940s and 50s was followed by the baby bust of the 1960s and 70s. This
gave rise to the echo baby boom of the 1980s.
Nationwide, districts have experienced the
effects of the echo baby bust of the 1990s.
From the 1950s to the 1970s, a dramatic
downsizing of the family unit occurred. A
direct result was the declining school
enrollment of the 1970s and 1980s. As of
the 2010 Census, the size of a family was at
an all-time low of 3.14 persons. The live
birth rate increased for the first time in
several years in 1998 and increased again in 2000. However, the birth rate resumed a
descending pattern in 2001 and reached an all-time low of 12.5 (per 1,000) in 2013
(preliminary).
2,000,000
2,500,000
3,000,000
3,500,000
4,000,000
4,500,000
U.S. TOTAL LIVE BIRTHS
Boom
Bust
Echo
Boom Echo
Bust
Source: CDC, National Vital Statistics Report
10
11
12
13
14
15
16
17
18
U.S. POPULATION - LIVE BIRTH RATE
PER 1,000 POPULATION
Source: CDC, National Vita l Statistics Report
DRAFT

GOOCHLAND COUNTY PUBLIC SCHOOLS
ENROLLMENT PROJECTIONS REPORT
PAGE 6
5/31/2017
Obviously, certain factors can be gauged and planned for far better than others. For instance,
it may be relatively straightforward to gather housing data from local builders regarding the
total number of lots in a planned subdivision and calculate the potential student yield.
However, planning for changes in the unemployment rate, and how these may either boost or
reduce public school enrollment, proves more difficult. In any case, it is essential to gather a
wide variety of information in preparation for producing enrollment projections.
When looking ahead at a school district’s enrollment over the next two, five, or ten years, it is
helpful to approach the process from a global perspective. For example: How many new
homes have been constructed each year? How many births have occurred each year in relation
to the resident population? Is housing experiencing a turnover—if so, what is the composition
of families moving in/out? Are more or less students attending private school or being home-
schooled? What has the unemployment rate trend been over the past ten years? What new
educational policies are in place that could affect student enrollment figures?
The cohort survival methodology is often used to answer these questions and is standard
throughout the educational planning industry. The enrollment projections developed for the
Goochland County Public Schools were developed using the cohort survival method.
When projecting future enrollments, it is vital to track the number of live births, the amount of
new housing activity, and the change in household composition. In addition, any of the
following factors could cause a significant change in projected student enrollment:
• Boundary adjustments
• New school openings
• Changes / additions in program offerings
• Preschool programs
• Change in grade configuration
• Interest rates / unemployment shifts
• Zoning changes
• Open Enrollment
• Magnet / Charter / Private school
opening or closure
• Unplanned new housing activity
• Planned, but not built, housing
• School voucher programs
DRAFT

GOOCHLAND COUNTY PUBLIC SCHOOLS
ENROLLMENT PROJECTIONS REPORT
PAGE 7
5/31/2017
Cohort Survival Method
A cohort is a group of persons [in this case, students]. The cohort survival enrollment
projection methodology uses historic live birth data and historic student enrollment to “age” a
known population or cohort throughout the school grades. For instance, a cohort begins when
a group of kindergarteners enrolls in grade K and moves to first grade the following year,
second grade the next year, and so on.
A “survival ratio” is developed to track how this group of students increased or decreased in
number as they moved through the grade levels. By developing survival ratios for each grade
transition [i.e. 2nd to 3rd grade] over a ten year period of time, patterns emerge and can be
folded into projections by using the survival ratio as a multiplier.
For example, if student enrollment has consistently increased from the 8th to the 9th grade
over the past ten years, the survival ratio would be greater than 100% and could be multiplied
by the current 8th grade to develop a projection for next year’s 9th grade. This methodology
can be carried through to develop ten years of projection figures. Because there is not a grade
cohort to follow for students coming into kindergarten, live birth counts are used to develop a
survival ratio. Babies born five years previous to the kindergarten class are compared in
number, and a ratio can be developed to project future kindergarten enrollments.
The cohort survival method is
useful in areas where population
is stable [relatively flat, growing
steadily, or declining steadily],
and where there have been no
significant fluctuations in
enrollment, births, and housing
patterns from year to year.
DRAFT

GOOCHLAND COUNTY PUBLIC SCHOOLS
ENROLLMENT PROJECTIONS REPORT
PAGE 8
5/31/2017
U.S. CENSUS
According to the U.S. Census Bureau,
the population in Goochland County,
Virginia increased from 16,863 to
21,717, or approximately 29 percent,
between the 2000 and 2010 Census.
In terms of school-aged children [5-19],
the population increased by 799, or 27
percent. The under age 5 population
increased from 875 to 1,012, or 16
percent.
The median age of an Goochland
County, Virginia resident is 45.2, an
increase of 4.7 years since the 2000
Census.
The average household size increased
from 2.51 to 2.54. The average family
size remained the same at 2.88.
The number of total housing units
increased in tandem with the number
of occupied and vacant housing units.
The table to the right provides a
comparison of the 2000 and 2010 U.S.
Census data.
Subject 2000 2010
Total population 16,863 21,717
SEX AND AGE
Male 8,494 10,764
Female 8,369 10,953
Under 5 years 875 1,012
5 to 19 years 2,977 3,776
20 to 64 years 10,902 13,692
65 years and over 2,109 3,237
Median age (years) 40.5 45.2
RACE
One Race 99.2% 98.8%
White 72.7% 77.5%
Black or African American 25.6% 19.2%
American Indian and Alaska Native 0.2% 0.2%
Asian 0.5% 1.0%
Native Hawaiian and Other Pacific Islander 0.0% 0.0%
Some Other Race 0.2% 0.8%
Two or More Races 0.8% 1.2%
Hispanic or Latino 0.9% 2.1%
DEMOGRAPHICS
Average household size 2.51 2.54
Average family size 2.88 2.88
HOUSING OCCUPANCY
Total housing units 6,555 8,618
Occupied housing units 6,158 7,998
Vacant housing units 397 620
GOOCHLAND COUNTY, VA
U.S. CENSUS
Source: U.S. Census
DRAFT

GOOCHLAND COUNTY PUBLIC SCHOOLS
ENROLLMENT PROJECTIONS REPORT
PAGE 9
5/31/2017
GENERAL DEMOGRAPHICS
The following information represents block group estimates and projections created from
market research and U.S. Census data obtained from the Environmental Systems Research
Institute [ESRI]. ESRI provides a yearly update to their demographic data in increments of five
years. To make updates to their demographic data set, they use American Community Survey
[ACS] data that takes a series of monthly sample surveys but only from areas with populations
of 65,000 or more. One year of ACS data is a period estimate as a twelve-month average,
rather than a single point in time.
According to the ESRI estimates, the total population of Goochland County, Virginia is
projected to increase over the next five years. As illustrated in the table, the number of
children, ages 5-18, is projected to increase by 78 children.
Age 2016 2021
Ages 0-2 557 554
Ages 3-4 410 400
Ages 5-10 1,501 1,472
Ages 11-13 894 899
Ages 14-18 1,310 1,412
Ages 5-18 3,705 3,783
Total Population 22,721 23,910
Source: ESRI BIS
GOOCHLAND COUNTY
POPULATION ESTIMATES
0
200
400
600
800
1,000
1,200
1,400
1,600
Ages 0-2 Ages 3-4 Ages 5-10 Ages 11-13 Ages 14-18
GOOCHLAND COUNTY
POPULATION ESTIMATES
2016 2021
DRAFT
GOOCHLAND COUNTY PUBLIC SCHOOLS
ENROLLMENT PROJECTIONS REPORT
PAGE 10
5/31/2017
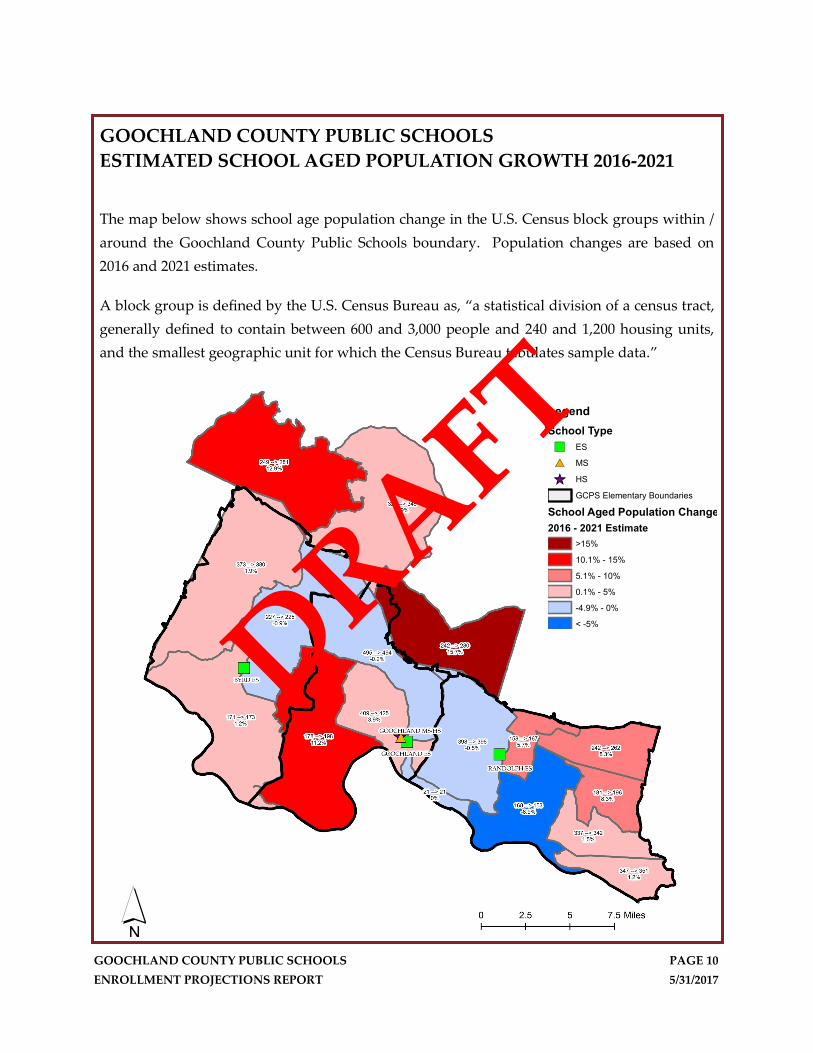
GOOCHLAND COUNTY PUBLIC SCHOOLS
ESTIMATED SCHOOL AGED POPULATION GROWTH 2016-2021
The map below shows school age population change in the U.S. Census block groups within /
around the Goochland County Public Schools boundary. Population changes are based on
2016 and 2021 estimates.
A block group is defined by the U.S. Census Bureau as, “a statistical division of a census tract,
generally defined to contain between 600 and 3,000 people and 240 and 1,200 housing units,
and the smallest geographic unit for which the Census Bureau tabulates sample data.”
Legend
School Type
") ES
#* MS
_̂ HS
GCPS Elementary Boundaries
School Aged Population Change
2016 - 2021 Estimate
>15%
10.1% - 15%
5.1% - 10%
0.1% - 5%
-4.9% - 0%
< -5%
´
DRAFT

GOOCHLAND COUNTY PUBLIC SCHOOLS
ENROLLMENT PROJECTIONS REPORT
PAGE 11
5/31/2017
HOUSING DATA
Housing development and building permits are tracked to determine their effect on student
enrollment. The tables below illustrates the number of single and multi-family building
permits issued in Goochland County since 2000.
Year Single-Family
2000 223
2001 246
2002 267
2003 286
2004 310
2005 380
2006 281
2007 196
2008 98
2009 75
2010 60
2011 47
2012 88
2013 142
2014 127
2015 136
2016 129
2017* 54
*preliminary through March 2017
BUILDING PERMITS
GOOCHLAND COUNTY
Source: SOCDS Building Permits Database
0
50
100
150
200
250
300
350
400
BUILDING PERMITS
GOOCHLAND COUNTY
Single-Family
DRAFT

GOOCHLAND COUNTY PUBLIC SCHOOLS
ENROLLMENT PROJECTIONS REPORT
PAGE 12
5/31/2017
LIVE BIRTH DATA
Utilization of live birth data is recommended when projecting future kindergarten
enrollments. This data provides a helpful overall trend. Large bubbles in birth counts, either
up or down, can also be planned for or anticipated by the Division.
In addition, the live birth counts are used in determining a birth-to-kindergarten and birth-to-
first grade survival ratio. This ratio identifies the percentage of children born in a
representative area who attend kindergarten and first grade in the Division five and six years
later. The survival ratios for birth-to-kindergarten, birth-to-first grade, as well as grades 1-12
can be found on page 13 of this report.
Data is arranged by the residence of the mother. For
example, if a mother lives in Goochland County but
delivers her baby in Norfolk, the birth is counted in
Goochland County. Live birth counts are different
from live birth rates. The live birth count is simply
the actual number of live births. A birth rate is the
number of births per 1,000 women in a specified
population group.
The chart and graph includes the live birth counts for
Goochland County.
Year # of births
2005 198
2006 213
2007 194
2008 209
2009 179
2010 173
2011 151
2012 165
2013 157
2014 185
GOOCHLAND COUNTY
LIVE BIRTH COUNTS
Source: Virginia Department of Health
0
50
100
150
200
250
LIVE BIRTH COUNTS
GOOCHLAND COUNTY
DRAFT

GOOCHLAND COUNTY PUBLIC SCHOOLS
ENROLLMENT PROJECTIONS REPORT
PAGE 13
5/31/2017
SURVIVAL RATIOS
The chart below demonstrates the ten-year changes in enrollment as students move through
the system. Percentages greater than 100 indicate that there are more students than there were
in the previous grade the previous year. In other words, there was an increase in student
population where new students were added to the system. Percentages less than 100 indicate
that there was decline or students left the system. If the exact number of students in 1st grade
during the 2010-11 school year were present in 2nd grade for the 2011-12 school year, the
survival ratio would be 100 percent.
Birth-to-Kindergarten and Birth-to-First Grade: This ratio indicates the number of children
born in the area who attend kindergarten and first grade in the Division five and six years
later. What is important to note is the trend in survival ratio, not necessarily the actual
number.
The following table illustrates the historical survival ratios in the Goochland County Public
Schools over the past ten years by grade level. Survival Ratios - District-wide
from to Birth to K K to 1 Birth to 1 1 to 2 2 to 3 3 to 4 4 to 5 5 to 6 6 to 7 7 to 8 8 to 9 9 to 10 10 to 11 11 to 12
2007 2008 Inf 102.67% Inf 98.54% 101.81% 107.26% 105.59% 110.84% 101.13% 101.91% 109.04% 103.57% 95.54% 91.10%
2008 2009 Inf 96.84% Inf 96.88% 104.43% 104.14% 100.00% 102.12% 104.89% 100.00% 121.25% 97.93% 85.22% 108.29%
2009 2010 88.89% 102.31% Inf 92.39% 105.38% 97.64% 99.43% 108.33% 101.04% 94.30% 113.41% 100.52% 92.59% 106.94%
2010 2011 75.59% 97.16% 86.36% 93.79% 101.76% 94.39% 96.62% 99.43% 96.63% 96.41% 112.64% 96.06% 84.10% 106.29%
2011 2012 81.96% 94.41% 71.36% 96.49% 95.78% 102.31% 98.38% 103.50% 103.45% 97.51% 120.74% 89.76% 84.62% 103.05%
2012 2013 89.95% 103.77% 85.05% 111.18% 106.67% 107.55% 105.65% 105.49% 98.07% 100.00% 107.65% 88.55% 94.57% 110.30%
2013 2014 78.77% 103.72% 93.30% 103.64% 102.37% 102.84% 98.83% 104.28% 104.17% 99.51% 106.11% 92.89% 99.00% 107.47%
2014 2015 106.36% 113.48% 89.39% 104.10% 108.19% 108.09% 108.29% 105.92% 100.00% 100.50% 115.35% 98.43% 93.88% 108.54%
2015 2016 99.34% 101.63% 108.09% 101.88% 107.88% 103.24% 101.07% 103.57% 101.68% 106.15% 107.96% 97.42% 98.40% 107.07%
mean simple all years Inf 101.78% Inf 99.88% 103.81% 103.05% 101.54% 104.83% 101.23% 99.59% 112.68% 96.12% 91.99% 105.45%
std. dev. simple all years NA 5.54% NA 5.91% 3.90% 4.60% 3.99% 3.36% 2.73% 3.39% 5.59% 4.92% 5.87% 5.73%
mean simple 5 years 91.28% 103.40% 89.44% 103.46% 104.18% 104.81% 102.44% 104.55% 101.47% 100.73% 111.56% 93.41% 94.09% 107.29%
std. dev. simple 5 years 11.59% 6.81% 13.31% 5.27% 5.24% 2.78% 4.36% 1.11% 2.50% 3.23% 6.26% 4.43% 5.76% 2.68%
mean simple 3 years 94.82% 106.28% 96.93% 103.20% 106.15% 104.73% 102.73% 104.59% 101.95% 102.05% 109.81% 96.25% 97.10% 107.69%
std. dev. simple 3 years 14.34% 6.32% 9.87% 1.17% 3.28% 2.92% 4.94% 1.20% 2.10% 3.59% 4.89% 2.95% 2.80% 0.76%
mean simple 2 years 102.85% 107.55% 98.74% 102.99% 108.03% 105.67% 104.68% 104.74% 100.84% 103.33% 111.65% 97.93% 96.14% 107.80%
std. dev. simple 2 years 4.96% 8.38% 13.23% 1.58% 0.22% 3.43% 5.10% 1.66% 1.19% 4.00% 5.22% 0.71% 3.20% 1.04%
mean weighted all years Inf 103.99% Inf 102.33% 105.53% 104.10% 102.39% 104.44% 101.23% 101.50% 110.96% 95.62% 94.82% 107.23%
std. dev. weighted all years NA 6.01% NA 4.71% 3.80% 3.64% 4.08% 1.98% 2.25% 3.73% 4.95% 3.92% 5.05% 2.79%
mean weighted 5 years 97.64% 104.83% 99.22% 103.04% 106.90% 104.65% 102.83% 104.36% 101.39% 103.32% 109.95% 96.42% 96.73% 107.57%
std. dev. weighted 5 years 9.61% 5.89% 11.39% 2.74% 2.91% 2.53% 3.90% 1.15% 1.66% 3.48% 4.30% 3.13% 3.25% 1.30%
mean weighted 3 years 99.76% 103.79% 104.23% 102.34% 107.72% 104.08% 102.25% 104.01% 101.48% 104.90% 109.18% 97.42% 97.63% 107.34%
std. dev. weighted 3 years 6.13% 5.50% 9.09% 1.08% 1.33% 2.27% 3.45% 1.09% 1.02% 2.94% 3.51% 1.21% 2.13% 0.69%
mean weighted 2 years 99.67% 102.19% 107.20% 101.98% 107.90% 103.47% 101.41% 103.68% 101.60% 105.88% 108.31% 97.47% 98.19% 107.14%
std. dev. weighted 2 years 2.11% 3.57% 5.63% 0.67% 0.09% 1.46% 2.17% 0.71% 0.50% 1.70% 2.22% 0.30% 1.36% 0.44%
DRAFT

GOOCHLAND COUNTY PUBLIC SCHOOLS
ENROLLMENT PROJECTIONS REPORT
PAGE 14
5/31/2017
GOOCHLAND COUNTY PUBLIC SCHOOLS
HISTORICAL ENROLLMENT
As indicated in the table below, over the past ten years, student enrollment in the
Goochland County Public Schools has increased by 183 students.
Historical Enrollment - District-wide
Grade 2007-08 2008-09 2009-10 2010-11 2011-12 2012-13 2013-14 2014-15 2015-16 2016-17
PK 37 NA NA 40 30 29 52 38 55 77
K - 5 1,083 1,135 1,123 1,101 1,056 994 1,056 1,030 1,115 1,099
6 - 8 511 523 565 585 563 583 575 597 575 592
9 - 12 780 763 765 758 750 745 768 773 821 826
Grand Total 2,411 2,421 2,453 2,484 2,399 2,351 2,451 2,438 2,566 2,594
Source: Goochland County Public Schools
0
500
1,000
1,500
2,000
2,500
3,000
Historical Enrollment - District-wide
Historical Enrollment - District-wide
Grade 2007-08 2008-09 2009-10 2010-11 2011-12 2012-13 2013-14 2014-15 2015-16 2016-17
PK 37 NA NA 40 30 29 52 38 55 77
K 187 190 173 176 161 159 188 141 184 150
1 206 192 184 177 171 152 165 195 160 187
2 166 203 186 170 166 165 169 171 203 163
3 179 169 212 196 173 159 176 173 185 219
4 179 192 176 207 185 177 171 181 187 191
5 166 189 192 175 200 182 187 169 196 189
6 177 184 193 208 174 207 192 195 179 203
7 157 179 193 195 201 180 203 200 195 182
8 177 160 179 182 188 196 180 202 201 207
9 196 193 194 203 205 227 211 191 233 217
10 202 203 189 195 195 184 201 196 188 227
11 191 193 173 175 164 165 174 199 184 185
12 191 174 209 185 186 169 182 187 216 197
Grand Total 2,411 2,421 2,453 2,484 2,399 2,351 2,451 2,438 2,566 2,594
Source: Goochland County Public Schools
DRAFT

GOOCHLAND COUNTY PUBLIC SCHOOLS
ENROLLMENT PROJECTIONS REPORT
PAGE 15
5/31/2017
Historical Enrollment - by School
School 2007-08 2008-09 2009-10 2010-11 2011-12 2012-13 2013-14 2014-15 2015-16 2016-17 Trend
Byrd Elementary 320 335 329 315 304 282 314 301 327 336
Goochland Elementary 388 373 364 385 370 344 350 329 350 354
Goochland High 780 763 765 758 750 745 768 773 821 826
Goochland Middle 511 523 565 585 563 583 575 597 575 592
Randolph Elementary 412 427 430 441 412 397 444 438 493 486
Total 2,411 2,421 2,453 2,484 2,399 2,351 2,451 2,438 2,566 2,594
Source: Goochland County Public Schools
DRAFT

GOOCHLAND COUNTY PUBLIC SCHOOLS
ENROLLMENT PROJECTIONS REPORT
PAGE 16
5/31/2017
PROJECTED ENROLLMENT
Cooperative Strategies developed low, moderate, high, and recommended enrollment
projections for the Goochland County Public Schools. The low projection illustrates a
conservative approach reflecting an economy that may have higher inflation / interest
rates, a decline in new housing, and / or a decline in live births. The high projection
takes a more liberal approach and reflects an economy that may have lower inflation /
interest rates, a high level of new housing, and / or an increase in live births. The
moderate falls in between these two approaches. The recommended projection
illustrates the most likely direction of the Division based on more recent trends in the
Division.
LOW PROJECTION
↑ Higher inflation / interest rates
↓ Decline in new housing
↓ Decline in live births
MODERATE PROJECTION
↔ Moderate inflation
↔ Moderate level of new housing
↔ Stagnate number of live births
HIGH PROJECTION
↓ Low inflation / interest rates
↑ High level of new housing
↑ Increase in live births
0
500
1,000
1,500
2,000
2,500
3,000
3,500
Historical & Projected Enrollment - Goochland County Public Schools
Historical Projected - Moderate/Recommended Projected - Low Projected - High
DRAFT

GOOCHLAND COUNTY PUBLIC SCHOOLS
ENROLLMENT PROJECTIONS REPORT
PAGE 17
5/31/2017
GOOCHLAND COUNTY PUBLIC SCHOOLS
PROJECTED ENROLLMENT—MODERATE/RECOMMENDED
Based on the moderate/recommended projected enrollment, the student enrollment in the
Goochland County Public Schools is projected to increase from 2,594 students in 2016-17 to
2,825 students in 2026-27.
0
500
1,000
1,500
2,000
2,500
3,000
3,500
Projected Enrollment -
Moderate/Recommended - District-wide
Projected Enrollment - Moderate/Recommended - District-wide
Grade 2017-18 2018-19 2019-20 2020-21 2021-22 2022-23 2023-24 2024-25 2025-26 2026-27
PK 77 77 77 77 77 77 77 77 77 77
K - 5 1,108 1,110 1,097 1,117 1,103 1,130 1,139 1,157 1,142 1,144
6 - 8 594 618 657 654 681 628 645 614 659 664
9 - 12 858 872 876 887 896 969 956 992 981 940
Grand Total 2,637 2,677 2,707 2,735 2,757 2,804 2,817 2,840 2,859 2,825
Source: Cooperative Strategies
Projected Enrollment - Moderate/Recommended - District-wide
Grade 2017-18 2018-19 2019-20 2020-21 2021-22 2022-23 2023-24 2024-25 2025-26 2026-27
PK 77 77 77 77 77 77 77 77 77 77
K 164 157 185 169 170 172 172 172 172 172
1 156 172 163 192 176 178 179 179 179 179
2 192 159 175 167 197 180 182 183 183 182
3 175 207 173 190 180 211 194 196 197 198
4 227 182 214 180 197 188 221 202 204 205
5 194 233 187 219 183 201 191 225 207 208
6 197 203 242 193 228 191 209 199 234 214
7 206 199 206 245 196 231 194 212 202 238
8 191 216 209 216 257 206 242 203 223 212
9 226 208 236 228 236 281 225 265 222 243
10 211 220 203 230 223 230 274 219 258 216
11 222 206 215 198 224 217 224 267 214 252
12 199 238 222 231 213 241 233 241 287 229
Grand Total 2,637 2,677 2,707 2,735 2,757 2,804 2,817 2,840 2,859 2,825
Source: Cooperative Strategies
DRAFT

GOOCHLAND COUNTY PUBLIC SCHOOLS
ENROLLMENT PROJECTIONS REPORT
PAGE 18
5/31/2017
Projected Enrollment - Moderate/Recommended - by School
School 2017-18 2018-19 2019-20 2020-21 2021-22 2022-23 2023-24 2024-25 2025-26 2026-27 Trend
Byrd Elementary 345 345 349 358 360 367 369 375 371 370
Goochland Elementary 350 358 353 369 366 375 377 383 378 379
Goochland High 858 872 876 887 896 969 956 992 981 940
Goochland Middle 594 618 657 654 681 628 645 614 659 664
Randolph Elementary 490 484 472 467 454 465 470 476 470 472
Total 2,637 2,677 2,707 2,735 2,757 2,804 2,817 2,840 2,859 2,825
Source: Cooperative Strategies
DRAFT

GOOCHLAND COUNTY PUBLIC SCHOOLS
ENROLLMENT PROJECTIONS REPORT
PAGE 19
5/31/2017
GOOCHLAND COUNTY PUBLIC SCHOOLS
PROJECTED ENROLLMENT—LOW
Based on the low projected enrollment, the student enrollment in the Goochland County
Public Schools is projected to decrease from 2,594 students in 2016-17 to 2,510 students in 2026-
27.
0
500
1,000
1,500
2,000
2,500
3,000
Projected Enrollment - Low - District-wide
Projected Enrollment - Low - District-wide
Grade 2017-18 2018-19 2019-20 2020-21 2021-22 2022-23 2023-24 2024-25 2025-26 2026-27
PK 77 77 77 77 77 77 77 77 77 77
K - 5 1,085 1,063 1,028 1,035 1,012 1,026 1,033 1,049 1,037 1,039
6 - 8 590 609 640 626 640 577 577 536 567 572
9 - 12 850 857 853 854 854 915 891 908 882 822
Grand Total 2,602 2,606 2,598 2,592 2,583 2,595 2,578 2,570 2,563 2,510
Source: Cooperative Strategies
Projected Enrollment - Low - District-wide
Grade 2017-18 2018-19 2019-20 2020-21 2021-22 2022-23 2023-24 2024-25 2025-26 2026-27
PK 77 77 77 77 77 77 77 77 77 77
K 158 150 177 162 165 165 165 165 165 165
1 151 160 151 178 164 165 167 167 166 167
2 189 152 160 152 180 165 166 167 168 167
3 171 199 161 171 162 191 174 176 177 177
4 223 176 204 166 175 166 195 178 181 181
5 193 226 175 206 166 174 166 196 180 182
6 196 199 234 182 212 172 181 173 203 186
7 205 198 201 236 184 214 174 183 174 205
8 189 212 205 208 244 191 222 180 190 181
9 223 203 229 220 224 263 205 239 194 204
10 210 216 197 221 213 217 255 199 232 188
11 219 203 209 190 214 206 210 246 192 224
12 198 235 218 223 203 229 221 224 264 206
Grand Total 2,602 2,606 2,598 2,592 2,583 2,595 2,578 2,570 2,563 2,510
Source: Cooperative Strategies
DRAFT

GOOCHLAND COUNTY PUBLIC SCHOOLS
ENROLLMENT PROJECTIONS REPORT
PAGE 20
5/31/2017
Projected Enrollment - Low - by School
School 2017-18 2018-19 2019-20 2020-21 2021-22 2022-23 2023-24 2024-25 2025-26 2026-27 Trend
Byrd Elementary 341 335 335 341 341 345 347 352 349 350
Goochland Elementary 345 347 335 349 345 350 351 357 353 353
Goochland High 850 857 853 854 854 915 891 908 882 822
Goochland Middle 590 609 640 626 640 577 577 536 567 572
Randolph Elementary 476 458 435 422 403 408 412 417 412 413
Total 2,602 2,606 2,598 2,592 2,583 2,595 2,578 2,570 2,563 2,510
Source: Cooperative Strategies
DRAFT

GOOCHLAND COUNTY PUBLIC SCHOOLS
ENROLLMENT PROJECTIONS REPORT
PAGE 21
5/31/2017
GOOCHLAND COUNTY PUBLIC SCHOOLS
PROJECTED ENROLLMENT—HIGH
Based on the high projected enrollment, the student enrollment in the Goochland County
Public Schools is projected to increase from 2,594 students in 2016-17 to 3,178 students in 2026-
27.
0
500
1,000
1,500
2,000
2,500
3,000
3,500
Projected Enrollment - High - District-wide
Projected Enrollment - High - District-wide
Grade 2017-18 2018-19 2019-20 2020-21 2021-22 2022-23 2023-24 2024-25 2025-26 2026-27
PK 77 77 77 77 77 77 77 77 77 77
K - 5 1,133 1,155 1,163 1,201 1,204 1,241 1,250 1,273 1,253 1,258
6 - 8 598 628 675 684 724 682 719 702 762 769
9 - 12 865 890 900 921 938 1,025 1,024 1,081 1,089 1,074
Grand Total 2,673 2,750 2,815 2,883 2,943 3,025 3,070 3,133 3,181 3,178
Source: Cooperative Strategies
Projected Enrollment - High - District-wide
Grade 2017-18 2018-19 2019-20 2020-21 2021-22 2022-23 2023-24 2024-25 2025-26 2026-27
PK 77 77 77 77 77 77 77 77 77 77
K 171 162 192 176 177 178 178 178 178 178
1 162 184 175 207 189 191 192 192 192 192
2 194 167 190 181 214 195 197 199 199 198
3 179 214 184 210 200 235 215 218 218 220
4 230 188 226 194 222 212 249 228 230 232
5 197 240 196 233 202 230 219 258 236 238
6 198 207 250 205 244 211 240 229 269 246
7 207 201 211 255 209 249 215 245 233 275
8 193 220 214 224 271 222 264 228 260 248
9 229 214 243 237 248 300 245 293 253 288
10 213 225 210 239 232 243 294 240 287 248
11 224 210 221 207 235 229 239 290 237 283
12 199 241 226 238 223 253 246 258 312 255
Grand Total 2,673 2,750 2,815 2,883 2,943 3,025 3,070 3,133 3,181 3,178
Source: Cooperative Strategies
DRAFT

GOOCHLAND COUNTY PUBLIC SCHOOLS
ENROLLMENT PROJECTIONS REPORT
PAGE 22
5/31/2017
Projected Enrollment - High - by School
School 2017-18 2018-19 2019-20 2020-21 2021-22 2022-23 2023-24 2024-25 2025-26 2026-27 Trend
Byrd Elementary 350 354 363 375 380 389 391 398 393 394
Goochland Elementary 356 368 369 390 392 400 404 411 404 406
Goochland High 865 890 900 921 938 1,025 1,024 1,081 1,089 1,074
Goochland Middle 598 628 675 684 724 682 719 702 762 769
Randolph Elementary 504 510 508 513 509 529 532 541 533 535
Total 2,673 2,750 2,815 2,883 2,943 3,025 3,070 3,133 3,181 3,178
Source: Cooperative Strategies
DRAFT

GOOCHLAND COUNTY PUBLIC SCHOOLS
ENROLLMENT PROJECTIONS REPORT
PAGE 23
5/31/2017
ENROLLMENT BY SCHOOL
The following pages illustrate historical and projected enrollment by school.
Byrd Elementary .............................................................................................................................. 24
Goochland Elementary ................................................................................................................... 25
Goochland High .............................................................................................................................. 26
Goochland Middle........................................................................................................................... 27
Randolph Elementary ..................................................................................................................... 28
DRAFT

GOOCHLAND COUNTY PUBLIC SCHOOLS
ENROLLMENT PROJECTIONS REPORT
PAGE 24
5/31/2017
BYRD ELEMENTARY
Historical Enrollment - Byrd Elementary
Grade 2007-08 2008-09 2009-10 2010-11 2011-12 2012-13 2013-14 2014-15 2015-16 2016-17
PK NA NA NA NA NA NA 16 16 21 19
K 57 49 47 50 48 52 51 46 53 50
1 63 62 46 47 45 47 54 51 48 53
2 47 63 61 41 44 41 51 52 53 46
3 53 54 64 64 47 46 47 46 55 58
4 49 55 55 61 59 43 46 45 51 59
5 51 52 56 52 61 53 49 45 46 51
Grand Total 320 335 329 315 304 282 314 301 327 336
Source: Goochland County Public Schools
Projected Enrollment - Moderate/Recommended - Byrd Elementary
Grade 2017-18 2018-19 2019-20 2020-21 2021-22 2022-23 2023-24 2024-25 2025-26 2026-27
PK 19 19 19 19 19 19 19 19 19 19
K 53 51 60 55 55 56 56 56 56 56
1 50 54 51 60 55 56 56 56 56 56
2 52 49 52 50 59 54 54 55 55 54
3 50 56 53 57 54 63 58 59 59 59
4 62 53 60 57 61 58 68 62 63 63
5 59 63 54 60 57 61 58 68 63 63
Grand Total 345 345 349 358 360 367 369 375 371 370
Source: Cooperative Strategies
Projected Enrollment - Low - Byrd Elementary
Grade 2017-18 2018-19 2019-20 2020-21 2021-22 2022-23 2023-24 2024-25 2025-26 2026-27
PK 19 19 19 19 19 19 19 19 19 19
K 52 49 58 53 54 54 54 54 54 54
1 50 52 49 58 53 54 54 54 54 54
2 51 48 50 47 56 51 51 52 52 52
3 49 54 51 53 50 59 54 54 55 55
4 61 52 57 54 56 53 62 57 58 58
5 59 61 51 57 53 55 53 62 57 58
Grand Total 341 335 335 341 341 345 347 352 349 350
Source: Cooperative Strategies
Projected Enrollment - High - Byrd Elementary
Grade 2017-18 2018-19 2019-20 2020-21 2021-22 2022-23 2023-24 2024-25 2025-26 2026-27
PK 19 19 19 19 19 19 19 19 19 19
K 55 52 62 56 57 57 57 57 57 57
1 51 56 53 63 57 58 58 58 58 58
2 52 50 55 53 62 57 57 58 58 58
3 51 58 55 61 58 68 62 63 63 64
4 63 55 63 60 66 63 74 68 69 69
5 59 64 56 63 61 67 64 75 69 69
Grand Total 350 354 363 375 380 389 391 398 393 394
Source: Cooperative Strategies
DRAFT

GOOCHLAND COUNTY PUBLIC SCHOOLS
ENROLLMENT PROJECTIONS REPORT
PAGE 25
5/31/2017
GOOCHLAND ELEMENTARY
Historical Enrollment - Goochland Elementary
Grade 2007-08 2008-09 2009-10 2010-11 2011-12 2012-13 2013-14 2014-15 2015-16 2016-17
PK 37 NA NA 33 30 26 30 16 31 34
K 55 70 53 51 54 49 53 36 46 41
1 68 56 66 55 54 53 45 55 39 54
2 55 68 53 62 51 51 55 50 58 39
3 60 54 71 60 55 46 51 60 54 70
4 61 63 58 65 59 59 55 56 61 53
5 52 62 63 59 67 60 61 56 61 63
Grand Total 388 373 364 385 370 344 350 329 350 354
Source: Goochland County Public Schools
Projected Enrollment - Moderate/Recommended - Goochland Elementary
Grade 2017-18 2018-19 2019-20 2020-21 2021-22 2022-23 2023-24 2024-25 2025-26 2026-27
PK 34 34 34 34 34 34 34 34 34 34
K 44 42 50 45 46 46 46 46 46 46
1 47 51 48 57 52 53 53 53 53 53
2 55 48 52 49 58 53 54 54 54 54
3 46 65 57 61 58 68 62 63 63 64
4 69 46 64 56 60 58 68 62 63 63
5 55 72 48 67 58 63 60 71 65 65
Grand Total 350 358 353 369 366 375 377 383 378 379
Source: Cooperative Strategies
Projected Enrollment - Low - Goochland Elementary
Grade 2017-18 2018-19 2019-20 2020-21 2021-22 2022-23 2023-24 2024-25 2025-26 2026-27
PK 34 34 34 34 34 34 34 34 34 34
K 43 41 48 44 45 45 45 45 45 45
1 46 49 46 54 50 50 51 51 50 51
2 54 46 48 46 54 50 50 50 51 50
3 45 62 53 56 53 63 57 58 58 58
4 68 44 61 52 55 52 61 56 57 57
5 55 71 45 63 54 56 53 63 58 58
Grand Total 345 347 335 349 345 350 351 357 353 353
Source: Cooperative Strategies
Projected Enrollment - High - Goochland Elementary
Grade 2017-18 2018-19 2019-20 2020-21 2021-22 2022-23 2023-24 2024-25 2025-26 2026-27
PK 34 34 34 34 34 34 34 34 34 34
K 45 43 51 47 47 47 47 47 47 47
1 48 53 51 60 55 55 56 56 56 56
2 56 50 55 52 62 56 57 57 57 57
3 47 67 60 66 63 74 68 69 69 69
4 70 47 68 60 67 64 75 69 69 70
5 56 74 50 71 64 70 67 79 72 73
Grand Total 356 368 369 390 392 400 404 411 404 406
Source: Cooperative Strategies
DRAFT

GOOCHLAND COUNTY PUBLIC SCHOOLS
ENROLLMENT PROJECTIONS REPORT
PAGE 26
5/31/2017
GOOCHLAND HIGH
Historical Enrollment - Goochland High
Grade 2007-08 2008-09 2009-10 2010-11 2011-12 2012-13 2013-14 2014-15 2015-16 2016-17
9 196 193 194 203 205 227 211 191 233 217
10 202 203 189 195 195 184 201 196 188 227
11 191 193 173 175 164 165 174 199 184 185
12 191 174 209 185 186 169 182 187 216 197
Grand Total 780 763 765 758 750 745 768 773 821 826
Source: Goochland County Public Schools
Projected Enrollment - Moderate/Recommended - Goochland High
Grade 2017-18 2018-19 2019-20 2020-21 2021-22 2022-23 2023-24 2024-25 2025-26 2026-27
9 226 208 236 228 236 281 225 265 222 243
10 211 220 203 230 223 230 274 219 258 216
11 222 206 215 198 224 217 224 267 214 252
12 199 238 222 231 213 241 233 241 287 229
Grand Total 858 872 876 887 896 969 956 992 981 940
Source: Cooperative Strategies
Projected Enrollment - Low - Goochland High
Grade 2017-18 2018-19 2019-20 2020-21 2021-22 2022-23 2023-24 2024-25 2025-26 2026-27
9 223 203 229 220 224 263 205 239 194 204
10 210 216 197 221 213 217 255 199 232 188
11 219 203 209 190 214 206 210 246 192 224
12 198 235 218 223 203 229 221 224 264 206
Grand Total 850 857 853 854 854 915 891 908 882 822
Source: Cooperative Strategies
Projected Enrollment - High - Goochland High
Grade 2017-18 2018-19 2019-20 2020-21 2021-22 2022-23 2023-24 2024-25 2025-26 2026-27
9 229 214 243 237 248 300 245 293 253 288
10 213 225 210 239 232 243 294 240 287 248
11 224 210 221 207 235 229 239 290 237 283
12 199 241 226 238 223 253 246 258 312 255
Grand Total 865 890 900 921 938 1,025 1,024 1,081 1,089 1,074
Source: Cooperative Strategies DRAFT

GOOCHLAND COUNTY PUBLIC SCHOOLS
ENROLLMENT PROJECTIONS REPORT
PAGE 27
5/31/2017
GOOCHLAND MIDDLE
Historical Enrollment - Goochland Middle
Grade 2007-08 2008-09 2009-10 2010-11 2011-12 2012-13 2013-14 2014-15 2015-16 2016-17
6 177 184 193 208 174 207 192 195 179 203
7 157 179 193 195 201 180 203 200 195 182
8 177 160 179 182 188 196 180 202 201 207
Grand Total 511 523 565 585 563 583 575 597 575 592
Source: Goochland County Public Schools
Projected Enrollment - Moderate/Recommended - Goochland Middle
Grade 2017-18 2018-19 2019-20 2020-21 2021-22 2022-23 2023-24 2024-25 2025-26 2026-27
6 197 203 242 193 228 191 209 199 234 214
7 206 199 206 245 196 231 194 212 202 238
8 191 216 209 216 257 206 242 203 223 212
Grand Total 594 618 657 654 681 628 645 614 659 664
Source: Cooperative Strategies
Projected Enrollment - Low - Goochland Middle
Grade 2017-18 2018-19 2019-20 2020-21 2021-22 2022-23 2023-24 2024-25 2025-26 2026-27
6 196 199 234 182 212 172 181 173 203 186
7 205 198 201 236 184 214 174 183 174 205
8 189 212 205 208 244 191 222 180 190 181
Grand Total 590 609 640 626 640 577 577 536 567 572
Source: Cooperative Strategies
Projected Enrollment - High - Goochland Middle
Grade 2017-18 2018-19 2019-20 2020-21 2021-22 2022-23 2023-24 2024-25 2025-26 2026-27
6 198 207 250 205 244 211 240 229 269 246
7 207 201 211 255 209 249 215 245 233 275
8 193 220 214 224 271 222 264 228 260 248
Grand Total 598 628 675 684 724 682 719 702 762 769
Source: Cooperative Strategies DRAFT

GOOCHLAND COUNTY PUBLIC SCHOOLS
ENROLLMENT PROJECTIONS REPORT
PAGE 28
5/31/2017
RANDOLPH ELEMENTARY
Historical Enrollment - Randolph Elementary
Grade 2007-08 2008-09 2009-10 2010-11 2011-12 2012-13 2013-14 2014-15 2015-16 2016-17
PK NA NA NA 7 NA 3 6 6 3 24
K 75 71 73 75 59 58 84 59 85 59
1 75 74 72 75 72 52 66 89 73 80
2 64 72 72 67 71 73 63 69 92 78
3 66 61 77 72 71 67 78 67 76 91
4 69 74 63 81 67 75 70 80 75 79
5 63 75 73 64 72 69 77 68 89 75
Grand Total 412 427 430 441 412 397 444 438 493 486
Source: Goochland County Public Schools
Projected Enrollment - Moderate/Recommended - Randolph Elementary
Grade 2017-18 2018-19 2019-20 2020-21 2021-22 2022-23 2023-24 2024-25 2025-26 2026-27
PK 24 24 24 24 24 24 24 24 24 24
K 67 64 75 69 69 70 70 70 70 70
1 59 67 64 75 69 69 70 70 70 70
2 85 62 71 68 80 73 74 74 74 74
3 79 86 63 72 68 80 74 74 75 75
4 96 83 90 67 76 72 85 78 78 79
5 80 98 85 92 68 77 73 86 79 80
Grand Total 490 484 472 467 454 465 470 476 470 472
Source: Cooperative Strategies
Projected Enrollment - Low - Randolph Elementary
Grade 2017-18 2018-19 2019-20 2020-21 2021-22 2022-23 2023-24 2024-25 2025-26 2026-27
PK 24 24 24 24 24 24 24 24 24 24
K 63 60 71 65 66 66 66 66 66 66
1 55 59 56 66 61 61 62 62 62 62
2 84 58 62 59 70 64 65 65 65 65
3 77 83 57 62 59 69 63 64 64 64
4 94 80 86 60 64 61 72 65 66 66
5 79 94 79 86 59 63 60 71 65 66
Grand Total 476 458 435 422 403 408 412 417 412 413
Source: Cooperative Strategies
Projected Enrollment - High - Randolph Elementary
Grade 2017-18 2018-19 2019-20 2020-21 2021-22 2022-23 2023-24 2024-25 2025-26 2026-27
PK 24 24 24 24 24 24 24 24 24 24
K 71 67 79 73 73 74 74 74 74 74
1 63 75 71 84 77 78 78 78 78 78
2 86 67 80 76 90 82 83 84 84 83
3 81 89 69 83 79 93 85 86 86 87
4 97 86 95 74 89 85 100 91 92 93
5 82 102 90 99 77 93 88 104 95 96
Grand Total 504 510 508 513 509 529 532 541 533 535
Source: Cooperative Strategies
DRAFT

GOOCHLAND COUNTY PUBLIC SCHOOLS
ENROLLMENT PROJECTIONS REPORT
PAGE 29
5/31/2017
CONCLUSION
As with any projection, the Division should pay close attention to live birth counts, enrollment
in elementary schools, open enrollment, non-public enrollment, in / out migration patterns,
and any housing growth. It is recommended that this document be reviewed on an annual
basis to determine how more recent growth and enrollment trends will impact the enrollment
projections.
Cooperative Strategies is pleased to have had the opportunity to provide the Division with
enrollment projection services. We hope this document will provide the necessary information
to make informed decisions about the future of the Goochland County Public Schools.
DRAFT