good judgment “disruptions from vehicle innovations
TRANSCRIPT
1
Good Judgment “Disruptions from Vehicle Innovations” Challenge July 21, 2017 - August 3, 2018
Year-End Summary of Trends, Patterns, and Lessons Learned
Rahul Kapoor, John Paul MacDuffie and Daniel Wilde Program on Vehicle and Mobility Innovation, Mack Institute of Innovation Management
The Wharton School, University of Pennsylvania
I. Background
The automotive ecosystem is in the midst of a dramatic transformation: from total reliance on internal combustion engines to growing acceptance of electric and hybrid electric vehicles; from driven to driverless cars; from vehicle ownership to vehicle sharing and pay-for-usage ride-hailing -- and everything in between. For the last two years, we have been studying this transformation using crowdsourced forecasting tournaments in collaboration with Good Judgment Inc. (GJ), an organization that excels in designing and implementing such tournaments, based on the pioneering research by Philip Tetlock and colleagues.
Much of the present research on forecasting tournaments is centered on efforts to predict economic and political outcomes. It is our continued belief that there is a real opportunity in exploring the use of this tournament design for the purpose of understanding the patterns of disruption in industries. We have been working with Good Judgment Inc. (GJ) since October of 2015, under the auspices of the Program on Vehicle and Mobility Innovation (PVMI), to design and host forecasting tournaments (also referred to as a “challenge”) focusing on the emerging technologies and innovations within the automotive sector.
The first tournament ran from April 2016 to December 2016, and allowed us to get hands-on experience with respect to how these tournaments operate, and to assess their potential utility vis-à-vis industry forecasting. The second tournament ran from July 2017 to August 2018. We have enclosed a report that details the design, the findings, and the learnings from the second tournament. Specifically, the report sets forth in the following order: (a) an overview of the challenge, (b) a discussion on what we have learned about disruption of Electric Vehicles (EVs) and Autonomous Vehicles (AVs) from our challenges, (c) a discussion on the forecasting trends from the challenge, (d) a discussion about the top forecasters in our challenges, (e) a detailed analysis of each question in our challenge, (f) a deep dive into the critical EV-related topic of average battery cost, and (g) an outline of our plans for the next challenge.
II. Challenge
We launched the second year-long tournament in July of 2017. This tournament built on the momentum that we generated during the 2016 challenge and was significantly broader than the previous challenge in terms of the topics covered. Table 1 below includes basic information on the questions included in the second challenge. The tournament attracted nearly 1,600 forecasters who made nearly 12,000 forecasts (up from 1,530 forecasters, and roughly 9,500 forecasts in the first-year challenge) on predictions covering specific developments in technology, automaker strategies, the competitive landscape and the regulatory environment. This has allowed us to
2
observe in real-time the uncertainties and the dynamics underlying this changing landscape, and to create a large-scale dataset involving tens of thousands of probabilistic predictions by forecasters on specific questions across a range of topics, along with the rationale for the specific prediction in many cases.
The challenge included 17 questions focusing on innovations with respect to autonomous vehicles (AVs) and electric vehicles (EVs) including battery electric vehicles (BEVs) and hydrogen fuel cell vehicles (FCVs) questions and autonomous vehicles. The nine questions on electric vehicles covered topics such as average cost for Lithium-ion batteries; customer demand and auto firm sales for certain vehicles (both battery electric vehicles and fuel cell vehicles); key infrastructure developments such as hydrogen fueling stations and DC Fast Charge electric stations; and whether Tesla would build a factory in China. The eight questions on autonomous vehicles covered issues such as state and federal regulation; the outcome of the Waymo-Uber litigation; autonomous vehicle related accident levels in California; and, autonomous vehicle technology advancements pioneered by Audi and Baidu. These questions were carefully identified based on their current relevance to the emergence of electric and autonomous vehicles with respect to the technologies, companies, and policies, and whose answers could be resolved through information from publicly available sources within the stipulated timeframe of the challenge.
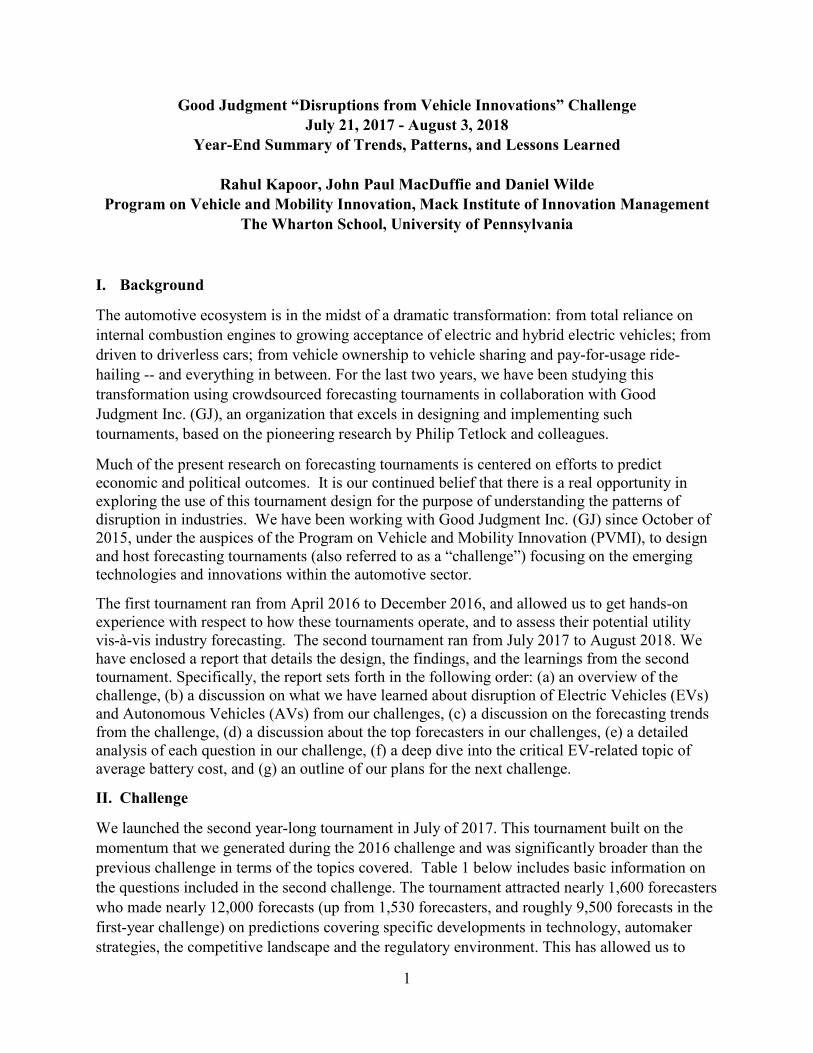
This forecasting challenge closed on August 3rd, 2018. Upon completion of the challenge, we resolved all the questions so forecasters could get feedback on how they performed on the challenge. We also analyzed the forecasting data (both quantitative and qualitative) to identify the trends and the basis for predictions made by the forecasters. The table below includes basic information on the questions included in the challenge.
Question Launch Date
Closed Date Resolution Forecasters Forecasts
Between 21 July 2017 and 20 July 2018, will any major automaker announce a date after which they will sell only electric or hybrid vehicles?
7/21/2017 7/20/2018 No 593 1243
Before 1 July 2018, how many Model 3 cars will Tesla deliver to customers? 7/21/2017 7/1/2018 Less than
50,000 518 1312
Before 1 July 2018, will Uber, or any of its subsidiaries, agree to a settlement or be found liable for trade secrets violations in the case brought by Waymo in the Northern District of California?
7/21/2017 2/9/2018 Yes 309 633
Before 1 January 2018, will the U.S. President sign legislation increasing the number of autonomous vehicle exemptions allowed by the Federal Motor Vehicle Safety Standards?
7/21/2017 1/1/2018 No 226 421
What will be the 2017 industry-wide average cost of Li-ion batteries used in battery-powered electric vehicles? 7/21/2017 1/1/2018 >$230, but <
$245 kWh 178 404
How many Chevrolet Bolt EV's will be sold between January and June 2018? 8/18/2017 7/1/2018 Less than
10,000 355 909
On 29 June 2018, how many public DC Fast Charge electric vehicle charging stations will be available in the United States?
9/8/2017 6/29/2018 Less than 2,400 332 850
On 30 March 2018, how many GitHub forks will Baidu's Apollo autonomous driving software have? 9/8/2017 3/30/2018
Between 2,001 and 3,000, inclusive
241 849
3
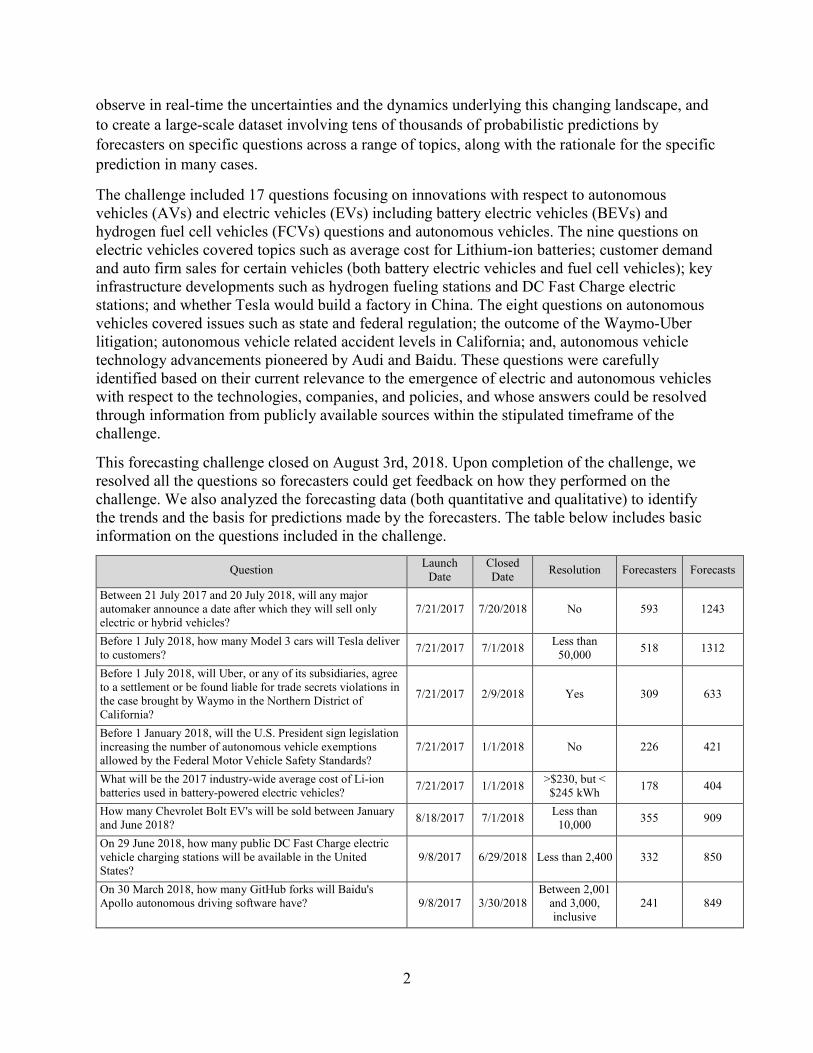
Before 1 July 2018, will Tesla announce that it will build a factory to manufacture electric vehicles in China? 10/20/2017 7/1/2018 No 520 947
Before 1 July 2018, will Waymo launch a driverless transportation service open to the public? 11/17/2017 3/13/2018 Yes 370 547
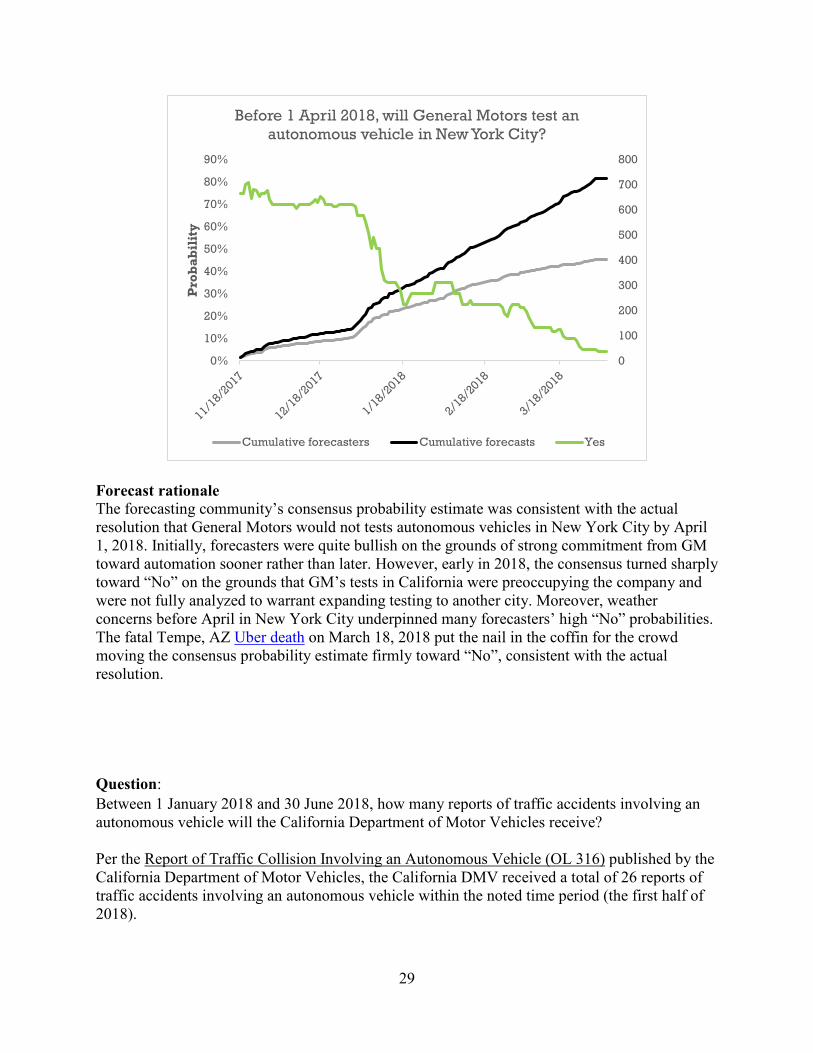
Before 1 April 2018, will General Motors test an autonomous vehicle in New York City? 11/17/2017 4/1/2018 No 409 730
Between 1 January 2018 and 30 June 2018, how many reports of traffic accidents involving an autonomous vehicle will the California Department of Motor Vehicles receive?
12/8/2017 7/1/2018 Between 20
and 29, inclusive
496 1072
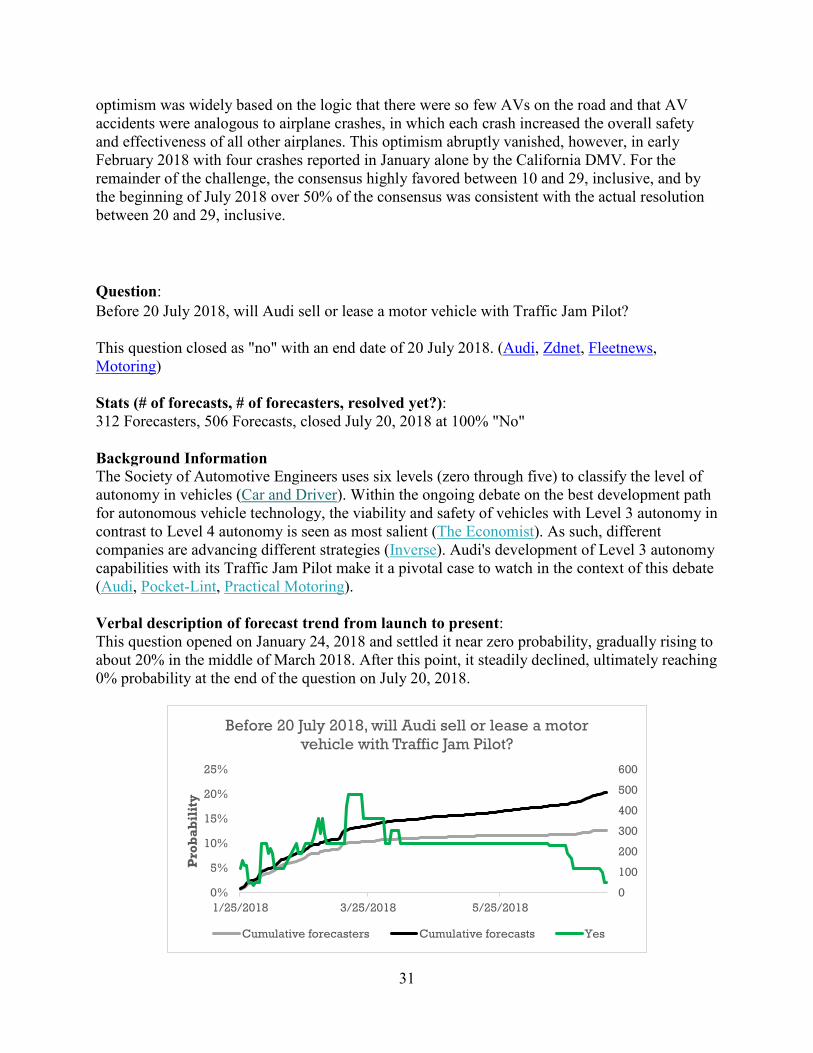
Before 20 July 2018, will Audi sell or lease a motor vehicle with Traffic Jam Pilot? 1/24/2018 7/20/2018 No 312 506
On 29 June 2018, how many public hydrogen fueling stations will be available in the United States? 2/28/2018 6/29/2018 Fewer than 45 195 435
How many Mirais will Toyota sell or lease between January 2018 and June 2018, inclusive? 2/28/2018 7/1/2018 Less than 900 100 265
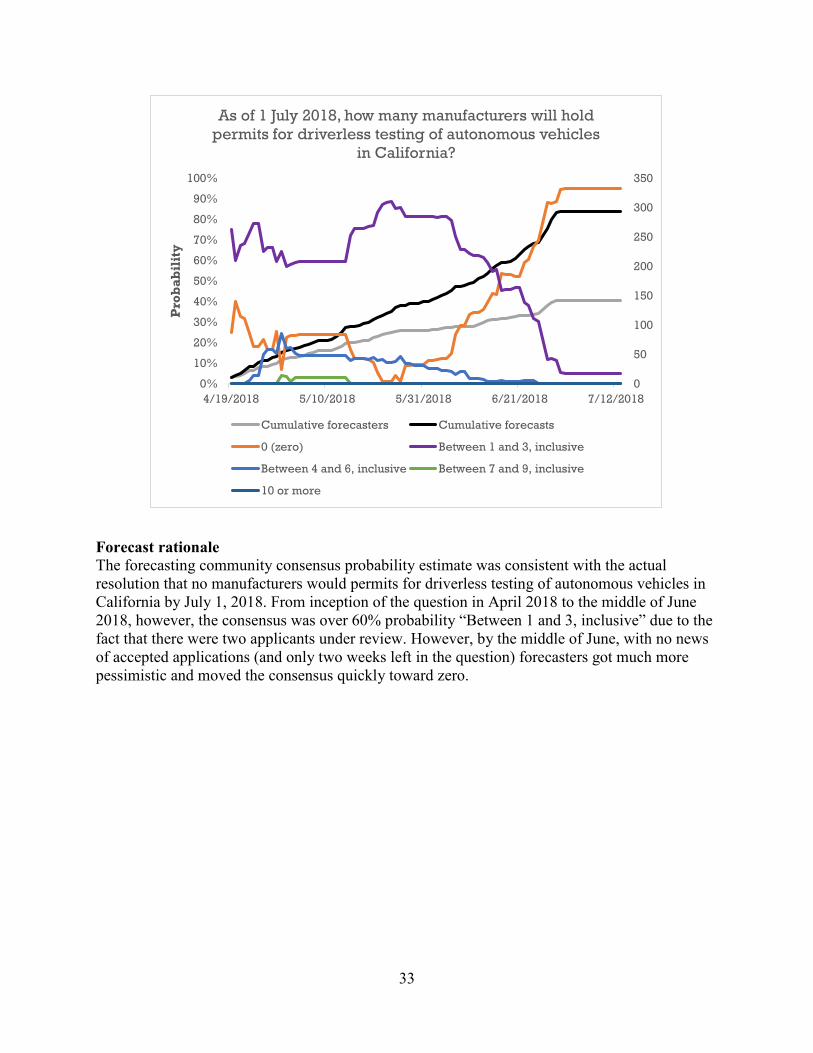
As of 1 July 2018, how many manufacturers will hold permits for driverless testing of autonomous vehicles in California? 4/18/2018 7/1/2018 Zero 154 312
Between 1 July 2017 and 1 July 2018, how many Model 3 cars will Tesla deliver to customers? 4/18/2018 7/1/2018 29,000 or less 107 391
III. Disruption overview
With the benefit of data spanning two challenges we are now able to glean insight on the overall acceleration or deceleration of disruption in the context of both electric vehicles (e.g., BEVs and FCVs) and AVs. Comparing the resolutions of electric vehicles questions from the 2016 challenge to this challenge, we find evidence to suggest a general deceleration in disruption or progress of electric vehicles (EVs). Specifically, among the EV questions of the 2016 challenge, four questions—related to sales, new market entry, and battery costs—resolved positively, while another four EV-related questions—related to sales and policy—resolved negatively1. In contrast, within the EV portion of this challenge, only one question—dealing with technology—resolved positively, while eight questions—dealing with sales and infrastructure—all resolved negatively. Overall, the disappointing (relative to expectations) sales figures, and slow infrastructure growth supported a broad conclusion that mid-2017 to mid-2018 was a year of unmet expectations for EV advocates. The one bright spot in the unfolding EV story, however, is the continued reduced battery cost.
In comparing the resolutions of AV-related questions in the 2016 challenge and this challenge, we find evidence to suggest a modest deceleration in disruption in AVs. In particular, among the 1 Questions were framed either positively, meaning resolution of “Yes” (for yes-no questions) or higher values (for multiple-choice questions) would indicate positive evidence of disruption in EVs or AVs, or negatively, meaning a “Yes” (for yes-no questions) or higher values (for multiple-choice questions) would provide negative evidence of disruption in EVs or AVs. An example of a positively-framed binary question is “Before 20 July 2018, will Audi sell or lease a motor vehicle with Traffic Jam Pilot?” A resolution of “Yes” would indicate forward movement in disruption through AVs. Conversely, a resolution of “No” would provide negative evidence toward the disruption through AVs. An example of a negatively-framed multinomial question is “Between 1 January 2018 and 30 June 2018, how many reports of traffic accidents involving an autonomous vehicle will the California Department of Motor Vehicles receive?” In this case, higher values would provide negative evidence toward the disruption through AVs. The converse in this case is also true. See “Detailed Analysis” section below for questions-specific details on framing.
4
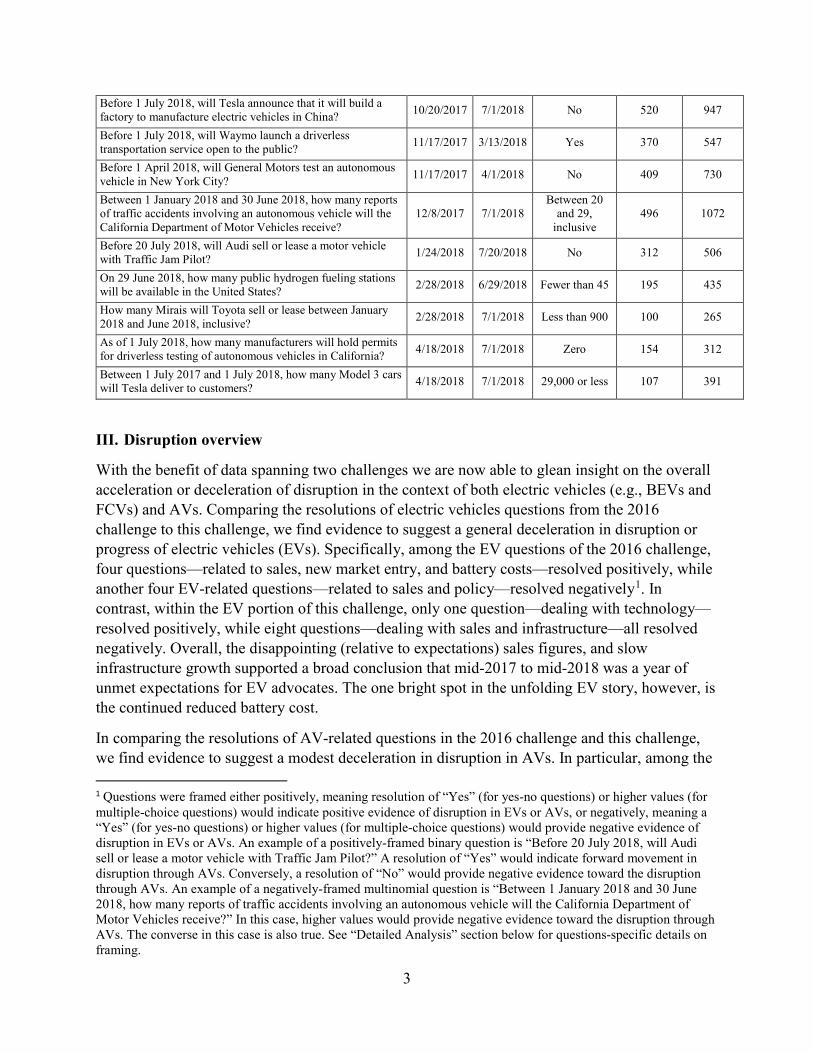
AV questions of the 2016 challenge, three questions—related to safety, technology, and policy—resolved positively, while one AV-related question—related to AV testing—resolved negatively. Similarly, within the AV portion of this challenge, three questions—dealing with trade secrets, technology and AV public services—resolved positively, while five questions—dealing with safety, technology, and AV testing—resolved negatively. The general subject areas of safety, technology, and policy shifted from positive to negative resolutions, and the AV testing related questions resolved negatively in both challenges. All the same, the fact that we are comparing four question resolutions from the 2016 challenge to the eight total questions in this challenge perhaps softens the conclusion as to the acceleration AV trends. Moreover, the three positive resolutions in this challenge do provide a positive tint and evidence of clear forward progress. Collectively, we see a general progress with perhaps a slight deceleration of AV disruption, not to the degree of deceleration in disruption of EVs. The table below summarizes these trends across topic and challenge.
IV. Forecasting trends
Optimism and pessimism
Based on the framing of questions and associated answers as well as comments made by forecasters (outlining their rationale for specific forecasts made), we are able to assess the general optimism or pessimism of the crowd throughout each question and challenge. During this challenge, the GJ Open forecasting community leaned slightly optimistic during the first half of most questions between both sections of this challenge. Specifically, in the EV section of the challenge, five of the nine questions settled in with a positive and optimistic consensus. However, of these five, four saw a sharp drop toward pessimism at some point in the middle of the question and one saw a gradual drop toward pessimism during the question window. Of the
Disruption questions resolutions by topic and challenge
2016 challenge 2017-18 challenge
Subject positive negative positive negative
Electric Vehicles
sales 3 4 5
technology 1 1
policy 1
infrastructure 3
Total 4 5 1 8
Autonomous Vehicles
safety 1 1 1
technology 1 1 2 2
policy 1 2
Total 3 1 3 5
5
four questions beginning with a clear pessimistic consensus, three remained so for the duration of the question and one shifted toward optimism.
In the AV section of this challenge, the crowd was also generally optimistic for the first half of question windows. In particular, six of the eight questions saw this optimistic consensus and rationale, with one shifting sharply toward pessimism with one month left in the question’s three month question window, four gradually shifting toward pessimism, and one maintaining optimism throughout. Both of the questions which settled in at a pessimistic consensus remained pessimistic throughout the question. For in-depth question-level analysis of trends and rationale refer to the “Detailed Analysis” section below.
The wisdom of the GJ Open crowd
Overall, the forecasting community performed quite well in the tournament. In five of the 17 questions in this challenge, from the beginning of the question onward the consensus probability estimate (hereafter, “consensus”) of high or low likelihood was consistent with the actual resolution of the question. In five other questions in the challenge the consensus made sharp adjustments at some point in the challenge window (i.e., this occurred seven months prior to the question close in two questions, four months prior in one question, two months prior in one question, and several weeks prior in one question) consistent with the actual resolution of the question. Among the remaining questions, in five questions the consensus gradually converged to the actual resolution. Comparing the 2016 challenge, the consensus became consistent with the actual resolution of the question immediately in four questions, gradually in six questions, and sharply within the question window in three questions.
In this challenge, there were only two questions in which the consensus probability estimate was inconsistent with the actual resolution prior to the resolution date. In one question, regarding whether Waymo would launch a driverless transportation service open to the public by July 1, 2018, the forecasting community overwhelmingly settled on a 15% consensus prediction until the end of the challenge. To be fair, there were a healthy bullish minority noting that Waymo had a permit granted and that increased media coverage surrounding the trials in Arizona made the affirmative resolution highly likely. For more details on this question and resolution, refer to the AV challenge detail section below.
The second question in which the crowd was unable to predict the forecast was related to the second of two Tesla Model 3 questions. As discussed under the EV section below, the forecasting community heavily used Bloomberg Model 3 Tracker, a website which estimates weekly and total Model 3 production, in their predictions. The question, however, was asking for deliveries, not production per se. Moreover, upon release of audited financial statements with clear delivery data, forecasters did not update their predictions. In the end, there were a total of 28,394 (“29,000 and less”) Model 3 deliveries from July 1 2017 and July 1, 2018 as opposed to the “Between 36,000 and 43,000 inclusive” clear consensus perpetuated by the Bloomberg cite. We feel this was a great learning experience for both the crowd and the question generators in being attuned to the wording of questions and tempting public sources that may distract well-intended forecasters.
6
Tesla Model 3
In addition to assessing general trends in the disruption EVs and AVs, we are able to zoom in to some granular trends including the highly-publicized Tesla Model 3 deliveries. Indeed, Tesla’s progress in producing and distributing the Model 3, its first mass market vehicle, has been the focus of intense scrutiny from financial analysts and Tesla investors as well as Tesla owners and fans, backers and opponents of electric vehicles, and the news media. We wrote a question asking forecasters to predict the total number of Model 3 deliveries by July 1, 2018. The GJ question team used a variety of sources, including Tesla, to establish a set of answers capturing a range of possibilities. Within three months, nearly all forecasters converged on a prediction of “less than 50,000” based on data on the very low production and delivery rates trackable via sources independent of Tesla.
To sustain forecaster interest and engage them in a more fine-grained analysis, we decided to write a new question providing a new set of categories below 50,000. Dramatic accounts of Tesla’s actions and struggles with Model 3 continued throughout the spring of 2018, including analyst reports that the company had over-automated in final assembly; one of these reports was written by a former PVMI researcher. We monitored both the pattern of forecasts and forecaster comments -- and the heated debate that emerges towards the end about which category would be right. By following responses to the first question, deciding to write the second question, and engaging the forecaster community in shifting attention to the latter, we learned more deeply about the issues affecting Model 3 production – and we were able to benefit from meta-learning about how tournament and question design can be adaptive in real time.
V. Top forecasters
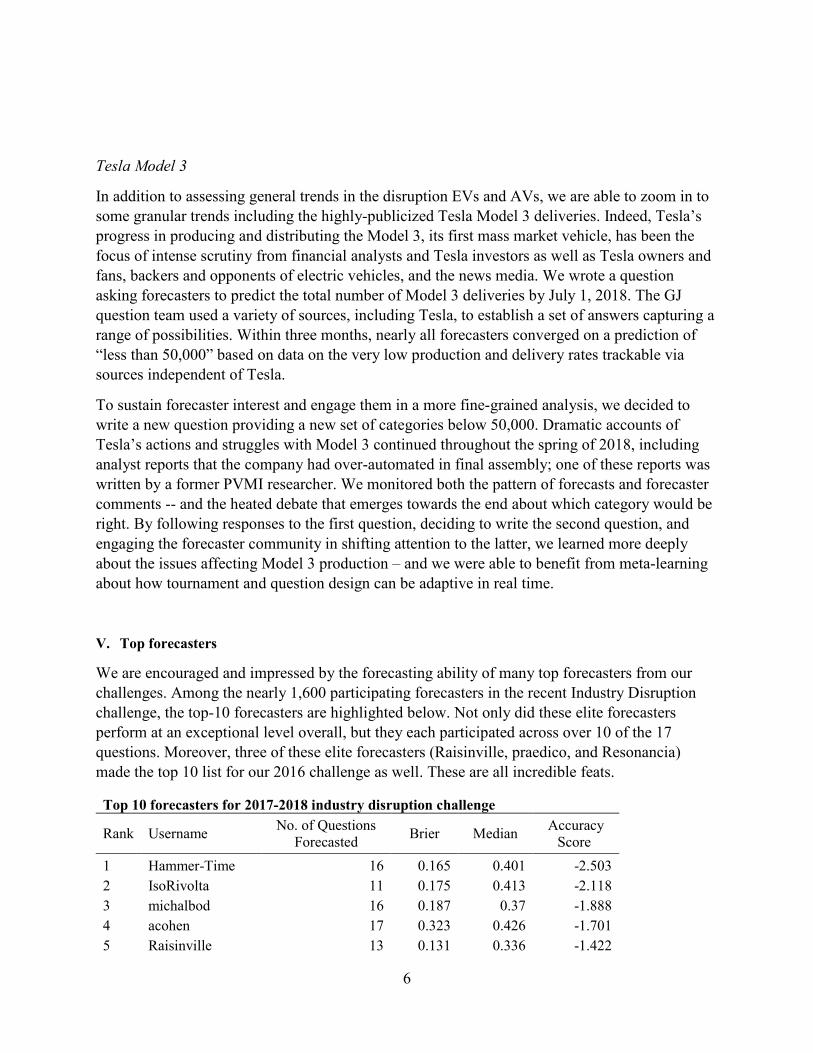
We are encouraged and impressed by the forecasting ability of many top forecasters from our challenges. Among the nearly 1,600 participating forecasters in the recent Industry Disruption challenge, the top-10 forecasters are highlighted below. Not only did these elite forecasters perform at an exceptional level overall, but they each participated across over 10 of the 17 questions. Moreover, three of these elite forecasters (Raisinville, praedico, and Resonancia) made the top 10 list for our 2016 challenge as well. These are all incredible feats.
Top 10 forecasters for 2017-2018 industry disruption challenge
Rank Username No. of Questions Forecasted Brier Median Accuracy
Score 1 Hammer-Time 16 0.165 0.401 -2.503 2 IsoRivolta 11 0.175 0.413 -2.118 3 michalbod 16 0.187 0.37 -1.888 4 acohen 17 0.323 0.426 -1.701 5 Raisinville 13 0.131 0.336 -1.422
7
6 lleone 13 0.236 0.37 -1.367 7 praedico 15 0.29 0.392 -1.361 8 cdob63 17 0.357 0.426 -1.171 9 axioman2 14 0.2 0.373 -1.169 10 Resonancia 15 0.283 0.377 -1.157
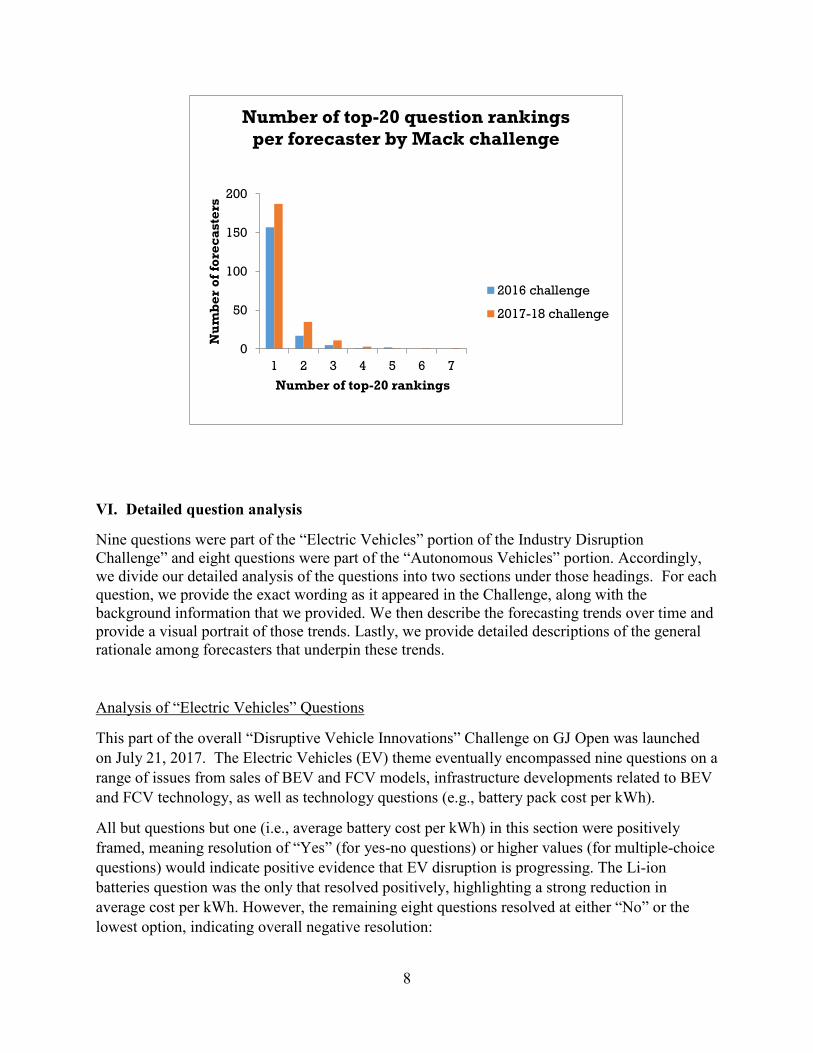
We were also encouraged by the results of our top forecasters at the question level. Indeed, we saw improvements in breadth of question-level performance (i.e., on average how many question-level top-20 accuracy rankings each forecaster received) between the first and second challenge. Specifically, among those who ranked in the top-20 in at least one question, the proportion of those who ranked in more than one question increased from roughly 14% to nearly 22%. Moreover, whereas the most versatile forecasters reached top-20 rankings in up to five questions in the 2016 challenge, forecasters in this challenge reached as many as seven top-20 rankings.
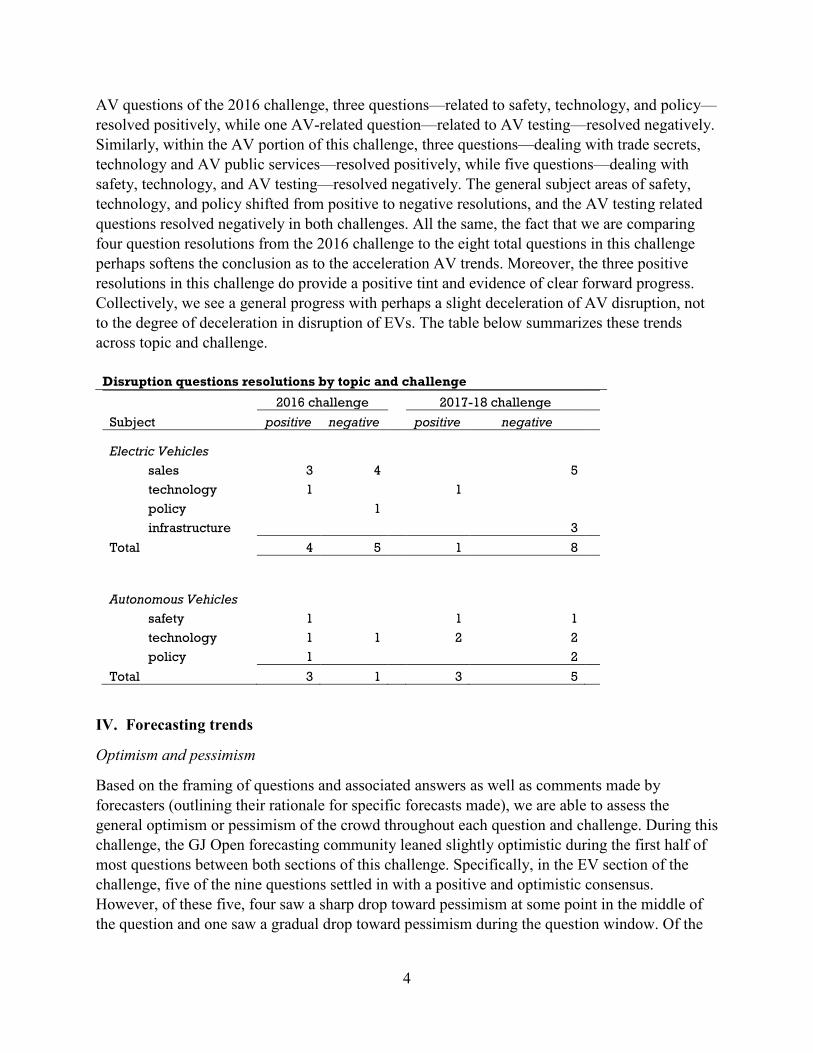
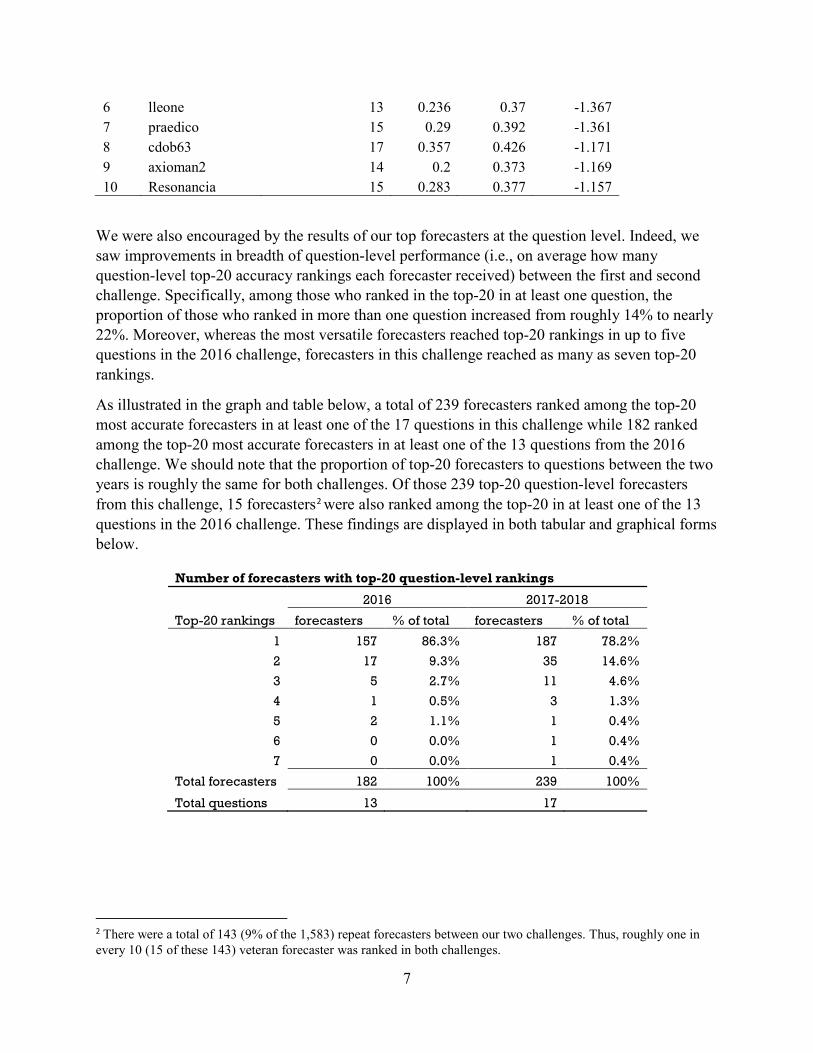
As illustrated in the graph and table below, a total of 239 forecasters ranked among the top-20 most accurate forecasters in at least one of the 17 questions in this challenge while 182 ranked among the top-20 most accurate forecasters in at least one of the 13 questions from the 2016 challenge. We should note that the proportion of top-20 forecasters to questions between the two years is roughly the same for both challenges. Of those 239 top-20 question-level forecasters from this challenge, 15 forecasters2 were also ranked among the top-20 in at least one of the 13 questions in the 2016 challenge. These findings are displayed in both tabular and graphical forms below.
Number of forecasters with top-20 question-level rankings
Top-20 rankings
2016 2017-2018
forecasters % of total forecasters % of total
1 157 86.3% 187 78.2%
2 17 9.3% 35 14.6%
3 5 2.7% 11 4.6%
4 1 0.5% 3 1.3%
5 2 1.1% 1 0.4%
6 0 0.0% 1 0.4%
7 0 0.0% 1 0.4%
Total forecasters 182 100% 239 100%
Total questions 13 17
2 There were a total of 143 (9% of the 1,583) repeat forecasters between our two challenges. Thus, roughly one in every 10 (15 of these 143) veteran forecaster was ranked in both challenges.
8
VI. Detailed question analysis
Nine questions were part of the “Electric Vehicles” portion of the Industry Disruption Challenge” and eight questions were part of the “Autonomous Vehicles” portion. Accordingly, we divide our detailed analysis of the questions into two sections under those headings. For each question, we provide the exact wording as it appeared in the Challenge, along with the background information that we provided. We then describe the forecasting trends over time and provide a visual portrait of those trends. Lastly, we provide detailed descriptions of the general rationale among forecasters that underpin these trends.
Analysis of “Electric Vehicles” Questions
This part of the overall “Disruptive Vehicle Innovations” Challenge on GJ Open was launched on July 21, 2017. The Electric Vehicles (EV) theme eventually encompassed nine questions on a range of issues from sales of BEV and FCV models, infrastructure developments related to BEV and FCV technology, as well as technology questions (e.g., battery pack cost per kWh).
All but questions but one (i.e., average battery cost per kWh) in this section were positively framed, meaning resolution of “Yes” (for yes-no questions) or higher values (for multiple-choice questions) would indicate positive evidence that EV disruption is progressing. The Li-ion batteries question was the only that resolved positively, highlighting a strong reduction in average cost per kWh. However, the remaining eight questions resolved at either “No” or the lowest option, indicating overall negative resolution:
0
50
100
150
200
1 2 3 4 5 6 7
Nu
mb
er o
f for
ecas
ters
Number of top-20 rankings
Number of top-20 question rankings per forecaster by Mack challenge
2016 challenge
2017-18 challenge
9
• No major automaker announced a date for which they would sell only electric or hybrid vehicles between July 21, 2017 and July 20, 2018.
• Before July 1, 2018 Tesla delivered fewer than 50,000 Model 3’s • Fewer than 10,000 Chevrolet Bolt EV’s were sold between January and June 2018 • Fewer than 2,400 public DC Fast Charge EV charging stations were available in the U.S.
by June 29, 2018. • Tesla did not announce plans to build an EV manufacturing factory in China before July
1, 2018. • Fewer than 45 public hydrogen fueling stations were available in the U.E. by June 29,
2018. • Fewer than 900 Toyota Mirais were sold or leased between January and June 2018,
inclusive. • Fewer than 29,001 Model 3s were delivered to customers between July 1, 2017 and July
1, 2018.
Overall, the disappointing (relative to expectations) sales figures and lack of legislative action in the US supported a broad conclusion that, far from being a “disruptive” year for EVs, mid-2017 to mid-2018 was instead a year of reality not matching the optimism of EV advocates. The one bright spot in the unfolding EV story is the reduced battery cost, which is dropping relatively quickly. We will continue to build on what we learned about writing questions on the diffusion of EVs to capture a broader range of positive and negative indicators for the next Challenge.
Question-by-question details follow for the seven questions related to EVs.
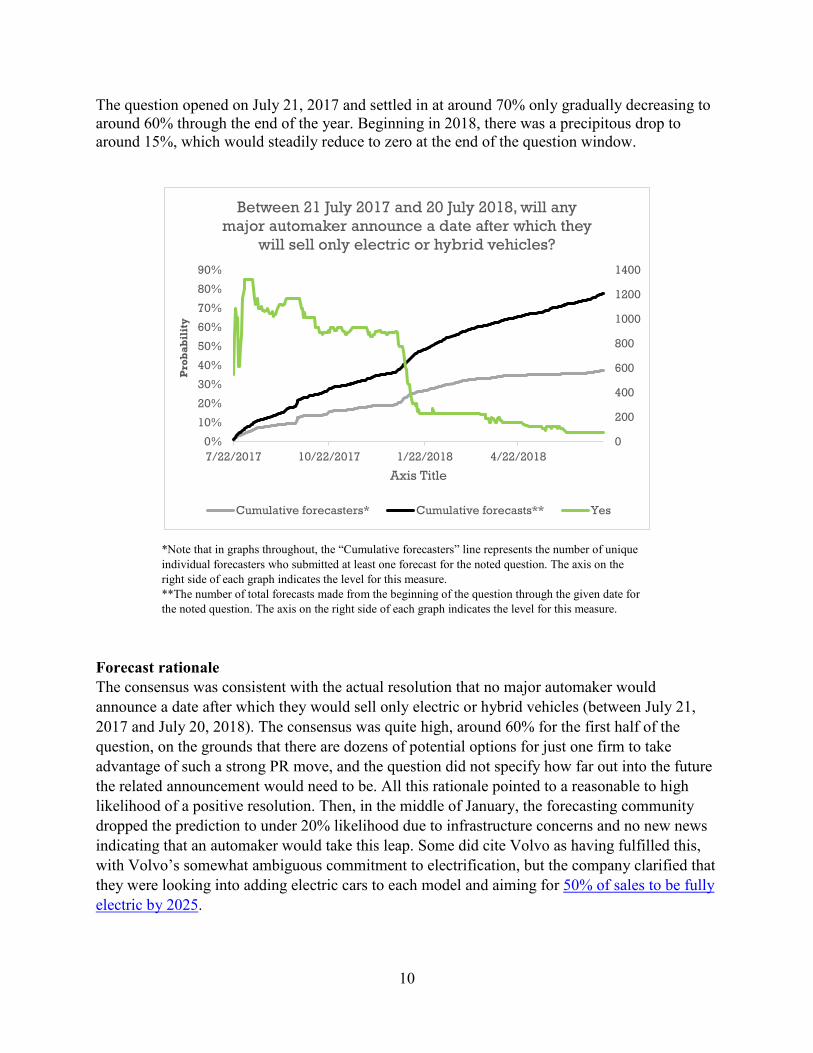
Question: Between 21 July 2017 and 20 July 2018, will any major automaker announce a date after which they will sell only electric or hybrid vehicles?
This question closed as "No" with an end date of 20 July 2018. https://electrek.co/2018/04/09/porsche-ceo-only-electric-vehicles-2030/ https://qz.com/1329712/why-the-world-is-so-excited-about-electric-cars-in-charts/ Background Information For the purposes of this question, "major automakers" are any of the car brands or whole car companies identified in this infographic. Volvo recently announced that starting in 2019 all new models it produces will be electric or hybrid (Volvo, Forbes). Announcements that only apply to a certain market segment or geographic location will not count. Stats (# of forecasts, # of forecasters, resolved yet?): 593 Forecasters, 1243 Forecasts, closed July 20, 2018 at 0% "No" Verbal description of forecast trend from launch to present:
10
The question opened on July 21, 2017 and settled in at around 70% only gradually decreasing to around 60% through the end of the year. Beginning in 2018, there was a precipitous drop to around 15%, which would steadily reduce to zero at the end of the question window.
*Note that in graphs throughout, the “Cumulative forecasters” line represents the number of unique individual forecasters who submitted at least one forecast for the noted question. The axis on the right side of each graph indicates the level for this measure. **The number of total forecasts made from the beginning of the question through the given date for the noted question. The axis on the right side of each graph indicates the level for this measure.
Forecast rationale The consensus was consistent with the actual resolution that no major automaker would announce a date after which they would sell only electric or hybrid vehicles (between July 21, 2017 and July 20, 2018). The consensus was quite high, around 60% for the first half of the question, on the grounds that there are dozens of potential options for just one firm to take advantage of such a strong PR move, and the question did not specify how far out into the future the related announcement would need to be. All this rationale pointed to a reasonable to high likelihood of a positive resolution. Then, in the middle of January, the forecasting community dropped the prediction to under 20% likelihood due to infrastructure concerns and no new news indicating that an automaker would take this leap. Some did cite Volvo as having fulfilled this, with Volvo’s somewhat ambiguous commitment to electrification, but the company clarified that they were looking into adding electric cars to each model and aiming for 50% of sales to be fully electric by 2025.
0%
10%
20%
30%
40%
50%
60%
70%
80%
90%
7/22/2017 10/22/2017 1/22/2018 4/22/20180
200
400
600
800
1000
1200
1400
Pro
bab
ilit
y
Axis Title
Between 21 July 2017 and 20 July 2018, will any major automaker announce a date after which they
will sell only electric or hybrid vehicles?
Cumulative forecasters* Cumulative forecasts** Yes
11
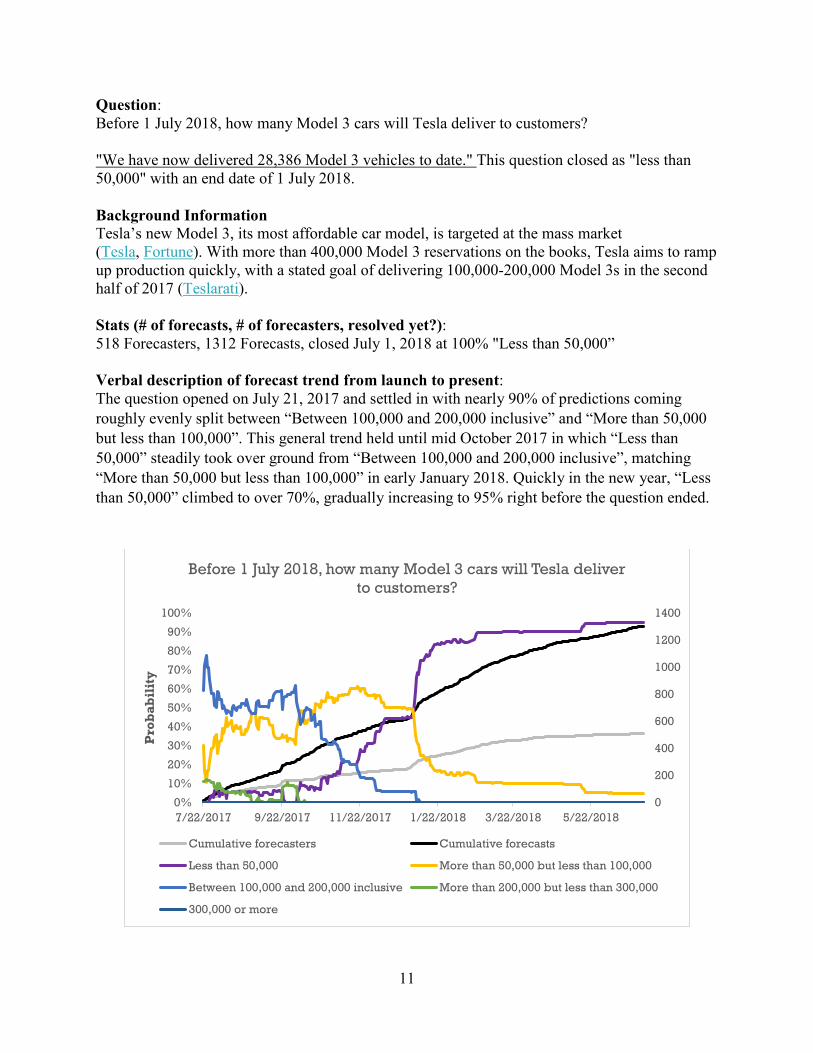
Question: Before 1 July 2018, how many Model 3 cars will Tesla deliver to customers? "We have now delivered 28,386 Model 3 vehicles to date." This question closed as "less than 50,000" with an end date of 1 July 2018. Background Information Tesla’s new Model 3, its most affordable car model, is targeted at the mass market (Tesla, Fortune). With more than 400,000 Model 3 reservations on the books, Tesla aims to ramp up production quickly, with a stated goal of delivering 100,000-200,000 Model 3s in the second half of 2017 (Teslarati). Stats (# of forecasts, # of forecasters, resolved yet?): 518 Forecasters, 1312 Forecasts, closed July 1, 2018 at 100% "Less than 50,000” Verbal description of forecast trend from launch to present: The question opened on July 21, 2017 and settled in with nearly 90% of predictions coming roughly evenly split between “Between 100,000 and 200,000 inclusive” and “More than 50,000 but less than 100,000”. This general trend held until mid October 2017 in which “Less than 50,000” steadily took over ground from “Between 100,000 and 200,000 inclusive”, matching “More than 50,000 but less than 100,000” in early January 2018. Quickly in the new year, “Less than 50,000” climbed to over 70%, gradually increasing to 95% right before the question ended.
0%
10%
20%
30%
40%
50%
60%
70%
80%
90%
100%
7/22/2017 9/22/2017 11/22/2017 1/22/2018 3/22/2018 5/22/20180
200
400
600
800
1000
1200
1400
Pro
bab
ilit
y
Before 1 July 2018, how many Model 3 cars will Tesla deliver to customers?
Cumulative forecasters Cumulative forecasts
Less than 50,000 More than 50,000 but less than 100,000
Between 100,000 and 200,000 inclusive More than 200,000 but less than 300,000
300,000 or more
12
Forecast rationale The GJ forecasting community consensus probability estimate was consistent with the actual resolution that Tesla would deliver fewer than 50,000 Model 3’s by July 1, 2018. Early on in the challenge forecasters were much more bullish on the production numbers, but in early October 2017 they pointed to very poor third quarter Model 3 production numbers (not much more than 200), dramatically missing CEO Elon Musk's prediction that it would produce more than 1,600 cars by September 2017. Moreover, Musk’s talk of “production hell” also served to tamper expectations. Thus, by the end of 2017, forecasters gave the lowest forecast option (fewer than 50,000) roughly 50% probability and in January 2018 as poor Q4 2017 production figures came out, the community rose that probability to nearly 100%, which would remain for the remainder of the challenge.
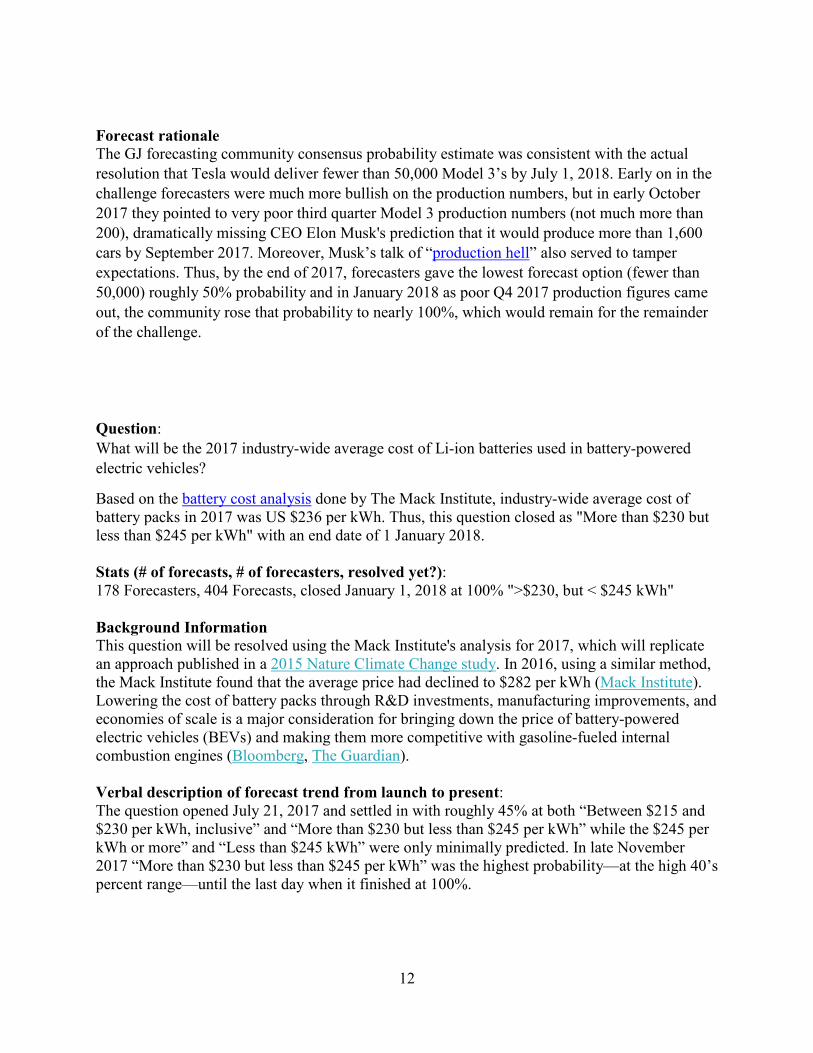
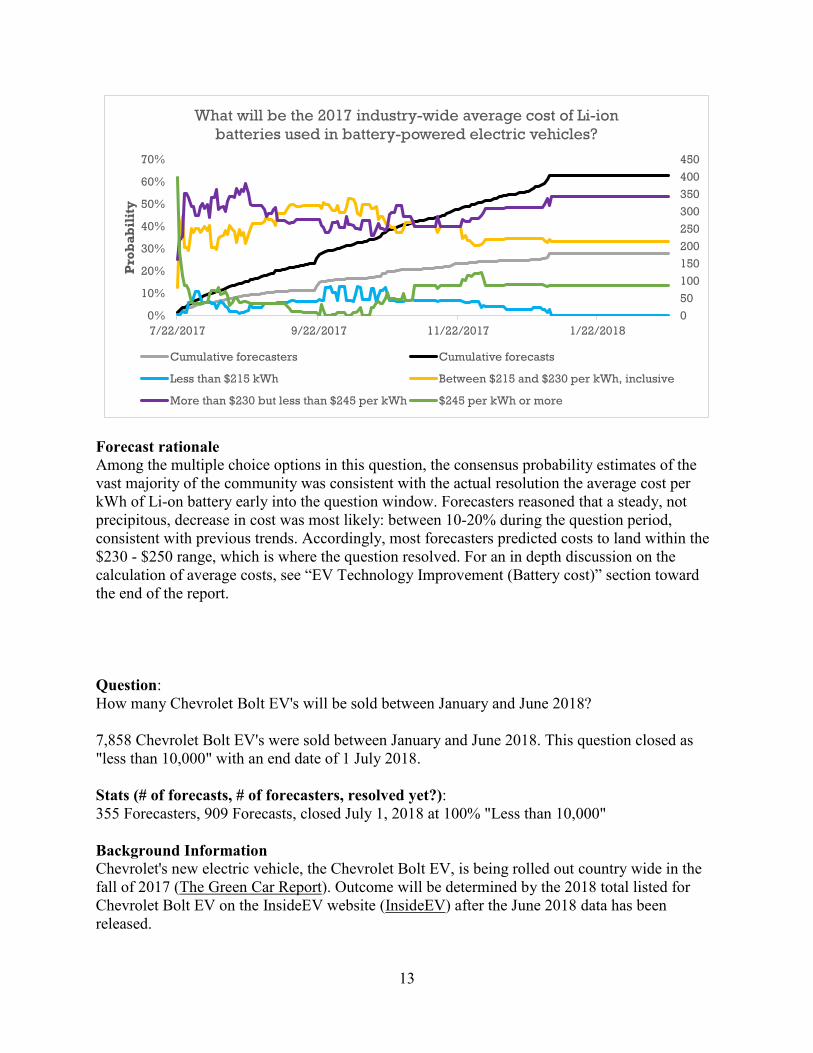
Question: What will be the 2017 industry-wide average cost of Li-ion batteries used in battery-powered electric vehicles?
Based on the battery cost analysis done by The Mack Institute, industry-wide average cost of battery packs in 2017 was US $236 per kWh. Thus, this question closed as "More than $230 but less than $245 per kWh" with an end date of 1 January 2018. Stats (# of forecasts, # of forecasters, resolved yet?): 178 Forecasters, 404 Forecasts, closed January 1, 2018 at 100% ">$230, but < $245 kWh" Background Information This question will be resolved using the Mack Institute's analysis for 2017, which will replicate an approach published in a 2015 Nature Climate Change study. In 2016, using a similar method, the Mack Institute found that the average price had declined to $282 per kWh (Mack Institute). Lowering the cost of battery packs through R&D investments, manufacturing improvements, and economies of scale is a major consideration for bringing down the price of battery-powered electric vehicles (BEVs) and making them more competitive with gasoline-fueled internal combustion engines (Bloomberg, The Guardian). Verbal description of forecast trend from launch to present: The question opened July 21, 2017 and settled in with roughly 45% at both “Between $215 and $230 per kWh, inclusive” and “More than $230 but less than $245 per kWh” while the $245 per kWh or more” and “Less than $245 kWh” were only minimally predicted. In late November 2017 “More than $230 but less than $245 per kWh” was the highest probability—at the high 40’s percent range—until the last day when it finished at 100%.
13
Forecast rationale Among the multiple choice options in this question, the consensus probability estimates of the vast majority of the community was consistent with the actual resolution the average cost per kWh of Li-on battery early into the question window. Forecasters reasoned that a steady, not precipitous, decrease in cost was most likely: between 10-20% during the question period, consistent with previous trends. Accordingly, most forecasters predicted costs to land within the $230 - $250 range, which is where the question resolved. For an in depth discussion on the calculation of average costs, see “EV Technology Improvement (Battery cost)” section toward the end of the report.
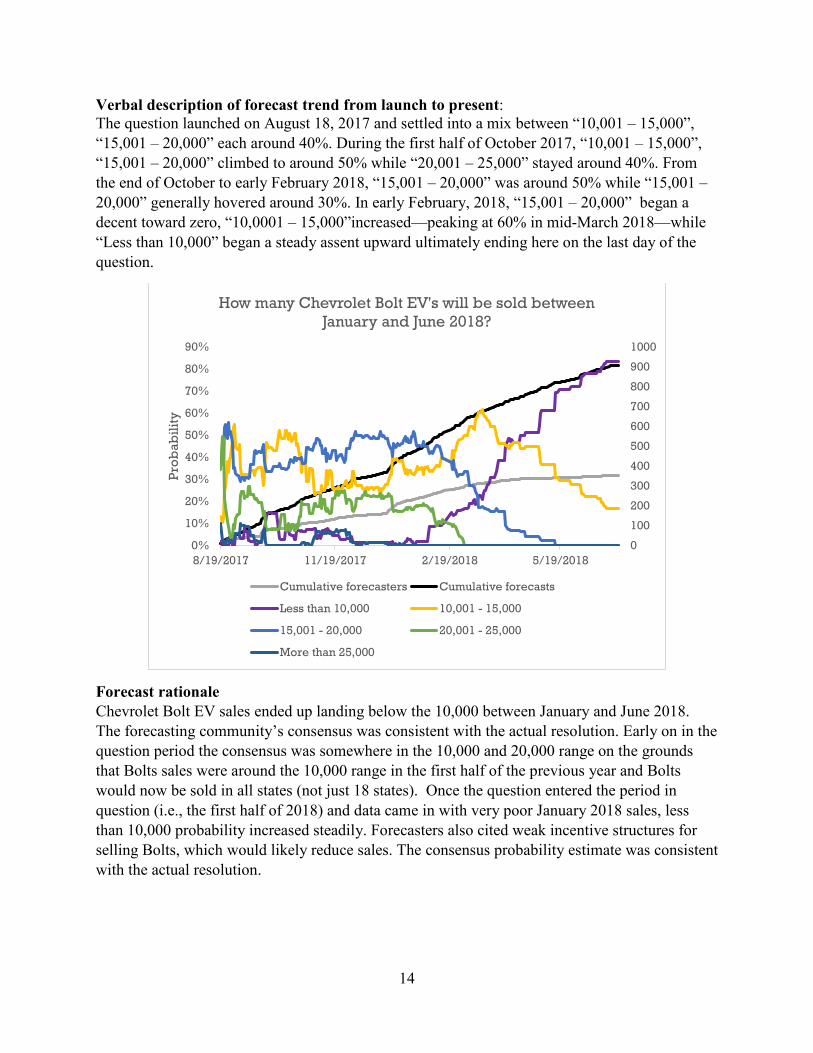
Question: How many Chevrolet Bolt EV's will be sold between January and June 2018? 7,858 Chevrolet Bolt EV's were sold between January and June 2018. This question closed as "less than 10,000" with an end date of 1 July 2018. Stats (# of forecasts, # of forecasters, resolved yet?): 355 Forecasters, 909 Forecasts, closed July 1, 2018 at 100% "Less than 10,000" Background Information Chevrolet's new electric vehicle, the Chevrolet Bolt EV, is being rolled out country wide in the fall of 2017 (The Green Car Report). Outcome will be determined by the 2018 total listed for Chevrolet Bolt EV on the InsideEV website (InsideEV) after the June 2018 data has been released.
0%
10%
20%
30%
40%
50%
60%
70%
7/22/2017 9/22/2017 11/22/2017 1/22/2018050100150200250300350400450
Pro
bab
ilit
yWhat will be the 2017 industry-wide average cost of Li-ion
batteries used in battery-powered electric vehicles?
Cumulative forecasters Cumulative forecasts
Less than $215 kWh Between $215 and $230 per kWh, inclusive
More than $230 but less than $245 per kWh $245 per kWh or more
14
Verbal description of forecast trend from launch to present: The question launched on August 18, 2017 and settled into a mix between “10,001 – 15,000”, “15,001 – 20,000” each around 40%. During the first half of October 2017, “10,001 – 15,000”, “15,001 – 20,000” climbed to around 50% while “20,001 – 25,000” stayed around 40%. From the end of October to early February 2018, “15,001 – 20,000” was around 50% while “15,001 – 20,000” generally hovered around 30%. In early February, 2018, “15,001 – 20,000” began a decent toward zero, “10,0001 – 15,000”increased—peaking at 60% in mid-March 2018—while “Less than 10,000” began a steady assent upward ultimately ending here on the last day of the question.
Forecast rationale Chevrolet Bolt EV sales ended up landing below the 10,000 between January and June 2018. The forecasting community’s consensus was consistent with the actual resolution. Early on in the question period the consensus was somewhere in the 10,000 and 20,000 range on the grounds that Bolts sales were around the 10,000 range in the first half of the previous year and Bolts would now be sold in all states (not just 18 states). Once the question entered the period in question (i.e., the first half of 2018) and data came in with very poor January 2018 sales, less than 10,000 probability increased steadily. Forecasters also cited weak incentive structures for selling Bolts, which would likely reduce sales. The consensus probability estimate was consistent with the actual resolution.
0%
10%
20%
30%
40%
50%
60%
70%
80%
90%
8/19/2017 11/19/2017 2/19/2018 5/19/20180
100
200
300
400
500
600
700
800
900
1000
Prob
abili
ty
How many Chevrolet Bolt EV's will be sold between January and June 2018?
Cumulative forecasters Cumulative forecasts
Less than 10,000 10,001 - 15,000
15,001 - 20,000 20,001 - 25,000
More than 25,000
15
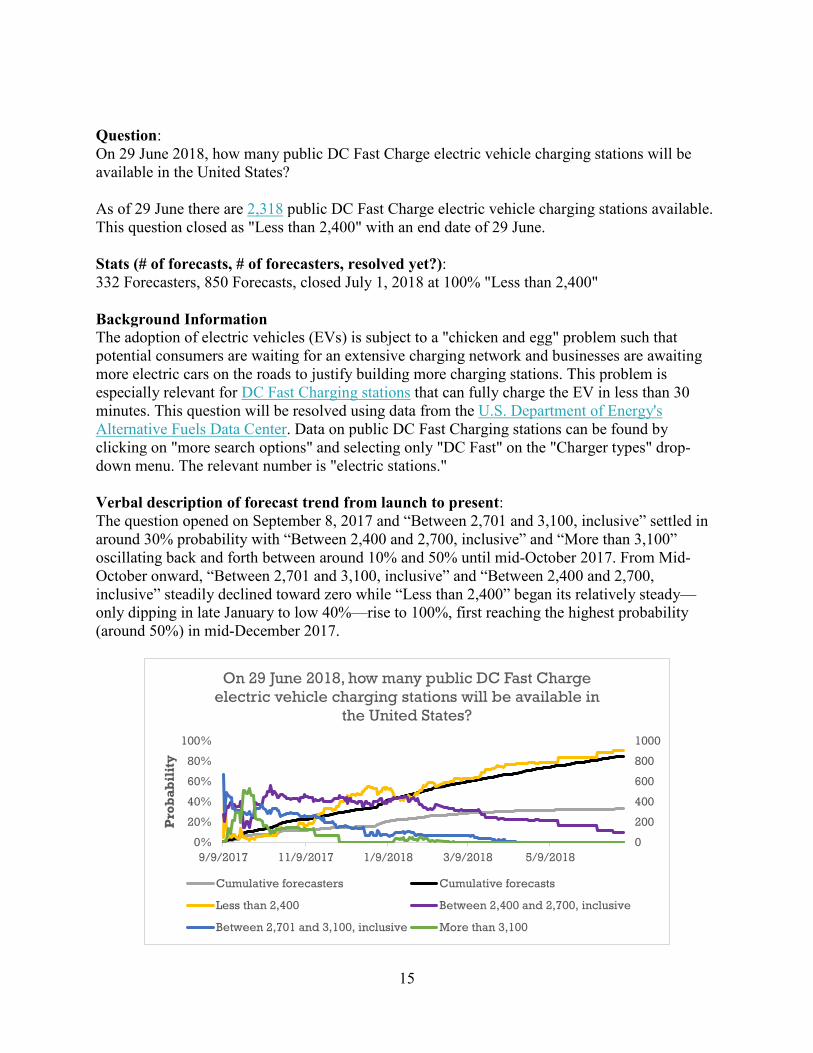
Question: On 29 June 2018, how many public DC Fast Charge electric vehicle charging stations will be available in the United States? As of 29 June there are 2,318 public DC Fast Charge electric vehicle charging stations available. This question closed as "Less than 2,400" with an end date of 29 June. Stats (# of forecasts, # of forecasters, resolved yet?): 332 Forecasters, 850 Forecasts, closed July 1, 2018 at 100% "Less than 2,400" Background Information The adoption of electric vehicles (EVs) is subject to a "chicken and egg" problem such that potential consumers are waiting for an extensive charging network and businesses are awaiting more electric cars on the roads to justify building more charging stations. This problem is especially relevant for DC Fast Charging stations that can fully charge the EV in less than 30 minutes. This question will be resolved using data from the U.S. Department of Energy's Alternative Fuels Data Center. Data on public DC Fast Charging stations can be found by clicking on "more search options" and selecting only "DC Fast" on the "Charger types" drop-down menu. The relevant number is "electric stations." Verbal description of forecast trend from launch to present: The question opened on September 8, 2017 and “Between 2,701 and 3,100, inclusive” settled in around 30% probability with “Between 2,400 and 2,700, inclusive” and “More than 3,100” oscillating back and forth between around 10% and 50% until mid-October 2017. From Mid-October onward, “Between 2,701 and 3,100, inclusive” and “Between 2,400 and 2,700, inclusive” steadily declined toward zero while “Less than 2,400” began its relatively steady—only dipping in late January to low 40%—rise to 100%, first reaching the highest probability (around 50%) in mid-December 2017.
0%
20%
40%
60%
80%
100%
9/9/2017 11/9/2017 1/9/2018 3/9/2018 5/9/20180
200
400
600
800
1000
Pro
bab
ilit
y
On 29 June 2018, how many public DC Fast Charge electric vehicle charging stations will be available in
the United States?
Cumulative forecasters Cumulative forecasts
Less than 2,400 Between 2,400 and 2,700, inclusive
Between 2,701 and 3,100, inclusive More than 3,100
16
Forecast rationale The forecasting community consensus probability estimate of high or low likelihood was consistent with the actual resolution that there would be fewer than 2,400 DC Fast Charge EV charging stations by the first half of 2018. Forecasters noted that there were about 2,200 Fast Charge stations at the beginning of the question window, with a relatively small absolute increase in station counts needed to resolve at least over 2,400. Thus, early on the consensus was largely in the 2,400 to 3,100 range. However, after subpar growth numbers began to trickle in at the end of 2017, the consensus was quickly moved to the less than 2,400 range, which ultimately was the resolution.
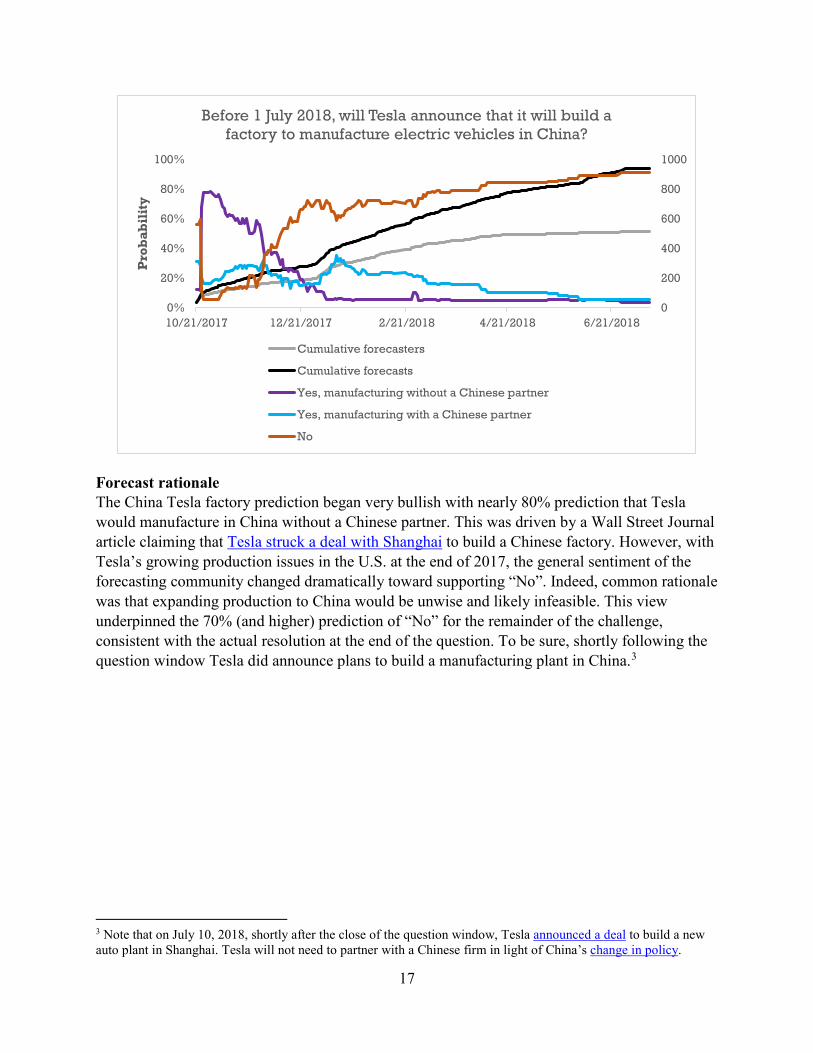
Question: Before 1 July 2018, will Tesla announce that it will build a factory to manufacture electric vehicles in China? This question was closed as "no" with an end date of 1 July 2018. Stats (# of forecasts, # of forecasters, resolved yet?): 520 Forecasters, 947 Forecasts, closed on July 1, 2018 at 100% "No" Background Information In its quest for global growth, Tesla is looking to expand its manufacturing capacity. There is speculation that it might build a new factory in China, but China's requirements for foreign automakers partnering with Chinese companies may prove an obstacle (Bloomberg, Electrek). An announcement by Tesla regarding a factory that only manufactures component parts of an electric vehicle will not count (e.g. Electrek). Verbal description of forecast trend from launch to present: This question opened on October 20, 2017 and the settled into “Yes, manufacturing without a Chinese partner” with nearly 80% probability and “Yes, manufacturing with a Chinese partner” at around 20%. During November, the “No” increased, “Yes, manufacturing without a Chinese partner” decreased and “Yes, manufacturing with a Chinese partner” stayed relatively constant, bringing all three between the high 20s and 30s percent probability by December 2017. During December 2017, “Yes, manufacturing without a Chinese partner” climbed to 70% probability steadily climbing toward 100%—except for a momentary dip to 60% in mid-March 2018—at the close of the question on July 1, 2018.
17
Forecast rationale The China Tesla factory prediction began very bullish with nearly 80% prediction that Tesla would manufacture in China without a Chinese partner. This was driven by a Wall Street Journal article claiming that Tesla struck a deal with Shanghai to build a Chinese factory. However, with Tesla’s growing production issues in the U.S. at the end of 2017, the general sentiment of the forecasting community changed dramatically toward supporting “No”. Indeed, common rationale was that expanding production to China would be unwise and likely infeasible. This view underpinned the 70% (and higher) prediction of “No” for the remainder of the challenge, consistent with the actual resolution at the end of the question. To be sure, shortly following the question window Tesla did announce plans to build a manufacturing plant in China.3
3 Note that on July 10, 2018, shortly after the close of the question window, Tesla announced a deal to build a new auto plant in Shanghai. Tesla will not need to partner with a Chinese firm in light of China’s change in policy.
0%
20%
40%
60%
80%
100%
10/21/2017 12/21/2017 2/21/2018 4/21/2018 6/21/20180
200
400
600
800
1000P
rob
abil
ity
Before 1 July 2018, will Tesla announce that it will build a factory to manufacture electric vehicles in China?
Cumulative forecasters
Cumulative forecasts
Yes, manufacturing without a Chinese partner
Yes, manufacturing with a Chinese partner
No
18
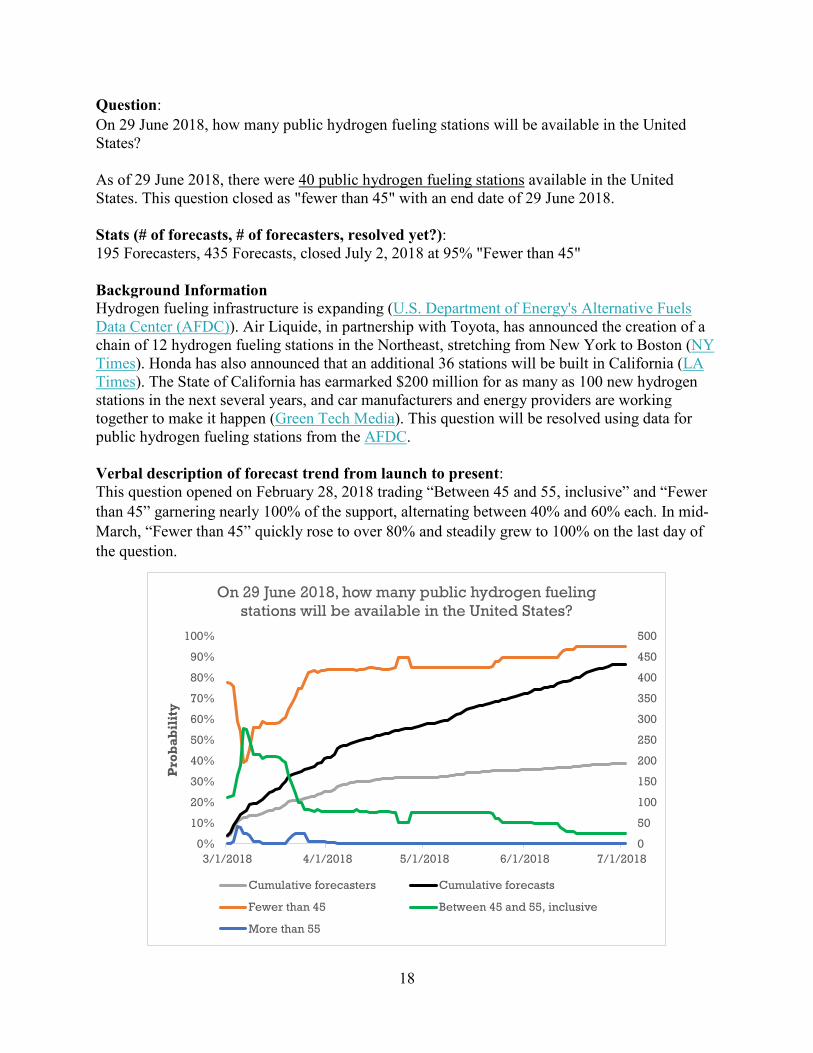
Question: On 29 June 2018, how many public hydrogen fueling stations will be available in the United States? As of 29 June 2018, there were 40 public hydrogen fueling stations available in the United States. This question closed as "fewer than 45" with an end date of 29 June 2018. Stats (# of forecasts, # of forecasters, resolved yet?): 195 Forecasters, 435 Forecasts, closed July 2, 2018 at 95% "Fewer than 45" Background Information Hydrogen fueling infrastructure is expanding (U.S. Department of Energy's Alternative Fuels Data Center (AFDC)). Air Liquide, in partnership with Toyota, has announced the creation of a chain of 12 hydrogen fueling stations in the Northeast, stretching from New York to Boston (NY Times). Honda has also announced that an additional 36 stations will be built in California (LA Times). The State of California has earmarked $200 million for as many as 100 new hydrogen stations in the next several years, and car manufacturers and energy providers are working together to make it happen (Green Tech Media). This question will be resolved using data for public hydrogen fueling stations from the AFDC. Verbal description of forecast trend from launch to present: This question opened on February 28, 2018 trading “Between 45 and 55, inclusive” and “Fewer than 45” garnering nearly 100% of the support, alternating between 40% and 60% each. In mid-March, “Fewer than 45” quickly rose to over 80% and steadily grew to 100% on the last day of the question.
0%
10%
20%
30%
40%
50%
60%
70%
80%
90%
100%
3/1/2018 4/1/2018 5/1/2018 6/1/2018 7/1/20180
50
100
150
200
250
300
350
400
450
500
Pro
bab
ilit
y
On 29 June 2018, how many public hydrogen fueling stations will be available in the United States?
Cumulative forecasters Cumulative forecasts
Fewer than 45 Between 45 and 55, inclusive
More than 55
19
Forecast rationale The forecasting community’s consensus probability estimate was consistent with the actual resolution that there would be fewer than 45 public hydrogen fueling stations available in the U.S. on June 29, 2018. In general, the rationale for this prediction was that there were 39 stations at the inception of the question and little signs of adding at least six by half way through 2018. Moreover, this slow trend, only up to 39 by middle of March 2018 and 41 by the end of April 2018 buttressed this pessimism. Ultimately, from the get go the forecasting community’s consensus probability estimate was consistent with the actual resolution of “fewer than 45”.
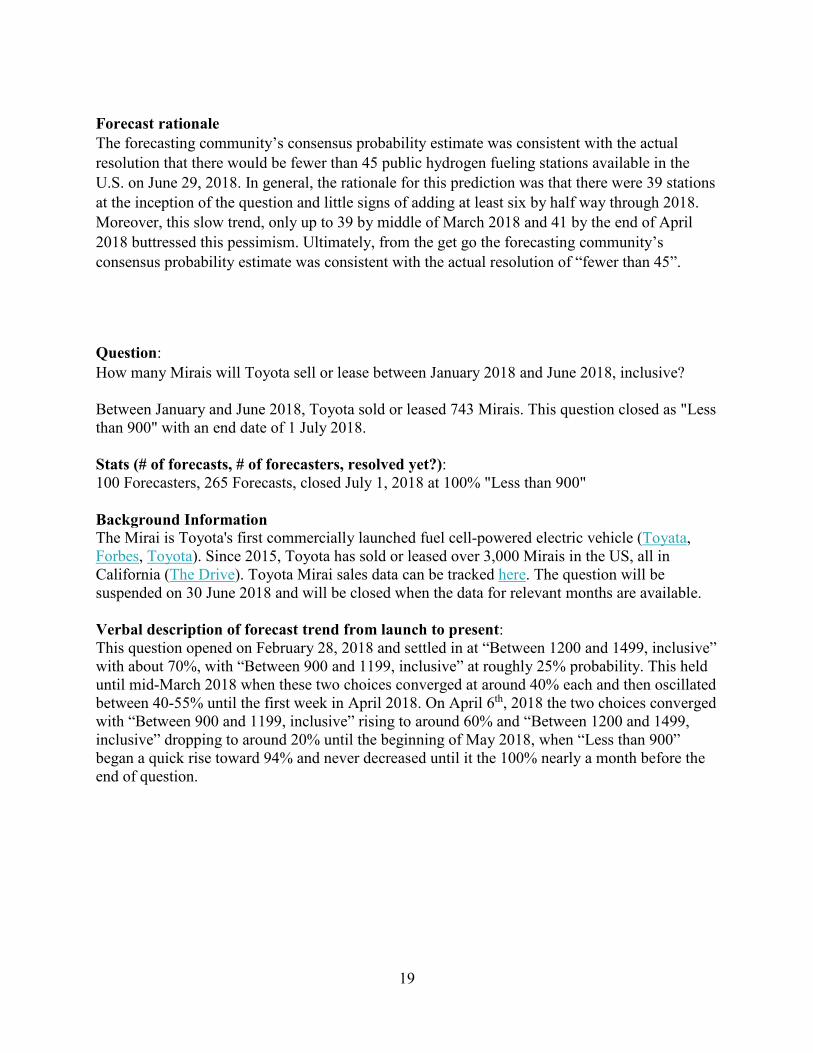
Question: How many Mirais will Toyota sell or lease between January 2018 and June 2018, inclusive? Between January and June 2018, Toyota sold or leased 743 Mirais. This question closed as "Less than 900" with an end date of 1 July 2018. Stats (# of forecasts, # of forecasters, resolved yet?): 100 Forecasters, 265 Forecasts, closed July 1, 2018 at 100% "Less than 900" Background Information The Mirai is Toyota's first commercially launched fuel cell-powered electric vehicle (Toyata, Forbes, Toyota). Since 2015, Toyota has sold or leased over 3,000 Mirais in the US, all in California (The Drive). Toyota Mirai sales data can be tracked here. The question will be suspended on 30 June 2018 and will be closed when the data for relevant months are available. Verbal description of forecast trend from launch to present: This question opened on February 28, 2018 and settled in at “Between 1200 and 1499, inclusive” with about 70%, with “Between 900 and 1199, inclusive” at roughly 25% probability. This held until mid-March 2018 when these two choices converged at around 40% each and then oscillated between 40-55% until the first week in April 2018. On April 6th, 2018 the two choices converged with “Between 900 and 1199, inclusive” rising to around 60% and “Between 1200 and 1499, inclusive” dropping to around 20% until the beginning of May 2018, when “Less than 900” began a quick rise toward 94% and never decreased until it the 100% nearly a month before the end of question.
20
Forecast rationale Toyota ended up selling fewer than 900 Mirai during the first half of 2018. The forecasting community was quite uncertain of this from the beginning of the question window (March 2018) to the middle of April, with the consensus oscillating within the 900 to 1,499 range. This uncertainty was largely due to conflicting forecasts based on historic analysis: with over 1,800 total 2017 sales, some rationalized at least 900 in the first half of 2018 while others employed seasonality, while still others noted the early 2018 growth figures. Then, in early May 2018, with four month numbers in at 538, the consensus moved sharply toward “Less than 900”—close to 100%—and remained there, consistent with the actual resolution, until the end of the question window.
Question: Between 1 July 2017 and 1 July 2018, how many Model 3 cars will Tesla deliver to customers? This question closed as "29,000 or less" with an end date of 1 July 2018. According to Tesla, Inc’s 2017 10-K, they delivered 1,764 in the second half of 2017 and per the Q2 2018 10-Q, “vehicles delivered in the six months ended June 30, 2018, which included approximately 26,630 deliveries of Model 3 vehicles”. In total, Model 3 deliveries from July 1 2017 and July 1, 2018 were 28,394: 29,000 and less.
0%
20%
40%
60%
80%
100%
120%
3/1/2018 4/1/2018 5/1/2018 6/1/2018 7/1/20180
50
100
150
200
250
300P
rob
abil
ity
How many Mirais will Toyota sell or lease between January 2018 and June 2018, inclusive?
Cumulative forecasters Cumulative forecasts
Less than 900 Between 900 and 1199, inclusive
Between 1200 and 1499, inclusive Between 1500 and 1799, inclusive
1800 or more
21
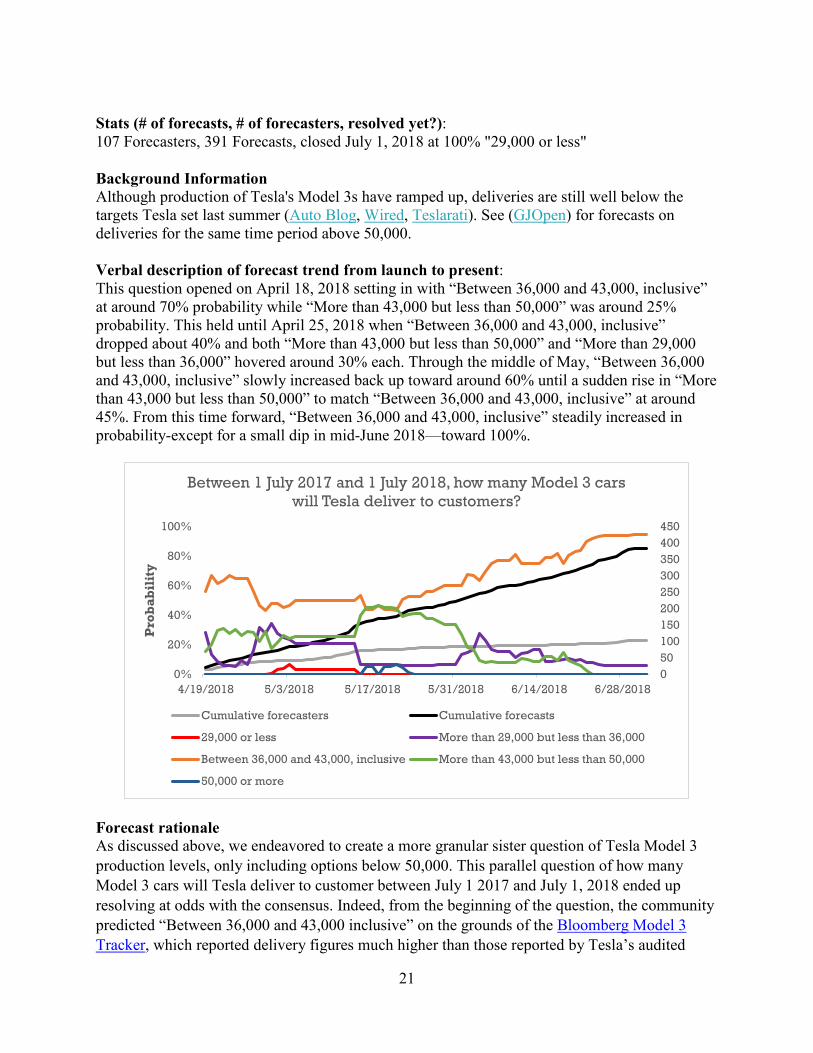
Stats (# of forecasts, # of forecasters, resolved yet?): 107 Forecasters, 391 Forecasts, closed July 1, 2018 at 100% "29,000 or less" Background Information Although production of Tesla's Model 3s have ramped up, deliveries are still well below the targets Tesla set last summer (Auto Blog, Wired, Teslarati). See (GJOpen) for forecasts on deliveries for the same time period above 50,000. Verbal description of forecast trend from launch to present: This question opened on April 18, 2018 setting in with “Between 36,000 and 43,000, inclusive” at around 70% probability while “More than 43,000 but less than 50,000” was around 25% probability. This held until April 25, 2018 when “Between 36,000 and 43,000, inclusive” dropped about 40% and both “More than 43,000 but less than 50,000” and “More than 29,000 but less than 36,000” hovered around 30% each. Through the middle of May, “Between 36,000 and 43,000, inclusive” slowly increased back up toward around 60% until a sudden rise in “More than 43,000 but less than 50,000” to match “Between 36,000 and 43,000, inclusive” at around 45%. From this time forward, “Between 36,000 and 43,000, inclusive” steadily increased in probability-except for a small dip in mid-June 2018—toward 100%.
Forecast rationale As discussed above, we endeavored to create a more granular sister question of Tesla Model 3 production levels, only including options below 50,000. This parallel question of how many Model 3 cars will Tesla deliver to customer between July 1 2017 and July 1, 2018 ended up resolving at odds with the consensus. Indeed, from the beginning of the question, the community predicted “Between 36,000 and 43,000 inclusive” on the grounds of the Bloomberg Model 3 Tracker, which reported delivery figures much higher than those reported by Tesla’s audited
0%
20%
40%
60%
80%
100%
4/19/2018 5/3/2018 5/17/2018 5/31/2018 6/14/2018 6/28/2018050100150200250300350400450
Pro
bab
ilit
y
Between 1 July 2017 and 1 July 2018, how many Model 3 cars will Tesla deliver to customers?
Cumulative forecasters Cumulative forecasts
29,000 or less More than 29,000 but less than 36,000
Between 36,000 and 43,000, inclusive More than 43,000 but less than 50,000
50,000 or more
22
financial statements. In particular, Tesla, Inc’s 2017 10-K noted that Tesla delivered 1,764 in the second half of 2017 and per the Q2 2018 10-Q, “vehicles delivered in the six months ended June 30, 2018, … included approximately 26,630 deliveries of Model 3 vehicles”. In total, Model 3 deliveries from July 1 2017 and July 1, 2018 were 28,394: 29,000 and less.
Analysis of “Autonomous Vehicles” Questions
This AV section of the Industry Disruption Challenge launched a total of eight questions. These questions focused on the major players (i.e., Uber, Baidu, Waymo, GM, and Audi) advancing the technology, on AV-related accident frequency, and on the relevant federal- and state-level policy in the short-run. The specific topics were selected based on the news reported in the popular and trade media, as well as the ease of resolving the question using publicly available data sources. All questions but one (i.e., AV-related traffic accidents in California) were positively framed, meaning resolution of “Yes” (for yes-no questions) or higher values (for multiple-choice questions) would indicate positive evidence to suggest progress in AV disruption. Three of the seven positively-framed questions resolved as “Yes” or not the lowest choice, indicating forward movement in AV disruption:
• Before July 1, 2018, Uber and Waymo agreed to a settlement in their legal dispute regarding trade secrets
• On March 30, 2018, Baidu’s Apollo autonomous driving software had between 2,001 and 3,000 GitHub forks
• Before July 1, 2018, Waymo launched a driverless transportation service open to the public.
There were four positively-framed autonomous vehicle questions that resolved as “No” (or the lowest choice) and there was one negatively-framed question (i.e., California AV accidents) resolved as nearly the highest quantity option, all serving as countervailing indicators to the forward movement of autonomous vehicles:
• Before 1 January 2018, the U.S. President did not sign legislation increasing the number of autonomous vehicle exemptions allowed by the Federal Motor Vehicle Safety Standards
• General Motors did not begin testing autonomous vehicles in New York City before April 1, 2018.
• Between January 1, 2018 and June 30, 2018, the California Department of Motor Vehicles (DMV) reported between 20 and 29, inclusive traffic accidents involving autonomous vehicles.
• Audi did not sell or lease a motor vehicle with Traffic Jam Pilot before July 20, 2018 • As of July 1, 2018, no manufacturers held permits for driverless testing of autonomous
vehicles in California. Question-by-question details follow for the four questions related to autonomous vehicles.
23
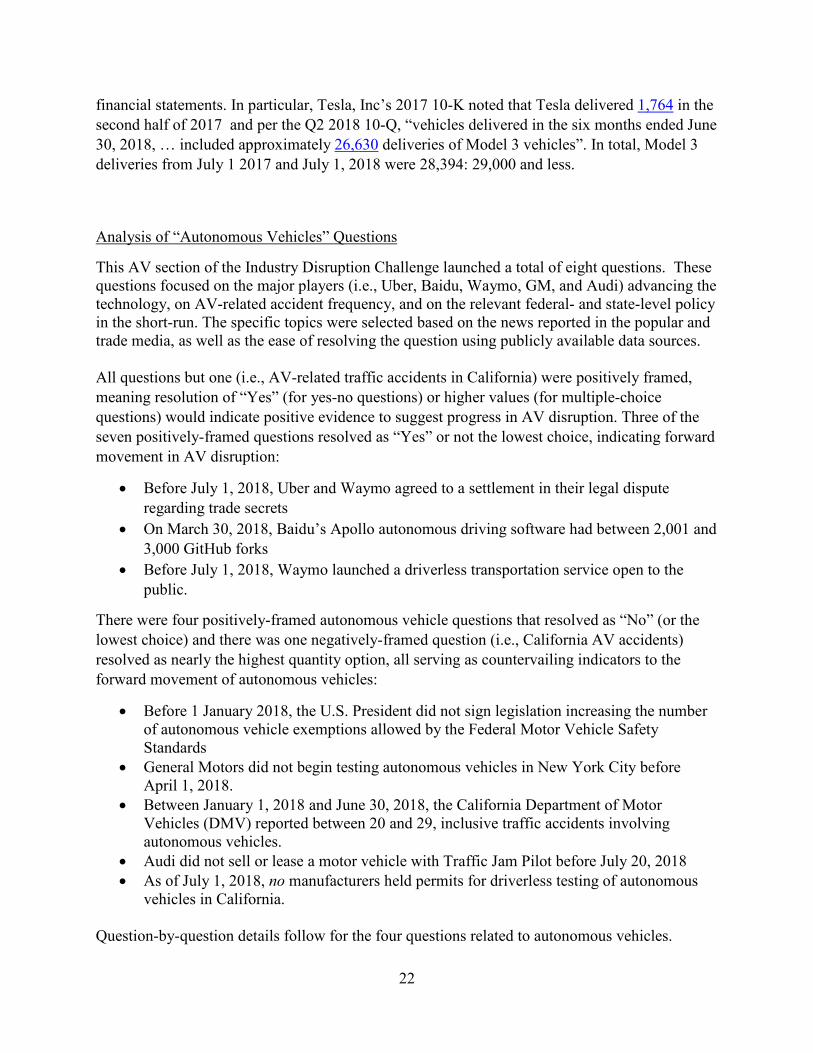
Question: Before 1 July 2018, will Uber, or any of its subsidiaries, agree to a settlement or be found liable for trade secrets violations in the case brought by Waymo in the Northern District of California? This question resolved as “Yes” on February 9, 2018 as Waymo and Uber settled their legal battle in court, nearly a year from when Waymo first accused Uber of plotting to steal important technology related to autonomous vehicles (NYT). Background Information In February, Waymo, a subsidiary of Alphabet (Google's parent company), filed suit against Uber Technologies and some of its subsidiaries for stealing information related to autonomous vehicle development (The Atlantic). For more information on Waymo LLC v Uber Technologies, Inc. et all (3:2017cv00939), currently before Federal District Judge William Alsup, see: Waymo-Uber Complaint. Settlements reached that do not include an admission of liability will still resolve the question as "yes." Subsequent appeals will not affect the resolution. Stats (# of forecasts, # of forecasters, resolved yet?): 309 Forecasters, 633 Forecasts, closed at 75% "Yes" on February 12, 2018. Verbal description of forecast trend from launch to present: The question opened on July 21, 2017 and settled in around 75% for most of the question window. During January 2018 the crowd dipped to around 65% and a momentary spike to 100% on February 9, 2018 and then down to 75% at the resolution of the question.
0%10%20%30%40%50%60%70%80%90%
7/22/2017 8/22/2017 9/22/2017 10/22/2017 11/22/2017 12/22/2017 1/22/20180
100
200
300
400
500
600
700
Prob
abili
ty
Before 1 July 2018, will Uber, or any of its subsidiaries, agree to a settlement or be found liable for trade secrets violations in
the case brought by Waymo in the Northern District of California?
Cumulative forecasters Cumulative forecasts Yes
24
Forecast rationale The forecasting community’s consensus probability estimate was consistent with the actual resolution that before July 1, 2018, Uber and Waymo would agree to a settlement in their legal dispute regarding trade secrets. Indeed, the consensus prediction was consistently over 80% throughout the question period. Forecasters reasoned that the evidence for trade secret violations was overwhelming and that the pressure for the new Uber CEO to be rid of this issue all lead to a high likelihood of settlement by the question deadline. The consensus probability estimate of the crowd was ultimately consistent with the actual resolution.
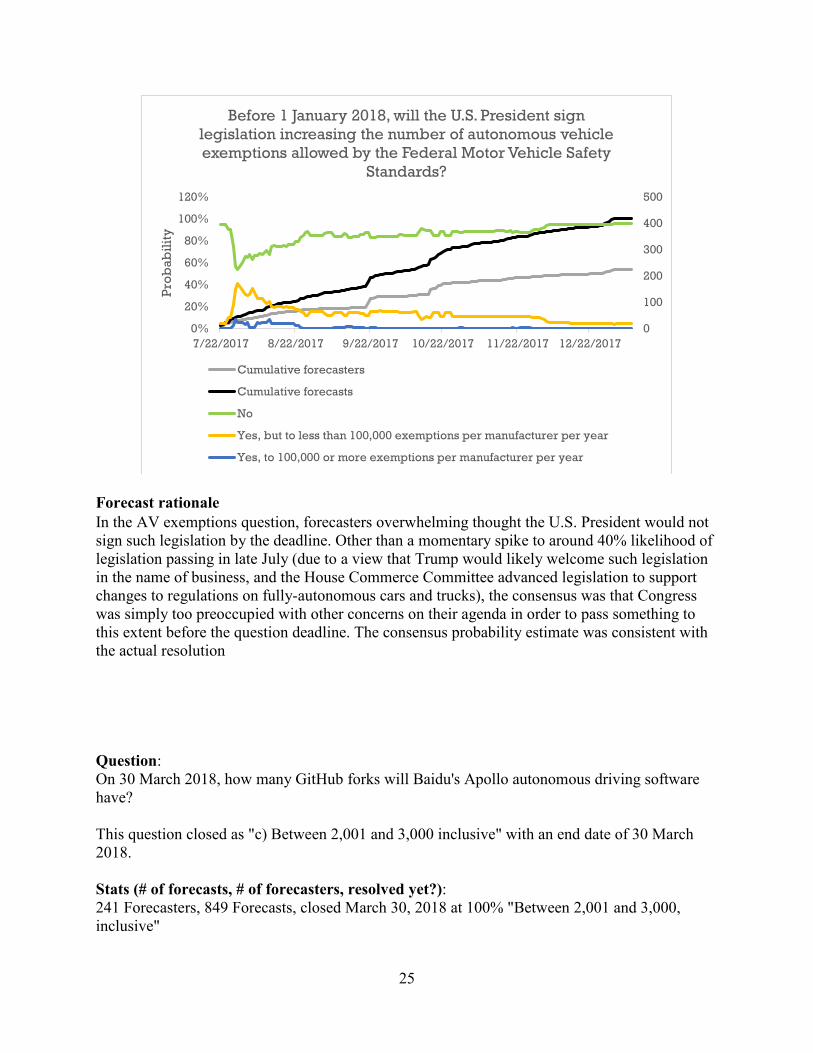
Question: Before 1 January 2018, will the U.S. President sign legislation increasing the number of autonomous vehicle exemptions allowed by the Federal Motor Vehicle Safety Standards? The U.S. President did not sign legislation increasing the number of autonomous vehicle exemptions allowed by the Federal Motor Vehicle Safety Standards. This question closed as "no" with an end date of 1 January 2018. Stats (# of forecasts, # of forecasters, resolved yet?): 226 Forecasters, 421 Forecasts, closed January 1, 2018 at 100% "No" Background Information A motor vehicle manufacturer may petition the National Highway Traffic Safety Administration for an exemption in order to sell self-driving vehicles without human controls, but only for up to 2,500 vehicles per year (National Highway Traffic Safety Administration, Reuters). The U.S. House of Representatives is considering a bill that would allow U.S. regulators to exempt up to 100,000 vehicles a year per manufacturer from these rules. Proponents say it would liberate innovation for self-driving vehicles. Opponents say that 100,000 vehicles per year, multiplied by up to 30 autonomous vehicle developers, would constitute full deployment without the requisite safety precautions. Verbal description of forecast trend from launch to present: This question opened on July 21, 2017 and settled in with about 70% at “No” and 30% at “Yes, but to less than 100,000 exemptions per manufacturer per year”. This gap gradually grew wider until “No” took 100% at the end of the question.
25
Forecast rationale In the AV exemptions question, forecasters overwhelming thought the U.S. President would not sign such legislation by the deadline. Other than a momentary spike to around 40% likelihood of legislation passing in late July (due to a view that Trump would likely welcome such legislation in the name of business, and the House Commerce Committee advanced legislation to support changes to regulations on fully-autonomous cars and trucks), the consensus was that Congress was simply too preoccupied with other concerns on their agenda in order to pass something to this extent before the question deadline. The consensus probability estimate was consistent with the actual resolution Question: On 30 March 2018, how many GitHub forks will Baidu's Apollo autonomous driving software have? This question closed as "c) Between 2,001 and 3,000 inclusive" with an end date of 30 March 2018. Stats (# of forecasts, # of forecasters, resolved yet?): 241 Forecasters, 849 Forecasts, closed March 30, 2018 at 100% "Between 2,001 and 3,000, inclusive"
0%
20%
40%
60%
80%
100%
120%
7/22/2017 8/22/2017 9/22/2017 10/22/2017 11/22/2017 12/22/20170
100
200
300
400
500
Prob
abili
ty
Before 1 January 2018, will the U.S. President sign legislation increasing the number of autonomous vehicle exemptions allowed by the Federal Motor Vehicle Safety
Standards?
Cumulative forecasters
Cumulative forecasts
No
Yes, but to less than 100,000 exemptions per manufacturer per year
Yes, to 100,000 or more exemptions per manufacturer per year
26
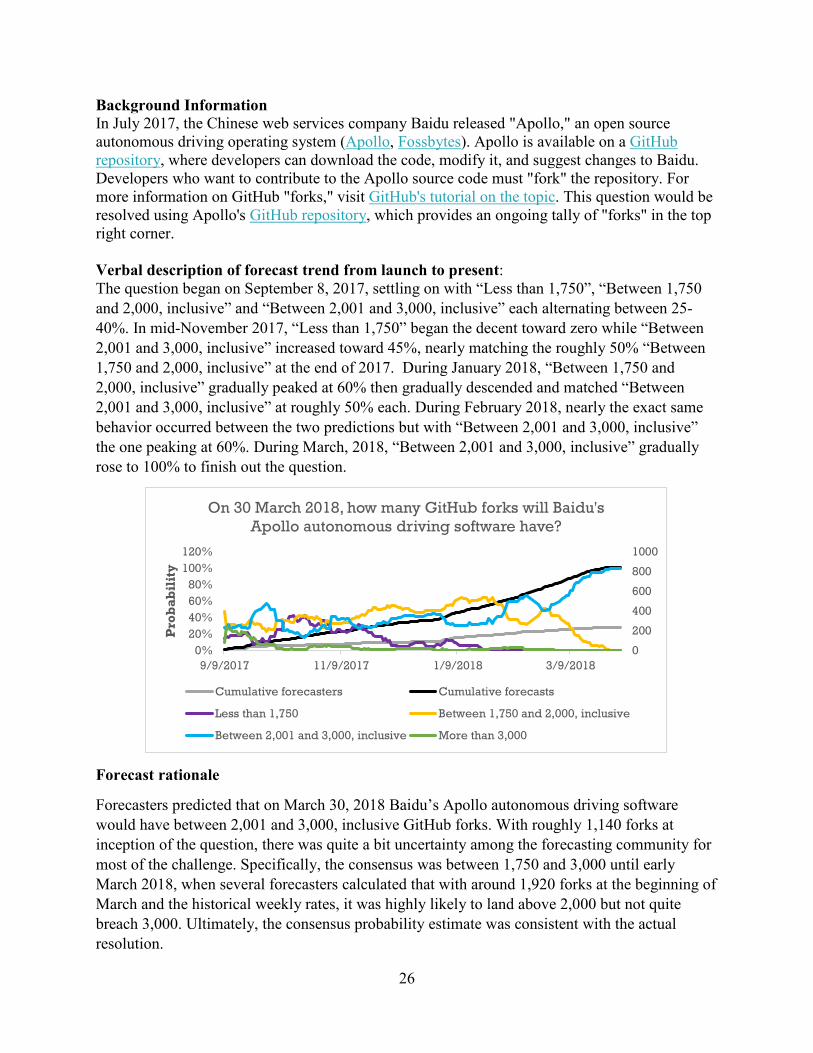
Background Information In July 2017, the Chinese web services company Baidu released "Apollo," an open source autonomous driving operating system (Apollo, Fossbytes). Apollo is available on a GitHub repository, where developers can download the code, modify it, and suggest changes to Baidu. Developers who want to contribute to the Apollo source code must "fork" the repository. For more information on GitHub "forks," visit GitHub's tutorial on the topic. This question would be resolved using Apollo's GitHub repository, which provides an ongoing tally of "forks" in the top right corner. Verbal description of forecast trend from launch to present: The question began on September 8, 2017, settling on with “Less than 1,750”, “Between 1,750 and 2,000, inclusive” and “Between 2,001 and 3,000, inclusive” each alternating between 25-40%. In mid-November 2017, “Less than 1,750” began the decent toward zero while “Between 2,001 and 3,000, inclusive” increased toward 45%, nearly matching the roughly 50% “Between 1,750 and 2,000, inclusive” at the end of 2017. During January 2018, “Between 1,750 and 2,000, inclusive” gradually peaked at 60% then gradually descended and matched “Between 2,001 and 3,000, inclusive” at roughly 50% each. During February 2018, nearly the exact same behavior occurred between the two predictions but with “Between 2,001 and 3,000, inclusive” the one peaking at 60%. During March, 2018, “Between 2,001 and 3,000, inclusive” gradually rose to 100% to finish out the question.
Forecast rationale
Forecasters predicted that on March 30, 2018 Baidu’s Apollo autonomous driving software would have between 2,001 and 3,000, inclusive GitHub forks. With roughly 1,140 forks at inception of the question, there was quite a bit uncertainty among the forecasting community for most of the challenge. Specifically, the consensus was between 1,750 and 3,000 until early March 2018, when several forecasters calculated that with around 1,920 forks at the beginning of March and the historical weekly rates, it was highly likely to land above 2,000 but not quite breach 3,000. Ultimately, the consensus probability estimate was consistent with the actual resolution.
0%20%40%60%80%
100%120%
9/9/2017 11/9/2017 1/9/2018 3/9/20180
200
400
600
800
1000
Pro
bab
ilit
y
On 30 March 2018, how many GitHub forks will Baidu's Apollo autonomous driving software have?
Cumulative forecasters Cumulative forecasts
Less than 1,750 Between 1,750 and 2,000, inclusive
Between 2,001 and 3,000, inclusive More than 3,000
27
Question:
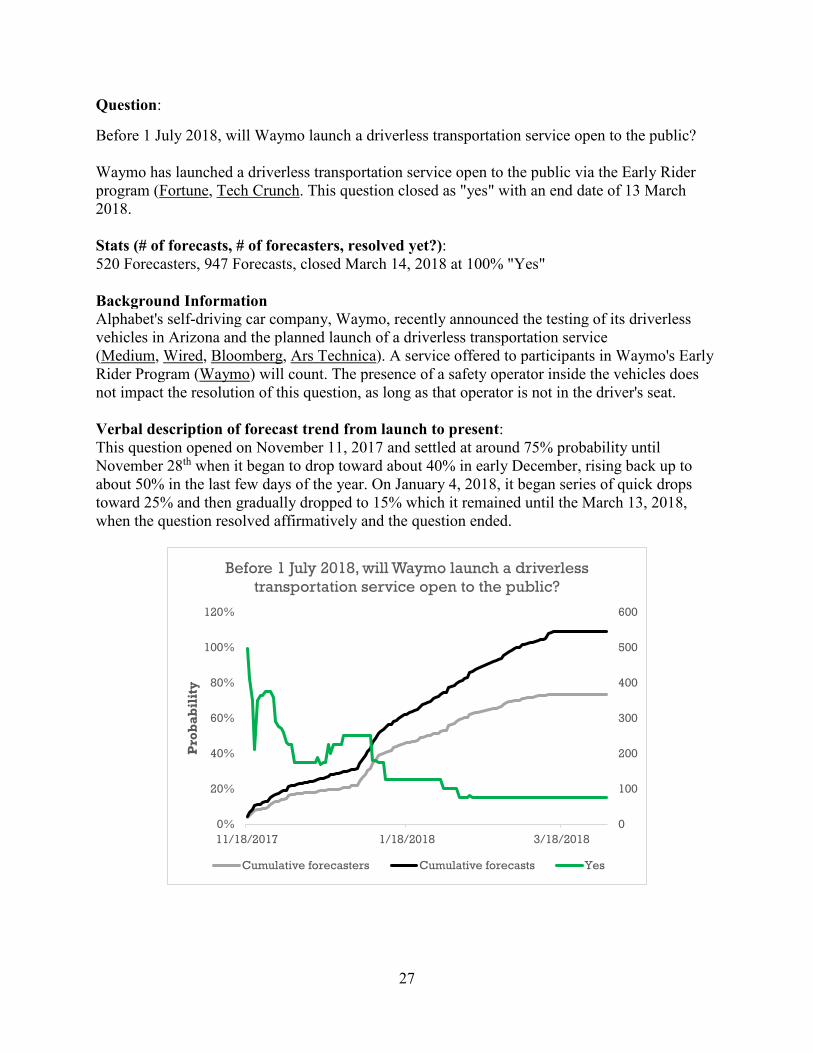
Before 1 July 2018, will Waymo launch a driverless transportation service open to the public? Waymo has launched a driverless transportation service open to the public via the Early Rider program (Fortune, Tech Crunch. This question closed as "yes" with an end date of 13 March 2018. Stats (# of forecasts, # of forecasters, resolved yet?): 520 Forecasters, 947 Forecasts, closed March 14, 2018 at 100% "Yes" Background Information Alphabet's self-driving car company, Waymo, recently announced the testing of its driverless vehicles in Arizona and the planned launch of a driverless transportation service (Medium, Wired, Bloomberg, Ars Technica). A service offered to participants in Waymo's Early Rider Program (Waymo) will count. The presence of a safety operator inside the vehicles does not impact the resolution of this question, as long as that operator is not in the driver's seat. Verbal description of forecast trend from launch to present: This question opened on November 11, 2017 and settled at around 75% probability until November 28th when it began to drop toward about 40% in early December, rising back up to about 50% in the last few days of the year. On January 4, 2018, it began series of quick drops toward 25% and then gradually dropped to 15% which it remained until the March 13, 2018, when the question resolved affirmatively and the question ended.
0%
20%
40%
60%
80%
100%
120%
11/18/2017 1/18/2018 3/18/20180
100
200
300
400
500
600
Pro
bab
ilit
y
Before 1 July 2018, will Waymo launch a driverless transportation service open to the public?
Cumulative forecasters Cumulative forecasts Yes
28
Forecast rationale The forecasting community did not anticipate that Waymo would launch a driverless transportation service open to the public before July 1, 2018. To be fair, the consensus probability estimate early on was consistent with the actual resolution, predicted “Yes” at over 70% on the grounds that Arizona was already so close to fulfilling this question. However, from the beginning of 2018 onward, the forecasting community was quite polarized, with almost all forecasters predicting over 80% “Yes” or “No”. However, the majority of these committed forecasts were for “No”, resulting in a 15% overall consensus for over a month before time of resolution of “Yes”. This winning (but inconsistent with the actual resolution) bearish view was driven by the uncertainty, legal liability, and general consumer mistrust regarding the technology. The losing (but consistent with the actual resolution) view primarily surrounded that Waymo had a permit granted and that increased media coverage surrounding the trials in Arizona. Ultimately, this question was a good learning opportunity.
Question: Before 1 April 2018, will General Motors test an autonomous vehicle in New York City? General Motors did not test an autonomous vehicle in New York City. This question closed as "no" with an end date of 1 April 2018. Stats (# of forecasts, # of forecasters, resolved yet?): 409 Forecasters, 730 Forecasts, closed April 1, 2018 at 100% "No" Background Information Cruise Automation, the self-driving unit of General Motors, recently announced its intention to test autonomous Chevy Bolts in New York City a high regulation, high density location. Tests conducted with backup drivers or engineers in the car will count. Verbal description of forecast trend from launch to present: This question opened on November 11, 2017 and settled in at 70% through the end of 2017. For the first half of January 2018, it fell to around 35% and then gradually dropped to zero by April 1, 2018, the end of the question.
29
Forecast rationale The forecasting community’s consensus probability estimate was consistent with the actual resolution that General Motors would not tests autonomous vehicles in New York City by April 1, 2018. Initially, forecasters were quite bullish on the grounds of strong commitment from GM toward automation sooner rather than later. However, early in 2018, the consensus turned sharply toward “No” on the grounds that GM’s tests in California were preoccupying the company and were not fully analyzed to warrant expanding testing to another city. Moreover, weather concerns before April in New York City underpinned many forecasters’ high “No” probabilities. The fatal Tempe, AZ Uber death on March 18, 2018 put the nail in the coffin for the crowd moving the consensus probability estimate firmly toward “No”, consistent with the actual resolution.
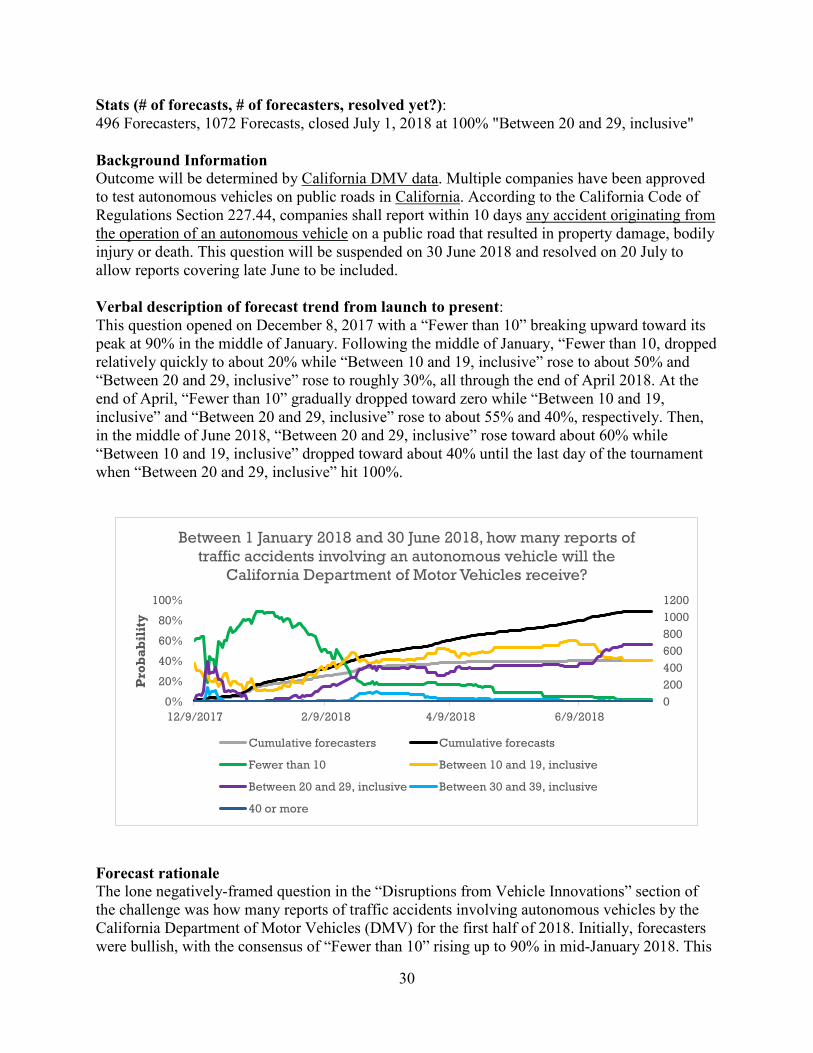
Question: Between 1 January 2018 and 30 June 2018, how many reports of traffic accidents involving an autonomous vehicle will the California Department of Motor Vehicles receive? Per the Report of Traffic Collision Involving an Autonomous Vehicle (OL 316) published by the California Department of Motor Vehicles, the California DMV received a total of 26 reports of traffic accidents involving an autonomous vehicle within the noted time period (the first half of 2018).
0%
10%
20%
30%
40%
50%
60%
70%
80%
90%
0
100
200
300
400
500
600
700
800
Pro
bab
ilit
y
Before 1 April 2018, will General Motors test an autonomous vehicle in New York City?
Cumulative forecasters Cumulative forecasts Yes
30
Stats (# of forecasts, # of forecasters, resolved yet?): 496 Forecasters, 1072 Forecasts, closed July 1, 2018 at 100% "Between 20 and 29, inclusive" Background Information Outcome will be determined by California DMV data. Multiple companies have been approved to test autonomous vehicles on public roads in California. According to the California Code of Regulations Section 227.44, companies shall report within 10 days any accident originating from the operation of an autonomous vehicle on a public road that resulted in property damage, bodily injury or death. This question will be suspended on 30 June 2018 and resolved on 20 July to allow reports covering late June to be included. Verbal description of forecast trend from launch to present: This question opened on December 8, 2017 with a “Fewer than 10” breaking upward toward its peak at 90% in the middle of January. Following the middle of January, “Fewer than 10, dropped relatively quickly to about 20% while “Between 10 and 19, inclusive” rose to about 50% and “Between 20 and 29, inclusive” rose to roughly 30%, all through the end of April 2018. At the end of April, “Fewer than 10” gradually dropped toward zero while “Between 10 and 19, inclusive” and “Between 20 and 29, inclusive” rose to about 55% and 40%, respectively. Then, in the middle of June 2018, “Between 20 and 29, inclusive” rose toward about 60% while “Between 10 and 19, inclusive” dropped toward about 40% until the last day of the tournament when “Between 20 and 29, inclusive” hit 100%.
Forecast rationale The lone negatively-framed question in the “Disruptions from Vehicle Innovations” section of the challenge was how many reports of traffic accidents involving autonomous vehicles by the California Department of Motor Vehicles (DMV) for the first half of 2018. Initially, forecasters were bullish, with the consensus of “Fewer than 10” rising up to 90% in mid-January 2018. This
0%
20%
40%
60%
80%
100%
12/9/2017 2/9/2018 4/9/2018 6/9/2018020040060080010001200
Pro
bab
ilit
y
Between 1 January 2018 and 30 June 2018, how many reports of traffic accidents involving an autonomous vehicle will the
California Department of Motor Vehicles receive?
Cumulative forecasters Cumulative forecasts
Fewer than 10 Between 10 and 19, inclusive
Between 20 and 29, inclusive Between 30 and 39, inclusive
40 or more
31
optimism was widely based on the logic that there were so few AVs on the road and that AV accidents were analogous to airplane crashes, in which each crash increased the overall safety and effectiveness of all other airplanes. This optimism abruptly vanished, however, in early February 2018 with four crashes reported in January alone by the California DMV. For the remainder of the challenge, the consensus highly favored between 10 and 29, inclusive, and by the beginning of July 2018 over 50% of the consensus was consistent with the actual resolution between 20 and 29, inclusive.
Question: Before 20 July 2018, will Audi sell or lease a motor vehicle with Traffic Jam Pilot? This question closed as "no" with an end date of 20 July 2018. (Audi, Zdnet, Fleetnews, Motoring) Stats (# of forecasts, # of forecasters, resolved yet?): 312 Forecasters, 506 Forecasts, closed July 20, 2018 at 100% "No" Background Information The Society of Automotive Engineers uses six levels (zero through five) to classify the level of autonomy in vehicles (Car and Driver). Within the ongoing debate on the best development path for autonomous vehicle technology, the viability and safety of vehicles with Level 3 autonomy in contrast to Level 4 autonomy is seen as most salient (The Economist). As such, different companies are advancing different strategies (Inverse). Audi's development of Level 3 autonomy capabilities with its Traffic Jam Pilot make it a pivotal case to watch in the context of this debate (Audi, Pocket-Lint, Practical Motoring). Verbal description of forecast trend from launch to present: This question opened on January 24, 2018 and settled it near zero probability, gradually rising to about 20% in the middle of March 2018. After this point, it steadily declined, ultimately reaching 0% probability at the end of the question on July 20, 2018.
0%
5%
10%
15%
20%
25%
1/25/2018 3/25/2018 5/25/20180
100
200
300
400
500
600
Pro
bab
ilit
y
Before 20 July 2018, will Audi sell or lease a motor vehicle with Traffic Jam Pilot?
Cumulative forecasters Cumulative forecasts Yes

32
Forecast rationale The consensus probability estimate was consistent with the actual resolution that Audi would not sell or lease a motor vehicle with Traffic Jam Pilot by July 20, 2018. In fact, the consensus “Yes” never breached 20% throughout the question window. Generally, this pessimistic view was built on the rationale that more regulations were needed first to adequately legalize and sustain such technology, that the technology is not ready or is not adequately tested, or that Audi’s current market position was so strong that such a move was currently premature. Ultimately, the forecasting community converged on and the question consistent with the resolution of “No”.
Question: As of 1 July 2018, how many manufacturers will hold permits for driverless testing of autonomous vehicles in California? No manufacturers hold permits for driverless testing of autonomous vehicles in California. This question closed as "0 (zero)" with an end date of 1 July 2018. Stats (# of forecasts, # of forecasters, resolved yet?): 154 Forecasters, 312 Forecasts, closed July 1, 2018 at 95% "Zero" Background Information For years, California has issued permits for testing of autonomous vehicles, provided that drivers remain in the car (California DMV, California DMV, The Economist). On 2 April 2018, the California DMV was authorized to approve permits for manufacturer's driverless testing of autonomous vehicles (California DMV, San Francisco Chronicle). Verbal description of forecast trend from launch to present: The question opened on April 18, 2018 and settled in around 70% predicting “Between 1 and 3, inclusive.” This general trend held until an early June when “0”, then only around 15%, began a relatively steady takeover of in probability until it reached 93% just before the end of the closing. Of note, there was a late momentary resurgence of predicting “Between 1 and 3, inclusive” in late June, but quickly returned toward zero probability.
33
Forecast rationale The forecasting community consensus probability estimate was consistent with the actual resolution that no manufacturers would permits for driverless testing of autonomous vehicles in California by July 1, 2018. From inception of the question in April 2018 to the middle of June 2018, however, the consensus was over 60% probability “Between 1 and 3, inclusive” due to the fact that there were two applicants under review. However, by the middle of June, with no news of accepted applications (and only two weeks left in the question) forecasters got much more pessimistic and moved the consensus quickly toward zero.
0%
10%
20%
30%
40%
50%
60%
70%
80%
90%
100%
4/19/2018 5/10/2018 5/31/2018 6/21/2018 7/12/20180
50
100
150
200
250
300
350P
rob
abil
ity
As of 1 July 2018, how many manufacturers will hold permits for driverless testing of autonomous vehicles
in California?
Cumulative forecasters Cumulative forecasts
0 (zero) Between 1 and 3, inclusive
Between 4 and 6, inclusive Between 7 and 9, inclusive
10 or more
34
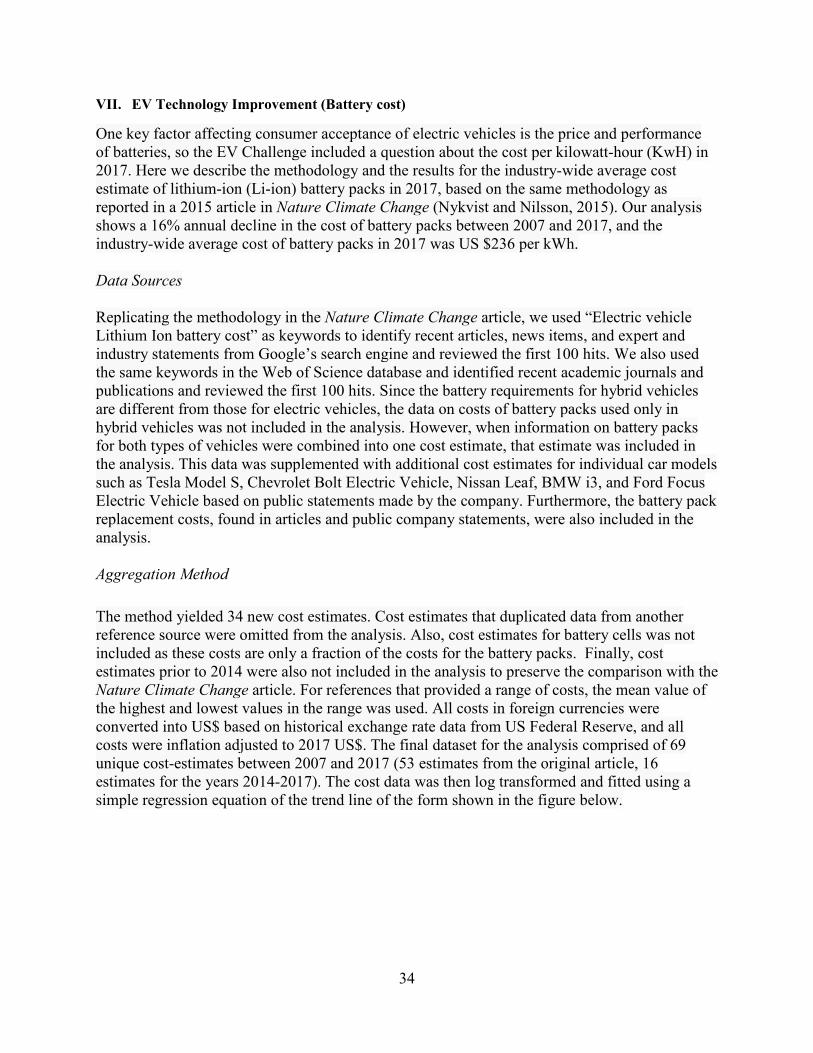
VII. EV Technology Improvement (Battery cost)
One key factor affecting consumer acceptance of electric vehicles is the price and performance of batteries, so the EV Challenge included a question about the cost per kilowatt-hour (KwH) in 2017. Here we describe the methodology and the results for the industry-wide average cost estimate of lithium-ion (Li-ion) battery packs in 2017, based on the same methodology as reported in a 2015 article in Nature Climate Change (Nykvist and Nilsson, 2015). Our analysis shows a 16% annual decline in the cost of battery packs between 2007 and 2017, and the industry-wide average cost of battery packs in 2017 was US $236 per kWh. Data Sources Replicating the methodology in the Nature Climate Change article, we used “Electric vehicle Lithium Ion battery cost” as keywords to identify recent articles, news items, and expert and industry statements from Google’s search engine and reviewed the first 100 hits. We also used the same keywords in the Web of Science database and identified recent academic journals and publications and reviewed the first 100 hits. Since the battery requirements for hybrid vehicles are different from those for electric vehicles, the data on costs of battery packs used only in hybrid vehicles was not included in the analysis. However, when information on battery packs for both types of vehicles were combined into one cost estimate, that estimate was included in the analysis. This data was supplemented with additional cost estimates for individual car models such as Tesla Model S, Chevrolet Bolt Electric Vehicle, Nissan Leaf, BMW i3, and Ford Focus Electric Vehicle based on public statements made by the company. Furthermore, the battery pack replacement costs, found in articles and public company statements, were also included in the analysis. Aggregation Method
The method yielded 34 new cost estimates. Cost estimates that duplicated data from another reference source were omitted from the analysis. Also, cost estimates for battery cells was not included as these costs are only a fraction of the costs for the battery packs. Finally, cost estimates prior to 2014 were also not included in the analysis to preserve the comparison with the Nature Climate Change article. For references that provided a range of costs, the mean value of the highest and lowest values in the range was used. All costs in foreign currencies were converted into US$ based on historical exchange rate data from US Federal Reserve, and all costs were inflation adjusted to 2017 US$. The final dataset for the analysis comprised of 69 unique cost-estimates between 2007 and 2017 (53 estimates from the original article, 16 estimates for the years 2014-2017). The cost data was then log transformed and fitted using a simple regression equation of the trend line of the form shown in the figure below.
35
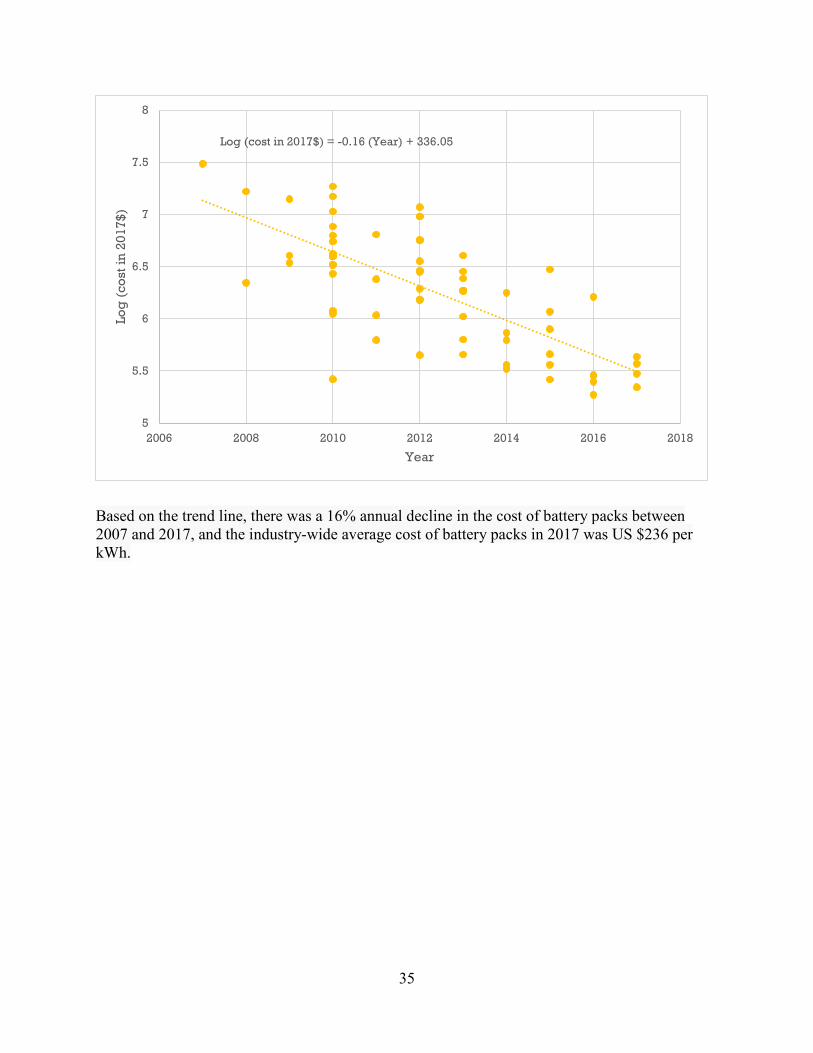
Based on the trend line, there was a 16% annual decline in the cost of battery packs between 2007 and 2017, and the industry-wide average cost of battery packs in 2017 was US $236 per kWh.
Log (cost in 2017$) = -0.16 (Year) + 336.05
5
5.5
6
6.5
7
7.5
8
2006 2008 2010 2012 2014 2016 2018
Log
(co
st in
201
7$)
Year