good organic growth and high acquisition activity
TRANSCRIPT

KAPITEL
GOOD ORGANIC GROWTH AND HIGH ACQUISITION ACTIVITYAt Addtech, 2017/2018 was a strong year, characterised by high activity and a favourable business climate. Strong profit growth and our focused work on continuous development – while keeping costs under control – delivered a higher operating margin. During the year, eleven acquisitions were made, adding annual sales of around SEK 700 million. Return on working capital (P/WC) amounted to 53 percent.
Q1 A GOOD STARTThe first quarter showed good growth with a retained operating margin, even compared with a strong quarter last year. The increase in organic net sales provided good earnings growth and three acquisi-tions were made.
Q2 STRONG ORGANIC GROWTHThe market was very strong during the quarter and the Group recorded an organ-ic increase of 9 percent in sales and a con-tinued improved operating margin.
Q3 HIGH ACQUISITION ACTIVITYThe business climate during the quarter was favourable with stronger demand in most of our geographical markets and most customer segments. Our activity level was high and five acquisitions were made.
Q4 FAVOURABLE BUSINESS CLIMATEThe favourable business climate contin-ued and the quarter provided an excellent conclusion to a successful year. Earnings growth was robust and the operating mar-gin continued to rise compared with the pre-vious year. Three acquisitions were made.
8,022NET SALES,
SEKm
10.5%EBITA MARGIN
THE YEAR IN BRIEF
YEAR NET SALES AND EBITA-MARGIN
12
9
6
3
9,000
6,000
3,000
014/15
%Net sales
EBITA-margin, %Net sales, SEKm
15/16 16/17 17/18
ABOUT THE ANNUAL REPORTThe annual report describes Addtech’s operations and financial results 2017/2018 and includes a Corporate Governance Report and a Sustainability Report. The legal annual report covers pages 22-31 and 35-96. Comparisons listed in brackets refer to the corresponding amount in the previous year. The statutory Sustainability Report according to ÅRL can be found on pages 22-31 and 38-40.
QUARTER NET SALES AND EBITA-MARGIN
12
10
8
6
4
2
2,500
2,000
1,500
1,000
500
0Q 1 Q 2 Q 3 Q 4
%Net sales
EBITA-margin, %Net sales, SEKm
3ADDTECH ANNUAL REPORT 2017/2018

4 ADDTECH ANNUAL REPORT 2017/2018
COMMENTS BY THE CEO
HIGH ACQUIS I T ION R ATE AND ADVANCED MARKE T POSI T IONS
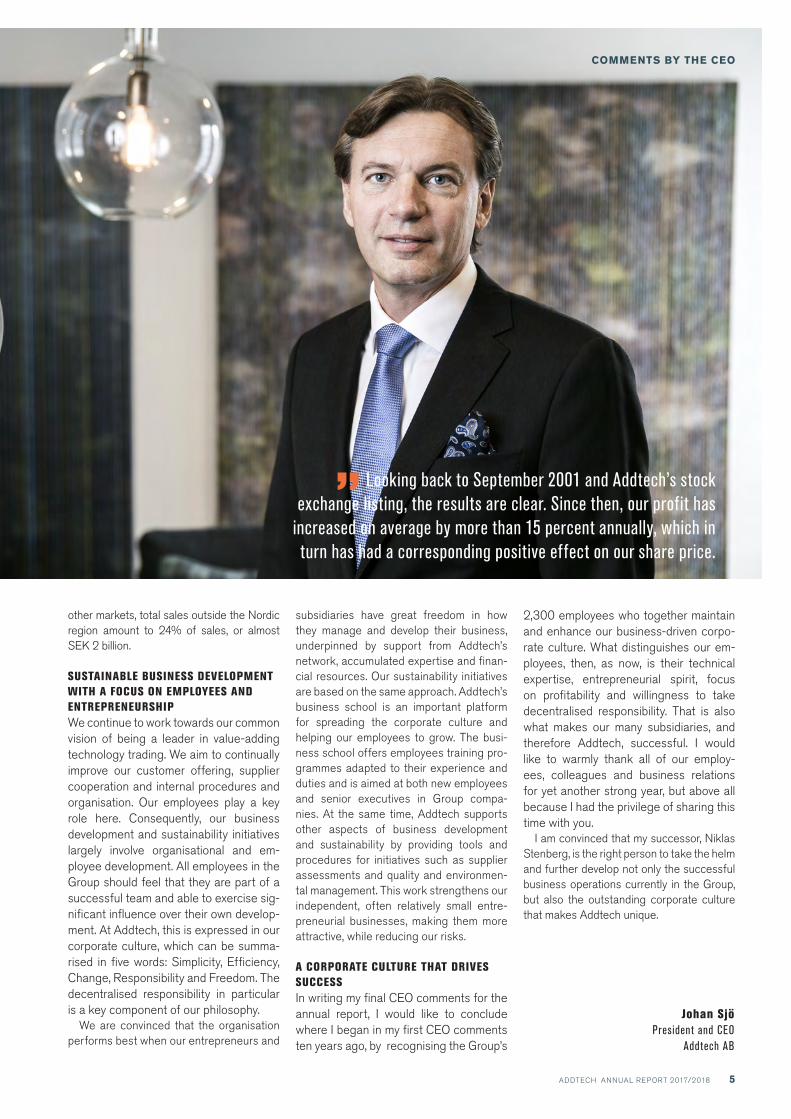
STRONG YEAR EXCEEDING FINANCIAL TARGETS 2017/2018 was a strong year for Addtech, marked by high activity, a favourable busi-ness climate and stable to rising demand in most of our markets. We are proud to say that we exceeded our financial targets once again. Sales surpassed SEK 8 billion, with growth of 12 percent, including 5 percent organic growth. Our profit growth, measured as EBITA, was 17 percent and our focused work on continuous development, while keeping costs under control, raised the EBI-TA margin from 10.0 to 10.5 percent.
Return on working capital (P/WC) amounted to 53 percent, an excellent cash flow from operations.
GOOD ORDER BRINGS PROFITABILITY THROUGHOUT THE GROUPOur long-term focus on profitable growth, both organically and through acquisitions, has paid off. Profitable growth generates a larger cash flow, which in turn can be invested for additional growth. Our good cash flow growth over the years has en-abled us to increase the dividend to our shareholders and to continue to acquire
With strong organic growth and eleven acquisitions, we advanced our market positions within and beyond the Nordic region, and can confirm
that we continue to perform well above our financial targets.
profitable companies. Looking back to September 2001 and Addtech’s stock ex-change listing, the results are clear. Since then, our profit has increased on average by more than 15 percent annually, which in turn has had a corresponding positive effect on our share price.
The basis for profitability is good order, which allows more time to be devoted to cre-ating value for our customers and ourselves. It is important to focus on what is essential and makes a difference. Thorough profita-bility analyses aimed at identifying essential activities are conducted in our subsidiaries. The regular analyses tell us where our mar-gins and growth are strong and where they are poorer. This methodical approach ena-bles us to invest where we are doing well and to reduce our focus on areas not con-tributing to long-term growth. In this way, we continue to build value for our shareholders, customers and employees, providing them with interesting growth opportunities.
HIGH ACQUISITION RATE AS WE ME-THODICALLY BUILD THE GROUP Our well established basic philosophy of building the Group from relatively small,
flexible businesses with in-depth tech-nical expertise, working close to the customer and able to respond rapidly to market changes, stands firm. We are methodically building the Group and every acquired company represents a unique building block that fits into the Group structure and contributes with new busi-ness opportunities and employees who want to develop. The acquisition process itself may take time – we are careful to learn as much as we can about the company, its people and its culture – but in return, integration is much faster. Our acquisition rate remained high during the year. We made a total of eleven careful-ly selected acquisitions that contributed annual sales of approximately SEK 700 million.
We have long known that our business model appeals to owners and entrepreneurs in the Nordic countries. Now we see that it is equally appealing to companies outside the Nordic region. Until recently, we have mainly focused on Nordic businesses, but over the past two years we have acquired a total of five businesses outside the Nordic region. With our exports from the Nordic countries to
KAPITEL
5ADDTECH ANNUAL REPORT 2017/2018
COMMENTS BY THE CEO
other markets, total sales outside the Nordic region amount to 24% of sales, or almost SEK 2 billion.
SUSTAINABLE BUSINESS DEVELOPMENT WITH A FOCUS ON EMPLOYEES AND ENTREPRENEURSHIP We continue to work towards our common vision of being a leader in value-adding technology trading. We aim to continually improve our customer offering, supplier cooperation and internal procedures and organisation. Our employees play a key role here. Consequently, our business development and sustainability initiatives largely involve organisational and em-ployee development. All employees in the Group should feel that they are part of a successful team and able to exercise sig-nificant influence over their own develop-ment. At Addtech, this is expressed in our corporate culture, which can be summa-rised in five words: Simplicity, Efficiency, Change, Responsibility and Freedom. The decentralised responsibility in particular is a key component of our philosophy.
We are convinced that the organisation performs best when our entrepreneurs and
subsidiaries have great freedom in how they manage and develop their business, underpinned by support from Addtech’s network, accumulated expertise and finan-cial resources. Our sustainability initiatives are based on the same approach. Addtech’s business school is an important platform for spreading the corporate culture and helping our employees to grow. The busi-ness school offers employees training pro-grammes adapted to their experience and duties and is aimed at both new employees and senior executives in Group compa-nies. At the same time, Addtech supports other aspects of business development and sustainability by providing tools and procedures for initiatives such as supplier assessments and quality and environmen-tal management. This work strengthens our independent, often relatively small entre-preneurial businesses, making them more attractive, while reducing our risks.
A CORPORATE CULTURE THAT DRIVES SUCCESS In writing my final CEO comments for the annual report, I would like to conclude where I began in my first CEO comments ten years ago, by recognising the Group’s
” Looking back to September 2001 and Addtech’s stock exchange listing, the results are clear. Since then, our profit has
increased on average by more than 15 percent annually, which in turn has had a corresponding positive effect on our share price.
2,300 employees who together maintain and enhance our business- driven corpo-rate culture. What distinguishes our em-ployees, then, as now, is their technical expertise, entrepreneurial spirit, focus on profitability and willingness to take decentralised responsibility. That is also what makes our many subsidiaries, and therefore Addtech, successful. I would like to warmly thank all of our employ-ees, colleagues and business relations for yet another strong year, but above all because I had the privilege of sharing this time with you.
I am convinced that my successor, Niklas Stenberg, is the right person to take the helm and further develop not only the successful business operations currently in the Group, but also the outstanding corporate culture that makes Addtech unique.
Johan SjöPresident and CEO
Addtech AB

KAPITEL
WE WILL BE LEADING IN VALUE-ADDING TECHNOLOGY TR ADING
Our vision is to be the leading value adding tech provider. As a Group-wide guiding principle, our vision directs how we should act in various situations, while
ef fectively and successfully combining continuity with development. To achieve this vision we have broken it down into goals, strategy and business concept.
VISION, BUSINESS CONCEPT, GOALS AND STRATEGIES
ADDTECH ANNUAL REPORT 2017/20186
VISION, BUSINESS CONCEPT, GOALS AND STRATEGIES
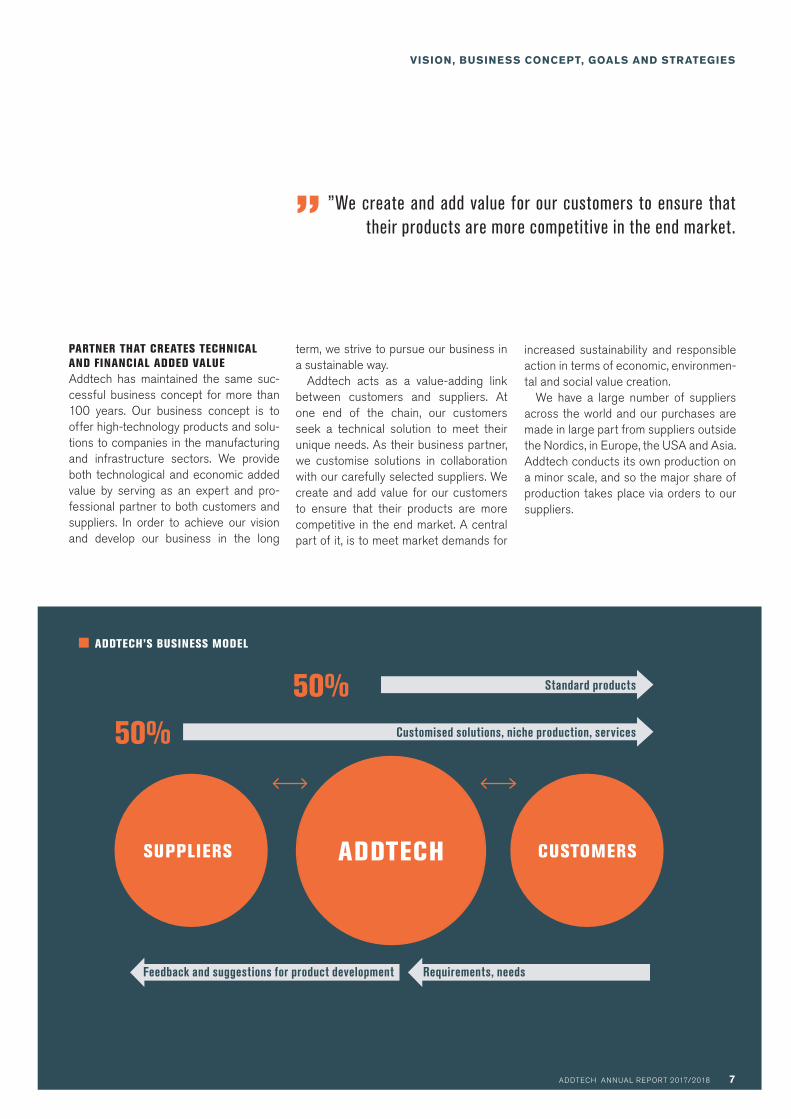
SUPPLIERS CUSTOMERSADDTECH
Standard products
Feedback and suggestions for product development Requirements, needs
50%Customised solutions, niche production, services50%
ADDTECH’S BUSINESS MODEL
PARTNER THAT CREATES TECHNICAL AND FINANCIAL ADDED VALUEAddtech has maintained the same suc-cessful business concept for more than 100 years. Our business concept is to offer high-technology products and solu-tions to companies in the manufacturing and infrastructure sectors. We provide both technological and economic added value by serving as an expert and pro-fessional partner to both customers and suppliers. In order to achieve our vision and develop our business in the long
term, we strive to pursue our business in a sustainable way.
Addtech acts as a value-adding link between customers and suppliers. At one end of the chain, our customers seek a technical solution to meet their unique needs. As their business partner, we customise solutions in collaboration with our carefully selected suppliers. We create and add value for our customers to ensure that their products are more competitive in the end market. A central part of it, is to meet market demands for
increased sustainability and responsible action in terms of economic, environmen-tal and social value creation.
We have a large number of suppliers across the world and our purchases are made in large part from suppliers outside the Nordics, in Europe, the USA and Asia. Addtech conducts its own production on a minor scale, and so the major share of production takes place via orders to our suppliers.
” ”We create and add value for our customers to ensure that their products are more competitive in the end market.
7ADDTECH ANNUAL REPORT 2017/2018
KAPITEL
8 ADDTECH ANNUAL REPORT 2017/2018
VISION, BUSINESS CONCEPT, GOALS AND STRATEGIES
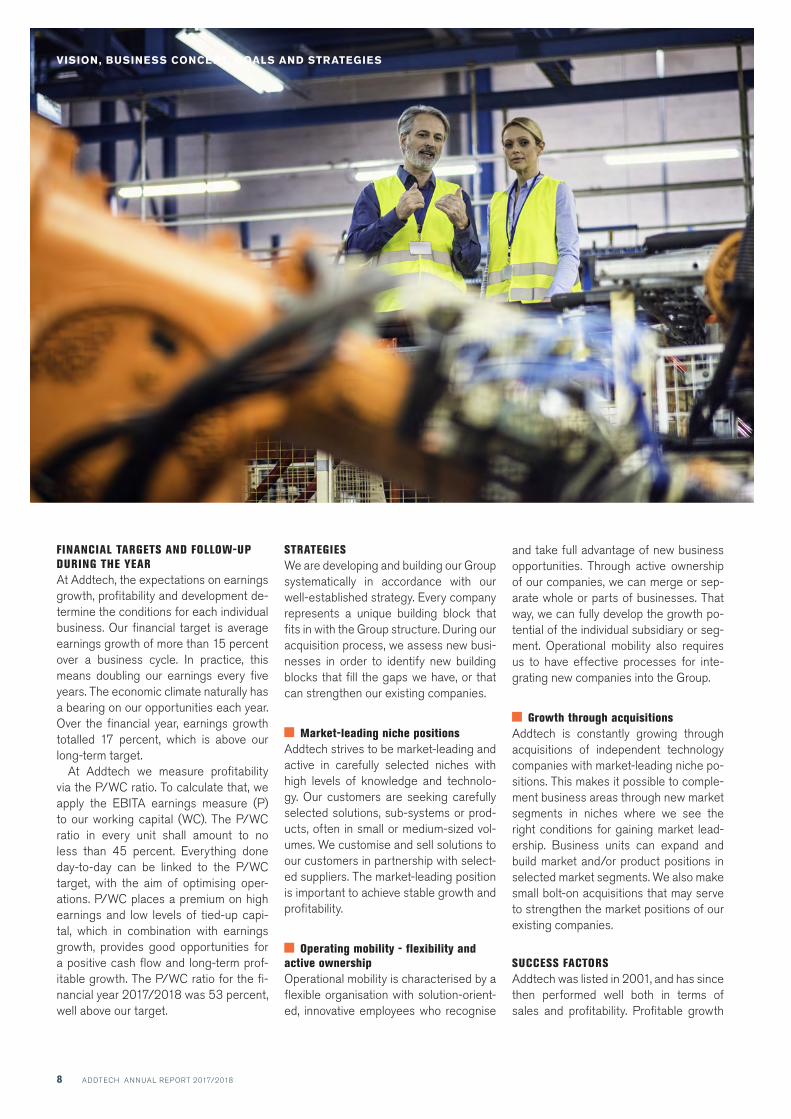
FINANCIAL TARGETS AND FOLLOW-UP DURING THE YEARAt Addtech, the expectations on earnings growth, profitability and development de-termine the conditions for each individual business. Our financial target is average earnings growth of more than 15 percent over a business cycle. In practice, this means doubling our earnings every five years. The economic climate naturally has a bearing on our opportunities each year. Over the financial year, earnings growth totalled 17 percent, which is above our long-term target.
At Addtech we measure profitability via the P/WC ratio. To calculate that, we apply the EBITA earnings measure (P) to our working capital (WC). The P/WC ratio in every unit shall amount to no less than 45 percent. Everything done day-to-day can be linked to the P/WC target, with the aim of optimising oper-ations. P/WC places a premium on high earnings and low levels of tied-up capi-tal, which in combination with earnings growth, provides good opportunities for a positive cash flow and long-term prof-itable growth. The P/WC ratio for the fi-nancial year 2017/2018 was 53 percent, well above our target.
STRATEGIESWe are developing and building our Group systematically in accordance with our well-established strategy. Every company represents a unique building block that fits in with the Group structure. During our acquisition process, we assess new busi-nesses in order to identify new building blocks that fill the gaps we have, or that can strengthen our existing companies.
Market-leading niche positionsAddtech strives to be market-leading and active in carefully selected niches with high levels of knowledge and technolo-gy. Our customers are seeking carefully selected solutions, sub-systems or prod-ucts, often in small or medium-sized vol-umes. We customise and sell solutions to our customers in partnership with select-ed suppliers. The market-leading position is important to achieve stable growth and profitability.
Operating mobility - flexibility and active ownershipOperational mobility is characterised by a flexible organisation with solution-orient-ed, innovative employees who recognise
and take full advantage of new business opportunities. Through active ownership of our companies, we can merge or sep-arate whole or parts of businesses. That way, we can fully develop the growth po-tential of the individual subsidiary or seg-ment. Operational mobility also requires us to have effective processes for inte-grating new companies into the Group.
Growth through acquisitionsAddtech is constantly growing through acquisitions of independent technology companies with market-leading niche po-sitions. This makes it possible to comple-ment business areas through new market segments in niches where we see the right conditions for gaining market lead-ership. Business units can expand and build market and/or product positions in selected market segments. We also make small bolt-on acquisitions that may serve to strengthen the market positions of our existing companies.
SUCCESS FACTORSAddtech was listed in 2001, and has since then performed well both in terms of sales and profitability. Profitable growth

KAPITEL
9ADDTECH ANNUAL REPORT 2017/2018
Leading value-adding tech provider
Profit growth 15% P/WC 45%
Market-leading niche-positions
Operating mobility – flexibility & active ownership
Growth through acquisitions
Simplicity, Efficiency, Change Responsibility & Freedom
Addtech offers high-tech products and solutions to companies in the manufacturing and infrastructure sectors. Addtech provides both technological and financial added value by being a capable business partner for customers and manufacturers.
DEVE
LOPM
ENT
PLAN
WE STEER TOWARDS THE VISIONAs a Group-wide guiding principle, our vision directs how we should act in var-ious situations.
VISION, BUSINESS CONCEPT, GOALS AND STRATEGIES
is achieved through continuous business and organisational development. The fol-lowing are the most important factors be-hind our successful business model.
Competent employeesAddtech’s employees are the absolutely key condition for our success. Our em-ployees represent high business acumen and technical expertise that are continu-ously focused on developing existing and new lines of business. When employees enjoy their work and can develop per-sonally, it is possible to drive up sales of products, solutions and sub-systems. Employees who are creative and decisive can prioritise among their tasks and raise their sights and look forward.
Decentralised organisationAddtech has organised its business on the basis of decentralised responsibili-ty for profitability and earnings. This of-fers good opportunities for combining the flexibility, personality and efficiency of a small company with the resources, networks and long-term approach of a large business. Every company has great
freedom as to which customers it serves, but also has great responsibility to live up to expectations of earnings growth and profitability.
Consistency and strong business cultureAddtech is characterised by a deeply rooted culture based on strategic and consistent acting, good planning, a long-term approach, diligent decision-making and effective implementation. Further-more, Addtech is characterised by strong business acumen, a firm focus on profita-bility and an ethical approach.
53%EBITA/WORKING CAPITAL
17%PROFIT GROWTH
” Financial stability and strength are a prerequisite
to invest in sustainable business development. This
sets requirements that can be summarised in profitability,
growth and development.
10 ADDTECH ANNUAL REPORT 2017/2018
ACQUISITIONS
11ACQUISITIONS
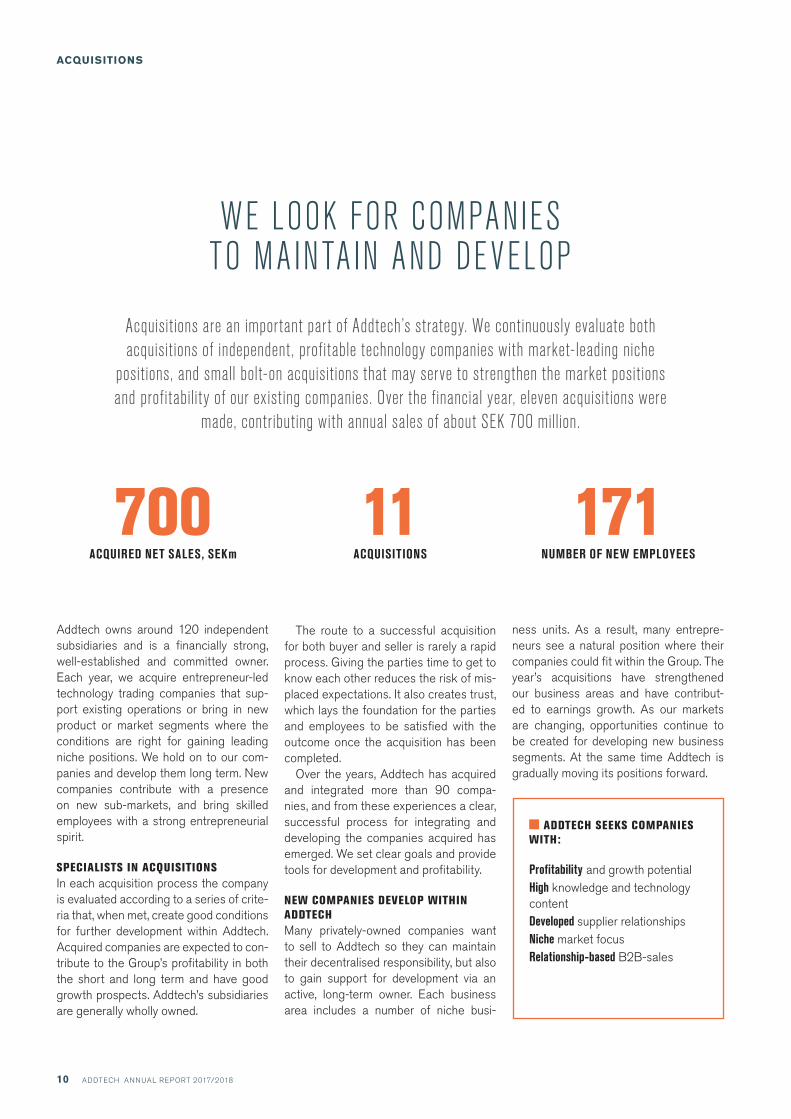
WE LOOK FOR COMPANIES TO MAINTA IN AND DEVELOP
Acquisitions are an impor tant par t of Addtech’s strategy. We continuously evaluate both acquisitions of independent, profitable technology companies with market-leading niche
positions, and small bolt-on acquisitions that may serve to strengthen the market positions and profitability of our existing companies. Over the financial year, eleven acquisitions were
made, contributing with annual sales of about SEK 700 million.
Addtech owns around 120 independent subsidiaries and is a financially strong, well-established and committed owner. Each year, we acquire entrepreneur-led technology trading companies that sup-port existing operations or bring in new product or market segments where the conditions are right for gaining leading niche positions. We hold on to our com-panies and develop them long term. New companies contribute with a presence on new sub-markets, and bring skilled employees with a strong entrepreneurial spirit.
SPECIALISTS IN ACQUISITIONSIn each acquisition process the company is evaluated according to a series of crite-ria that, when met, create good conditions for further development within Addtech. Acquired companies are expected to con-tribute to the Group’s profitability in both the short and long term and have good growth prospects. Addtech’s subsidiaries are generally wholly owned.
The route to a successful acquisition for both buyer and seller is rarely a rapid process. Giving the parties time to get to know each other reduces the risk of mis-placed expectations. It also creates trust, which lays the foundation for the parties and employees to be satisfied with the outcome once the acquisition has been completed.
Over the years, Addtech has acquired and integrated more than 90 compa-nies, and from these experiences a clear, successful process for integrating and developing the companies acquired has emerged. We set clear goals and provide tools for development and profitability.
NEW COMPANIES DEVELOP WITHIN ADDTECHMany privately-owned companies want to sell to Addtech so they can maintain their decentralised responsibility, but also to gain support for development via an active, long-term owner. Each business area includes a number of niche busi-
ADDTECH SEEKS COMPANIES WITH:
Profitability and growth potential High knowledge and technology content Developed supplier relationshipsNiche market focus Relationship-based B2B-sales
700ACQUIRED NET SALES, SEKm
ness units. As a result, many entrepre-neurs see a natural position where their companies could fit within the Group. The year’s acquisitions have strengthened our business areas and have contribut-ed to earnings growth. As our markets are changing, opportunities continue to be created for developing new business segments. At the same time Addtech is gradually moving its positions forward.
171NUMBER OF NEW EMPLOYEES
KAPITELACQUISITIONS
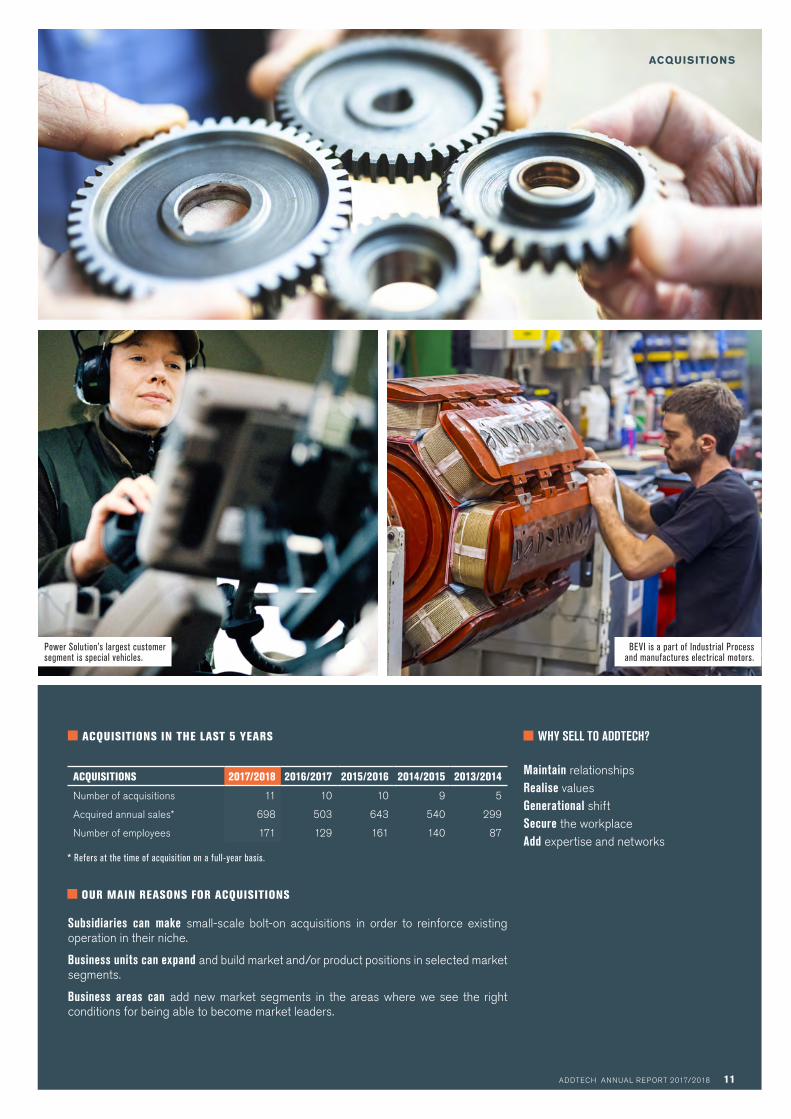
ACQUISITIONS IN THE LAST 5 YEARS
OUR MAIN REASONS FOR ACQUISITIONS
Subsidiaries can make small-scale bolt-on acquisitions in order to reinforce existing operation in their niche.
Business units can expand and build market and/or product positions in selected market segments.
Business areas can add new market segments in the areas where we see the right conditions for being able to become market leaders.
BEVI is a part of Industrial Process and manufactures electrical motors.
Power Solution’s largest customer segment is special vehicles.
ACQUISITIONS 2017/2018 2016/2017 2015/2016 2014/2015 2013/2014
Number of acquisitions 11 10 10 9 5
Acquired annual sales* 698 503 643 540 299
Number of employees 171 129 161 140 87
* Refers at the time of acquisition on a full-year basis.
WHY SELL TO ADDTECH?
Maintain relationships Realise values Generational shift Secure the workplace Add expertise and networks
11ADDTECH ANNUAL REPORT 2017/2018
ORGANISATION
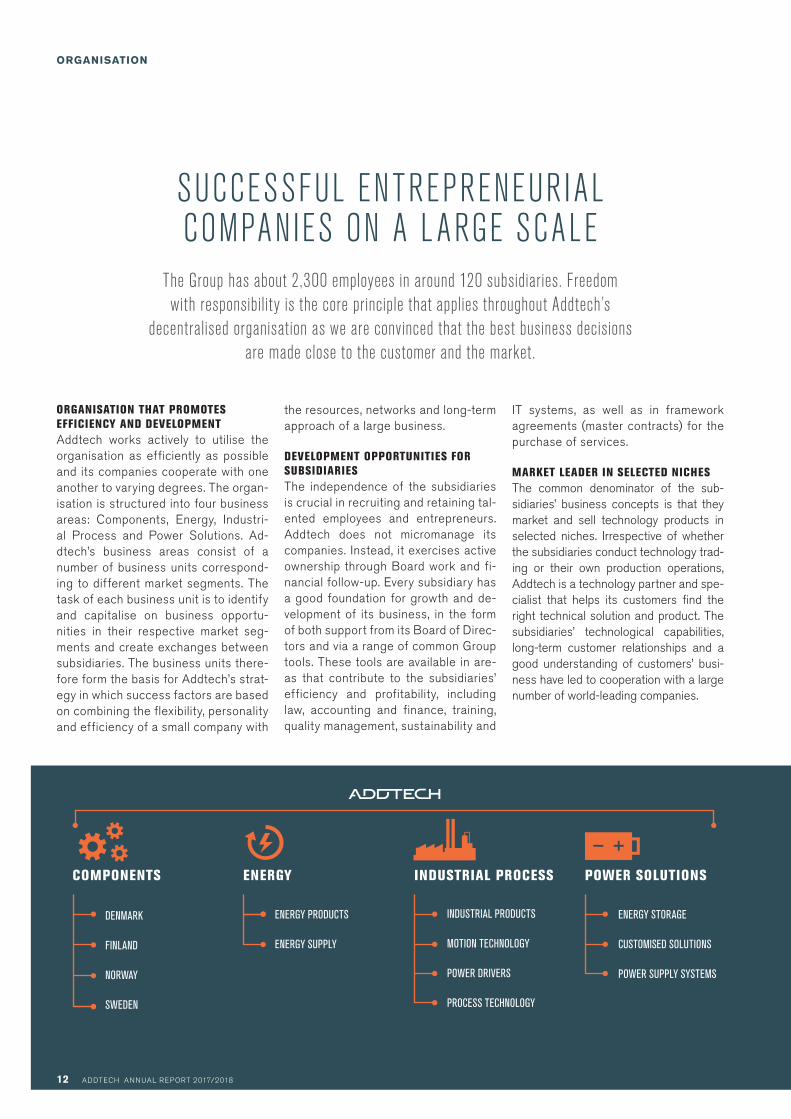
COMPONENTS ENERGY INDUSTRIAL PROCESS POWER SOLUTIONS
DENMARK
FINLAND
NORWAY
SWEDEN
ENERGY PRODUCTS
ENERGY SUPPLY
INDUSTRIAL PRODUCTS
MOTION TECHNOLOGY
POWER DRIVERS
PROCESS TECHNOLOGY
The Group has about 2,300 employees in around 120 subsidiaries. Freedom with responsibility is the core principle that applies throughout Addtech’s
decentralised organisation as we are convinced that the best business decisions are made close to the customer and the market.
ORGANISATION THAT PROMOTES EFFICIENCY AND DEVELOPMENTAddtech works actively to utilise the organisation as efficiently as possible and its companies cooperate with one another to varying degrees. The organ-isation is structured into four business areas: Components, Energy, Industri-al Process and Power Solutions. Ad-dtech’s business areas consist of a number of business units correspond-ing to different market segments. The task of each business unit is to identify and capitalise on business opportu-nities in their respective market seg-ments and create exchanges between subsidiaries. The business units there-fore form the basis for Addtech’s strat-egy in which success factors are based on combining the flexibility, personality and efficiency of a small company with
the resources, networks and long-term approach of a large business.
DEVELOPMENT OPPORTUNITIES FOR SUBSIDIARIESThe independence of the subsidiaries is crucial in recruiting and retaining tal-ented employees and entrepreneurs. Addtech does not micromanage its companies. Instead, it exercises active ownership through Board work and fi-nancial follow-up. Every subsidiary has a good foundation for growth and de-velopment of its business, in the form of both support from its Board of Direc-tors and via a range of common Group tools. These tools are available in are-as that contribute to the subsidiaries’ efficiency and profitability, including law, accounting and finance, training, quality management, sustainability and
SUCCESSFUL ENTREPRENEUR IAL COMPANIES ON A L ARGE SCALE
IT systems, as well as in framework agreements (master contracts) for the purchase of services.
MARKET LEADER IN SELECTED NICHESThe common denominator of the sub-sidiaries’ business concepts is that they market and sell technology products in selected niches. Irrespective of whether the subsidiaries conduct technology trad-ing or their own production operations, Addtech is a technology partner and spe-cialist that helps its customers find the right technical solution and product. The subsidiaries’ technological capabilities, long-term customer relationships and a good understanding of customers’ busi-ness have led to cooperation with a large number of world-leading companies.
ENERGY STORAGE
CUSTOMISED SOLUTIONS
POWER SUPPLY SYSTEMS
12 ADDTECH ANNUAL REPORT 2017/2018
MARKET DRIVERS
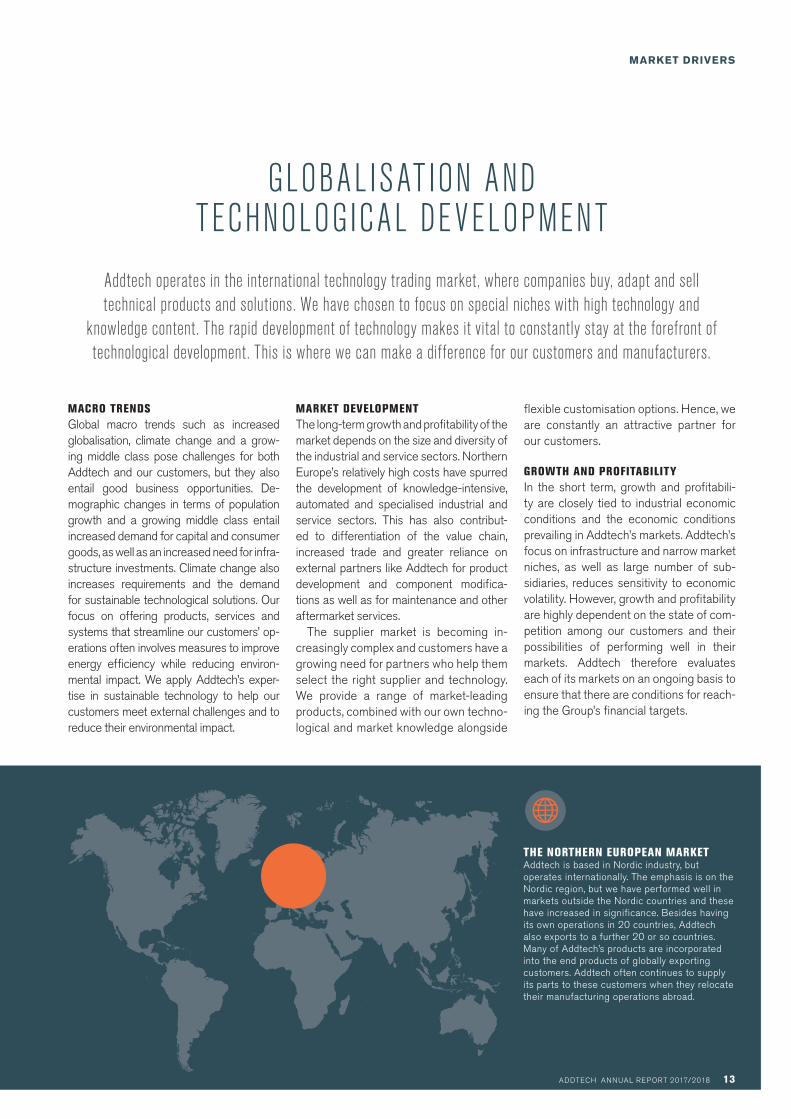
Addtech operates in the international technology trading market, where companies buy, adapt and sell technical products and solutions. We have chosen to focus on special niches with high technology and
knowledge content. The rapid development of technology makes it vital to constantly stay at the forefront of technological development. This is where we can make a difference for our customers and manufacturers.
MACRO TRENDSGlobal macro trends such as increased globalisation, climate change and a grow-ing middle class pose challenges for both Addtech and our customers, but they also entail good business opportunities. De-mographic changes in terms of population growth and a growing middle class entail increased demand for capital and consumer goods, as well as an increased need for infra-structure investments. Climate change also increases requirements and the demand for sustainable technological solutions. Our focus on offering products, services and systems that streamline our customers’ op-erations often involves measures to improve energy efficiency while reducing environ-mental impact. We apply Addtech’s exper-tise in sustainable technology to help our customers meet external challenges and to reduce their environmental impact.
MARKET DEVELOPMENTThe long-term growth and profitability of the market depends on the size and diversity of the industrial and service sectors. Northern Europe’s relatively high costs have spurred the development of knowledge -intensive, automated and specialised industrial and service sectors. This has also contribut-ed to differentiation of the value chain, increased trade and greater reliance on external partners like Addtech for product development and component modifica-tions as well as for maintenance and other aftermarket services.
The supplier market is becoming in-creasingly complex and customers have a growing need for partners who help them select the right supplier and technology. We provide a range of market-leading products, combined with our own techno-logical and market knowledge alongside
GLOBAL ISAT ION AND TECHNOLOGICAL DEVELOPMENT
flexible customisation options. Hence, we are constantly an attractive partner for our customers.
GROWTH AND PROFITABILITYIn the short term, growth and profitabili-ty are closely tied to industrial economic conditions and the economic conditions prevailing in Addtech’s markets. Addtech’s focus on infrastructure and narrow market niches, as well as large number of sub-sidiaries, reduces sensitivity to economic volatility. However, growth and profitability are highly dependent on the state of com-petition among our customers and their possibilities of performing well in their markets. Addtech therefore evaluates each of its markets on an ongoing basis to ensure that there are conditions for reach-ing the Group’s financial targets.
THE NORTHERN EUROPEAN MARKETAddtech is based in Nordic industry, but operates internationally. The emphasis is on the Nordic region, but we have performed well in markets outside the Nordic countries and these have increased in significance. Besides having its own operations in 20 countries, Addtech also exports to a further 20 or so countries. Many of Addtech’s products are incorporated into the end products of globally exporting customers. Addtech often continues to supply its parts to these customers when they relocate their manufacturing operations abroad.
13ADDTECH ANNUAL REPORT 2017/2018

14 ADDTECH ANNUAL REPORT 2017/2018
Components markets and sells components and sub-systems in mechanics, electromechanics, hydraulics and electronics as well as automation solutions and industrial IT. Its customers mainly operate in the Nordic manufacturing industry.
COMPONENTS
OPERATIONSComponents focuses on technology trading with components and for more complex customer needs, solutions are offered that may be a combination of components and subsystems. Companies in the business area strive continuously to increase the added value in their offering. Products and solutions are often custom-ised in collaboration with the customer and supplier.
MARKETThe business area holds a strong mar-ket position in the Nordics. A local base combined with high levels of technical ex-pertise provide the companies with com-petitive advantages in their respective niche markets. Major customer segments include OEM applications within manu-facturing industries, energy, electronics industry and special vehicles. Demand
tracks developments in the manufac-turing industry. Competition is tough for standard products in large volumes. Seg-ments with medium volumes, which com-prise our focus, prioritise service, custo-misation and delivery capacity. Long-term relationships with leading global suppliers are essential and a high priority.
Building & installation 5%
Data & telecommunication 5%
Electronics 14%
Energy 12%
Vehicle 11%
Medical technology 6%
Mechanical industry 26%
Forestry & process 6%
Other 15%
COMPONENTS NET SALES, GEOGRAPHIC MARKET
COMPONENTS NET SALES, CUSTOMER SEGMENT
Sweden 32%
Denmark 22%
Finland 18%
Norway 12%
Other 16%
OUR BUSINESS AREAS
15ADDTECH ANNUAL REPORT 2017/2018
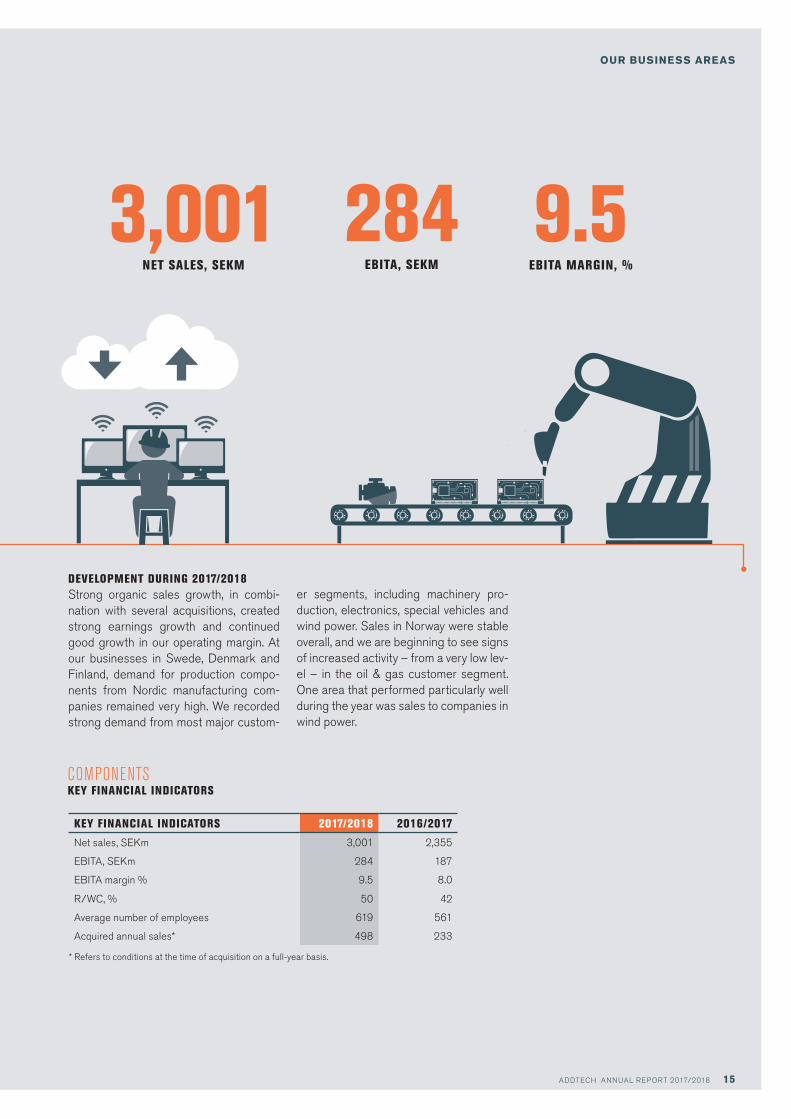
9.5EBITA MARGIN, %
284EBITA, SEKM
3,001NET SALES, SEKM
DEVELOPMENT DURING 2017/2018Strong organic sales growth, in combi-nation with several acquisitions, created strong earnings growth and continued good growth in our operating margin. At our businesses in Swede, Denmark and Finland, demand for production compo-nents from Nordic manufacturing com-panies remained very high. We recorded strong demand from most major custom-
KEY FINANCIAL INDICATORS 2017/2018 2016/2017
Net sales, SEKm 3,001 2,355
EBITA, SEKm 284 187
EBITA margin % 9.5 8.0
R/WC, % 50 42
Average number of employees 619 561
Acquired annual sales* 498 233
* Refers to conditions at the time of acquisition on a full-year basis.
er segments, including machinery pro-duction, electronics, special vehicles and wind power. Sales in Norway were stable overall, and we are beginning to see signs of increased activity – from a very low lev-el – in the oil & gas customer segment. One area that performed particularly well during the year was sales to companies in wind power.
COMPONENTS KEY FINANCIAL INDICATORS
OUR BUSINESS AREAS

16 ADDTECH ANNUAL REPORT 2017/2018
Energy markets and sells products for the transmission and distribution of electricity and products in electrical safety, electrical installation and connection technology.
Its customers mainly operate in the energy and electrical installation market.
ENERGY
OPERATIONSEnergy focuses on the markets for electri-cal power distribution and electrical instal-lation, as well as products and solutions in electrical safety, energy efficiency and connection technology. Companies also carry out the customisation of standard components and solutions for products, primarily in electric power transmission.
Building & installation 26%
Data & telecommunication 3%
Electronics 4%
Energy 46%
Vehicle 2%
Medical technology 0%
Mechanical industry 6%
Forestry & process 4%
Other 9%
MARKETEnergy’s companies hold leading market positions in their respective niche areas in electrical power products and electri-cal safety. In addition to trading, several companies also manufacture niche prod-ucts under their own brands. Demand in the energy market is relatively stable and is affected by the electricity companies’ investment rate. Energy’s subsidiaries
also offer aftermarket services such as education, service and support, which generates both long-term customer rela-tionships and current income.
ENERGY NET SALES, GEOGRAPHIC MARKET
ENERGY NET SALES, CUSTOMER SEGMENT
Sweden 32%
Denmark 12%
Finland 8%
Norway 26%
Other 22%
OUR BUSINESS AREAS

17ADDTECH ANNUAL REPORT 2017/2018
11.7EBITA MARGIN, %
215EBITA, SEKM
1,846NET SALES, SEKM
DEVELOPMENT DURING 2017/2018Sales of infrastructure products to the primary and regional grids in the Nor-dic region were stable overall during the year. Appetite for investment is keen and, given the intensified competition we noted during the year, we are focusing on business deals offering a good busi-ness margin. To Addtech companies op-erating in the area of niche products for power distribution, the market situation
KEY FINANCIAL INDICATORS 2017/2018 2016/2017
Net sales, SEKm 1,846 1,807
EBITA, SEKm 215 225
EBITA margin % 11.7 12.5
R/WC, % 59 69
Average number of employees 583 585
Acquired annual sales* 40 100
* Refers to conditions at the time of acquisition on a full-year basis.
ENERGY KEY FINANCIAL INDICATORS
varies but is relatively stable overall.Sales in the electrical installation and
electrical safety sectors include products with an important role in renovation and new-building, such as fuses, cable ducts and presence and movement detectors, as well as professional lighting. With a contin-ued high tempo in the construction and in-stallation sector, demand for Energy’s com-panies remained stable.
OUR BUSINESS AREAS
18 ADDTECH ANNUAL REPORT 2017/2018
OUR BUSINESS AREAS
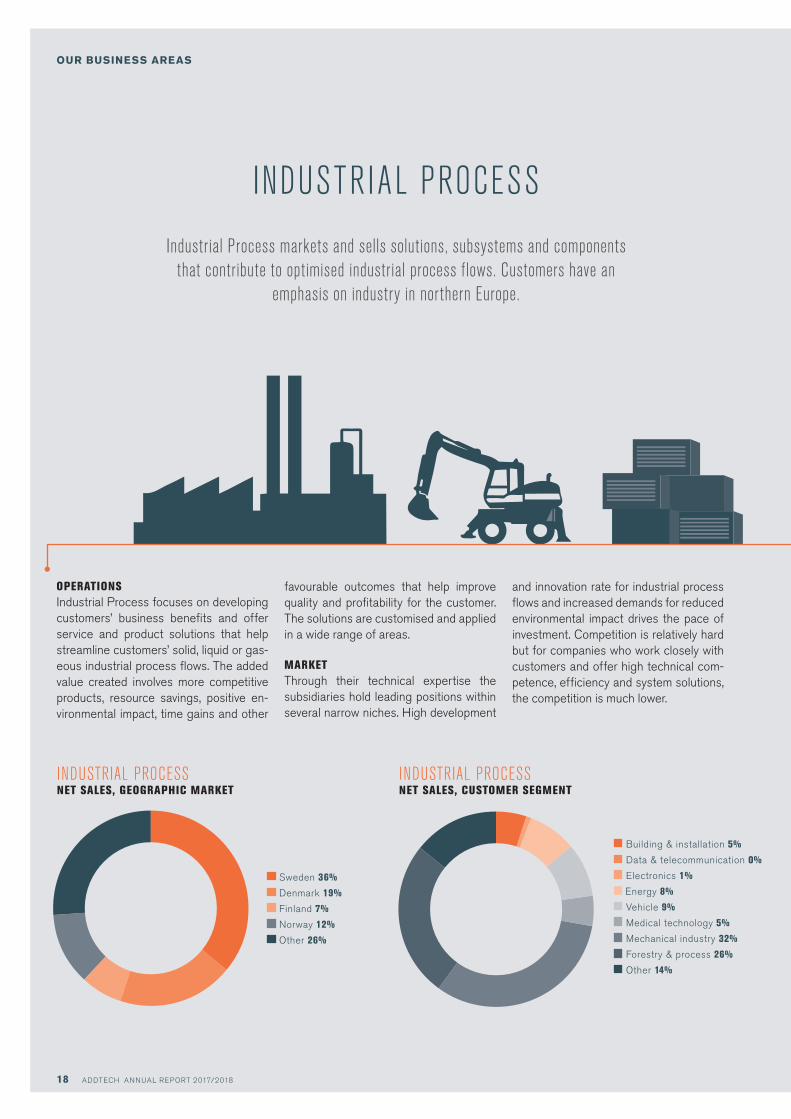
Industrial Process markets and sells solutions, subsystems and components that contribute to optimised industrial process flows. Customers have an
emphasis on industry in nor thern Europe.
INDUSTR IAL PROCESS
OPERATIONSIndustrial Process focuses on developing customers’ business benefits and offer service and product solutions that help streamline customers’ solid, liquid or gas-eous industrial process flows. The added value created involves more competitive products, resource savings, positive en-vironmental impact, time gains and other
favourable outcomes that help improve quality and profitability for the customer. The solutions are customised and applied in a wide range of areas.
MARKETThrough their technical expertise the subsidiaries hold leading positions within several narrow niches. High development
and innovation rate for industrial process flows and increased demands for reduced environmental impact drives the pace of investment. Competition is relatively hard but for companies who work closely with customers and offer high technical com-petence, efficiency and system solutions, the competition is much lower.
Building & installation 5%
Data & telecommunication 0%
Electronics 1%
Energy 8%
Vehicle 9%
Medical technology 5%
Mechanical industry 32%
Forestry & process 26%
Other 14%
INDUSTRIAL PROCESS NET SALES, GEOGRAPHIC MARKET
INDUSTRIAL PROCESS NET SALES, CUSTOMER SEGMENT
Sweden 36%
Denmark 19%
Finland 7%
Norway 12%
Other 26%

19ADDTECH ANNUAL REPORT 2017/2018
OUR BUSINESS AREAS
8.5 EBITA MARGIN, %
142EBITA, SEKM
1,677NET SALES, SEKM
DEVELOPMENT DURING 2017/2018Good organic growth, combined with a successful efficiency drive produced strong growth in earnings and a clear im-provement in operating margin. Sales to the manufacturing industry continued to show positive growth for the year, espe-cially in customer segments such as the mechanical industry and special vehicles.
Demand from customers also continued to grow within the processing industry and the ship supply market.
One sector where the business area expanded strongly during the year was sales of measurement systems for ships. With new environmental regulations im-posing stricter demands on emissions from ships, investments in e.g. measure-
KEY FINANCIAL INDICATORS 2017/2018 2016/2017
Net sales, SEKm 1,677 1,585
EBITA, SEKm 142 125
EBITA margin % 8.5 7.9
R/WC, % 40 38
Average number of employees 642 639
Acquired annual sales* - 110
* Refers to conditions at the time of acquisition on a full-year basis.
ment equipment rises. Increased need for inspection and analysis of e.g. fuel consumption and purity and composition of discharged process water will affect not just the marine sector, but also indus-tries such as the paper, energy, chemical and pharmaceutical industries.
INDUSTRIAL PROCESS KEY FINANCIAL INDICATORS
20 ADDTECH ANNUAL REPORT 2017/2018
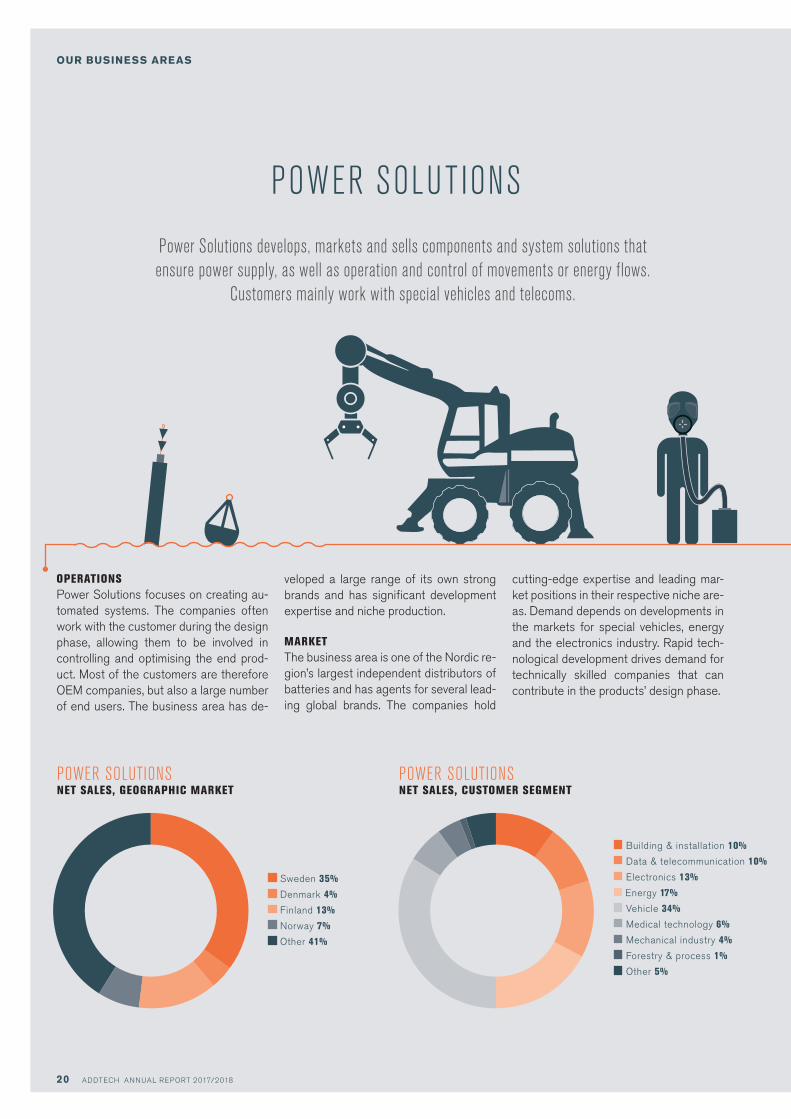
Power Solutions develops, markets and sells components and system solutions that ensure power supply, as well as operation and control of movements or energy flows.
Customers mainly work with special vehicles and telecoms.
POWER SOLUT IONS
OPERATIONSPower Solutions focuses on creating au-tomated systems. The companies often work with the customer during the design phase, allowing them to be involved in controlling and optimising the end prod-uct. Most of the customers are therefore OEM companies, but also a large number of end users. The business area has de-
veloped a large range of its own strong brands and has significant development expertise and niche production.
MARKETThe business area is one of the Nordic re-gion’s largest independent distributors of batteries and has agents for several lead-ing global brands. The companies hold
cutting-edge expertise and leading mar-ket positions in their respective niche are-as. Demand depends on developments in the markets for special vehicles, energy and the electronics industry. Rapid tech-nological development drives demand for technically skilled companies that can contribute in the products’ design phase.
Building & installation 10%
Data & telecommunication 10%
Electronics 13%
Energy 17%
Vehicle 34%
Medical technology 6%
Mechanical industry 4%
Forestry & process 1%
Other 5%
POWER SOLUTIONS NET SALES, GEOGRAPHIC MARKET
POWER SOLUTIONS NET SALES, CUSTOMER SEGMENT
Sweden 35%
Denmark 4%
Finland 13%
Norway 7%
Other 41%
OUR BUSINESS AREAS

21ADDTECH ANNUAL REPORT 2017/2018
13.1EBITA MARGIN, %
198EBITA, SEKM
1,510NET SALES, SEKM
DEVELOPMENT DURING 2017/2018Business conditions continued to vary from one customer to another and among product segments, but overall demand was stable during the year. The biggest customer segment in the business area, special vehicles, showed high demand, and we increased sales of control and er-gonomics products. The market for new types of battery technology developed
KEY FINANCIAL INDICATORS 2017/2018 2016/2017
Net sales, SEKm 1,510 1,439
EBITA, SEKm 198 187
EBITA margin % 13.1 13.0
R/WC, % 64 72
Average number of employees 397 305
Acquired annual sales* 160 60
* Refers to conditions at the time of acquisition on a full-year basis.
strongly, while demand for traditional battery solutions declined. In the tele-com and wind power customer segments, business conditions remained weak, whereas demand from electronics-based customers increased.
The strongest increase in demand during the year came from manufac-turers of special vehicles, in segments such as forklift trucks and mining and
forestry machinery. In pace with the growing need for raw materials, and as more and more goods are being shipped worldwide and logistics management is taking on an increasingly important role, the need for modern special vehicles is also on the rise. Many such vehicles use systems solutions and products from Power Solutions.
POWER SOLUTIONS KEY FINANCIAL INDICATORS
OUR BUSINESS AREAS

KAPITEL
WE ENGAGE IN SUSTA INABLE DEVELOPMENT
Addtech’s vision is to be the leading value-adding tech provider. The vision entails a long-term focus on developing the business by constantly being a value-adding knowledge provider. To achieve that vision we must run our business sustainably. Addtech aims to meet the sustainability requirements and expectations
set by customers, shareholders and employees and to promote sustainable technological development.
We take long-term responsibility for sus-tainable development of profitability, em-ployees and the environment. Global and local demand for lower emissions and greater sustainability in society are mak-ing sustainable products and solutions into a competitive asset in the technolo-gy trading market. We aim to be a better choice than our competitors and focus actively on meeting this demand. With a structured sustainability programme, we are developing the business to make it
both stronger and more sustainable, for example by highlighting the potential for savings and improvements, as well as the risks. We are also meeting this demand by ensuring that our companies are commit-ted to developing and offering solutions that increase customers’ energy efficien-cy and reduce their negative environmen-tal impact. By continuing to develop sus-tainable solutions for our customers, we increase our competitiveness while help-ing to bring about a sustainable society.
SUSTAINABILITY REPORT
Purpose and objective of the reportThe purpose of this sustainability report is to describe in a transparent way Addtech’s objectives, strategies and governance, as well as its accountability, risks and oppor-tunities from a sustainability perspective. The report is intended to provide custom-ers, employees and shareholders with an understanding and knowledge of our sus-tainability work.
ABOUT THE SUSTAINABILITY REPORTPages 22-31 and 38-40 constitute Addtech’s statutory sustainability report. Sustainability Report 2017/2018 has been produced in accordance with the Global Reporting Initiatives (GRI) guidelines. The GRI index is available at www.addtech.se.
22 ADDTECH ANNUAL REPORT 2017/2018

KAPITEL
ADDTECH ANNUAL REPORT 2017/2018 23
SUSTAINABILITY REPORT
DIALOGUE WITH STAKEHOLDERS CREATES THE RIGHT FOCUS FOR SUSTAINABILITY WORKOur sustainability work is affected by the fact that a number of stakeholders make demands and have expectations of us. Dealing with existing demands and planning ahead for anticipated demands is a fundamental part of our strategy for sustainable development. Our stakeholders are groups in our vicinity who affect or are affected by our opera-tions. We strive to maintain an open dialogue with our stakeholders so we can focus our efforts on the sustainability issues that our stakeholders see as most important. We have identified five important stakeholder groups: customers, suppliers, employ-ees, shareholders and society.
In 2016/2017, we conducted a new stakeholder dialogue to ensure that we are working and reporting on the areas that are most important to our business and our stakeholders. Via surveys and interviews, we put a number of questions to a selection of our stake-holders about their expectations of our sustainabil-ity work. The stakeholders questioned were major customers and owners, analysts and a selection of employees and Board members. The stakeholder di-alogue revealed that our strengthened commitment within sustainability is valued but also that demands are increasing for continued engagement in the area.
SIGNIFICANT ISSUES AND RISKSThe findings from the stakeholder analysis revealed the most highly prioritised areas in sustainabili-ty were to create and deliver profitable growth, to reduce our negative impact on the environment, to maintain a high standard of business ethics and to provide a healthy workplace. The table below shows the work we performed in these areas over the fi-nancial year. In the materiality analysis, we weighed up the stakeholders’ observations against the risks and opportunities that are specific to us. The risks are described further on pages 38-40.
SIGN
IFIC
ANCE
TO
STAK
EHOL
DERS
SIGNIFICANCE TO ADDTECH AND ABILITY TO INFLUENCE
CO2 emissions
Life cycle analysis
Business ethics/Anti-corruption Responsibility for suppliersEmployee health & safetyEducation & training
Return to shareholders Customer satisfactionEarnings growth
Energy consumption
Waste management
Reduce amount of transports
Human rights Working environmentDiversity & equality
Transparency
Innovation
MOR
ELE
SS
MOR EL E S S
MATERIALITY ANALYSIS
Social value added
Economic value added
Environmental value added
STAKEHOLDERS KEY QUESTIONS WITHIN SUSTAINABILITY COMMUNICATION AND COLLABORATION
EMPLOYEES Health and safety for employees, education & training, customer satisfaction, earnings growth, good working conditions at suppliers
Regular employee surveys, annual performance and goals reviews, as well as education and training. Com-munication is mainly conducted via managers, the intranet and mailings.
CUSTOMERS Customer satisfaction, innovation, business ethics, environmental impact
The subsidiaries have a close relationship with their customers and have regular personal meetings. Information is distributed thorugh subsidiaries or on the website.
SHAREHOLDERS Earnings growth, business ethics, return to shareholders, customer satisfaction
Annual reports, quarterly reports, investor and analyst meetings, the website and the annual general meeting.
SUPPLIERS Business ethics, customer satis-faction
The subsidiaries work closely with their suppliers, which enables a close dialogue. Supplier evaluations are conducted.
SOCIETY Business ethics, environmental impact
Subsidiaries collaborate with local organisations to improve the local environment. Questions regarding working environment, environment and product liability are discussed with relevant authorities. Certifica-tion body for ISO etc.
SUSTAINABILITY AREAS PRIORITY AREAS ACTIVITIES DURING THE FISCAL YEAR
ECONOMIC VALUE ADDED
Long-term profitable growth Efficiency initiatives, earnings growth, higher operating margin
ENVIRONMENTAL VALUE ADDED
Continuously reduce our direct and indirect environmental impact
Power usage audit, emission moni-toring, development of environmen-tal policy
SOCIAL VALUE ADDED
Maintain high quality and a high ethical level for ourselves and our suppliers
Development of code of conduct for both the company and its suppliers. Development of supplier evaluations
A healthy workplace where em-ployees thrive and grow
Systematic work environment development in subsidiaries, educa-tion and training, employee surveys, relevant actions

24 ADDTECH ANNUAL REPORT 2017/2018
SUSTAINABILITY REPORT
Sustainability is an important part of our strategy and the aim is that sustainability should be taken into account in all strategic decisions within the organisation. We have divided
our sustainability work into three categories: economic, social and environmental value added. In each area, we have a number of strategies, policies and objectives.
S TR ATEGY AND GOVERNANCE
SUSTAINABLE GOVERNANCE WITH DECENTRALISED RESPONSIBILITYAddtech’s sustainability work is in the first instance governed by our Code of Conduct. Addtech’s Board of Directors, via Group management, is ultimately re-sponsible for the Group’s sus-tainability work. Group man-agement determines long-term overarching goals in important areas. These are supplemented by goals and action plans devel-oped by each business area for their companies. In line with our well- established corporate cul-ture, our operational sustaina-bility work is driven via a system of decentralised responsibilities in our companies. Addtech does not micromanage its companies
and instead exercises active ownership through its Board of Directors and follow-up. The Codes of Conduct have been adopted by the Board of Direc-tors and are available on our website at www.addtech.se.
FOLLOW-UP AND ACTIONSAddtech actively assesses its own operations and those of its suppliers. Every year, our companies report on their own sustainability work and on the results of supplier reviews performed. When failures are identified, the companies take the appropriate actions with the support of the Group. Fol-low-up is performed and ac-tions taken at company, busi-ness area and Group level.
Addtech’s Code of ConductAddtech’s Code of Conduct is a foundation for our sustainability work and an integral part of the organisation. Our Code of Con-duct, taken together with our core values (simplicity, efficiency, change, responsibility & freedom), is the basis on which we do business, perform and act in our day-to-day work and in our relationships with the world around us. The Code includes all major issues in human rights, working conditions, corruption, equal opportunity and diversity. The Code is based on the UN’s Global Compact, ILO’s Core Conventions and the OECD Guide-lines for Multinational Enterprises and applies to all companies and all employees. The Board of Directors has decided on the Code of Conduct, which is published on www.addtech.se
ADDTECH IN THE VALUE CHAIN AND OUR BUSINESS MODELAddtech’s business con-cept is to offer high-tech-nology products and solu-tions to companies in the manufacturing and infra-structure sectors. Addtech acts as a value-adding link between customers and suppliers. For description of the business model, see page 7.
” Our operational sustainability work is driven, in line with our well-established corporate culture, through decentralised responsibility in our companies.
ADDTECH’S THREE FOCUS AREAS FOR STRATEGIC SUSTAINABILITY WORK
Customer satisfaction | Earnings growth
CO2 emissions | Energy consumption Transports | Sustainable products
ENVIRONMENTAL VALUE ADDED
ECONOMIC VALUE ADDED
Business ethics | Education & training | Diversity & Equality | Health & safety
SOCIAL VALUE ADDED
THREE FOCUS AREAS FOR STRATEGIC SUSTAINABILITYAddtech’s sustainability efforts work together in three categories; econom-ic, social and environmen-tal value creation. Within these areas, we have iden-tified significant sustain-ability areas to focus our work around.
25ADDTECH ANNUAL REPORT 2017/2018
KAPITELSUSTAINABILITY REPORT
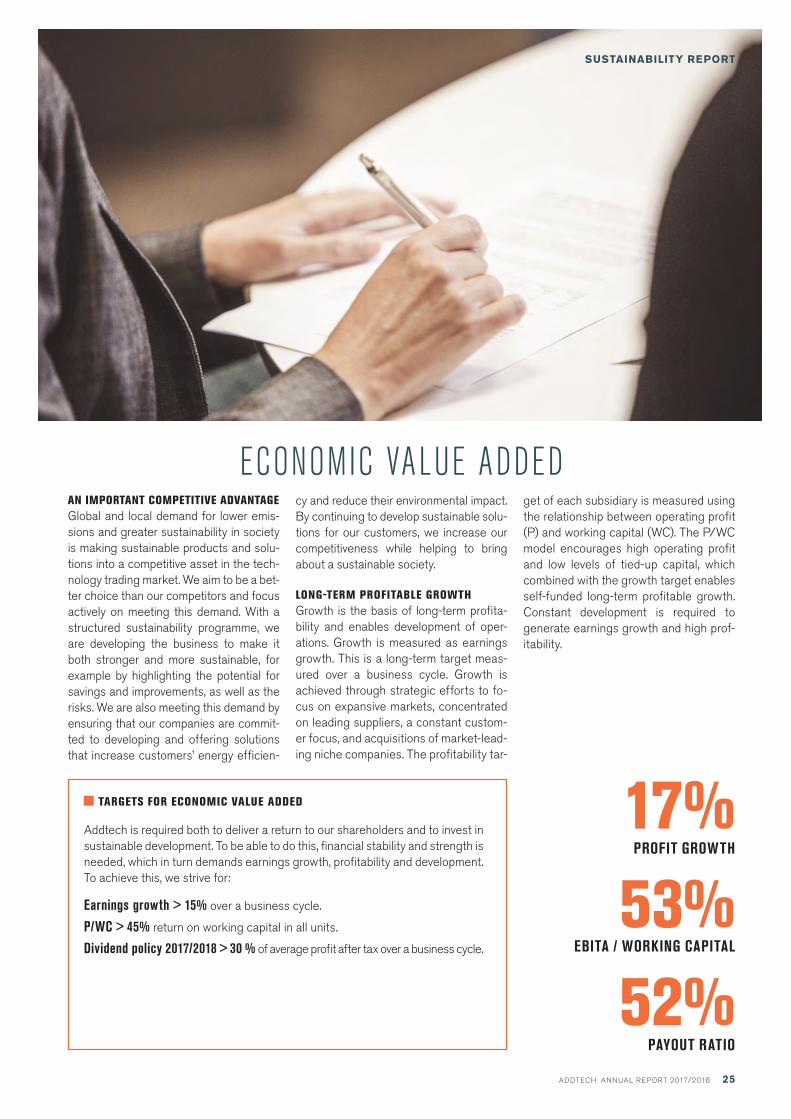
ECONOMIC VALUE ADDEDAN IMPORTANT COMPETITIVE ADVANTAGEGlobal and local demand for lower emis-sions and greater sustainability in society is making sustainable products and solu-tions into a competitive asset in the tech-nology trading market. We aim to be a bet-ter choice than our competitors and focus actively on meeting this demand. With a structured sustainability programme, we are developing the business to make it both stronger and more sustainable, for example by highlighting the potential for savings and improvements, as well as the risks. We are also meeting this demand by ensuring that our companies are commit-ted to developing and offering solutions that increase customers’ energy efficien-
cy and reduce their environmental impact. By continuing to develop sustainable solu-tions for our customers, we increase our competitiveness while helping to bring about a sustainable society.
LONG-TERM PROFITABLE GROWTHGrowth is the basis of long-term profita-bility and enables development of oper-ations. Growth is measured as earnings growth. This is a long-term target meas-ured over a business cycle. Growth is achieved through strategic efforts to fo-cus on expansive markets, concentrated on leading suppliers, a constant custom-er focus, and acquisitions of market-lead-ing niche companies. The profitability tar-
get of each subsidiary is measured using the relationship between operating profit (P) and working capital (WC). The P/WC model encourages high operating profit and low levels of tied-up capital, which combined with the growth target enables self-funded long-term profitable growth. Constant development is required to generate earnings growth and high prof-itability.
TARGETS FOR ECONOMIC VALUE ADDED
Addtech is required both to deliver a return to our shareholders and to invest in sustainable development. To be able to do this, financial stability and strength is needed, which in turn demands earnings growth, profitability and development.To achieve this, we strive for:
Earnings growth > 15% over a business cycle.
P/WC > 45% return on working capital in all units.
Dividend policy 2017/2018 > 30 % of average profit after tax over a business cycle.
17%PROFIT GROWTH
53%EBITA / WORKING CAPITAL
52%PAYOUT RATIO

KAPITEL
26 ADDTECH ANNUAL REPORT 2017/2018
SUSTAINABILITY REPORT
SOCIAL VALUE ADDEDThe key to Addtech’s continuing sustainable business development and success lies in the
long-term relationships we have built with our employees, customers and suppliers. To uphold our good reputation, we must maintain high quality and a high standard of business ethics in
all our under takings. We strive at all times to be a responsible actor.
OUR EMPLOYEES ARE OUR MOST IMPORTANT ASSET Addtech’s employees are our most impor-tant resource and competitive instrument. They drive our business development and contribute to social development. We nur-ture employees’ interests by developing them towards greater responsibility within their own company or in other parts of the Group.
As our employees develop, so we also obtain an internal leadership supply.
Addtech organises its business on the basis of decentralised responsibility for profitability and earnings. This involves a high presence of motivated, creative and decisive employees who can prioritise between work tasks yet lift their eyes and look ahead. In order to succeed in this, Addtech works to maintain an open and positive approach to people, capitalising on the full potential of employees, what-ever their position and level of responsi-bility. We emphasise the importance of taking account of the distinctive charac-ter of each individual employee. It is the very differences that create the dynam-
ics that have made Addtech successful. Our employee philosophy is about being an attractive employer, creating a work-place where employees are happy, devel-oped and proud to work.
Corporate culture that leads the way To measure up to our vision of being the leading value-adding tech provider, we must comply with our corporate culture and core values. We call this Addtech’s soul. Our culture helps our employees re-late to their responsibilities, customers, partners, colleagues and the outside world.
Responsibility and Freedom are two of Addtech’s core values and are summa-rised as “Freedom with responsibility”. This is a central concept within the Group and a key prerequisite to enable subsidiaries and employees to work closely with cus-tomers and suppliers. Our decentralised organisation is based on our conviction that decisions achieve the best results when they are taken close to the market.
Over time, Addtech’s corporate culture has become a deeply anchored root sys-tem that links employees and subsidiaries.
It also paves the way for Addtech’s future, and all employees are trained in the cor-porate philosophy via the Addtech Busi-ness School. In total, there are five core values that should permeate employees’ work. Freedom and responsibility have al-ready been mentioned; the other three are simplicity, efficiency and change.
Employee surveys To monitor our long-term, strategic work on personal development, we regularly conduct employee surveys. That way, we identify the Group’s strengths and weak-nesses as an employer, as well as map-ping areas for improvement.
From a Group perspective, the survey creates the scope for us to offer our com-panies support where we identify general needs, while enabling us to disseminate knowledge and ideas from successful companies around the Group. Addtech’s Group management encourages the CEOs of each Group company to produce an action plan based on the company’s specific findings, as the size and condi-tions of the companies can vary consid-
Addtech’s business school educates all employees in our company philosophy.
KAPITEL
27ADDTECH ANNUAL REPORT 2017/2018
SUSTAINABILITY REPORT
erably. The findings from the employee survey are also used as a basis for our long-term, strategic work on personnel development.
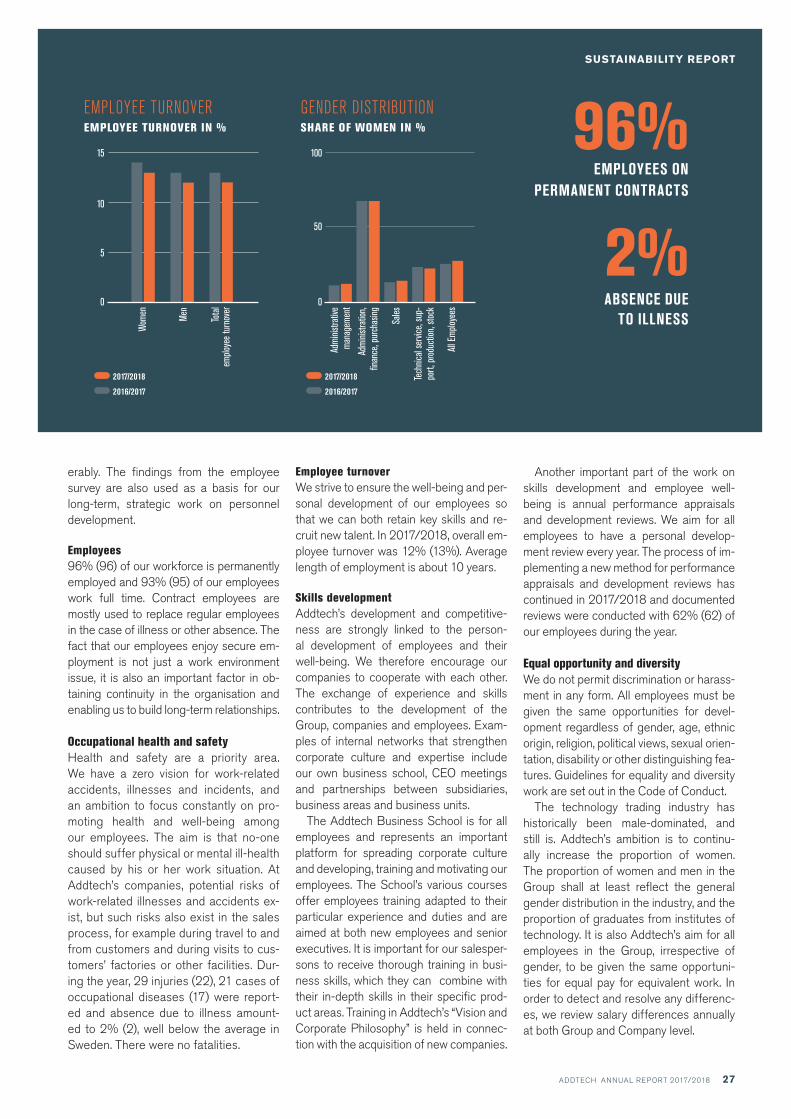
Employees96% (96) of our workforce is permanently employed and 93% (95) of our employees work full time. Contract employees are mostly used to replace regular employees in the case of illness or other absence. The fact that our employees enjoy secure em-ployment is not just a work environment issue, it is also an important factor in ob-taining continuity in the organisation and enabling us to build long-term relationships.
Occupational health and safety Health and safety are a priority area. We have a zero vision for work-related accidents, illnesses and incidents, and an ambition to focus constantly on pro-moting health and well-being among our employees. The aim is that no-one should suffer physical or mental ill-health caused by his or her work situation. At Addtech’s companies, potential risks of work-related illnesses and accidents ex-ist, but such risks also exist in the sales process, for example during travel to and from customers and during visits to cus-tomers’ factories or other facilities. Dur-ing the year, 29 injuries (22), 21 cases of occupational diseases (17) were report-ed and absence due to illness amount-ed to 2% (2), well below the average in Sweden. There were no fatalities.
Employee turnoverWe strive to ensure the well-being and per-sonal development of our employees so that we can both retain key skills and re-cruit new talent. In 2017/2018, overall em-ployee turnover was 12% (13%). Average length of employment is about 10 years.
Skills developmentAddtech’s development and competitive-ness are strongly linked to the person-al development of employees and their well-being. We therefore encourage our companies to cooperate with each other. The exchange of experience and skills contributes to the development of the Group, companies and employees. Exam-ples of internal networks that strengthen corporate culture and expertise include our own business school, CEO meetings and partnerships between subsidiaries, business areas and business units.
The Addtech Business School is for all employees and represents an important platform for spreading corporate culture and developing, training and motivating our employees. The School’s various courses offer employees training adapted to their particular experience and duties and are aimed at both new employees and senior executives. It is important for our salesper-sons to receive thorough training in busi-ness skills, which they can combine with their in-depth skills in their specific prod-uct areas. Training in Addtech’s “Vision and Corporate Philosophy” is held in connec-tion with the acquisition of new companies.
GENDER DISTRIBUTION SHARE OF WOMEN IN % 96%
EMPLOYEES ON PERMANENT CONTRACTS
2%ABSENCE DUE
TO ILLNESS
EMPLOYEE TURNOVER EMPLOYEE TURNOVER IN %
15
10
5
0
Wom
en
Men
Tota
l em
ploye
e tu
rnov
er
Another important part of the work on skills development and employee well- being is annual performance appraisals and development reviews. We aim for all employees to have a personal develop-ment review every year. The process of im-plementing a new method for performance appraisals and development reviews has continued in 2017/2018 and documented reviews were conducted with 62% (62) of our employees during the year.
Equal opportunity and diversityWe do not permit discrimination or harass-ment in any form. All employees must be given the same opportunities for devel-opment regardless of gender, age, ethnic origin, religion, political views, sexual orien-tation, disability or other distinguishing fea-tures. Guidelines for equality and diversity work are set out in the Code of Conduct.
The technology trading industry has historically been male-dominated, and still is. Addtech’s ambition is to continu-ally increase the proportion of women. The proportion of women and men in the Group shall at least reflect the general gender distribution in the industry, and the proportion of graduates from institutes of technology. It is also Addtech’s aim for all employees in the Group, irrespective of gender, to be given the same opportuni-ties for equal pay for equivalent work. In order to detect and resolve any differenc-es, we review salary differences annually at both Group and Company level.
100
50
0
Adm
inistr
ative
m
anag
emen
t
Adm
inistr
ation
, fin
ance
, pur
chas
ing
Sales
Tech
nical
serv
ice, s
up-
port,
pro
duct
ion, s
tock
All E
mplo
yees
2016/2017
2017/2018
2016/2017
2017/2018
ADDTECH ANNUAL REPORT 2017/201828
KAPITEL
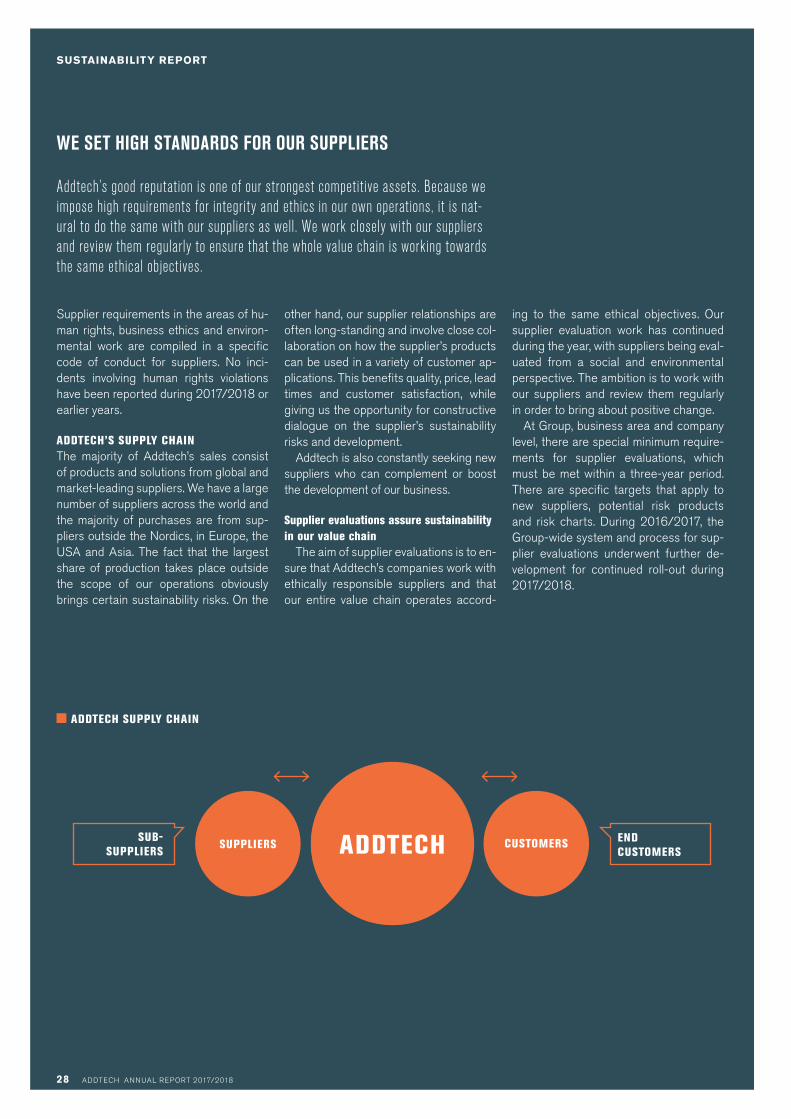
SUPPLIERS CUSTOMERSADDTECH END CUSTOMERS
SUB-SUPPLIERS
SUSTAINABILITY REPORT
WE SET HIGH STANDARDS FOR OUR SUPPLIERS
Addtech’s good reputation is one of our strongest competitive assets. Because we impose high requirements for integrity and ethics in our own operations, it is nat-ural to do the same with our suppliers as well. We work closely with our suppliers and review them regularly to ensure that the whole value chain is working towards the same ethical objectives.
Supplier requirements in the areas of hu-man rights, business ethics and environ-mental work are compiled in a specific code of conduct for suppliers. No inci-dents involving human rights violations have been reported during 2017/2018 or earlier years.
ADDTECH’S SUPPLY CHAINThe majority of Addtech’s sales consist of products and solutions from global and market-leading suppliers. We have a large number of suppliers across the world and the majority of purchases are from sup-pliers outside the Nordics, in Europe, the USA and Asia. The fact that the largest share of production takes place outside the scope of our operations obviously brings certain sustainability risks. On the
other hand, our supplier relationships are often long-standing and involve close col-laboration on how the supplier’s products can be used in a variety of customer ap-plications. This benefits quality, price, lead times and customer satisfaction, while giving us the opportunity for constructive dialogue on the supplier’s sustainability risks and development.
Addtech is also constantly seeking new suppliers who can complement or boost the development of our business.
Supplier evaluations assure sustainability in our value chain
The aim of supplier evaluations is to en-sure that Addtech’s companies work with ethically responsible suppliers and that our entire value chain operates accord-
ing to the same ethical objectives. Our supplier evaluation work has continued during the year, with suppliers being eval-uated from a social and environmental perspective. The ambition is to work with our suppliers and review them regularly in order to bring about positive change.
At Group, business area and company level, there are special minimum require-ments for supplier evaluations, which must be met within a three-year period. There are specific targets that apply to new suppliers, potential risk products and risk charts. During 2016/2017, the Group-wide system and process for sup-plier evaluations underwent further de-velopment for continued roll-out during 2017/2018.
ADDTECH SUPPLY CHAIN

29ADDTECH ANNUAL REPORT 2017/2018
SUSTAINABILITY REPORT
Anti-corruption Business ethics is high on our agenda and is an issue that is continuously addressed in the Addtech Business School and other areas. Guidelines on anti-corruption are set out in the Code of Conduct and the Supplier Code of Conduct. We have a stat-ed policy of zero tolerance for corruption, bribes and unfair anti-competitive practic-es. No cases of corruption were found to have occurred during the year.
Child labourThe UN Convention on the Rights of the Child, the ILO’s Minimum Age Convention (no. 138) concerning Minimum Age for Admission to Employment, and the ILO’s convention (no. 182) concerning the Pro-hibition and Immediate Action for the Elimination of the Worst Forms of Child Labour serve as guidelines for all activi-ties conducted in our name. No incidents involving any breach of these conven-tions were reported during 2017/2018.
Labour lawOur Code of Conduct requires all our companies and suppliers to at least meet the minimum requirements of nation-al legislation in the area of labour law. La-bour law guidelines are set out in our Code of Conduct. Addtech has a zero tol-
TARGETS FOR SOCIAL VALUE ADDED
Addtech shall provide a workplace where employees are happy and develop their capacity. To uphold our good reputation, we must maintain high quality and a high standard of business ethics in all our undertakings. To achieve this, we strive to ensure that:
we have the most satisfied em-ployees in the sector
we offer a workplace that pro-motes diversity and equal oppor-tunity
no employees suffer physical or mental ill-health as a result of their work
all employees, operations and suppliers comply with our Code of Conduct
every year we increase the num-ber of suppliers who have under-gone our supplier evaluation
erance policy on forced labour and works actively to assure itself that there are no breaches of regulations in our operations or our value chain.
OUR ROLE IN SOCIETYAddtech also creates value at society level. We create jobs, advance the development of competitiveness in value-adding technol-ogy trading and contribute via tax payments.Addtech’s companies have strong local roots and their operations are often based in small towns. When making acquisi¬tions, we therefore seek to remain in those loca-tions, nurturing and developing the skills that exist there. Our aim is to contribute to strengthening the community in which we operate by pursuing an invigorating and long-term policy in our business activities. We endeavour to recruit new employees lo-cally and to offer jobs to young people. We want to create the right conditions for local growth by means of active and constructive dialogue with the local community.
TaxesWe play our part in and contribute to our collective prosperity via employer’s social welfare contributions and taxes. Compli-ance with local tax laws and regulations must be observed in all our countries of operation.
30 ADDTECH ANNUAL REPORT 2017/2018
SUSTAINABILITY REPORT
ENV IRONMENTAL VALUE ADDED
Conservation of the environment is an important part of our strategy. The aim is to mini-mise our environmental impact, which means that we focus actively on cutting our carbon dioxide emissions, raising the proportion of renewable energy consumed in our operations
and helping our customers to develop more environmentally-friendly products and solutions.
Addtech’s main business currently con-sists of trading in technology products, which means that a large proportion of our environmental impact comes from transport and warehousing activities. Our own use of raw materials, chemicals and fossil fuels is limited, as most of the ac-tual production process takes place at our suppliers. However, we have decided to assume a degree of responsibility that stretches beyond our own operations, with our Code of Conduct also requiring our suppliers to consider the environment in their production.
The environmental perspective must be part of all important decisions, with a view to creating long-term value for cus-tomers, employees, shareholders and so-ciety at large. Environmental work must be conducted within the scope of our business concept and closely integrated into operational activities. With a high lev-el of expertise among our employees, and constantly development of our knowl-edge of environmental consequences, we can maintain a holistic approach to environmental issues and contribute to improvements within the organisation and among our customers and suppliers. As much of our environmental impact is indirect, we aim to develop more sustain-able products and solutions that help our customers reduce their environmental impact. That way, we can make a differ-ence on a larger scale. During the year,
we did not incur any fines or sanctions for environmental contraventions. During 2017/2018, we have rolled out our up-dated environmental policy in the Group.
CARBON DIOXIDE EMISSIONSAddtech’s main impact on the climate comprises carbon dioxide emissions. Combustion of fossil fuels also produces emissions of other greenhouse gases, but Addtech has concluded that carbon dioxide emissions represent the largest negative environmental impact from our operations.
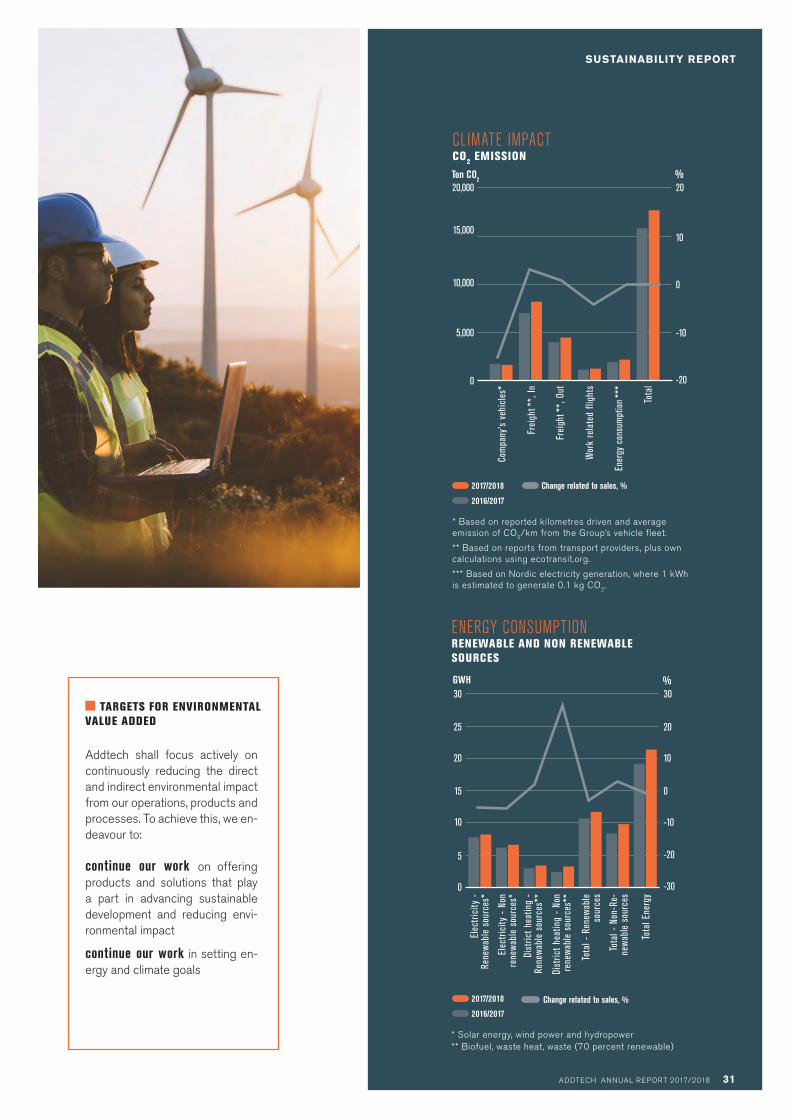
The calculation of carbon dioxide emis-sions arising from electricity generation was based on Nordic electricity genera-tion, where 1 kWh is estimated to gener-ate 0.1 kg CO2. In addition to emissions arising from the internal use of fossil fu-els and electricity, carbon dioxide emis-sions are also generated by various kinds of transport, including transport of mate-rials and products, as well as employee travel. Addtech reports carbon dioxide emissions for employee travel and redun-dant materials and product transport ac-cording to the table below, which shows the Group’s CO2 emissions. We place total carbon dioxide emissions in rela-tion to sales to give a true and fair view of emissions, referred to as an intensity measure for greenhouse gases. The total climate impact for the year amounted to 2.2 tonnes CO2/SEK million.
ENERGY CONSUMPTIONThe Group’s energy analysis is progress-ing according to plan and will be used to identify areas for improvement. At pres-ent, more than half of the electricity that we use comes from renewable sources and our aim is to continue to increase the proportion. Total energy consumption decreased to 21.3 GWH (19.1) during the year. Energy consumption in relation to net sales was 2.66 MWH/SEK million (2.66).
SUPPLIERS AND THE ENVIRONMENT Addtech’s sales of high-technology prod-ucts and solutions have little direct impact on the environment and our indirect en-vironmental impact largely takes place at our suppliers. The objective of our sup-plier evaluations is to obtain an overview of how our suppliers pursue sustainable development. Environmental conserva-tion measures shall be implemented to the extent they are technically feasible, reasonable in terms of business economy and environmentally justified. Suppliers are encouraged to operate in line with our environmental policy. Suppliers are also required to be familiar with and observe requirements laid down by national leg-islation, statutes and industry standards. Suppliers must as a minimum requirement operate a secure system for management of hazardous materials and waste.
ADDTECH ANNUAL REPORT 2017/2018 31
KAPITEL
TARGETS FOR ENVIRONMENTAL VALUE ADDED
Addtech shall focus actively on continuously reducing the direct and indirect environmental impact from our operations, products and processes. To achieve this, we en-deavour to:
continue our work on offering products and solutions that play a part in advancing sustainable development and reducing envi-ronmental impact
continue our work in setting en-ergy and climate goals
ENERGY CONSUMPTIONRENEWABLE AND NON RENEWABLE SOURCES
2016/2017
2017/2018
Elec
tric
ity -
Rene
wabl
e so
urce
s*
0
5
10
15
20
25
30
-30
-20
-10
0
10
20
30
Elec
tric
ity -
Non
re
newa
ble
sour
ces*
Dist
rict h
eatin
g -
Rene
wabl
e so
urce
s**
Dist
rict h
eatin
g -
Non
rene
wabl
e so
urce
s**
Tota
l - R
enew
able
sour
ces
Tota
l - N
on-R
e-ne
wabl
e so
urce
s
Tota
l Ene
rgy
Change related to sales, %
%GWH
* Solar energy, wind power and hydropower** Biofuel, waste heat, waste (70 percent renewable)
SUSTAINABILITY REPORT
CLIMATE IMPACTCO2 EMISSION
2016/2017
2017/2018
Com
pany
’s v
ehic
les*
0
5,000
10,000
20,000
-20
-10
0
10
20
Frei
ght **
, In
Frei
ght **
, Out
Wor
k re
late
d fli
ghts
Ener
gy c
onsu
mpt
ion **
*
Tota
l
Change related to sales, %
%Ton CO2
15,000
* Based on reported kilometres driven and average emission of CO2/km from the Group’s vehicle fleet.
** Based on reports from transport providers, plus own calculations using ecotransit.org.
*** Based on Nordic electricity generation, where 1 kWh is estimated to generate 0.1 kg CO2.
32 ADDTECH ANNUAL REPORT 2017/2018
ADDTECH SHARES
SHARE PRICE TREND AND RETURNThe Addtech shares are listed on Nasdaq OMX Stockholm. Since their listing in September 2001 until 31 March 2018, the total re-turn on the shares until 31 March 2018 has averaged 16 percent per year. The OMX Stockholm index on the Nasdaq OMX Stock-holm Exchange increased by 6 percent in the corresponding period.
The Addtech share increased by 13 percent in value during the financial year. The OMX Stockholm index on the Nasdaq OMX Stockholm Exchange decreased by 1 percent in the cor-
responding period. The highest price paid during the year was SEK 204.00 and was quoted on 22 January 2018. The lowest was SEK 146.50 on 21 August 2017. The final price paid be-fore the end of the financial year was SEK 168.00, correspond-ing to a market value of SEK 10.9 billion (9.6).
During the period 1 April 2017 - 31 March 2018, 13 million (12) shares were traded with an aggregate value of approxi-mately SEK 2 billion (2 billion). Relative to the average number of Class B shares outstanding, this is equivalent to a turno-ver rate of 20 percent (18). A daily average of 50,305 (45,716) Addtech shares were traded at an average value of about SEK 9 million (6).
ADDTECH SHARES
SHARE CAPITALAt 31 March 2017, Parent Company share capital stood at SEK 51.1 million, distributed over the following number of shares with a quotient value of SEK 0.75 per share.
CLASS OF SHARES NUMBER OF SHARES NUMBER OF VOTES PERCENTAGE OF CAPITAL PERCENTAGE OF VOTES
Class A shares, 10 votes per share 3,229,500 32,295,000 4.7 33.2
Class B shares, 1 vote per share 64,968,996 64,968,996 95.3 66.8
Total number of shares before repurchases 68,198,496 97,263,996 100.0 100.0
Of which repurchased class B shares 1,206,145 1.8 1.2
Total number of shares after repurchases 66,992,351
Chapter 6, Section 2a of the Swedish Annual Accounts Act requires listed companies to disclose specific circumstances that may affect the prospects for acquiring the Company via a public share offer. In the event of the Company being delisted from Nasdaq OMX Stockholm or a party other than the present principal shareholder attaining an ownership holding exceeding 50 percent of the capital or votes, the granted credit line in terms of contractual credit facilities of SEK 400 million and overdraft facilities of SEK 1,100 million can be terminated.
REPURCHASE OF TREASURY SHARES AND INCENTIVE PROGRAMMESThe Annual General Meeting in August 2017 authorised the Board of Directors to repurchase a maximum of ten percent of all shares in the Company during the period until the Annual General Meeting in 2018. During the financial year Addtech repurchased 200,000 of its own Class B shares. At year-end the number of treasury
shares was 1,206,145 (1,374,721), with an average purchase price of SEK 92.12 (81.17). These shares correspond to 1.8 percent (2.0) of the number of shares issued and 1.2 percent (1.4) of the votes.
Addtech has four outstanding call option programmes for a total of 1,250,178 shares. Call options issued on repurchased shares entail a dilution effect of about 0.3 percent during the latest 12-month period. Addtech’s own shareholdings fully meet the needs of the outstanding call option programmes.
OUTSTANDING PROGRAMME
NUMBER OF OPTIONS
CORRESPONDING NUMBER OF SHARES
PROPORTION OF TOTAL SHARES
INITIAL EXERCISE PRICE
ADJUSTED EXERCISE PRICE EXPIRATION PERIOD
2017/2021 300,000 300,000 0.4% 178.50 - 14 Sep 2020 - 4 Jun 2021
2016/2020 300,000 300,000 0.4% 159.00 - 16 Sep 2019 - 5 Jun 2020
2015/2019 350,000 430,500 0.6% 154.50 125.10 17 Sep 2018 - 3 Jun 2019
2014/2018 178,600 219,678 0.3% 116.70 94.50 17 Sep 2017 - 1 Jun 2018
Total 1,128,600 1,250,178
33ADDTECH ANNUAL REPORT 2017/2018
ADDTECH SHARES
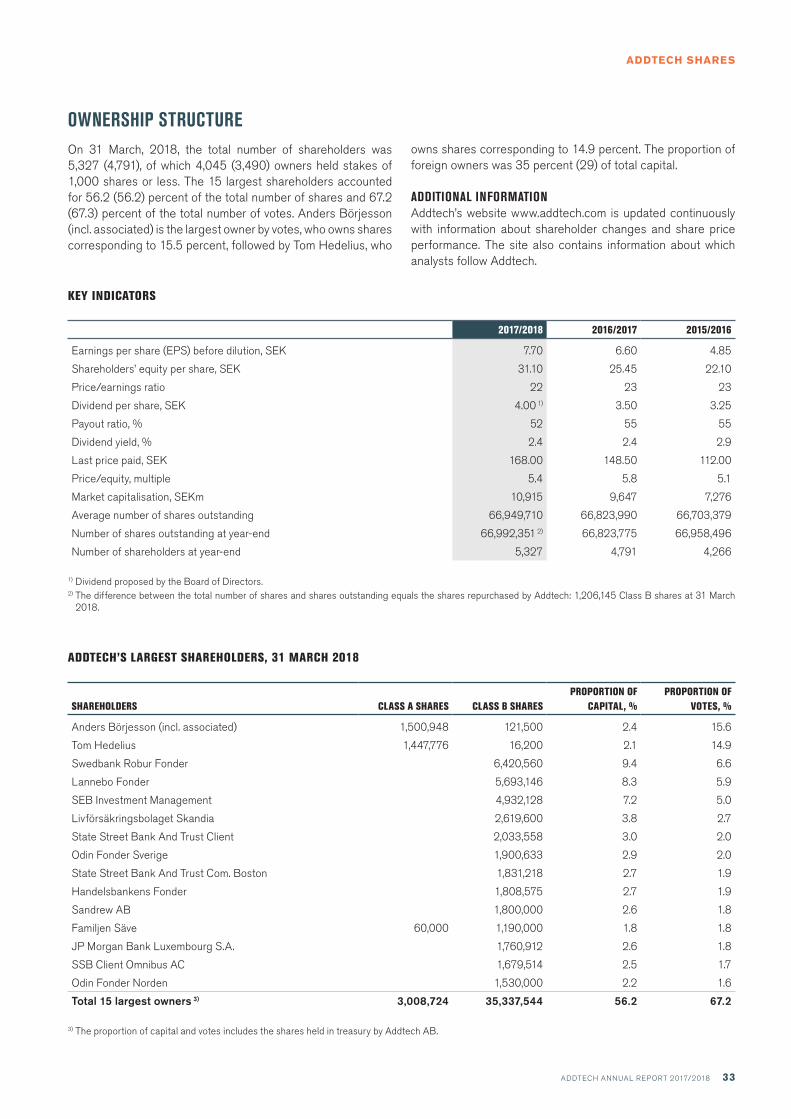
OWNERSHIP STRUCTUREOn 31 March, 2018, the total number of shareholders was 5,327 (4,791), of which 4,045 (3,490) owners held stakes of 1,000 shares or less. The 15 largest shareholders accounted for 56.2 (56.2) percent of the total number of shares and 67.2 (67.3) percent of the total number of votes. Anders Börjesson (incl. associated) is the largest owner by votes, who owns shares corresponding to 15.5 percent, followed by Tom Hedelius, who
owns shares corresponding to 14.9 percent. The proportion of foreign owners was 35 percent (29) of total capital.
ADDITIONAL INFORMATIONAddtech’s website www.addtech.com is updated continuously with information about shareholder changes and share price performance. The site also contains information about which analysts follow Addtech.
KEY INDICATORS
2017/2018 2016/2017 2015/2016
Earnings per share (EPS) before dilution, SEK 7.70 6.60 4.85
Shareholders’ equity per share, SEK 31.10 25.45 22.10
Price/earnings ratio 22 23 23
Dividend per share, SEK 4.00 1) 3.50 3.25
Payout ratio, % 52 55 55
Dividend yield, % 2.4 2.4 2.9
Last price paid, SEK 168.00 148.50 112.00
Price/equity, multiple 5.4 5.8 5.1
Market capitalisation, SEKm 10,915 9,647 7,276
Average number of shares outstanding 66,949,710 66,823,990 66,703,379
Number of shares outstanding at year-end 66,992,351 2) 66,823,775 66,958,496
Number of shareholders at year-end 5,327 4,791 4,266
1) Dividend proposed by the Board of Directors.2) The difference between the total number of shares and shares outstanding equals the shares repurchased by Addtech: 1,206,145 Class B shares at 31 March
2018.
ADDTECH’S LARGEST SHAREHOLDERS, 31 MARCH 2018
SHAREHOLDERS CLASS A SHARES CLASS B SHARESPROPORTION OF
CAPITAL, %PROPORTION OF
VOTES, %
Anders Börjesson (incl. associated) 1,500,948 121,500 2.4 15.6
Tom Hedelius 1,447,776 16,200 2.1 14.9
Swedbank Robur Fonder 6,420,560 9.4 6.6
Lannebo Fonder 5,693,146 8.3 5.9
SEB Investment Management 4,932,128 7.2 5.0
Livförsäkringsbolaget Skandia 2,619,600 3.8 2.7
State Street Bank And Trust Client 2,033,558 3.0 2.0
Odin Fonder Sverige 1,900,633 2.9 2.0
State Street Bank And Trust Com. Boston 1,831,218 2.7 1.9
Handelsbankens Fonder 1,808,575 2.7 1.9
Sandrew AB 1,800,000 2.6 1.8
Familjen Säve 60,000 1,190,000 1.8 1.8
JP Morgan Bank Luxembourg S.A. 1,760,912 2.6 1.8
SSB Client Omnibus AC 1,679,514 2.5 1.7
Odin Fonder Norden 1,530,000 2.2 1.6
Total 15 largest owners 3) 3,008,724 35,337,544 56.2 67.2
3) The proportion of capital and votes includes the shares held in treasury by Addtech AB.
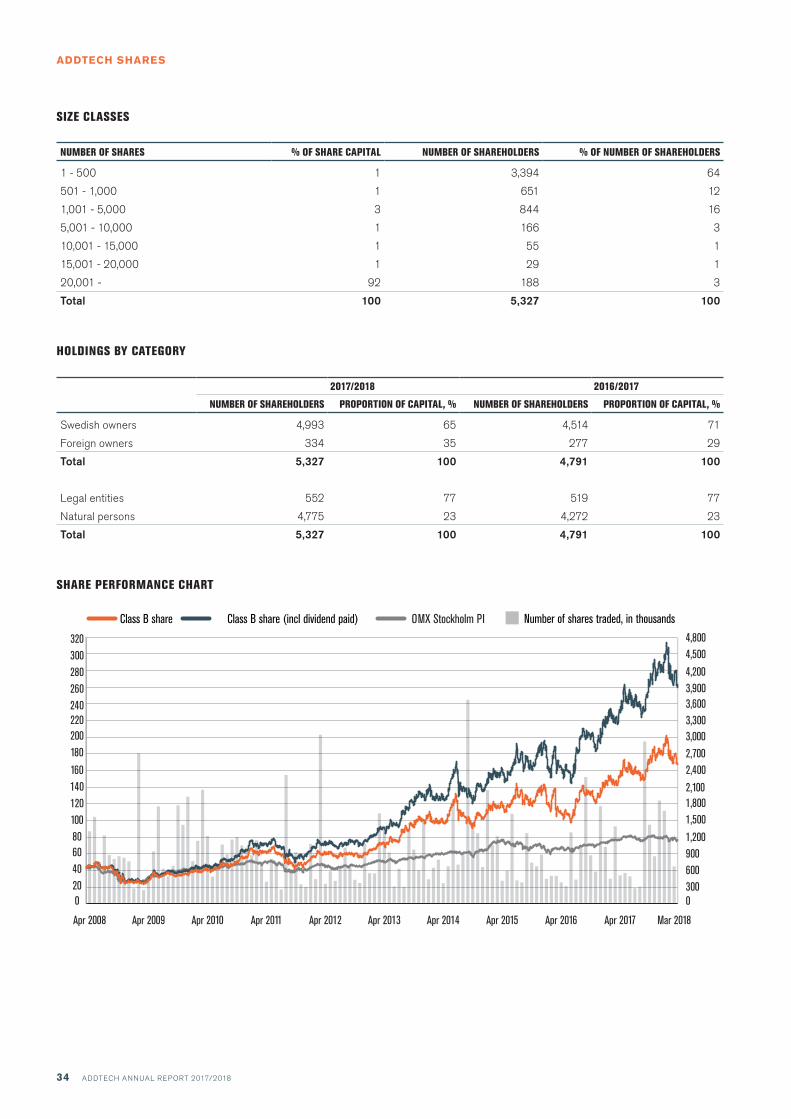
34 ADDTECH ANNUAL REPORT 2017/2018
ADDTECH SHARES
SIZE CLASSES
NUMBER OF SHARES % OF SHARE CAPITAL NUMBER OF SHAREHOLDERS % OF NUMBER OF SHAREHOLDERS
1 - 500 1 3,394 64
501 - 1,000 1 651 12
1,001 - 5,000 3 844 16
5,001 - 10,000 1 166 3
10,001 - 15,000 1 55 1
15,001 - 20,000 1 29 1
20,001 - 92 188 3
Total 100 5,327 100
HOLDINGS BY CATEGORY
2017/2018 2016/2017
NUMBER OF SHAREHOLDERS PROPORTION OF CAPITAL, % NUMBER OF SHAREHOLDERS PROPORTION OF CAPITAL, %
Swedish owners 4,993 65 4,514 71
Foreign owners 334 35 277 29
Total 5,327 100 4,791 100
Legal entities 552 77 519 77
Natural persons 4,775 23 4,272 23
Total 5,327 100 4,791 100
SHARE PERFORMANCE CHART
03006009001,200
1,5001,8002,100
2,4002,7003,0003,3003,6003,9004,200
4,5004,800
Mar 2018Apr 2017Apr 2016Apr 2015Apr 2014Apr 2013Apr 2012Apr 2011Apr 2010Apr 2009Apr 2008
020406080100120140160
180200220240260280300320
Number of shares traded, in thousandsOMX Stockholm PIClass B share (incl dividend paid)Class B share