good practices in antimicrobial use (amu) surveillance the ...amu/amr pilot 2010 amu research...
TRANSCRIPT
Good Practices in Antimicrobial Use (AMU)
Surveillance – the Canadian Experience
Implementing AMU Surveillance
APEC Workshop – Oct. 9, 2018
Santiago, Chile

Things to think about at the beginning…
2

Why do you want data about antimicrobial use?
Generally – it is all about comparisons…
• Is antimicrobial consumption/AMU increasing or decreasing?
• How do we compare to other areas?
• Is antimicrobial consumption/AMU different in different host species?
• What does antimicrobial consumption/AMU mean for resistance?
COMPARISONS CREATE DISCOMFORT!
• Are we sure?
• What are the implications of increasing precision/accuracy?
3

Setting your objectives – Language is important!
Surveillance ≠ Research
4
Types of surveillance
• Active – defined sample frame/protocol
• Passive – “take what you have in place”
• Enhanced passive - specific data collection in addition to passive data
• Continuous vs. periodic/episodic
• Comprehensive vs. sentinel/target site
What type of surveillance best meets your objectives?
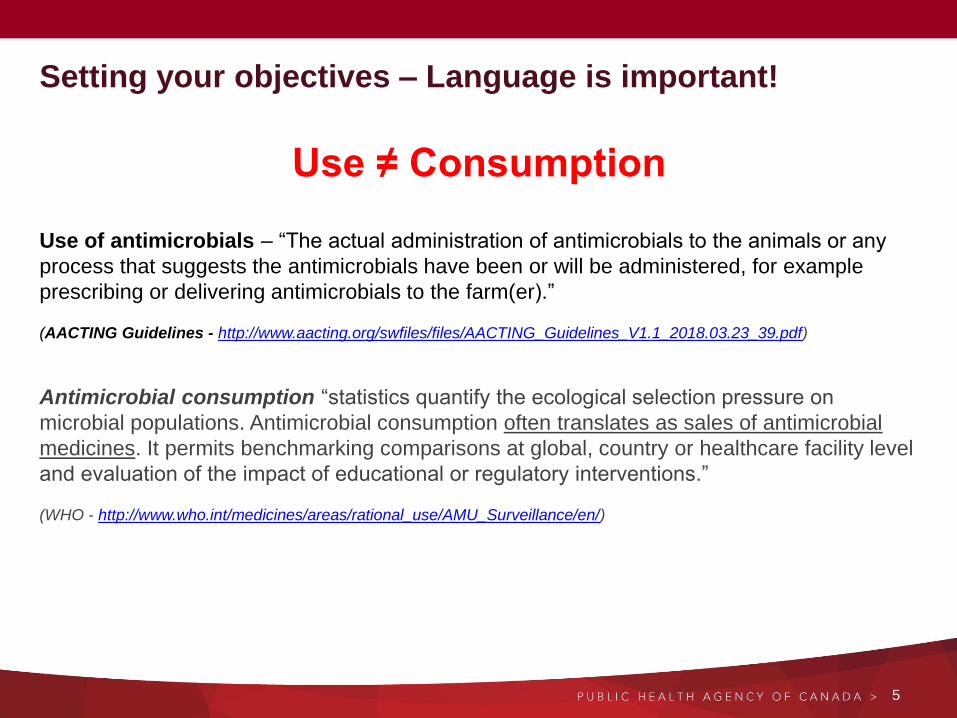
Setting your objectives – Language is important!
Use ≠ Consumption
Use of antimicrobials – “The actual administration of antimicrobials to the animals or any
process that suggests the antimicrobials have been or will be administered, for example
prescribing or delivering antimicrobials to the farm(er).”
(AACTING Guidelines - http://www.aacting.org/swfiles/files/AACTING_Guidelines_V1.1_2018.03.23_39.pdf)
Antimicrobial consumption “statistics quantify the ecological selection pressure on
microbial populations. Antimicrobial consumption often translates as sales of antimicrobial
medicines. It permits benchmarking comparisons at global, country or healthcare facility level
and evaluation of the impact of educational or regulatory interventions.”
(WHO - http://www.who.int/medicines/areas/rational_use/AMU_Surveillance/en/)
5
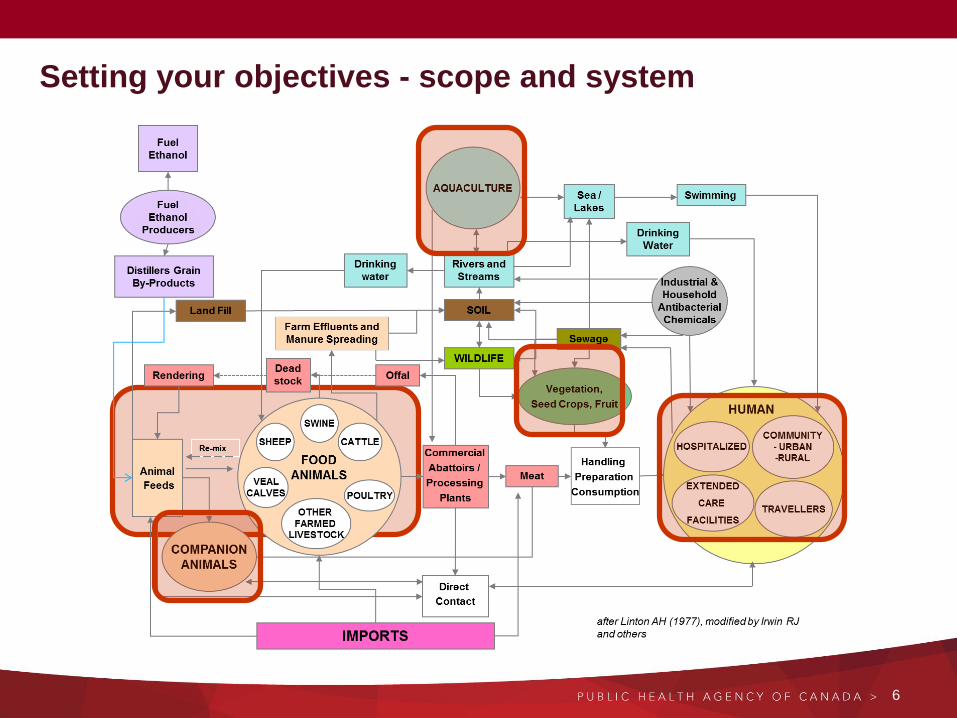
Setting your objectives - scope and system
6
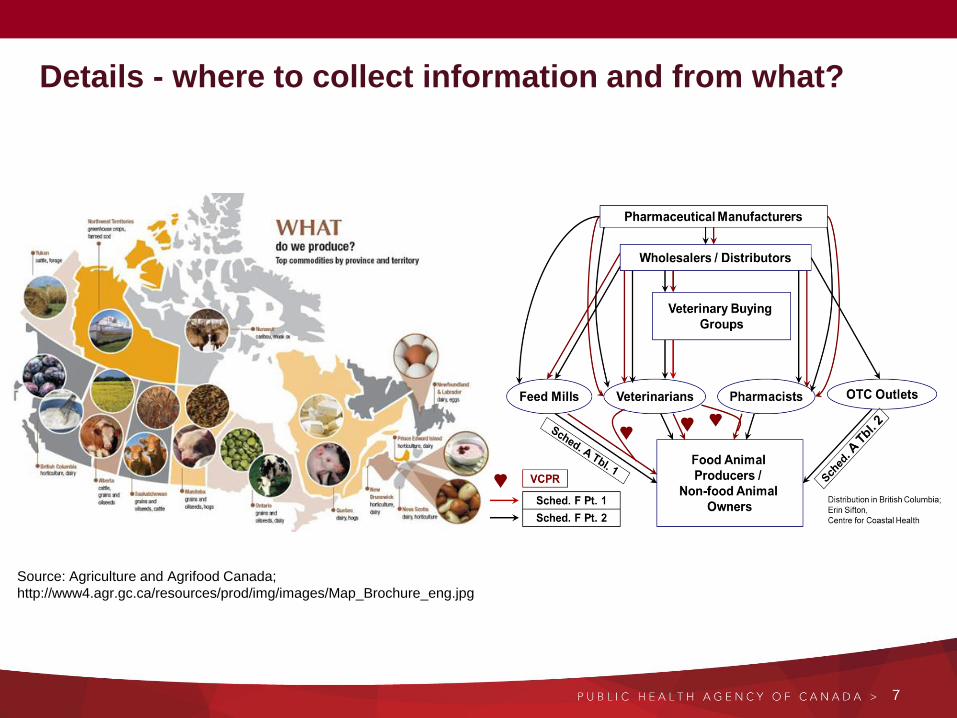
Details - where to collect information and from what?
7
Source: Agriculture and Agrifood Canada;
http://www4.agr.gc.ca/resources/prod/img/images/Map_Brochure_eng.jpg
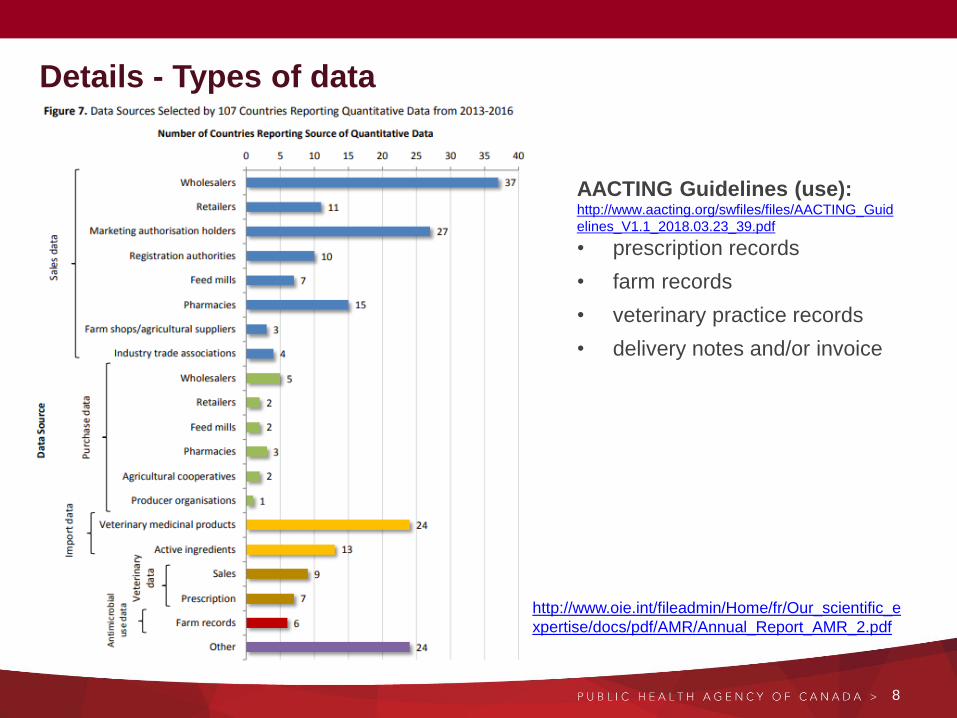
Details - Types of data
AACTING Guidelines (use): http://www.aacting.org/swfiles/files/AACTING_Guid
elines_V1.1_2018.03.23_39.pdf
• prescription records
• farm records
• veterinary practice records
• delivery notes and/or invoice
8
http://www.oie.int/fileadmin/Home/fr/Our_scientific_e
xpertise/docs/pdf/AMR/Annual_Report_AMR_2.pdf

Policy Community
Policy NetworkFederal Gov’t
Regional Gov’t
Industry-Farming
Veterinary
Universities
Who has data and who can contribute to reporting
Industry–
PharmaceuticalInternational
Public Health
9

CIPARS
11

• Unified approach to monitor trends in antimicrobial resistance (AMR) & antimicrobial use
(AMU) in humans & animals
• Allow accurate international comparisons with other countries that use similar
surveillance systems
• Generate data and timely reports to facilitate the assessment of the public health impact
of antimicrobials used in human & agricultural sectors
12
CIPARS Objectives

Partnership
and collaboration
13

14
1997 1998 1999 2000 2001 2002 2003 2004 2005 2006 2007 2008 2009 2011 2012 2013 2014
CIPARS AMU Research
CIPARS Farm Swine AMU
National Consensus
Conference on AMR/U
WHO Global Strategy for the
Containment of AMR
Animal Drug
Distribution SchematicBeef, Swine,
Sheep, Dairy,
Companion
Animals
Refinements
CIPARS Farm
Broiler
Chicken AMU
CIPARS Surveillance
Strategy
Farm-Turkey
AMU/AMR Pilot
2010
AMU
Research
Summary
Table
Human
Consumption
Pharmacy
Sales Data
Mg AM per
Kg PCU
CIPARS Farm Swine AMU
AMU Trends, Grams/1000 pig-days & PCU
2002 Advisory Committee Report on
Animal Uses of Antimicrobials and
Impact on AMR and Human Health
AMU Discussion Paper
Animal
Consumption
Sales Data
Human AMU/consumption:
Physician and hospital data
Animal
Consumption
Region & CA-LA
Ongoing international activities to promote prudent use and
surveillance of AMU (WHO/OIE/ESVAC/Codex)
Broiler Poultry
CIPARS – surveillance of antimicrobials

15
2015 2016 2017 2018
DDDvetCA
Nursery Pig
Research
Project
Beef Cattle
AMU
Research
(retrospective
data)
Turkey AMU
Surveillance
CIPARS – surveillance of antimicrobials
Marine Finfish
AMU: Department
of Fisheries and
Oceans Canada
(2016 data)
• In the beginning our activities were very small.
• But we had a great plan(ner)!
• Critical to just start.

Data sources - antimicrobials intended for use in animals
• CIPARS farm questionnaire
– Data voluntarily provided by participating producers and veterinarians
– Broiler chickens, turkeys, grower-finisher pigs
– Beef and dairy farm surveillance frameworks under development
• Quantity of active ingredient distributed for use in animals since 2006
– Data voluntarily provided by the Canadian Animal Health Institute (CAHI)
• Stratified by province and type of animal (companion vs. production animal)
• Marine Finfish data - Fisheries and Oceans Canada requires industry owners and
operators to report on their use of drugs and pesticides, including antimicrobials under
the authority of the Aquaculture Activities Regulations authorized under the Fisheries Act
– Freshwater finish data anticipated for 2017
16
Data sources - antimicrobials intended for use in people
• Purchased from IQVIA – provided to CIPARS via CARSS
– Physician diagnosis and antimicrobial recommendations
– Hospital purchases
– Pharmacy dispensations
• Additional data from Northern Communities included in pharmacy data
17
Data sources - antimicrobials intended for use on crops
• Provided by Health Canada’s Pest Management Regulatory Agency
– Annual Canadian sales data from all pesticide manufacturers
• Fireblight on pome fruits (apples, pears, quince), caneberries and Saskatoon
berries; blossom blast and bacterial canker on cherries; stem canker and
bacterial spot on greenhouse and field fruiting vegetables (peppers, tomatoes,
and eggplant); and walnut blight of walnuts.

https://www.canada.ca/en/public-health/services/antibiotic-antimicrobial-resistance/animals/veterinary-antimicrobial-sales-
reporting.html
Continuing to evolve – animal sales data
18
Current 2019 (for 2018 data)
Voluntary provision (Canadian Animal Health Institute)
Regulatory authority
90%-95% of animal health product
market
All antimicrobials
Missing some imported products Will capture data from importers
• By animal type• Production animal• Companion animal
• By animal species (low/high estimates)
• Cattle (dairy, beef, veal)
• Pigs
• Chickens (broilers, layers)
• Turkeys
• Horses
• Aquaculture (finfish, shellfish)
• Small ruminants
• Companion animals
• Other

Ok. Now we have data…
19

20
• This is not hard (mathematically).
• This is very meticulous work.
• This has fancy language.
• Technical details matter.
• Decisions about these can be complex
• Not everyone needs to know the technical details!
• This is not hard.
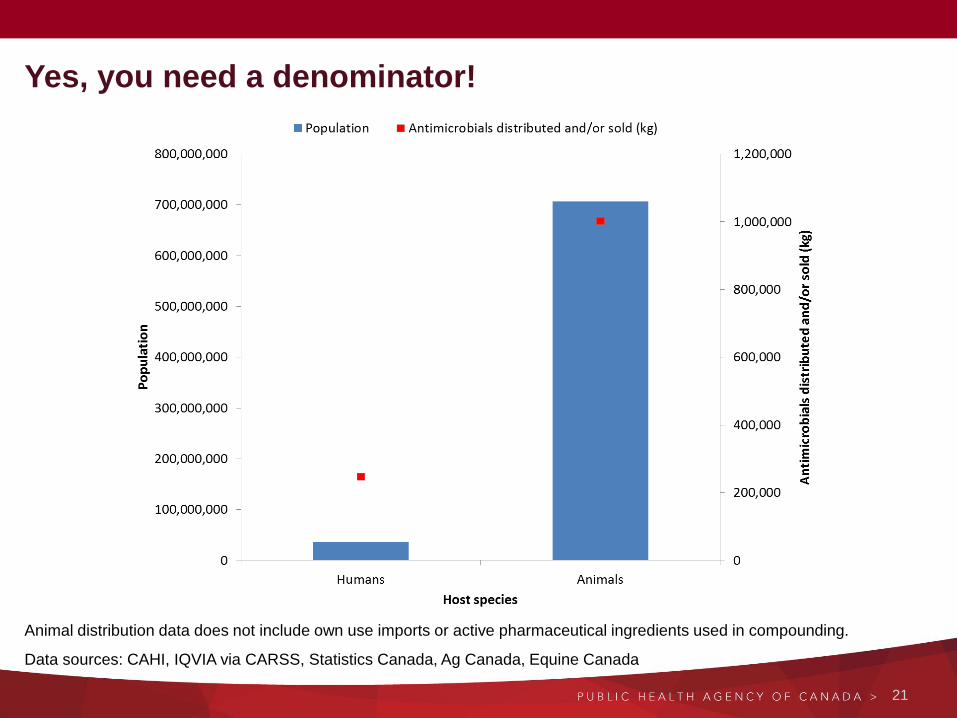
Yes, you need a denominator!
21
Animal distribution data does not include own use imports or active pharmaceutical ingredients used in compounding.
Data sources: CAHI, IQVIA via CARSS, Statistics Canada, Ag Canada, Equine Canada
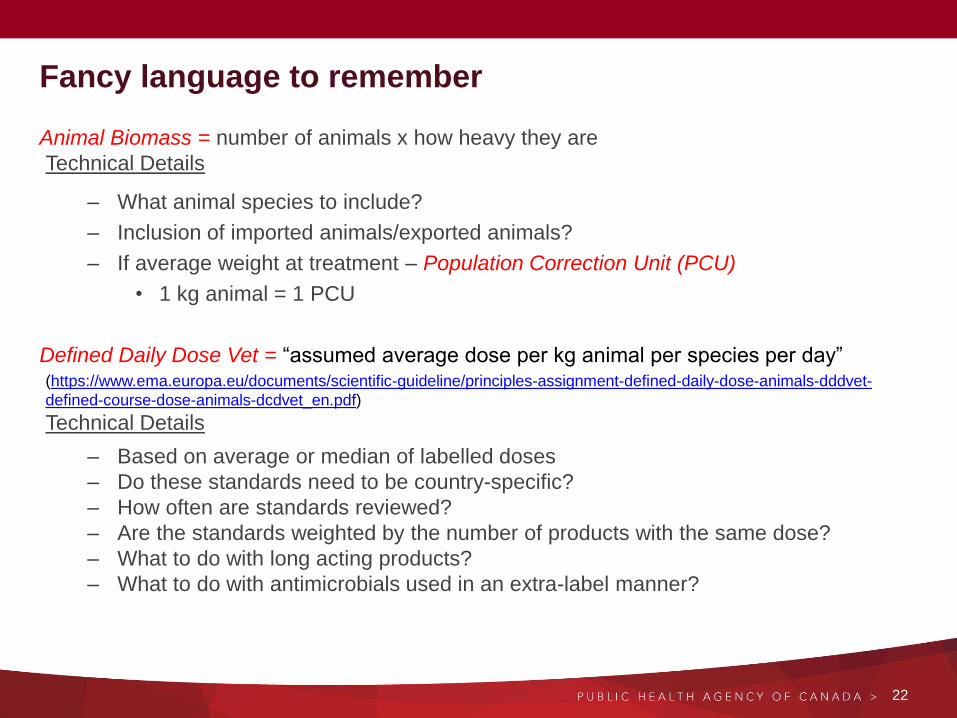
Fancy language to remember
Animal Biomass = number of animals x how heavy they are
Technical Details
– What animal species to include?
– Inclusion of imported animals/exported animals?
– If average weight at treatment – Population Correction Unit (PCU)
• 1 kg animal = 1 PCU
Defined Daily Dose Vet = “assumed average dose per kg animal per species per day”(https://www.ema.europa.eu/documents/scientific-guideline/principles-assignment-defined-daily-dose-animals-dddvet-
defined-course-dose-animals-dcdvet_en.pdf)
Technical Details
– Based on average or median of labelled doses
– Do these standards need to be country-specific?
– How often are standards reviewed?
– Are the standards weighted by the number of products with the same dose?
– What to do with long acting products?
– What to do with antimicrobials used in an extra-label manner?
22

Evolution of antimicrobial consumption/use reporting
Consumption: kg mg/animal biomass
• Animal biomass based on average weight at treatment (PCU)
– Criticisms: uncertainty and variability with this weight choice
– Pros: if done ‘right’ the one weight reflects weight at exposure to the drug
• Animal biomass based on live animal weight at time of slaughter (e.g., OIE denominator)
– Criticisms: we generally don’t administer antimicrobials to animals at this weight (i.e.,
withdrawal periods)
– Pros: this often is a ‘known’ weight
Use: if you have good quality farm level data – you can report in any metric!
• Mg/biomass
• DDDvet/1000 animal-days
– Country-specific DDDvet standards take time to develop
• Dependent on your objectives
23

24
Unit of
Measurement
Indicator
(=numerator/denominator)
Sales Data Sentinel farm
data
Count-based • #farms/total sampled
• #rations medicated/total #rations
• days exposed
• % herd exposed
NA √
√
√
√
Weight-based • mg/PCU √* √
Dose-based • nDDDvetCA/PCU
• nDDDvetCA/1000 animal-days
Coming… √
Denominator: PCU=Population Correction Unit (1 PCU =1 kg animal)
Average weight at treatment (Canadian and ESVAC) – dual reporting
*Inclusion of beef cows
DDDvetCA=defined daily dose for animals based on Canadian product labels
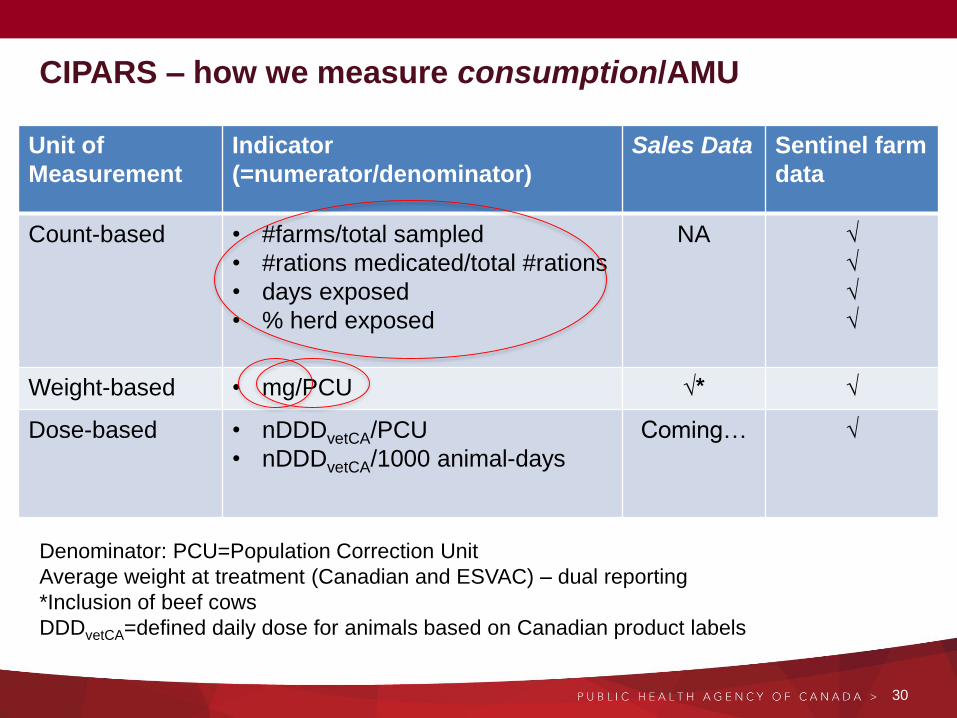
CIPARS – how we measure consumption/AMU

In summary
• What to you want to know?
– What outputs/outcomes meet your objectives?
• Set objectives – design your surveillance to meet your objectives
• Surveillance ≠ research
• Just start. No matter how small. And have a great plan.
• Antimicrobial use/consumption surveillance – analysis is not hard, but it is meticulous
• Technical details and language matter – know who to deliver this info to
25

Next….
We answer questions.
26

AMU - When you only have the basic data.
What is useful for?
APEC Workshop – Oct. 10, 2018
Santiago, Chile

Why do you want data about antimicrobial use?
Generally speaking – it is all about comparisons…these are often what your
surveillance objectives are based on
• Is antimicrobial consumption/AMU different in different host species?
– Regardless of objectives – be prepared for this
• Is antimicrobial consumption/AMU increasing or decreasing?
– What practices are related to this? (stewardship)
• How do we compare to other areas?
• What does antimicrobial consumption/AMU mean for resistance?
28
COMPARISONS CREATE DISCOMFORT!
But can drive stewardship
Are we sure? What are the implications of increasing precision/accuracy?

OIE – Reporting Options
OIE Annual collection of data on antimicrobial agents intended for use in animals
– Baseline – quantitative data not available
• Are antimicrobial agents used for growth promotion
• Does legislation/regulations exist about this
• What are the list of authorised products for growth promotion
– Reporting Option 1
• Overall amount sold for use/used in animals by antimicrobial class
– Possibility to separate by type of use (therapeutic/prevention vs.
growth promotion)
– Reporting Option 2
• Additionally can separate by animal groups
– All food producing animals, companion animals and/or by
terrestrial and aquatic animals
– Reporting Option 3
• Additionally by route of administration
29
30
Unit of
Measurement
Indicator
(=numerator/denominator)
Sales Data Sentinel farm
data
Count-based • #farms/total sampled
• #rations medicated/total #rations
• days exposed
• % herd exposed
NA √
√
√
√
Weight-based • mg/PCU √* √
Dose-based • nDDDvetCA/PCU
• nDDDvetCA/1000 animal-days
Coming… √
Denominator: PCU=Population Correction Unit
Average weight at treatment (Canadian and ESVAC) – dual reporting
*Inclusion of beef cows
DDDvetCA=defined daily dose for animals based on Canadian product labels
CIPARS – how we measure consumption/AMU
31
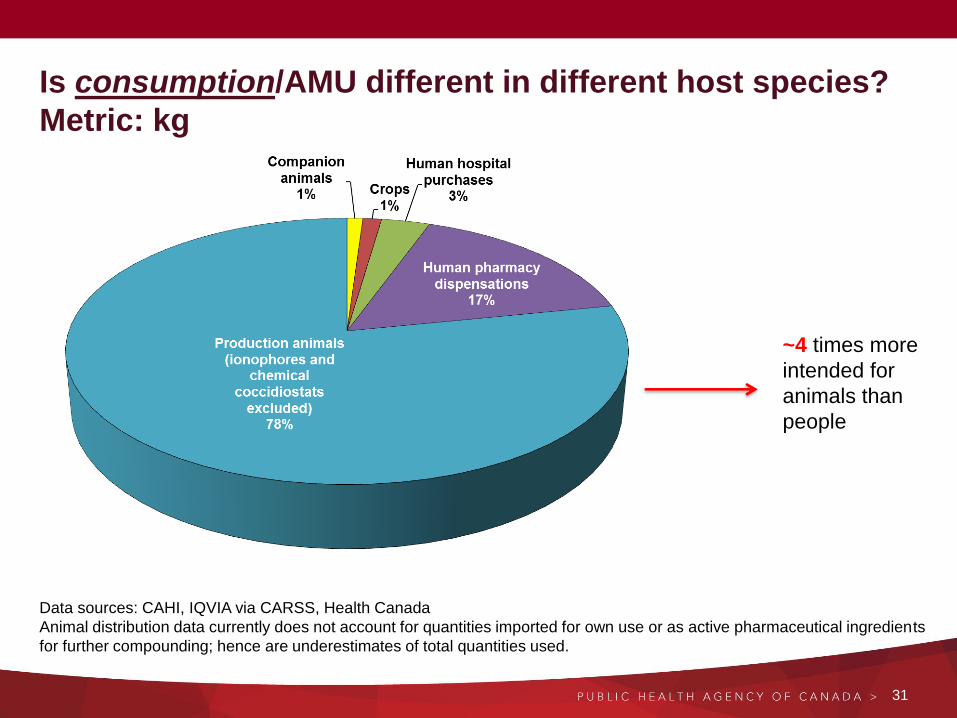
Data sources: CAHI, IQVIA via CARSS, Health Canada
Animal distribution data currently does not account for quantities imported for own use or as active pharmaceutical ingredients
for further compounding; hence are underestimates of total quantities used.
~4 times more
intended for
animals than
people
Is consumption/AMU different in different host species?
Metric: kg

Is consumption/AMU different in different host species?
Metric: mg/PCU
32
~ 1.5 times more
antimicrobials were
distributed for use in
animals than humans
(per kg host)
(European standard weights
of animals)
Data sources: CAHI, IQVIA via CARSS, Statistics Canada, Ag Canada, Equine Canada
Animal distribution data does not include own use imports or active pharmaceutical ingredients used in compounding.

Is consumption/AMU different in different host species?
Metric: kg
33
Values do not include antimicrobials
imported under the “own use”
provision or imported as active
pharmaceutical ingredients used in
compounding. Data sources: CAHI, IQVIA via CARSS
Is consumption/AMU different in different host species?
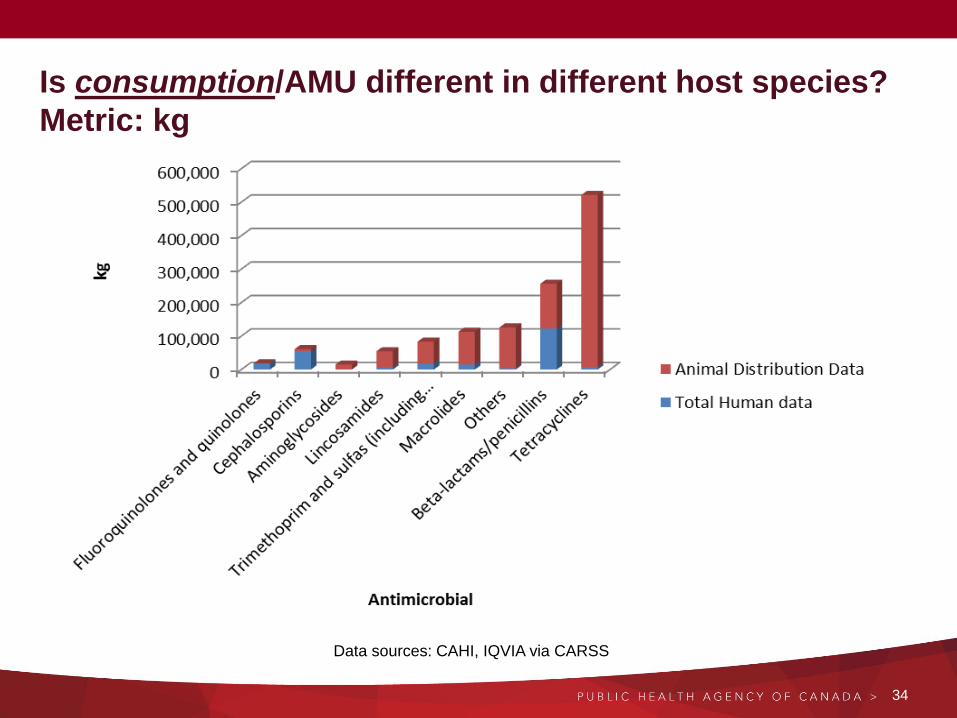
Metric: kg
34
Data sources: CAHI, IQVIA via CARSS
800,000
850,000
900,000
950,000
1,000,000
1,050,000
1,100,000
1,150,000
1,200,000
1,250,000
2007 2008 2009 2010 2011 2012* 2013* 2014* 2015* 2016*
Quantity
of
active ingre
die
nt
(kg)
Year
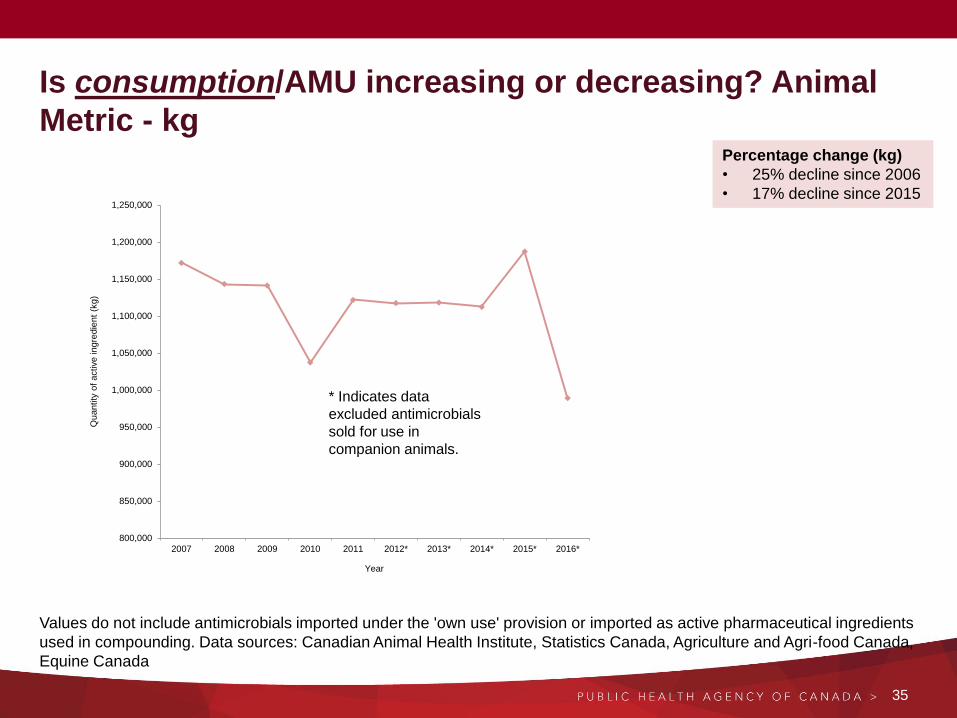
Is consumption/AMU increasing or decreasing? Animal
Metric - kg
35
Percentage change (kg)
• 25% decline since 2006
• 17% decline since 2015
Values do not include antimicrobials imported under the 'own use' provision or imported as active pharmaceutical ingredients
used in compounding. Data sources: Canadian Animal Health Institute, Statistics Canada, Agriculture and Agri-food Canada,
Equine Canada
* Indicates data
excluded antimicrobials
sold for use in
companion animals.

Is consumption/AMU increasing or decreasing? Animal
Metric – mg/PCUEU
36
Values do not include antimicrobials imported under the 'own use' provision or imported as active pharmaceutical ingredients
used in compounding. Data sources: Canadian Animal Health Institute, Statistics Canada, Agriculture and Agri-food Canada,
Equine Canada
* Indicates data
excluded antimicrobials
sold for use in
companion animals.
100
120
140
160
180
200
220
240
800,000
850,000
900,000
950,000
1,000,000
1,050,000
1,100,000
1,150,000
1,200,000
1,250,000
2007 2008 2009 2010 2011 2012* 2013* 2014* 2015* 2016*
Qu
an
tity
of
active
in
gre
die
nt
adju
ste
d f
or
po
pu
latio
ns a
nd
we
ights
(m
g/P
CU
)
Qu
an
tity
of
active
in
gre
die
nt
(kg
)
Year
Total (kg) Total (mg/PCU—European weights)
Percentage change (kg)
• 25% decline since 2006
• 17% decline since 2015
Percentage change
(mg/PCUEU)
• 11% decline since 2006
• 18% decline since 2015
But … some
Canadian
production classes
are heavier than
their European
counterparts…

Is consumption/AMU increasing or decreasing? Animal
Metric – mg/PCUCA
37
Values do not include antimicrobials imported under the 'own use' provision or imported as active pharmaceutical ingredients
used in compounding. Data sources: Canadian Animal Health Institute, Statistics Canada, Agriculture and Agri-food Canada,
Equine Canada
* Indicates data
excluded antimicrobials
sold for use in
companion animals.
Percentage change (kg)
• 25% decline since 2006
• 17% decline since 2015
Percentage change
(mg/PCUEU)
• 11% decline since 2006
• 18% decline since 2015
100
120
140
160
180
200
220
240
800,000
850,000
900,000
950,000
1,000,000
1,050,000
1,100,000
1,150,000
1,200,000
1,250,000
2007 2008 2009 2010 2011 2012* 2013* 2014* 2015* 2016*
Qu
an
tity
of
active
in
gre
die
nt
adju
ste
d f
or
po
pu
latio
ns a
nd
we
ights
(m
g/P
CU
)
Qu
an
tity
of
active
in
gre
die
nt
(kg
)
Year
Total (kg)
Total (mg/PCU—European weights)
Total (mg/PCU—Canadian weights)
Percentage change
(mg/PCUCA)
• 10% decline since 2006
• 17% decline since 2015

Did the different animal weights make a
difference?
38

Is consumption/AMU increasing or decreasing? Human
Metric: DDD/1000 inhabitant-days
39
IQVIA data – CARSS. https://www.canada.ca/en/public-health/services/publications/drugs-health-products/canadian-
antimicrobial-resistance-surveillance-system-2017-report-executive-summary.html
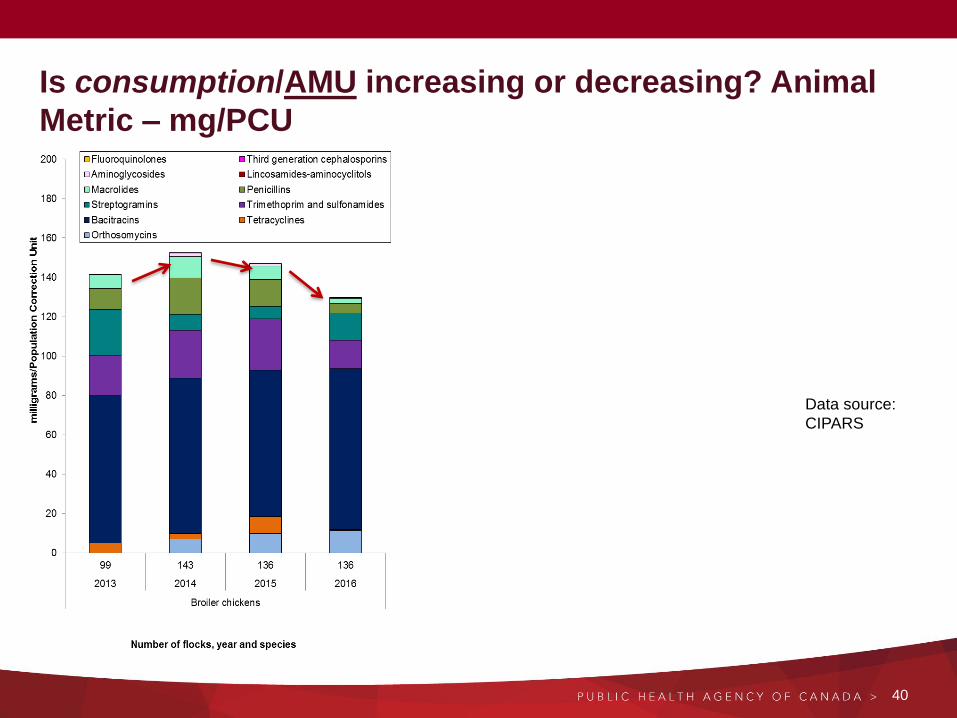
Is consumption/AMU increasing or decreasing? Animal
Metric – mg/PCU
40
Data source:
CIPARS
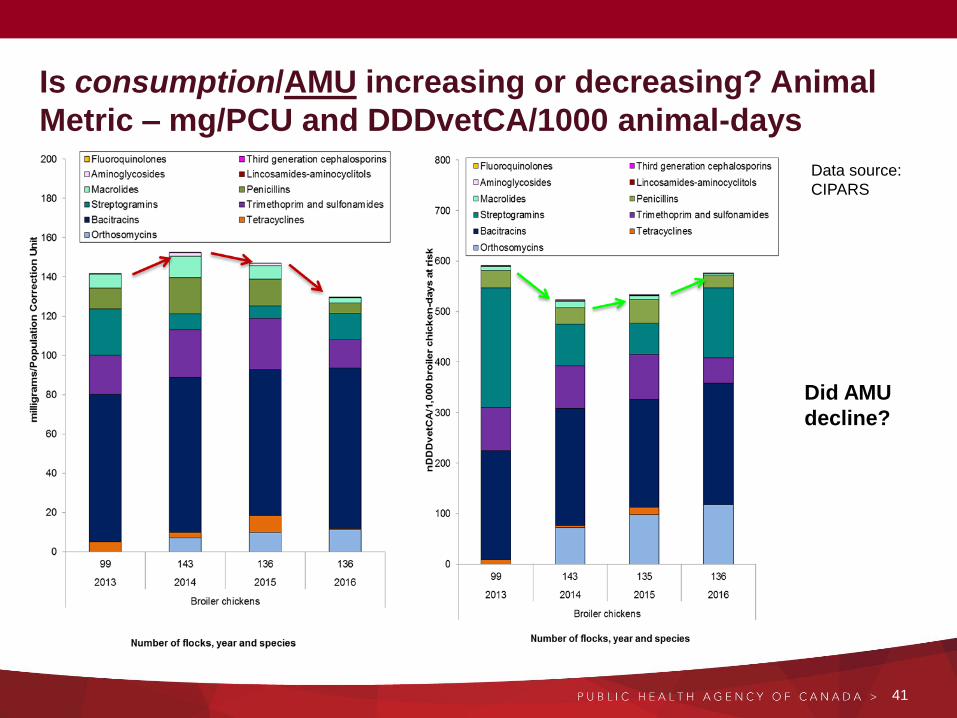
Is consumption/AMU increasing or decreasing? Animal
Metric – mg/PCU and DDDvetCA/1000 animal-days
41
Data source:
CIPARS
Did AMU
decline?

42
Is consumption/AMU increasing or decreasing? Animal
Metric – mg/PCU and DDDvetCA/1000 animal-days
Did AMU
decline?
Data source:
CIPARS
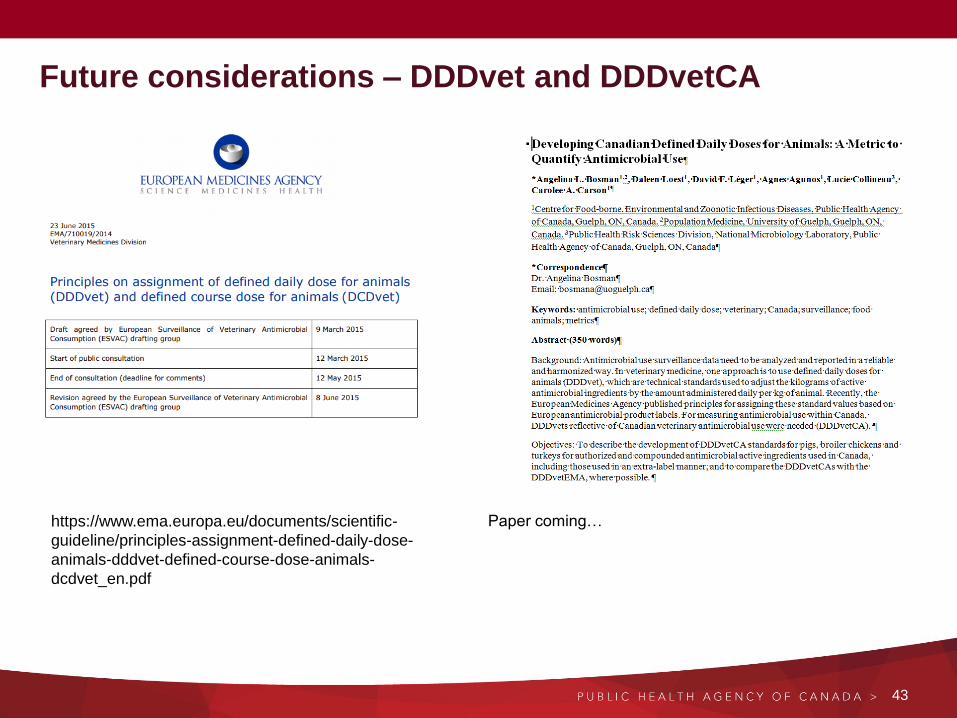
Future considerations – DDDvet and DDDvetCA
43
https://www.ema.europa.eu/documents/scientific-
guideline/principles-assignment-defined-daily-dose-
animals-dddvet-defined-course-dose-animals-
dcdvet_en.pdf
Paper coming…

How do we compare to other areas? Human
Metric: DDD/1000 inhabitant-days
44
https://ecdc.europa.eu/en/antimicrobial-
consumption/database/country-overview
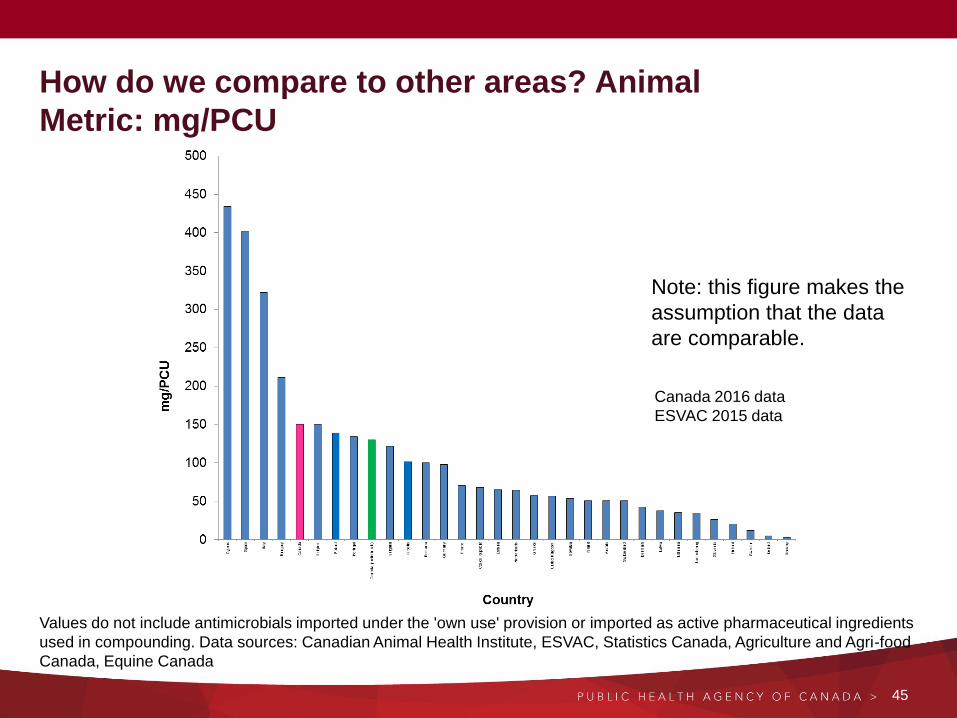
45
Values do not include antimicrobials imported under the 'own use' provision or imported as active pharmaceutical ingredients
used in compounding. Data sources: Canadian Animal Health Institute, ESVAC, Statistics Canada, Agriculture and Agri-food
Canada, Equine Canada
Canada 2016 data
ESVAC 2015 data
Note: this figure makes the
assumption that the data
are comparable.
How do we compare to other areas? Animal
Metric: mg/PCU

Did the different animal weights make a
difference?
46

Summary
• First think about what you are trying to do with your surveillance data
• Simple metrics are very powerful
• “Perfect is the enemy of good” (Voltaire). (better data comes with a cost)
• There are some sticky and important technical decisions
– Which weight in the denominator
– Which animal populations to include
– Which standard dose?
47
“overall aim is to compare antimicrobial
usage between populations, standardized
parameters should be used, whereas the
quantification of exposure to antimicrobials
should rely on actual parameters”
In other words: if you want to look deep at
AMU and relationship AMR, the metrics need
to be tailored to the population under study. If
you want to compare, metrics need to be
stable and standard.

The BIG questions:
What does antimicrobial consumption/
AMU mean for: Resistance?
Or stewardship?
48
AMU and AMR monitoring programs; how
they feed each other
Integrated Surveillance
APEC Workshop – Oct. 10, 2018
Santiago, Chile

Surveillance information is compelling
Harmonization enables comparisons & integration
50
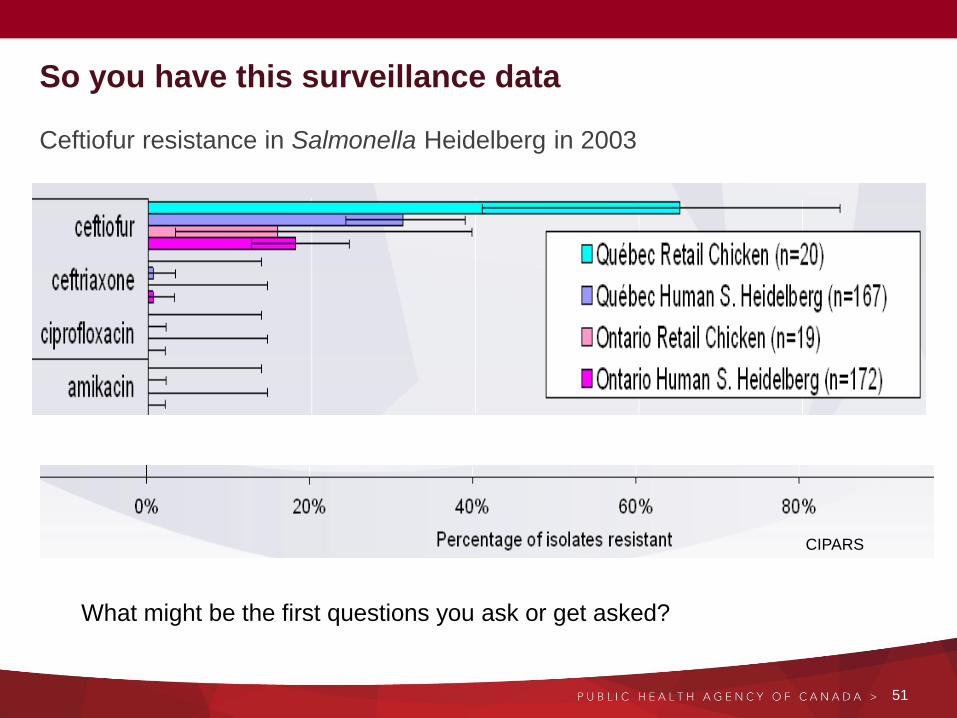
So you have this surveillance data
Ceftiofur resistance in Salmonella Heidelberg in 2003
51
CIPARS
What might be the first questions you ask or get asked?

COMPARISONS CREATE DISCOMFORT!
But can be a great motivator for change.
52
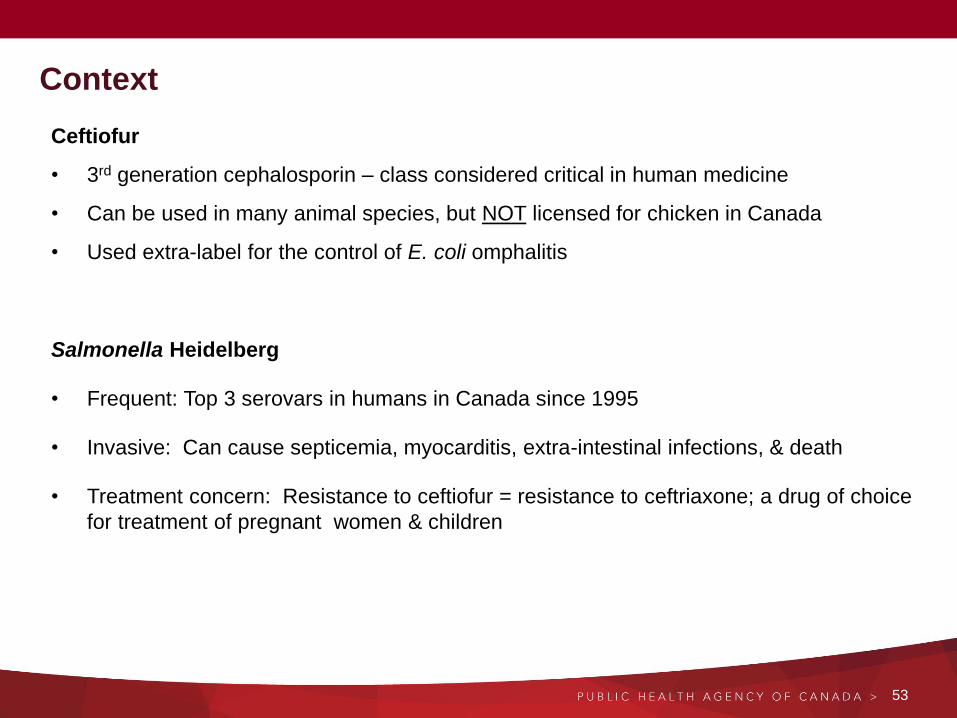
Context
Ceftiofur
• 3rd generation cephalosporin – class considered critical in human medicine
• Can be used in many animal species, but NOT licensed for chicken in Canada
• Used extra-label for the control of E. coli omphalitis
Salmonella Heidelberg
• Frequent: Top 3 serovars in humans in Canada since 1995
• Invasive: Can cause septicemia, myocarditis, extra-intestinal infections, & death
• Treatment concern: Resistance to ceftiofur = resistance to ceftriaxone; a drug of choice
for treatment of pregnant women & children
53

Questions?
Is this happening in other animal species?
Is this happening in other strains of Salmonella
Is this happening in other bacterial species?
Or is this just a clone of Salmonella that is spreading?
Is this happening in other regions?
What is happening at other stages in the food chain (i.e., farm, slaughter)
What is happening with antimicrobial use?
54
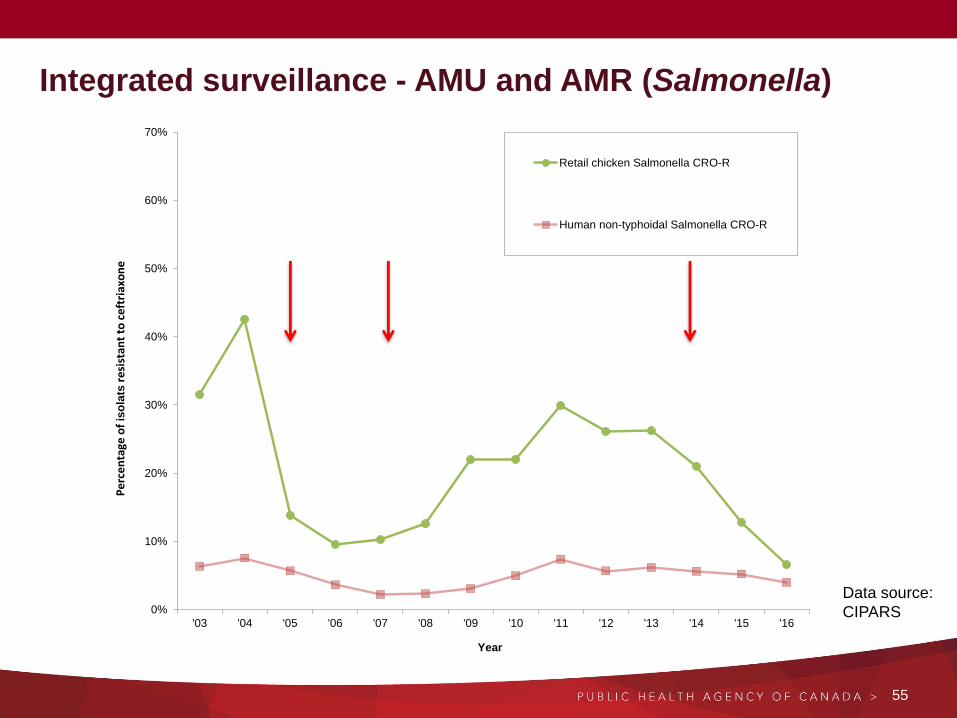
0%
10%
20%
30%
40%
50%
60%
70%
'03 '04 '05 '06 '07 '08 '09 '10 '11 '12 '13 '14 '15 '16
Year
Retail chicken Salmonella CRO-R
Human non-typhoidal Salmonella CRO-R
Pe
rce
nta
ge o
f is
ola
tsre
sist
ant
to c
eft
riax
on
e
Integrated surveillance - AMU and AMR (Salmonella)
55
Data source:
CIPARS
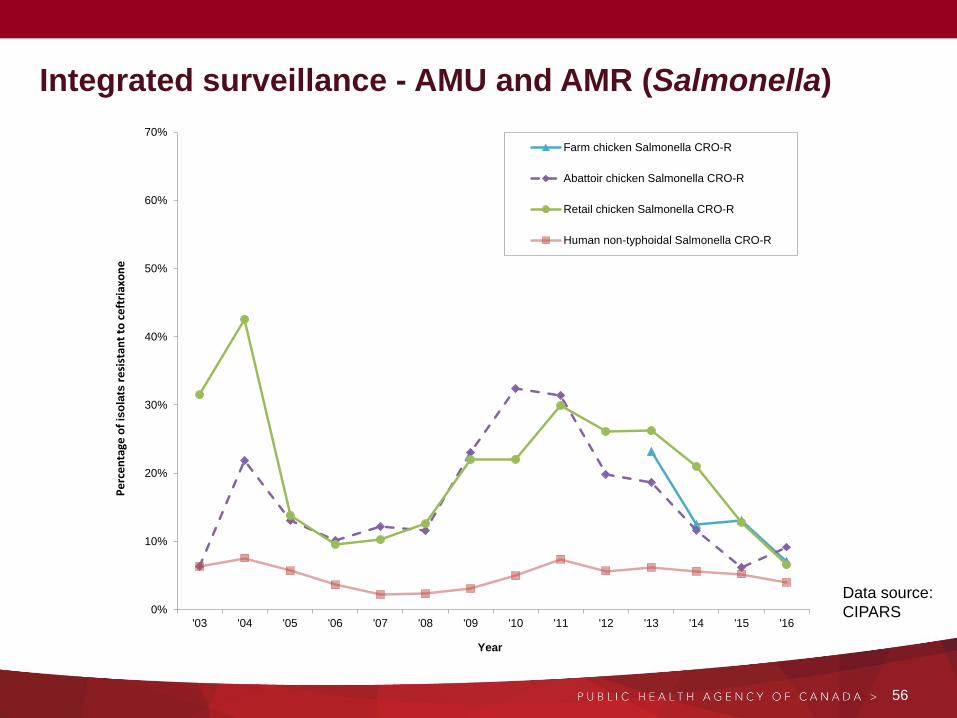
0%
10%
20%
30%
40%
50%
60%
70%
'03 '04 '05 '06 '07 '08 '09 '10 '11 '12 '13 '14 '15 '16
Year
Farm chicken Salmonella CRO-R
Abattoir chicken Salmonella CRO-R
Retail chicken Salmonella CRO-R
Human non-typhoidal Salmonella CRO-R
Pe
rce
nta
ge o
f is
ola
tsre
sist
ant
to c
eft
riax
on
e
Integrated surveillance - AMU and AMR (Salmonella)
56
Data source:
CIPARS

Integrated surveillance - AMU and AMR (Salmonella)
57
31%
6%
0% 0%0%
10%
20%
30%
40%
50%
60%
70%
0%
10%
20%
30%
40%
50%
60%
70%
'03 '04 '05 '06 '07 '08 '09 '10 '11 '12 '13 '14 '15 '16
Pe
rce
nta
ge
of
flo
ck
s r
ep
ort
ing
us
e o
f c
eft
iofu
r
Year
Percentage of flocks reporting use of ceftiofur
Farm chicken Salmonella CRO-R
Abattoir chicken Salmonella CRO-R
Retail chicken Salmonella CRO-R
Human non-typhoidal Salmonella CRO-R
Pe
rce
nta
ge o
f is
ola
tsre
sist
ant
to c
eft
riax
on
e
Data source:
CIPARS

58
Frequency-based indicator – can show
effect of intervention and easy to
communicate

59
31%
6%
0% 0%0%
10%
20%
30%
40%
50%
60%
70%
0%
10%
20%
30%
40%
50%
60%
70%
'03 '04 '05 '06 '07 '08 '09 '10 '11 '12 '13 '14 '15 '16
Pe
rce
nta
ge
of
flo
ck
s r
ep
ort
ing
us
e o
f c
eft
iofu
r
Year
Percentage of flocks reporting use of ceftiofur
Farm chicken E. coli CRO-R
Abattoir chicken E. coli CRO-R
Retail chicken E. coli CRO-R
Pe
rce
nta
ge o
f is
ola
tsre
sist
ant
to c
eft
riax
on
e
Integrated surveillance - AMU and AMR (E. coli)
Data source:
CIPARS
60
When you have use and resistance data –
what next?
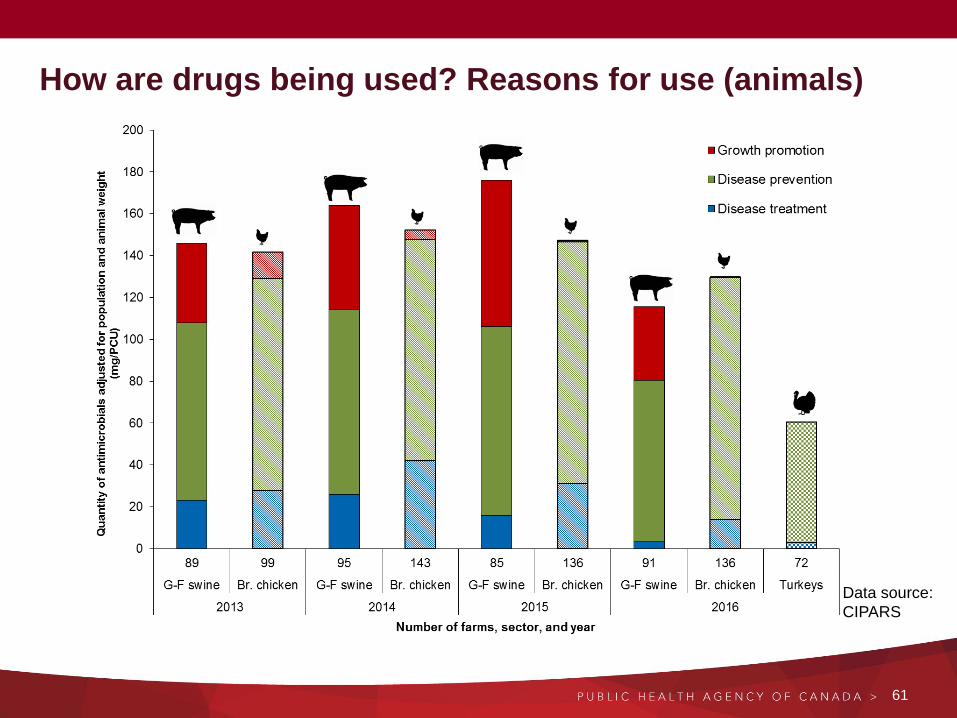
How are drugs being used? Reasons for use (animals)
61
Data source:
CIPARS

Flock / Herd size
Region / Location
Source of Birds/
Animals
Antimicrobial Use
Disease Status
Vaccination
Biosecurity / Infection
Control
Production Type
Season
Antimicrobial Resistance
What can change how drugs are being used?

Conclusions
• Need to be clear on what it is you want to do
• More than one indicator is necessary to answer all the things we want to
do with AMU data
• What level of ‘correct’ is good enough to suit the need?
• Comparisons can drive change
• Simple ways of communicating about comparisons and data can drive
change
• The industry-led initiative to eliminate use of ceftiofur in poultry for disease
prevention is appearing to have the desired effect
• Surveillance needs to be designed well to meet objectives and answer
questions
63