goodman property trust interim result 2020...rental growth. portfolio assessed to be 7.6%...
TRANSCRIPT

Goodman Property Trust Interim Result 2020

Unless otherwise indicated, all numerical data provided in this presentation is stated as at 30 September 2019. All dollar values are NZD unless otherwise stated. All figures are rounded.
03 Overview
05 Financial result
11 Capital management
14 Investment portfolio
25 Summary and outlook
28 Appendix
Contents
Presented by:
John Dakin Chief Executive Officer Andy Eakin Chief Financial Officer James Spence Director - Investment Management

3Gateway warehouse – Highbrook Business Park

Overview
Auckland industrial focus is driving strong operating results:
+ Occupancy of 99.5%, retention rate of 74%1, WALE of 5.5 years
+ 128,581 sqm of new leasing and market reviews completed with 7.3%2 rental growth. Portfolio assessed to be 7.6% under-rented
+ Development workbook remains strong; 15 build-to-lease warehouses completed over last 12 months are fully leased
+ Interim revaluation of $172.4 million driven by a combination of cap rate compression (28 bps) and underlying market rental growth3
$227.1 million of strategic investment:
+ Acquisitions of Mt Wellington, Pilkington Road and Favona Road properties, all prime infill locations, settled for $103.9 million
+ Development commitments: $123.2 million4 – nine new projects including two new customer expansions announced today
Strengthened financial metrics:
+ $175 million of new equity raised5
+ Gearing of 17.9% (20.6% on a fully committed basis) provides significant financial flexibility to continue accretive investment programme
+ Refinancing of GMT’s bank facility completed in November 2019
+ Increase in NTA by 15.8 cpu (10%) to 172.8 cpu
+ FY20 earnings guidance reaffirmed; cash earnings to be materially consistent with FY19
+ Distribution guidance maintained at 6.65 cpu
4
Interim Result 2020
Overview
1 Retention rate measured over a 24 month period2 Increase in passing rental on leasing and market reviews completed on stabilised portfolio in the period3 2.7% increase in market rental across GMT’s underlying portfolio for the 6 months to September 2019 as assessed by GMT’s independent valuers4 Total project cost including land, finance costs and all fees5 $150 million Placement completed in the period with $25 million from a Retail Unit Offer completed in October 2019

5Premium Apparel – Highbrook Business Park

Interim Result 2020
Financial result
Financial highlights
17.9% Loan-to-value ratio
172.8cpu Net tangible asset backing
$172.4m Portfolio revaluation
$236.4m Profit before tax
4.5 years Weighted average debt term2
3.325cpu Cash distributions
3.15cpu Cash earnings
30.3%
1 GMT’s stock market performance including unit price appreciation and distributions paid2 Calculated on drawn debt
Total Unitholder Return1
6 months to 30 September 2019
6
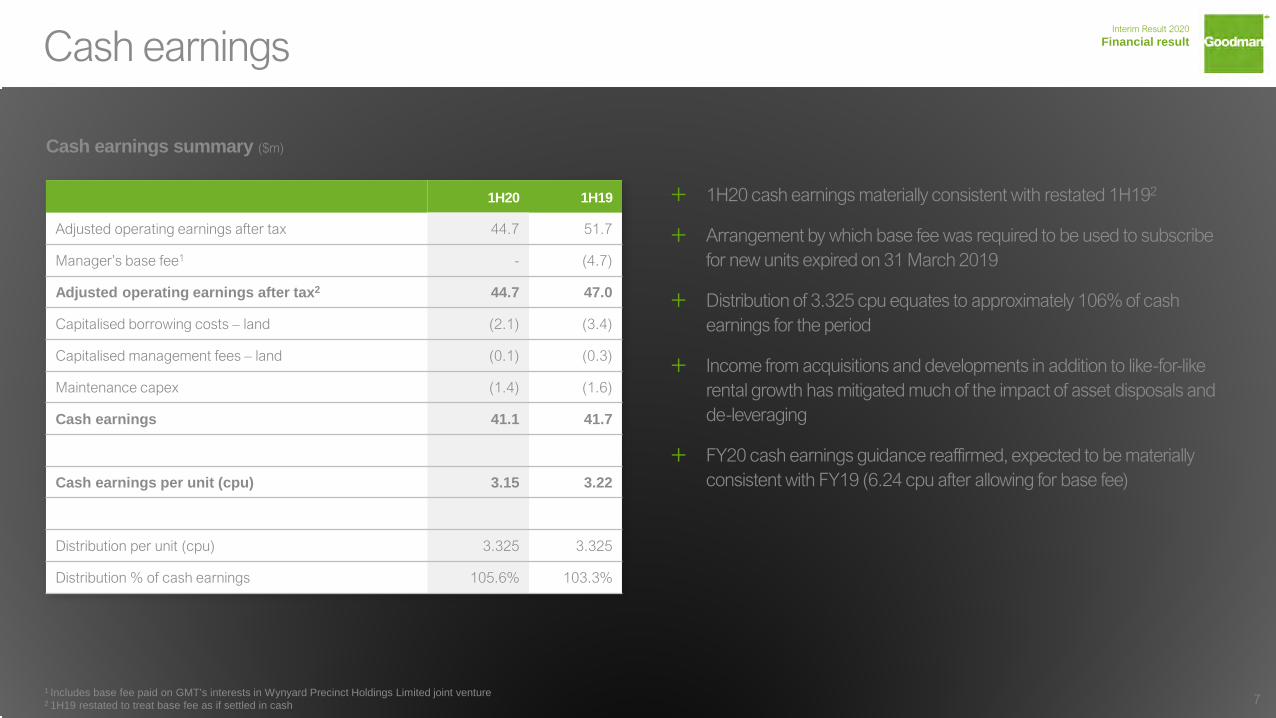
1H20 1H19
Adjusted operating earnings after tax 44.7 51.7
Manager’s base fee1 - (4.7)
Adjusted operating earnings after tax2 44.7 47.0
Capitalised borrowing costs – land (2.1) (3.4)
Capitalised management fees – land (0.1) (0.3)
Maintenance capex (1.4) (1.6)
Cash earnings 41.1 41.7
Cash earnings per unit (cpu) 3.15 3.22
Distribution per unit (cpu) 3.325 3.325
Distribution % of cash earnings 105.6% 103.3%
+ 1H20 cash earnings materially consistent with restated 1H192
+ Arrangement by which base fee was required to be used to subscribe for new units expired on 31 March 2019
+ Distribution of 3.325 cpu equates to approximately 106% of cash earnings for the period
+ Income from acquisitions and developments in addition to like-for-like rental growth has mitigated much of the impact of asset disposals and de-leveraging
+ FY20 cash earnings guidance reaffirmed, expected to be materially consistent with FY19 (6.24 cpu after allowing for base fee)
Cash earnings
Cash earnings summary ($m)
1 Includes base fee paid on GMT’s interests in Wynyard Precinct Holdings Limited joint venture2 1H19 restated to treat base fee as if settled in cash 7
Interim Result 2020
Financial result

172.8
+2.6
+11.6
+0.9+0.7
157.0
140.0
145.0
150.0
155.0
160.0
165.0
170.0
175.0
31-Mar-19 Equityplacement
Stabilisedrevaluation
Developmentrevaluation
Other 30-Sep-19
+ NTA increased 15.8 cpu (10%) for the year to date to 172.8 cpu
+ 6.5% increase in underlying portfolio valuation main contributor
+ $150 million1 of equity raised at 23% premium to NTA2
+ $12.4 million revaluation gains on developments reflects an average margin of 16%
Capital growth
Net tangible assets (cents per unit)
81 A further $25 million of equity was raised through a Retail Unit Offer in October 20192 NTA as at 30 September 2019 excluding impact from equity placement
Interim Result 2020
Financial result

Valuation ($m) Cap rate Change ($m) Change (%)% attributable to cap rate
compression
Highbrook Business Park 1,430.4 5.2% 102.8 7.7% 54%
Savill Link 307.4 5.6% 15.4 5.3% 80%
M20 Business Park 272.6 5.7% 23.7 9.5% 66%
The Gate Industry Park 242.4 5.4% 8.1 3.5% 73%
Westney Industry Park 125.0 7.0% 2.6 2.1% 100%
Value-add estates 257.1 5.5% 7.3 2.9% 57%
Underlying stabilised portfolio 2,634.9 5.4% 159.9 6.5% 65%
Completed developments1 75.0 5.2% 10.4 n/a n/a
Acquisitions2 105.4 4.7%3 - - n/a
Right-of-use assets in respect of ground leases 62.2 n/a - - n/a
Total stabilised properties 2,877.5 5.3% 170.3 6.3% n/a
Partially completed developments4 97.0 5.3% 2.0 n/a n/a
Land 48.6 n/a 0.1 0.2% n/a
Total investment portfolio 3,023.1 5.3% 172.4 6.0% n/a
Investment property contracted for sale 8.8 n/a - - n/a
Total portfolio 3,031.9 5.3% 172.4 6.0% n/a
Interim portfolio valuation
Portfolio valuation summary
9
Interim Result 2020
Financial result
1 In addition, $4.1 million was recognised in March 20192 Pilkington Road, Favona Road and Monahan Road properties, including costs capitalised since acquisition3 Passing yield on acquisition price4 Partially complete developments include developments held at cost (i.e. not sufficiently complete to be valued)

+ GMT continues to be conservatively leveraged
+ LVR of 17.9% at 30 September with fully committed LVR at 20.6%
+ ICR of 3.9x on a normalised basis1 (covenant: not less than 2.0x)
+ Significant capacity for investment in development pipeline and other opportunities
Balance sheet strength
Loan-to-value ratio
10
Interim Result 2020
Financial result
17.9%
20.6%
+3.0%
+1.2%
+0.6%
+3.5%
-0.4%
-1.3%
-5.0%
-0.8%
19.7%
10%
12%
14%
16%
18%
20%
22%
24%
26%
31-Mar-19 Acquisitions Developmentsincl.
revaluation
Disposals Stabilisedrevaluation
Equityplacement
Other 30-Sep-19 Retail offer Committeddevelopments
CommittedLVR
Refer to note 2.5 of GMT’s Interim Financial Statements for further detail regarding calculation of LVR1 ICR covenant calculation benefits from realised gain on disposal of interests in the Wynyard Precinct Holdings Limited joint venture resulting in a 5.0x measure as at 30 September 2019. Normalised ICR excludes this one-off gain.
11NCI Packaging – Savill Link

Metrics 30-Sep-19 31-Mar-19
Non-bank funding (drawn debt) 100% 98%
Headroom within bank facility $400m1 $288m
Weighted average debt term (drawn debt) 4.5y 5.0y
Gearing covenant (<50%) 20.5% 22.4%
+ Refinancing of GMT’s bank facility completed in November 2019
+ Increased facility size by $100m to $400m, with funding from BNZ, CBA, HSBC and Westpac
+ Significant headroom provides capacity for further development and investment
+ Committed to continued accessing of non-bank funding
+ Maintained Standard & Poor’s corporate rating of BBB (stable), BBB+ debt issue rating
Managing funding risk
Bank funding maturity profile
Non-bank funding maturity profile
12
Interim Result 2020
Capital management
100 100 100 100
52 52 52
0
20
40
60
80
100
120
140
FY20 FY21 FY22 FY23 FY24 FY25 FY26 FY27 FY28 FY29 FY30 FY31
USPP notes
Domestic bonds
1 Post bank facility refinancing
150 150 135 135 130
0
20
40
60
80
100
120
140
FY20 FY21 FY22 FY23 FY24 FY25 FY26 FY27 FY28 FY29 FY30 FY31
Bank facility - old
Bank facility - new

Metrics 30-Sep-19 31-Mar-19
12m forward hedging level 77% 76%
Weighted average debt cost 5.0% 4.9%
ICR covenant1 (>2.0x) 3.9x 3.6x0%
10%
20%
30%
40%
50%
60%
70%
80%
90%
100%
Y1 Y2 Y3 Y4 Y5
+ Debt repayment has resulted in elevated hedging levels over the next 12 months
+ Greater exposure to floating rates from late CY20
+ Cross currency swaps USD:NZD movement on USPP notes (ITM $34.8 million)
+ Interest rate swaps net ITM $3.4 million
+ WACD for FY20 expected to be around 4.9%
Managing interest rate risk
Hedging profile
13
Interim Result 2020
Capital management
1 ICR covenant calculations benefit from realised gain on disposal of interests in the Wynyard Precinct Holdings Limited joint venture resulting in a 5.0x measure as at 30 September 2019. Normalised ICR excludes this one-off gain.

14Premium Apparel – Highbrook Business Park

Interim Result 2020
Investment portfolio
Portfolio highlights
$123.2m Development commencements
3.4% Underlying net property income growth
5.5 years Weighted average lease term
99.5% Occupancy
15
100% Auckland industrial weighting
Gateway warehouse – Highbrook Business Park

70
80
90
100
110
120
130
140
150
2014 2015 2016 2017 2018 2019
Prime Industrial Secondary Industrial
Penrose
Rosebank
Albany
East Tamaki
Wiri
Airport Corridor
Mangere
Market update
16
Source: JLL (Jun 2019)
Interim Result 2020
Investment portfolio
Total: 162,000 sqmGMT: 47,000 sqm
Source: CBRE (Oct 2019)
0
50,000
100,000
150,000
200,000
250,000
300,000
350,000
400,000
2010 2011 2012 2013 2014 2015 2016 2017 2018 2019(F)
Industrial speculative development (sqm)Auckland warehouse rents ($psm)
+ Auckland industrial market near capacity with 1.9% vacancy rate1
+ Prime industrial rental growth of 5.6% in year to June 20191
+ Prime locations, close to consumers, expected to deliver best returns
+ Industrial market showing strongest investment performance and investor confidence of all property sectors
+ Speculative development around 160,000 sqm (1.5% of total stock) in Auckland’s central industrial locations
— GMT is responsible for around 30% of this build-to-lease activity. We constantly monitor our exposure to uncommitted product alongside market conditions
Auckland prime industrial absorption (sqm)
1 JLL 3Q19
Auckland central industrial precincts
Source: CBRE (Aug 2019)

95%
96%
97%
98%
99%
100%
FY16 FY17 FY18 FY19 1H20
Portfolio leasing
+ First half stabilised leasing totalled 67,778 sqm (equates to approximately 7% of the portfolio)
+ Occupancy of 99.5% with limited expiries remaining in FY20
+ FY21 expiries equate to 10.8% of portfolio, down from 15.0% as at March 2019
+ Development leasing a strong mixture of expansions for GMT’s existing customer base (15,976 sqm) and 4 new customers (6,405 sqm)
17
Lease expiry profile (% of portfolio income) Occupancy (% of portfolio income)
Interim Result 2020
Investment portfolio
0%
5%
10%
15%
20%
25%
Vacant FY20 FY21 FY22 FY23 FY24 FY25 FY26 FY27 FY28 >FY28
Vacant Expiring Income

64.0
10.2
+2.3
+6.2
+1.7 +0.3
-3.2
-10.2
74.2
71.3
40
45
50
55
60
65
70
75
80
1H19 Disposals Acquisitions Developments Underlyingportfolio
Other 1H20
GMT WPH GMT WPH
Net property income
Look-through net property income bridge ($m)
+ Income from acquisitions and developments in addition to like-for-like rental growth has mitigated much of the impact of asset disposals
+ Average occupancy of 99.2%, reflecting the portfolio re-weighting to Auckland Industrial
+ Underlying NPI growth equated to 3.4% for the period, (4.1% when adjusting for straightlining and the impact of fitout rents)
18
Interim Result 2020
Investment portfolio

Reversion event Estate New WH rental rate (psm)
% Increase on passing
Incentive (%)
Renewal Highbrook 130 4.9% 5.4%
Market Review (10% cap/collar)2 Highbrook 128 10.0% -
Market Review (10% cap/collar)2 The Gate 122 10.0% -
Market Review (10% cap/collar)2 Savill 119 10.0% -
Renewal M20 135 1.9% 7.1%
Income subject to reversion in 1H20
Rental increase from 1H20 reversion events
Rental increase from 1H20 reversion event pa1
Total 12.5% 7.3% 4.6%
Rental growth
Rental reversion
+ New leases, renewals and market reviews (reversion events) across 12.5% of portfolio produced average annualised passing rental increases of 4.6%1
+ Strength of market rental growth has resulted in a number of market reviews being limited to the pre agreed capped level
1 Increase in contract rental for reversion events divided by number of years since the last time the rental was reviewed 2 A cap/collar is an agreement whereby rental cannot go up or down by more than a certain percentage upon a market rent review 19
Interim Result 2020
Investment portfolio
Leasing and market review examples above 10,000 sqm

+ Portfolio assessed as being 7.6% under-rented as at 30 September1
+ 36% of portfolio is subject to market review or expiry prior to the end of FY22. Of these, 34% are subject to a form of cap with an average cap on rental increases of 9%
+ Fixed reviews have an average increase of 2.6% per annum
Future reversions
Portfolio review profile (% of portfolio income)
20
Interim Result 2020
Investment portfolio
1 Internally assessed as at 30 September 2019 (face market rental vs. face passing rental across portfolio)
19%
57% 54%
3%
11%8%
3%
5%
5%
2%
11%15%
0%
10%
20%
30%
40%
50%
60%
70%
80%
90%
2H20 FY21 FY22
Fixed CPI Market Expiries

Metrics
Expansion net lettable area 15,976 sqm
Total project cost $48.4m
Yield on additional cost 7.7%
Yield on total cost (incl. land) 5.7%
Expansion of Mainstream at Savill Link and Ingram Micro at M20 Business Park:
+ 5,972 sqm of expansion space to cater for businesses which are
currently operating their facilities at capacity
+ Average term to expiry of 7.3 years
+ Developments add to the expansion workbook announced in
September 2019, which included expansions of the OfficeMax
and Panasonic buildings at Highbrook Business Park
Customer expansions
Highlights – customer expansions1
Mainstream – Savill Link
Ingram Micro – M20 Business Park 21
Interim Result 2020
Investment portfolio
1 All customer expansions commenced in FY20 including: OfficeMax, Panasonic, Mainstream and Ingram Micro

Savill Link
99%complete1
Mainstream expansion
22
Savill Drive Units
100%occupancy
$365.4mvaluation
1 Post completion of current development programme

Ingram Micro expansion
M20 9,000
M20 Business Park
23
100%complete1
$279.9mvaluation
100%occupancy
1 Post completion of current development programme

Estate Total project cost ($m)
Lettable area (sqm)
Expected completion date2 Leased
Highbrook 156.1 47,107 Feb-21 43%
Savill Link 25.2 7,502 Oct-20 51%
Westney 16.4 8,347 Dec-20 0%
M20 37.9 13,582 Dec-20 32%
Total 235.6 76,538 38%
Current development programme
+ 15 warehouses completed by GMT on a build-to-lease basis in FY19 are fully leased
+ Current development programmeof 76,538 sqm is 38% committed (49% terms agreed) and average time to completion of nine months1
— average warehouse face rent achieved on current workbook of $135 psm and incentives of 4.7%
+ GMT’s exposure to build-to-lease (uncommitted) development remains low, equating to just 4.4% of total portfolio
24
Work-in-progress summary Leasing exposure
sqm
Currently under construction 76,538
Uncommitted 48,954
Total GMT portfolio 1,116,869
Exposure 4.4%
Interim Result 2020
Investment portfolio
1 Weighted by total project cost2 Last completion date of current work in progress

25Gateway warehouses - Highbrook Business Park

Outlook
Underlying fundamentals are expected to continue to drive sustainable growth in the Auckland Industrial market
+ Scarcity of land in infill locations likely to result in increased brownfield development / site intensification
+ Industry continues to see significant change with customers re-evaluating supply chains and becoming more focused on locations which provide
efficient and timely distribution within a congested transport network
+ Expect to see increased use of technology & automation as distributors seek to maximise productivity from within existing assets
+ Structural trends are expected to continue to attract strong capital investment into the sector
GMT focused on making the right decisions for the long term
+ The location of GMT’s real estate will support our customers supply chain evolution, forecast to provide resilient cash flows in a low interest rate /
low growth environment
+ Substantial balance sheet capacity to further increase footprint in preferred Auckland markets through incremental site acquisitions in line with
strategy
26
Interim Result 2020
Summary and outlook

27Goodman office – VXV Precinct
Disclaimer: The information and opinions in this presentation were prepared by Goodman (NZ) Limited on behalf of Goodman Property Trust and its subsidiaries (Goodman).Goodman makes no representation or warranty as to the accuracy or completeness of the information in this presentation.Opinions including estimates and projections in this presentation constitute the current judgment of Goodman as at the date of this presentation. They are subject to change without notice. Such opinions are not guarantees or predictions of future performance, and involve known and unknown risks, uncertainties and other factors, many of which are beyond Goodman’s control, and which may cause actual results to differ materially from those expressed in this presentation.Goodman undertakes no obligation to update any information or opinions whether as a result of new information, future events or otherwise.This presentation is provided for information purposes only.No contract or other legal obligations shall arise between Goodman and any recipient of this presentation.Neither Goodman, nor any of its Board members, officers, employees, advisers or other representatives will be liable (in contract or tort, including negligence, or otherwise) for any direct or indirect damage, loss or cost (including legal costs) incurred or suffered by any recipient of this presentation or other person in connection with this presentation.

28NCI Packaging – Savill Link

Work-in-progress summary
29
Interim Result 2020
Appendix
Development Estate Total project cost ($m)
Lettable area (sqm)
Expected completion date Leased
Underwood 1,000 Highbrook Business Park 3.6 1,026 Oct-19 Uncommitted
The Crossing Carpark Highbrook Business Park 12.7 - Dec-19 50%
El Kobar Units Highbrook Business Park 18.0 5,330 Dec-19 34%
Underwood 2,600 Highbrook Business Park 9.4 2,990 Dec-19 100%
Business Parade 3,100 Highbrook Business Park 11.2 3,530 Dec-19 100%1
Panasonic Expansion Highbrook Business Park 8.0 2,660 Feb-20 100%
Big Chill Expansion Highbrook Business Park 13.2 5,203 Feb-20 100%
Savill Drive Units Savill Link 18.0 5,482 Mar-20 64%1
OfficeMax Expansion Highbrook Business Park 20.3 7,344 Jul-20 100%
El Kobar 10,000 Highbrook Business Park 26.1 10,400 Sep-20 Uncommitted
Waiouru Point Highbrook Business Park 15.1 4,359 Oct-20 Uncommitted
Westney 4,500 Westney Industry Park 9.8 4,970 Oct-20 Uncommitted
M20 9,000 M20 Business Park 25.0 9,630 Dec-20 Uncommitted
68 Westney Road Westney Industry Park 6.6 3,377 Dec-20 100%1
Island Units Highbrook Business Park 18.3 4,265 Feb-21 Uncommitted
Total existing projects 215.6 70,566
Ingram Micro Expansion M20 Business Park 12.8 3,952 Oct-20 100%
Mainstream Expansion Savill Link 7.2 2,020 Oct-20 100%
Total new developments (announced 14 November 2019) 20.0 5,972
Total work in progress 235.6 76,538
1 Includes terms agreed by way of Heads of Agreement

Profit or loss
30
Interim Result 2020
Appendix

Balance sheet
31
Interim Result 2020
Appendix

Cash flows
32
Interim Result 2020
Appendix