google analytics annual report 2016 - tourism partners site · google analytics annual report 2016...
TRANSCRIPT

KOOTENAY ROCKIES TOURISMGoogle Analytics Annual Report 2016
Report Created ByNavigator Multimedia Inc.
March 30, 2017

TABLE OF CONTENTS
2016 OVERVIEW 1 2016 vs 2015: Noteworthy KPI’s 2 Sessions by Month 2 Mobile (including Tablet) Organic Search Tra�c 3 Demographic and Interests 5 Device Breakdown (Sessions) 6 Internet Browser Breakdown 6 Top Countries 7 Top Provinces / States 7 Top 20 Cities 7 Top Tra�c Sources 8 Top Referring Sites 8 Noteworthy Backlinks 8
PEAK SEASON 9 Peak Season Acquisition 10 Mobile Impact 11 Peak Season Behaviour 11
SOCIAL MEDIA 13 Top Social Referrals by platform 14 Top 10 Social Referral by Country 15 Top Social Referrals by Device 16
TOP PERFORMING BLOG POSTS 17
TOP /PARTNER/ PAGES 19
TOP LANDING PAGE REPORT 21 Top landing pages by sessions 22
SITE SPEED 23
ANALYTICS GLOSSARY 25
TABLE OF CONTENTS

2016 OVERVIEW
1
2016 OVERVIEW 2
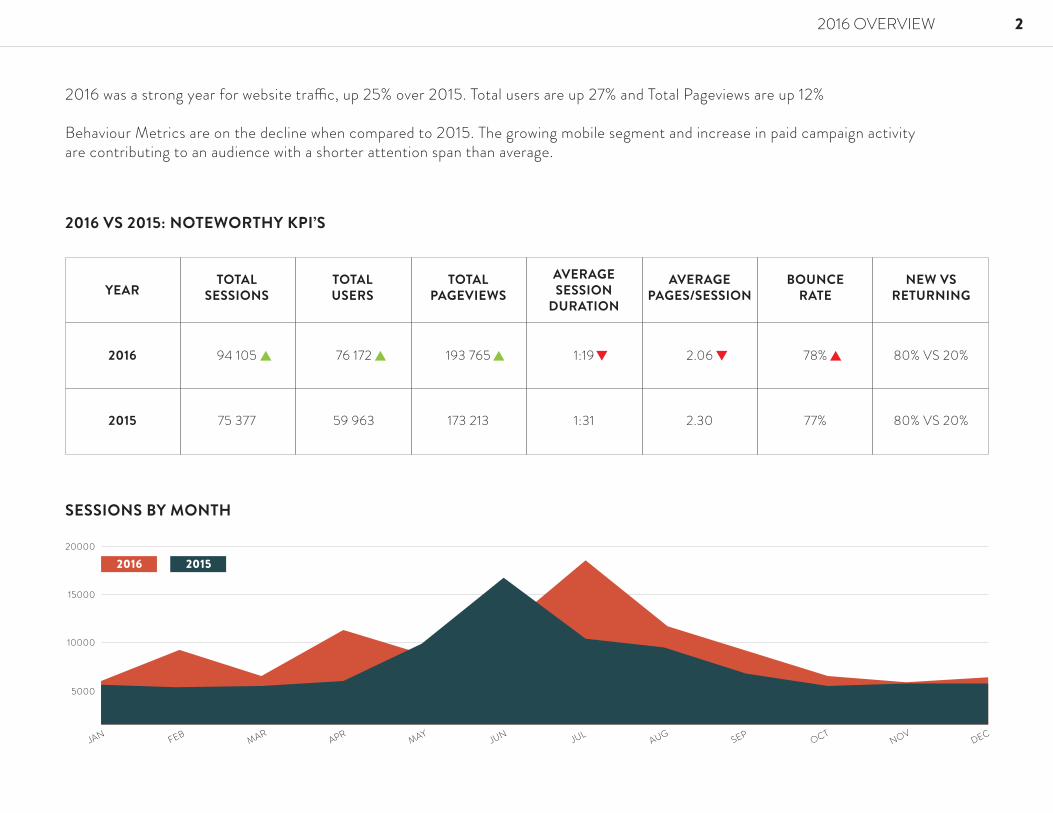
2016 VS 2015: NOTEWORTHY KPI’S
TOTALSESSIONSYEAR
2016 94 105 76 172 193 765 1:19 2.06 78% 80% VS 20%
75 377 59 963 173 213 1:31 2.30 77% 80% VS 20%2015
TOTALUSERS
TOTALPAGEVIEWS
AVERAGESESSION
DURATION
AVERAGEPAGES/SESSION
BOUNCERATE
NEW VSRETURNING
JAN FEB MAR APR MAY JUN JUL AUG SEP OCTNOV
DEC
5000
10000
15000
20000
2016 2015
SESSIONS BY MONTH
2016 was a strong year for website tra�c, up 25% over 2015. Total users are up 27% and Total Pageviews are up 12%
Behaviour Metrics are on the decline when compared to 2015. The growing mobile segment and increase in paid campaign activityare contributing to an audience with a shorter attention span than average.
2016 OVERVIEW 3
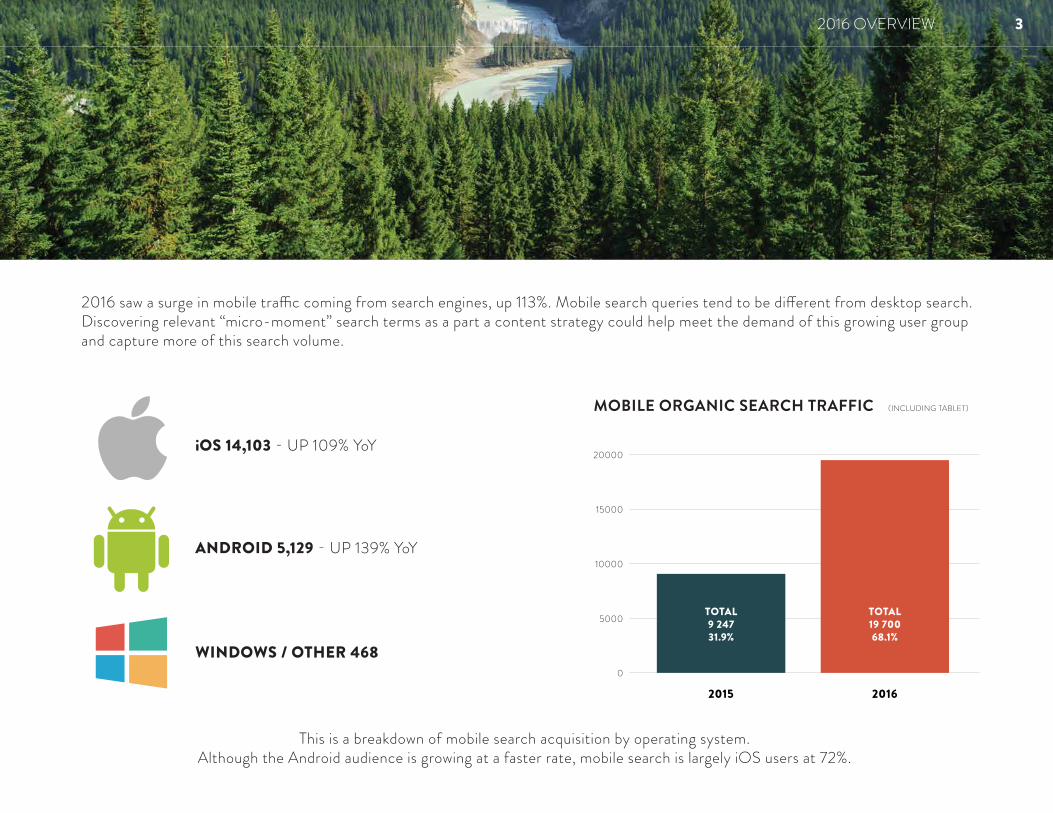
iOS 14,103 - UP 109% YoY
ANDROID 5,129 - UP 139% YoY
WINDOWS / OTHER 468
This is a breakdown of mobile search acquisition by operating system. Although the Android audience is growing at a faster rate, mobile search is largely iOS users at 72%.
2016 saw a surge in mobile tra�c coming from search engines, up 113%. Mobile search queries tend to be di�erent from desktop search. Discovering relevant “micro-moment” search terms as a part a content strategy could help meet the demand of this growing user group and capture more of this search volume.
MOBILE ORGANIC SEARCH TRAFFIC (INCLUDING TABLET)
5000
0
10000
15000
20000
20162015
TOTAL9 24731.9%
TOTAL19 70068.1%

4
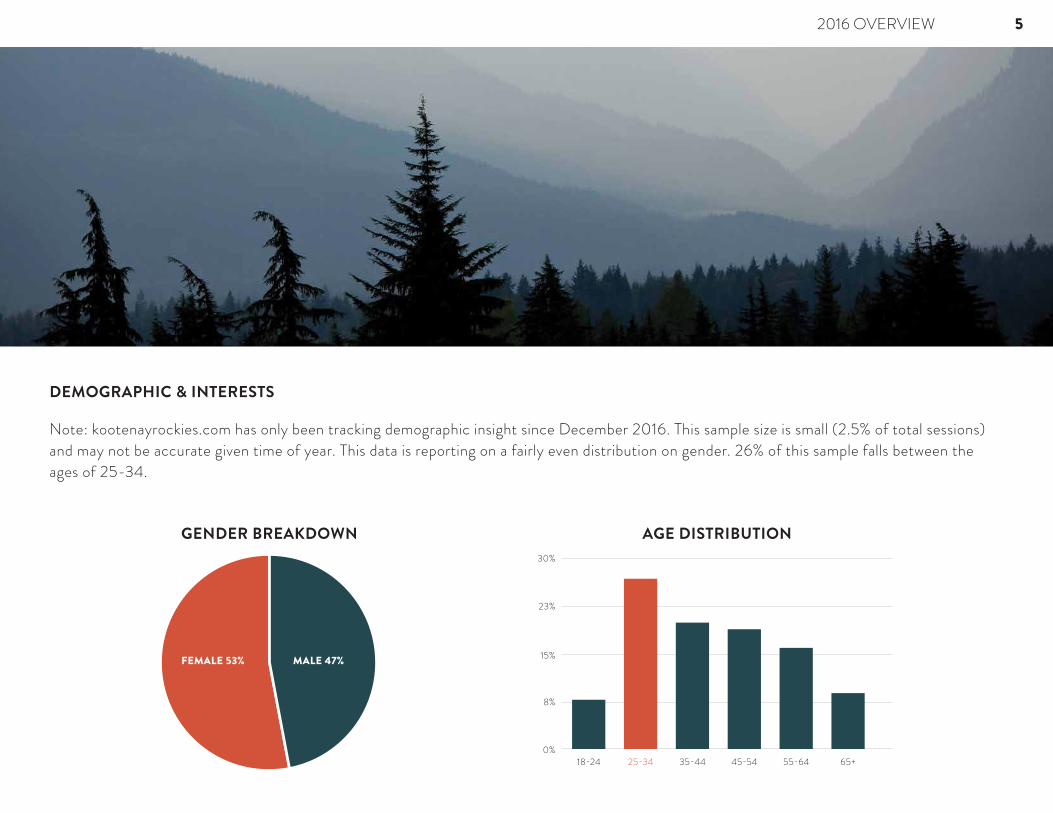
GENDER BREAKDOWN
FEMALE 53% MALE 47%
AGE DISTRIBUTION
8%
0%18-24 25-34 35-44 45-54 55-64 65+
15%
23%
30%
DEMOGRAPHIC & INTERESTS
Note: kootenayrockies.com has only been tracking demographic insight since December 2016. This sample size is small (2.5% of total sessions) and may not be accurate given time of year. This data is reporting on a fairly even distribution on gender. 26% of this sample falls between the ages of 25-34.
2016 OVERVIEW 5
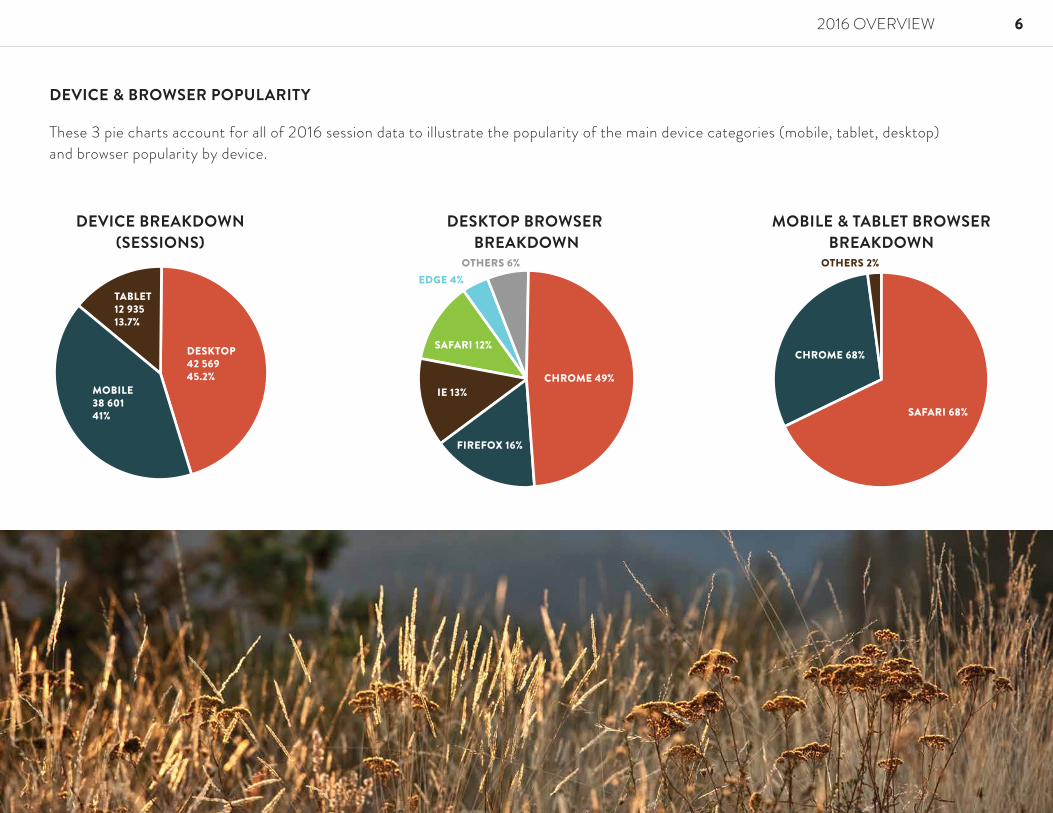
DEVICE BREAKDOWN(SESSIONS)
DESKTOP42 56945.2%
MOBILE38 60141%
TABLET12 93513.7%
DESKTOP BROWSER BREAKDOWN
CHROME 49%
FIREFOX 16%
IE 13%
SAFARI 12%
EDGE 4%OTHERS 6%
MOBILE & TABLET BROWSERBREAKDOWN
OTHERS 2%
SAFARI 68%
CHROME 68%
2016 OVERVIEW 6
DEVICE & BROWSER POPULARITY
These 3 pie charts account for all of 2016 session data to illustrate the popularity of the main device categories (mobile, tablet, desktop) and browser popularity by device.

CANADAUNITED STATESRUSSIA (SPAM)
UNITED KINGDOMGERMANY
AUSTRALIANETHERLANDS
KYRGYZSTANFRANCE
SWITZERLANDBRAZIL
NEW ZEALAND
0% 25% 50%
79%9%
4.39%
1%
BELOW 1%
75% 100%
TOP COUNTRIES
BRITISH COLUMBIAALBERTA
ONTARIOSASKATCHEWAN
QUEBECCALIFORNIA
MANITOBA
0% 15 000 30 000 45 000 60 000
TOP PROVINCES / STATES
CALGARY
VANCOUVER
NELSON
CRANBROOK
KIMBERLEY
KELOWNA
EDMONTON
TRAIL
INVERMERE
CASTLEGAR
FERNIE
CRESTON
TORONTO
REVELSTOKE
KAMLOOPS
VERNON
SURREY
VICTORIA
SASKATOON
REGINA
10,254
9,839
4,998
4,879
3,002
2,823
2,572
2,270
1,804
1,606
1,407
1,248
1,122
918
834
834
763
712
698
647
TOP CANADIAN CITIESSESSIONS
2016 OVERVIEW 7
GEOGRAPHIC OVERVIEW
Sessions are defined as users that have visited the website. The same user may visit the Kootenay Rockies website on their desktop, then later on their iPhone. Sessions account for both new and returning users. On average, 80% of sessions are new (unique), while 20% are returning visits. (Refer to table “new vs. Returning” column on page 2).
There will be some internal tra�c visiting the website from the Kimberley O�ce. By setting up an internal o�ce IP filter we can open a new Analytic view and begin excluding internal tra�c. 60% of these sessions (1,965) are returning users, which would suggest they are KRT sta�.

TOP TRAFFIC SOURCES
TOP REFERRING SITES
250
0
KRTOURISM.CA
BLOG.HELLOBC.COM
OBRIENS.KOOTENAYS.COM
TRAINSDELUXE.COM
CRESTONVALLEYBC.COM
500
750
1000
NOTEWORTHY BACKLINKS
• blog.hellobc.com• hellobc.com• pc.gc.ca• canada.startpagina.nl• en.wikipedia.org
Other websites (domains) that link to the Kootenay Rockies website can
help with users finding the right information online. However, not all
links are treated equal. Links from authoritative websites like govern-
ment, news publishers, Destination BC properties or even other DMO
websites have far greater perceived trust than young websites that don’t
see as much tra�c. Search engines like Google and Bing judge how
authoritative a domain is based on a number of factors, but building links
similar to the list above can help pass some of this domain authority to
its recipient, KootenayRockies.com.
Opportunity: Continue building links from other authoritative delegates
in tourism, press mentions and citations. 3rd party software like Moz,
Ahrefs and SEMrush can assist in identifying link building opportunities
in other parts of the web, as well as identify a more comprehensive
backlink list.
2016 OVERVIEW 8
GOOGLE 45.1%
FACEBOOK 31.2%
DIRECT OR UNTRACKED18.5%
BING 2% YAHOO 1.5% TWITTER 1% • o.canada.com• thestar.com• nytimes.com• cotr.bc.ca• flatheadbeacon.com

PEAK SEASON
9

The Peak Season Report looks at the busiest 3 months of the year for site tra�c: June, July, August. We look at tra�c from North America. Regions beyond North America were small sample sizes or deemed spam tra�c.
PEAK SEASON 10
PEAK SEASON ACQUISITION
JAN FEB MAR APR MAY JUN JUL AUG SEP OCTNOV
DEC
5000
10000
15000
20000
PEAK SEASON TOTAL SESSIONSN. American Peak Season visitation 92% YoY
34 368
17 858
201620150
10000
20000
30000
40000
CANADA SESSIONS
0
10000
20000
30000
40000
32 350
15 914
20162015
Canadian Sessions 103% YoY
USA SESSIONS
0
1000
2000
3000
4000
2 018
1 944
20162015
USA Sessions 4% YoY

PEAK SEASON 11
BOUNCE RATE
MOBILEDESKTOPTABLET
83%77%82%
71%70%71%
20152016
PAGES PER SESSION
MOBILEDESKTOPTABLET
1.672.531.78
2.393.032.42
20152016
AVG. SESSION DURATION
MOBILEDESKTOPTABLET
50s1m 57s
57s
1m 13s2m 53s1m 26s
20152016
iOS
0
5000
10000
15000
20000
15 368
7 654
20162015
iOs visitation 100% YoY
ANDROID
0
2000
4000
6000
10000
6 397
2 274
20162015
Android visitation 181% YoY
CHANNEL ACQUISITION
Organic Search 16 787 105% YoY
Social Media 11 026 294% YoY
Direct 4 831 4% YoY
Referral 1 721 6% YoY
MOBILE IMPACT
PEAK SEASON BEHAVIOUR
PEAK SEASON
During Peak Season (June-August) kootenayrockies.com sees 41% of its annual North American tra�c. Acquisition metrics are up signifi-cantly in Canada, and mobile acquisition is up more than double across our 2 main device groups iOS and Android. Organic search and Social Media (largely Facebook) fast movers in channel acquisition, while referral and direct channels have remained flat.
Acquisition metrics are generally up, but the behaviour metrics are down. The new Social Media (Facebook) tra�c in 2016 is made up of largely mobile, enter-and-exit tra�c. This segment is skewing our behaviour metrics downward with a bounce rate of 90%, Pages per session of 1.21, and an Average session duration of 24 seconds. This high growth segment has a short attention span, and there may be an opportunity to find ways to retain and hold this user on site for longer.
PEAK SEASON 12
SOCIAL MEDIA
13

TOP SOCIAL REFERRALS BY PLATFORM
SOCIAL MEDIA 14
SOCIAL NETWORK
FACEBOOK 26 221 (95.09%) 33 668 (93.98%) 0:00:32 1.28
1 015 (3.68%) 1 433 (4.00%) 0:00:31 1.41TWITTER
GOOGLE+
TRIP ADVISOR
188 (0.68%)
41 (0.15%)
33 (0.12%)
22 (0.08%)
17 (0.06%)
12 (0.04%)
386 (1.08%)
73 (0.20%)
66 (0.18%)
54 (0.15%)
81 (0.23%)
14 (0.04%)
0:01:07
0:01:20
0:05:18
0:05:50
0:02:57
0:00:05
2.05
1.78
2
2.45
4.76
1.17
SESSIONS PAGEVIEWS AVG. SESSION DURATION PAGES / SESSION
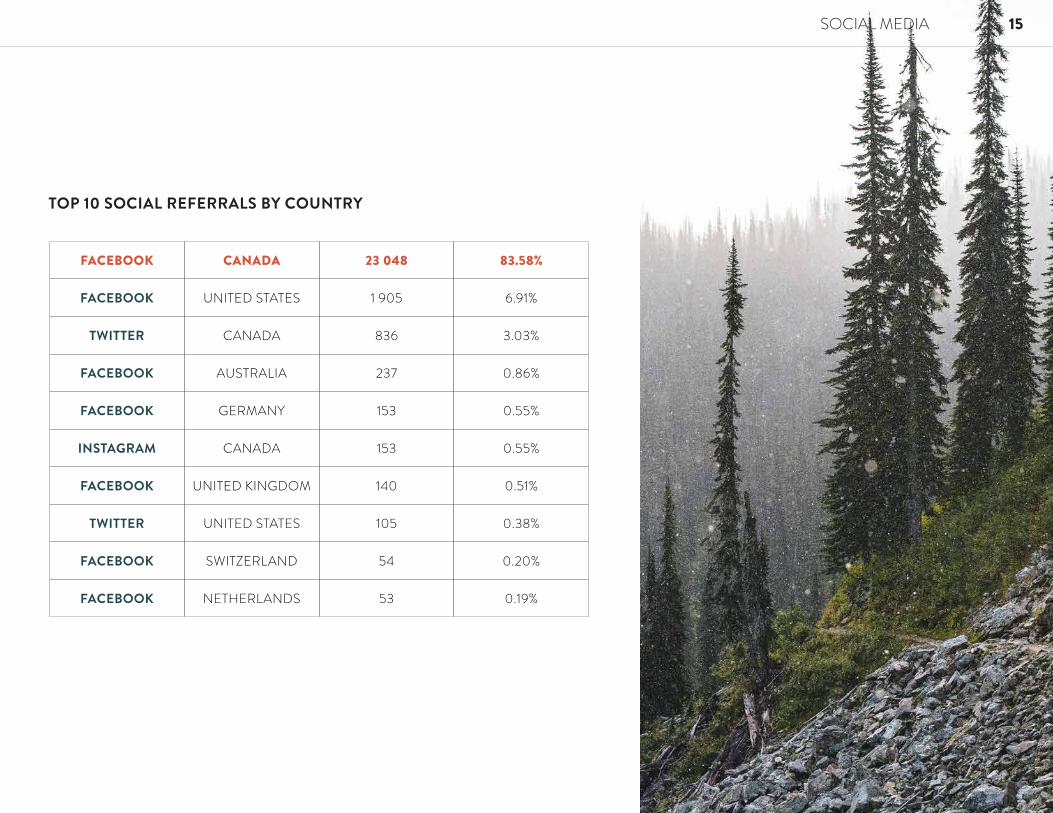
TOP 10 SOCIAL REFERRALS BY COUNTRY
CANADA
UNITED STATES
CANADA
AUSTRALIA
GERMANY
CANADA
UNITED KINGDOM
UNITED STATES
SWITZERLAND
NETHERLANDS
23 048
1 905
836
237
153
153
140
105
54
53
83.58%
6.91%
3.03%
0.86%
0.55%
0.55%
0.51%
0.38%
0.20%
0.19%
SOCIAL MEDIA 15
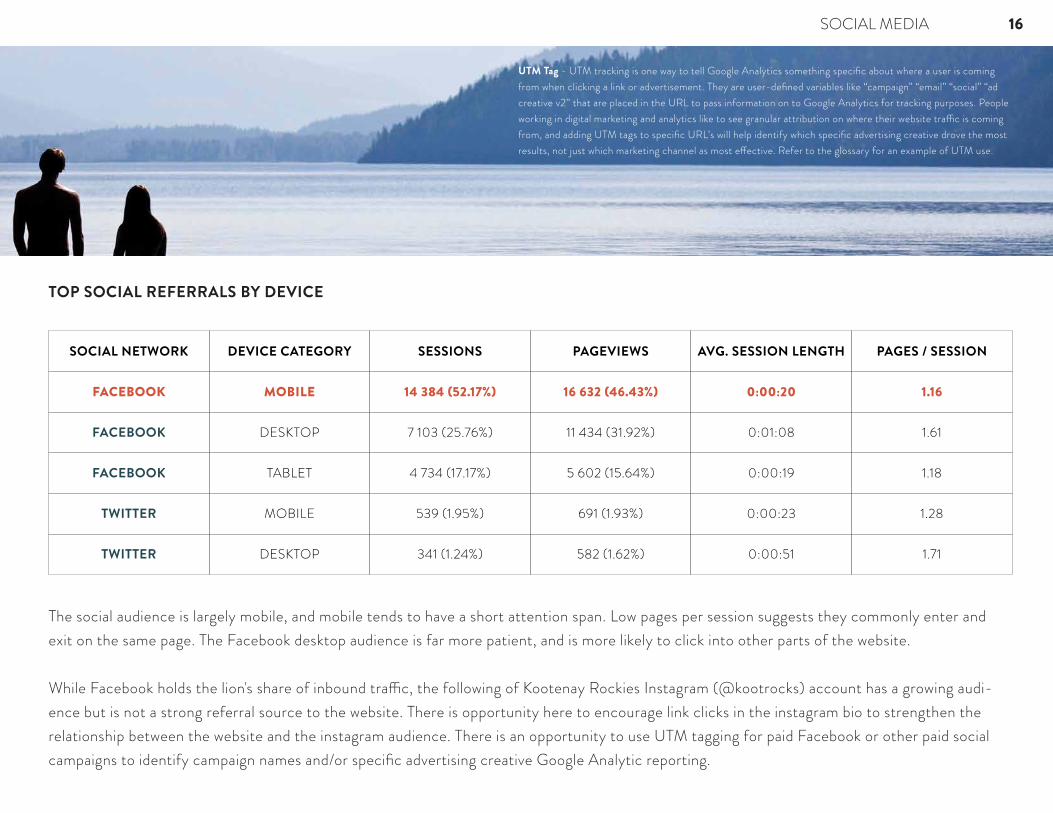
TOP SOCIAL REFERRALS BY DEVICE
SOCIAL NETWORK
MOBILE
DESKTOP
TABLET
MOBILE
DESKTOP
14 384 (52.17%)
7 103 (25.76%)
4 734 (17.17%)
539 (1.95%)
341 (1.24%)
16 632 (46.43%)
11 434 (31.92%)
5 602 (15.64%)
691 (1.93%)
582 (1.62%)
0:00:20
0:01:08
0:00:19
0:00:23
0:00:51
1.16
1.61
1.18
1.28
1.71
DEVICE CATEGORY SESSIONS PAGEVIEWS AVG. SESSION LENGTH PAGES / SESSION
The social audience is largely mobile, and mobile tends to have a short attention span. Low pages per session suggests they commonly enter and exit on the same page. The Facebook desktop audience is far more patient, and is more likely to click into other parts of the website.
While Facebook holds the lion's share of inbound tra�c, the following of Kootenay Rockies Instagram (@kootrocks) account has a growing audi-ence but is not a strong referral source to the website. There is opportunity here to encourage link clicks in the instagram bio to strengthen the relationship between the website and the instagram audience. There is an opportunity to use UTM tagging for paid Facebook or other paid social campaigns to identify campaign names and/or specific advertising creative Google Analytic reporting.
SOCIAL MEDIA 16
UTM Tag - UTM tracking is one way to tell Google Analytics something specific about where a user is coming from when clicking a link or advertisement. They are user-defined variables like “campaign” “email” “social” “ad creative v2” that are placed in the URL to pass information on to Google Analytics for tracking purposes. People working in digital marketing and analytics like to see granular attribution on where their website tra�c is coming from, and adding UTM tags to specific URL’s will help identify which specific advertising creative drove the most results, not just which marketing channel as most e�ective. Refer to the glossary for an example of UTM use.
TOP PERFORMING BLOG POSTS
17

PAGE
/blog/post/swimming-holes 6 062 (20.29%) 5 658 (20.73%) 5 636 (21.33%) 94.45% 92.63%
4 455 (14.91%) 4 235 (15.52%) 4 229 (16.00%) 94.63% 94.10%
3 524 (11.80%) 3 228 (11.83%) 3 215 (12.17%) 91.63% 90.78%
1 902 (6.37%) 1 851 (6.78%) 1 837 (6.95%) 96.90% 95.79%
1 536 (5.14%) 1 244 (4.56%) 1 224 (4.63%) 83.33% 75.85%
1 012 (3.39%) 942 (3.45%) 933 (3.53%) 76.42% 75.99%
1 002 (3.35%) 928 (3.40%) 915 (3.46%) 81.09% 79.64%
706 (2.36%) 648 (2.37%) 637 (2.41%) 76.42% 75.99%
705 (2.36%) 661 (2.42%) 629 (2.38%) 89.67% 86.81%
654 (2.19%) 597 (2.19%) 580 (2.19%) 88.62% 85.93%
/blog/post/top-10-whitewater
/blog/post/the-pipe
/blog/post/picnic-spots
/blog/post/trail-events
/blog/post/kootenay-ghost-towns
/blog/post/farmers-market-explosion
/blog/post/lakit-lookout
/post/kootenay-unique-attractions
/post/the-powder-highway-101
PAGEVIEWS UNIQUE PAGEVIEWS ENTRANCES BOUNCE RATE % EXIT
TOP PERFORMING BLOG POSTS 18
Blog content makes up 29,872 pageviews or 15% of total annual pageviews. Of which, 26,426 are entrances, largely from Facebook. There is opportunity here to reduce bounce rate and improve these pages even further by adding images, video, and internal linking to engage the user. This would also have a positive e�ect on organic page rank.
TOP PARTNER PAGES
19

Partner pages make up 59,723 or 30% of the total annual pageviews. Of which, 38,033 are entrances, largely from Google Search. There is opportunity here to reduce bounce rate and improve these pages even further by adding images, video, and internal linking to engage the user. This would also have a positive e�ect on organic page rank.
PAGE
/partner/ghost-towns/ 3 523 (5.90%) 3 202 (6.00%) 2 958 (7.78%) 90.97%
3 376 (5.65%) 3 028 (5.67%) 2 708 (7.12%) 69.24%
3 069 (5.14%) 2 781 (5.21%) 2 504 (6.58%) 84.78%
2 428 (4.07%) 2 259 (4.23%) 2 241 (5.89%) 91.88%
1 492 (2.50%) 1 322 (2.48%) 1 317 (3.46%) 87.93%
1 288 (2.16%) 1 210 (2.27%) 1 195 (3.14%) 92.30%
1 210 (2.03%) 1 083 (2.03%) 921 (2.42%) 83.82%
1 158 (1.94%) 1 023 (1.92%) 1 005 (2.64%) 89.45%
935 (1.57%) 870 (1.63%) 792 (2.08%) 90.28%
858 (1.44%) 814 (1.52%) 791 (2.08%) 92.67%
/partner/hot-springs-route/
/partner/halfway-river-hot-springs/
/partner/valhalla-park/
/partner/kootenay-trout-hatchery
/partner/top-of-the-world/
/partner/buhl-creek-hot-springs/
/partner/mt-assiniboine/
/partner/whiteswan-lake-park/
/partner/kokanee-glacier/
PAGEVIEWS UNIQUE PAGEVIEWS ENTRANCES BOUNCE RATE
TOP /PARTNER/ PAGES 20

TOP LANDING PAGE REPORT
21

TOP LANDING PAGE REPORT 22
BLOG26 456 - 28.2%HOME PAGE
20 415 - 21.8%
EVENTS & OTHER8 442 - 9%
PARTNER PAGE 38 489 - 41%
TOP LANDING PAGE REPORT
The Partner Page section of the website outperforms the rest of the website in acquiring organic search tra�c.
Breaking out the Blog tra�c by entry source, we can see the majority (91%) of inbound tra�c to the blog is coming from a Referral source. The referral source has been identified as Facebook.
Note: Referral is boosted/paid Facebook blog posts. The Kootenay Rockies blog has an opportunity to improve their keyword targeting strategy and working with other DMO’s/stakeholders to cross promote blog content. This would o�er a significant SEO advantage as well as referral visibility. The goal here is to diversify the blog entries between referral, direct, and organic.
Home/blog/post/swimming-holes/blog/post/top-10-whitewater/blog/post/the-pipe/partner/ghost-towns/partner/hot-springs-route/partner/halfway-river-hot-springs/partner/valhalla-park/blog/post/picnic-spots /cat/ski-snowboard
20 4155 6364 2293 2152 9582 7082 5042 2411 837
1 400
TOP LANDING PAGES BY SESSIONS
ORGANIC31 534 - 81.9%
DIRECT - 3 942 - 10.2%
REFERRAL - 3 008 - 7.8%
PARTNER LANDING PAGE ENTRY SOURCE
REFERRAL8 213 - 40.2%
DIRECT7 016 - 34.4%
ORGANIC5,186 - 25.4%
HOME LANDING PAGEENTRY SOURCE
BLOG LANDING PAGEENTRY SOURCE
DIRECT - 1 939 - 7.3%
ORGANIC - 361 - 7.3%
REFERRAL24 142 - 91.3%
SITE SPEED
23
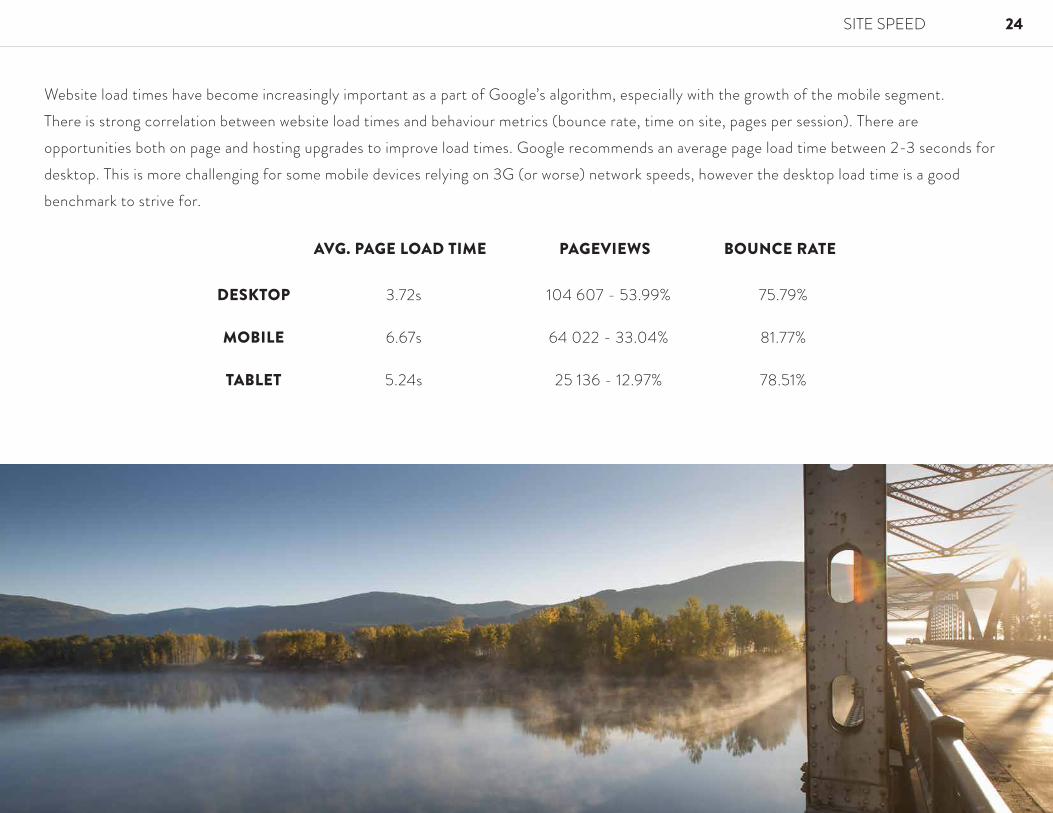
Website load times have become increasingly important as a part of Google’s algorithm, especially with the growth of the mobile segment. There is strong correlation between website load times and behaviour metrics (bounce rate, time on site, pages per session). There are opportunities both on page and hosting upgrades to improve load times. Google recommends an average page load time between 2-3 seconds for desktop. This is more challenging for some mobile devices relying on 3G (or worse) network speeds, however the desktop load time is a good benchmark to strive for.
SITE SPEED 24
AVG. PAGE LOAD TIME
DESKTOP
MOBILE
TABLET
3.72s
6.67s
5.24s
104 607 - 53.99%
64 022 - 33.04%
25 136 - 12.97%
75.79%
81.77%
78.51%
PAGEVIEWS BOUNCE RATE

25
ANALYTICS GLOSSARY
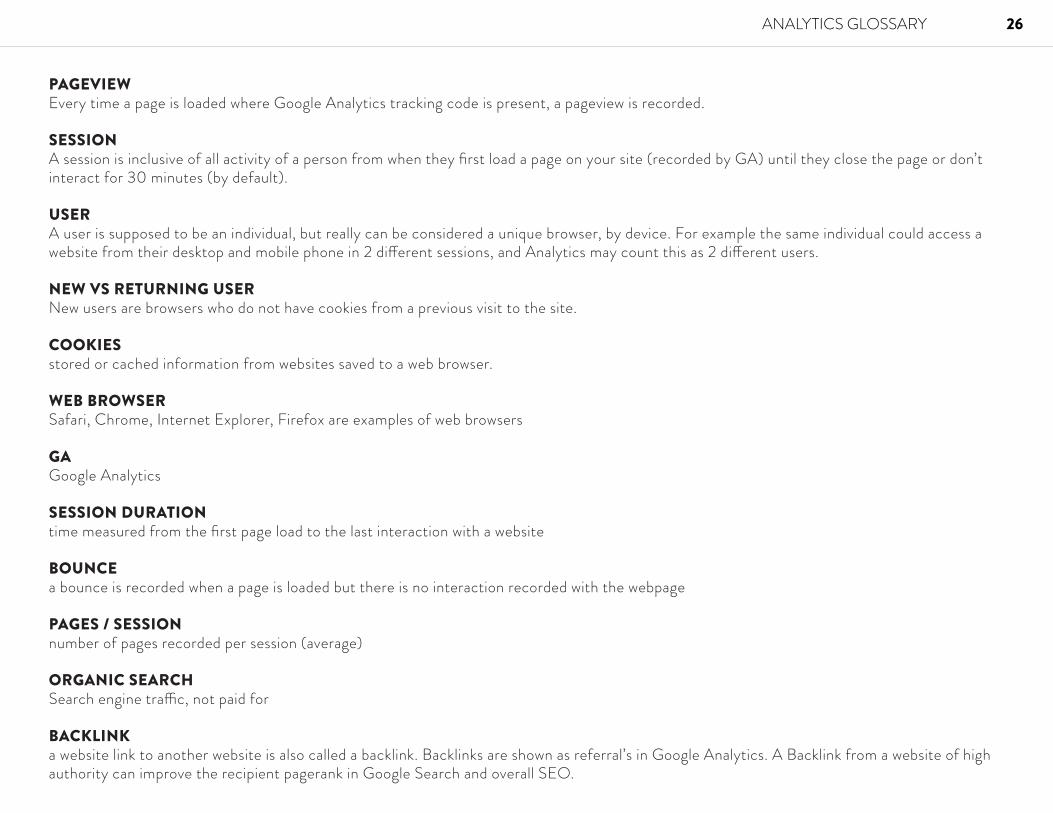
PAGEVIEWEvery time a page is loaded where Google Analytics tracking code is present, a pageview is recorded.
SESSIONA session is inclusive of all activity of a person from when they first load a page on your site (recorded by GA) until they close the page or don’t interact for 30 minutes (by default).
USERA user is supposed to be an individual, but really can be considered a unique browser, by device. For example the same individual could access a website from their desktop and mobile phone in 2 di�erent sessions, and Analytics may count this as 2 di�erent users.
NEW VS RETURNING USERNew users are browsers who do not have cookies from a previous visit to the site.
COOKIESstored or cached information from websites saved to a web browser.
WEB BROWSERSafari, Chrome, Internet Explorer, Firefox are examples of web browsers
GAGoogle Analytics
SESSION DURATIONtime measured from the first page load to the last interaction with a website
BOUNCEa bounce is recorded when a page is loaded but there is no interaction recorded with the webpage
PAGES / SESSIONnumber of pages recorded per session (average)
ORGANIC SEARCHSearch engine tra�c, not paid for
BACKLINKa website link to another website is also called a backlink. Backlinks are shown as referral’s in Google Analytics. A Backlink from a website of high authority can improve the recipient pagerank in Google Search and overall SEO.
ANALYTICS GLOSSARY 26
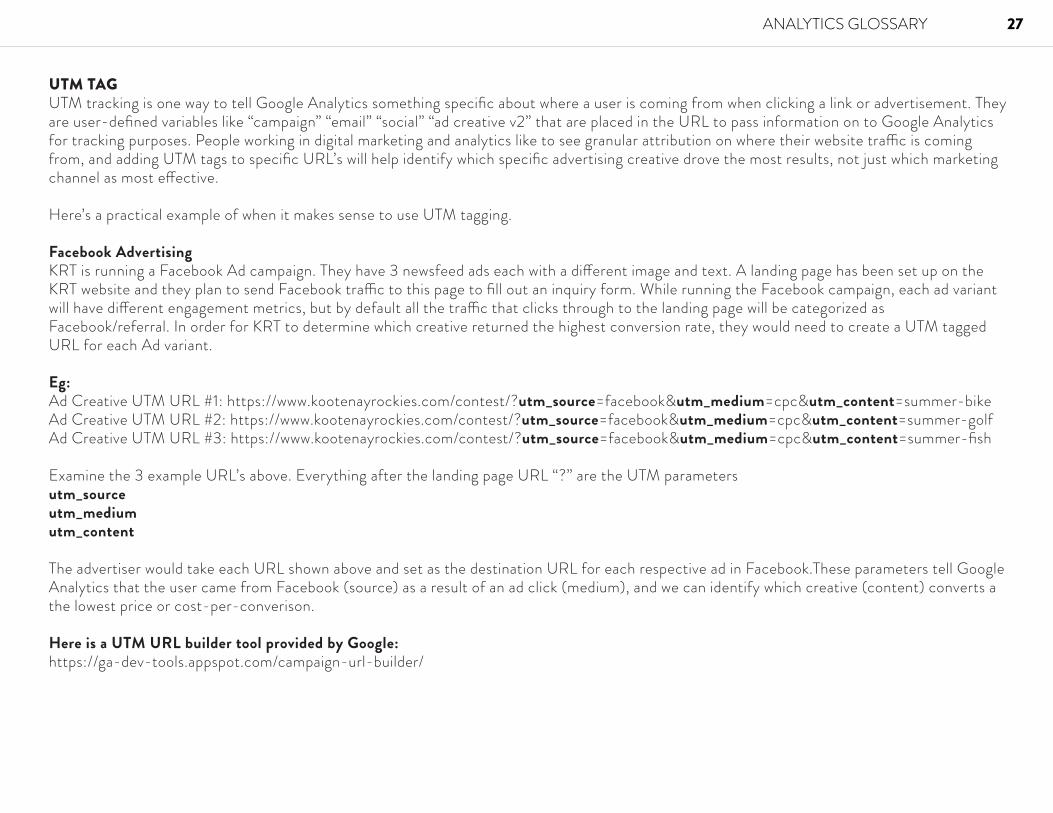
UTM TAGUTM tracking is one way to tell Google Analytics something specific about where a user is coming from when clicking a link or advertisement. They are user-defined variables like “campaign” “email” “social” “ad creative v2” that are placed in the URL to pass information on to Google Analytics for tracking purposes. People working in digital marketing and analytics like to see granular attribution on where their website tra�c is coming from, and adding UTM tags to specific URL’s will help identify which specific advertising creative drove the most results, not just which marketing channel as most e�ective.
Here’s a practical example of when it makes sense to use UTM tagging.
Facebook AdvertisingKRT is running a Facebook Ad campaign. They have 3 newsfeed ads each with a di�erent image and text. A landing page has been set up on the KRT website and they plan to send Facebook tra�c to this page to fill out an inquiry form. While running the Facebook campaign, each ad variant will have di�erent engagement metrics, but by default all the tra�c that clicks through to the landing page will be categorized as Facebook/referral. In order for KRT to determine which creative returned the highest conversion rate, they would need to create a UTM tagged URL for each Ad variant.
Eg:Ad Creative UTM URL #1: https://www.kootenayrockies.com/contest/?utm_source=facebook&utm_medium=cpc&utm_content=summer-bikeAd Creative UTM URL #2: https://www.kootenayrockies.com/contest/?utm_source=facebook&utm_medium=cpc&utm_content=summer-golfAd Creative UTM URL #3: https://www.kootenayrockies.com/contest/?utm_source=facebook&utm_medium=cpc&utm_content=summer-fish
Examine the 3 example URL’s above. Everything after the landing page URL “?” are the UTM parameters utm_sourceutm_mediumutm_content
The advertiser would take each URL shown above and set as the destination URL for each respective ad in Facebook.These parameters tell Google Analytics that the user came from Facebook (source) as a result of an ad click (medium), and we can identify which creative (content) converts a the lowest price or cost-per-converison.
Here is a UTM URL builder tool provided by Google:https://ga-dev-tools.appspot.com/campaign-url-builder/
ANALYTICS GLOSSARY 27

Questions or [email protected]
KOOTENAY ROCKIES TOURISMGoogle Analytics Annual Report 2016
March 30, 2017