google consumer barometer - storage.googleapis.com filegoogle consumer barometer the internet in...
TRANSCRIPT

1 / 28
Google Consumer BarometerThe Internet in Numbers 2012 - 2016

2 / 28 Introduction
Over the last five years, the market research company Kantar TNS, commissioned by Google, has polled consumers from around the world on their internet habits. The answers reveal monumental changes in media habits and indeed daily life brought about by the internet in just half a decade. It’s time to stop and reflect on the development.
In 2012, we started out with 40 selected global markets, both small and big, developed and developing1. Back then, 72% of consumers were internet users. Five years later, it’s up to 80% in the same 40 markets - hundreds of millions of new users have joined the ranks of internet users across the world. Read more on how the internet became global property on page 3.
One of the biggest developments in the period has arguably been the massive rise of the smartphone. In 2012, one in three consumers across 40 markets had access to a smartphone. Just four years later, the number has grown to a staggering 70%. Learn more about the success of the smartphone on page 7.
Simultaneously with the growth of the smartphone, consumers around the world have acquired more and more internet-connected devices. Make sense of the multiscreen world on page 11.
The smartphone is now our primary device. It’s what we use to keep up with friends, consume entertainment and do our shopping. We studied how consumers put their trusted sidekick to use on page 15.
The first thing you did this morning was probably check your smartphone. It’s also what you use for taking photos, listening to music, and a plethora of other tasks. We’ve mapped the everyday revolution on page 19.
1 The 40 original markets in the survey are: Argentina (AR), Australia (AU),
Austria (AT), Belgium (BE), Brazil (BR), Canada (CA), China (CN), Czech
Republic (CZ), Denmark (DK), Egypt (EG), Finland (FI), France (FR), Germany
(DE), Greece (GR), Hong Kong (HK), Hungary (HU), Ireland (IE), Israel (IL), Italy
(IT), Japan (JP), Mexico (MX), Netherlands (NL), New Zealand (NZ), Norway
(NO), Poland (PL), Portugal (PT), Romania (RO), Russia (RU), Kingdom of
Saudi Arabia (KSA), Slovakia (SK), South Africa (ZA), Spain (ES), Sweden (SE),
Switzerland (CH), Taiwan (TW), Turkey (TR), United Arab Emirates (UAE), Unit-
ed Kingdom (UK), Ukraine (UA) and USA. Since 2012 we have expanded the
survey with Bulgaria (BG), Croatia (HR), Estonia (EE) India (IN), Indonesia (ID),
Kenya (KR), Latvia (LV), Lithuania (LT), Malaysia, (MY), Nigeria (NG), Serbia
(RS), Singapore (SG), Slovenia (SI), South Korea (KR), Phillipines (PH),
Thailand (TH) and Vietnam (VN).

3 / 28
The Internet: Global Property

4 / 28 The Internet: Global Property
Since 2012, we have polled consumers around the world on their internet habits. The growth of internet access has been staggering: Hundreds of millions of new internet users. Across 40 markets, 80% of consumers are now internet users for personal purposes - up from 72% in just four years.
People who use the internet do so more and more: 6 in 10 of internet users now use the internet several times a day, up from less than 4 in 10 in 2012.
But it’s one thing if people use the internet. We’ve also looked at their habits and sentiment. Across all markets, 8 in 10 internet users tell us that the internet is the first place they look when they need information. Six in 10 prefer to do a task digitally when they have the opportunity.
One of those tasks might be shopping, so we polled consumers on where they bought their last product (within select categories): Globally, more than one in four bought their last product online as opposed to 60% in a store. And by the way, 7 in 10 tell us that using the internet is fun. We couldn’t agree more.It comes as no surprise that the younger you are,
the more likely you are to use the internet: 94% of the population under 25 across all markets are internet users, while this only goes for a little more than half of those over the age of 55.
But to get a true understanding of adoption patterns, it’s not enough to look only at the big picture. For example, in some markets, such as Australia, Singapore and the Scandinavian countries, four out of five over the age of 55 are internet users. In India and Indonesia the same is only true for approximately 1 in 20 in the same age group.
Younger Indonesians are catching up, though. An Indonesian under the age of 25 will find that more than 80% of his or her peers are internet users, an adoption rate not far behind the same age groups in markets such as Brazil (89%) or Serbia (94%). In most developed markets the adoption rate is now over 95% for the youngest group.
However, the biggest growth potential for the internet is not based on age, but on income level. In some developed markets such as Austria, Belgium or Italy, only 2 in 3 with a low income level are internet users, with even lower adoption rates in developing markets.

5 / 28
More and More People Use the Internet More and MoreQuestion asked: How often do you access the Internet for personal reasons, i.e. all non-business or work related purposes? Please think about your usage habits during the last month (see page 24).
The Internet Is Used Daily by All Age GroupsQuestion asked: How often do you access the Internet for personal reasons, i.e. all non-business or work related purposes? (see page 24)
The Internet Is Our First Place to Look for InformationQuestion asked: To what extent do you agree or disagree with the following statements? Please evaluate each of the following statements on a scale from 1 - strongly agree to 5 - strongly disagree. When I need information, the first place I look is the Internet (see page 24)
Most People Are Online Several Times a DayQuestion asked: How often do you access the Internet for personal reasons, i.e. all non-business or work related purposes? (see page 24)
2012
Under 25 yrs. Under 25 yrs.
84% 85% 82% 79% 72%
25-34 yrs. 25-34 yrs.35-44 yrs. 35-44 yrs.45-55 yrs. 45-54 yrs.55 + yrs. 55 + yrs.
Se
vera
l tim
es a
day
O
nce
a da
y
2-
6 tim
es a
wee
k
O
nce
a w
eek
2-
3 tim
es a
mon
th
O
nce
a m
onth
Le
ss th
an o
nce
a m
onth
N
ever
2013 2014 2015 2016
0% 0%
0% 0%
15% 15%
25% 25%
45% 45%
30% 30%
50% 50%
75% 75%
Several times a day
Daily
60% 60%
100% 100%
Once a day or less
Weekly
Never
Monthly or less
6 / 28
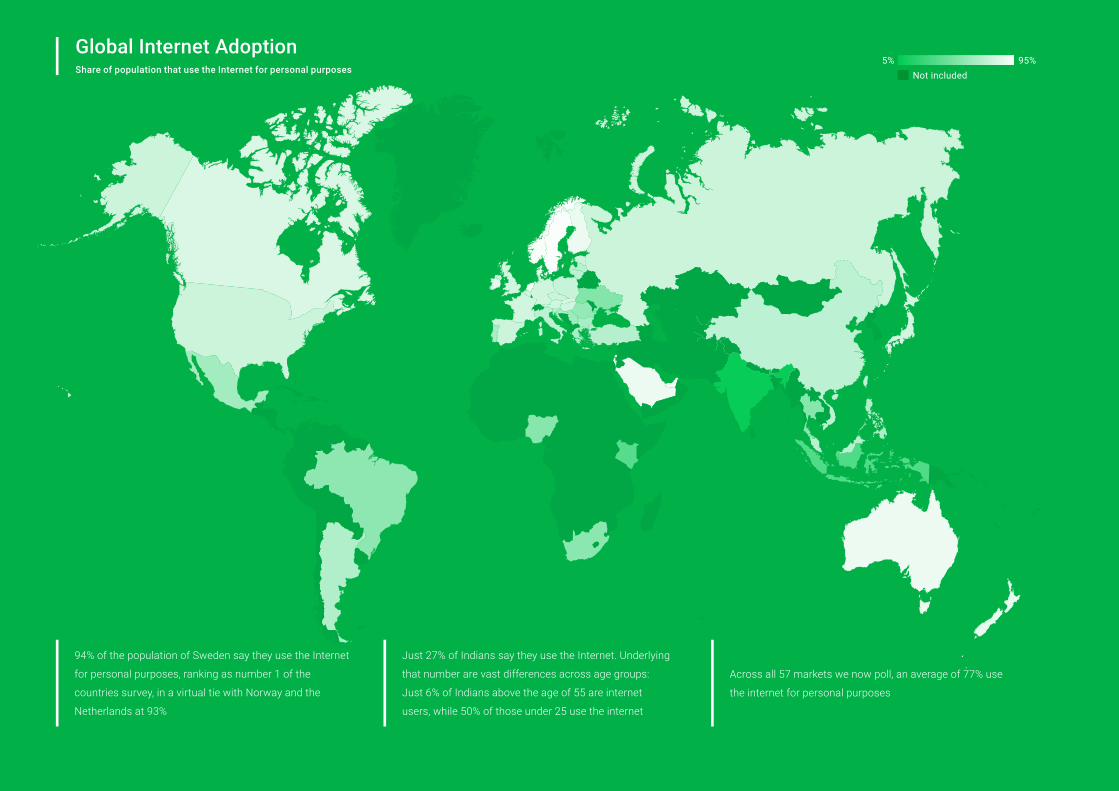
94% of the population of Sweden say they use the Internet
for personal purposes, ranking as number 1 of the
countries survey, in a virtual tie with Norway and the
Netherlands at 93%
Just 27% of Indians say they use the Internet. Underlying
that number are vast differences across age groups:
Just 6% of Indians above the age of 55 are internet
users, while 50% of those under 25 use the internet
Across all 57 markets we now poll, an average of 77% use
the internet for personal purposes
Global Internet AdoptionShare of population that use the Internet for personal purposes
95%5%Not included

7 / 28
Smartphone Success

8 / 28 Smartphone Success
One of the biggest developments in recent years has been the rise of the smartphone. In 2012, one in three consumers across 40 markets had access to a smartphone. Just four years later, the number has risen to a staggering 70%. Smartphones have truly become ubiquitous, and our research shows that this growth has happened across all markets: From Australia (80% smartphone users) to China (79%), and from Norway (83%) to the United States (72%).
The growth of the smartphone has been swift across all demographics. Although in general younger people got hold of smartphones first, their parents’ generation is getting ready to catch up on a global level. This trend has already materialized in developed markets. Take Sweden, for instance, where 7 out of 10 of all Swedes over the age of 45 are smartphone users. In developing markets, the trend is occurring at a slower rate: Only 3 out of 10 Brazilians over the age of 45 say they are smartphone users.
To a consumer in a developed market, it might seem that they have been swiping and tapping forever. But to really take in how massive the rise of the smartphone continues to be on a global level, consider this: We asked smartphone users across 56 markets and in all demographics how long they had been using their smartphone? One in eight told us that they had just started within the last six months.
Due to this rapid adoption of smartphones, something really fascinating is happening: The computer is being leapfrogged by smartphones in developing markets. In Vietnam for instance, PC adoption rates are fairly flat: 44% use a PC. Compare this to smartphone adoption, which is at 72% and continues to outgrow the computer.
The same trend is happening in markets with high adoption rates: The smartphone is playing catch-up with the computer. Take Switzerland for example, where 84% tell us they are computer users (desktop, laptop or netbook), but 77% are already smartphone users. The days of thinking of the smartphone as a secondary device are over.
One thing is whether you’re a smartphone user. But how often do consumers actually go online on their smartphone vs. their computer or tablets? Across 40 markets globally, we’ve asked them year after year. The answers illustrate that the smartphone not only holds a place in our pocket, but also grows in our habits.
Roughly one third of smartphone users tell us they access the internet more often via a smartphone than a computer/tablet. Another third use both devices equally. So, for two thirds of smartphone users, the smartphone is not a secondary device. A massive change since 2012, where four in five used a computer or tablet more than a smartphone.

9 / 28
Smartphone Adoption Has Doubled in Just Four YearsQuestion asked: Which, if any, of the following devices do you currently use? Smartphone (see page 25)
It’s Not That We Stopped Using Computers. It’s Just an Age ThingQuestion asked: How often do you use the Internet - through your web browser or apps - for personal reasons (i.e. all non business or work-related purposes) on a [computer / smartphone / tablet]? (see page 25)
Massive Change: The Smartphone Is No Longer a Secondary DeviceQuestion asked: How often do you use the Internet - through your web browser or apps - for personal reasons (i.e. all non business or work-related purposes) on a [computer / smartphone / tablet]? (see page 25)
Two Thirds Say the Smartphone Is Not Their Secondary DeviceQuestion asked: How often do you use the Internet - through your web browser or apps - for personal reasons (i.e. all non business or work-related purposes) on a [computer / smartphone / tablet]? (see page 25)
Q1 / 2012
33%
Under 25 yrs. 201225-34 yrs. 201335-44 yrs. 201445-55 yrs. 201555 + yrs. 2016
More often via smartphone than computer/tablet 32%
Equally via smartphone & computer / tablet 33%
More often via computer/tablet than smartphone 28%
Q1 / 2013 Q1 / 2014 Q1 / 2015 Q1 / 2016
70%
20%
0% 0%
40%
20% 25%
60%
40% 50%
60% 75%
More often via computer/tablet than smartphone
More often via smartphone than computer/tablet
80%
80% 100%
40%30%20%10%0%
Equally via smartphone & computer/tablet
More often via computer/tablet than smartphone More often via smartphone than computer/tablet
10 / 28
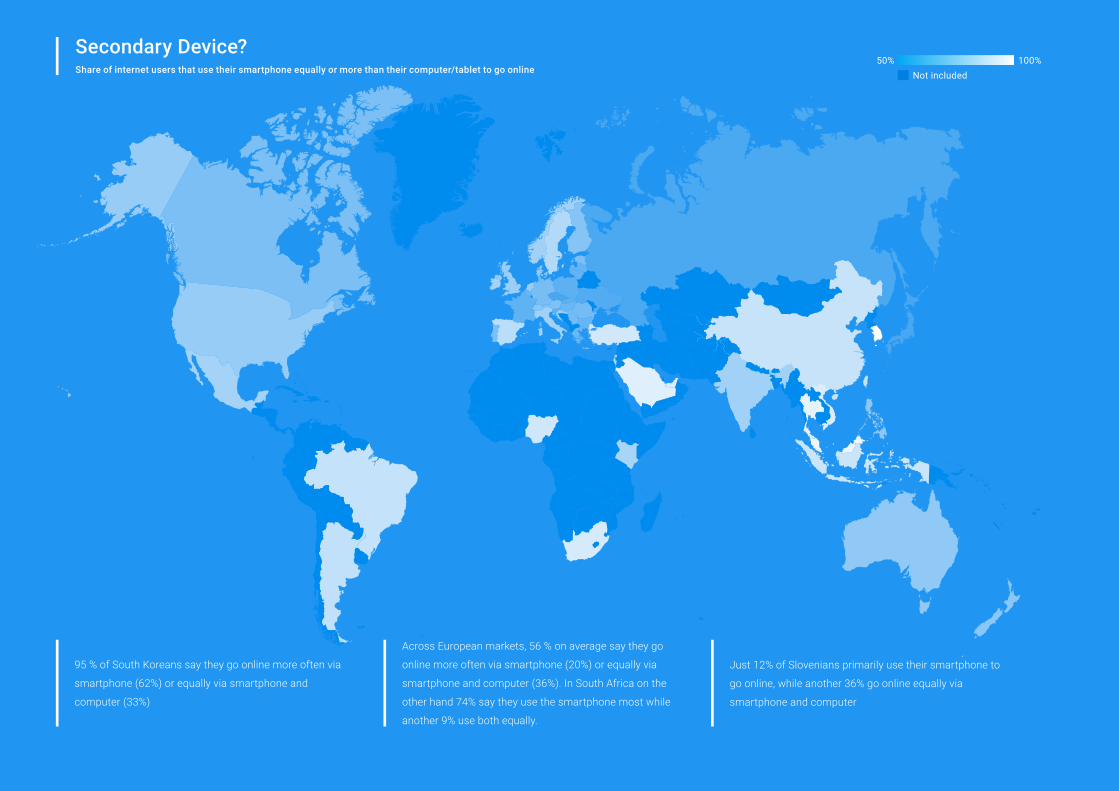
95 % of South Koreans say they go online more often via
smartphone (62%) or equally via smartphone and
computer (33%)
Across European markets, 56 % on average say they go
online more often via smartphone (20%) or equally via
smartphone and computer (36%). In South Africa on the
other hand 74% say they use the smartphone most while
another 9% use both equally.
Just 12% of Slovenians primarily use their smartphone to
go online, while another 36% go online equally via
smartphone and computer
Secondary Device?Share of internet users that use their smartphone equally or more than their computer/tablet to go online
100%50%Not included

11 / 28
Multiscreen World
12 / 28 Multiscreen World
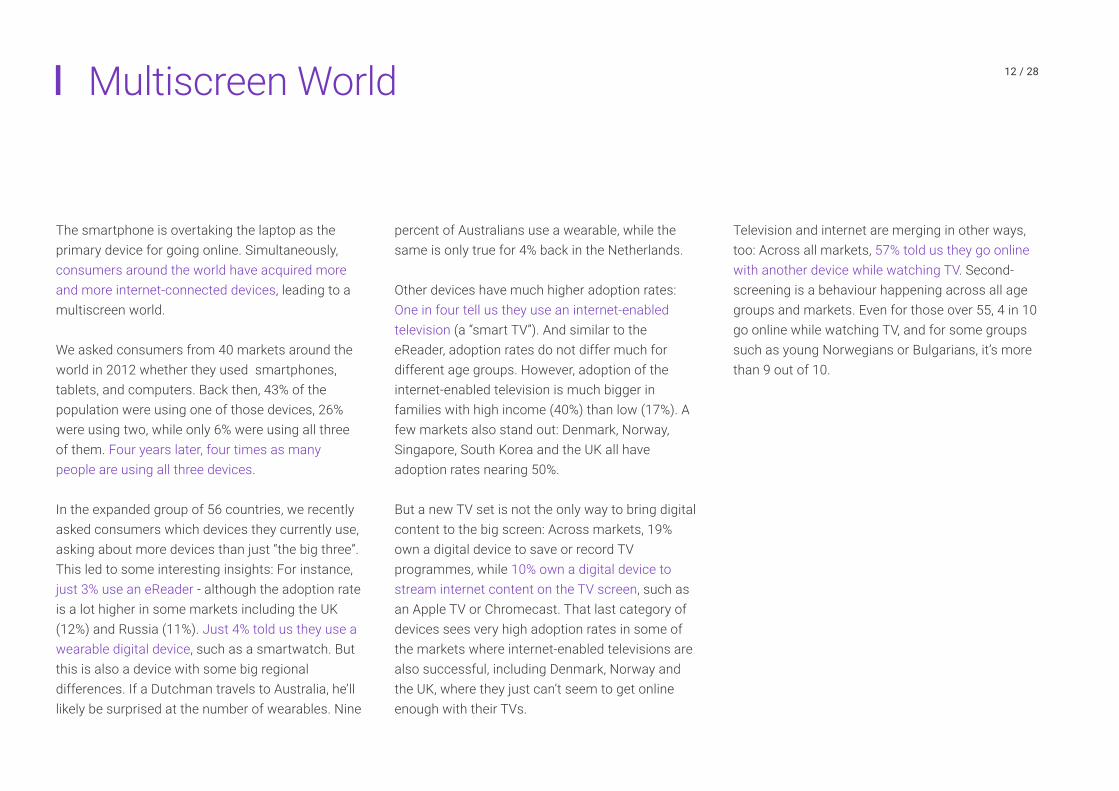
The smartphone is overtaking the laptop as the primary device for going online. Simultaneously, consumers around the world have acquired more and more internet-connected devices, leading to a multiscreen world.
We asked consumers from 40 markets around the world in 2012 whether they used smartphones, tablets, and computers. Back then, 43% of the population were using one of those devices, 26% were using two, while only 6% were using all three of them. Four years later, four times as many people are using all three devices.
In the expanded group of 56 countries, we recently asked consumers which devices they currently use, asking about more devices than just “the big three”. This led to some interesting insights: For instance, just 3% use an eReader - although the adoption rate is a lot higher in some markets including the UK (12%) and Russia (11%). Just 4% told us they use a wearable digital device, such as a smartwatch. But this is also a device with some big regional differences. If a Dutchman travels to Australia, he’ll likely be surprised at the number of wearables. Nine
percent of Australians use a wearable, while the same is only true for 4% back in the Netherlands.
Other devices have much higher adoption rates: One in four tell us they use an internet-enabled television (a “smart TV”). And similar to the eReader, adoption rates do not differ much for different age groups. However, adoption of the internet-enabled television is much bigger in families with high income (40%) than low (17%). A few markets also stand out: Denmark, Norway, Singapore, South Korea and the UK all have adoption rates nearing 50%.
But a new TV set is not the only way to bring digital content to the big screen: Across markets, 19% own a digital device to save or record TV programmes, while 10% own a digital device to stream internet content on the TV screen, such as an Apple TV or Chromecast. That last category of devices sees very high adoption rates in some of the markets where internet-enabled televisions are also successful, including Denmark, Norway and the UK, where they just can’t seem to get online enough with their TVs.
Television and internet are merging in other ways, too: Across all markets, 57% told us they go online with another device while watching TV. Second-screening is a behaviour happening across all age groups and markets. Even for those over 55, 4 in 10 go online while watching TV, and for some groups such as young Norwegians or Bulgarians, it’s more than 9 out of 10.

13 / 28
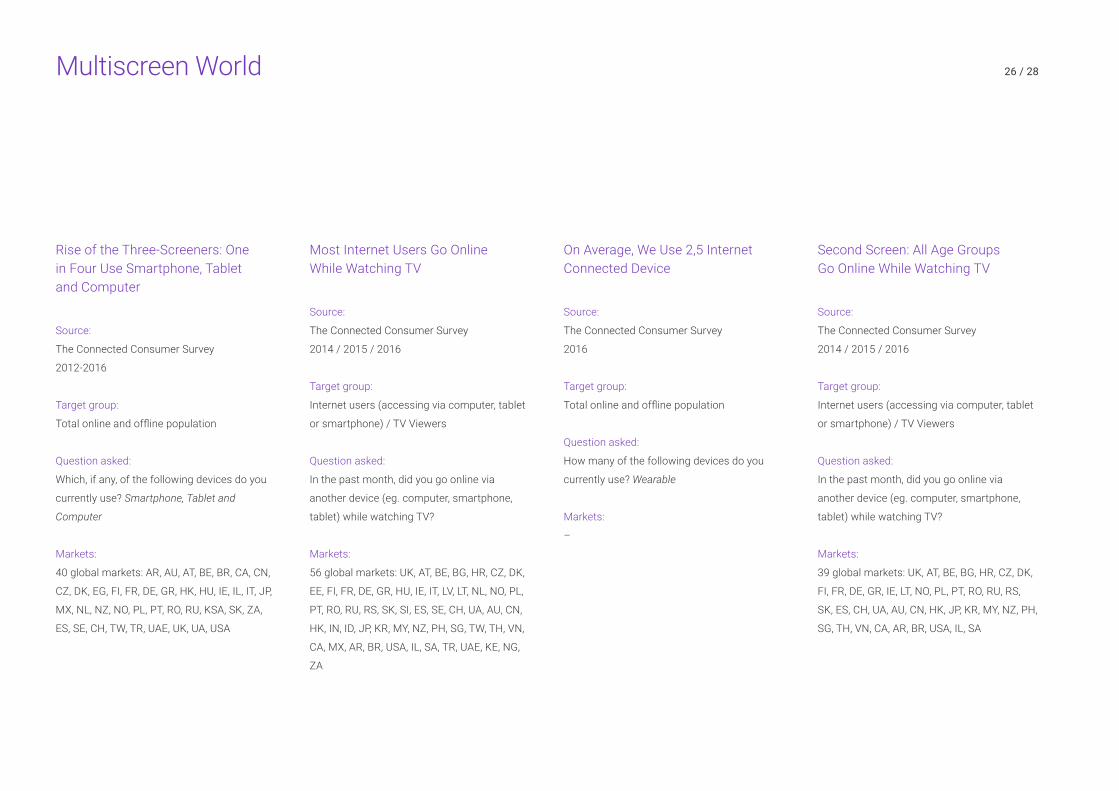
Rise of the Three-Screeners: One in Four Use Smartphone, Tablet and ComputerQuestion asked: Which, if any, of the following devices do you currently use? Smartphone, Tablet and Computer (see page 26)
Vast differences in adoption of wearablesQuestion asked: How many of the following devices do you currently use? (Wearable) (see page 26)
Second Screen: All Age Groups Go Online While Watching TVQuestion asked: In the past month, did you go online via another device (eg. computer, smartphone, tablet) while watching TV? (see page 26)
Most Internet Users Go Online While Watching TVQuestion asked: In the past month, did you go online via another device (eg. computer, smartphone, tablet) while watching TV? (see page 26)
2012
Under 25 yrs.Greece Nigeria India Hong Kong Sweden USA AustraliaAverage 25-34 yrs. 35-44 yrs. 45-54 yrs. 55 + yrs.
2013 2014 2015 2016
0%
0%0%
8%
20%2%
23%
15%
40%4%
60%
6%
8%
30%
80%10%
58%... of internet users go online
while watching TV
14 / 28
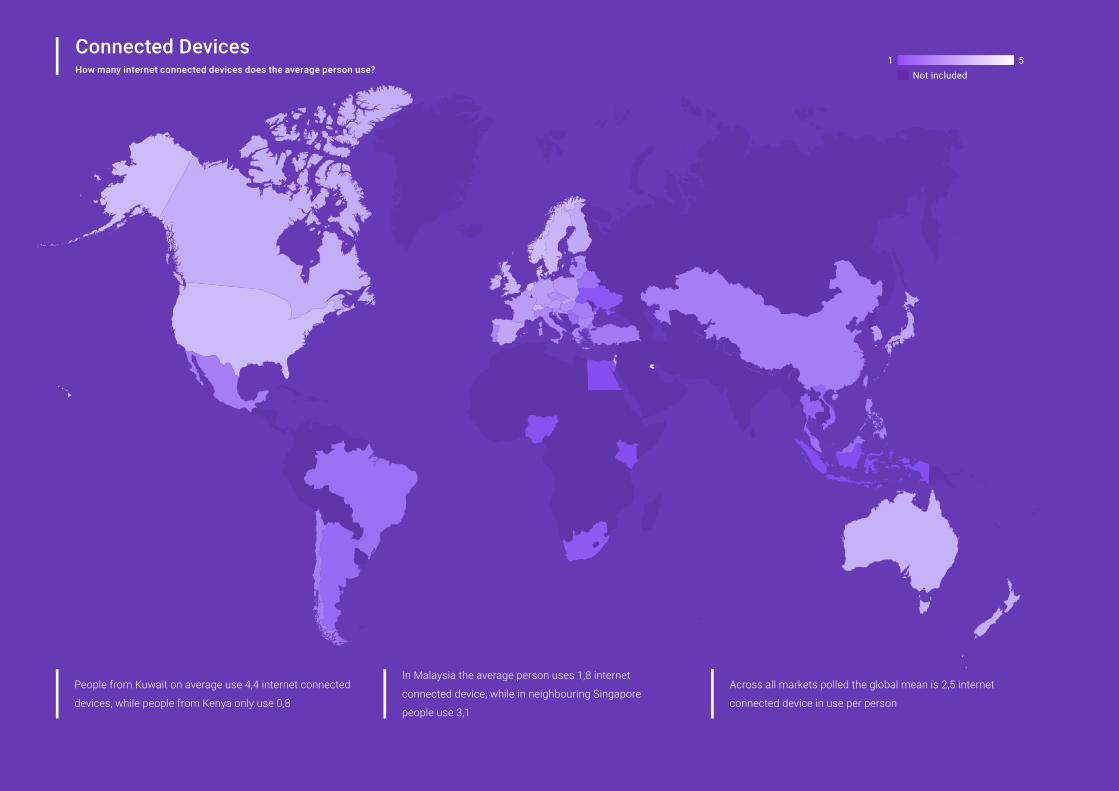
People from Kuwait on average use 4,4 internet connected
devices, while people from Kenya only use 0,8
In Malaysia the average person uses 1,8 internet
connected device, while in neighbouring Singapore
people use 3,1
Across all markets polled the global mean is 2,5 internet
connected device in use per person
Connected DevicesHow many internet connected devices does the average person use?
51Not included

15 / 28
Trusted Sidekick

16 / 28 Trusted Sidekick
In order examine to what extent the smartphone is taking over the role as the primary device, we’ve asked internet users what tasks they do with their smartphones and how often. Our new companion is the smartphone, and users from around the globe tell us a riveting story about how they put their smartphones to use.
Some tasks have caught on very rapidly on smartphones. Search engines, for instance, are now used on smartphones by 51% of internet users, rivalling the reach of search on computers. And we know from other data sources that the sheer volume of searches on smartphones has already surpassed that of computers. The smartphone is transforming how we watch video: 4 in 10 internet users tell us that they watch online video on their smartphone every week. And the younger you are, the more common this is. If you are under 25, two thirds of your peers watch online video on smartphones every week. In the same age group, 58% watch online video on their computer every week.
Across most of Asia and the Middle East, watching online video on your smartphone is especially common. In Hong Kong, Malaysia, Saudi Arabia, Singapore, Taiwan, Thailand, Turkey and the United Arab Emirates, more than 60% report this behaviour. But no country matches Vietnam, where more than three in four internet users tell us they watch online video on their smartphone every week, including half of Vietnamese over the age of 55.
If you are young, the smartphone is also where you go to interact with your friends. Three in four internet users under the age of 25 tell us that they visit social networks on their phone every week, and almost as many do so daily. Just over half within the same age group visit social networks on their computer every week.
This trend really shows across the European markets, where 81% of those under 25 visit social networks on their smartphones weekly, while the same is only true for 14% of those over the age of 55. Among all internet users across all 56 markets, 51% visit social networks on their phone every week.
Those under 25 are much more prone to using their smartphone than the computer for a variety of tasks. Every week, 70% use search engines, 54% check email, 19% play games, and 26% look for product information.
The smartphone is also catching up as a shopping device: Globally, one in five look for product information on their smartphone at least weekly, while 4% tell us they use their phone to purchase products or services at least weekly, rivaling the use of computers for these purposes. In some countries, the smartphone is even more popular. For example, in the UK 19% are buying products or services on their phone at least weekly, while 35% look for product information. This trend is also more distinct the younger consumers are.

17 / 28
Let Me Just Google ThatQuestion asked: How often do you – through your web browser or apps on a smartphone? Use search engines (at least weekly) (see page 27)
Sent From My Phone: Smartphones Have Become an Email Tool as Widespread as the ComputerQuestion asked: How often do you – through your web browser or apps on a smartphone / tablet / computer? Check email (at least weekly) (see page 27)
If You Are Young, the Smartphone Is the Device to Meet Your Friends. Three in Four Use Social Networks on Their Phones WeeklyQuestion asked: How often do you – through your web browser or apps on a smartphone? Visit social networks (at least weekly) (see page 27)
0%
0%
20%
15%
60%
40%
30%
45%
80%
60%
51%... of internet users use search engines
on their smartphones every week Under 25 yrs.
Vietnam 77
South Korea 54
USA 45
Japan 16
Turkey 68
Brazil 50
United Kingdom 43
Germany 26
China 33
Nigeria 7
Taiwan 64
Spain 48
Average (55 markets) 41
India 23
Smartphone
25-34 yrs.
Computer
35-44 yrs.
Tablet
45-54 yrs. 55 + yrs.
100%75%50%20%0%
76%
43% 46%
14%
67%
52%
40%
20%
Video on the Smartphone: We’re Using Our Phones to Stream Online Video. Selected MarketsQuestion asked: How often do you – through your web browser or apps on a smartphone? Watch online videos (at least weekly) (see page 27)

18 / 28
Across all markets polled, 41% of internet users watch
online videos on their smartphone at least weekly
In South Africa, just 11% of internet users watch online
vidoes on their smartphone at least weekly, while in
Vietnam 77% say the same
Across the four middle eastern countries polled, 64% say
they watch online videos on their smartphones at least
weekly. Across European markets, just 37%
Online VideoHow large a share of the population watches online video on their smartphone at least weekly?
80%10%Not included

19 / 28
Everyday Revolution

20 / 28 Everyday Revolution
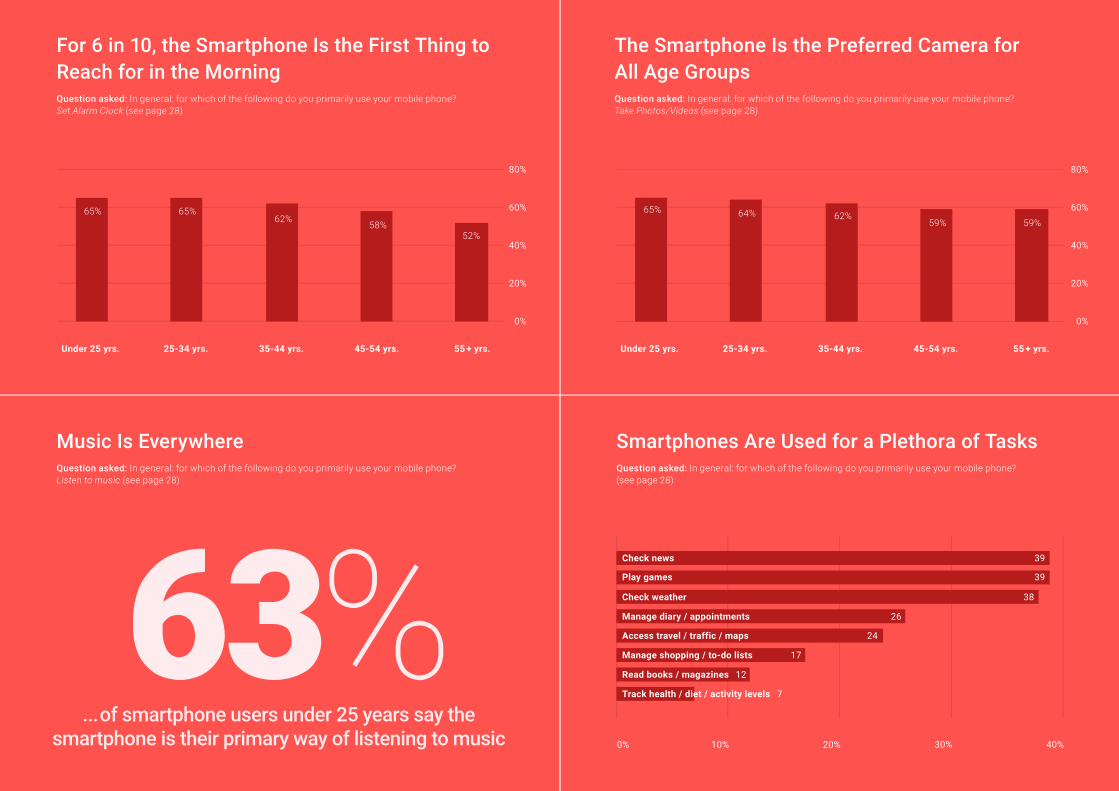
It’s probably been a long time since you set an alarm on an old fashioned alarm clock. Indeed, for more than half of smartphone users around the globe, their phone is now their favourite way to carry out everyday tasks such as telling time (60%) or setting their alarm clock (61%). This means that the smartphone is now the first thing you reach for in the morning, a silent transition that has taken place across virtually all markets and all age groups.
The alarm clock is obviously not the only piece of technology the smartphone is replacing. Two thirds of smartphone users tell us the phone is their primary means for taking photos. And this goes for all age groups, including 6 out of 10 people over the age of 55.
For half of smartphone users, it is also the primary way to listen to music. But with music, we see a distinct age gap: For those under 25, almost two out of three have the smartphone as their primary way to listen to music. But for the oldest age group, those over 55, the same applies only to one in four.
For early adopters, using your phone as a clock, a camera or a way of listening to music might seem quite mundane. And indeed, this is not all we use our smartphones for. For 39%, it’s the primary way to check the news (including one in three over the age of 55). A similar share of consumers has the phone as their primary means to check the weather and to play games. For one in four, it’s the primary way to access travel/traffic/maps, 17% manage shopping or to-do lists, and 26% primarily manage their diary and appointments on their smartphones.
There are, however, some smartphone activities that haven’t caught on (yet). Just 12% of smartphone users primarily read books and magazines on their phone. And only 7% tell us the smartphone is their primary way of tracking health/diet/activity.
21 / 28
For 6 in 10, the Smartphone Is the First Thing to Reach for in the MorningQuestion asked: In general: for which of the following do you primarily use your mobile phone? Set Alarm Clock (see page 28)
Music Is EverywhereQuestion asked: In general: for which of the following do you primarily use your mobile phone? Listen to music (see page 28)
Smartphones Are Used for a Plethora of TasksQuestion asked: In general: for which of the following do you primarily use your mobile phone? (see page 28)
The Smartphone Is the Preferred Camera for All Age GroupsQuestion asked: In general: for which of the following do you primarily use your mobile phone? Take Photos/Videos (see page 28)
0% 0%
20% 20%
60% 60%
40% 40%
80% 80%
Under 25 yrs. Under 25 yrs.25-34 yrs. 25-34 yrs.35-44 yrs. 35-44 yrs.45-54 yrs. 45-54 yrs.55 + yrs. 55 + yrs.
63%... of smartphone users under 25 years say the
smartphone is their primary way of listening to music 40%30%20% 10%0%
Access travel / traffic / maps
Check news
Check weather
Manage diary / appointments
Manage shopping / to-do lists
Play games
Read books / magazines
Track health / diet / activity levels
24
39
38
26
17
39
12
7
65% 65% 65% 64% 62% 62% 58% 59%
52%59%
22 / 28
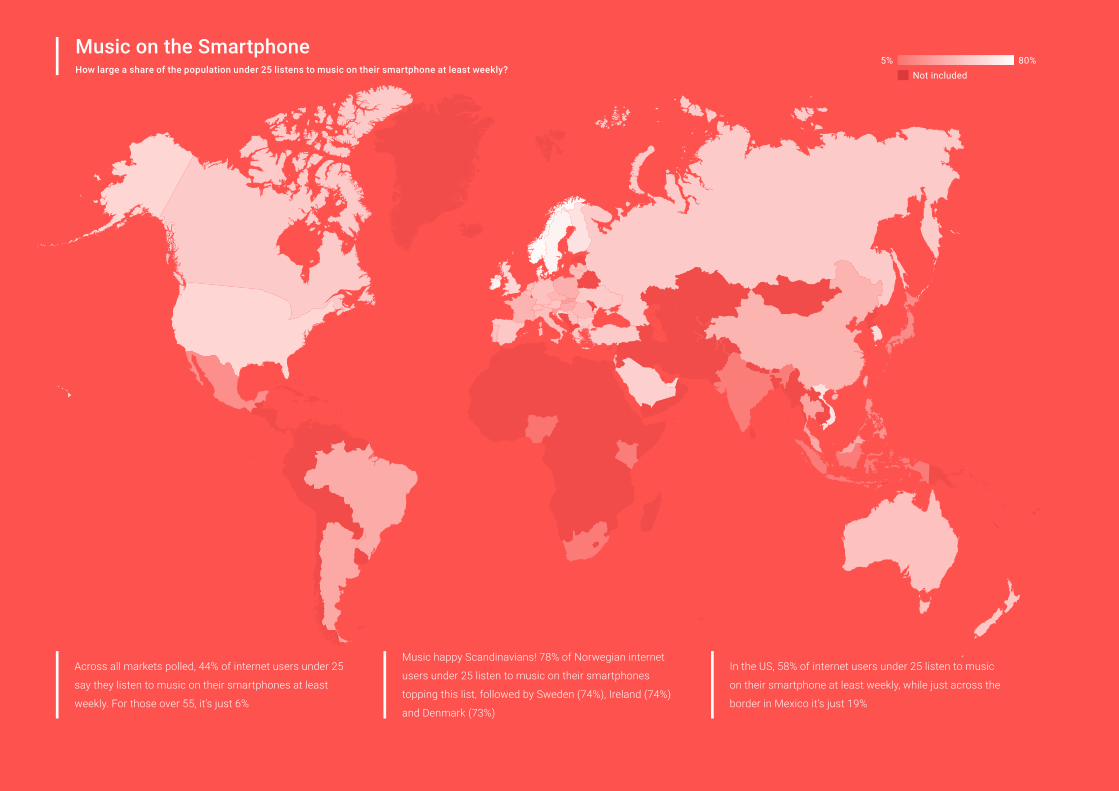
Across all markets polled, 44% of internet users under 25
say they listen to music on their smartphones at least
weekly. For those over 55, it’s just 6%
Music happy Scandinavians! 78% of Norwegian internet
users under 25 listen to music on their smartphones
topping this list, followed by Sweden (74%), Ireland (74%)
and Denmark (73%)
In the US, 58% of internet users under 25 listen to music
on their smartphone at least weekly, while just across the
border in Mexico it’s just 19%
Music on the SmartphoneHow large a share of the population under 25 listens to music on their smartphone at least weekly?
80%5%Not included
23 / 28 End Note
This report presents a flavor of the findings from our massive, multi-year research project. On consumerbarometer.com you can dive deeper into the numbers and compose your own graphs across markets and demographics.
Our work on documenting how people around the world use the internet doesn’t stop here. Our next wave of questions is in the pipeline and results will hit the website in 2017. Our research continues to expand to new markets and develop in scope to keep up with the rapid development of technology – and how people put it to use.
We will follow along and document this global revolution in the making, sharing data and insights on consumerbarometer.com.
The Consumer Barometer site further describes the survey method in detail.

24 / 28The Internet: Global Property
More and More People Use the Internet More and More
Source:
The Connected Consumer Survey
2012-2016
Target group:
Total online and offline population
Question asked:
How often do you access the Internet for
personal reasons, i.e. all non-business or work
related purposes? Please think about your
usage habits during the last month.
Markets:
40 global markets: AR, AU, AT, BE, BR, CA, CN,
CZ, DK, EG, FI, FR, DE, GR, HK, HU, IE, IL, IT, JP,
MX, NL, NZ, NO, PL, PT, RO, RU, KSA, SK, ZA,
ES, SE, CH, TW, TR, UAE, UK, UA, USA
Most People Are Online Several Times a Day
Source:
The Connected Consumer Survey
2012-2016
Target group:
Internet users (accessing via computer, tablet
or smartphone)
Question asked:
How often do you access the Internet for
personal reasons, i.e. all non-business or work
related purposes?
Markets:
40 global markets: AR, AU, AT, BE, BR, CA, CN,
CZ, DK, EG, FI, FR, DE, GR, HK, HU, IE, IL, IT, JP,
MX, NL, NZ, NO, PL, PT, RO, RU, KSA, SK, ZA,
ES, SE, CH, TW, TR, UAE, UK, UA, USA
The Internet Is Used Daily by All Age Groups
Source:
The Connected Consumer Survey
2014 / 2015 / 2016
Target group:
Internet users (accessing via computer, tablet
or smartphone)
Question asked:
How often do you access the Internet for
personal reasons, i.e. all non-business or work
related purposes?
Markets:
43 global markets: UK, AT, BE, BG, HR, CZ, DK,
FI, FR, DE, GR, HU, IE, LV, LT, NO, PL, PT, RO, RU,
RS, SK, ES, CH, UA, AU, CN, HK, JP, KR, MY, NZ,
PH, SG, TH, VN, CA, AR, BR, USA, IL, SA, NG
The Internet Is Our First Place to Look for Information
Source:
The Connected Consumer Survey
2014 / 2015 / 2016
Target group:
Internet users (accessing via computer, tablet
or smartphone)
Question asked:
To what extent do you agree or disagree with
the following statements? Please evaluate
each of the following statements on a scale
from 1 - strongly agree to 5 - strongly disagree.
When I need information, the first place I look is
the Internet.
Markets:
43 global markets: UK, AT, BE, BG, HR, CZ, DK,
FI, FR, DE, GR, HU, IE, LV, LT, NO, PL, PT, RO, RU,
RS, SK, ES, CH, UA, AU, CN, HK, JP, KR, MY, NZ,
PH, SG, TH, VN, CA, AR, BR, USA, IL, SA, NG

25 / 28Smartphone Success
Smartphone Adoption Has Doubled in Just Four Years
Source:
The Connected Consumer Survey
2012-2016
Target group:
Total online and offline population
Question asked:
Which, if any, of the following devices do you
currently use? Smartphone
Markets:
40 global markets: AR, AU, AT, BE, BR, CA, CN,
CZ, DK, EG, FI, FR, DE, GR, HK, HU, IE, IL, IT, JP,
MX, NL, NZ, NO, PL, PT, RO, RU, KSA, SK, ZA,
ES, SE, CH, TW, TR, UAE, UK, UA, USA
Two Thirds Say the Smartphone Is Not Their Secondary Device
Source:
The Connected Consumer Survey
2015 / 2016
Target group:
Internet users (accessing via computer, tablet
or smartphone)
Question asked:
How often do you use the Internet - through
your web browser or apps – for personal
reasons (i.e. all non business or work-related
purposes) on a [computer / smartphone /
tablet]?
Markets:
56 global markets: UK, AT, BE, BG, HR, CZ, DK,
EE, FI, FR, DE, GR, HU, IE, IT, LV, LT, NL, NO, PL,
PT, RO, RU, RS, SK, SI, ES, SE, CH, UA, AU, CN,
HK, IN, ID, JP, KR, MY, NZ, PH, SG, TW, TH, VN,
CA, MX, AR, BR, USA, IL, SA, TR, UAE, KE, NG,
ZA
It’s Not That We Stopped Using Computers. It’s Just an Age Thing
Source:
The Connected Consumer Survey
2014 / 2015 / 2016
Target group:
Internet users (accessing via computer, tablet
or smartphone)
Question asked:
How often do you use the Internet - through
your web browser or apps – for personal
reasons (i.e. all non business or work-related
purposes) on a [computer / smartphone /
tablet]?
Markets:
43 global markets: UK, AT, BE, BG, HR, CZ, DK,
FI, FR, DE, GR, HU, IE, LV, LT, NO, PL, PT, RO, RU,
RS, SK, ES, CH, UA, AU, CN, HK, JP, KR, MY, NZ,
PH, SG, TH, VN, CA, AR, BR, USA, IL, SA, NG
Massive Change: The Smartphone Is No Longer a Secondary Device
Source:
The Connected Consumer Survey
2012 - 2016
Target group:
Internet users (accessing via computer, tablet
or smartphone)
Question asked:
How often do you use the Internet - through
your web browser or apps - for personal
reasons (i.e. all non business or work-related
purposes) on a [computer / smartphone /
tablet]?
Markets:
40 global markets: AR, AU, AT, BE, BR, CA, CN,
CZ, DK, EG, FI, FR, DE, GR, HK, HU, IE, IL, IT, JP,
MX, NL, NZ, NO, PL, PT, RO, RU, KSA, SK, ZA,
ES, SE, CH, TW, TR, UAE, UK, UA, USA
26 / 28Multiscreen World
Rise of the Three-Screeners: One in Four Use Smartphone, Tablet and Computer
Source:
The Connected Consumer Survey
2012-2016
Target group:
Total online and offline population
Question asked:
Which, if any, of the following devices do you
currently use? Smartphone, Tablet and
Computer
Markets:
40 global markets: AR, AU, AT, BE, BR, CA, CN,
CZ, DK, EG, FI, FR, DE, GR, HK, HU, IE, IL, IT, JP,
MX, NL, NZ, NO, PL, PT, RO, RU, KSA, SK, ZA,
ES, SE, CH, TW, TR, UAE, UK, UA, USA
Most Internet Users Go Online While Watching TV
Source:
The Connected Consumer Survey
2014 / 2015 / 2016
Target group:
Internet users (accessing via computer, tablet
or smartphone) / TV Viewers
Question asked:
In the past month, did you go online via
another device (eg. computer, smartphone,
tablet) while watching TV?
Markets:
56 global markets: UK, AT, BE, BG, HR, CZ, DK,
EE, FI, FR, DE, GR, HU, IE, IT, LV, LT, NL, NO, PL,
PT, RO, RU, RS, SK, SI, ES, SE, CH, UA, AU, CN,
HK, IN, ID, JP, KR, MY, NZ, PH, SG, TW, TH, VN,
CA, MX, AR, BR, USA, IL, SA, TR, UAE, KE, NG,
ZA
On Average, We Use 2,5 Internet Connected Device
Source:
The Connected Consumer Survey
2016
Target group:
Total online and offline population
Question asked:
How many of the following devices do you
currently use? Wearable
Markets:
–
Second Screen: All Age Groups Go Online While Watching TV
Source:
The Connected Consumer Survey
2014 / 2015 / 2016
Target group:
Internet users (accessing via computer, tablet
or smartphone) / TV Viewers
Question asked:
In the past month, did you go online via
another device (eg. computer, smartphone,
tablet) while watching TV?
Markets:
39 global markets: UK, AT, BE, BG, HR, CZ, DK,
FI, FR, DE, GR, IE, LT, NO, PL, PT, RO, RU, RS,
SK, ES, CH, UA, AU, CN, HK, JP, KR, MY, NZ, PH,
SG, TH, VN, CA, AR, BR, USA, IL, SA
27 / 28Trusted Sidekick
Let Me Just Google That
Source:
The Connected Consumer Survey
2015 / 2016
Target group:
Internet users (accessing via computer, tablet
or smartphone)
Question asked:
How often do you – through your web browser
or apps on a smartphone? Use search engines
(at least weekly)
Markets:
56 global markets: UK, AT, BE, BG, HR, CZ, DK,
EE, FI, FR, DE, GR, HU, IE, IT, LV, LT, NL, NO, PL,
PT, RO, RU, RS, SK, SI, ES, SE, CH, UA, AU, CN,
HK, IN, ID, JP, KR, MY, NZ, PH, SG, TW, TH, VN,
CA, MX, AR, BR, USA, IL, SA, TR, UAE, KE, NG,
ZA
If You Are Young, the Smartphone Is the Device to Meet Your Friends. Three in Four Use Social Networks on Their Phones Weekly
Source:
The Connected Consumer Survey
2015 / 2016
Target group:
Internet users (accessing via computer, tablet
or smartphone)
Question asked:
How often do you – through your web browser
or apps on a smartphone? Visit social
networks (at least weekly)
Markets:
48 global markets: UK, AT, BE, BG, HR, CZ, DK,
FI, FR, DE, GR, HU, IE, IT, LV, LT, NL, NO, PL, PT,
RO, RU, RS, SK, SI, ES, SE, CH, UA, AU, CN, HK,
JP, KR, MY, NZ, PH, SG, TW, TH, VN, CA, MX,
AR, BR, USA, IL, SA
Sent From My Phone: Smartphones Have Become an Email Tool as Widespread as the Computer
Source:
The Connected Consumer Survey
2015 / 2016
Target group:
Internet users (accessing via computer, tablet
or smartphone)
Question asked:
How often do you – through your web browser
or apps on a smartphone / tablet / computer?
Check email (at least weekly)
Markets:
56 global markets: UK, AT, BE, BG, HR, CZ, DK,
EE, FI, FR, DE, GR, HU, IE, IT, LV, LT, NL, NO, PL,
PT, RO, RU, RS, SK, SI, ES, SE, CH, UA, AU, CN,
HK, IN, ID, JP, KR, MY, NZ, PH, SG, TW, TH, VN,
CA, MX, AR, BR, USA, IL, SA, TR, UAE, KE, NG,
ZA
Video on the Smartphone: We’re Using Our Phones to Stream Online Video. Selected Markets
Source:
The Connected Consumer Survey
2015 / 2016
Target group:
Internet users (accessing via computer, tablet
or smartphone)
Question asked:
How often do you – through your web browser
or apps on a smartphone? Watch online videos
(at least weekly)
Markets:
56 global markets: UK, AT, BE, BG, HR, CZ, DK,
EE, FI, FR, DE, GR, HU, IE, IT, LV, LT, NL, NO, PL,
PT, RO, RU, RS, SK, SI, ES, SE, CH, UA, AU, CN,
HK, IN, ID, JP, KR, MY, NZ, PH, SG, TW, TH, VN,
CA, MX, AR, BR, USA, IL, SA, TR, UAE, KE, NG,
ZA
28 / 28Everyday Revolution
For Six in 10, the Smartphone Is the First Thing to Reach for in the Morning
Source:
The Consumer Barometer Survey
2014/15
Target group:
Internet users who use a smartphone
Question asked:
In general: for which of the following do you
primarily use your mobile phone?
Set Alarm Clock
Markets:
55 global markets: UK, AT, BE, BG, HR, CZ, DK,
EE, FI, FR, DE, GR, HU, IE, IT, LV, LT, NL, NO, PL,
PT, RO, RU, RS, SK, SI, ES, SE, CH, UA, AU, CN,
HK, IN, JP, KR, MY, NZ, PH, SG, TW, TH, VN, CA,
MX, AR, BR, USA, IL, SA, TR, UAE, KE, NG, ZA
The Smartphone Is the Preferred Camera for All Age Groups
Source:
The Consumer Barometer Survey
2014/15
Target group:
Internet users who use a smartphone
Question asked:
In general: for which of the following do you
primarily use your mobile phone?
Take Photos/Videos
Markets:
55 global markets: UK, AT, BE, BG, HR, CZ, DK,
EE, FI, FR, DE, GR, HU, IE, IT, LV, LT, NL, NO, PL,
PT, RO, RU, RS, SK, SI, ES, SE, CH, UA, AU, CN,
HK, IN, JP, KR, MY, NZ, PH, SG, TW, TH, VN, CA,
MX, AR, BR, USA, IL, SA, TR, UAE, KE, NG, ZA
Music Is Everywhere
Source:
The Consumer Barometer Survey
2014/15
Target group:
Internet users who use a smartphone / under
25 years old
Question asked:
In general: for which of the following do you
primarily use your mobile phone?
Listen to music
Markets:
55 global markets: UK, AT, BE, BG, HR, CZ, DK,
EE, FI, FR, DE, GR, HU, IE, IT, LV, LT, NL, NO, PL,
PT, RO, RU, RS, SK, SI, ES, SE, CH, UA, AU, CN,
HK, IN, JP, KR, MY, NZ, PH, SG, TW, TH, VN, CA,
MX, AR, BR, USA, IL, SA, TR, UAE, KE, NG, ZA
Smartphones Are Used for a Plethora of Tasks
Source:
The Consumer Barometer Survey
2014/15
Target group:
Internet users who use a smartphone / under
25 years old
Question asked:
In general: for which of the following do you
primarily use your mobile phone?
Markets:
56 global markets: UK, AT, BE, BG, HR, CZ, DK,
EE, FI, FR, DE, GR, HU, IE, IT, LV, LT, NL, NO, PL,
PT, RO, RU, RS, SK, SI, ES, SE, CH, UA, AU, CN,
HK, IN, ID, JP, KR, MY, NZ, PH, SG, TW, TH, VN,
CA, MX, AR, BR, USA, IL, SA, TR, UAE, KE, NG,
ZA.