google earth pro fundamentals - amazon...
TRANSCRIPT
Data Visualization Techniques with Google Earth
E-Learning for the GIS Professional – Any Time, Any Place! geospatialtraining.com
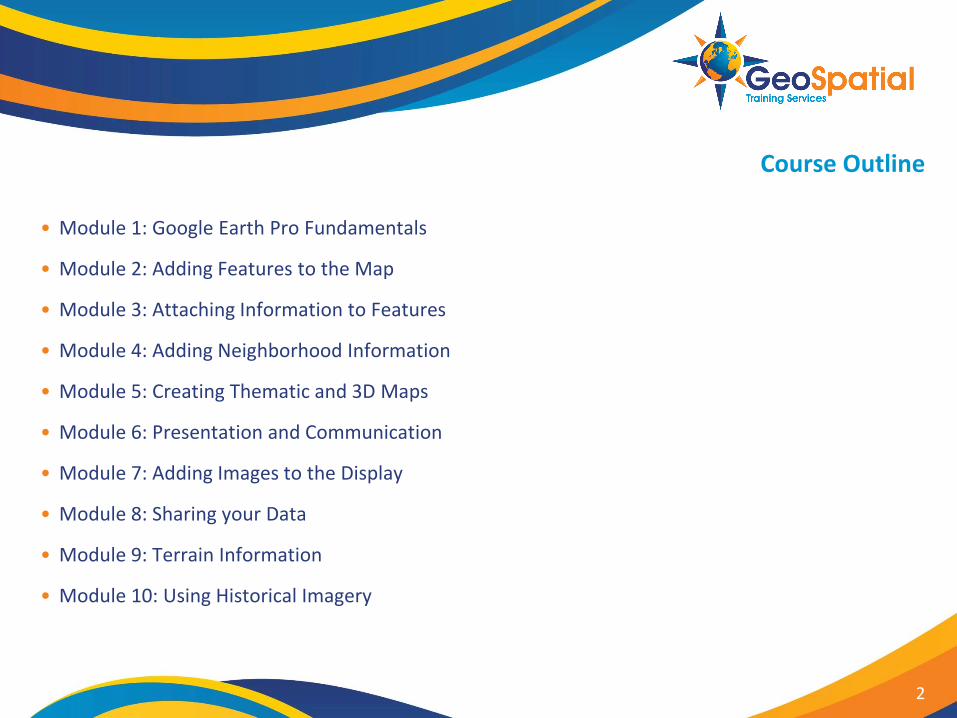
Course Outline
• Module 1: Google Earth Pro Fundamentals
• Module 2: Adding Features to the Map
• Module 3: Attaching Information to Features
• Module 4: Adding Neighborhood Information
• Module 5: Creating Thematic and 3D Maps
• Module 6: Presentation and Communication
• Module 7: Adding Images to the Display
• Module 8: Sharing your Data
• Module 9: Terrain Information
• Module 10: Using Historical Imagery
2
GOOGLE EARTH PRO FUNDAMENTALS
3
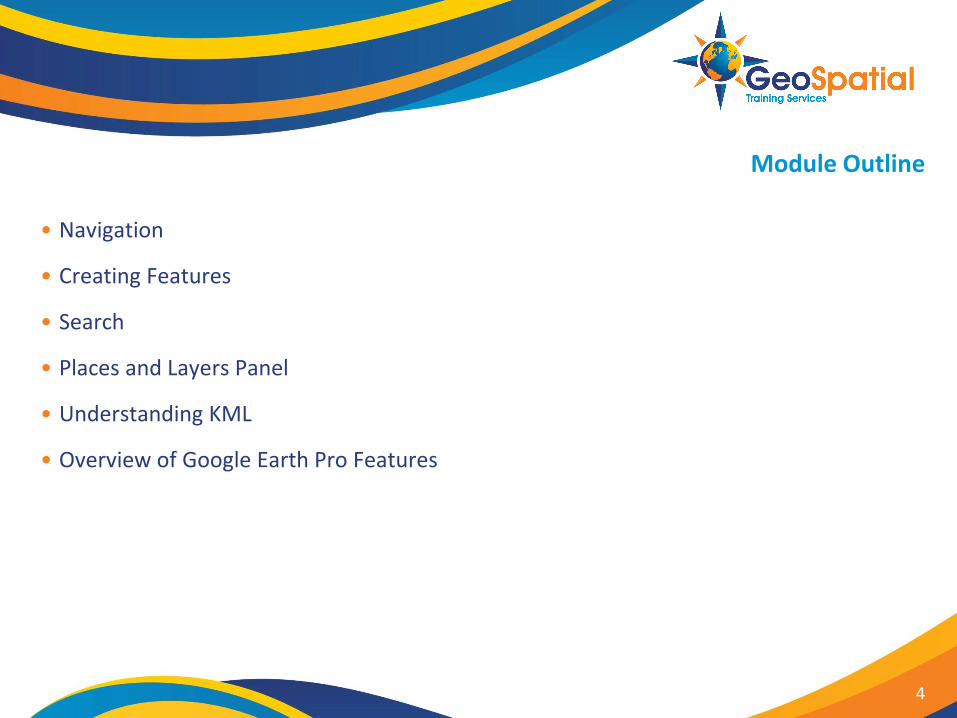
Module Outline
• Navigation
• Creating Features
• Search
• Places and Layers Panel
• Understanding KML
• Overview of Google Earth Pro Features
4
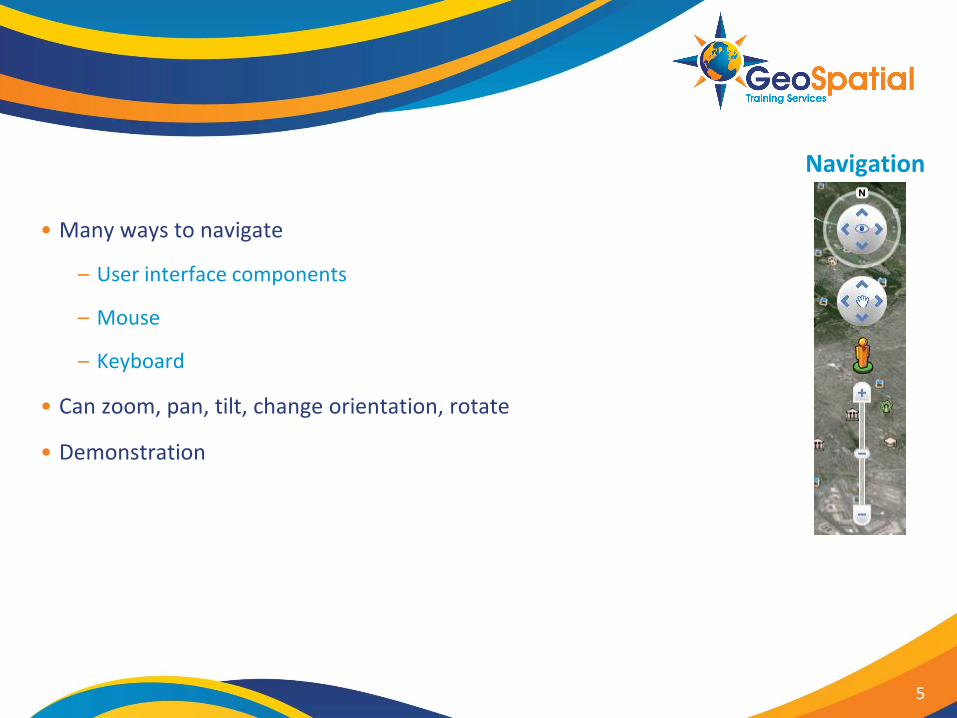
Navigation
• Many ways to navigate
– User interface components
– Mouse
– Keyboard
• Can zoom, pan, tilt, change orientation, rotate
• Demonstration
5
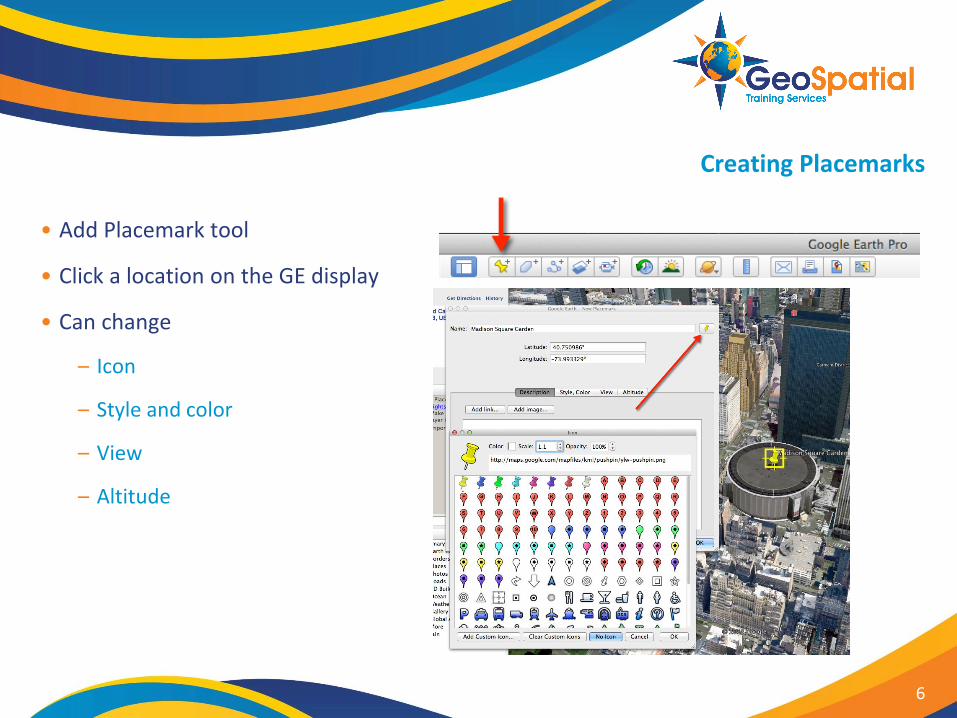
Creating Placemarks
• Add Placemark tool
• Click a location on the GE display
• Can change
– Icon
– Style and color
– View
– Altitude
6
Extruding a Placemark
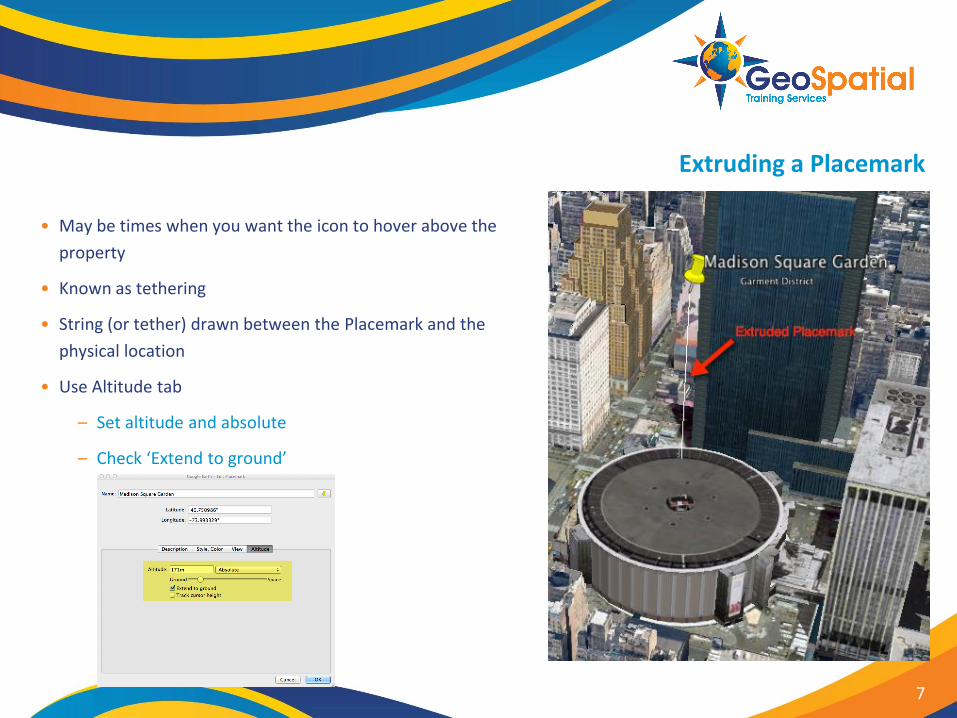
• May be times when you want the icon to hover above the
property
• Known as tethering
• String (or tether) drawn between the Placemark and the
physical location
• Use Altitude tab
– Set altitude and absolute
– Check ‘Extend to ground’
7
Creating Paths
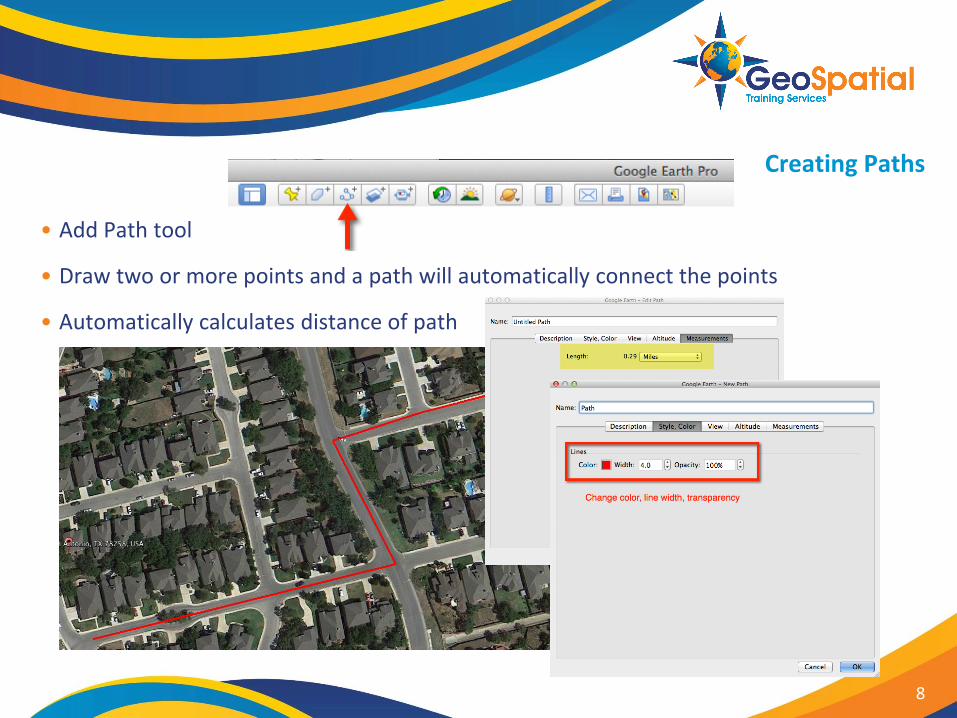
• Add Path tool
• Draw two or more points and a path will automatically connect the points
• Automatically calculates distance of path
8
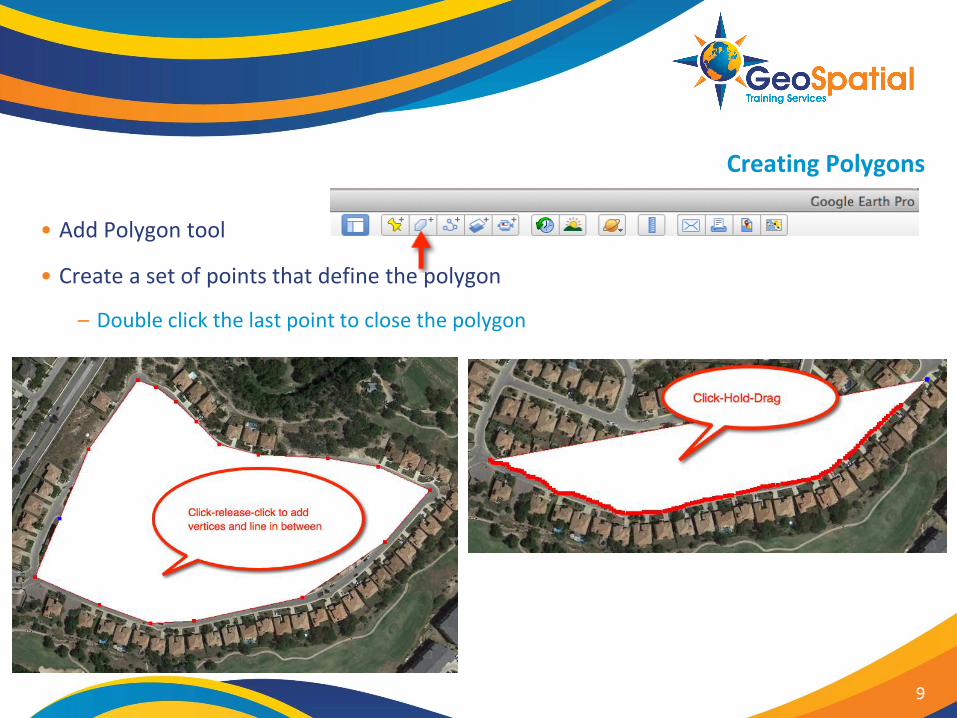
Creating Polygons
• Add Polygon tool
• Create a set of points that define the polygon
– Double click the last point to close the polygon
9
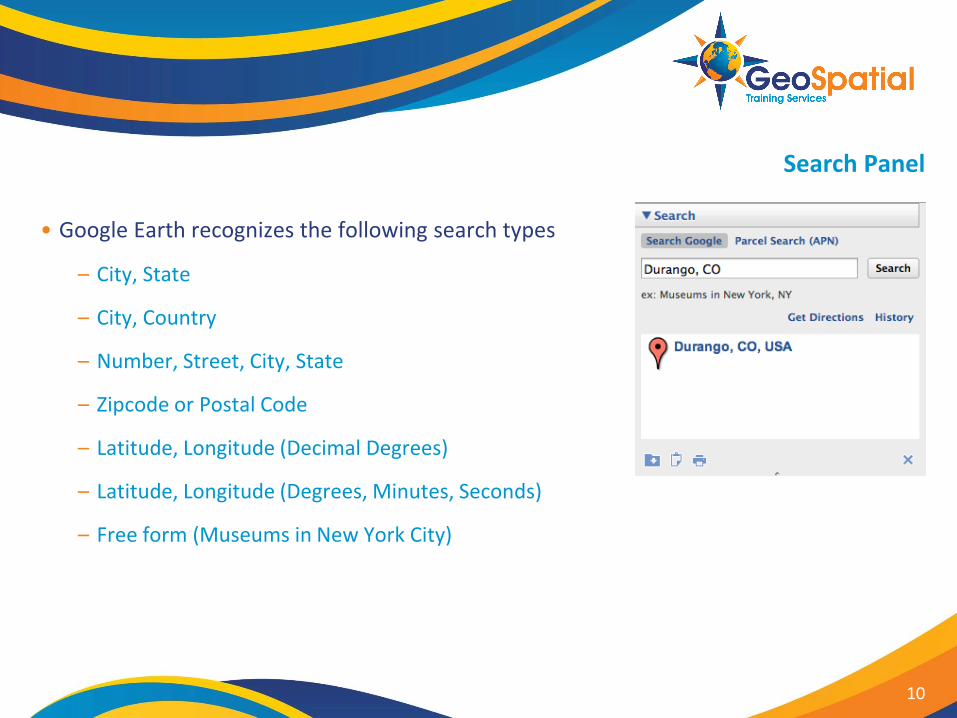
Search Panel
• Google Earth recognizes the following search types
– City, State
– City, Country
– Number, Street, City, State
– Zipcode or Postal Code
– Latitude, Longitude (Decimal Degrees)
– Latitude, Longitude (Degrees, Minutes, Seconds)
– Free form (Museums in New York City)
10
Places Panel
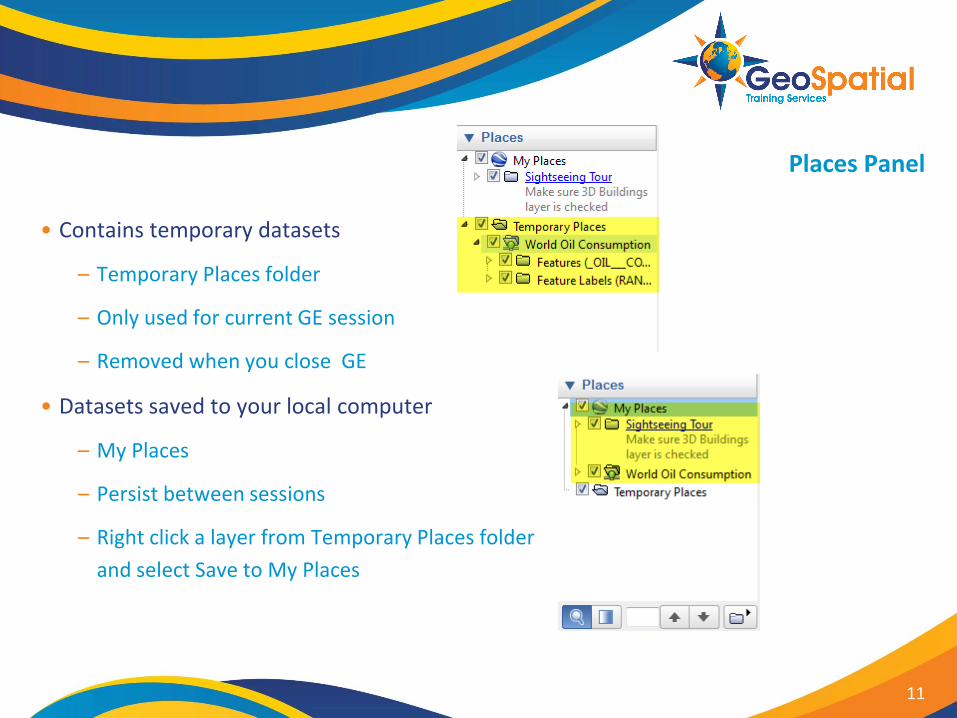
• Contains temporary datasets
– Temporary Places folder
– Only used for current GE session
– Removed when you close GE
• Datasets saved to your local computer
– My Places
– Persist between sessions
– Right click a layer from Temporary Places folder
and select Save to My Places
11
Layers Panel
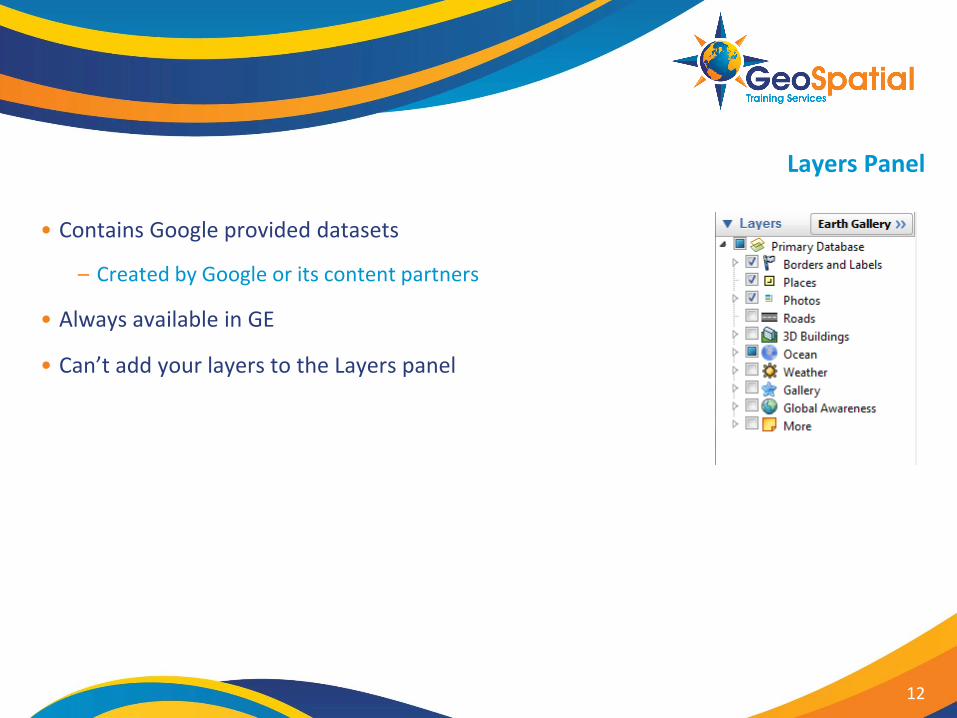
• Contains Google provided datasets
– Created by Google or its content partners
• Always available in GE
• Can’t add your layers to the Layers panel
12
What is KML?
• Keyhole Markup Language or KML
– XML grammar and file format for modeling and storing geographic features
• Tag based structure (XML)
– Similar to HTML
• Can be created in Google Earth, XML editors, or text editors (jEdit, Notepad++)
• Can be shared
13

Open GeoSpatial Consortium and KML
• KML originally created by a company called Keyhole for it’s Earth Viewer
– Later acquired by Google
– KML specification now controlled by Open Geospatial Consortium (OGC)
http://www.opengeospatial.org/standards/kml
• Currently at KML version 2.2
– Continues to evolve under OGC
14
KML Functionality
• Specify icons and labels on the earth’s surface
• Define unique views using camera positions
• Drape images over the terrain
• Specify feature appearance with styles
• Write HTML descriptions of features, including hyperlinks and embedded images
• Use folders for grouping features
• Fetch data from remote servers
• Much more!
15
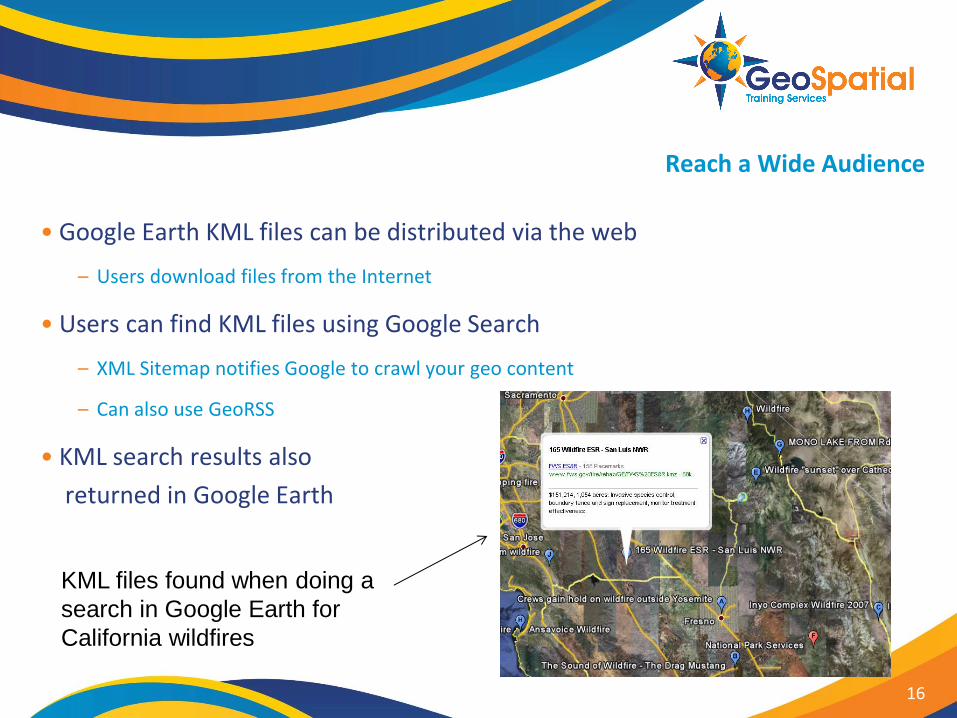
Reach a Wide Audience
• Google Earth KML files can be distributed via the web
– Users download files from the Internet
• Users can find KML files using Google Search
– XML Sitemap notifies Google to crawl your geo content
– Can also use GeoRSS
• KML search results also
returned in Google Earth
KML files found when doing a
search in Google Earth for
California wildfires
16
Data is Easy to Distribute
• All content contained within KML or KMZ file
• Can be distributed via
– Internet
– Network Server
– Web Services
17
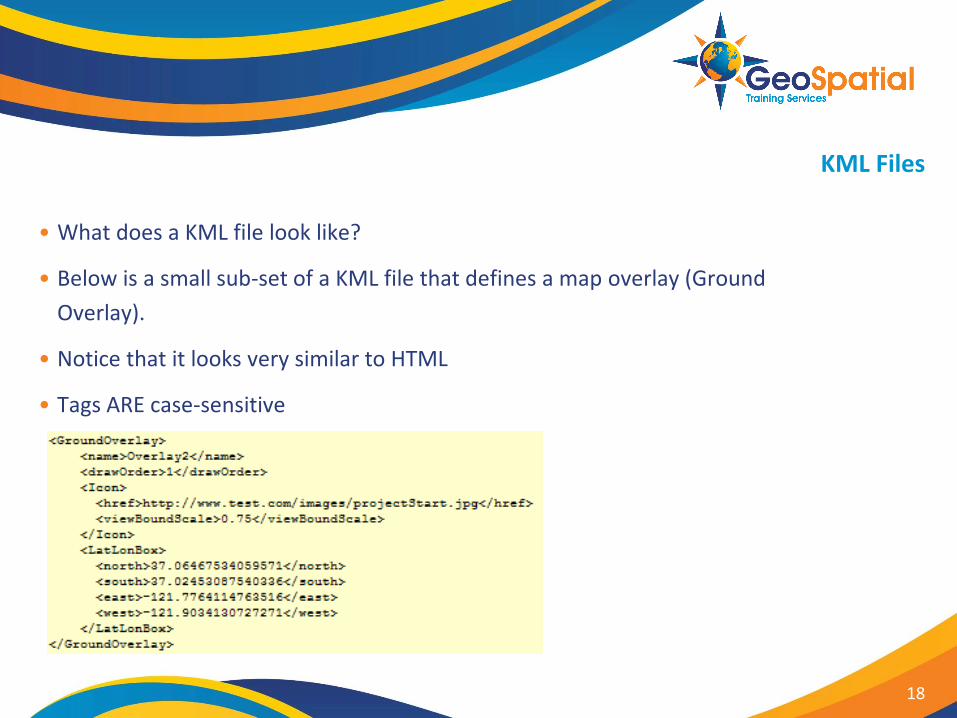
KML Files
• What does a KML file look like?
• Below is a small sub-set of a KML file that defines a map overlay (Ground
Overlay).
• Notice that it looks very similar to HTML
• Tags ARE case-sensitive
18
KML vs KMZ
• KML files can get VERY large when dealing with large datasets
– This is due to the amount of text that it takes to describe GE features
• Need a way to compress these files to make them smaller
• KMZ files are the compressed versions of KML files
• KMZ files also used to distribute additional files referenced by a main
KML file
– Images, icons, textures, models, HTML
• GE can read KML or KMZ files
• Can open KMZ files with tools such as WinZip
19
ADDING FEATURES TO THE MAP
20

Module Outline
• Address geocoding
• Adding all your properties to Google Earth using geocoding
• Adding properties manually as points
• Creating land parcels as polygons
21
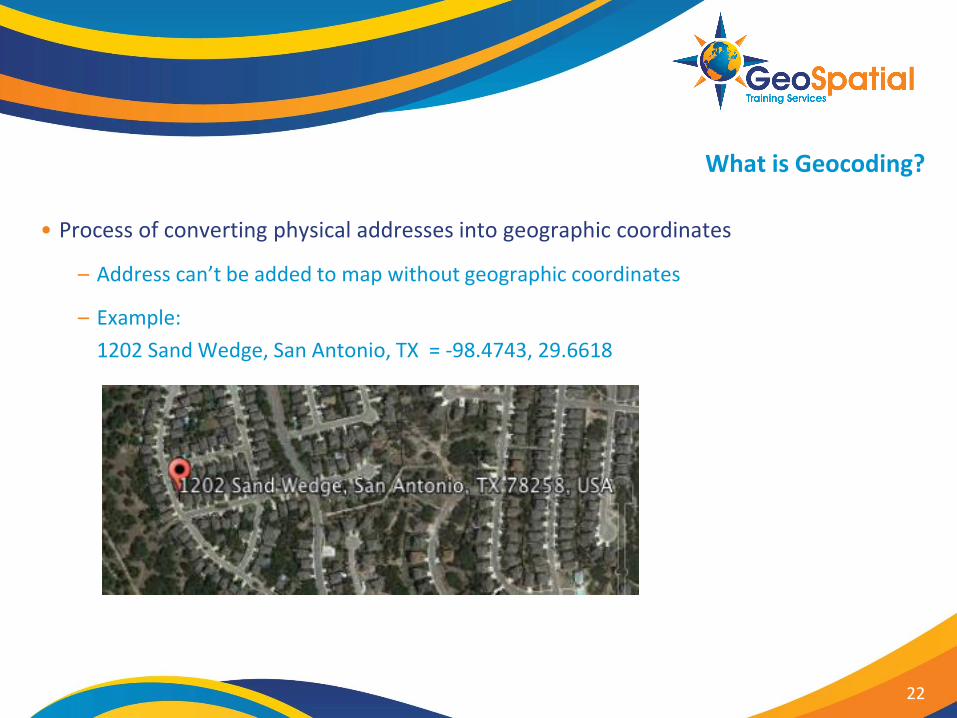
What is Geocoding?
• Process of converting physical addresses into geographic coordinates
– Address can’t be added to map without geographic coordinates
– Example:
1202 Sand Wedge, San Antonio, TX = -98.4743, 29.6618
22
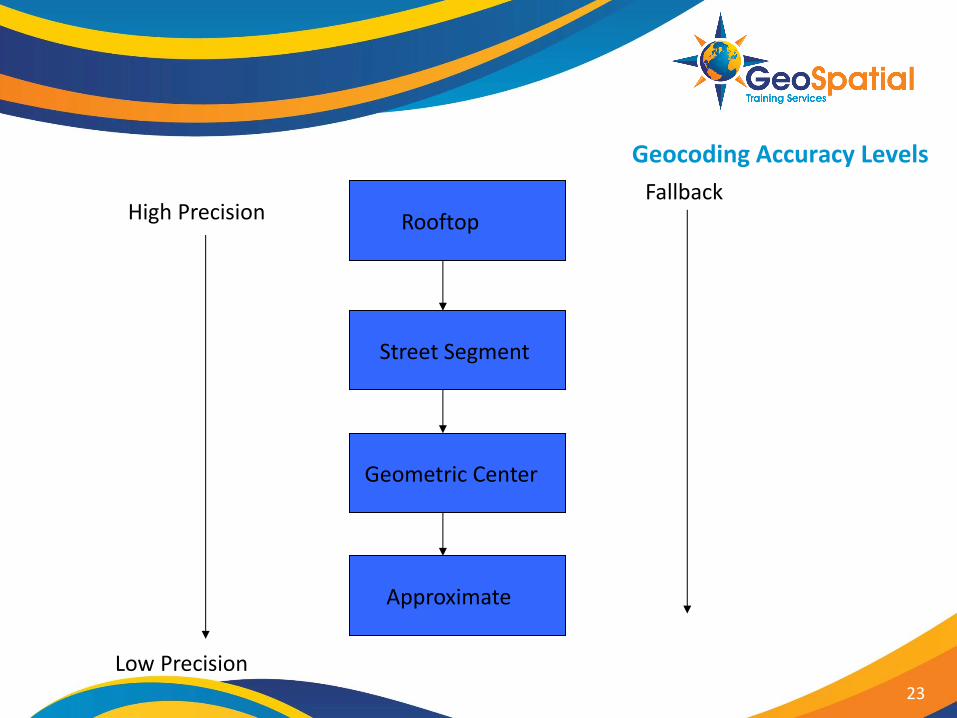
Geocoding Accuracy Levels
Rooftop
Street Segment
Geometric Center
Approximate
High Precision Fallback
23
Low Precision
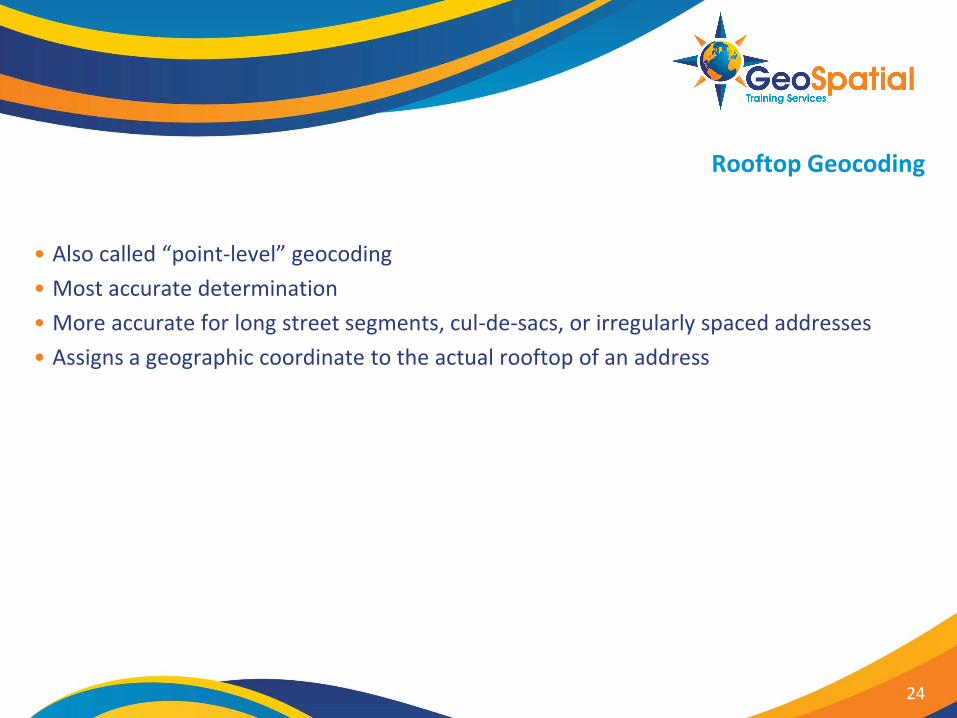
Rooftop Geocoding
• Also called “point-level” geocoding
• Most accurate determination
• More accurate for long street segments, cul-de-sacs, or irregularly spaced addresses
• Assigns a geographic coordinate to the actual rooftop of an address
24
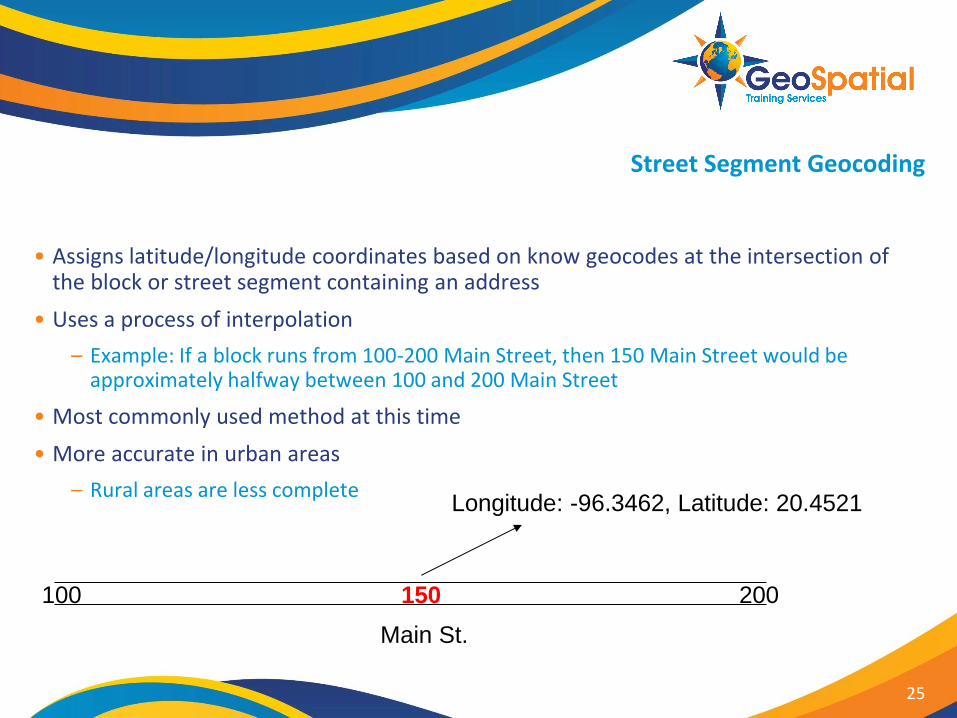
Street Segment Geocoding
• Assigns latitude/longitude coordinates based on know geocodes at the intersection of the block or street segment containing an address
• Uses a process of interpolation
– Example: If a block runs from 100-200 Main Street, then 150 Main Street would be approximately halfway between 100 and 200 Main Street
• Most commonly used method at this time
• More accurate in urban areas
– Rural areas are less complete
25
Main St.
100 200 150
Longitude: -96.3462, Latitude: 20.4521
Geocoding in Google Earth Pro
• GE Pro can import a text file containing a batch set of addresses
• Text file is typically delimited by a comma or tab
• Supported countries
– United States, United Kingdom, Canada, France, Italy, Germany, Spain
• Each address converted into a Placemark
26
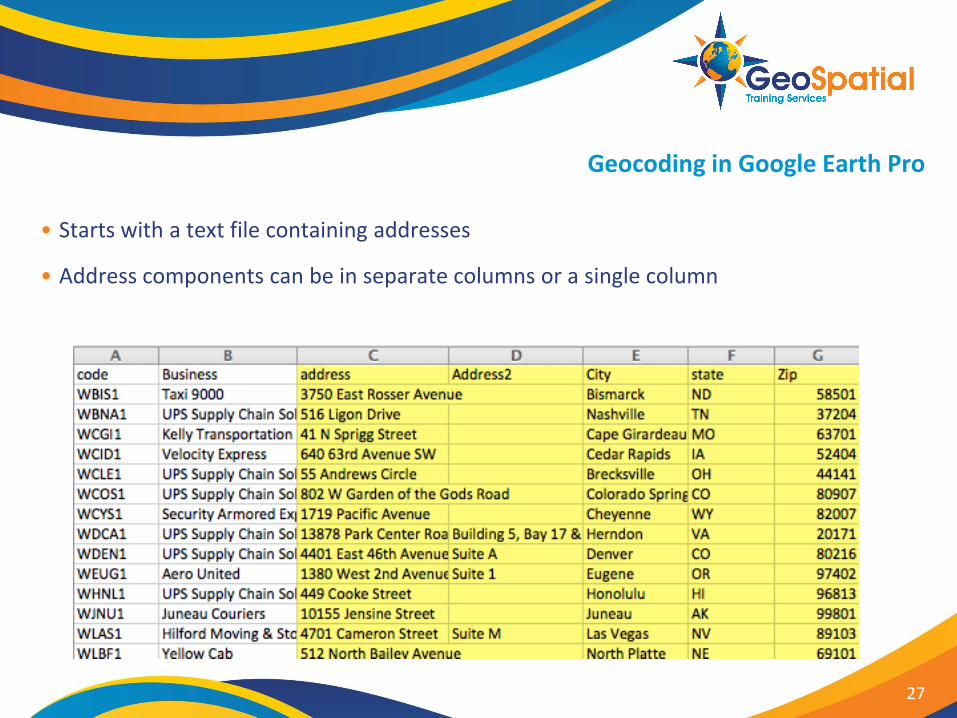
Geocoding in Google Earth Pro
• Starts with a text file containing addresses
• Address components can be in separate columns or a single column
27
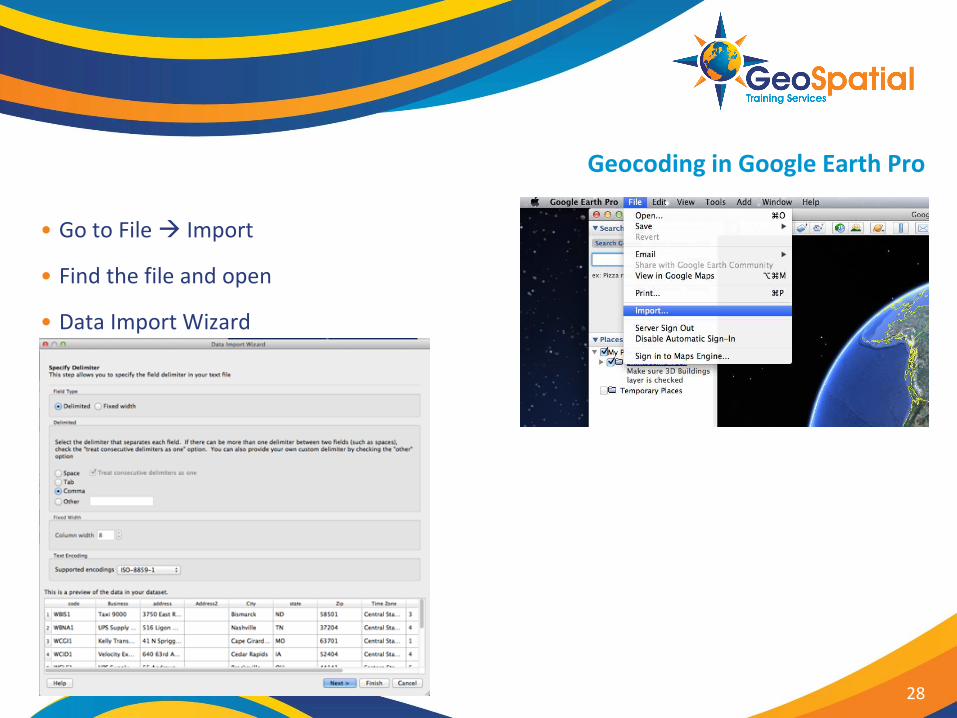
Geocoding in Google Earth Pro
• Go to File Import
• Find the file and open
• Data Import Wizard
28
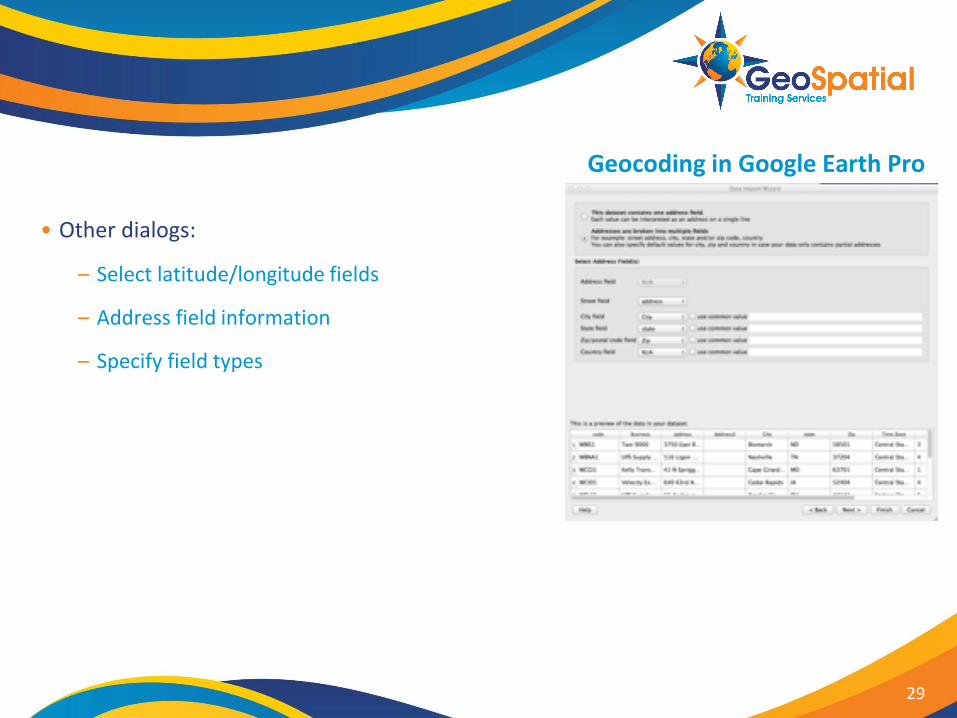
Geocoding in Google Earth Pro
• Other dialogs:
– Select latitude/longitude fields
– Address field information
– Specify field types
29
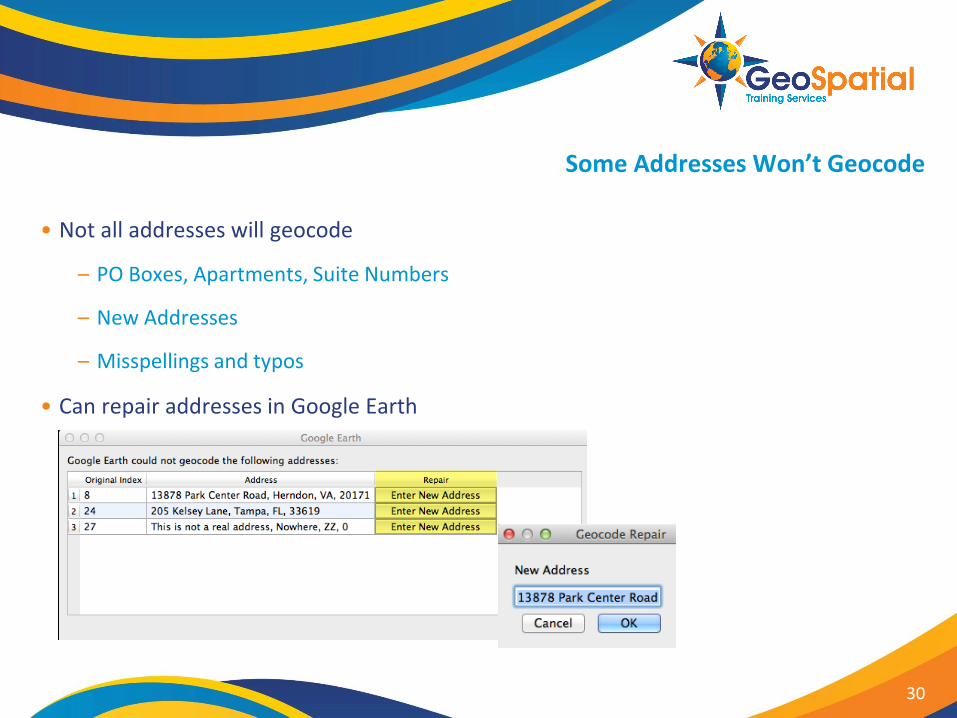
Some Addresses Won’t Geocode
• Not all addresses will geocode
– PO Boxes, Apartments, Suite Numbers
– New Addresses
– Misspellings and typos
• Can repair addresses in Google Earth
30
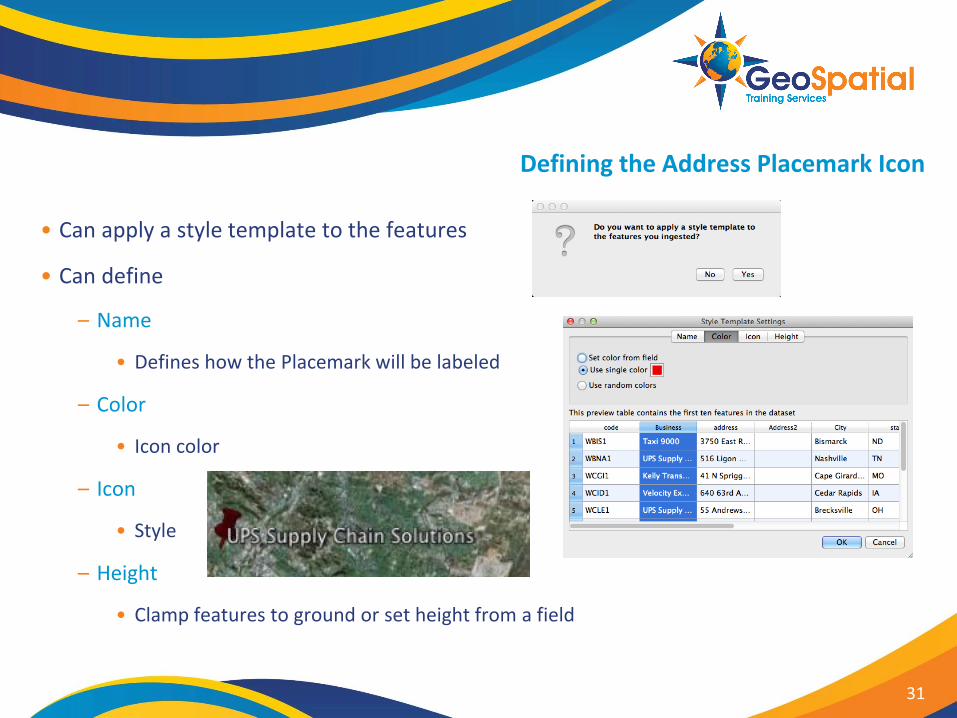
Defining the Address Placemark Icon
• Can apply a style template to the features
• Can define
– Name
• Defines how the Placemark will be labeled
– Color
• Icon color
– Icon
• Style
– Height
• Clamp features to ground or set height from a field
31
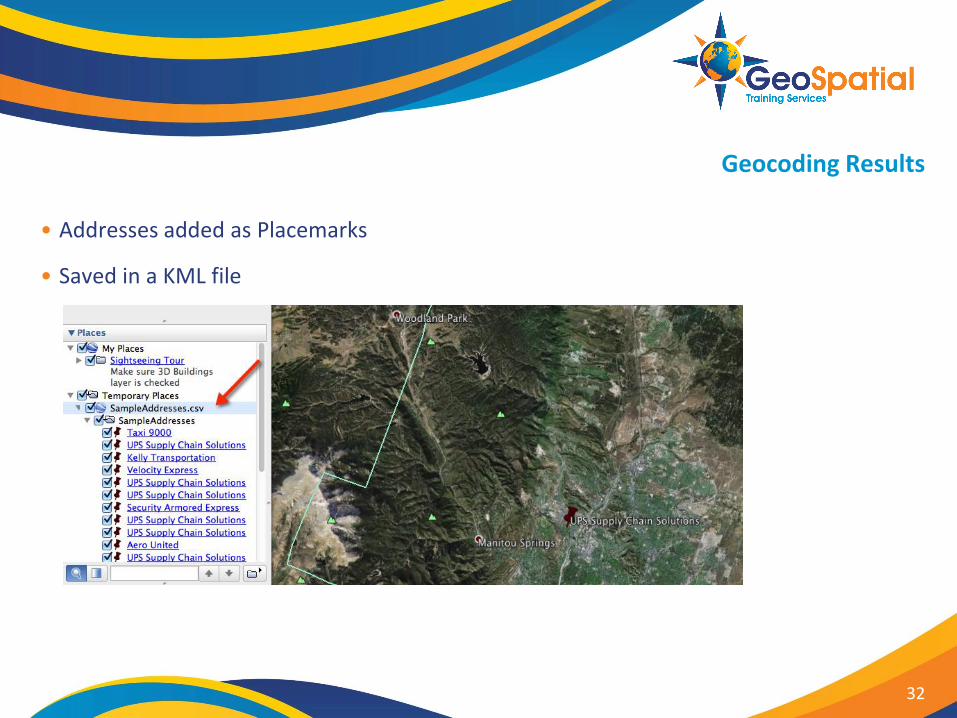
Geocoding Results
• Addresses added as Placemarks
• Saved in a KML file
32

Exercise
• Please complete the following exercise:
Adding Addresses to Google Earth with Geocoding
33
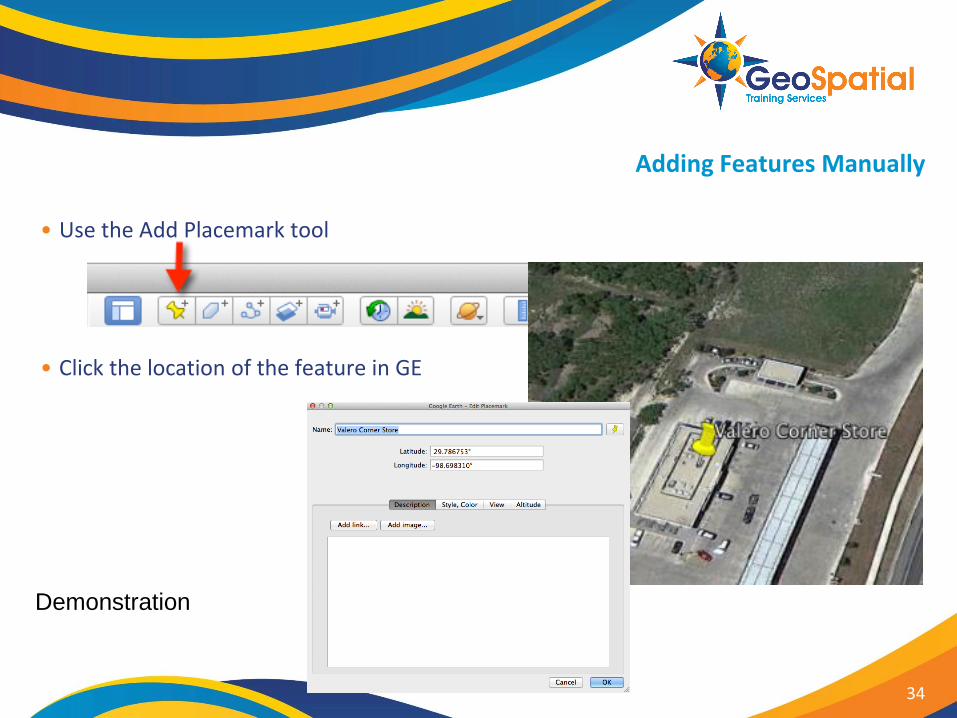
Adding Features Manually
• Use the Add Placemark tool
• Click the location of the feature in GE
34
Demonstration
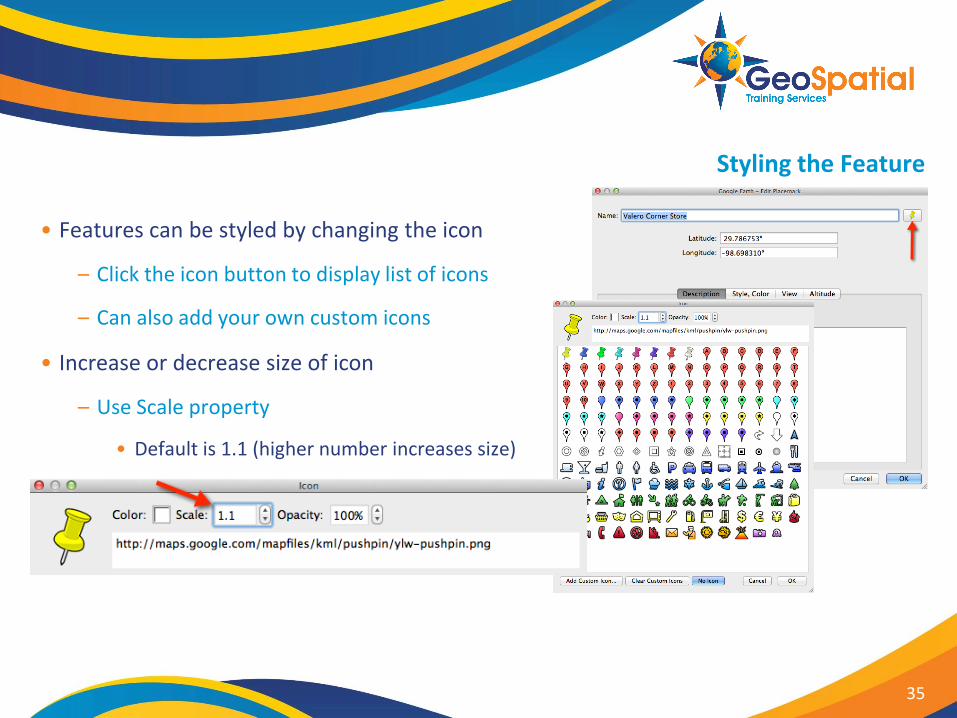
Styling the Feature
• Features can be styled by changing the icon
– Click the icon button to display list of icons
– Can also add your own custom icons
• Increase or decrease size of icon
– Use Scale property
• Default is 1.1 (higher number increases size)
35
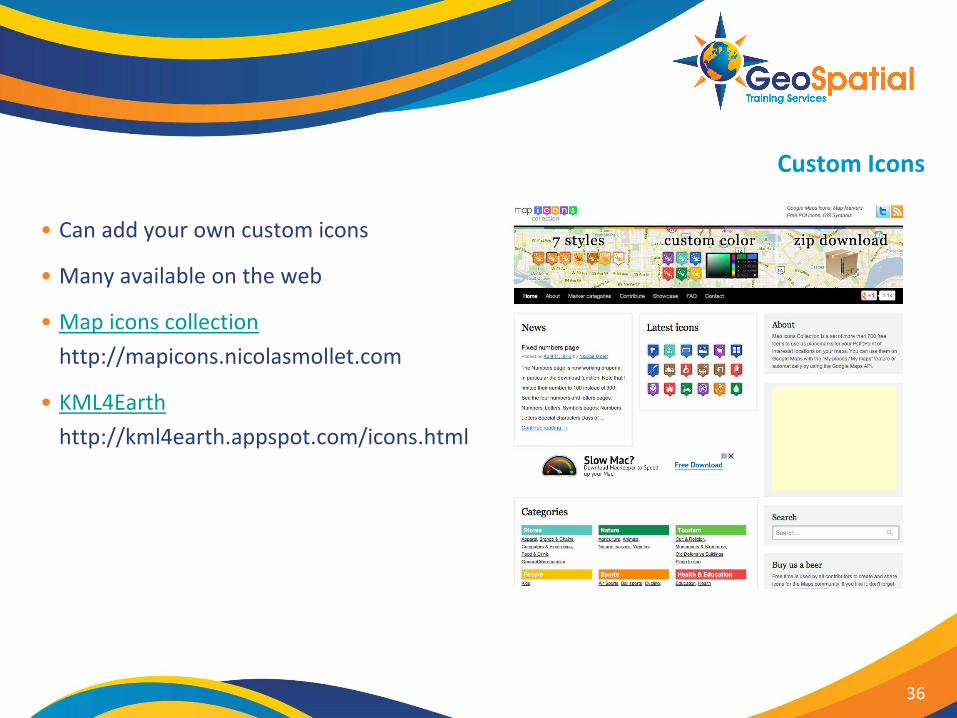
Custom Icons
• Can add your own custom icons
• Many available on the web
• Map icons collection
http://mapicons.nicolasmollet.com
• KML4Earth
http://kml4earth.appspot.com/icons.html
36
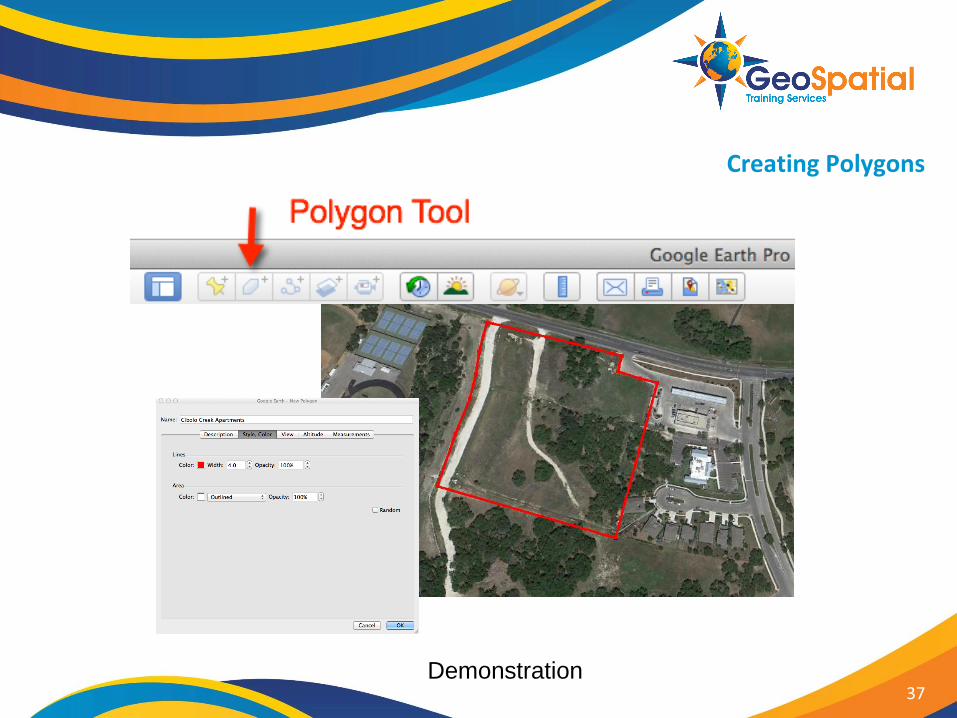
Creating Polygons
37 Demonstration
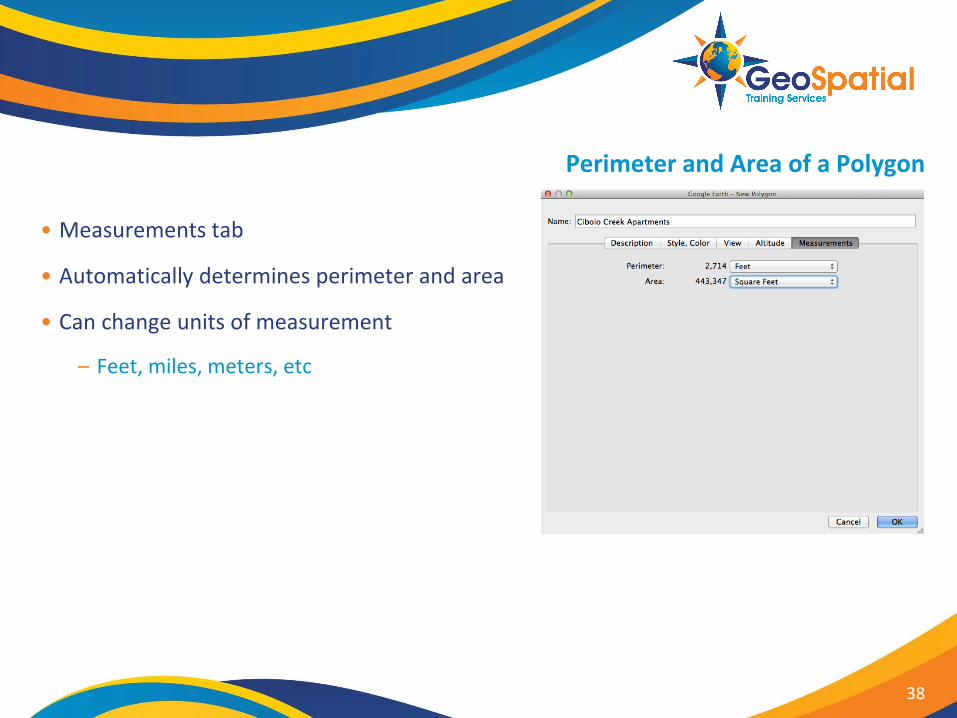
Perimeter and Area of a Polygon
• Measurements tab
• Automatically determines perimeter and area
• Can change units of measurement
– Feet, miles, meters, etc
38
Exercise
• Please complete the following exercise:
Manually Creating Features with Google Earth
39
ADDING FEATURE INFORMATION
40
Module Outline
• Styling your icons
• Introduction to info balloons
• Adding text, photos, video, links to info balloons
• Using templates to create info balloons
41
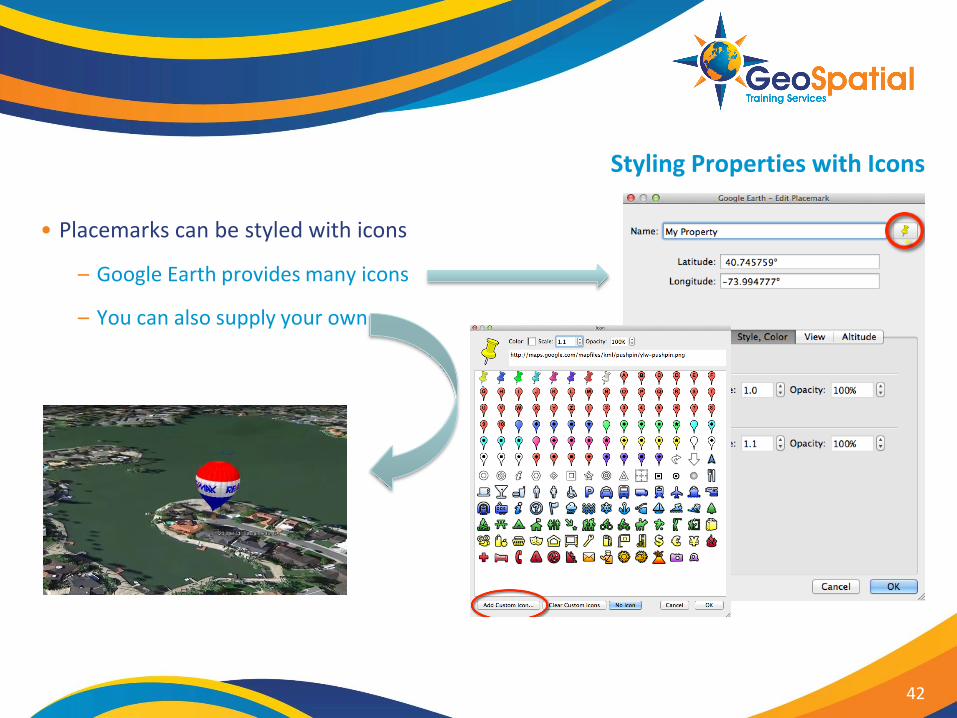
Styling Properties with Icons
• Placemarks can be styled with icons
– Google Earth provides many icons
– You can also supply your own
42
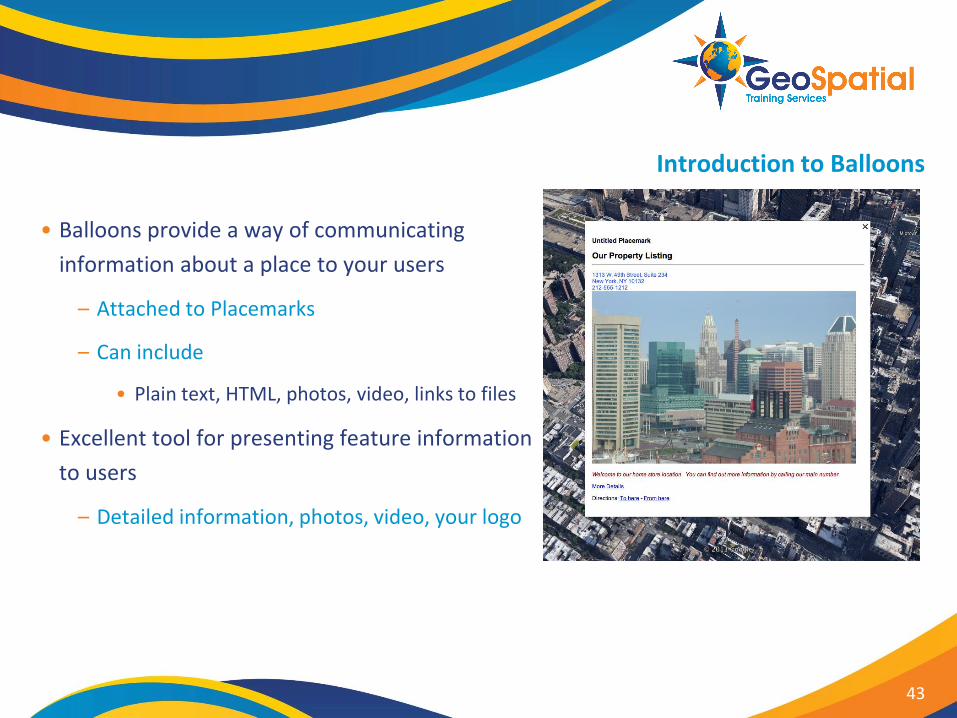
Introduction to Balloons
• Balloons provide a way of communicating
information about a place to your users
– Attached to Placemarks
– Can include
• Plain text, HTML, photos, video, links to files
• Excellent tool for presenting feature information
to users
– Detailed information, photos, video, your logo
43
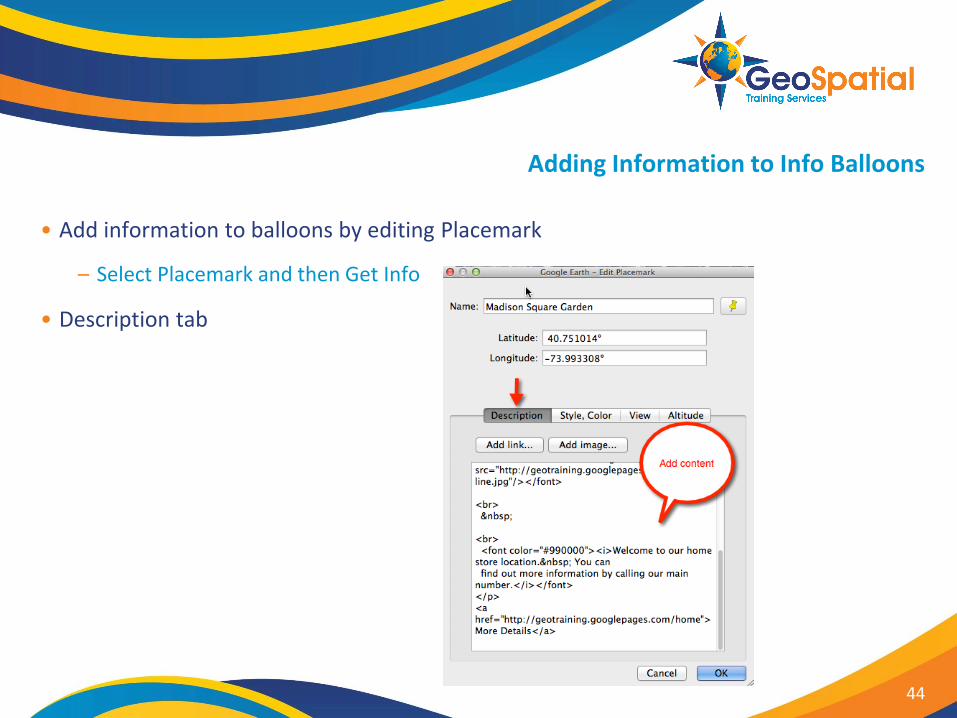
Adding Information to Info Balloons
• Add information to balloons by editing Placemark
– Select Placemark and then Get Info
• Description tab
44
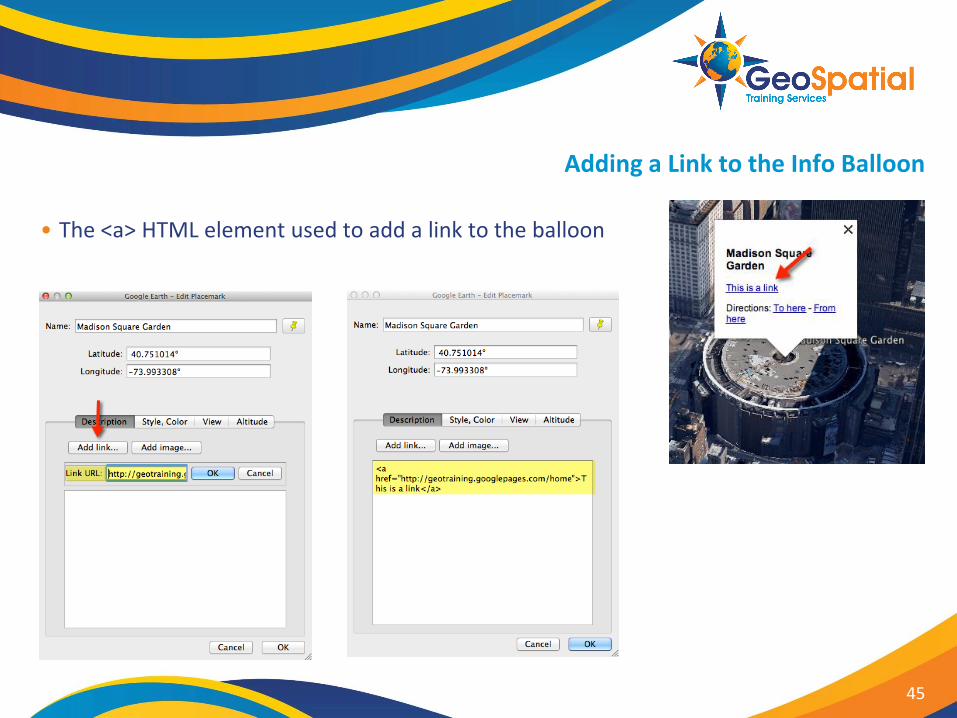
Adding a Link to the Info Balloon
• The <a> HTML element used to add a link to the balloon
45
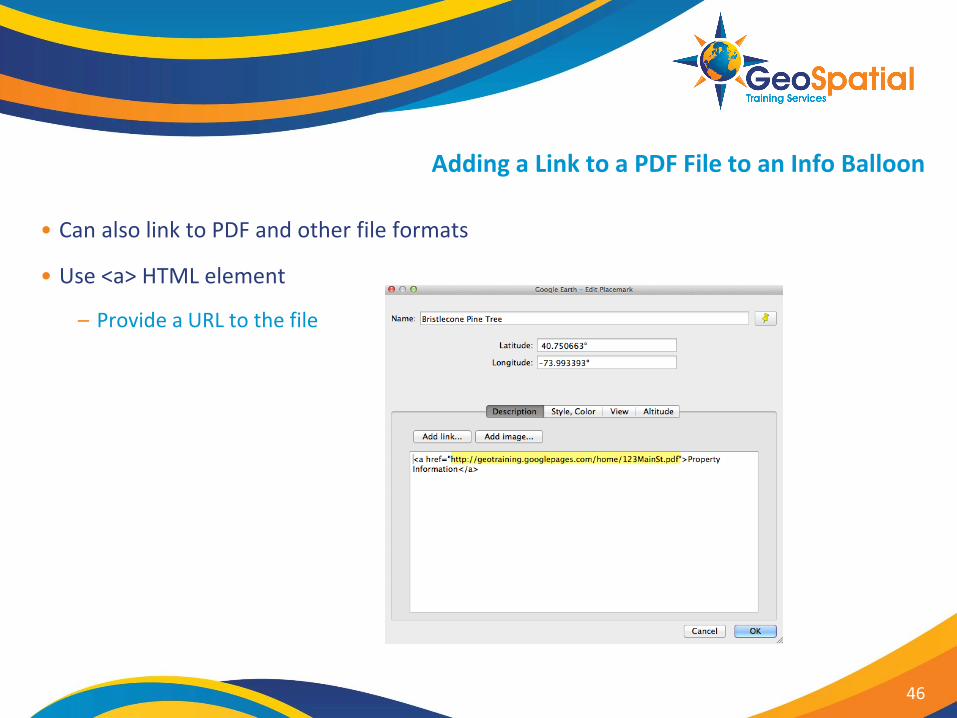
Adding a Link to a PDF File to an Info Balloon
• Can also link to PDF and other file formats
• Use <a> HTML element
– Provide a URL to the file
46
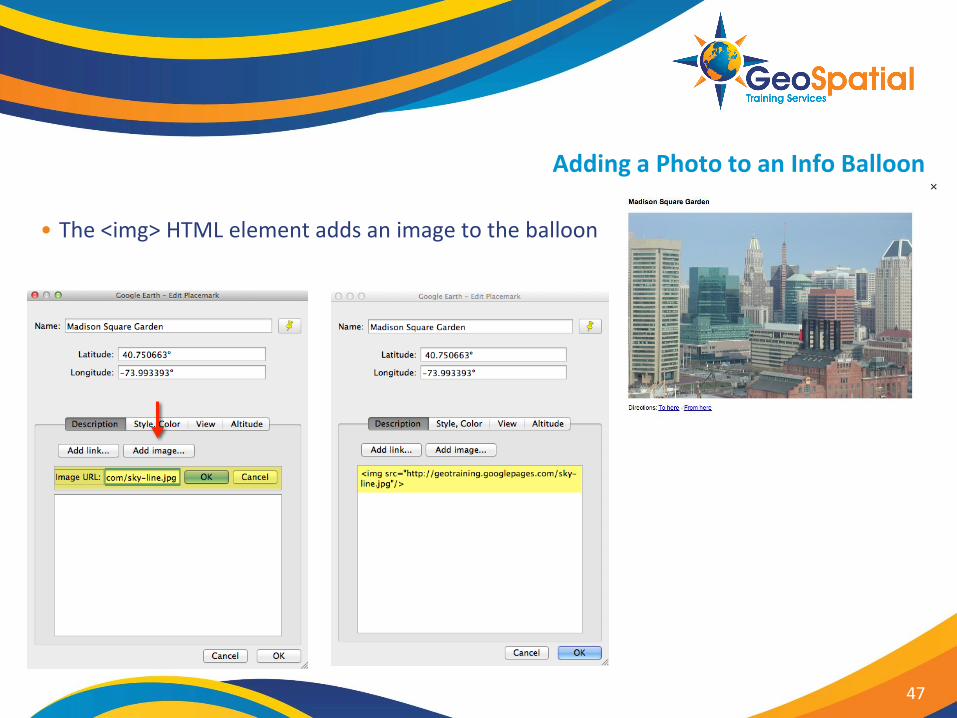
Adding a Photo to an Info Balloon
• The <img> HTML element adds an image to the balloon
47
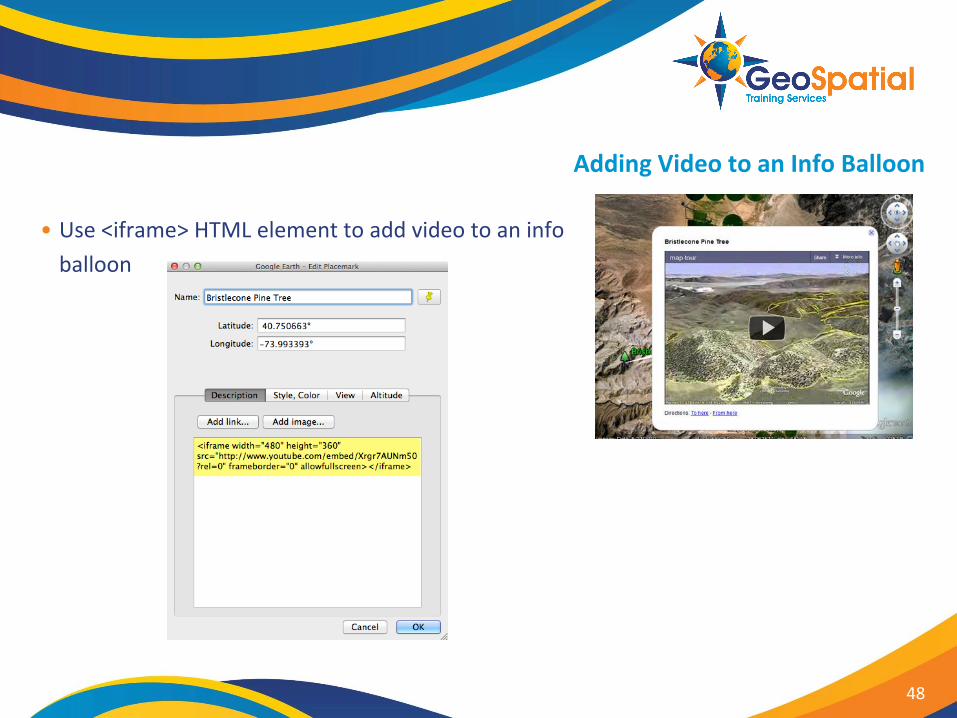
Adding Video to an Info Balloon
• Use <iframe> HTML element to add video to an info
balloon
48

Exercise
• Please complete the following exercise:
Adding Feature Information to Info Balloons
49
ADDITIONAL DATASETS
50
Module Outline
• Demographic information
• Parcel information
• Traffic counts
• Importing GIS datasets
• Styling imported datasets
51
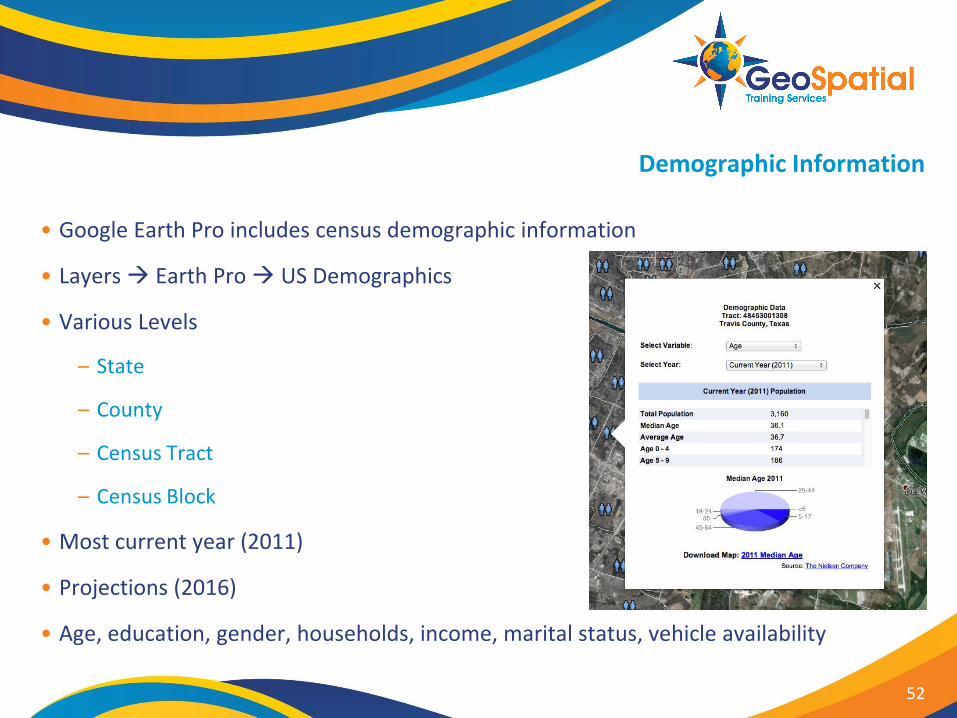
Demographic Information
• Google Earth Pro includes census demographic information
• Layers Earth Pro US Demographics
• Various Levels
– State
– County
– Census Tract
– Census Block
• Most current year (2011)
• Projections (2016)
• Age, education, gender, households, income, marital status, vehicle availability
52
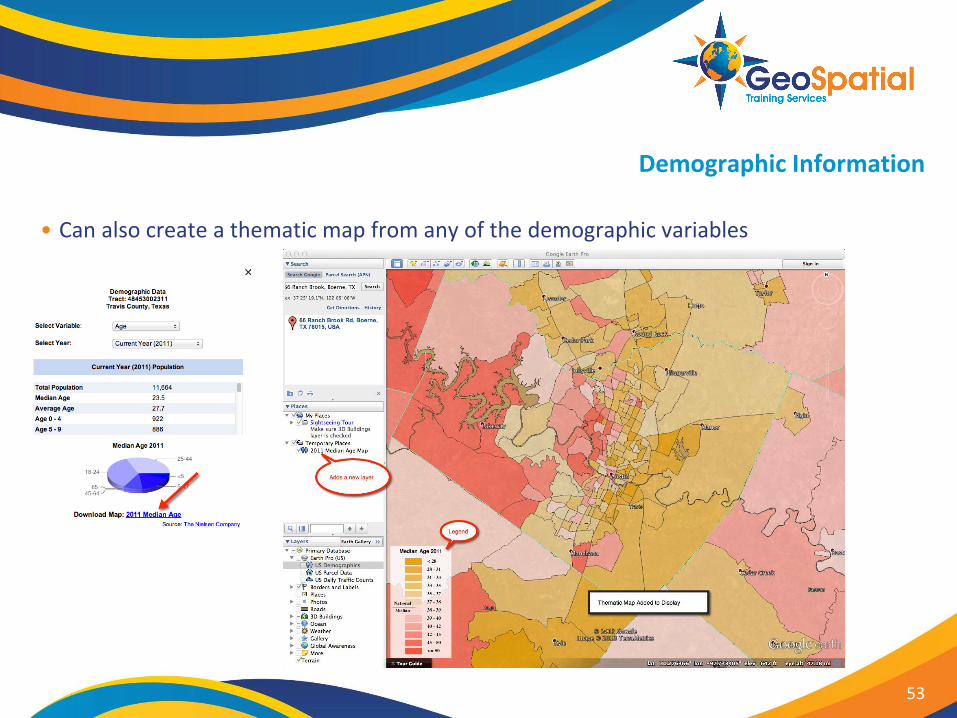
Demographic Information
• Can also create a thematic map from any of the demographic variables
53

Exercise
• Please complete the following exercise:
Displaying Demographic Data in Google Earth Pro
54
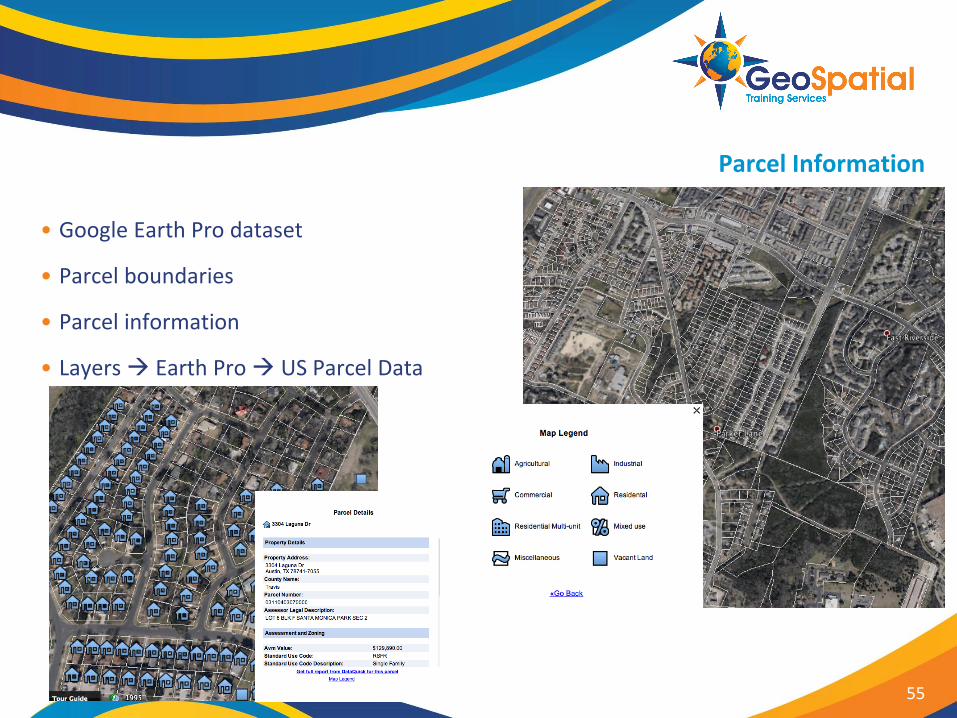
Parcel Information
• Google Earth Pro dataset
• Parcel boundaries
• Parcel information
• Layers Earth Pro US Parcel Data
55
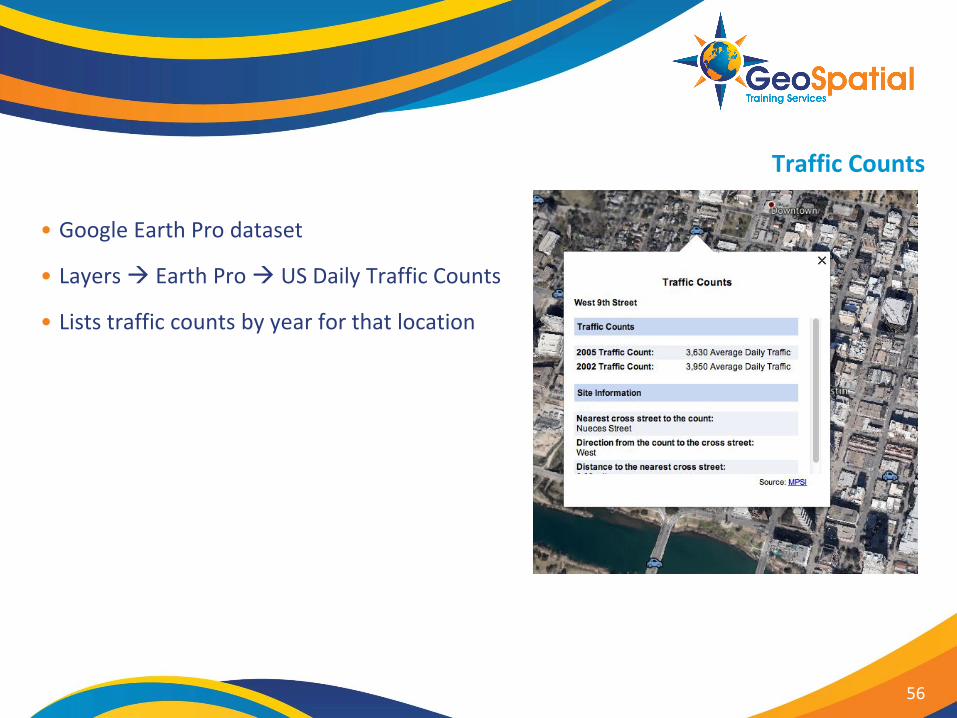
Traffic Counts
• Google Earth Pro dataset
• Layers Earth Pro US Daily Traffic Counts
• Lists traffic counts by year for that location
56
Importing Other GIS Datasets
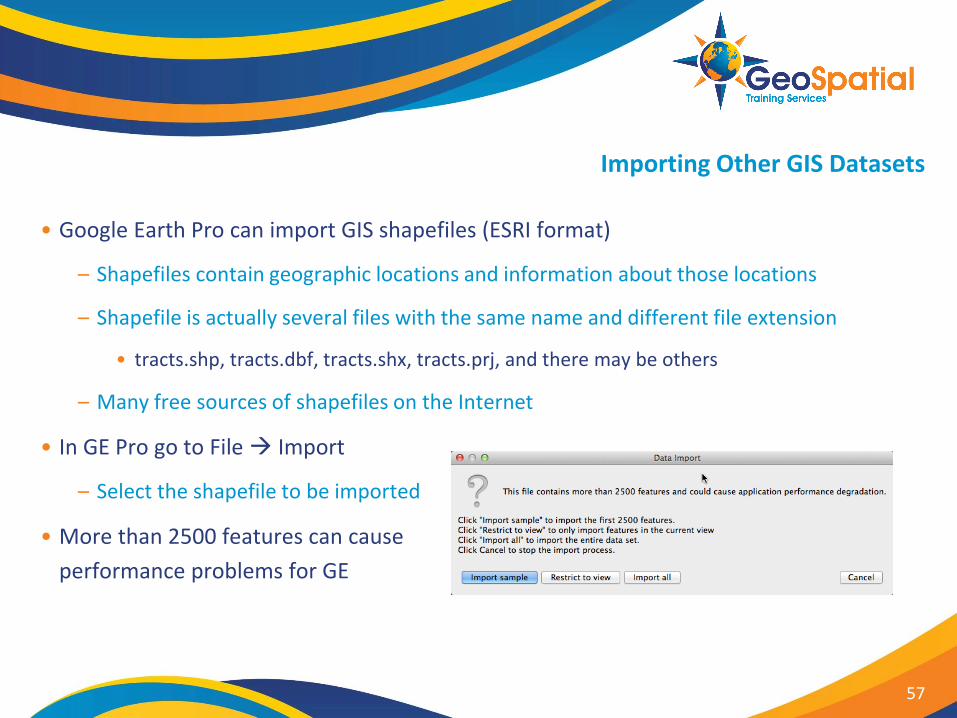
• Google Earth Pro can import GIS shapefiles (ESRI format)
– Shapefiles contain geographic locations and information about those locations
– Shapefile is actually several files with the same name and different file extension
• tracts.shp, tracts.dbf, tracts.shx, tracts.prj, and there may be others
– Many free sources of shapefiles on the Internet
• In GE Pro go to File Import
– Select the shapefile to be imported
• More than 2500 features can cause
performance problems for GE
57
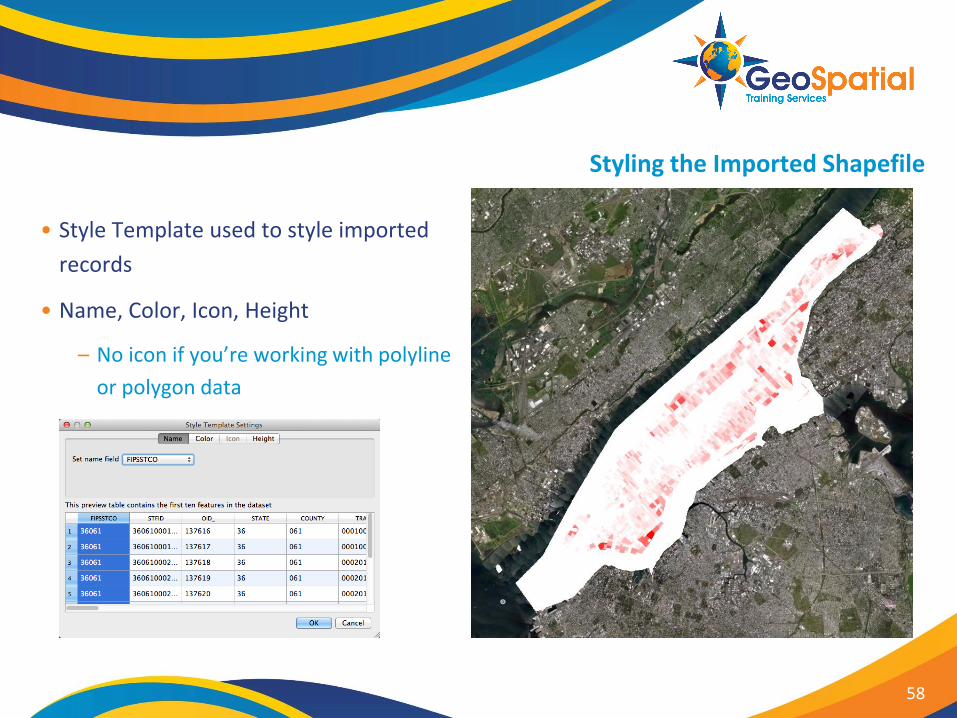
Styling the Imported Shapefile
• Style Template used to style imported
records
• Name, Color, Icon, Height
– No icon if you’re working with polyline
or polygon data
58

Exercise
• Please complete the following exercise:
Importing Shapefiles to Google Earth Pro
59

CREATING THEMATIC AND 3D MAPS
60
Module Outline
• Creating thematic maps
• Adjusting the transparency of a map
• Creating 3D maps
61
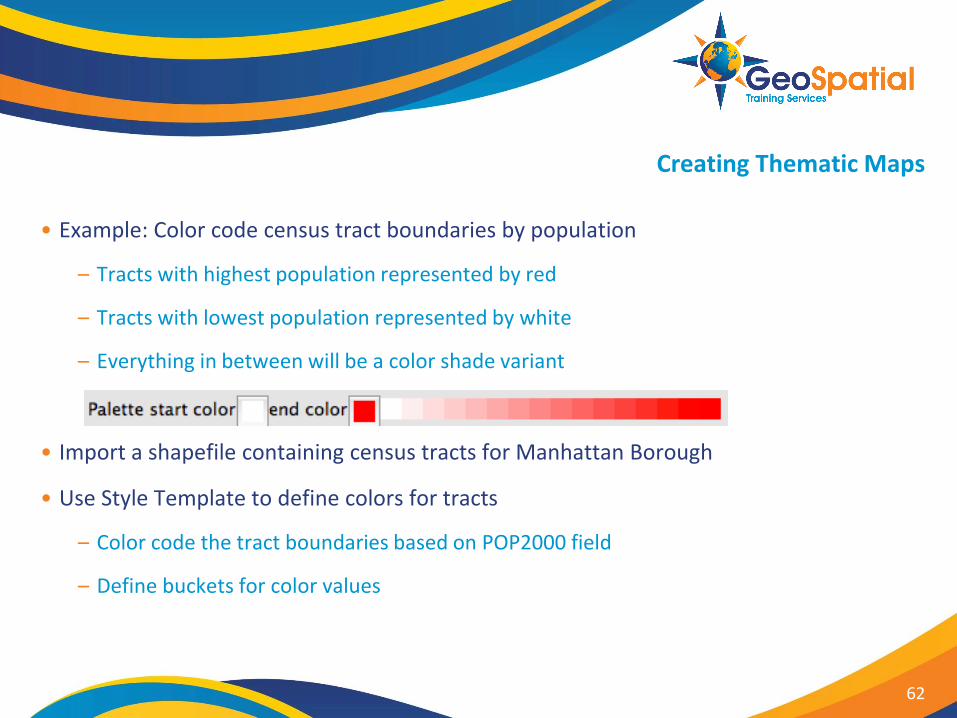
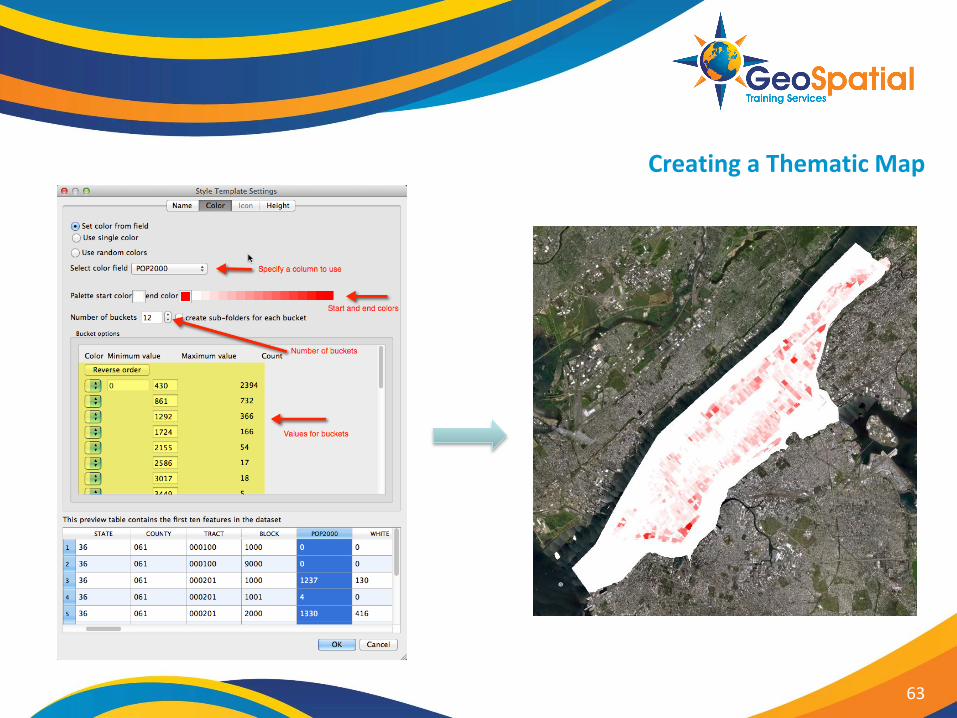
Creating Thematic Maps
• Example: Color code census tract boundaries by population
– Tracts with highest population represented by red
– Tracts with lowest population represented by white
– Everything in between will be a color shade variant
• Import a shapefile containing census tracts for Manhattan Borough
• Use Style Template to define colors for tracts
– Color code the tract boundaries based on POP2000 field
– Define buckets for color values
62
Creating a Thematic Map
63
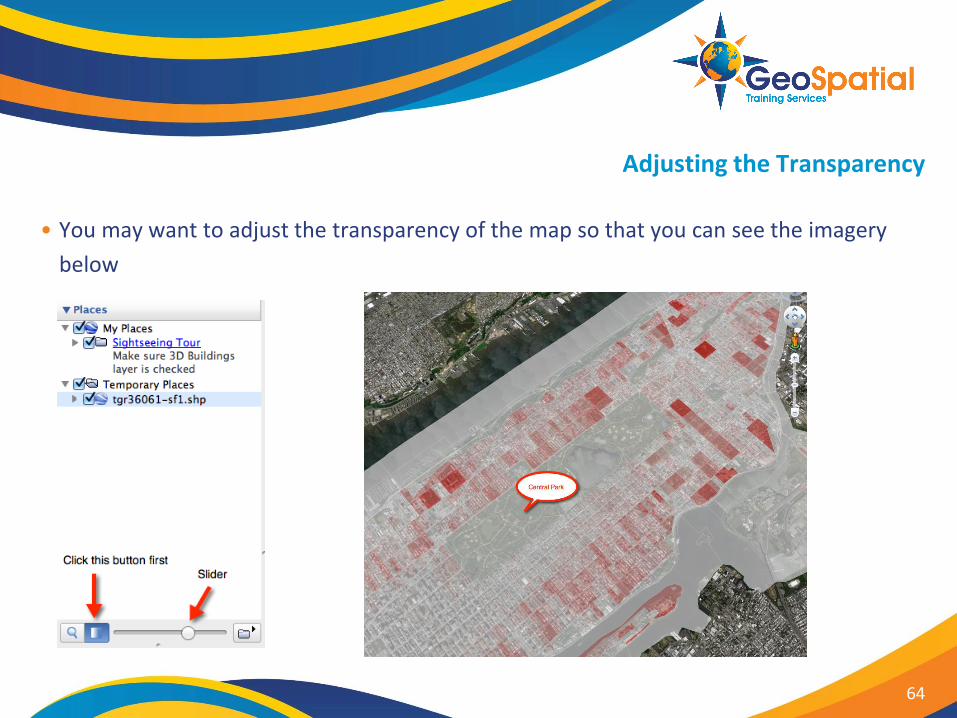
Adjusting the Transparency
• You may want to adjust the transparency of the map so that you can see the imagery
below
64
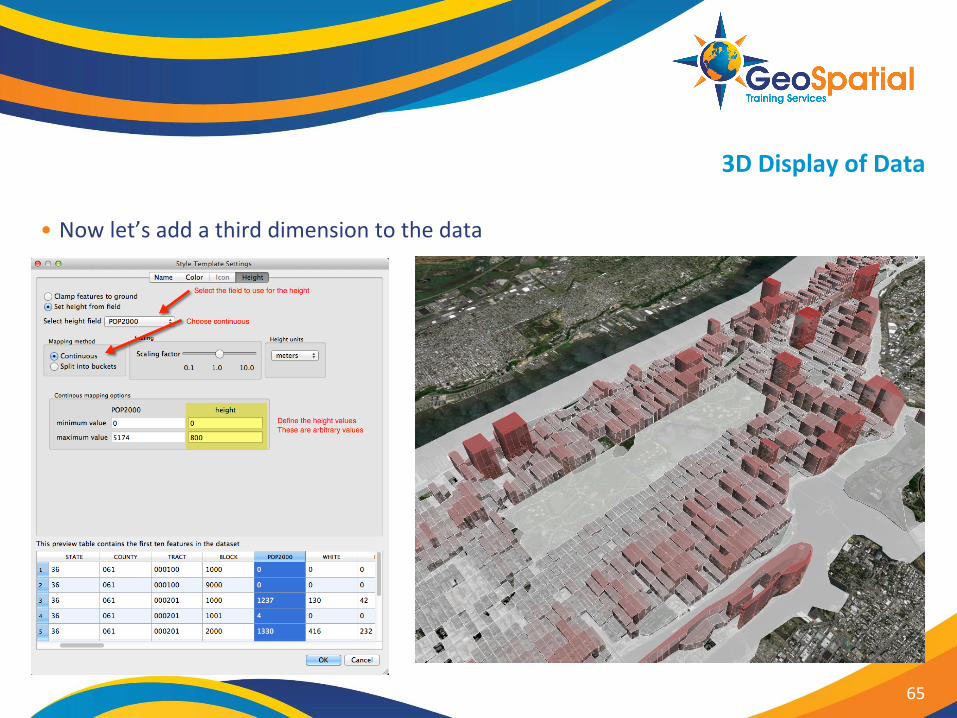
3D Display of Data
• Now let’s add a third dimension to the data
65
Exercise
• Please complete the following exercise:
Creating Thematic and 3D Maps with Google Earth Pro
66
PRESENTATION AND COMMUNICATION
67
Module Outline
• Emailing maps
• Printing maps
• Adding titles, legends, north arrows, and HTML to your printable maps
• Exporting maps as images or PDF files
• Creating tours and movies
68
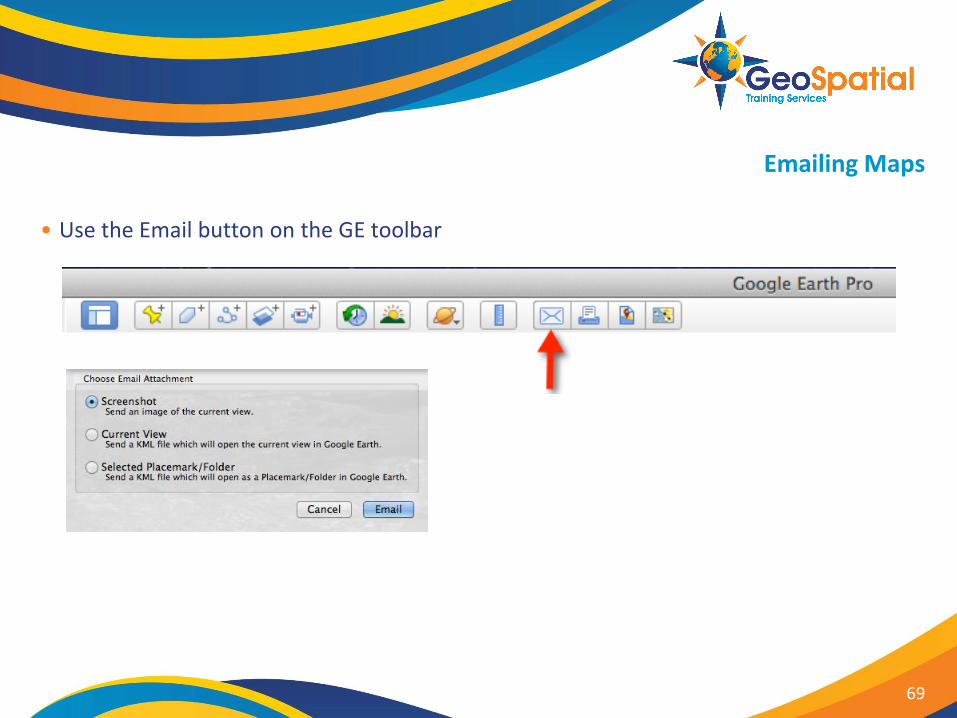
Emailing Maps
• Use the Email button on the GE toolbar
69
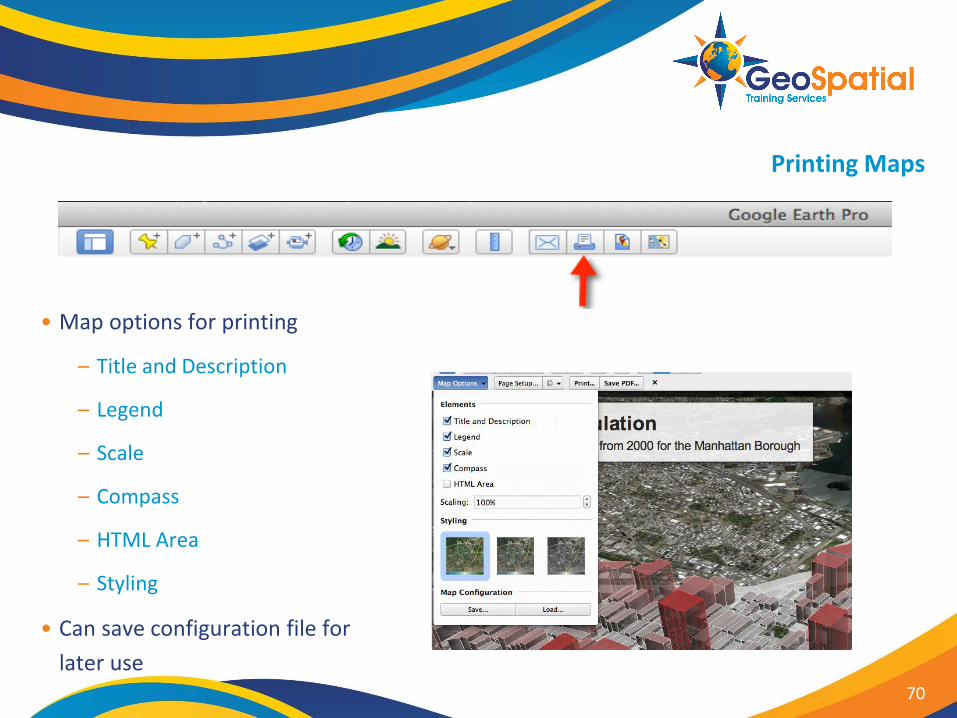
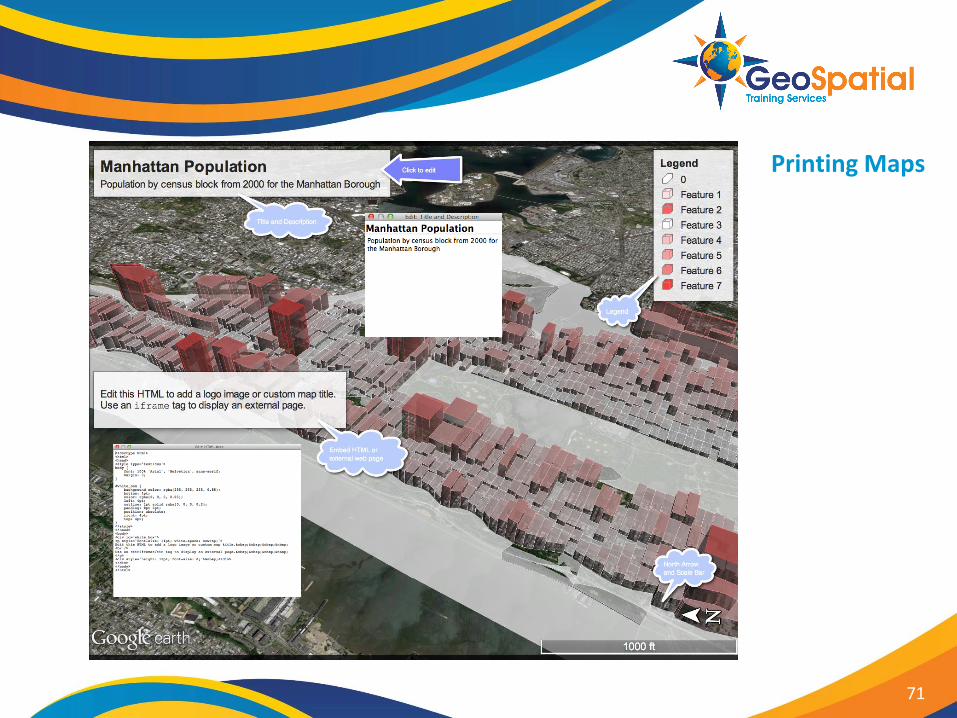
Printing Maps
• Map options for printing
– Title and Description
– Legend
– Scale
– Compass
– HTML Area
– Styling
• Can save configuration file for
later use 70
Printing Maps
71
Exercise
• Please complete the following exercise:
Printing Maps with Google Earth Pro
72
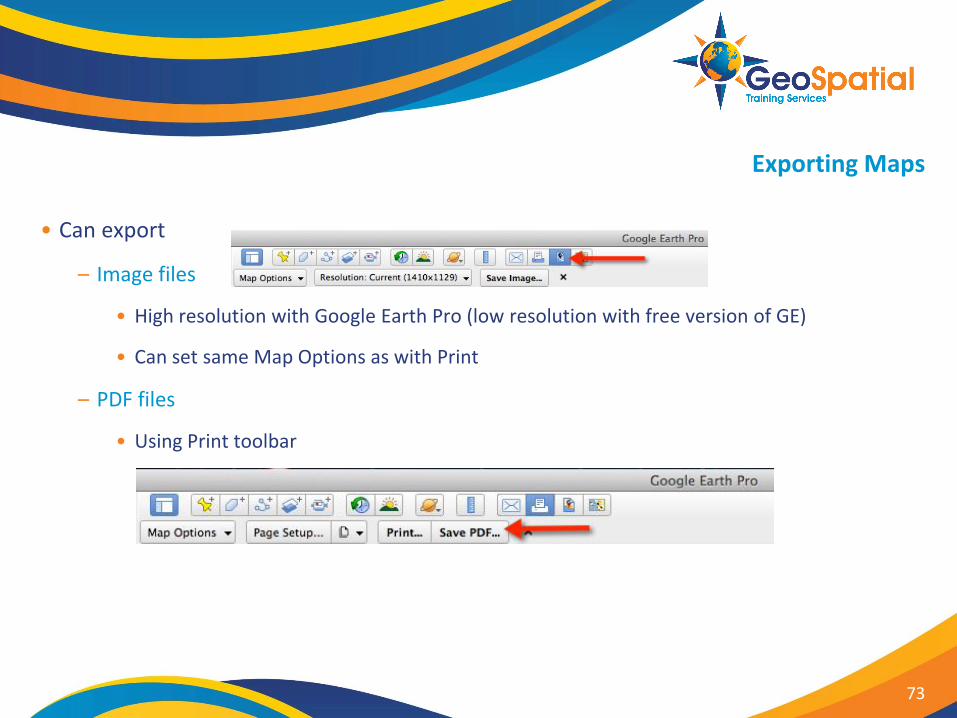
Exporting Maps
• Can export
– Image files
• High resolution with Google Earth Pro (low resolution with free version of GE)
• Can set same Map Options as with Print
– PDF files
• Using Print toolbar
73
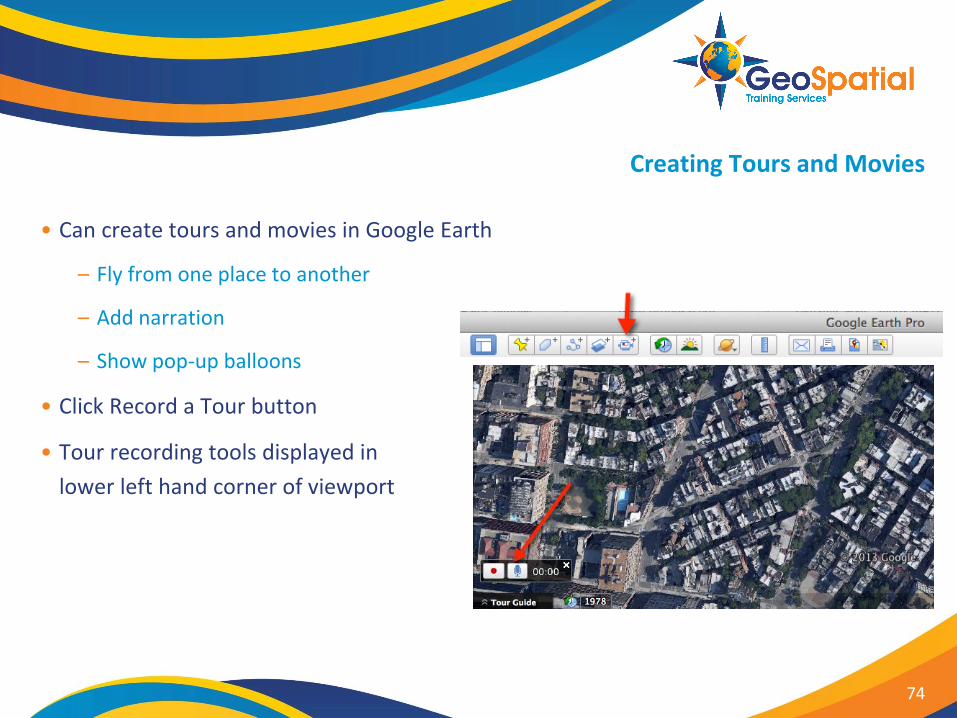
Creating Tours and Movies
• Can create tours and movies in Google Earth
– Fly from one place to another
– Add narration
– Show pop-up balloons
• Click Record a Tour button
• Tour recording tools displayed in
lower left hand corner of viewport
74
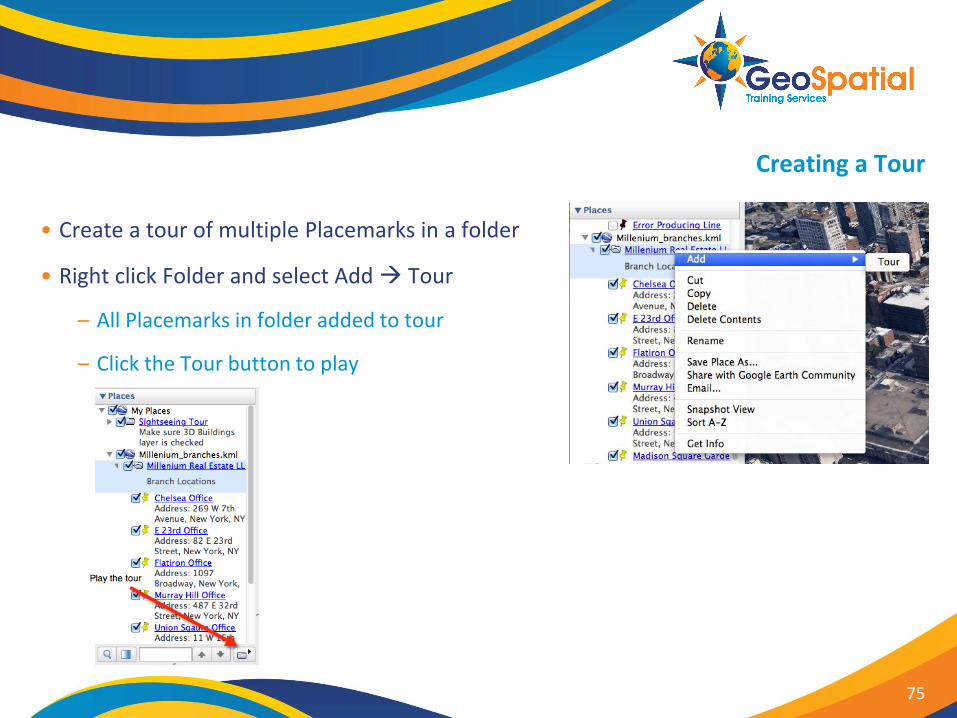
Creating a Tour
• Create a tour of multiple Placemarks in a folder
• Right click Folder and select Add Tour
– All Placemarks in folder added to tour
– Click the Tour button to play
75
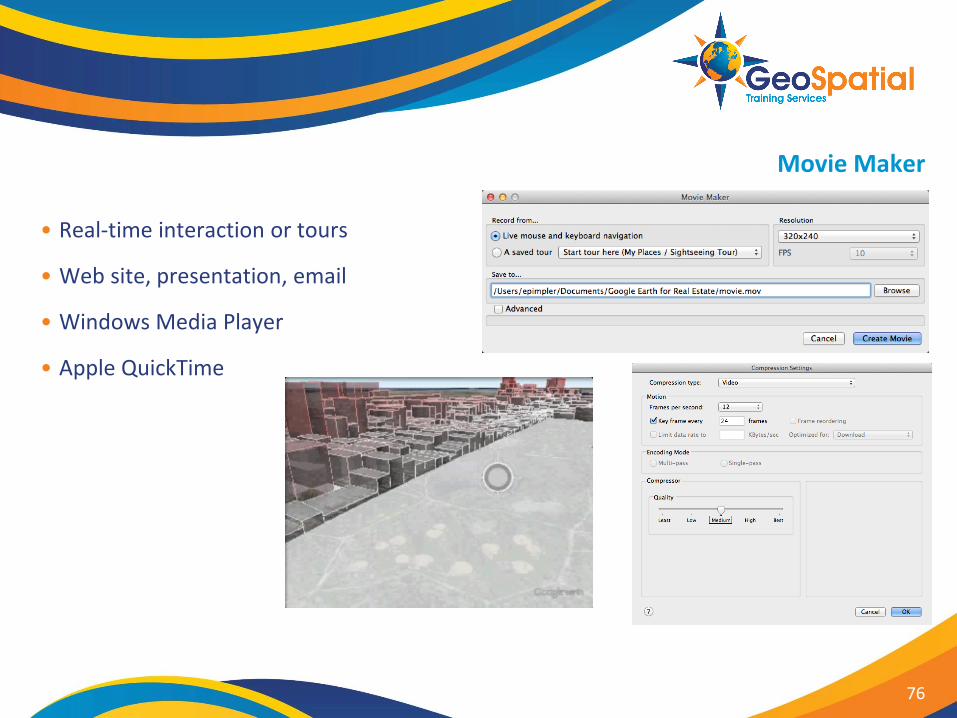
Movie Maker
• Real-time interaction or tours
• Web site, presentation, email
• Windows Media Player
• Apple QuickTime
76

ADDING IMAGES TO THE DISPLAY
77
Module Outline
• Overview of adding images to Google Earth
• Add Image Overlay tool
• Defining coordinates for the image
78
Adding Images to the Google Earth Display
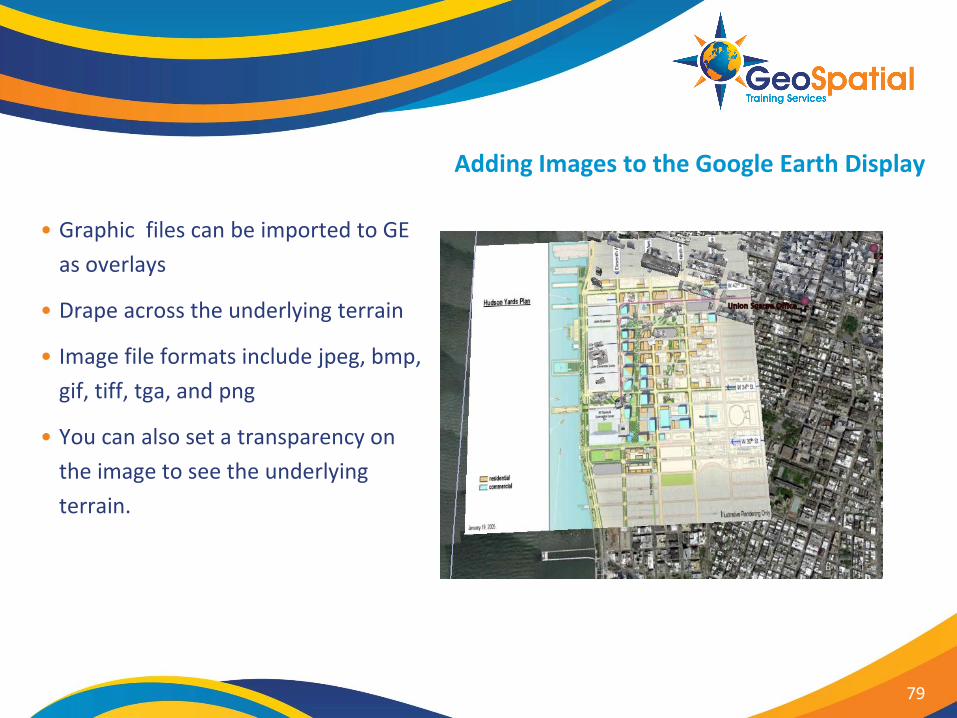
• Graphic files can be imported to GE
as overlays
• Drape across the underlying terrain
• Image file formats include jpeg, bmp,
gif, tiff, tga, and png
• You can also set a transparency on
the image to see the underlying
terrain.
79
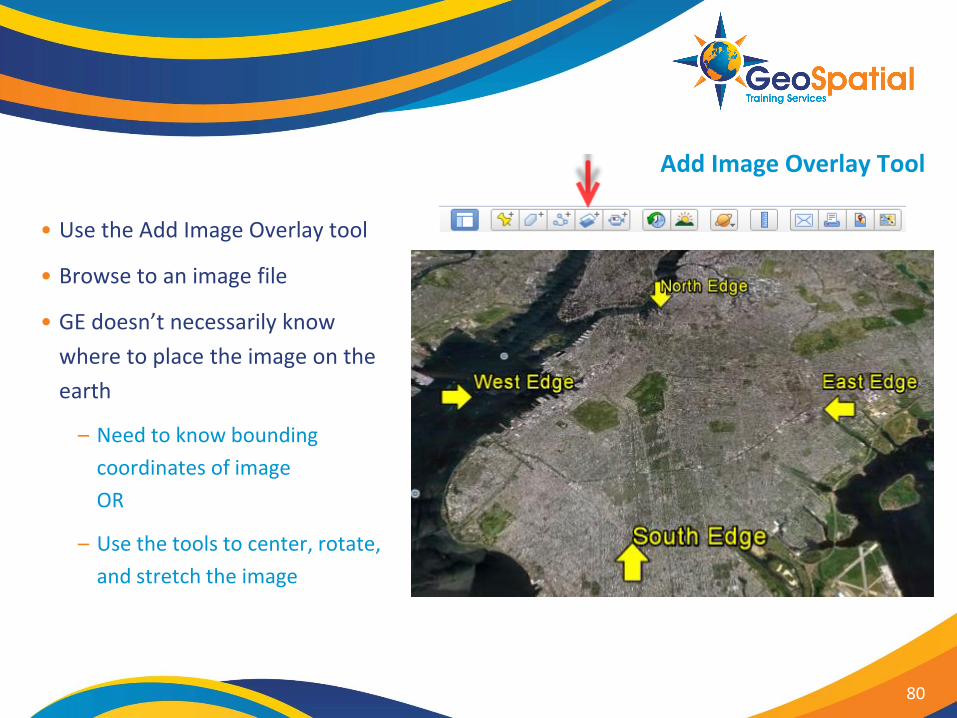
Add Image Overlay Tool
• Use the Add Image Overlay tool
• Browse to an image file
• GE doesn’t necessarily know
where to place the image on the
earth
– Need to know bounding
coordinates of image
OR
– Use the tools to center, rotate,
and stretch the image
80
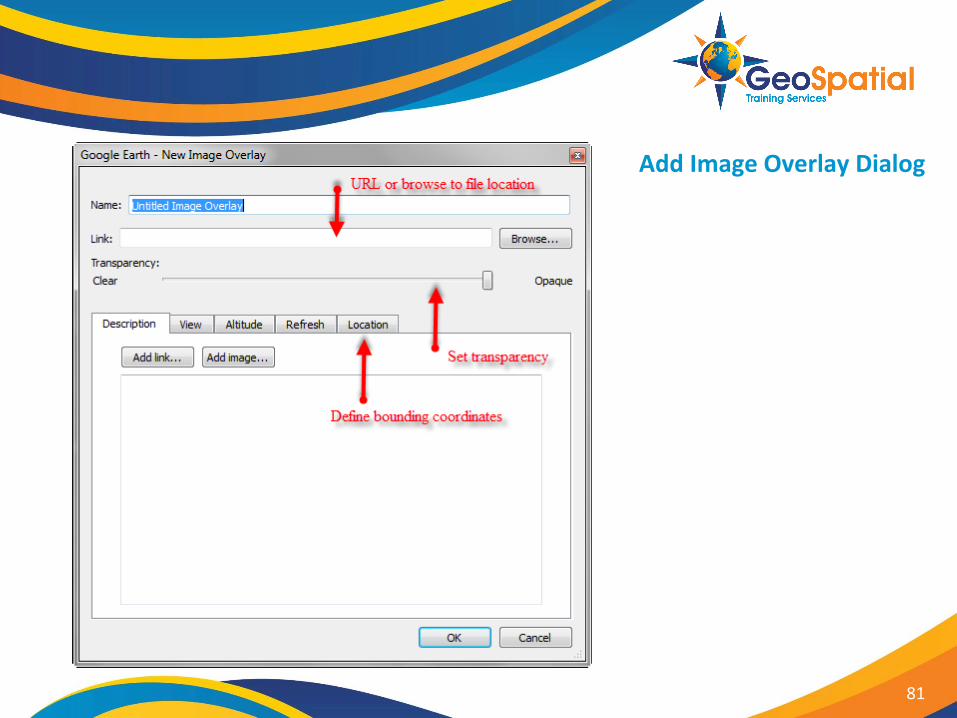
Add Image Overlay Dialog
81
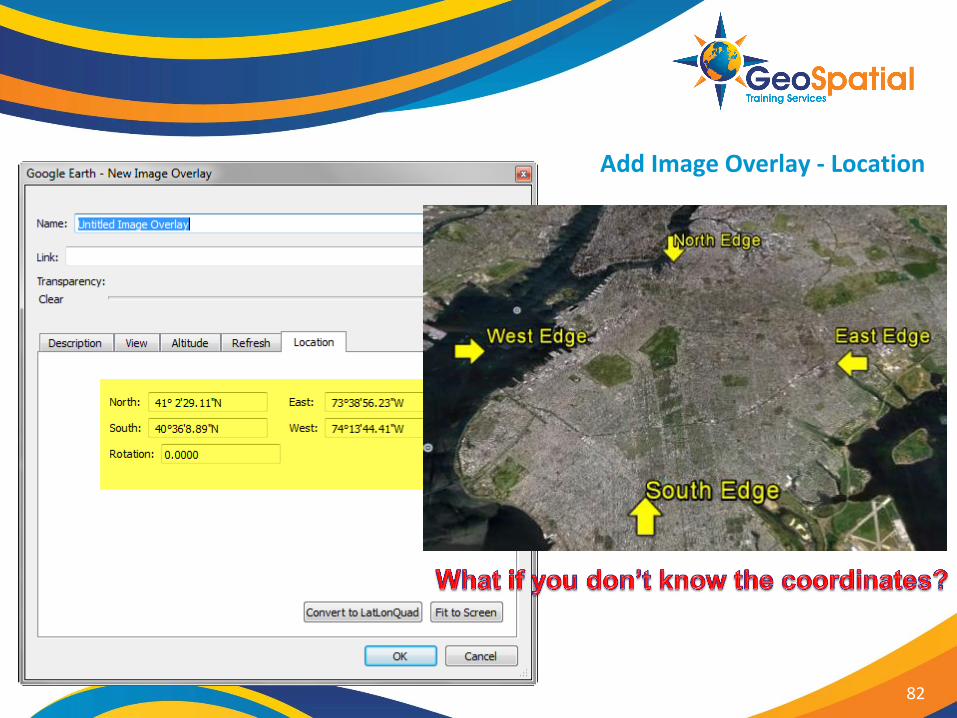
Add Image Overlay - Location
82
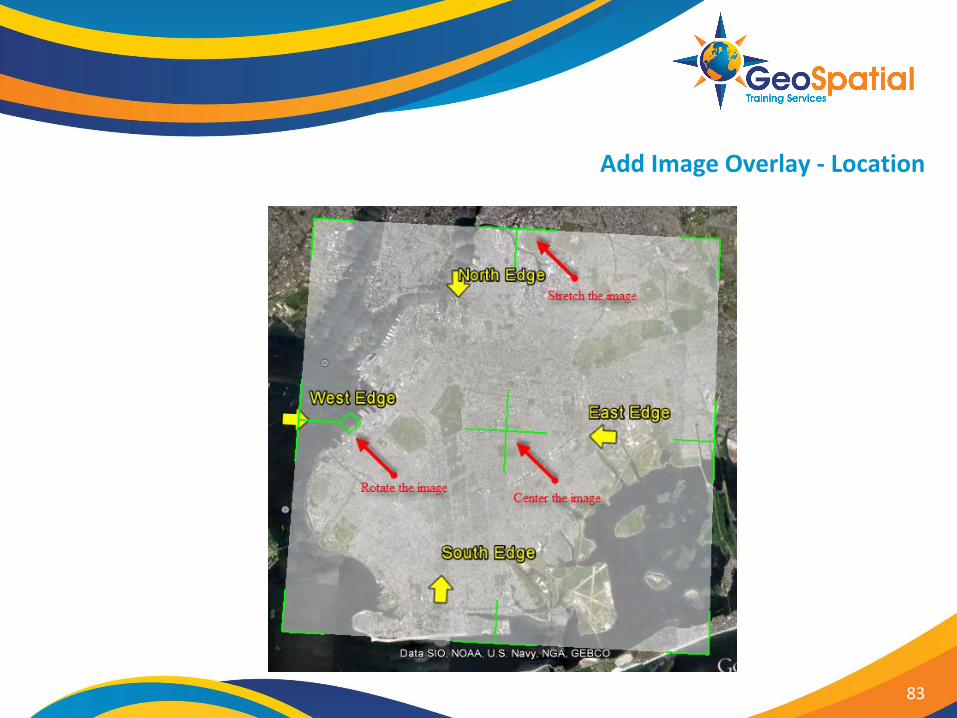
Add Image Overlay - Location
83
Some Image Files are Georeferenced
• Some image formats are already georeferenced
– GeoTIFF
– National Imagery Transmission Format (NTF)
– ERDAS Imagine Image (IMG)
• Can import these files without having to reposition
– Done automatically by GE
84
Exercise
• Please complete the following exercise:
Adding an Image Overlay to Google Earth
85

SHARING YOUR DATA WITH NETWORK LINKS
86
Module Outline
• What is a Network Link?
• Network Link Concepts
• How Network Links Work
• Reasons for Using Network Links
87
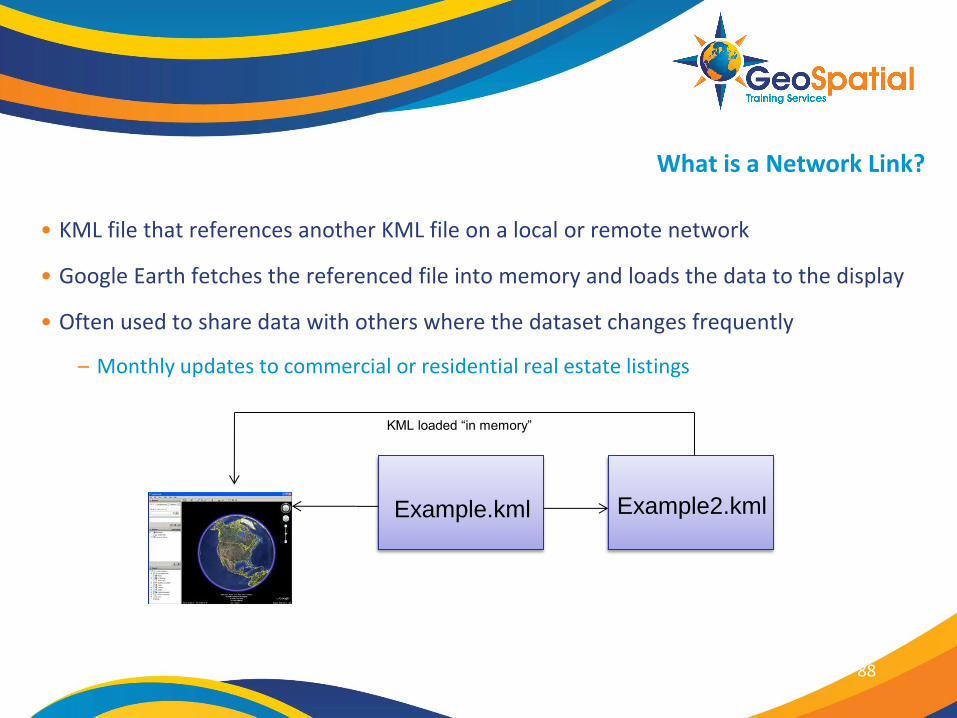
What is a Network Link?
• KML file that references another KML file on a local or remote network
• Google Earth fetches the referenced file into memory and loads the data to the display
• Often used to share data with others where the dataset changes frequently
– Monthly updates to commercial or residential real estate listings
Example.kml Example2.kml
KML loaded “in memory”
88
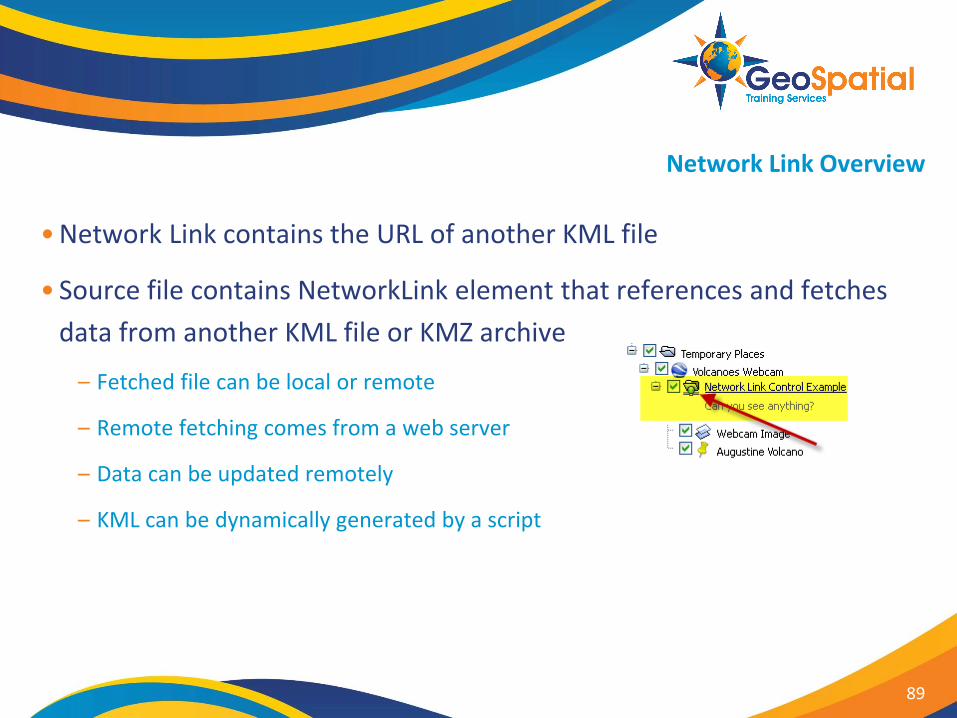
Network Link Overview
89
• Network Link contains the URL of another KML file
• Source file contains NetworkLink element that references and fetches
data from another KML file or KMZ archive
– Fetched file can be local or remote
– Remote fetching comes from a web server
– Data can be updated remotely
– KML can be dynamically generated by a script
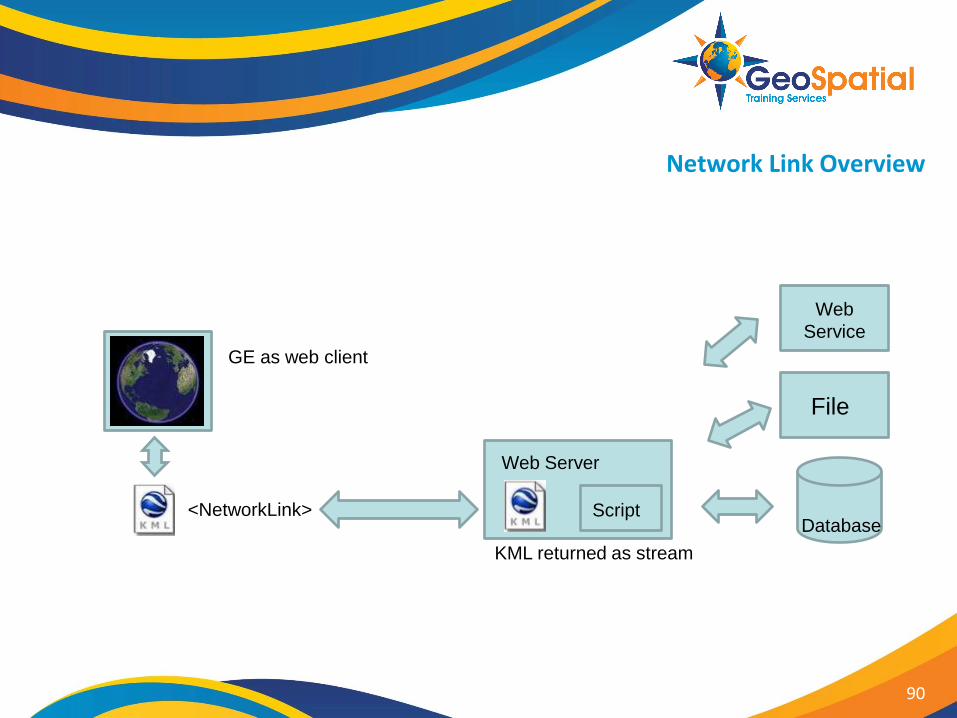
Network Link Overview
90
<NetworkLink>
Web Server
Script
GE as web client
KML returned as stream
Database
File
Web
Service
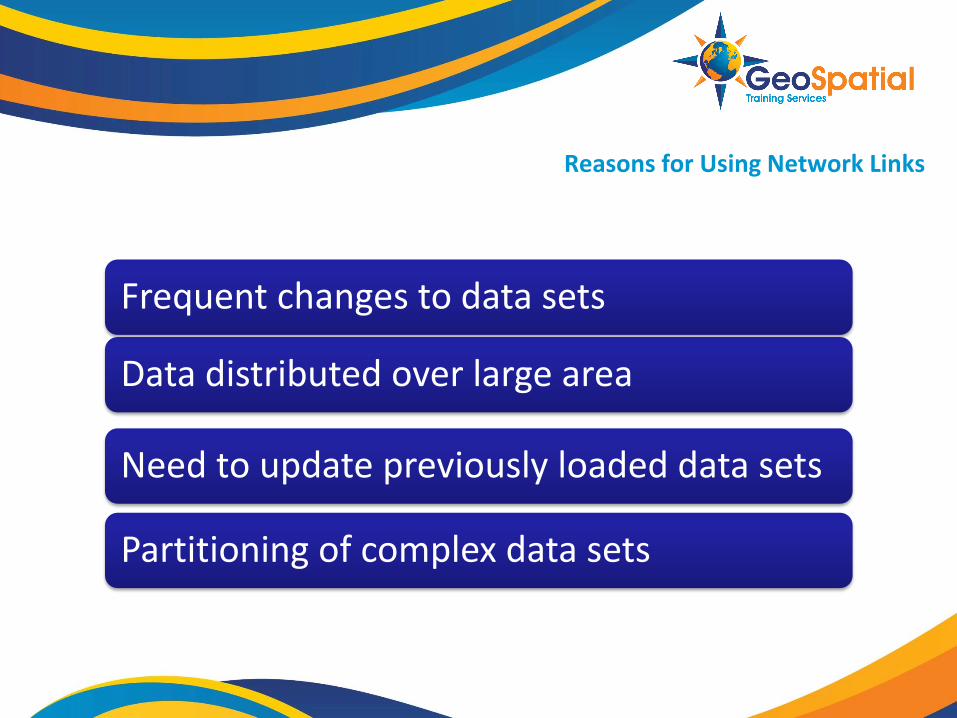
Reasons for Using Network Links
Frequent changes to data sets
Data distributed over large area
Need to update previously loaded data sets
Partitioning of complex data sets
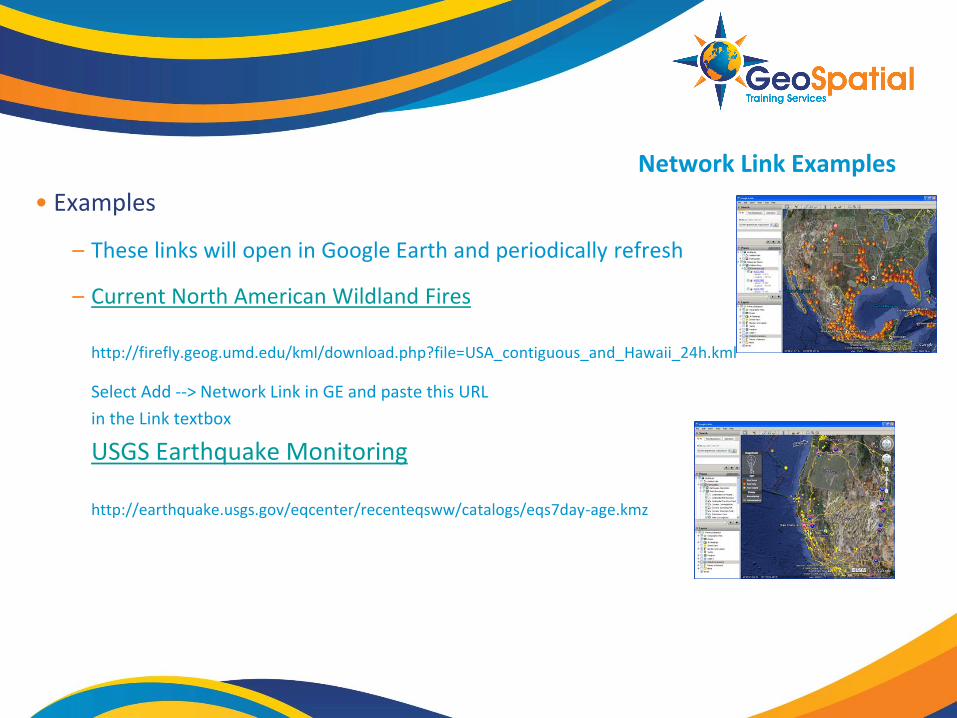
Network Link Examples
• Examples
– These links will open in Google Earth and periodically refresh
– Current North American Wildland Fires
http://firefly.geog.umd.edu/kml/download.php?file=USA_contiguous_and_Hawaii_24h.kml
Select Add --> Network Link in GE and paste this URL
in the Link textbox
USGS Earthquake Monitoring
http://earthquake.usgs.gov/eqcenter/recenteqsww/catalogs/eqs7day-age.kmz
Scripting Network Links
• CGI scripting languages can be used to dynamically generate KML data streams to a Network Link
– Python
– Perl
– PHP
• Process
– Client (Google Earth) calls the server (KML or KMZ file)
• Server (KML or KMZ) file contains a pointer to the CGI script
• Server returns:
– Response code of HTTP 200
– Sets the response content type to text/plain or application/vnd.google-earth.kml+xml
– Valid KML code
• This is powerful functionality for dynamically generating content
• Covered extensively in our “Creating Real Time Google Earth Applications” course.
93
TERRAIN INFORMATION
94
Module Outline
• Creating a viewshed
• Creating an elevation profile
95
Viewshed Basics
• GE Pro feature
• 360-degree view of area visible from a Placemark
– Doesn’t limit the view to a particular angle
• Visible area highlighted in green; non-visible area shaded in gray
96
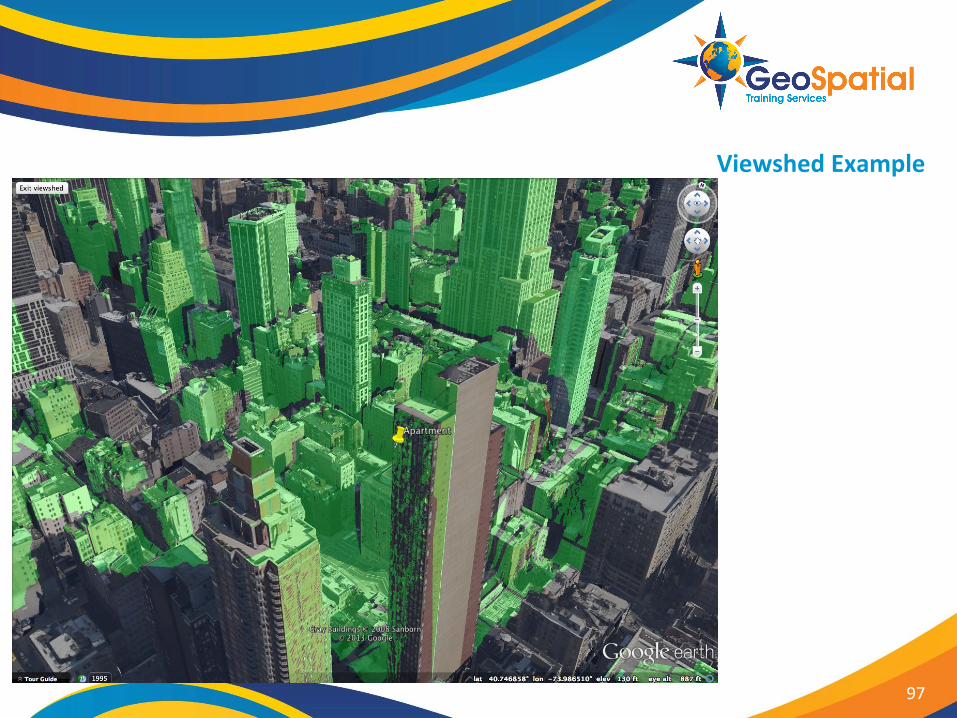
Viewshed Example
97
Viewshed Examples
• Architects can analyze the views available from a tract of land before designing
buildings.
• Real estate agents can evaluate views remotely, and take views into consideration when
they set property prices.
• Land developers can illustrate the viewable areas of parcels
• Businesses can make rough estimates of cell tower coverage from a particular location.
• Advertisers can try out different locations for billboards and signs.
98
How Viewshed Works
• Uses terrain layer to calculate
• Viewshed is calculated from Placemark view
– What you would see if you were at the Placemark itself, looking out at the view all around
you
– This is the view that Viewshed calculates.
• Camera view
– View of the Placemark and its surroundings
– This is the view GE displays
• In other words, Earth Pro calculates the viewshed from the Placemark view and displays
the viewshed from the Camera view.
99
Using Viewshed
1. Select an existing placemark or create a new one.
2. Right-click the placemark, then select Get Info.
– The Edit Placemark dialog appears.
3. Click Altitude and adjust the altitude so that it's at least approximately one meter
above the surface, then click OK.
4. From either the Edit menu or the placemark’s right-click menu, select Show Viewshed.
100

Exercise
• Please complete the following exercise:
Defining a Viewshed for a Commercial Property
101
Elevation Profiles
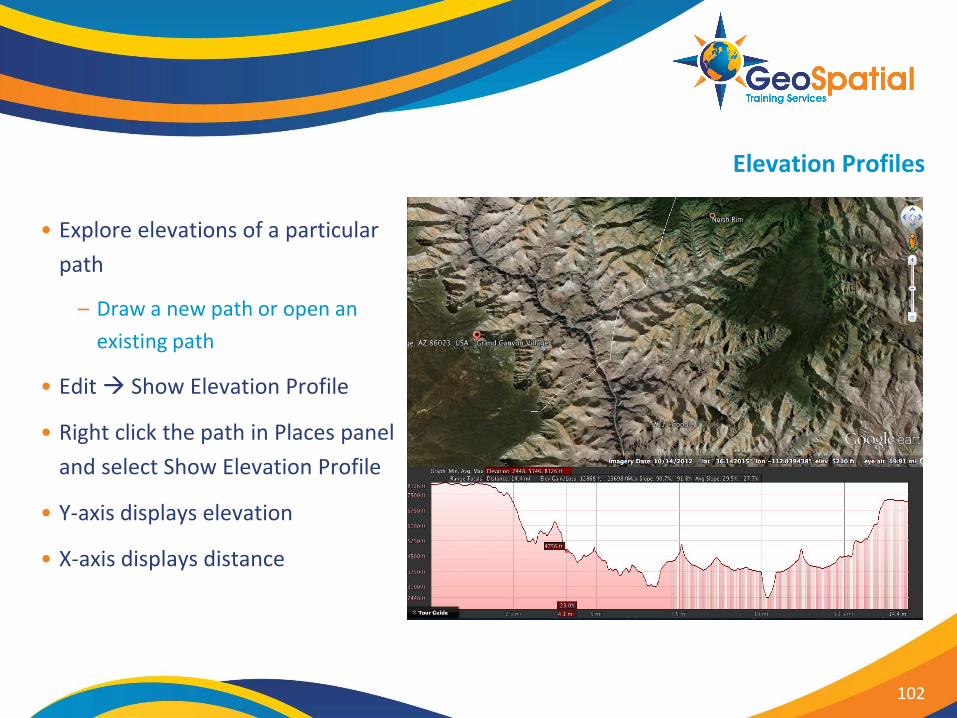
• Explore elevations of a particular
path
– Draw a new path or open an
existing path
• Edit Show Elevation Profile
• Right click the path in Places panel
and select Show Elevation Profile
• Y-axis displays elevation
• X-axis displays distance
102

Exercise
• Please complete the following exercise:
Creating an Elevation Profile for a Path
103
USING HISTORICAL IMAGERY
104
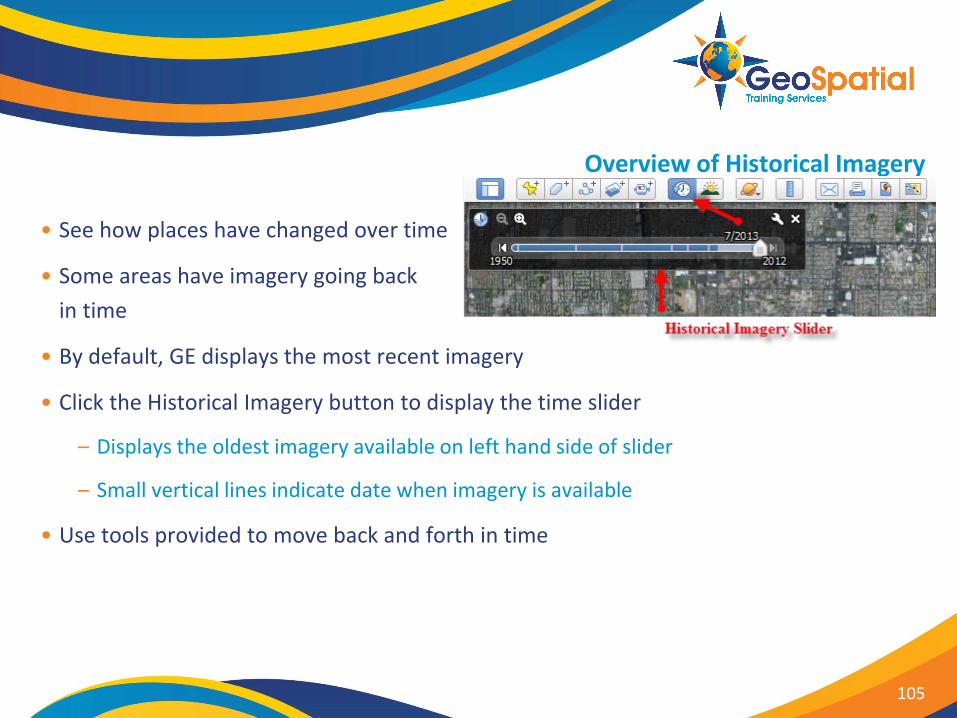
Overview of Historical Imagery
• See how places have changed over time
• Some areas have imagery going back
in time
• By default, GE displays the most recent imagery
• Click the Historical Imagery button to display the time slider
– Displays the oldest imagery available on left hand side of slider
– Small vertical lines indicate date when imagery is available
• Use tools provided to move back and forth in time
105
Overview of Historical Imagery
106
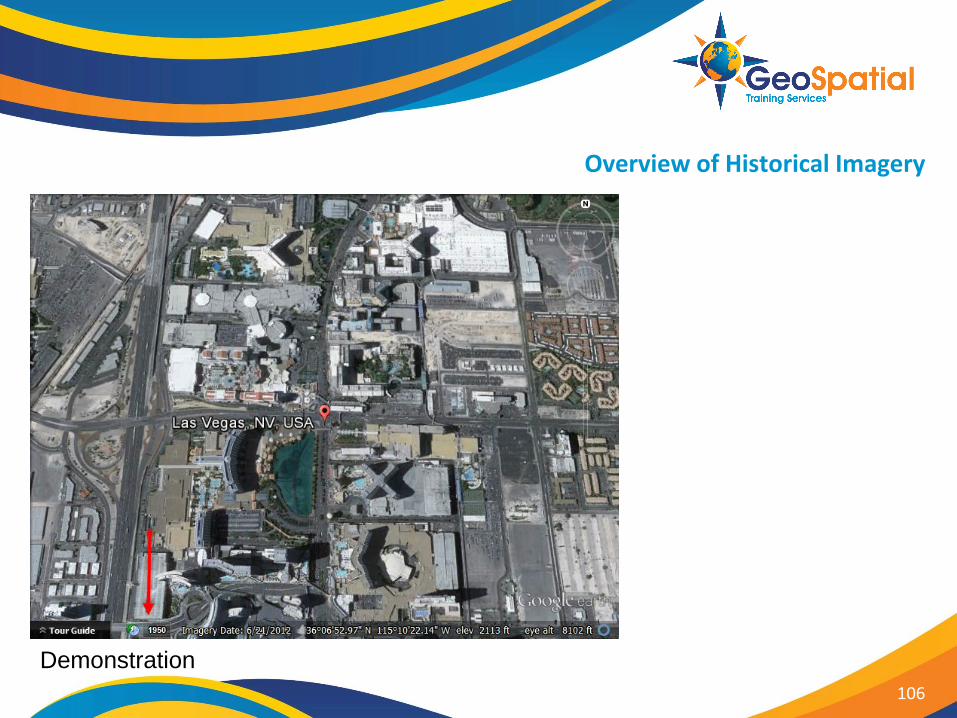
Demonstration
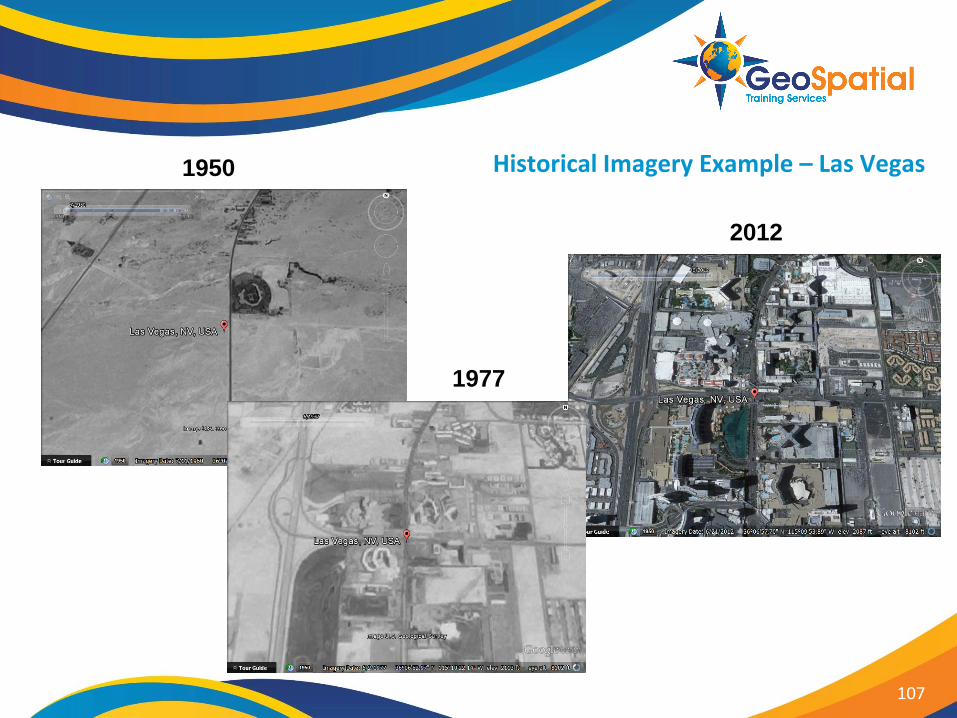
Historical Imagery Example – Las Vegas
107
1950
1977
2012
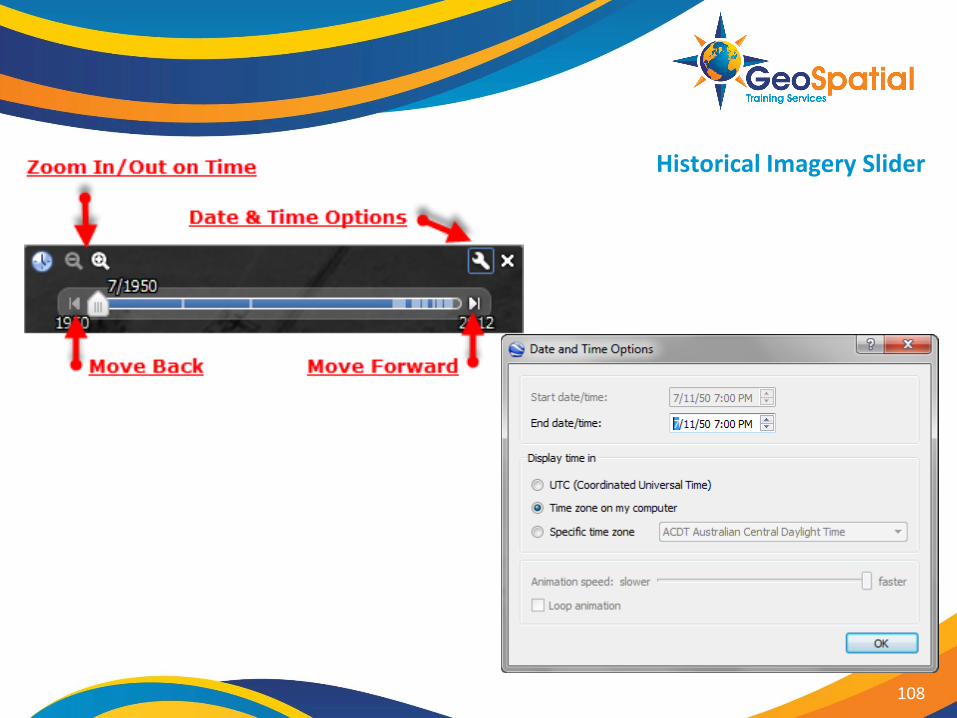
Historical Imagery Slider
108