got a raise? investors wince - markets.ap.orgmarkets.ap.org/members/txder/004pd.txder.pdf ·...

1
Commodities U.S. crude oil and wholesale gasoline rose. Natural gas fell almost 3 percent. Gold, silver and copper prices fell. Crude Oil (bbl) 55.26 53.79 +2.73 +21.7 Ethanol (gal) 1.30 1.28 +1.88 +3.1 Heating Oil (gal) 1.91 1.88 +1.88 +13.4 Natural Gas (mm btu) 2.73 2.81 -2.84 -7.0 Unleaded Gas (gal) 1.44 1.36 +4.36 +8.8 FUELS CLOSE PVS %CHG %YTD Gold (oz) 1316.90 1319.70 -0.21 +3.0 Silver (oz) 15.88 16.02 -0.89 +2.9 Platinum (oz) 826.70 824.70 +0.24 +3.9 Copper (lb) 2.78 2.79 -0.50 +5.6 METALS CLOSE PVS %CHG %YTD Cattle (lb) 1.25 1.25 +0.52 +0.5 Coffee (lb) 1.07 1.09 -2.02 +4.9 Corn (bu) 3.78 3.77 +0.46 +0.9 Cotton (lb) 0.74 0.74 -1.02 +2.0 Lumber (1,000 bd ft) 419.20 416.20 +0.72 ... Orange Juice (lb) 1.22 1.20 +1.79 -2.3 Soybeans (bu) 9.18 9.15 +0.27 +4.0 Wheat (bu) 5.24 5.17 +1.50 +4.2 AGRICULTURE CLOSE PVS %CHG %YTD Advanced 1584 Declined 1186 New Highs 86 New Lows 9 Vol. (in mil.) 3,703 Pvs. Volume 4,833 2,343 2,864 1658 1222 53 16 NYSE NASD DOW 25193.15 24982.49 25063.89 +64.22 +0.26% s s t +7.44% DOW Trans. 10171.30 10060.19 10123.99 +64.62 +0.64% s s t +10.40% DOW Util. 727.65 719.08 724.66 -2.59 -0.36% s s t +1.65% NYSE Comp. 12350.55 12287.21 12329.69 +30.65 +0.25% s s s +8.40% NASDAQ 7299.94 7243.41 7263.87 -17.87 -0.25% s s t +9.47% S&P 500 2716.66 2696.88 2706.53 +2.43 +0.09% s s t +7.97% S&P 400 1843.79 1831.34 1841.52 +6.13 +0.33% s s t +10.73% Wilshire 5000 28108.54 27926.17 28026.70 +34.29 +0.12% s s t +8.84% Russell 2000 1504.51 1495.47 1502.05 +2.63 +0.18% s s t +11.38% HIGH LOW CLOSE CHG %CHG WK MO QTR YTD StocksRecap 21,000 22,000 23,000 24,000 25,000 26,000 27,000 A S O N D J 24,240 24,720 25,200 Dow Jones industrials Close: 25,063.89 Change: 64.22 (0.3%) 10 DAYS 6,000 6,500 7,000 7,500 8,000 8,500 A S O N D J 6,920 7,120 7,320 Nasdaq composite Close: 7,263.87 Change: -17.87 (-0.2%) 10 DAYS NET 1YR TREASURIES LAST PVS CHG WK MO QTR AGO 5.50 5.00 4.50 2.38 1.88 1.38 PRIME RATE FED FUNDS LAST 6 MO AGO 1 YR AGO 3-month T-bill 2.39 2.39 ... s t s 1.49 6-month T-bill 2.46 2.46 ... t r t 1.64 52-wk T-bill 2.56 2.55 +0.01 t s t 1.88 2-year T-note 2.49 2.45 +0.04 t s t 2.16 5-year T-note 2.50 2.43 +0.07 t s t 2.56 7-year T-note 2.58 2.51 +0.07 t s t 2.71 10-year T-note 2.69 2.63 +0.06 t s t 2.79 30-year T-bond 3.03 3.00 +0.03 t s t 3.02 NET 1YR BONDS LAST PVS CHG WK MO QTR AGO Barclays Glob Agg Bd 1.93 1.98 -0.05 t t t 1.80 Barclays USAggregate 3.15 3.22 -0.07 t t t 2.97 Barclays US Corp 3.91 3.99 -0.08 t t t 3.45 Barclays US High Yield 6.90 7.03 -0.13 t t s 5.78 Moodys AAA Corp Idx 3.79 3.85 -0.06 t t t 3.59 10-Yr. TIPS .78 .75 +0.03 t t t .63 Interestrates The yield on the 10-year Treasury note rose to 2.69 percent Friday. Yields affect interest rates on mortgages and other consumer loans. USD per British Pound 1.3083 -.0030 -.23% 1.3130 1.4263 Canadian Dollar 1.3088 -.0044 -.34% 1.2992 1.2274 USD per Euro 1.1461 +.0017 +.15% 1.1664 1.2502 Japanese Yen 109.51 +.62 +.57% 111.56 109.42 Mexican Peso 19.1210 -.0137 -.07% 18.6047 18.3469 6MO 1YR MAJORS CLOSE CHG %CHG AGO AGO Israeli Shekel 3.6376 +.0043 +.12% 3.6743 3.4315 Norwegian Krone 8.4370 +.0013 +.02% 8.1729 7.6502 South African Rand 13.3280 +.0586 +.44% 13.2276 11.8680 Swedish Krona 9.0555 +.0057 +.06% 8.8032 7.8496 Swiss Franc .9951 +.0004 +.04% .9916 .9277 EUROPE/AFRICA/MIDDLE EAST Australian Dollar 1.3792 +.0027 +.20% 1.3511 1.2446 Chinese Yuan 6.7449 +.0445 +.66% 6.8248 6.2986 Hong Kong Dollar 7.8471 -.0000 -.00% 7.8484 7.8214 Indian Rupee 71.475 +.523 +.73% 68.325 63.918 Singapore Dollar 1.3505 +.0044 +.33% 1.3620 1.3085 South Korean Won 1119.56 +5.47 +.49% 1118.90 1071.41 Taiwan Dollar 30.78 +.05 +.16% 30.63 29.21 ASIA/PACIFIC Foreign Exchange The U.S. dollar strengthened versus the euro and the Japa- nese yen. The dollar also strengthened against the British pound, but weakened versus the Canadian dollar. Stocks of Local Interest AK Steel Hold AKS 2.94 -.01 -0.3% +30.7% -41.7% 13 ... AT&T Inc T 30.00 -.06 -0.2% +5.1% -14.4% 6 2.04 Activision Blizzard ATVI 46.01 -1.23 -2.6% -1.2% -35.8% 25 0.34 Adv Micro Dev AMD 24.51 +.10 +0.4% +32.8% +77.7% ... Altria Group MO 49.20 -.15 -0.3% -0.4% -25.6% 16 3.44 Amazon.com Inc AMZN 1626.23 -92.50 -5.4% +8.3% +18.5% ... Annaly Capital Mgmt NLY 10.40 -.04 -0.4% +5.9% +10.4% 12 1.20 Aphria Inc APHA 9.62 +.88 +10.1% +69.1% -38.9% ... Apple Inc AAPL 166.52 +.08 ...% +5.6% +1.1% 17 2.92 Aurora Cannabis Inc ACB 7.40 +.31 +4.4% +49.2% -25.7% ... AVEO Pharmaceuticals AVEO .60 -.10 -14.2% -62.5% -78.4% ... Avon Products AVP 2.50 +.16 +6.8% +64.5% -4.1% 25 ... Bank of America BAC 28.38 -.09 -0.3% +15.2% -9.3% 11 0.60 Barrick Gold GOLD 13.25 -.14 -1.0% +11.8% -5.6% ... Baxter Intl BAX 72.13 -.36 -0.5% +9.6% +1.7% 34 0.76 Brist Myr Sqb BMY 49.89 +.52 +1.1% -4.0% -18.6% 49 1.64 Brixmor Property Grp BRX 17.50 +.37 +2.2% +19.1% +12.4% 15 1.12 CVS Health Corp CVS 65.22 -.33 -0.5% -0.5% -14.2% 11 2.00 Caesars Entertain CZR 9.26 +.12 +1.3% +36.4% -34.5% ... Canopy Growth Corp CGC 48.88 -.10 -0.2% +81.9% +94.3% ... Celgene Inc CELG 89.67 +1.21 +1.4% +39.9% -12.6% 28 ... CenturyLink Inc CTL 15.25 -.07 -0.5% +0.7% -1.9% 6 2.16 Chesapk Engy CHK 2.84 -.01 -0.4% +35.2% -18.6% 5 ... Cisco Syst CSCO 47.34 +.05 +0.1% +9.3% +16.2% 21 1.32 Citigroup C 63.67 -.34 -0.5% +22.3% -15.9% 10 1.80 CocaCola Co KO 48.70 +.57 +1.2% +2.9% +4.4% 92 1.56 Colfax Corp CFX 24.86 +.11 +0.4% +18.9% -38.2% 18 ... Comcast Corp A CMCSA 36.79 +.22 +0.6% +8.0% -12.2% 18 0.84 Cronos Group Inc CRON 20.81 +1.13 +5.7% +100.3% +167.7% ... Cypress Semi CY 14.79 +.92 +6.6% +16.3% -17.2% 25 0.44 Deutsche Bank AG DB 8.85 -.03 -0.3% +8.6% -51.6% 0.83 Dow DuPont Inc DWDP 53.47 -.34 -0.6% ...% -26.8% 17 1.52 eBay Inc EBAY 34.31 +.66 +2.0% +22.2% -17.1% 15 0.14 EnCana Corp ECA 6.88 ... ...% +19.0% -43.9% 12 0.06 Exxon Mobil Corp XOM 75.92 +2.64 +3.6% +11.3% -12.4% 14 3.28 Facebook Inc FB 165.71 -.98 -0.6% +26.4% -10.8% 31 ... Fastenal Co FAST 60.55 +.09 +0.1% +15.8% +12.9% 23 1.72 Ferrellgas Part FGP 1.19 -.03 -2.5% +122.4% -62.9% 0.40 Flex Ltd FLEX 9.40 -.22 -2.3% +23.5% -46.6% 10 ... Flowers Foods FLO 19.61 -.05 -0.3% +6.2% +3.9% 21 0.72 Ford Motor F 8.72 -.08 -0.9% +14.0% -14.3% 5 0.60 Freeport McMoRan FCX 11.51 -.13 -1.1% +11.6% -39.3% 7 0.20 Gen Electric GE 10.19 +.03 +0.3% +34.6% -34.9% 0.04 HCA Holdings Inc HCA 139.71 +.28 +0.2% +12.3% +39.2% 21 1.60 Helios and Matheson HMNY .01 ... ...% -31.3% -100.0% ... Hilton Wwde Hldgs HLT 74.42 -.06 -0.1% +3.6% -12.3% 37 0.60 Histogenics Corp HSGX .18 -.03 -14.9% +101.1% -92.5% ... Indep Bk Cp MI IBCP 22.29 +.13 +0.6% +6.0% -1.3% 17 0.72 Intel Corp INTC 48.73 +1.61 +3.4% +3.8% +0.4% 18 1.26 JPMorgan Chase & Co JPM 103.88 +.38 +0.4% +6.4% -8.2% 12 2.24 Keycorp KEY 16.63 +.16 +1.0% +12.5% -20.4% 10 0.56 MGM Resorts Intl MGM 29.75 +.31 +1.1% +22.6% -17.9% 9 0.48 Marathon Oil MRO 16.00 +.21 +1.3% +11.6% -12.1% 0.20 Marriott Intl A MAR 114.57 +.04 ...% +5.5% -21.2% 26 1.64 Merck & Co MRK 76.45 +2.02 +2.7% +0.1% +29.0% 29 2.20 Micron Tech MU 39.60 +1.38 +3.6% +24.8% -12.6% 3 ... Microsoft Corp MSFT 102.78 -1.65 -1.6% +1.2% +11.2% 43 1.84 Mondelez Intl MDLZ 45.57 -.69 -1.5% +13.8% +6.4% 22 1.04 Morgan Stanley MS 41.82 -.48 -1.1% +5.5% -23.2% 9 1.20 Nabors Inds NBR 3.13 +.17 +5.7% +56.5% -59.2% 0.24 Newell Rubbermaid NWL 21.28 +.07 +0.3% +14.5% -16.3% 0.92 Nvidia Corporation NVDA 144.73 +.98 +0.7% +8.4% -41.3% 24 0.64 On Semiconductor ON 20.80 +.76 +3.8% +26.0% -19.0% 10 ... Oracle Corp ORCL 50.81 +.58 +1.2% +12.5% -1.2% 52 0.76 Paccar Inc PCAR 64.96 -.56 -0.9% +13.7% -8.0% 10 1.28 Pfizer Inc PFE 42.88 +.43 +1.0% -1.8% +19.3% 17 1.44 Procter & Gamble PG 97.47 +1.00 +1.0% +6.0% +15.1% 24 2.87 Qualcomm Inc QCOM 49.61 +.09 +0.2% -12.8% -23.9% 2.48 Regions Fncl RF 15.33 +.16 +1.1% +14.6% -18.7% 11 0.56 Rite Aid Corp RAD .75 -.05 -6.2% +6.4% -63.2% 1 ... Sally Beauty Hld SBH 17.42 +.20 +1.2% +2.2% +3.7% 11 ... Select Med Hldgs SEM 15.46 -.16 -1.0% +0.7% -11.8% 11 ... Sirius XM Hldgs Inc SIRI 5.98 +.15 +2.6% +4.7% -3.8% 33 0.05 Snap Inc A SNAP 6.91 +.23 +3.4% +25.4% -50.6% ... Sthwstn Energy SWN 4.38 +.01 +0.2% +28.4% +3.1% 5 ... Square Inc SQ 70.80 -.55 -0.8% +26.2% +52.1% ... Symantec Corp SYMC 22.91 +1.89 +9.0% +21.2% -21.7% 11 0.30 Target Corp TGT 71.17 -1.83 -2.5% +7.7% -0.5% 12 2.56 Titan Pharmaceut TTNP 1.65 +.42 +34.1% +23.3% -84.2% ... Transocean Ltd RIG 8.71 +.14 +1.6% +25.5% -20.6% ... TravelCenters Am TA 4.95 -.07 -1.4% +31.6% +14.1% ... Trinty Inds TRN 23.55 +.17 +0.7% +14.4% -13.8% 5 0.52 Twitter Inc TWTR 33.19 -.37 -1.1% +15.5% +30.0% ... US Steel Corp X 22.04 -.50 -2.2% +20.8% -39.2% 13 0.20 Universal Hlth Svc UHS 135.53 +3.00 +2.3% +16.3% +9.4% 17 0.40 Verizon Comm VZ 54.55 -.51 -0.9% -3.0% +6.2% 7 2.41 Visa Inc V 140.15 +5.14 +3.8% +6.2% +9.4% 47 1.00 WalMart Strs WMT 93.86 -1.97 -2.1% +0.8% -8.2% 54 2.08 Weatherford Intl Ltd WFT .77 +.13 +19.4% +38.5% -83.5% ... Wells Fargo & Co WFC 48.91 ... ...% +6.1% -22.5% 11 1.80 YTD 1YR NAME TKR CLOSE CHG %CHG %CHG %RTN P/E DIV YTD 1YR NAME TKR CLOSE CHG %CHG %CHG %RTN P/E DIV YTD 1YR NAME TKR CLOSE CHG %CHG %CHG %RTN P/E DIV The Week Ahead Spotlight on Mickey Walt Disney serves up its latest quarterly report card Tuesday. Wall Street expects the entertainment giant will report that its fiscal first-quarter earn- ings and revenue declined from a year earlier. Beyond its October-December results, investors will be keen for an update on the company’s plans to roll out video streaming ser- vices and its acquisition of 21st Century Fox’s film and TV assets. Buy now, pay later The Federal Reserve issues its monthly tally of U.S. consumer borrowing Thursday. The tally, which excludes mortgages and other loans secured by real estate, is expected to show consumer borrowing increased by $16 billion in December, below November’s $22.2 billion gain. That lifted total consumer credit to a record $3.98 trillion. Downshifting in Detroit General Motors struggled through much of 2018, largely due to declining sales in the U.S. and China. In November, the automak- er launched a restructuring plan that called for the elimina- tion of five North American factories and 14,000 jobs. In- vestors will be listening for an update on how the strategy is working on Wednesday, when GM reports its fourth-quarter results. DIS 90 105 $120 $111.30 ’18 $108.67 Q1 ’18 Q1 ’19 $1.89 est. $1.55 Source: FactSet Operating EPS Price-earnings ratio: 13 based on past 12-month results Dividend: $1.76 Div. yield: 1.6% Consumer credit seasonally adjusted change Source: FactSet 0 5 10 15 20 $25 billion D N O S A J 2018 est. 16.0 15.1 21.0 22.2 25.0 9.6 Marcy Gordon; J. Paschke • AP Source: Professor Jay Ritter, University of Florida The 35-day partial government shutdown, which closed most of the Securities and Exchange Commission, slowed some companies’ plans to issue stock to the public. SEC staffers who must approve paperwork for initial public offerings were furloughed. Yet even before the shutdown, IPOs have been declining in recent years. That trend has sparked concern on Wall Street and among some regulators, who blame burdensome rules for public companies. More companies are turning to the private markets to raise capital or staying private. At the peak in 1996, about 7,400 companies were listed on U.S. stock exchanges. Now, there are only around 3,600. But Jay Ritter, a University of Florida finance professor and leading expert on IPOs, says there’s no evidence that companies with strong prospects are starved of capital by the IPO decline or that consumers have been harmed. The main reason for the IPO decline, Ritter says: Compa- nies have been merging. Both public and private companies are bigger, mainly because technology has reduced costs. The bigger companies are often more efficient, and consumers can benefit from that, in Ritter’s view. Shutdown IPO blues Number of IPOs Proceeds in billions 0 50 100 150 200 250 ’18 ’17 ’16 ’15 ’14 ’13 ’12 ’11 ’10 0 10 20 30 40 $50 ’18 ’17 ’16 ’15 ’14 ’13 ’12 ’11 ’10 IPOs stalling? The shutdown had an impact on IPO paperwork, but Prof. Jay Ritter says it’s also because of increased mergers. The cybersecurity company beat Wall Street’s quarterly forecast and raised its guidance for the current quarter. The drug developer beat Wall Street’s quarterly profit expectations thanks to sales of cancer treat- ments. The energy company beat Wall Street forecasts for the fourth-quar- ter as volatile oil prices lifted reve- nue. The Indian generic drug maker said revenue grew thanks to emerging markets. The health insurer said proposed regulations might hurt its pharmacy benefit management unit. The e-commerce giant gave a weak outlook for the current quarter, citing the potential for lost sales in India and overall higher costs. SOURCE: FIS AP Stocks capped a bumpy day of trading Friday with modest gains, extending the market’s winning streak to a third day. Investors’ enthusiasm over a burst of hiring in January by U.S. employers was tempered by a disappointing revenue outlook from Amazon.com. 1,200 1,400 1,600 $1,800 N D J Amazon.com AMZN Close: $1,626.23 -92.50 or -5.4% $1,265.93 $2,050.50 Vol.: Mkt. Cap: 11.5m (1.6x avg.) $795.2 b 52-week range PE: Yield: 91.2 ... 150 200 $250 N D J Cigna CI Close: $194.06 -5.75 or -2.9% $163.02 $226.61 Vol.: Mkt. Cap: 5.5m (1.9x avg.) $47.3 b 52-week range PE: Yield: 17.3 0.0% 30 35 $40 N D J Dr. Reddy’s Laboratories RDY Close: $39.03 0.84 or 2.2% $28.13 $39.90 Vol.: Mkt. Cap: 263.5k (1.1x avg.) $6.5 b 52-week range PE: Yield: 27.3 0.7% 60 70 80 $90 N D J Exxon Mobil XOM Close: $75.92 2.64 or 3.6% $64.65 $87.36 Vol.: Mkt. Cap: 23.0m (1.5x avg.) $321.4 b 52-week range PE: Yield: 14.0 4.3% 70 75 $80 N D J Merck MRK Close: $76.45 2.02 or 2.7% $52.83 $80.19 Vol.: Mkt. Cap: 15.0m (1.1x avg.) $198.8 b 52-week range PE: Yield: 61.7 2.9% 15 20 $25 N D J Symantec SYMC Close: $22.91 1.89 or 9.0% $17.43 $29.20 Vol.: Mkt. Cap: 24.9m (3.4x avg.) $14.6 b 52-week range PE: Yield: 12.4 1.3% American Funds AmrcnBalA m MA 26.08 -0.01 +4.7 -0.9/A +9.5/A +7.7/A American Funds CptWldGrIncA m WS 45.90 ... +7.2 -9.3/D +10.4/C +6.1/C American Funds CptlIncBldrA m IH 58.64 +0.02 +4.1 -5.7/C +6.2/D +4.8/A American Funds FdmtlInvsA m LB 56.48 +0.06 +8.0 -4.6/C +13.9/B +10.4/A American Funds GrfAmrcA m LG 46.72 -0.05 +9.3 -1.6/D +16.2/B +11.3/C American Funds IncAmrcA m AL 21.54 +0.05 +4.4 -3.7/B +8.4/D +6.2/C American Funds InvCAmrcA m LB 35.99 ... +6.1 -6.4/D +12.2/C +9.1/C American Funds WAMtInvsA m LB 43.66 +0.14 +6.3 -1.9/A +13.7/B +10.1/B Dodge & Cox Inc CI 13.45 -0.01 +1.4 +1.7/C +3.8/A +2.9/A Dodge & Cox IntlStk FV 39.94 -0.11 +8.2 -16.8/D +9.8/A +2.0/B Dodge & Cox Stk LV 188.08 +0.56 +8.8 -4.6/B +16.0/A +9.6/A Fidelity 500IdxInsPrm LB 94.18 +0.10 +8.1 -2.2/B +14.1/A +11.0/A Fidelity Contrafund LG 12.03 -0.02 +9.3 -2.1/D +15.6/B +11.8/B Fidelity TtlMktIdxInsPrm LB 76.79 +0.12 +8.8 -2.1/A +14.3/A +10.4/A PIMCO IncInstl MU 11.95 ... +1.7 +2.5 +6.4 +5.5 PIMCO TtlRetIns CI 9.99 -0.03 +0.9 +1.9/B +2.5/B +2.5/B Vanguard 500IdxAdmrl LB 250.23 +0.25 +8.1 -2.2/B +14.0/A +10.9/A Vanguard InTrTEAdmrl MI 13.99 ... +0.8 +3.3/A +1.9/B +3.1/B Vanguard InsIdxIns LB 246.04 +0.26 +8.1 -2.2/B +14.0/A +10.9/A Vanguard InsIdxInsPlus LB 246.05 +0.25 +8.1 -2.2/B +14.1/A +11.0/A Vanguard PrmCpAdmrl LG 130.88 +0.13 +8.2 -0.4/C +17.7/A +13.4/A Vanguard TtBMIdxAdmrl CI 10.50 -0.03 +0.7 +2.2/B +1.9/D +2.3/C Vanguard TtInBIdxAdmrl IB 21.89 -0.01 +1.1 +4.6/A +3.2/C +3.9/A Vanguard TtInSIdxAdmrl FB 27.25 -0.06 +7.4 -13.0/B +9.2/A +3.4/A Vanguard TtInSIdxInsPlus FB 109.00 -0.22 +7.4 -13.0/B +9.3/A +3.4/A Vanguard TtInSIdxInv FB 16.29 -0.03 +7.4 -13.1/B +9.1/A +3.3/A Vanguard TtlSMIdxAdmrl LB 67.54 +0.11 +8.8 -2.1/A +14.3/A +10.4/A Vanguard TtlSMIdxIns LB 67.55 +0.10 +8.8 -2.1/A +14.3/A +10.4/A Vanguard TtlSMIdxInv LB 67.52 +0.11 +8.8 -2.1/A +14.2/A +10.3/B Vanguard WlngtnAdmrl MA 67.00 +0.06 +4.5 -1.7/B +9.9/A +7.6/A 30 Biggest Funds PERCENT RETURN/RANK FUND OBJ NAV CHG 4-WK 12-MO 3-YR 5YR DOW 25,063.89 +64.22 NASDAQ 7,263.87 -17.87 S&P 500 2,706.53 +2.43 10-YR T-NOTE 2.69% +.06 30-YR T-BOND 3.03% +.03 CRUDE OIL $55.26 +1.47 GOLD $1,316.90 -2.80 EURO $1.1461 +.0017 p p q p p p p q (Close and change figures reflect current contract.) Rank: Fund’s letter grade compared with others in the same group; an A indicates fund performed in the top 20 percent; an E, in the bottom 20 percent. Source: Morningstar and the Associated Press. Stocks in bold are the top public companies in Denton.

Upload: lecong

Post on 17-Dec-2018

214 views

Category:

Documents


0 download

TRANSCRIPT

CommoditiesU.S. crude oil and wholesale gasoline rose. Natural gas fell almost 3percent. Gold, silver and copper prices fell.

Crude Oil (bbl) 55.26 53.79 +2.73 +21.7Ethanol (gal) 1.30 1.28 +1.88 +3.1Heating Oil (gal) 1.91 1.88 +1.88 +13.4Natural Gas (mm btu) 2.73 2.81 -2.84 -7.0Unleaded Gas (gal) 1.44 1.36 +4.36 +8.8

FUELS CLOSE PVS %CHG %YTD

Gold (oz) 1316.90 1319.70 -0.21 +3.0Silver (oz) 15.88 16.02 -0.89 +2.9Platinum (oz) 826.70 824.70 +0.24 +3.9Copper (lb) 2.78 2.79 -0.50 +5.6

METALS CLOSE PVS %CHG %YTD

Cattle (lb) 1.25 1.25 +0.52 +0.5Coffee (lb) 1.07 1.09 -2.02 +4.9Corn (bu) 3.78 3.77 +0.46 +0.9Cotton (lb) 0.74 0.74 -1.02 +2.0Lumber (1,000 bd ft) 419.20 416.20 +0.72 ...Orange Juice (lb) 1.22 1.20 +1.79 -2.3Soybeans (bu) 9.18 9.15 +0.27 +4.0Wheat (bu) 5.24 5.17 +1.50 +4.2

AGRICULTURE CLOSE PVS %CHG %YTD

Advanced 1584Declined 1186New Highs 86New Lows 9

Vol. (in mil.) 3,703Pvs. Volume 4,833

2,3432,86416581222

5316

NYSE NASD

DOW 25193.15 24982.49 25063.89 +64.22 +0.26% s s t +7.44%DOW Trans. 10171.30 10060.19 10123.99 +64.62 +0.64% s s t +10.40%DOW Util. 727.65 719.08 724.66 -2.59 -0.36% s s t +1.65%NYSE Comp. 12350.55 12287.21 12329.69 +30.65 +0.25% s s s +8.40%NASDAQ 7299.94 7243.41 7263.87 -17.87 -0.25% s s t +9.47%S&P 500 2716.66 2696.88 2706.53 +2.43 +0.09% s s t +7.97%S&P 400 1843.79 1831.34 1841.52 +6.13 +0.33% s s t +10.73%Wilshire 5000 28108.54 27926.17 28026.70 +34.29 +0.12% s s t +8.84%Russell 2000 1504.51 1495.47 1502.05 +2.63 +0.18% s s t +11.38%

HIGH LOW CLOSE CHG %CHG WK MO QTR YTDStocksRecap

21,000

22,000

23,000

24,000

25,000

26,000

27,000

A S O N D J

24,240

24,720

25,200 Dow Jones industrialsClose: 25,063.89Change: 64.22 (0.3%)

10 DAYS

6,000

6,500

7,000

7,500

8,000

8,500

A S O N D J

6,920

7,120

7,320 Nasdaq compositeClose: 7,263.87Change: -17.87 (-0.2%)

10 DAYS

NET 1YR TREASURIES LAST PVS CHG WK MO QTR AGO

5.505.004.50

2.381.881.38

PRIMERATE

FEDFUNDS

LAST6 MO AGO1 YR AGO

3-month T-bill 2.39 2.39 ... s t s 1.496-month T-bill 2.46 2.46 ... t r t 1.6452-wk T-bill 2.56 2.55 +0.01 t s t 1.882-year T-note 2.49 2.45 +0.04 t s t 2.165-year T-note 2.50 2.43 +0.07 t s t 2.567-year T-note 2.58 2.51 +0.07 t s t 2.7110-year T-note 2.69 2.63 +0.06 t s t 2.7930-year T-bond 3.03 3.00 +0.03 t s t 3.02

NET 1YRBONDS LAST PVS CHG WK MO QTR AGO

Barclays Glob Agg Bd 1.93 1.98 -0.05 t t t 1.80Barclays USAggregate 3.15 3.22 -0.07 t t t 2.97Barclays US Corp 3.91 3.99 -0.08 t t t 3.45Barclays US High Yield 6.90 7.03 -0.13 t t s 5.78Moodys AAA Corp Idx 3.79 3.85 -0.06 t t t 3.5910-Yr. TIPS .78 .75 +0.03 t t t .63

Interestrates

The yield on the 10-year Treasury note rose to 2.69 percent Friday. Yields affectinterest rates on mortgages and other consumer loans.

USD per British Pound 1.3083 -.0030 -.23% 1.3130 1.4263Canadian Dollar 1.3088 -.0044 -.34% 1.2992 1.2274USD per Euro 1.1461 +.0017 +.15% 1.1664 1.2502Japanese Yen 109.51 +.62 +.57% 111.56 109.42Mexican Peso 19.1210 -.0137 -.07% 18.6047 18.3469

6MO 1YRMAJORS CLOSE CHG %CHG AGO AGO

Israeli Shekel 3.6376 +.0043 +.12% 3.6743 3.4315Norwegian Krone 8.4370 +.0013 +.02% 8.1729 7.6502South African Rand 13.3280 +.0586 +.44% 13.2276 11.8680Swedish Krona 9.0555 +.0057 +.06% 8.8032 7.8496Swiss Franc .9951 +.0004 +.04% .9916 .9277

EUROPE/AFRICA/MIDDLE EAST

Australian Dollar 1.3792 +.0027 +.20% 1.3511 1.2446Chinese Yuan 6.7449 +.0445 +.66% 6.8248 6.2986Hong Kong Dollar 7.8471 -.0000 -.00% 7.8484 7.8214Indian Rupee 71.475 +.523 +.73% 68.325 63.918Singapore Dollar 1.3505 +.0044 +.33% 1.3620 1.3085South Korean Won 1119.56 +5.47 +.49% 1118.90 1071.41Taiwan Dollar 30.78 +.05 +.16% 30.63 29.21

ASIA/PACIFIC

ForeignExchange

The U.S. dollar strengthened versus the euro and the Japa-nese yen. The dollar also strengthened against theBritish pound, but weakened versus theCanadian dollar.

Stocks of Local Interest

AK Steel Hold AKS 2.94 -.01 -0.3% +30.7% -41.7% 13 ...AT&T Inc T 30.00 -.06 -0.2% +5.1% -14.4% 6 2.04Activision Blizzard ATVI 46.01 -1.23 -2.6% -1.2% -35.8% 25 0.34Adv Micro Dev AMD 24.51 +.10 +0.4% +32.8% +77.7% ...Altria Group MO 49.20 -.15 -0.3% -0.4% -25.6% 16 3.44Amazon.com Inc AMZN 1626.23 -92.50 -5.4% +8.3% +18.5% ...Annaly Capital Mgmt NLY 10.40 -.04 -0.4% +5.9% +10.4% 12 1.20Aphria Inc APHA 9.62 +.88 +10.1% +69.1% -38.9% ...Apple Inc AAPL 166.52 +.08 ...% +5.6% +1.1% 17 2.92Aurora Cannabis Inc ACB 7.40 +.31 +4.4% +49.2% -25.7% ...AVEO Pharmaceuticals AVEO .60 -.10 -14.2% -62.5% -78.4% ...Avon Products AVP 2.50 +.16 +6.8% +64.5% -4.1% 25 ...Bank of America BAC 28.38 -.09 -0.3% +15.2% -9.3% 11 0.60Barrick Gold GOLD 13.25 -.14 -1.0% +11.8% -5.6% ...Baxter Intl BAX 72.13 -.36 -0.5% +9.6% +1.7% 34 0.76Brist Myr Sqb BMY 49.89 +.52 +1.1% -4.0% -18.6% 49 1.64Brixmor Property Grp BRX 17.50 +.37 +2.2% +19.1% +12.4% 15 1.12CVS Health Corp CVS 65.22 -.33 -0.5% -0.5% -14.2% 11 2.00Caesars Entertain CZR 9.26 +.12 +1.3% +36.4% -34.5% ...Canopy Growth Corp CGC 48.88 -.10 -0.2% +81.9% +94.3% ...Celgene Inc CELG 89.67 +1.21 +1.4% +39.9% -12.6% 28 ...CenturyLink Inc CTL 15.25 -.07 -0.5% +0.7% -1.9% 6 2.16Chesapk Engy CHK 2.84 -.01 -0.4% +35.2% -18.6% 5 ...Cisco Syst CSCO 47.34 +.05 +0.1% +9.3% +16.2% 21 1.32Citigroup C 63.67 -.34 -0.5% +22.3% -15.9% 10 1.80CocaCola Co KO 48.70 +.57 +1.2% +2.9% +4.4% 92 1.56Colfax Corp CFX 24.86 +.11 +0.4% +18.9% -38.2% 18 ...Comcast Corp A CMCSA 36.79 +.22 +0.6% +8.0% -12.2% 18 0.84Cronos Group Inc CRON 20.81 +1.13 +5.7% +100.3% +167.7% ...Cypress Semi CY 14.79 +.92 +6.6% +16.3% -17.2% 25 0.44

Deutsche Bank AG DB 8.85 -.03 -0.3% +8.6% -51.6% 0.83Dow DuPont Inc DWDP 53.47 -.34 -0.6% ...% -26.8% 17 1.52eBay Inc EBAY 34.31 +.66 +2.0% +22.2% -17.1% 15 0.14EnCana Corp ECA 6.88 ... ...% +19.0% -43.9% 12 0.06Exxon Mobil Corp XOM 75.92 +2.64 +3.6% +11.3% -12.4% 14 3.28Facebook Inc FB 165.71 -.98 -0.6% +26.4% -10.8% 31 ...Fastenal Co FAST 60.55 +.09 +0.1% +15.8% +12.9% 23 1.72Ferrellgas Part FGP 1.19 -.03 -2.5% +122.4% -62.9% 0.40Flex Ltd FLEX 9.40 -.22 -2.3% +23.5% -46.6% 10 ...Flowers Foods FLO 19.61 -.05 -0.3% +6.2% +3.9% 21 0.72Ford Motor F 8.72 -.08 -0.9% +14.0% -14.3% 5 0.60Freeport McMoRan FCX 11.51 -.13 -1.1% +11.6% -39.3% 7 0.20Gen Electric GE 10.19 +.03 +0.3% +34.6% -34.9% 0.04HCA Holdings Inc HCA 139.71 +.28 +0.2% +12.3% +39.2% 21 1.60Helios and Matheson HMNY .01 ... ...% -31.3% -100.0% ...Hilton Wwde Hldgs HLT 74.42 -.06 -0.1% +3.6% -12.3% 37 0.60Histogenics Corp HSGX .18 -.03 -14.9% +101.1% -92.5% ...Indep Bk Cp MI IBCP 22.29 +.13 +0.6% +6.0% -1.3% 17 0.72Intel Corp INTC 48.73 +1.61 +3.4% +3.8% +0.4% 18 1.26JPMorgan Chase & Co JPM 103.88 +.38 +0.4% +6.4% -8.2% 12 2.24Keycorp KEY 16.63 +.16 +1.0% +12.5% -20.4% 10 0.56MGM Resorts Intl MGM 29.75 +.31 +1.1% +22.6% -17.9% 9 0.48Marathon Oil MRO 16.00 +.21 +1.3% +11.6% -12.1% 0.20Marriott Intl A MAR 114.57 +.04 ...% +5.5% -21.2% 26 1.64Merck & Co MRK 76.45 +2.02 +2.7% +0.1% +29.0% 29 2.20Micron Tech MU 39.60 +1.38 +3.6% +24.8% -12.6% 3 ...Microsoft Corp MSFT 102.78 -1.65 -1.6% +1.2% +11.2% 43 1.84Mondelez Intl MDLZ 45.57 -.69 -1.5% +13.8% +6.4% 22 1.04Morgan Stanley MS 41.82 -.48 -1.1% +5.5% -23.2% 9 1.20Nabors Inds NBR 3.13 +.17 +5.7% +56.5% -59.2% 0.24

Newell Rubbermaid NWL 21.28 +.07 +0.3% +14.5% -16.3% 0.92Nvidia Corporation NVDA 144.73 +.98 +0.7% +8.4% -41.3% 24 0.64On Semiconductor ON 20.80 +.76 +3.8% +26.0% -19.0% 10 ...Oracle Corp ORCL 50.81 +.58 +1.2% +12.5% -1.2% 52 0.76Paccar Inc PCAR 64.96 -.56 -0.9% +13.7% -8.0% 10 1.28Pfizer Inc PFE 42.88 +.43 +1.0% -1.8% +19.3% 17 1.44Procter & Gamble PG 97.47 +1.00 +1.0% +6.0% +15.1% 24 2.87Qualcomm Inc QCOM 49.61 +.09 +0.2% -12.8% -23.9% 2.48Regions Fncl RF 15.33 +.16 +1.1% +14.6% -18.7% 11 0.56Rite Aid Corp RAD .75 -.05 -6.2% +6.4% -63.2% 1 ...Sally Beauty Hld SBH 17.42 +.20 +1.2% +2.2% +3.7% 11 ...Select Med Hldgs SEM 15.46 -.16 -1.0% +0.7% -11.8% 11 ...Sirius XM Hldgs Inc SIRI 5.98 +.15 +2.6% +4.7% -3.8% 33 0.05Snap Inc A SNAP 6.91 +.23 +3.4% +25.4% -50.6% ...Sthwstn Energy SWN 4.38 +.01 +0.2% +28.4% +3.1% 5 ...Square Inc SQ 70.80 -.55 -0.8% +26.2% +52.1% ...Symantec Corp SYMC 22.91 +1.89 +9.0% +21.2% -21.7% 11 0.30Target Corp TGT 71.17 -1.83 -2.5% +7.7% -0.5% 12 2.56Titan Pharmaceut TTNP 1.65 +.42 +34.1% +23.3% -84.2% ...Transocean Ltd RIG 8.71 +.14 +1.6% +25.5% -20.6% ...TravelCenters Am TA 4.95 -.07 -1.4% +31.6% +14.1% ...Trinty Inds TRN 23.55 +.17 +0.7% +14.4% -13.8% 5 0.52Twitter Inc TWTR 33.19 -.37 -1.1% +15.5% +30.0% ...US Steel Corp X 22.04 -.50 -2.2% +20.8% -39.2% 13 0.20Universal Hlth Svc UHS 135.53 +3.00 +2.3% +16.3% +9.4% 17 0.40Verizon Comm VZ 54.55 -.51 -0.9% -3.0% +6.2% 7 2.41Visa Inc V 140.15 +5.14 +3.8% +6.2% +9.4% 47 1.00WalMart Strs WMT 93.86 -1.97 -2.1% +0.8% -8.2% 54 2.08Weatherford Intl Ltd WFT .77 +.13 +19.4% +38.5% -83.5% ...Wells Fargo & Co WFC 48.91 ... ...% +6.1% -22.5% 11 1.80

YTD 1YR NAME TKR CLOSE CHG %CHG %CHG %RTN P/E DIV

YTD 1YR NAME TKR CLOSE CHG %CHG %CHG %RTN P/E DIV

YTD 1YR NAME TKR CLOSE CHG %CHG %CHG %RTN P/E DIV

The

Wee

k Ah

ead

Spotlight on MickeyWalt Disney serves up its latest quarterly report card Tuesday.

Wall Street expects the entertainment giant will report that its fiscal first-quarter earn-ings and revenue declined from a year earlier. Beyond its October-December results, investors will be keen for an update on the company’s plans to roll out video streaming ser-vices and its acquisition of 21st Century Fox’s film and TV assets.

Buy now, pay laterThe Federal Reserve issues its monthly tally of U.S. consumer borrowing Thursday.

The tally, which excludes mortgages and other loans secured by real estate, is expected to show consumer borrowing increased by $16 billion in December, below November’s $22.2 billion gain. That lifted total consumer credit to a record $3.98 trillion.

Downshifting in DetroitGeneral Motors struggled through much of 2018, largely due to declining sales in the U.S. and China.

In November, the automak-er launched a restructuring plan that called for the elimina-tion of five North American factories and 14,000 jobs. In-vestors will be listening for an update on how the strategy is working on Wednesday, when GM reports its fourth-quarter results.

DIS

90

105

$120 $111.30

’18

$108.67

Q1 ’18 Q1 ’19

$1.89 est.$1.55

Source: FactSet

Operating EPS

Price-earnings ratio: 13based on past 12-month resultsDividend: $1.76 Div. yield: 1.6%

Consumer creditseasonally adjusted change

Source: FactSet

0

5

10

15

20

$25 billion

DNOSAJ2018

est.16.015.1

21.0 22.225.0

9.6

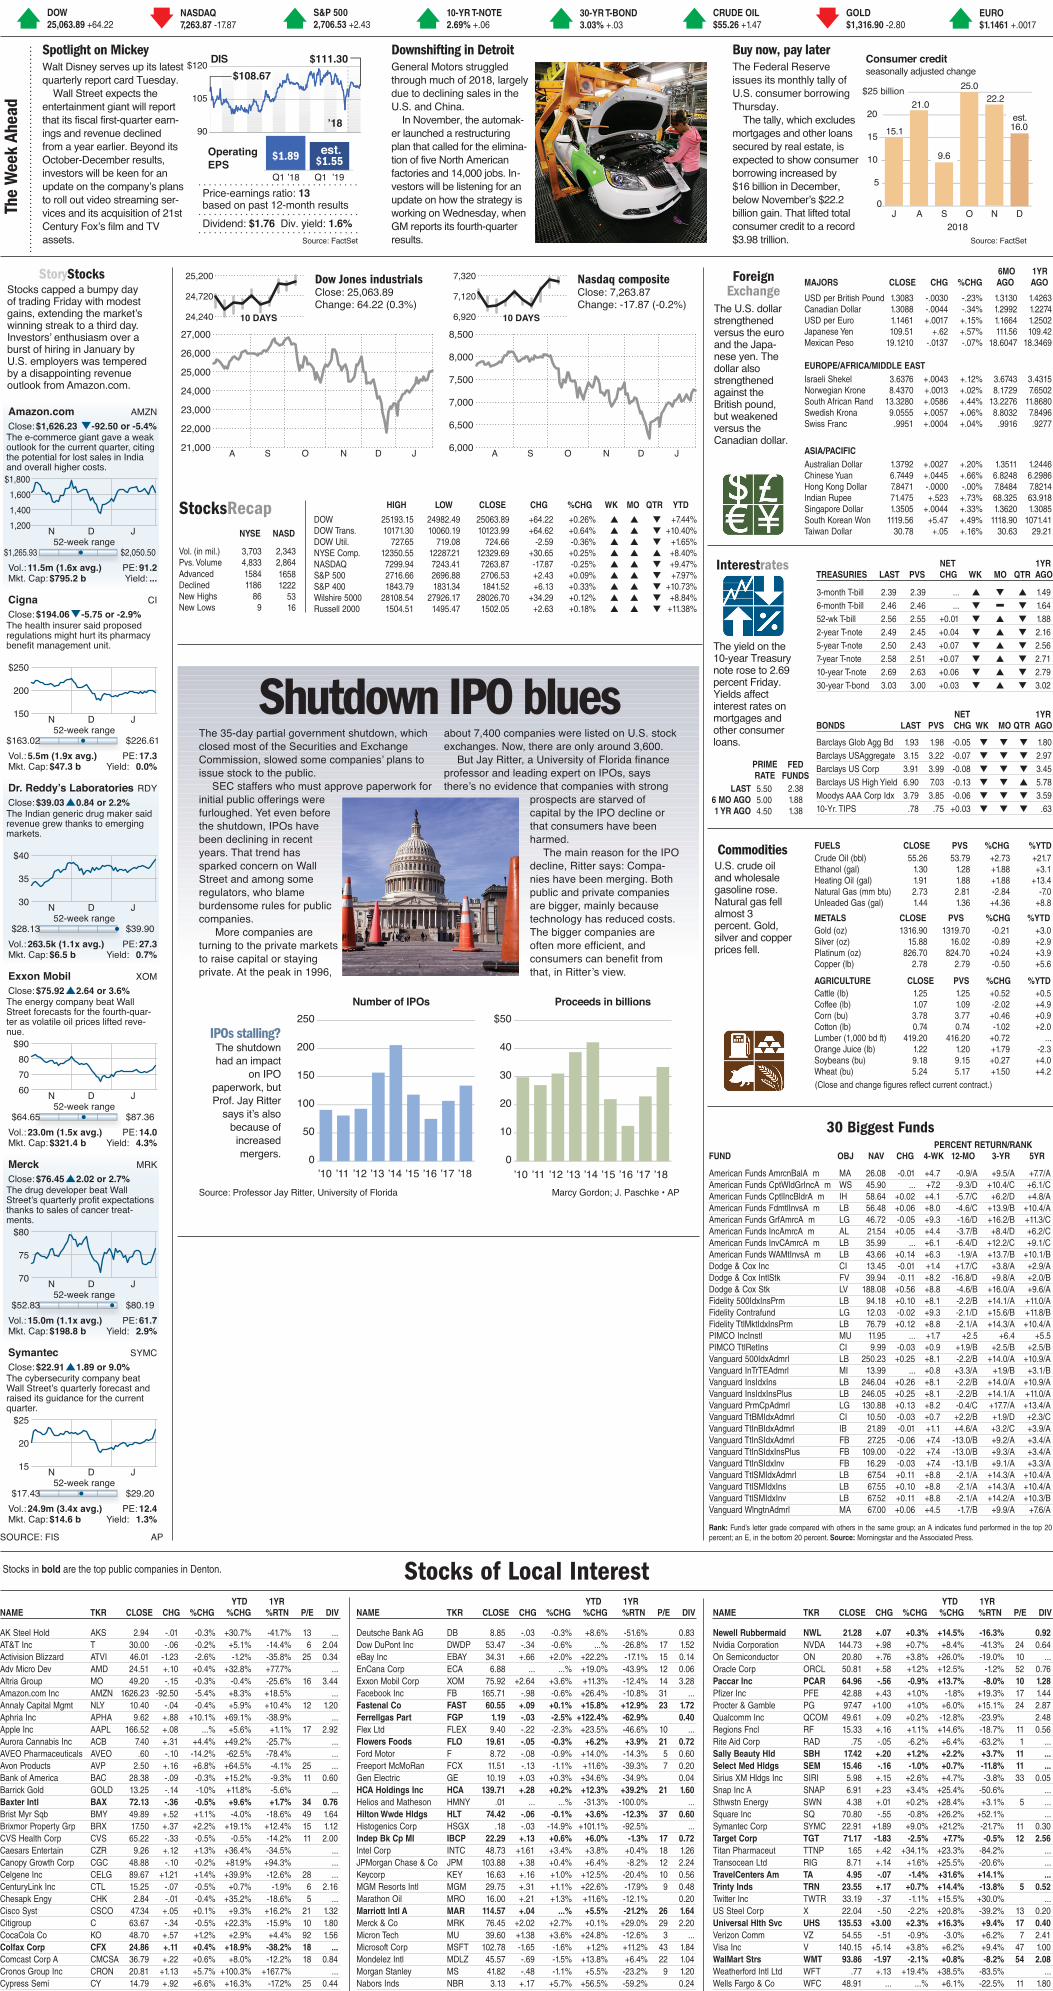
Marcy Gordon; J. Paschke • APSource: Professor Jay Ritter, University of Florida

The 35-day partial government shutdown, which closed most of the Securities and Exchange Commission, slowed some companies’ plans to issue stock to the public.

SEC staffers who must approve paperwork for initial public offerings were furloughed. Yet even before the shutdown, IPOs have been declining in recent years. That trend has sparked concern on Wall Street and among some regulators, who blame burdensome rules for public companies.

More companies are turning to the private markets to raise capital or staying private. At the peak in 1996,

about 7,400 companies were listed on U.S. stock exchanges. Now, there are only around 3,600.

But Jay Ritter, a University of Florida finance professor and leading expert on IPOs, says there’s no evidence that companies with strong

prospects are starved of capital by the IPO decline or that consumers have been harmed.

The main reason for the IPO decline, Ritter says: Compa-nies have been merging. Both public and private companies are bigger, mainly because technology has reduced costs. The bigger companies are often more efficient, and consumers can benefit from that, in Ritter’s view.

Shutdown IPO blues

Number of IPOs Proceeds in billions

0

50

100

150

200

250

’18’17’16’15’14’13’12’11’100

10

20

30

40

$50

’18’17’16’15’14’13’12’11’10

IPOs stalling? The shutdown had an impact

on IPO paperwork, but Prof. Jay Ritter

says it’s also because of increased mergers.

The cybersecurity company beat Wall Street’s quarterly forecast and raised its guidance for the current quarter.

The drug developer beat Wall Street’s quarterly profit expectations thanks to sales of cancer treat-ments.

The energy company beat Wall Street forecasts for the fourth-quar-ter as volatile oil prices lifted reve-nue.

The Indian generic drug maker said revenue grew thanks to emerging markets.

The health insurer said proposed regulations might hurt its pharmacy benefit management unit.

The e-commerce giant gave a weak outlook for the current quarter, citing the potential for lost sales in India and overall higher costs.

SOURCE: FIS AP

Stocks capped a bumpy day of trading Friday with modest gains, extending the market’s winning streak to a third day. Investors’ enthusiasm over a burst of hiring in January by U.S. employers was tempered by a disappointing revenue outlook from Amazon.com.

1,2001,4001,600

$1,800

N D J

Amazon.com AMZNClose: $1,626.23 -92.50 or -5.4%

$1,265.93 $2,050.50Vol.:Mkt. Cap:

11.5m (1.6x avg.)$795.2 b

52-week range

PE:Yield:

91.2...

150

200

$250

N D J

Cigna CIClose: $194.06 -5.75 or -2.9%

$163.02 $226.61Vol.:Mkt. Cap:

5.5m (1.9x avg.)$47.3 b

52-week range

PE:Yield:

17.30.0%

30

35

$40

N D J

Dr. Reddy’s Laboratories RDYClose: $39.03 0.84 or 2.2%

$28.13 $39.90Vol.:Mkt. Cap:

263.5k (1.1x avg.)$6.5 b

52-week range

PE:Yield:

27.30.7%

607080

$90

N D J

Exxon Mobil XOMClose: $75.92 2.64 or 3.6%

$64.65 $87.36Vol.:Mkt. Cap:

23.0m (1.5x avg.)$321.4 b

52-week range

PE:Yield:

14.04.3%

70

75

$80

N D J

Merck MRKClose: $76.45 2.02 or 2.7%

$52.83 $80.19Vol.:Mkt. Cap:

15.0m (1.1x avg.)$198.8 b

52-week range

PE:Yield:

61.72.9%

15

20

$25

N D J

Symantec SYMCClose: $22.91 1.89 or 9.0%

$17.43 $29.20Vol.:Mkt. Cap:

24.9m (3.4x avg.)$14.6 b

52-week range

PE:Yield:

12.41.3%

American Funds AmrcnBalA m MA 26.08 -0.01 +4.7 -0.9/A +9.5/A +7.7/AAmerican Funds CptWldGrIncA m WS 45.90 ... +7.2 -9.3/D +10.4/C +6.1/CAmerican Funds CptlIncBldrA m IH 58.64 +0.02 +4.1 -5.7/C +6.2/D +4.8/AAmerican Funds FdmtlInvsA m LB 56.48 +0.06 +8.0 -4.6/C +13.9/B +10.4/AAmerican Funds GrfAmrcA m LG 46.72 -0.05 +9.3 -1.6/D +16.2/B +11.3/CAmerican Funds IncAmrcA m AL 21.54 +0.05 +4.4 -3.7/B +8.4/D +6.2/CAmerican Funds InvCAmrcA m LB 35.99 ... +6.1 -6.4/D +12.2/C +9.1/CAmerican Funds WAMtInvsA m LB 43.66 +0.14 +6.3 -1.9/A +13.7/B +10.1/BDodge & Cox Inc CI 13.45 -0.01 +1.4 +1.7/C +3.8/A +2.9/ADodge & Cox IntlStk FV 39.94 -0.11 +8.2 -16.8/D +9.8/A +2.0/BDodge & Cox Stk LV 188.08 +0.56 +8.8 -4.6/B +16.0/A +9.6/AFidelity 500IdxInsPrm LB 94.18 +0.10 +8.1 -2.2/B +14.1/A +11.0/AFidelity Contrafund LG 12.03 -0.02 +9.3 -2.1/D +15.6/B +11.8/BFidelity TtlMktIdxInsPrm LB 76.79 +0.12 +8.8 -2.1/A +14.3/A +10.4/APIMCO IncInstl MU 11.95 ... +1.7 +2.5 +6.4 +5.5PIMCO TtlRetIns CI 9.99 -0.03 +0.9 +1.9/B +2.5/B +2.5/BVanguard 500IdxAdmrl LB 250.23 +0.25 +8.1 -2.2/B +14.0/A +10.9/AVanguard InTrTEAdmrl MI 13.99 ... +0.8 +3.3/A +1.9/B +3.1/BVanguard InsIdxIns LB 246.04 +0.26 +8.1 -2.2/B +14.0/A +10.9/AVanguard InsIdxInsPlus LB 246.05 +0.25 +8.1 -2.2/B +14.1/A +11.0/AVanguard PrmCpAdmrl LG 130.88 +0.13 +8.2 -0.4/C +17.7/A +13.4/AVanguard TtBMIdxAdmrl CI 10.50 -0.03 +0.7 +2.2/B +1.9/D +2.3/CVanguard TtInBIdxAdmrl IB 21.89 -0.01 +1.1 +4.6/A +3.2/C +3.9/AVanguard TtInSIdxAdmrl FB 27.25 -0.06 +7.4 -13.0/B +9.2/A +3.4/AVanguard TtInSIdxInsPlus FB 109.00 -0.22 +7.4 -13.0/B +9.3/A +3.4/AVanguard TtInSIdxInv FB 16.29 -0.03 +7.4 -13.1/B +9.1/A +3.3/AVanguard TtlSMIdxAdmrl LB 67.54 +0.11 +8.8 -2.1/A +14.3/A +10.4/AVanguard TtlSMIdxIns LB 67.55 +0.10 +8.8 -2.1/A +14.3/A +10.4/AVanguard TtlSMIdxInv LB 67.52 +0.11 +8.8 -2.1/A +14.2/A +10.3/BVanguard WlngtnAdmrl MA 67.00 +0.06 +4.5 -1.7/B +9.9/A +7.6/A

30 Biggest Funds PERCENT RETURN/RANKFUND OBJ NAV CHG 4-WK 12-MO 3-YR 5YR

DOW25,063.89 +64.22

NASDAQ7,263.87 -17.87

S&P 5002,706.53 +2.43

10-YR T-NOTE2.69% +.06

30-YR T-BOND3.03% +.03

CRUDE OIL$55.26 +1.47

GOLD$1,316.90 -2.80

EURO$1.1461 +.0017pp q p p p p q

(Close and change figures reflect current contract.)

Rank: Fund’s letter grade compared with others in the same group; an A indicates fund performed in the top 20 percent; an E, in the bottom 20 percent. Source: Morningstar and the Associated Press.

Stocks in bold are the top public companies in Denton.