governance, competitiveness and growth: the … governance, competitiveness and growth: the...
TRANSCRIPT
1
ADB Institute Discussion Paper No. 53
Governance, Competitiveness and Growth: The Challenges for Bangladesh
Dilip Kumar Roy
August 2006
Dilip Kumar Roy is Research Fellow at the Bangladesh Institute of Development Studies and Visiting Scholar at George Washington University. This paper was written when he was a Visiting Researcher at Asian Development Bank Institute (ADBI). The author recognizes the contribution of Peter McCawley, Dean, ADBI and Douglas Brooks, Senior Research Fellow, a.i ADBI, by providing useful comments, which led to an improvement of the paper. The author benefited from comments in the ADBI-BBL seminars. The views expressed in this paper are the views of the author and do not necessarily reflect the view or policies of ADBI nor Asian Development Bank. Names of countries or economies mentioned are chosen by the author/s, in the exercise of his/her/their academic freedom, and the Institute is in no way responsible for such usage.
2
Contents Abstract Table of Contents
1. Introduction 2. Concepts of Governance Dimensions and Sources of Data
2.1 Concept of Governance 2.2 Sources of Data
3. Methodology for Composition of Governance Dimensions
4. Analysis of Governance Dimensions
4.1 Political Governance Dimension in Bangladesh 4.2 Institutional Dimension of Governance in Bangladesh 4.3 Technology Dimension of Governance in Bangladesh
5. Governance and Growth: Application to Bangladesh 6. Outlook: Meeting Governance Challenges
7. Concluding Remarks
References Appendix Appendix Tables

3
Governance, Competitiveness and Growth: The Challenges for Bangladesh
Williamson (2005) concludes the article in American Economic Review, ”The economics of governance is an unfinished project whose time has come.” The economics of governance works through three fundamental concepts: governance, adaptation and transaction costs.
1. Introduction The issue of governance has gained importance over the last ten years and become a key component of policies for economic development. Good governance acts as a positive force to influence economic growth. In fact, a growing amount of available evidence (mainly in World Bank documents) suggests that lack of quality governance hinders growth and investment, and aggravates poverty and inequality. In fact, governance problems foil every effort to improve infrastructure, attract investment, and raise educational standards (Harford, 2006). Governance matters significantly for a country’s aid effectiveness, and is now at heart of the new World Bank assistance strategy for Bangladesh. Better governance will lead a country to achieve greater competitiveness. Competitiveness indicates the ability of a nation to maintain high rates of economic growth and productivity with sustained employment. More competitive economies tend to be able to achieve higher levels of income for their citizens (World Economic Forum, 2005-2006). Governance and competitiveness may be related, but they are distinct notions. In fact, competitiveness incorporates some governance variables. In a population of 120 million in Bangladesh, some 63 million are estimated to live below the poverty line in 2000. The burden of poverty is heavy. The number of poor virtually remains unchanged from ten years earlier due to population growth. The inequality in the distribution of per capita expenditures, as measured by a Gini coefficient increased from 0.259 in 1991/92 to 0.306 in 2000. The inequality has risen in both the urban and rural sectors. Adult literacy rate is very low (45.3 percent in 2001) and more than half of rural population has no access to electricity and health. Nevertheless, Bangladesh has made notable progress in the 1990s on the average. Bangladesh’s growth in the 1990s has been respectable, at an average rate close to five and half percent per annum although it declined marginally over the period from 1997/98-2000/01 to 2000/01-2003/04 (Table 1). In the industrial sector, the most significant development of the past decades has been the growth of the garments industry. Woven garments, knitwear and specialized textiles together account for about 77.5 percent of exports in 2003-04. The devastating floods of 1998 and 2004 affected both agriculture and industry. The growth process has displayed a degree of stability with positive implications for poverty reductions. The low volatility of GDP growth in Bangladesh was favorable to achieve progress in other social dimensions. The incidence of income poverty has fallen considerably from 59 percent in 1991/92 to 50 percent in 2000, by 0.9 percent per year. There is notable progress in social development indicators. The under five mortality rate per 1000 live births declined from 151 in 1990/91 to 110 in 2000, and the infant mortality rate per 1000 live births from 92 in 1990/91 to 61 in 2000 (WB 2003). There has been concern with regard to governance problems in Bangladesh. Mis-governance, lack of transparency, deterioration of law and order, corruption, abuse of

4
government power, political instability and lack of access for public redress for human rights violations are the paramount features of the governance environment in Bangladesh (TIB, TIS 2003). So the challenge facing Bangladesh is the weak and deteriorating state of governance (see Section 4). Weak governance poses a major challenge not only to further gains in development but also to sustain economic growth achieved so far. The findings of a recent firm-level survey of common sectors in Bangladesh, People’s Republic of China (PRC), Ethiopia and Pakistan indicate that if the investment climate in Bangladesh were to match PRC’s then, on average, TFP in Bangladesh would be 110 percent higher, return to capital 80 percent higher and output growth 3.7 percentage points higher (World Bank 2003). There are certain improvements necessary in some areas of political governance such as peaceful transition to democracy and formation of a non-party caretaker government for impartial handling of national elections. In view of the ensuing outcome for exclusion of textiles and garments from preferential market access opportunities, behind-the-border barriers to trade, such as weakness in governance and infrastructure, are of more importance than tariff concessions to enhance export competitiveness and trade promotion. All the factors responsible for improving national governance are equally applicable to the increase in export competitiveness. The problem of governance is now the overriding aspect of the country to sustain both economic growth and social development. It is therefore necessary to emphasize various dimensions of governance and competitiveness to make a serious dent in poverty and support growth in the country. At the outset, it should be recognized that the theory of governance research that imposes a causal ordering or a priori structure on the logic that links context, governance, and consequences or outcomes is extraordinarily complex. This paper aims to examine the current situation of governance of Bangladesh in an international context and analyze the different governance dimensions in economic development. The paper will also try to highlight some mis-governance issues in some sectors of the economy. Overall, the evidence presented in the paper indicates that different governance dimensions such as political governance, institutional dimension and technology dimension are significantly and positively related to the increase in per capita income, and the quality of governance in Bangladesh has remained at a low level as indicated by a cross-country comparison among South Asia and East Asian countries. The paper is organized as follows. Section 1 is introductory providing importance and objectives of the study. Section 2 presents a literature review to understand the concepts of governance and competitiveness along with sources of data. Methodology for composition of governance dimensions will be presented in section 3. Section 4 will analyze governance dimensions of Bangladesh in an international context. Some mis-governance issues will be highlighted in this section. In section 5, econometric estimation will be made to relate governance with growth. Section 6 discusses the outlook for meeting governance challenges in Bangladesh. Concluding remarks will be presented in the last section 7.

5
Table 1 Annual Growth rate of GDP, 1991/92-2003/04 Period Growth Rate Per capita Total GDP Exports GDP per yr per year per year 1991/92-1994/95 2.57 4.53 20.31 1994/95-1997/98 3.22 5.08 14.12 1997/98-2000/01 4.44 5.36 7.81 2000/01-2003/04 3.91 5.31 5.54 Note: GDP at constant market price of 1995/96 in Tk. Exports are million US $ Source: Statistical Yearbook of Bangladesh, 2004 Monthly Statistical Bulletin Bangladesh, May 2005 2. Concepts on Governance Dimensions and Sources of Data 2.1. Concept on Governance
The topic of governance is very broad and of great complexity. It is referred to as “study of good order and workable arrangement,” (Williamson, 2005). In the broadest sense, governance concerns performance of the government including public and private sectors, global and local arrangements, formal structures and informal norms and practices, spontaneous and intentional systems of control. In the simplest sense, governance means the process of decision-making and the process by which decisions are implemented (or not implemented). In the empirical analysis of public policies, governance is considered to encompass all aspects of the exercise of authority in the management of the resource endowment of a state and the manner in which the power is exercised. The quality of governance is determined by the impact of this exercise of power on the quality of life enjoyed by the citizens. Governance can be used in several contexts such as corporate governance, international governance, national governance and local governance. This study is confined to only national governance. Government is one of the actors in governance. All other actors except the military are grouped together as part of the "civil society" (see appendix for section-2).
Asian Development Bank (1995) identifies four basic elements of good governance (which McCawley calls democratic governance) such as accountability, participation, predictability and transparency. According to McCawley (2005, page 2), the most important elements of governance are the following:
1. The processes by which governments are chosen, monitored and changed 2. The systems of interaction between the administration, the legislature, and the
judiciary 3. The ability of government to create and to implement public policy

6
4. The mechanism by which citizens and groups define their interests and interact with institutions of authority and with each other.
Within national governance, McCawley (2004) categorizes governance issues at the macro and micro level. The macro level includes constitution, the overall rule of government itself (size and resources) and relationship between legislature, the judiciary and the military, while micro issues of governance are on government departments, commercial firms, social institutions and civil society affairs (such as the media, think tanks, and non-government organizations). The major contribution of McCawley’s paper (2005) in the governance literature lies in explaining the political process within the framework of structure-conduct-performance paradigm. The political process might be seen as an “industry”. Political leaders as entrepreneurs take risks and lead the parties (firms) in the national political industry. Political process will maintain acceptable and effective balances of power among the administration, the legislature, and the judiciary. Domestic political industries must be efficient and productive to realize outcomes. Political markets could benefit from competitive arrangements, selection of the chief executives of the organizations, and regulatory controls.
Imperfections in political markets will create high distortions and impede good national governance. Low-income voters make up a large share of the electorate in many poor developing countries and democratization might be expected to benefit them. Imperfections in political markets are greater in some countries than in others with respect to diverting resources by politicians to political rents and private transfers. Keefer and Khemani (2005) identify three political market imperfections that undermine the role of elections in guaranteeing accountable and responsive government. The distortions are generated due to information asymmetries, social polarization and non-credibility of political promises. There is some evidence for the role of mass media in spreading and coordinating information among the electorate and thereby improving political accountability. Dreze and Sen (1996, reprinted in Keefer and Khemani, 2005) have examined the contrasts of outcome in basic health and education between the northern state of Uttar Pradesh and southern state of Kerala in India. The two states have almost identical per capita income and poverty rates, but dramatically different outcomes in health and education. One important part of the answer would seem to lie in the dynamics of political competition rather than in differences in the political institutions themselves. In states like Uttar Pradesh, the Congress party did not confront vigorous competition from other credible and well-organized parties. In Kerala, competition was between two credible parties, the Congress and the Communists. Both parties make promises to serve high quality social services. Among three parties in U.P., BJP appeals to upper class Hindus, Samaj party to backward castes, Samawadi party to marginalized religious groups and castes. The contrast between Kerala and Uttar Pradesh demonstrates that the sheer endurance of democracy is no guarantee that political market imperfections will disappear. 2.2 Sources of Data The data on governance is inherently subjective. It is useful to collect data on governance perceptions, because for example, perceptions may often be more meaningful than objective data, especially when it measures public faith in institutions (Kaufmann et al., 1999).

7
Several Organizations such as the Economist Intelligence Unit (EIU), the world governance survey (WGS), International Country Risk Guide (ICRG), the Freedom House Index (FHI), World Economic Forum (WEF), World Bank (WB), Transparency International (TI), Polity data Base, and The Wall Street Journal and the Heritage Foundation (WSJ-Heritage 1997) have attempted to quantitatively “measure” the overall “quality” of governance in individual countries. The variables used to measure indicators as a proxy for governance, are not uniform (see Chart 1 and appendix for section-2).
The Economist Intelligence Unit is primarily concerned with indicators related to economic development. The Global Competitiveness Survey of the World Economic Forum presents a competitiveness index incorporating institutional, technology and macro-economy dimensions. International Country Risk Guide deals with the issues of interest to business corporations and potential investors. Scholars and practitioners frequently use the Freedom House Index (FHI) and Polity datasets to measure the level of democracy in a given country, but these deal only with a specific set of civil freedoms and political rights. Transparency International constructed numeric indices of the extent of corruption in the private sector and state. The indices range from a value of zero for a country perceived to be totally corrupt to a value of 10 for a country perceived to be totally clean.
World Bank reports perceptions of governance based on several hundred variables for a large number of countries (Kaufmann et al., 1999, 2005). A total of six dimensions of governance indicators was constructed based on 352 individual variables taken from 37 different sources, produced by 31 different organizations (Kaufmann et. al.). These are now recognized as worldwide governance indicators. The aggregate indicators are oriented such that higher scores correspond to better governance outcomes. The world governance survey (WGS) constructed indicators of governance based on thirty indicators using a five point response scale: as either very high, high, moderate, low or very low, but their scores are highly correlated with World Bank indicators. The Wall Street Journal and the Heritage Foundation (WSJ-Heritage 1997) compiled indices of the overall economic policy environment pertaining to ten indicators. The index takes a value from one to five with lower values indicating a policy environment more conducive to economic growth. An overall index of the quality of the national economic environment was derived from the average of the ten WSI-Heritage policy index (appendix for section-2). There are some economists such as Paul Krugman, Sanjaya Lall, and John Weiss who differ with World Economic Forum on the concept of competitiveness index. To them, competitiveness means essentially the capability (in a broader concept) of firms, which can compete at the international level. But firms do not act in isolation. So competitiveness lies in the effectiveness with which countries promote the development of technological and managerial capabilities. Market imperfections are common in technology and innovation, the main drivers of national competitiveness. In this context, they do not differ from a national competitiveness index. We use two sources of information provided by World Bank and World Economic Forum to compose governance indices. World Bank provides six governance dimensions while World Economic Forum reports on Institution and technology dimension along with other indicators in its competitiveness indices.

8
Chart 1: Measurement of Governance and Competitiveness Index from the Literature
Institutional Measure Sources and data Components of Index Value of Index availability
Governance World Bank 1. Political/Democratic Governance: Unobserved Components
1996-2004 a. Voice and Accountabilit Model
b. Political Stability
(Quality of government) The rating varies
average of six indices 2. Economic Governance: from - 2.5 to + 2.5
i. Ability of the Government (Effective Dimensions) a. Government Effectiveness
b. Regulatory Quality
ii. Respect of citizens and the State of the Institutions a. Rule of Law
b. Control of Corruption
Competitiveness World Economic 1. Global Competitiveness Index
Forum (WEF) (2004/05-2005/06) Values varies from 1 to 7
(2001/02-2005/06) a.Basic requirements Both objective and
b. Efficiency Enhances subjective variables
(National Competitiveness) c. Innovation Factors
a.Basic requirements Institution, Infrastructure, Macroeconomy, Health & primary education
b.Efficiency Enhances Higher Education & Training, Market Efficiency, technological readiness
c.Innovation Factors Business Sophistication & Innovation
2. Growth Competitiveness Index
a.Technology Index: Technology subindex, ICT subindex, Technology transfer subindex
b. Public Institution Index: contracts & law, corruption
c. Macroeconomic Environment: macroeconomic stability, govt. waste, country credit rating
ICRG Indicator International Security of Contracts &
Country Risk Guide Property Rights
(ICRG) and WDI a. Rule of Law Values are from 1 to 12
b. Corruption in government
c. Quality of the Bureaucracy
d. Repudiation of contracts by Govt.
Investment
Climate Indicators World Development 1. Starting a business
Report, 2005 2. Enforcing a contract Both objective and
3. Registering Property subjective variables
4. Investment Profile (ICRG)
5. Policy Uncertainty
6. Corruption, Court, Crimes
Infrastructure World Development 1. Electricity consumption per capita

9
Indicators Indicators 2. Telephone mainlines per 1000 people
Institutional Measure Sources and data Components of Index Value of Index availability
Competitiveness Firm's Competitiveness but firms do not act in isolation. So the competitiveness lies with
which countries promote the development of technological and managerial capabilities.
Sophistication index can be used as a preliminary step for country's competitiveness analysis.
Market share of exports in world market
Source: Lall & Weiss, (2004), Industrial Competitiveness, The Challenge for Pakistan, ADB Institute, October
Export Competitiveness Behind the border agenda
1. Governance (corruption, law and order, business environment etc.)
2. Physical Infrastructure (power, gas, telecommunications etc.)
3. Operating cost due to high Cost of borrowing
Globalization AT Kearney/Foreign Ranks
Index Policy Magazine
(out of 62 Countries)
Index of Regulations Doing business data base
of World Bank ( 7 indicators): a. weighted average of
Starting a business five components
labor market regulation
contract regulation
creditor rights
Insolvancy regulation
Study: Busse, Matthias and Jose Luis Groizard (2005)
Djankov, S. et al (2005), World Bank: simple average of country rankings of 7 indicators: starting a business,
hiring & firing workers, registering property, getting bank credit, protecting equity investors, enforcing contracts
in the courts, and closing a business. The index is normalized to vary from 0 to 1.
Corruption Index Business International /
/Institutional Efficiency The Economist Intelligence Unit 0 to 10
(average of three indicators:) Higher value means that
Efficiency of the Judiciary system country in question has
Red tape & Bureaucracy good institution
Corruption
Bureaucratic Efficiency
Political Stability (social change0
Political change (institutional)
opposition take over

10
Stability of labor
Neighboring Countries
Terrorism
Mauro, Paolo (1995), The Quarterly Journal of Economics, August
Governance McCawley (2005)
1. The processes by which governments are chosen, monitored and changed
2. The systems of interaction between the administration, the legislature, and the judiciary
3. The ability of government to create and to implement public policy
4. The mechanism by which citizens and groups define their interests and interact
with institutions of authority and with each other.
Institutional Measure Sources and data Components of Index Value of Index availability
Institutional Quality ICRG's Index Normalized to 0 to 100
Bureaucratic quality, corruption & rule of law are used
separately as proxy for a country's institutional framework.
Institutional Environment Rule of Law (World Bank)
Counties with better functioning institutions are less likely to
be hampered with inefficient laws and regulations
ICRG's corruption ranking
Source: Bolaky B. (2006), IMF 2006
Regulation is used from Doing Business dataset combined of index
of labor and entry regulations, each is the simple average.
Quality of Government simple average of six component indices of WB
Political dimensions (voice & Political stability)
Effective dimensions(govt. effectiveness, regulatory quality,
rule of law & control of corruption)
Source: Helliwell, John F. et al (2006), NBER WP 11988
Institutions IMF (2003) 1. An aggregate governance index, average of six measures
of institutional development (WB) increase better quality Institution
Heritage Foundation 2. Property rights, the degree of prote- higher score greater rights
ction that private property receives
Polity IV data set 3.constraint on the executive 1-7, higher score more constraints
1 & 2 are not totally independent; 2 is incorporated in 1.
11
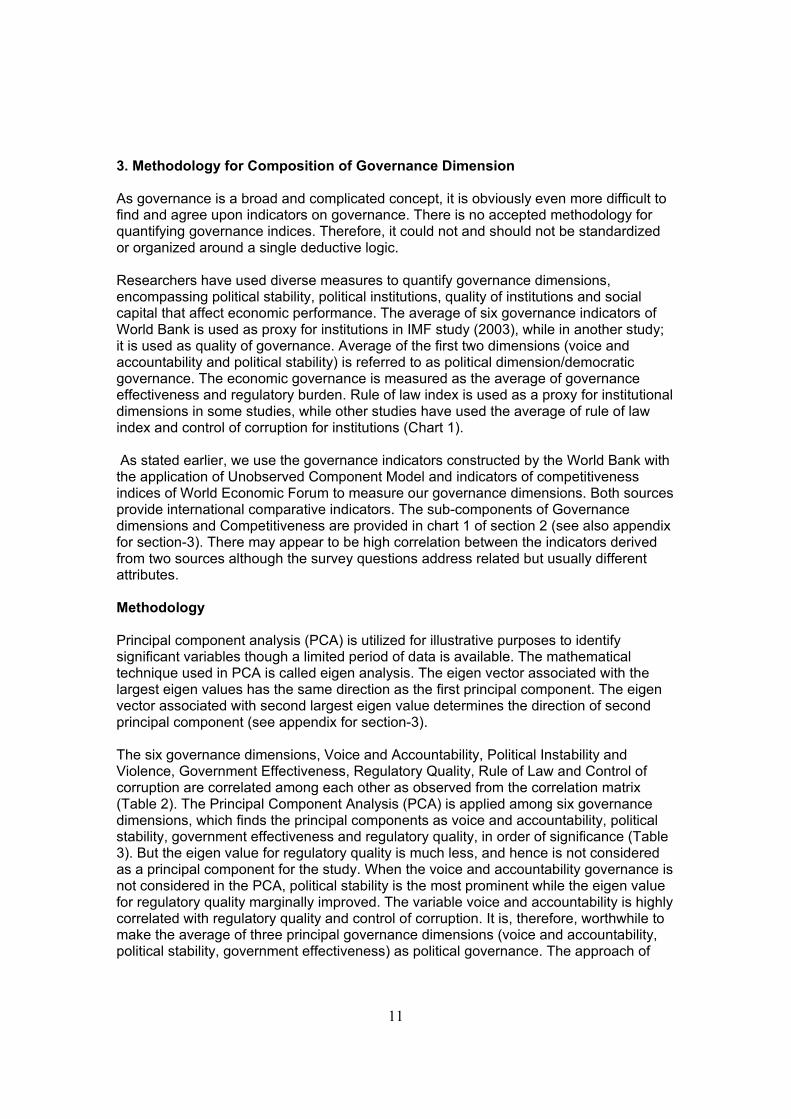
3. Methodology for Composition of Governance Dimension As governance is a broad and complicated concept, it is obviously even more difficult to find and agree upon indicators on governance. There is no accepted methodology for quantifying governance indices. Therefore, it could not and should not be standardized or organized around a single deductive logic. Researchers have used diverse measures to quantify governance dimensions, encompassing political stability, political institutions, quality of institutions and social capital that affect economic performance. The average of six governance indicators of World Bank is used as proxy for institutions in IMF study (2003), while in another study; it is used as quality of governance. Average of the first two dimensions (voice and accountability and political stability) is referred to as political dimension/democratic governance. The economic governance is measured as the average of governance effectiveness and regulatory burden. Rule of law index is used as a proxy for institutional dimensions in some studies, while other studies have used the average of rule of law index and control of corruption for institutions (Chart 1). As stated earlier, we use the governance indicators constructed by the World Bank with the application of Unobserved Component Model and indicators of competitiveness indices of World Economic Forum to measure our governance dimensions. Both sources provide international comparative indicators. The sub-components of Governance dimensions and Competitiveness are provided in chart 1 of section 2 (see also appendix for section-3). There may appear to be high correlation between the indicators derived from two sources although the survey questions address related but usually different attributes. Methodology Principal component analysis (PCA) is utilized for illustrative purposes to identify significant variables though a limited period of data is available. The mathematical technique used in PCA is called eigen analysis. The eigen vector associated with the largest eigen values has the same direction as the first principal component. The eigen vector associated with second largest eigen value determines the direction of second principal component (see appendix for section-3). The six governance dimensions, Voice and Accountability, Political Instability and Violence, Government Effectiveness, Regulatory Quality, Rule of Law and Control of corruption are correlated among each other as observed from the correlation matrix (Table 2). The Principal Component Analysis (PCA) is applied among six governance dimensions, which finds the principal components as voice and accountability, political stability, government effectiveness and regulatory quality, in order of significance (Table 3). But the eigen value for regulatory quality is much less, and hence is not considered as a principal component for the study. When the voice and accountability governance is not considered in the PCA, political stability is the most prominent while the eigen value for regulatory quality marginally improved. The variable voice and accountability is highly correlated with regulatory quality and control of corruption. It is, therefore, worthwhile to make the average of three principal governance dimensions (voice and accountability, political stability, government effectiveness) as political governance. The approach of

12
average provides equal weighting to each index and no excessive weight is given to any single index. As WEF reports information on sub-components of global competitiveness index as well as of growth competitiveness index, PCA is fitted on subcomponents of both the indices. Principal component analysis in global competitiveness index suggests basic requirements as the first principal component, which contains all institutional sub-components (Table 4). Institutions, heath and primary education, and macro-economy are grouped into basic requirements. For our study, institutional component of basic requirement is of more relevance and important, and hence is selected as a governance dimension for analysis in addition to the political governance. Applying PCA among sub-components of growth competitiveness, public institutions are found to be the first principal component which has the same direction of higher eigen value associated with eigen vector (Table 5). But the eigen value of technology sub-index does not have the same direction as of eigen vector even with higher values. The principal components analysis on three sub components of technology index (innovation, ICT sub index and technology transfer subindex), provides the similar result for innovation showing that the eigen vector of innovation sub index does not have the same direction as the eigen value (though the value is higher). This seems to indicate that institutional effort needs to be given to technology transfer (which has high scores 4.10 in 2005/06) but not innovation with low level of scores (1.61 in 2005/06) within technology index. Both ICT sub index and technology transfer index show the same direction of eigen vectors with eigen values but the eigen values for ICT sub-index are much larger than technology transfer sub-index (Table 6). When seven sub indices of growth competitiveness indices other than public institutions are used together in the principal Component Analysis, information and communication technology (ICT) and technology transfer indices are also found to have the same direction with the eigen values and these are also second and third principal components following the public institutions index. We choose four significant components for the study based on Principal component analysis applying to the elements of growth competitiveness index and also that the analysis relates to the longer period of five years from 2001/02 to 2005/06 compared to that used for global competitiveness indices. In short, appearing from the Principal Component Analysis are the followings: (a) Political governance appears as the principal element from governance dimension constructed by averaging three indices: voice and accountability, political stability and government effectiveness. Equal weighing in constructing the composite index means that potential biases or errors do not unduly influence the composite index.
(b) Public institutions index emerges as the first principal component in the growth competitiveness index, followed by ICT and Technology transfer sub-index. Within global competitiveness index, basic requirements (which has three sub-components: Institutions, Macro-economy, Infrastructure & Health & Primary Education) are observed to be the first principal component. The institutions sub-component of basic requirements in global competitiveness index includes both private and public institutions while growth competitiveness index reports only on public institutions index as in World Economic Forum. We choose Public Institutions and all institutions for our investigations. The corruption index falls into public institution index as recorded in the global competitiveness report, and it is highly correlated with political governance dimensions.

13
(c) ICT sub-index and technology transfer sub-index appear prominently in the Principal component analysis. We will also analyze technology readiness (pillar 7 in Global competitiveness index), which specifically relates to those factors which facilitate and enable the technological capacity of a country including information and communication technologies (ICT). This includes the general availability of technologies, and the penetration rate of information and communication technologies (ICT), as these tools are seen as critical indicators of the overall technological readiness of a country. Technological readiness (Pillar 7) deals with the stock of technology available in a given economy, regardless of its original source. It is considered one of the main drivers in national competitiveness. Access to ICT is critical, not only for the establishment of an effective and rapid communications system but also for providing an efficient infrastructure for commercial transactions. Chart –2 provides the key features of governance dimensions that have emerged for operational purposes. These are: (i) Political Governance, (ii) Institutions: All institutions and public institutions, and (iii) Technology transfer, ICT index and Technological readiness. We will not focus on each of the sub indices of all the three governance dimensions, but will analyze a few of them as much of our focus is on governance. ICT, technology transfer and stock of technology will come up to our discussion as these technology factors facilitate improvement of governance and achieving higher growth. From now, these will be referred to as governance dimensions. The value of political governance varies from -2.5 to +2.5 and it has been rescaled to 0 to 100. The values of other dimensions, institutions, technological readiness, ICT and technological transfer range from 1 to 7. Chart-2: Governance Dimensions that have emerged from PCA Governance Dimensions Subcomponents Sources of Data Political Governance Voice & Accountability World Bank Political Stability Government Effectiveness Institutional Dimension Public Institutions World Economic Forum All Institutions Technology Dimension Information & Communications Technology World Economic Forum Technology Transfer Technology Readiness Some qualifications have to be made in this classification although principal component analysis is applied to identify the variables in order of significance because the concepts political governance, institutions and technological readiness may be inter-related. In particular, governance issues provide a common link to all the categories. But they are distinct notions, and ought not to be regarded as one and the same. It is also a kind of synergy among the components; actions on three fronts are needed to realize the synergy. Better Political Governance affects and leads to stronger institutions and improvements in technological readiness, which will influence the formulation and

14
implementation of policies for promoting macroeconomic stability, private sector development (which determines level and quality of private investment) and human development, resulting in higher economic growth. An important component of the enabling environment for reducing poverty is the macroeconomic sustainability of the growth. Bangladesh was basically able to maintain good macroeconomic management, trade reforms and human development. The area in which Bangladesh is facing a great problem lies in improving governance and fragile institutions. This has caused to a large extent, weak implementation of reforms and worsening of income distribution in the country. Table 2: Correlation Matrix among Six Governance Indices Over 5 Years, 1996-2004 Variable var1 var2 var3 var4 var5 var6 Voice and Accountability ( Var 1) 1 Political stability (Var 2) 0.87 1 Government Effectiveness (Var 3) 0.7231 0.7206 1 Regulatory Quality (Var 4) 0.9442 0.7711 0.7613 1 Rule of Law (Var 5) 0.7468 0.8928 0.5364 0.7509 1 Controll of Corruption (Var 6) 0.9793 0.8523 0.5756 0.9047 0.7744 1 Table 3: Principal Component Analysis on six Governance Dimensions (Prinicipal components: 4 components retained) Var 1 Var2 Var 3 Var 4 Dimensions Eigen value Eigen Vectors Voice and Accountability (Var1) 4.957 0.436 0.012 -0.366 -0.240 Political stability (Var2) 0.524 0.421 -0.149 0.421 -0.548 Government Effectiveness (var3) 0.375 0.352 0.816 0.312 -0.006 Regulatory Quality (var4) 0.144 0.424 0.147 -0.350 0.600 Rule of Law (var 5) 0.000 0.388 -0.471 0.528 0.474 Control of Corruption (var 6) 0.000 0.423 -0.259 -0.436 -0.239 Table 4 : Principal Component Analysis on three global competitiveness index (Principal components: 1 component retained) Eigen Vectors Dimensions Eigen value Var 1 Var2 var 3 Basic requirements (var 1) 3.000 0.577 Efficiency enhancements (Var 2) 0.000 0.577 Innovation Factors (Var 3) 0.000 0.577

15
Table 5: Principal Component Analysis on three Growth Competitiveness Indices
(Principal components: 3 components retained) Var 1 Var2 Var 3 Dimensions Eigen value Eigen Vectors Technology subindex: innovation (Var1) 1.74757 -0.50583 0.68855 0.51965 Public Institutions (Var2) 1.05194 0.71887 0.00348 0.69513 Macroeconomic Environment index (var3) 0.20049 0.47682 0.72518 -0.49674 Table 6: Principal Component Analysis on Technology Sub-indices of Growth Competitiveness Index (Principal components: 3 components retained) Var 1 Var2 Var 3 Dimensions Eigen value Eigen Vectors Technology Sub-index (innovation) (Var 1) 2.27275 -0.53486 0.73161 0.4227 ICT sub index (var 2) 0.61665 0.64125 0.02571 0.76691 Technology Transfer Sub-index (Var 3) 0.1106 0.55021 0.68124 -0.48289 4. Analysis of Governance Dimensions Analysis on governance dimensions encompasses positive analysis derived from theory as well as propositions concerning what government ought to be doing (i.e. analysis of normative propositions) on the achievement of development outcomes. Both kinds of research are useful in the analysis and design of governance systems. One has to bear in mind the complications of governance research, given their broad coverage and complexity. Our approach is more modest and more realistic in the analysis and interpretation with respect to three dimensions of governance: political, institutional and technology governance dimensions. Our analysis for governance dimensions pertains to five years covering the period from 1996 to 2004 due to availability of comparable data. Comparable countries are chosen from South Asia, South East Asia. Some developed countries are also included in our country sample. 4.1 The Political Governance Dimension in Bangladesh As mentioned earlier, political governance refers to a country’s voice and accountability, political stability and government effectiveness. If political governance deteriorates or remains at a low level, it may be reflected in work disruptions, and a poor environment for protecting the rights and freedom of the common citizen. The result may be in chaos. Table 7 reports the indices of political governance from 1996 to 2004 for 17 countries. Within South Asia, political governance of Bangladesh is better than in Pakistan and Sri Lanka but lower than in the other larger economy, India. In comparison to Southeast Asia, Bangladesh did better than Indonesia but significantly worse than the other economies, Malaysia, Thailand, Philippines and Singapore (Figure 1). As can be seen in Figure 2, the performance of Bangladesh’s political governance deteriorates despite having a democratically elected government in power. Over the years from 1998 to

16
2004, political governance dimensions portray a dismal picture (Figure 2). There was some improvement in political governance from 1996 to 1998. It indicates that the political governance in Bangladesh is a problem and political institutions are becoming increasingly dysfunctional due to imperfections prevailing in political markets. Domestic political industries happen to be more inefficient. Political industries, where entrepreneurs are political leaders, do not perform in a reasonable degree of order. As a consequence, good governance is impeded. The worsening political governance may be a reflection of popular dissatisfaction with the performance of the government in power. It may be noted that the index of political stability, one element of political governance, goes down by 39 per cent over the period from 1998 to 2004 (Table 8). The adverse result is due to the main influence of the confrontational politics and non-democratic interventions in political life. There were a number of politically related hartals (work stoppages) in the country. During the latter half of the 1991-96 period, there was a longer period of strikes to institutionalize a caretaker government after the tenure of five-year period to conduct national elections within three months. An amendment was made to the constitution in 1996 for holding such free and fair elections under a non-partisan, caretaker government. The then opposition Awami League (AL) came to power in 1996 in the fresh election held under caretaker government. The political trouble started again on different political grounds in latter half of 1997 and it continues. The opposition Bangladesh Nationalist Party boycotted parliament and there have been a series of hartals. After 5-year term, national election was held under caretaker government in October 2001. The opposition Bangladesh Nationalist Party (BNP) was elected to power. Their term will end on October 2006. Political difficulties and troubles emerged again on a variety of political grounds such as for the reform of caretaker government and the election process. Out of three consecutive elections, the opposition was elected to power twice. A viable two party system prevails now in Bangladesh, with the Awami League (AL) and Bangladesh Nationalist Party (BNP). There is a lack of democratic practice within each party and efficient people are not being placed in the deserved positions. The party head is chosen based on historical inheritance. Political governance in Bangladesh is about exercising different types of power – executive, legislative and judiciary. Power is centralized in the hands of cabinet and head of the government to exert authority and undue power. The head of the government and the party in power behaves as if he/she has dictatorial power and can function without being accountable. Organizations such as Accountability Bureau, and the Comptroller General’s office serve more as the agents of the governments in power than autonomous, non-partisan bodies. Political patronage and weak autonomy of the law enforcing agencies have caused these bodies to often serve as instruments of control and sources of harassment of the opposition political parties and the civil society. The legislature and judiciary have been relatively weak compared to the executive. The lower levels of judiciary are subject to political patronage and corruption. Within the civil administration, the head of the government and the cabinet exercise almost all authority. Local governments are very weak with very little administrative and financial authority. The political parties coming to power politicize the bureaucrats. Public Administrative

17
Reform Commission, formed few years ago, placed some recommendations for ensuring effective administration, which have not been implemented. The military had a tremendous influence on politics, civilian decision-making and patronage. The civilian leaders took cognizance of the military to get support on their side. Senior positions in the government, public enterprises and public banks, and allocations of urban land at heavily subsidized rates are offered to them. Street politics with money and political hooligans (‘Mastans’) are significant factors in Bangladesh politics. The parliament is largely ineffective due to long series of hartals, parliamentary boycott and street policies. Mastans backed by powerful political personnel organize hartals, mobilize political money by force, and when necessary kidnap and kill political opponents. They are also utilized to gather votes based on threats over life and property. In the 1990s, the mastans caused a near breakdown of the law and order situation. In immediate past, there were grenade attack on the opposition AL rally killing so many persons, including the British envoy to Bangladesh, killing of former finance minister, death of 21 persons by suicide squads including judges and lawyers, and simultaneous bomb blasts in 61 out of 64 districts. There was some improvement in 2005 due to prompt actions by the elite Rapid Action Battalion (RAB) against hardcore criminals, but a number of deaths in their custody and in encounters, and emergence of radical Islamic Party with simultaneous bomb blasts throughout the country in 2005, triggered protests from human right organizations from abroad. Impact on economy: The concern with poor political governance has affected domestic resource mobilization. Bangladesh has one of the lowest tax-GDP ratios in the world --- the lowest in South Asia. Raising domestic resource mobilization will raise public investments for infrastructural developments. In every year, experience shows that there is a revenue shortfall from target with under performance of Annual development program (ADP) and over spending in current expenditure. Under utilization of ADP has been a regular feature since the early nineties. Political Governance failure causes high tax evasion and may be responsible for failure to recover non-performing loans, which are at present 25 percent of total loans. Poor ADP utilization is not simply a problem of resource scarcity but also of implementation failure, which is related to some extent with governance failures. The deterioration in political governance has an effect on other economic and social fronts such as education and health sectors (see section 4.2). Public institutions through which government delivers services will be in jeopardy. As a result, almost the whole masses of the country have been affected. A malfunctioning democratic system is not a conducive environment for the entrepreneurs (who want political stability) for long-term investment. Political governance has been most dominant in defining the relative balance of roles between public and private sectors. The present BNP government’s ability to close down the Adamjee Jute Mills (which incur loss Tk. 5 million per day) is a positive step forward, although a generous program of compensation tackled the opposition by labor.

18
Although macroeconomic performance has been better, there are emerging risks of declining performance due to stagnation of the revenue effort. It might be relevant in this context to quote the following: “The restoration of pluralist system since 1991 has not fulfilled the promise of accountable governance. Secularism was not only eliminated as a pillar of the constitution but we have since become more communal and intolerant of the rights of minorities in our society.” (Sobhan 2004) Bangladesh is yet to develop a modern system of political governance through a process of debate and consultation. The main factors as emerged to improve political governance, seem to be as follows:
• Independence of Judiciary: Law should not subject to government. • Effective Parliamentary System: The parliament cannot be paralyzed and be
made to play effective control over administration. • Office of the Ombudsman: The Ombudsman Act is to be enforced to play
important role for ensuring political governance. • Independent Anti-corruption Commission: Anti-corruption commission set up by
the government over more than 35 months is to be allowed to function. This should not be to just show to international donors.
• Effective media to perform vigilance functions: Distribution of government advertisements to the media should not be used to control media.
Figure 1: Political Governance
0.000
10.000
20.000
30.000
40.000
50.000
60.000
70.000
80.000
90.000
Bangla
desh
German
y
Hong K
ong,
China
India
Indon
esia
Japa
nKore
a
Malays
ia
Pakist
anPRC
Philipp
ines
Singap
ore
Sri Lan
ka
Taipei,
China
Thaila
nd UKUSA
Source: Table 7
Scor
es (0
-100
) 20042002200019981996

19
Table 7: Political Governance in Bangladesh 2004 2002 2000 1998 1996 Bangladesh 32.3 38.2 40.9 43.5 39.8 Germany 74.5 79.1 80.4 80.4 81.8 Hong Kong, China 70.0 67.7 63.1 66.1 68.0 India 46.1 45.6 49.9 48.0 45.8 Indonesia 35.5 33.4 31.5 27.9 38.1 Japan 71.2 72.2 72.1 72.5 73.5 Korea, Republic of 64.2 63.6 62.5 59.5 60.1 Malaysia 56.7 56.9 55.1 56.6 63.1 Pakistan 26.9 29.8 32.2 35.4 32.7 PRC 40.0 42.5 43.2 41.5 43.4 Philippines 41.9 46.6 50.6 54.7 51.6 Singapore 74.0 77.9 76.1 77.6 78.7 Sri Lanka 40.7 43.2 33.2 33.8 35.1 Taipei,China 67.5 68.9 67.6 72.6 69.9 Thailand 53.1 56.3 54.6 53.4 54.5 UK 76.6 78.3 80.5 82.1 80.5 USA 73.2 71.7 78.5 78.9 80.7 Source: Kaufmann, et al. (2005)
Figure 2: Political Governance in Bangladesh, 1996-2004
0.00
5.00
10.00
15.00
20.00
25.00
30.00
35.00
40.00
45.00
50.00
2004 2002 2000 1998 1996
Scor
es
Governance
20
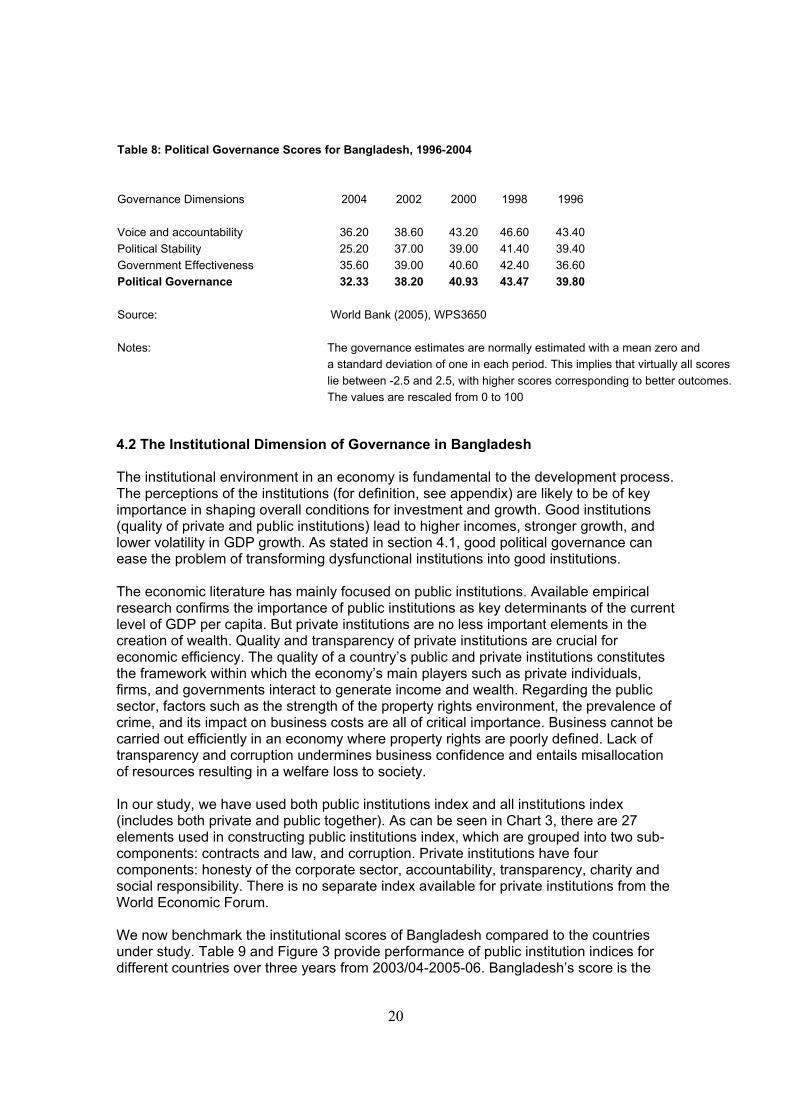
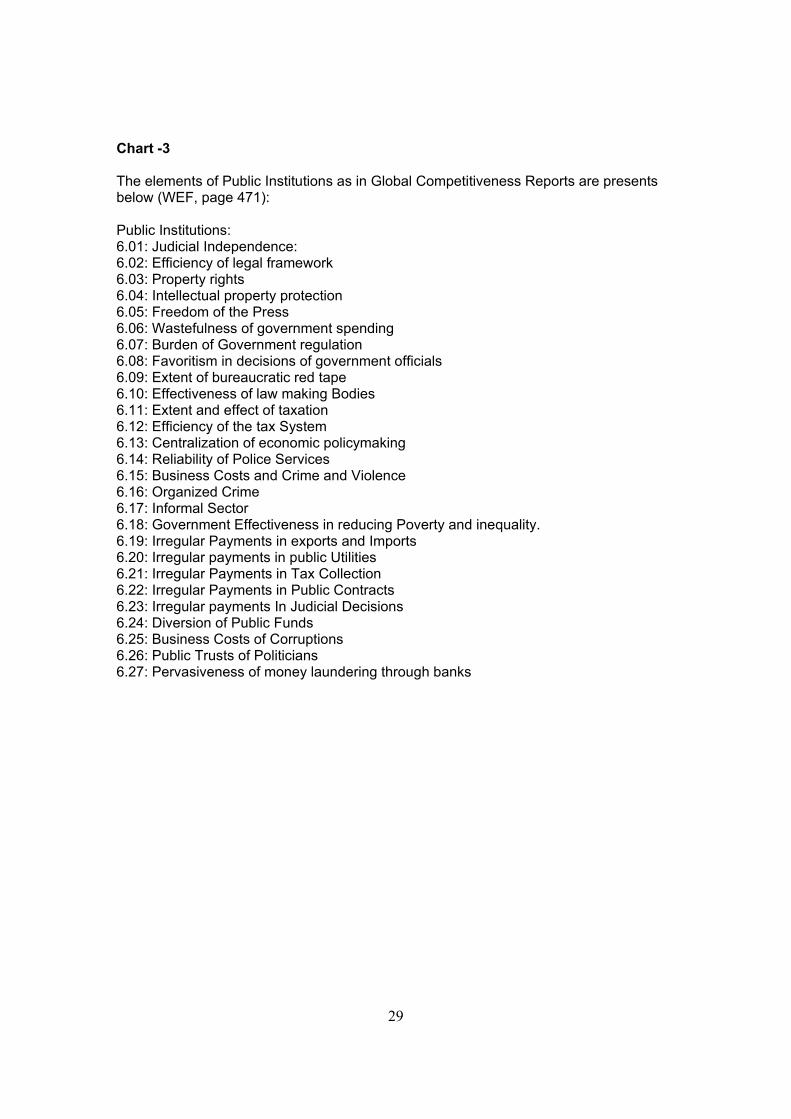
Table 8: Political Governance Scores for Bangladesh, 1996-2004 Governance Dimensions 2004 2002 2000 1998 1996 Voice and accountability 36.20 38.60 43.20 46.60 43.40 Political Stability 25.20 37.00 39.00 41.40 39.40 Government Effectiveness 35.60 39.00 40.60 42.40 36.60 Political Governance 32.33 38.20 40.93 43.47 39.80 Source: World Bank (2005), WPS3650 Notes: The governance estimates are normally estimated with a mean zero and a standard deviation of one in each period. This implies that virtually all scores lie between -2.5 and 2.5, with higher scores corresponding to better outcomes. The values are rescaled from 0 to 100 4.2 The Institutional Dimension of Governance in Bangladesh The institutional environment in an economy is fundamental to the development process. The perceptions of the institutions (for definition, see appendix) are likely to be of key importance in shaping overall conditions for investment and growth. Good institutions (quality of private and public institutions) lead to higher incomes, stronger growth, and lower volatility in GDP growth. As stated in section 4.1, good political governance can ease the problem of transforming dysfunctional institutions into good institutions. The economic literature has mainly focused on public institutions. Available empirical research confirms the importance of public institutions as key determinants of the current level of GDP per capita. But private institutions are no less important elements in the creation of wealth. Quality and transparency of private institutions are crucial for economic efficiency. The quality of a country’s public and private institutions constitutes the framework within which the economy’s main players such as private individuals, firms, and governments interact to generate income and wealth. Regarding the public sector, factors such as the strength of the property rights environment, the prevalence of crime, and its impact on business costs are all of critical importance. Business cannot be carried out efficiently in an economy where property rights are poorly defined. Lack of transparency and corruption undermines business confidence and entails misallocation of resources resulting in a welfare loss to society. In our study, we have used both public institutions index and all institutions index (includes both private and public together). As can be seen in Chart 3, there are 27 elements used in constructing public institutions index, which are grouped into two sub-components: contracts and law, and corruption. Private institutions have four components: honesty of the corporate sector, accountability, transparency, charity and social responsibility. There is no separate index available for private institutions from the World Economic Forum. We now benchmark the institutional scores of Bangladesh compared to the countries under study. Table 9 and Figure 3 provide performance of public institution indices for different countries over three years from 2003/04-2005-06. Bangladesh’s score is the

21
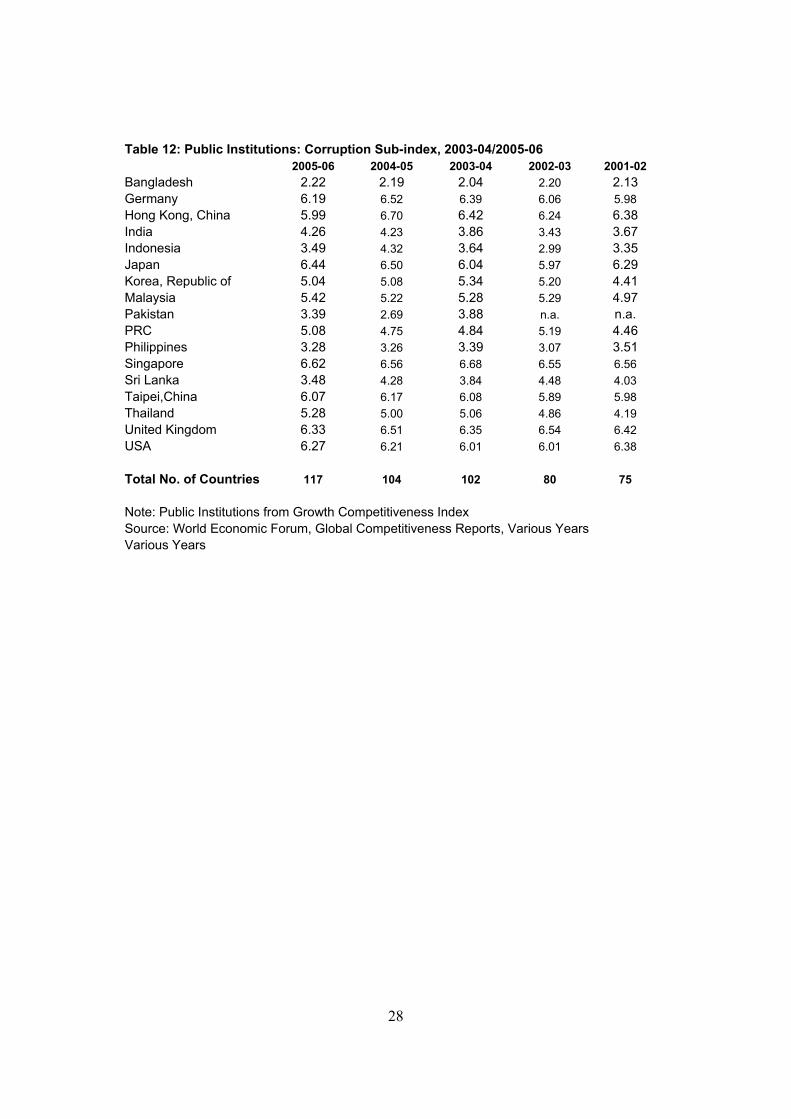
lowest of all the countries including South Asian and East Asian Countries. Similar results are observed in the performance of all institutions (Table 10 & Figure 4). It may be noted that the performance of public institutions improves very marginally from 2003/04 to 2005/06. The lowest performance index on public institution aspect serves as a grim reminder of the governance problems in which the country is enmeshed. A government works through public institutions to deliver services. When the public institution component is classified into contracts and law, and corruption subcomponents, the result does not seem to improve. As can be seen, the performance on contract and law declines from 2003-04 to 2004-05 and then marginally increases in 2005-06 (Table 11 and Figure 5). The corruption index in public institution component provides the gloomiest picture, although its performance improves marginally over the years (Table 12 and Figure 6). The Transparency International rates Bangladesh as the most corrupt country in the world for five consecutive years due to the institutional problems. Corruption is partly a reflection of underlying weak institutions. Corruption is often defined as the use of public office for private gains. There are cases of abuse of private office for private gains (corporate scandals in USA and Europe, excess export subsidies drawn in Bangladesh from government, etc.). Different indices of corruption from different sources are likely to be correlated. Corruption mostly originates in large government procurements, purchases and in the provision of public service delivery programs. There is a need to do favor to private financiers for financing party and electoral activities. Corruption acting like a tax reduces foreign direct investment, has adverse effects on economic growth by lowering incentives to invest, and disproportionately burdens the poor. The annual rate of procurement is estimated about 10 per cent of GDP (around $ 3 billion) (Ahmed 2002). In Bangladesh, as other countries, the problems of nepotism and perverse client-patron relationships and bribery, deprive the most efficient firms. There is a plenty of evidence of corruption in the provision of public services in Bangladesh. TIB study (2005) based on nation-wide household survey in 9 sectors in Bangladesh provides information on the incidence of corruption as a consequence of the weak public institutions. It has been found that an average Bangladeshi paid Taka 485 taka per year as bribes. The bribes paid by households for 25 service categories within the 9 sectors (education, health, land administration, police, judiciary, electricity, taxation, local government- shalish & relief, and pension) are Taka 6,796 crore. It may be worthwhile to highlight institutional problems and the underlying corruption therein in a few sectors of public services, such as education, health and port services. These sectors are chosen in view of their importance in the national economy with regard to trade, poverty alleviation and attaining Millennium Development (MDG) goals. Out of 10 targets set for 2015, four are health related targets (infant and child mortality, under-nutrition, maternal mortality and reproductive health).
Education Service: There are institutional problems in this education service at the primary and secondary level (for example) in course of implementation of Stipend Scheme, as have been pointed out (Background paper of PRSP, GOB). In some cases it is found that some non-deserving families are included in the list of beneficiary students and getting benefits, depriving some genuine poor. In some cases misappropriation of funds has been found.

22
False enrolment of a single student in several schools is observed at the same time. False attendance of absentee students is noticed in the attendance registers. This is more noticeable in the implementation of female stipend scheme in leakage, efficiency and targeting. The female stipend scheme has raised the ratio of females to males in secondary level institution to 52:48 from 34:66 in 1990. The rate of teenage marriage is reduced and is retaining them in schools for longer period. The huge inclusion of girls not satisfying the criteria may jeopardize the program.
TIB study (2005) has also found in education sector, 40% students at the primary level had to pay admission fees at an average rate of Tk. 209 whereas it is supposed to be free; 32.4% primary school students who were entitled for government stipend had to pay Tk. 40 on an average for enrolment to receive the stipend. In case of girl students at the secondary level 22% had to make similar payments at an average rate of Taka 45 for government stipend.
The country still cannot ensure quality education, although there is significant improvement in primary school enrollment compared to other developing countries. . Government has to set basic education standard in Madrasha (religious education system) as in other school. Quality graduate is not produced. The young people aged between 14 and 18 are easily attracted to extremism due to lack of quality education. The present government has reduced unfair means at public examinations to a large extent as a necessary drive for quality education.
Health care Service:
Good health promotes economic development. Improved health will bring higher incomes, higher economic growth, and lower poverty. The institutional issues in relation to health are to increase availability of doctors, nurses, drugs, facilities and safety net for the poor. Institutional problems are associated with all levels of healthcare system.
Bangladesh has achieved some gains in health outcomes in the areas of population control, reducing total fertility rate, infant and child mortality and malnutrition over the decade. Its immunization program has registered noticeable results. However, the pace of progress has slowed down and outcome stagnates. Though the infant mortality rates (deaths under age 1) decline over the years, the level remains high. The average life expectancy is significantly lower. Only 40 per cent of the rural people have access to the public health care. This indicates that a major proportion of population is out of public healthcare service. Public health services are not the preferred choice for those who can afford private health services. The poor have no choice but to rely on public services. The institutional problems in the public health service provision result in poor quality of services indicated by staff absenteeism, inadequate attention given by doctors, non-availability of medicines and supplies, long waiting times, poor maintenance of equipment and unhygienic conditions. In public health facilities, there is widespread incidence of collection of unofficial user fees in hospital admission and other health related service delivery. In most facilities, fees are widespread and almost institutionalized. In some cases, especially surgical cases, fees can be as much as 10-12 times the expected amount of official fees. The poor patients pay the unofficial fees although the quality of public care is very poor (Mamud, S. 2004).

23
The World Bank/ Euro Health Study (2004) and other survey (e.g. Ghost Doctors, absenteeism in Bangladesh health facilities, WB 2003) report widespread absenteeism of doctors. A large majority (62%) of the outpatients reports that doctors are not available, while 54% of support staff show hostile attitude. For inpatients, the figure is 44% and 32.2% respectively. Senior doctors of the hospital are found to attend private patients within the facility or in their private chambers/clinics within working hours. The study also finds that 24% of outpatients and 65% of inpatients paid unofficial fees and at district level, it is as high as 94% of inpatients making unofficial payments (Mannan 2005).
TIB nation-wide survey in 2005 corroborates the above findings in that in health sector, 26% outdoor patients had to pay bribes to doctors for receiving medical treatment at the public hospital at an average rate of Taka 60 per visit. 20% indoor patients had to pay bribes for the same purpose at a much higher rate of Taka 478 on an average. 37% patients who had to undergo surgery in public hospital had to pay bribes at an average rate of 1420 taka. 57% of patients who had an X-ray done from public hospital had to pay Taka 516 on average as bribes.
The quality of health care (especially public health, including water quality) is dependent on the quality of institutions. There remains much more to be done in quality management of service provision to improve further aggregate heath indicators. It has been suggested that partnership with NGO has played a positive role leading to significant reduction in infant mortality. Basic health care needs to given priority instead of tertiary care which should be left to the private health sector, which has emerged in response to growing demand. A major policy weakness is the lack of effective regulatory framework for private health care for quality control, accountability and affordability. Infrastructure (Port)
The infrastructure situation is a significant constraint to a more rapid expansion of economic activities in Bangladesh. Weak institutions resulting from political constraints could not make desired progress on infrastructure development. Efficiency in the utilization of ports can contribute significantly to the efficiency and competitiveness of the economy as well as reducing trade costs and thereby enhancing export competitiveness. The weak institutional issues are mainly with operational problems resulting in inefficiencies indicated by low productivity and high cost in port operation. The main operational problems relate to poor service delivery, poor security, slowness in trade facilitation (lengthy custom formalities, customs hassles etc.), complications in submitting and clearing documents (lengthy and cumbersome procedures in the process clearance, submission of documents to many desks etc.), problems in auctioning unclaimed goods by customs. The vessel and container turn around time is very high compared to regional ports, thus increasing operational costs for the users, especially the shipping companies. The cost of moving a container through Chittagong is estimated at $600 as compared to norms of $150-300 in neighboring country ports (World Bank 1998). In 2003, average productivity of the Chittagong port was 196 moves per container vessel per day compared with 220 moves per day in Kolkata, 225 moves per day in Cochin, and 295 moves per day in Mumbai. Therefore, institutional efficiency is much needed in the port sector to improve Bangladesh’s competitiveness and promote export-led growth. There

24
is also restriction on setting up of private off docks within 20 KM from the port and handling of import containers, thereby discouraging potential investors. Recently, in April 2006, all documentations for container clearance (done earlier at different points) have now been brought at one point. In land port, the situation is not different either. Transparency International, Bangladesh diagnostic study (2005) revealed that officials and employees at the Banepole Land port (BLP) extorted ‘speed money’ worth Tk. 1390 million between 2003-04 and 2004-05 Tk. 990 million went into pockets of custom officials while Tk. 400 million went to the officials of Benepole port authority during the period under review. Further, governance failure with regard to passport issuance procedures, have created scope for a wholesale practice of taking bribes at the city’s passport office. The monthly volume of such illegal pay-offs is around Tk. 26.4 million and a large portion of it goes into pockets of the high officials of the department, in addition to an average of Tk. 1000 per verification. On the whole, the institutional problems associated with public service delivery are severe. Poor political governance impacts badly on the institutions and vice versa. The worsening institutions affect negatively the government delivery programs, and generate corruption and slower economic growth. In Bangladesh, NGOs participate in the delivery of social programs, thereby mitigating to a great extent the low efficiency and high corruption of public service delivery. Public-private partnership with NGOs has a great potential in Bangladesh for effective use of limited public resources.
Figure 3: Public Institutions
0
1
2
3
4
5
6
7
Ban
glad
esh
Ger
man
y
Hon
g K
ong,
Chi
na
Indi
a
Indo
nesi
a
Japa
n
Kor
ea
Mal
aysi
a
Pak
ista
n
PR
C
Phi
lippi
nes
Sin
gapo
re
Sri
Lank
a
Taip
ei,C
hina
Thai
land
Uni
ted
Kin
gdom
US
A
Scor
es 2005-062004-052003-04
Source: Table 9

25
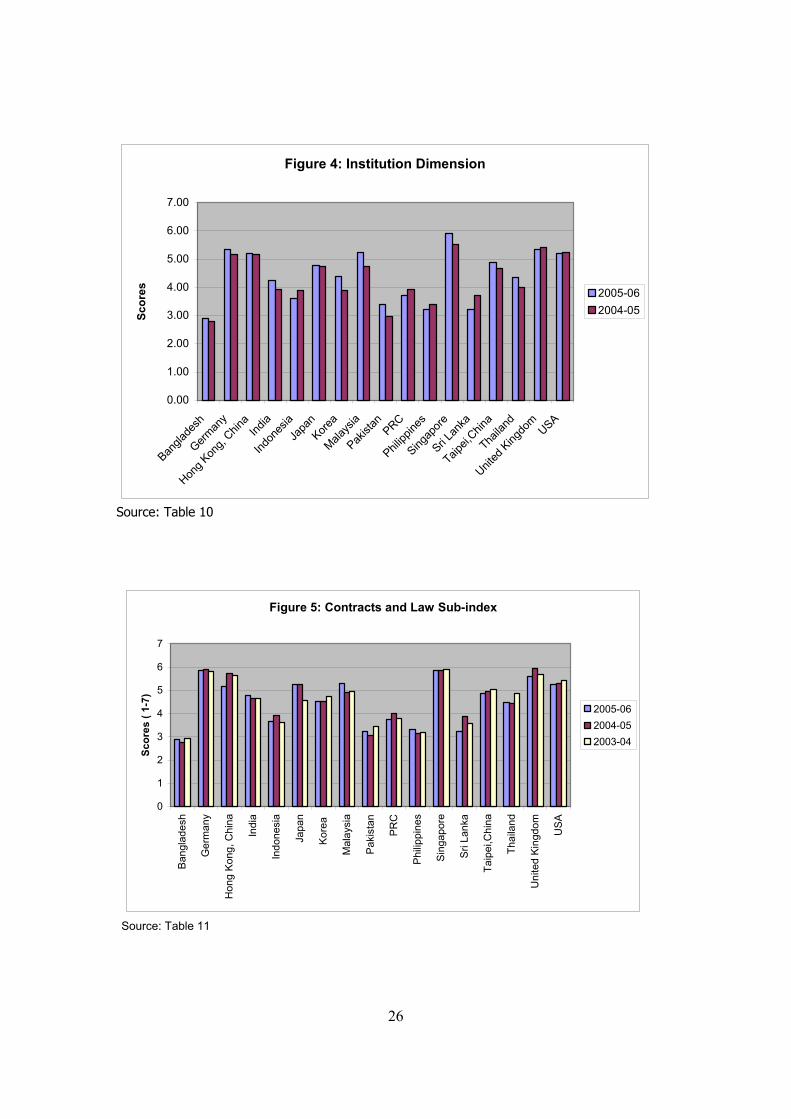
Table 9: Public Institutions, 2003-04/2005-06 2005-06 2004-05 2003-04 Average Bangladesh 2.55 2.47 2.48 2.50 Germany 6.04 6.21 6.10 6.12 Hong Kong, China 5.58 6.22 6.03 5.94 India 4.52 4.45 4.26 4.41 Indonesia 3.58 4.12 3.63 3.78 Japan 5.84 5.88 5.30 5.67 Korea, Republic of 4.78 4.81 5.03 4.87 Malaysia 5.36 5.06 5.12 5.18 Pakistan 3.31 2.87 3.67 3.28 PRC 4.41 4.39 4.33 4.38 Philippines 3.30 3.21 3.29 3.27 Singapore 6.25 6.21 6.28 6.25 Sri Lanka 3.34 4.08 3.70 3.71 Taipei,China 5.47 5.56 5.55 5.53 Thailand 4.88 4.71 4.97 4.85 United Kingdom 5.98 6.23 6.01 6.07 USA 5.77 5.74 5.71 5.74 Total No. of Countries 117 104 102 Note: Public Institutions from Growth Competitiveness Index Source: World Economic Forum, Global Competitiveness Reports, Various Years Table 10: Institutional Dimension, 2005-06 & 2004-05 Country Institution Scores Average 2005-06 2004-05 (2004-06) Bangladesh 2.90 2.80 2.85 Germany 5.33 5.15 5.24 Hong Kong, China 5.19 5.18 5.19 India 4.25 3.92 4.09 Indonesia 3.62 3.87 3.75 Japan 4.78 4.73 4.76 Korea, Republic of 4.39 3.87 4.13 Malaysia 5.22 4.74 4.98 Pakistan 3.41 2.96 3.19 PRC 3.72 3.91 3.82 Philippines 3.21 3.39 3.30 Singapore 5.92 5.53 5.73 Sri Lanka 3.22 3.7 3.46 Taipei,China 4.88 4.65 4.77 Thailand 4.35 4.01 4.18 United Kingdom 5.35 5.43 5.39 USA 5.21 5.22 5.22 Source: WEF, Global Competitiveness Reports Note: It includes both public and private Institutions
26
Figure 4: Institution Dimension
0.00
1.00
2.00
3.00
4.00
5.00
6.00
7.00
Bangla
desh
German
y
Hong K
ong,
China
India
Indon
esia
Japa
nKore
a
Malays
ia
Pakist
anPRC
Philipp
ines
Singap
ore
Sri Lan
ka
Taipei,
China
Thaila
nd
United
King
dom
USA
Scor
es 2005-062004-05
Source: Table 10
Figure 5: Contracts and Law Sub-index
0
1
2
3
4
5
6
7
Ban
glad
esh
Ger
man
y
Hon
g K
ong,
Chi
na
Indi
a
Indo
nesi
a
Japa
n
Kor
ea
Mal
aysi
a
Pak
ista
n
PR
C
Phi
lippi
nes
Sin
gapo
re
Sri
Lank
a
Taip
ei,C
hina
Thai
land
Uni
ted
Kin
gdom
US
A
Scor
es (
1-7)
2005-062004-052003-04
Source: Table 11

27
Table 11: Public Institution: Contracts and Law Sub-index, 2003-04/2005-06 2005-06 2004-05 2003-04 2002-03 Bangladesh 2.88 2.76 2.93 2.93 Germany 5.88 5.89 5.80 5.64 Hong Kong, China 5.16 5.74 5.65 5.53 India 4.78 4.67 4.65 4.48 Indonesia 3.66 3.91 3.63 2.8 Japan 5.24 5.26 4.57 4.56 Korea, Republic of 4.53 4.54 4.72 4.72 Malaysia 5.30 4.91 4.95 4.59 Pakistan 3.23 3.06 3.46 n.a. PRC 3.74 4.02 3.81 4.18 Philippines 3.32 3.16 3.20 3.14 Singapore 5.88 5.86 5.89 5.78 Sri Lanka 3.21 3.88 3.57 4.67 Taipei,China 4.88 4.95 5.03 4.61 Thailand 4.48 4.42 4.88 4.49 United Kingdom 5.62 5.96 5.67 5.85 USA 5.27 5.28 5.42 5.50 Total No. of Countries 117 104 102 80 Note: Public Institutions from Growth Competitiveness Index Source: World Economic Forum, Global Competitiveness Reports
Figure 6: Corruption Sub-index
012345678
Bang
lade
sh
Ger
man
y
Hon
g Ko
ng, C
hina
Indi
a
Indo
nesi
a
Japa
n
Kore
a
Mal
aysi
a
Paki
stan
PR
C
Philip
pine
s
Sing
apor
e
Sri L
anka
Taip
ei, C
hina
Thai
land
Uni
ted
King
dom
US
A
Scor
es (1
-7)
2005-062004-052003-04
Source: Table 12
28
Table 12: Public Institutions: Corruption Sub-index, 2003-04/2005-06 2005-06 2004-05 2003-04 2002-03 2001-02 Bangladesh 2.22 2.19 2.04 2.20 2.13 Germany 6.19 6.52 6.39 6.06 5.98 Hong Kong, China 5.99 6.70 6.42 6.24 6.38 India 4.26 4.23 3.86 3.43 3.67 Indonesia 3.49 4.32 3.64 2.99 3.35 Japan 6.44 6.50 6.04 5.97 6.29 Korea, Republic of 5.04 5.08 5.34 5.20 4.41 Malaysia 5.42 5.22 5.28 5.29 4.97 Pakistan 3.39 2.69 3.88 n.a. n.a. PRC 5.08 4.75 4.84 5.19 4.46 Philippines 3.28 3.26 3.39 3.07 3.51 Singapore 6.62 6.56 6.68 6.55 6.56 Sri Lanka 3.48 4.28 3.84 4.48 4.03 Taipei,China 6.07 6.17 6.08 5.89 5.98 Thailand 5.28 5.00 5.06 4.86 4.19 United Kingdom 6.33 6.51 6.35 6.54 6.42 USA 6.27 6.21 6.01 6.01 6.38 Total No. of Countries 117 104 102 80 75 Note: Public Institutions from Growth Competitiveness Index Source: World Economic Forum, Global Competitiveness Reports, Various Years Various Years
29
Chart -3 The elements of Public Institutions as in Global Competitiveness Reports are presents below (WEF, page 471): Public Institutions: 6.01: Judicial Independence: 6.02: Efficiency of legal framework 6.03: Property rights 6.04: Intellectual property protection 6.05: Freedom of the Press 6.06: Wastefulness of government spending 6.07: Burden of Government regulation 6.08: Favoritism in decisions of government officials 6.09: Extent of bureaucratic red tape 6.10: Effectiveness of law making Bodies 6.11: Extent and effect of taxation 6.12: Efficiency of the tax System 6.13: Centralization of economic policymaking 6.14: Reliability of Police Services 6.15: Business Costs and Crime and Violence 6.16: Organized Crime 6.17: Informal Sector 6.18: Government Effectiveness in reducing Poverty and inequality. 6.19: Irregular Payments in exports and Imports 6.20: Irregular payments in public Utilities 6.21: Irregular Payments in Tax Collection 6.22: Irregular Payments in Public Contracts 6.23: Irregular payments In Judicial Decisions 6.24: Diversion of Public Funds 6.25: Business Costs of Corruptions 6.26: Public Trusts of Politicians 6.27: Pervasiveness of money laundering through banks
30
4.3. Technology Dimension of Governance Technological readiness, information and communication technologies (ICTs) and technology transfer are sub-components of technology dimension under study in this paper. They can play an important role in enhancing both political governance and institutional governance dimensions, and can also be influenced by governance dimension. They are one of the main driving forces to improve national competitiveness, economic growth and have an impact on poverty reduction. As an example, ICT may have an impact on poverty alleviation, (i) through distance education and greater awareness efforts; (ii) due to malnutrition, unhygienic environment and lack of primary health care privileges, through telemedicine bringing health care to rural areas. We recognize that ICT dimension is more relevant to our study focusing on governance, but governance issues are there in two sub-dimensions: technology transfer and technological readiness. As stated earlier in section 3, technological readiness (considered from global competitiveness index) relates to the stock of available technology, which incorporates also information and communication technologies (ICT) of the country but not innovation (treated as separate component). ICT is seen as an umbrella term for a range of technological applications such as computer hardware and software; digital broadcast technologies; telecommunications technologies such as mobile phones as well as electronic information resources such as the world-wide web and CD_ROM (Selwyn: www.cardiff.ac.uk/socsi/ict). Technology transfer relates to the diffusion of practical knowledge from one enterprise, institution or country to another. Technology may be transferred by giving it away (eg, through technical journals or conferences); by theft (e.g. industrial espionage); or by commercial transactions (eg, patents for industrial processes) as well as through cross-national exchanges among components of multinational enterprises. (www.itcdonline.com/introduction/glossary2_q-z.html) An attempt is made to assess the current position of Bangladesh in terms of technological readiness, ICT and technology transfer. In all of the technology related indices, Bangladesh’s position is below that of its neighbors and other countries under study (Figures 7 to 9 & Tables 13 to 15). The weak public institutions have an adverse effect on country’s ICT and other technology related dimensions. This also reflects the fact that the country’s exports are produced by low level of technology (Table 16). Bangladesh obtains lowest scores on export sophistication among South Asian and East Asian countries. Its scores fall by 11 points (Table 17). The low scores indicate specialization in low technology products. It can be noted from Table 16 that the share of exports at the lowest sophistication level increases. One may point out that the country is specializing in low-level technology products. The country’s current respectable growth rate may not be sustained as per unit price of exports may decline in the long run. As mentioned in section 3, ICT component appears most prominently when all variables in governance dimensions are used together in the principal component analysis. It may be worth looking into status on ICT in Bangladesh (for detail, Background paper, Government of Bangladesh, undated).
31
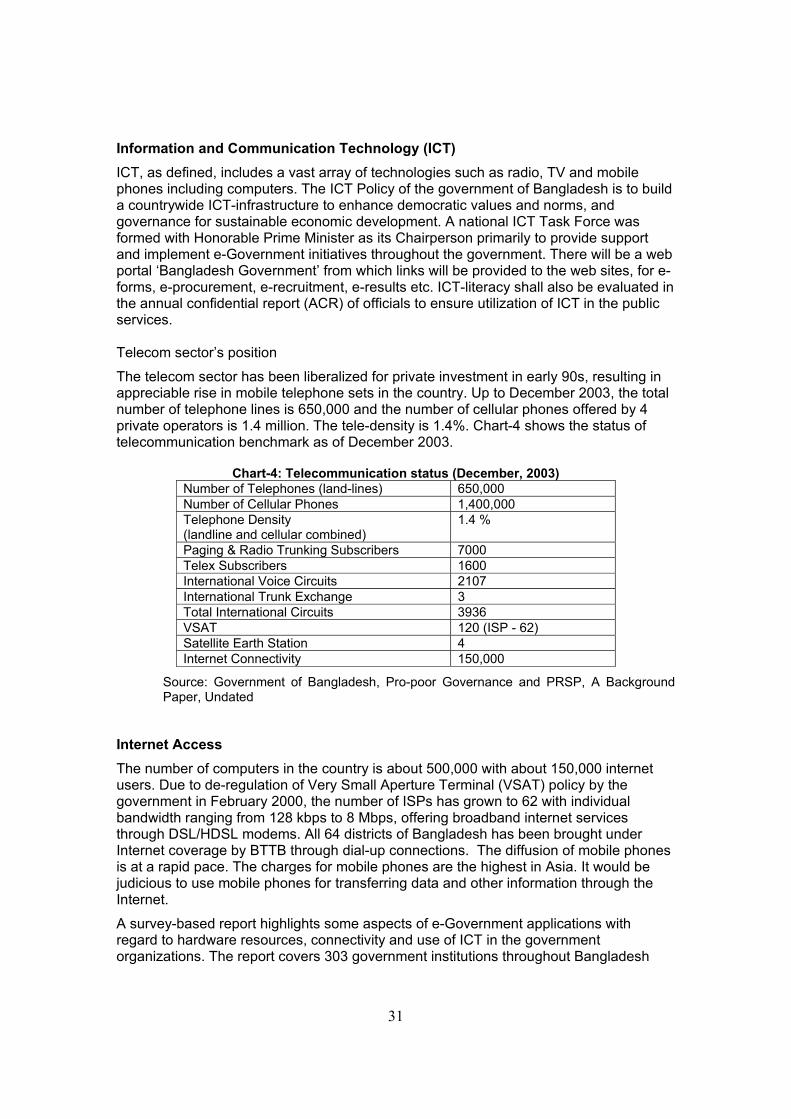
Information and Communication Technology (ICT) ICT, as defined, includes a vast array of technologies such as radio, TV and mobile phones including computers. The ICT Policy of the government of Bangladesh is to build a countrywide ICT-infrastructure to enhance democratic values and norms, and governance for sustainable economic development. A national ICT Task Force was formed with Honorable Prime Minister as its Chairperson primarily to provide support and implement e-Government initiatives throughout the government. There will be a web portal ‘Bangladesh Government’ from which links will be provided to the web sites, for e-forms, e-procurement, e-recruitment, e-results etc. ICT-literacy shall also be evaluated in the annual confidential report (ACR) of officials to ensure utilization of ICT in the public services. Telecom sector’s position The telecom sector has been liberalized for private investment in early 90s, resulting in appreciable rise in mobile telephone sets in the country. Up to December 2003, the total number of telephone lines is 650,000 and the number of cellular phones offered by 4 private operators is 1.4 million. The tele-density is 1.4%. Chart-4 shows the status of telecommunication benchmark as of December 2003.
Chart-4: Telecommunication status (December, 2003)
Number of Telephones (land-lines) 650,000 Number of Cellular Phones 1,400,000 Telephone Density (landline and cellular combined)
1.4 %
Paging & Radio Trunking Subscribers 7000 Telex Subscribers 1600 International Voice Circuits 2107 International Trunk Exchange 3 Total International Circuits 3936 VSAT 120 (ISP - 62) Satellite Earth Station 4 Internet Connectivity 150,000
Source: Government of Bangladesh, Pro-poor Governance and PRSP, A Background Paper, Undated
Internet Access The number of computers in the country is about 500,000 with about 150,000 internet users. Due to de-regulation of Very Small Aperture Terminal (VSAT) policy by the government in February 2000, the number of ISPs has grown to 62 with individual bandwidth ranging from 128 kbps to 8 Mbps, offering broadband internet services through DSL/HDSL modems. All 64 districts of Bangladesh has been brought under Internet coverage by BTTB through dial-up connections. The diffusion of mobile phones is at a rapid pace. The charges for mobile phones are the highest in Asia. It would be judicious to use mobile phones for transferring data and other information through the Internet.
A survey-based report highlights some aspects of e-Government applications with regard to hardware resources, connectivity and use of ICT in the government organizations. The report covers 303 government institutions throughout Bangladesh

32
covering a total of 35,658 officers and 103,126 staff during July to September 2003. Some of the salient findings of the report are given below:
Use of ICT
• At the Ministry/ Division level, about 31% of officers and about 33% of staff use PCs.
• At the Department/ Corporation level, about 21% of officers and about 6.49% of staff use PCs.
• In academic institutions, about 40% of officers and about 7% of staff use PCs.
• At the Ministry/ Division level, more than 88% of the offices that are connected to the Internet use it for purposes of official e-mail, about 80% for information search and more than 52% for downloading files.
• At the Department/ Corporation level, about 50% use the Internet for official e-mail purposes, about 42% for searching information and about 32% for downloading files.
• In academic institutions, about 21% use the Internet for official e-mail purposes, about 25% for searching information and about 25% for downloading files.
• At the Ministry/ Division level, a little more than 8% of the officers use e-mail directly and about 5% of the officers use e-mail through computer operators.
• At the Department/ Corporation level, on an average, 6% of officers use e-mail directly while about 6% of officers use e-mail through the help of computer operators.
• In academic institutions, 42% of the officers use e-mail directly and about 38% of the officers use e-mail through computer operators.
• Percentage of offices with websites: Ministry - 24%; Division - 50%; Department -14%; Corporation - 14%; Academic Institution - 25%.
• Percentage of offices with customized software: Ministry - 24%; Division - 60%; Department - 25%; Corporation - 41%; Academic Institution - 50%.

33
Figure 7: Technological Readiness
0
1
2
3
4
5
6
7
Bangla
desh
German
y
Hong K
ong,
China
India
Indon
esia
Japa
nKore
a
Malays
ia
Pakist
anPRC
Philipp
ines
Singap
ore
Sri Lan
ka
Taipei,
China
Thaila
nd UKUSA
Source: Table 13
Scor
es 2005-062004-05
Table 13: Technology Readiness Sub-index of Bangladesh, 2004-2006 Average techno-ready techno-ready techno-ready 2005-06 2004-05 2004-06 Bangladesh 2.31 2.23 2.27 Germany 5.11 5.09 5.10 Hong Kong, China 5.47 5.27 5.37 India 3.22 3.44 3.33 Indonesia 2.82 2.99 2.91 Japan 5.09 5.16 5.13 Korea, Republic of 5.40 5.06 5.23 Malaysia 4.51 4.13 4.32 Pakistan 2.73 2.9 2.82 PRC 3.08 3.24 3.16 Philippines 3.06 3.00 3.03 Singapore 5.82 5.22 5.52 Sri Lanka 2.61 2.71 2.66 Taipei,China 5.59 5.1 5.35 Thailand 3.50 3.48 3.49 UK 5.42 5.13 5.28 USA 5.61 5.32 5.47 Source: Global Competitiveness Report Note: Technological Index is taken from Global Competitiveness Index

34
Figure 8: ICT Sub-index
0
1
2
3
4
5
6
7
Bangla
desh
German
y
Hong K
ong,
China
India
Indon
esia
Japa
nKore
a
Malays
ia
Pakist
anPRC
Philipp
ines
Singap
ore
Sri Lan
ka
Taipei,
China
Thaila
nd UKUSA
Scor
es 2005-062004-052003-04
Source: Table 14
Table 14: ICT Sub-index Average 2005-06 2004-05 2003-04 2002-03 2003-06 Bangladesh 1.73 1.81 1.86 1.71 1.80 Germany 4.63 5.77 5.71 5.51 5.37 Hong Kong, China 5.23 6.06 5.94 5.97 5.74 India 2.33 2.84 2.87 2.38 2.68 Indonesia 2.04 2.98 2.91 2.22 2.64 Japan 4.75 5.79 5.63 5.50 5.39 Korea, Republic of 5.23 5.74 5.88 5.4 5.62 Malaysia 3.56 4.69 4.84 4.43 4.36 Pakistan 2.21 2.66 2.50 … 2.46 PRC 2.48 3.46 3.42 2.88 3.12 Philippines 2.42 3.21 3.06 2.85 2.90 Singapore 5.40 6.16 6.21 6.02 5.92 Sri Lanka 1.94 2.63 2.37 2.34 2.31 Taipei,China 5.51 6.03 6.35 5.86 5.96 Thailand 2.70 3.78 3.70 3.29 3.39 UK 4.98 5.80 6.15 5.71 5.64 USA 5.72 6.07 6.50 6.09 6.10 Note: ICT index comes from Growth Competitiveness Index Source" WER, Global Competitiveness Reports

35
Figure 9: Technology Transfer
0.00
1.00
2.00
3.00
4.00
5.00
6.00
Scor
es 2005-062004-052003-04
2005-06 4.10 5.32 4.95 5.57 4.35 4.47 5.15 4.30 5.33
2004-05 4.05 5.40 4.15 5.32 3.99 4.59 4.86 4.39 5.36
2003-04 4.14 5.31 4.09 5.69 4.58 4.57 5.22 4.89 5.38
Bangladesh India Indonesi
aMalaysi
aPakista
n PRC Philippines
SriLanka
Thailand
Source: Table 15
Table 15: Technology Transfer Score among Some Countries
2005-06 2004-05 2003-04 2002-03 Bangladesh 4.10 4.05 4.14 4.13 Germany … … … … Hong Kong, China … … … … India 5.32 5.40 5.31 5.65 Indonesia 4.95 4.15 4.09 5.09 Japan … … … … Korea, Republic of … … … … Malaysia 5.57 5.32 5.69 5.68 Pakistan 4.35 3.99 4.58 … PRC 4.47 4.59 4.57 4.70 Philippines 5.15 4.86 5.22 5.24 Singapore … … … … Sri Lanka 4.30 4.39 4.89 4.60 Taipei,China … … … … Thailand 5.33 5.36 5.38 5.52 UK … … … … USA … … … … Note: Technology Transfer Sub-Index is taken from Growth Competitiveness Index Source: WER, Global Competitiveness Reports
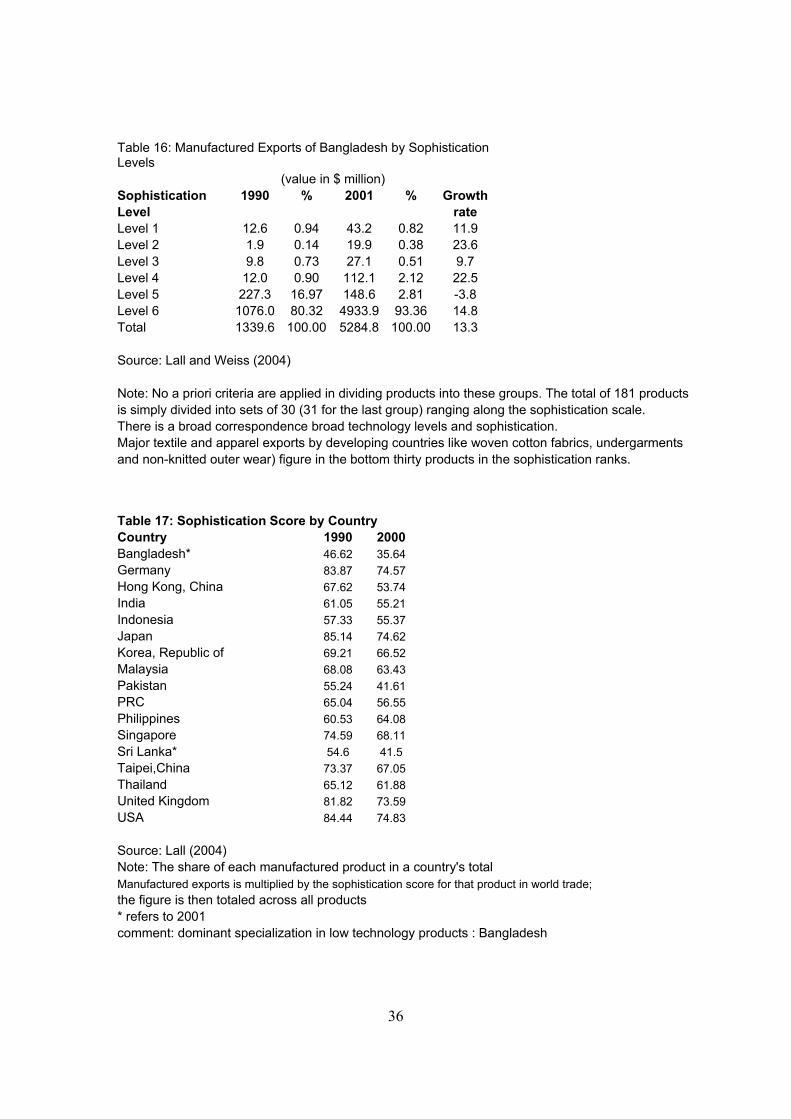
36
Table 16: Manufactured Exports of Bangladesh by Sophistication Levels (value in $ million) Sophistication 1990 % 2001 % Growth Level rate Level 1 12.6 0.94 43.2 0.82 11.9 Level 2 1.9 0.14 19.9 0.38 23.6 Level 3 9.8 0.73 27.1 0.51 9.7 Level 4 12.0 0.90 112.1 2.12 22.5 Level 5 227.3 16.97 148.6 2.81 -3.8 Level 6 1076.0 80.32 4933.9 93.36 14.8 Total 1339.6 100.00 5284.8 100.00 13.3 Source: Lall and Weiss (2004) Note: No a priori criteria are applied in dividing products into these groups. The total of 181 products is simply divided into sets of 30 (31 for the last group) ranging along the sophistication scale. There is a broad correspondence broad technology levels and sophistication. Major textile and apparel exports by developing countries like woven cotton fabrics, undergarments and non-knitted outer wear) figure in the bottom thirty products in the sophistication ranks. Table 17: Sophistication Score by Country Country 1990 2000 Bangladesh* 46.62 35.64 Germany 83.87 74.57 Hong Kong, China 67.62 53.74 India 61.05 55.21 Indonesia 57.33 55.37 Japan 85.14 74.62 Korea, Republic of 69.21 66.52 Malaysia 68.08 63.43 Pakistan 55.24 41.61 PRC 65.04 56.55 Philippines 60.53 64.08 Singapore 74.59 68.11 Sri Lanka* 54.6 41.5 Taipei,China 73.37 67.05 Thailand 65.12 61.88 United Kingdom 81.82 73.59 USA 84.44 74.83 Source: Lall (2004) Note: The share of each manufactured product in a country's total Manufactured exports is multiplied by the sophistication score for that product in world trade; the figure is then totaled across all products * refers to 2001 comment: dominant specialization in low technology products : Bangladesh

37
5. Governance and Growth: An Application to Bangladesh In the 19th century, many thought that specialization and division of labor was the engine of growth. In the 20th century, the driving force for economic growth was considered to be investment in physical capital and infrastructures. Later, human capital, technological progress (whether created by the country or copied from advanced economies) and governance are considered central determinants of economic growth (Barro 1991; 1997). The higher growth rate in least developed countries including Bangladesh would lift people out of poverty as their incomes rise and make improvements in other development dimensions such as reductions in infant mortality, longer life expectancy, increased access to water and sanitation, expanded education, reduced female discrimination and declines in child labor. Poor governance has been an important constraint on growth in Bangladesh. Traditionally, the causal relationship between governance and growth is estimated by regressions with the aid of instrumental variables. The instrumental variables are used to deal with biases caused by measurement errors, omitted variables and endogeneity. The general effect of quality of governance on the level of income is measured by one standard deviation (see Mauro 1995). There are quite a few attempts to link perceptions of governance with development outcomes to explore casual relationships across countries. Data availability in governance research for longer periods remains a great problem. As a result, broad patterns of interrelationships that affect governmental outcomes are often incorporated into explanations and research findings. Nevertheless, the empirical research over the last decade has given us some basis to gauge the effects of governance on development. The available evidence in a number of studies across countries suggests that better maintenance of the rule of law market distortions and political stability affect economic growth (Barro 1991: 1997). IMF empirical study (2003) using geographic variables as instruments, found that governance has a statistically significant impact on GDP per capita across ninety-three countries and the governance explain nearly 75 per cent of the cross country variations in income per head. Hurther and Shah study (2005, chapter 2) found that there is a high correlation between governance quality and per capita income. The positive correlation between the 10-year economic growth rate and governance quality supports the argument that it is an important determinant in economic development. Since the highest income countries have generally not had the highest growth rates over the last decade, the positive correlation between higher growth and better governance suggests that good governance improves economic performance rather than vice versa. Kaufmann et al. (2002) found direct casual effect from better governance to higher per capita income across countries pertaining to 175 countries for the period 2000/01. Negative causal effect is found as well from per capita income to governance implying that improvements in governance are unlikely to occur merely as a consequence of development. The simple correlation coefficient between per capita income and quality of governance are strongly positive since the strong positive effects of governance dominate the correlation result. Using the technique of non-sample information (out-of-sample technique) through the Unobserved Component Model, the authors do not find positive feed back from higher income to better governance outcomes (see Kaufmann and Kraay. 2002). Two hundred years ago, per capita incomes were not very different
38
across countries. The recent research attributes a substantial part of vast differences in long run growth to huge historical differences in governance quality.
Mauro (1995) constructed a subjective index of bureaucratic efficiency (proxy for corruption) as an average of three components: Efficiency of the Judiciary System, Red tape, and Corruption, to provide empirical evidence of the effects of corruption on economic growth. The indices are integers between 0 and 10 and a high value of the index meaning a better outcome. The negative association between corruption and investment, as well as growth, has been found significant in both a statistical and an economic sense in his cross-country study. A one-standard-deviation improvement in the bureaucratic efficiency (corruption) index is associated with a 1.3 (0.8) percentage point (absolute) increase in the annual growth rate of GDP per capita. For Bangladesh, a one-standard-deviation increase in the bureaucratic efficiency index corresponds to a rise of its investment rate by almost five percentage points, and its yearly GDP growth rate would rise by over half a percentage point. Rahman et al’s paper (2000) extends the pioneering work of Mauro (1995) covering data in the 1990’s (1991-97). International Country Risk Guide (ICRG) corruption index is chosen as proxy for corruption in this paper. As noted earlier, corruption is most prevalent where there are weak institutions, political governance failures and low level of ICT. Using a cross-country econometric model, this study has shown that corruption significantly reduces the growth of per capita GDP in Bangladesh, and if corruption in Bangladesh could be reduced to levels existing in economies like Poland, during the 1990-97 period, Bangladesh could have increased its annual average per capita growth rate by more than 2 percent. Over a short period of time (8 years), Bangladesh per capita GNP would have increased by 18% increase compared to the actual 1997 per capita GNP of $350. Bangladesh 2020 report (reprinted in Rahman, 2000) shows that incidence of extreme poverty would be reduced from the current 36 percent to about 11 percent by the year 2020 if the economic growth increases further by 2-3 per cent per annum. A modest attempt is made here to link gross national product per capita with the governance dimensions employing 2SLS and OLS methods. Relationship between governance dimensions and average per capita GNP is expected to be positive, as in other cross-country studies stated earlier. The recent available data are used to estimate the equations. GNP per capita is the average of two years 2003 and 2002. Each of the governance measures is highly correlated with per capita GNP across country. Both ordinary least squares and 2SLS methods are applied to estimate the casual links. Table 18 reports regression results for the relationship between GNP per capita and each of governance dimensions. The focal variables, political governance, institutional dimension, and ICT are found to be both economically and statistically significant. The direction of causality between GNP per capita and governance dimensions has remained unchanged with the application of both OLS and 2SLS methods where five year lagged values of the independent variables, human capital (secondary school enrollment is used as a proxy) and ICT are incorporated into the equation. But the coefficients of focal variables change to a certain extent when 2SLS is applied. Usually, there is no correlation between the disturbance and the lagged values (Iimi 2005). Moreover there is a strong correlation between per capita income and governance indicators. Literally speaking, if political governance improves to the level of Thailand, GNP per capita would increase by more than 3.5 USD at PPP per annum holding other things constant. Researchers tend to estimate the growth equation with or without

39
investment as an explanatory variable. In our study, using gross capital formation in the equation, the level of coefficients and direction of political governance remains unchanged as being positive and significant. Similarly, the impact of public institutions on GNP per capita has been assessed with the application of both OLS and 2SLS methods. The public institutions have been found to be significant and positive. If the quality of public institutions could be improved to the level of Malaysia, Bangladesh GNP per capita would have increased by USD 11 at PPP in one year. The coefficient of public institutions is found much higher than that of political governance (Regressions 1 to 4). The coefficient of public institutions is estimated to be .085 while that for political governance is .061. The result indicates that better public institutions will have much greater impact on the Bangladesh economy compared to other governance dimensions, although the three dimensions under study are inter-related. As mentioned in section 4.2 the performance of Bangladesh on public institutions shows a dismal picture. Judicial independence is the number one element of public institutions and Bangladesh performance is lower compared to other countries (Figure 10). It may be noted that the ICT dimension is highly significant in all the equations with political governance and public institutions variables. The separate estimation on the causal relationship of ICT with GNP per capita provides the same significant results (regressions 5 & 6). What appears is that political governance, public institutions and ICT have positive influence on GNP per capita. The three governance dimensions are assessed together by OLS method to see the extent of their effects on per capita income and the results are reported in regression 7 of Table 18. Due to application of OLS method, the estimated equation may have problems of multicolinearity and endogeneity bias. The results show that the impact of ICT seems to be greater on per capita income, followed by political governance. The un-weighted decomposition analysis among political governance, public institutions and ICT reveals public institutions as most significant (39%) followed by political dimension (35%) and ICT (26%). The Principal component Analysis identified them as principal component variables in order of similar significance. It can be safely said that the improved performance of public institutions will bring greater significant impact on overall improvement of governance dimension as well as higher growth in the economy, although they are interrelated.
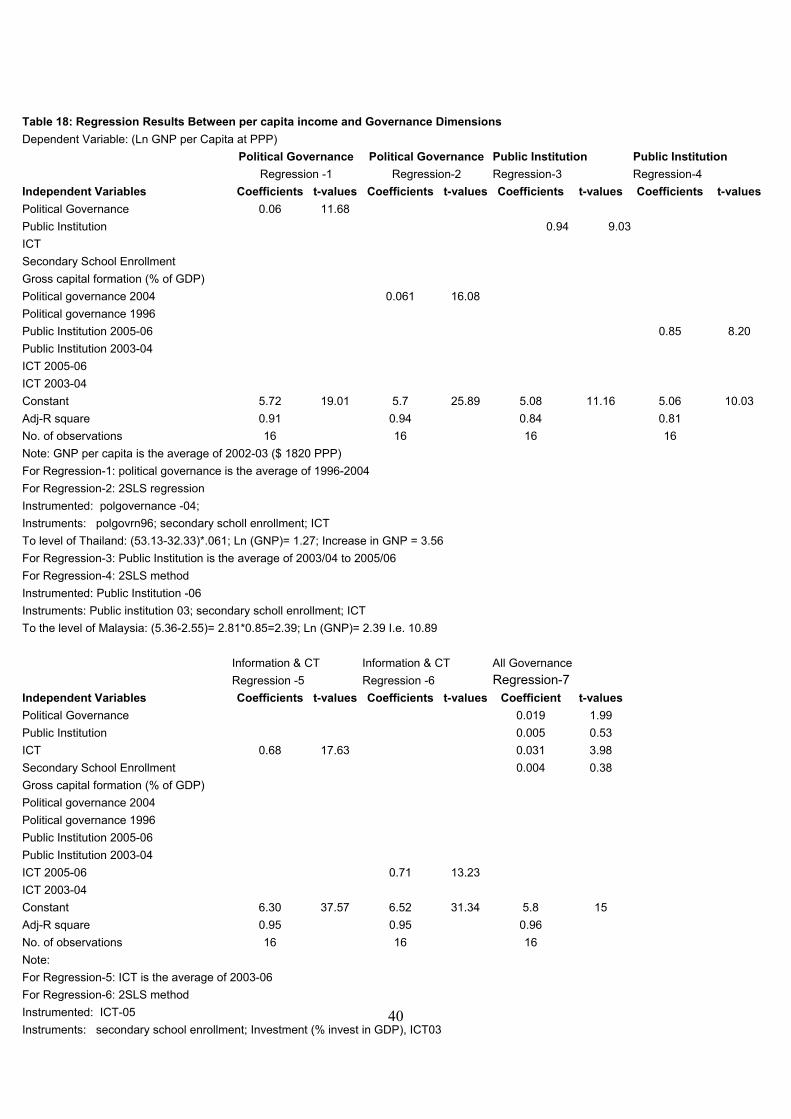
40
Table 18: Regression Results Between per capita income and Governance Dimensions Dependent Variable: (Ln GNP per Capita at PPP) Political Governance Political Governance Public Institution Public Institution Regression -1 Regression-2 Regression-3 Regression-4 Independent Variables Coefficients t-values Coefficients t-values Coefficients t-values Coefficients t-values Political Governance 0.06 11.68 Public Institution 0.94 9.03 ICT Secondary School Enrollment Gross capital formation (% of GDP) Political governance 2004 0.061 16.08 Political governance 1996 Public Institution 2005-06 0.85 8.20 Public Institution 2003-04 ICT 2005-06 ICT 2003-04 Constant 5.72 19.01 5.7 25.89 5.08 11.16 5.06 10.03 Adj-R square 0.91 0.94 0.84 0.81 No. of observations 16 16 16 16 Note: GNP per capita is the average of 2002-03 ($ 1820 PPP) For Regression-1: political governance is the average of 1996-2004 For Regression-2: 2SLS regression Instrumented: polgovernance -04; Instruments: polgovrn96; secondary scholl enrollment; ICT To level of Thailand: (53.13-32.33)*.061; Ln (GNP)= 1.27; Increase in GNP = 3.56 For Regression-3: Public Institution is the average of 2003/04 to 2005/06 For Regression-4: 2SLS method Instrumented: Public Institution -06 Instruments: Public institution 03; secondary scholl enrollment; ICT To the level of Malaysia: (5.36-2.55)= 2.81*0.85=2.39; Ln (GNP)= 2.39 I.e. 10.89 Information & CT Information & CT All Governance Regression -5 Regression -6 Regression-7 Independent Variables Coefficients t-values Coefficients t-values Coefficient t-values Political Governance 0.019 1.99 Public Institution 0.005 0.53 ICT 0.68 17.63 0.031 3.98 Secondary School Enrollment 0.004 0.38 Gross capital formation (% of GDP) Political governance 2004 Political governance 1996 Public Institution 2005-06 Public Institution 2003-04 ICT 2005-06 0.71 13.23 ICT 2003-04 Constant 6.30 37.57 6.52 31.34 5.8 15 Adj-R square 0.95 0.95 0.96 No. of observations 16 16 16 Note: For Regression-5: ICT is the average of 2003-06 For Regression-6: 2SLS method Instrumented: ICT-05 Instruments: secondary school enrollment; Investment (% invest in GDP), ICT03

41
Figure 10: Judicial Independence
0
1
2
3
4
5
6
7
Bangla
desh
German
y
Hong K
ong,
China
India
Indon
esia
Japa
nKore
a
Malays
ia
Pakist
anPRC
Philipp
ines
Singap
ore
Sri Lan
ka
Taipei,
China
Thaila
nd
United
King
dom
USA
Scor
es (
1-7)
2005-06
Source: World Economic Forum 6. Outlook: Meeting Governance Challenges First, we summarize some of the key observations. The Bangladesh experiences on governance performance reveal mixed results as outlined throughout the sections. The quality of political governance, institutional and ICT dimensions are found to remain at a low level. Per capita income is positively related to governance dimensions. Bangladesh has some success in political governance due to holding three successive national elections under caretaker government, presence of an active civil society and assertive position of Supreme Court. Alongside this many governance failures are observed, mainly due to imperfect competition and non-democratic intervention in political markets, as well as within political industry, which are not functioning in a reasonable degree of order. Governance failure contributes to high tax evasion and poor recovery of non-performing loans, at present 25 per cent of total loans. Poor ADP utilization is partly due to implementation failure, which is related to some extent with governance failures, among other reasons. The institutional problems result in corruption and poor quality of public service delivery such as education, health, issuance of passport and infrastructure (port for example). 6.1 Outlook: Political Governance The main barriers that have emerged to hinder development in political governance are to be removed to facilitate to increase in political accountability. Political governance may be developed through a process of debate and consultation. (a) Eliminate non-democratic intervention in the political markets
to achieve good national governance:
42
Rules of the game must be allowed to operate in political institutions. Bureaucracy cannot be politicized. Due to hyper-partisanship, there are persistent conflicts and animosity between main parties AL and BNP. Politics of confrontation and non-democratic interventions are to be reduced in a process of consultation. Radical Islamic Party which emerged with coordinated bomb blasts throughout the country in 2005 may be brought to justice and subsequently to normal political activity. (b) Political accountability may be increased through:
(i) Effective Parliamentary System: The parliament can not be paralyzed; and be made to play effective control over administration.
(ii) Office of the Ombudsman: The Ombudsman Act is to be enforced to play an important role for ensuring political governance.
(iii) Independent Anti-corruption Commission: Anti-corruption commission set up be the government over more than a year is to be allowed to function. This should not be just to show international organizations.
(iv) Effective media to perform vigilance functions: Distribution of government advertisements to the media should not be used to control media.
(c) To mitigate political corruption, it is suggested to introduce allocations in the national budget to reduce dependence on private financiers, and to support democratic politics (Sobhan 2004). Then it would not be necessary to correct financing irregularities in public procurement bidding (source of political corruption). 6.2 Outlook: Institutional Dimension (a) The main institutional weakness relates to poor quality of public service delivery, which generates bureaucratic corruption. Institutions lack resources to meet growing demand. Within the resource constraint, the institutions can be made more effective for efficient use of resources. In this context, a few sectors may be highlighted. (b) Independence of judiciary at all levels must be established: Law interpretation and enforcement should not be subject to government. (c) Privatization versus affordability for the poor of public service delivery: The bureaucratic corruption may be privatized through institutionalization of corruption. The poor are taking the service at a higher price. Private health care service has emerged in response to growing demand. There are problems of effective regulatory system on quality control, affordability and accountability in private health care service. In hospitals, some units may be given to the private sector on experimental basis. (d) Primary health care service may be kept under government control. Its service may be improved involving local representatives in the management. Partnership between government and NGO with encouragement from international organizations such as UNICEF and WHO have made possible reductions in infant mortality and success in child immunization program, but the pace of improvement has slowed down, and without improvement in institutional governance dimension, there would be problems in the provision of quality health service.
43
(e) In ports, wider participation of the private sector for development and operation, along with institutional/organizational reforms in the ports, may improve efficiency. (f) Restructuring management of the primary schools to include the local people, may help to improve quality education in primary education, and to increase further enrollment by targeting poor students under stipend scheme. Primary education stipend scheme provides cash assistance to poor families if they send their children to primary school. (g) Increasing the number of issuing authorities (creating competition in the market) to issue passport may reduce open corruption. (h) It may be recalled that the impact of public institutions dimension has much greater effect on per capita income and consequently on social development indicators. Emphasis needs to be given to improvement of public institutions, which may lead to improvement in other governance dimensions as they are inter-related. 6.3: Outlook: Prioritization of Governance Dimensions Governance issues provide a common link to all governance dimensions. Good political governance leads to better public institutions and improvements in technology dimensions. It is wise to take actions on all three fronts to realize the synergy. It is important to recognize that there are macro and micro level issues in each of the governance dimensions. There may be trade-offs of priorities among distinct governance actors. Politicians might give priority to those governance concerns as to increase satisfaction among their supporters; donors to efficient management and use of public resources; bureaucrats may favor technocratic solutions to those concerns which require greater social engagement; investors to those that eliminate troublesome government bureaucracies and improved security of their property; and poor people to the availability of public services and their personal security. In our study, the effect of public institutions on the economy is greater. When the question of prioritization of governance dimensions comes, emphasis is to be given on improvement of public institutions. Judicial independence at all levels may be given first priority followed by effective parliamentary system, and cooperation and dialogue between two main political parties. Then it might be possible to resolve trade-offs to a great extent, among the different actors of governance. 7. Concluding Remarks The study underscores the importance of certain governance dimensions to achieve higher development outcomes. Our results on the performance of Bangladesh for governance dimensions of political governance, institutional governance and ICT dimensions portray an unfavorable situation. Weak governance is not a conducive environment for entrepreneurs for long-term investment. Bangladesh has made improvements during the 1990s in the quality of macroeconomic management in terms of exchange rate stability, reduced inflation and balance of payments position. Improvements in macroeconomic policies and worsening governance are both observed in the Bangladesh economy. There are some governance successes at both macro and micro level: (a) in political governance, holding three successive free elections under caretaker governments, (b) making ban on the use of polythene bags, and (c) reduced

44
cheating in public examinations. From the perspective of the economy as well as investors, the improvement of governance and macroeconomic policies should not be separated. Otherwise, there will remain a risk that the country’s growth may not be increased/ sustained and the poverty problem will remain substantial for decades. To face the challenge of good governance, Bangladesh needs to formulate and effectively implement its governance policies to improve institutional governance dimension alongside political governance and technology governance dimensions, taking account of higher growth and halving poverty by 2015. The Bangladesh Poverty reduction strategy paper recognizes the challenges of governance weakness across sectors and highlights good governance as a major thrust. The reforms to improve governance need to have strong support from government, civil society, media, industrialist and the local elites. In 2006, the term of current government expires in October. It is hoped that the two main political parties in Bangladesh will undertake measures to improve the governance performance to attain higher economic growth, and to break the vicious circle of bad governance, economic growth and poverty alleviation. It may start from somewhere in the economy, perhaps in the energy sector where meter readers becomes millionaire in a short span of time.
45
References Acemoglu, Daron (2003), Root Causes, A historical approach to assessing the role of institutions in economic development, Finance & development, June. Acemoglu et al (2002), “Revesal of Fortune: Geography and Institutions in the Making of the Modern World Income Distribution”, The Quarterly Journal of Economics, November, pp 1231-1294. Acemoglu, Daron et al (2002), Institutional causes, Macroeconomic Symptoms: Volatility, Crisis and Growth, Working paper 9124, National Bureau of Economic Research. Abed, George T. and Sanjeev Gupta (2002), The Economics of Corruption: An Overview, IMF Ahmed, Sadiq (2002), The Politics of Reforms in South Asia, Bangladesh and Pakistan, South Ais Region, Internal Discussion paper, Report No. IDP – 184, October, The World Bank. Asian Development Bank (1995), Governance: Sound Development Management, August. Aron, Janine (2000), Growth and Institutions: A Review of the Evidence, The World Bank Research Observer, Vol. 15, No. 1, February , pp. 99-135 Bangladesh Bureau of Statistics (2006), Statistical Yearbook of Bangladesh-2004. Barro, Robert J. (1991), Economic Growth in a Cross Section Countries, The Quarterly Journal of Economics, May. Barro, Robert J. (1997), Determinants of Economic Growth, A Cross-Country Empirical Study, Massachusetts Institute of technology, The MIT Press, Cambridge, Massachusetts, London, England Bolaky, Bineswaree and Caroline Freund, Trade, Regulations and Growth, Conference on Trade and Growth, Research Department, Monday, International Monetary Fund Financial Express, Daily News Paper in Bangladesh, Various Issues. Felipe, Jesus and Joseph Anthony Lim (2005), Export or Domestic-led Growth in Asia? Asian Development Review, Vol. 22, No. 2, PP 35-75. Global Competitiveness report, 2003-04, Governance redux: The Empirical Challenge; Government of Bangladesh, (2004), Pro-poor Governance and PRSP: A Strategic Review of Key Concerns and Agenda for Governance Solutions, Prepared for Government of Bangladesh, A Background Paper, July (Unpublished). Government of Bangladesh (2005), Planning Commission, General Economics Division, Unlocking the Potential, National Strategy for Accelerated Poverty Reduction, October
46
Gradstein, mark, (2001), Governance and Growth, October ([email protected]) Hallward-Driemeier, Mary and David Steward (2004), How do Investment Climate Conditions vary Across Countries, Regions and Types of Firms?, Background paper prepared for the World Development Report 2005: A Better Investment Climate for Everyone Harford, Tim, “ Why Poor Countries are Poor”, 2006 Financial Times Helliwell, John F. and Haifang Huang (January 2006), How’s Your Government? International Evidence Linking Good Government and Well-Being, NBER Working paper 11988, (http://www.nber.org/papers/w11988), January Huda, Sigma (undated), Good Governance, Transparency, Accountability and Rule of Law, A Talk Huther, Jeff and Anwar Shah, A Simple Measure of Good Governance, in Public Service Delivery, Anwar Shah (edited), World bank 2005 Iimi, Atsushi and Yasuhisa Ojima (2005), Natural Resiurces, Economic Growth and Good Governance: An Empirical Note, JBIC Working Paper No. 21, June. Iimi, Atsushi (2004), Decentralization and economic growth Revisited: An Empirical Note, JBICI Working Paper No. 17, August International Monetary Fund (2003), World Economic Outlook, Growth and Institutions, World Economic and Financial Surveys, (Chapter III), April Jacob, Jeffry and Thomas Osang (2004), What matters for Economic development: Institutions, Geography and Trade – A panel Data Study Jacob, Jeffry and Thomas osang (2005), What matters for Economic Development: Institutions, geography and Trade – A panel Data Study, Department of Economics, Southern Methodist University, Dallas Jayasuriya, Ruwan and Quentin Wodon (2005), “Measuring and Explaining the Impact of Productive Efficiency on Economic Development”, The World Bank Economic Review, Vol. 19, No.1, pp 121-140, Kaufmann, Daniel, A. Kraay, and P. Zoido-Lobatón (1999), Governance Matters, World Bank Policy Research Working Paper 2196, October Kaufmann and Aart Kraay (2003), Governance and Growth: Casuality Which way? - Evidence for the World, in brief, February Kaufmann, Daniel and Aart Kraay (2002), Growth without Governance, Economica, 3(1): 169-229 Kaufmann, Daniel, Aart Kraay and Massimo Mastruzzi (2005), Governance Matters IV: Governance Indicators for 1996-2004, World Bank Policy Research Working Paper 3630 (WPS3630), The World Bank, June

47
Keefer, Philip and Stuti Khemani (2005), Democracy, Public Expenditures, and the Poor: Understanding Political Incentives for Providing Public Services, The World bank Research Observer, Vol 20, No.1, Spring Keefer, Philip and Stuti Khemani (2005), Democracy, Public Expenditures, and the Poor: Understanding Political Incentives for Providing Public Services, The World bank Research Observer, Vol 20, No.1, Spring
Lall, S. & John Weiss, (2004), Industrial Competitiveness, The Challenge for Pakistan, ADB Institute, October Lall, S., John Weiss & Jinkang Zhang (2006), The “Sophistication” of Exports: A New Trade Measure, World Development, Vol. 34, No. 2, pp 222-237 Lall, Sanjaya and John Weiss (2005), The Competitive Threat Posed by the people’s Republic of China to Latin America: An Analysis for 1990-2002, ADBI Research paper 65, April. Lall, Sanjaya, (2001), Competitiveness Indices and Developing Countries: An Economic Evaluation of the Global Competitiveness Report, World Development, Vol. 29, No. 9, pp. 1501-1525 Mahmud, Simeen (2004), Health and Population, Making Progress under Poverty, Economic and Political Weekly, September 4, Mannan, M. A. (2005), Access to Public Health Facilities: Some Observations, A Seminar Paper, Bangladesh Institute of Development Studies, May 29. Mauro, Paolo (1995), Corruption and Growth, The Quarterly Journal of Economics, August. Mauro, Paolo (1998), Corruption: causes, Consequences and Agenda for further Research, Finance and Development, March McCawley Peter (2005), Governance in Indonesia: Some Comments, ADBI Research Policy Brief No. 17, Governance, Tokyo McCawley, Peter (2004), Comments on “Democratic Governance in the Asia-Pacific”, A paper presented in the International Workshop on Asian democratic Governance, held in Tokyo, 26-27 March at United Nations University North, Douglass C., 1990, Institutions, Institutional Change and Economic Performance (New York: Cambridge University Press). North, Douglass C., 1991, “Institutions,” Journal of Economic Perspectives, Vol. 5 (Winter), pp. 97-112 Rahman, Aminur, G. Kisunko and Kapil Kapoor (2000), Estimating the Effects of Corruption, Implications for Bangladesh, Policy Research Working paper 2479, The World bank, South Asia Region, November
48
Rehman Sobhan (2004), Challenging Bangladesh’s Crisis of Governance: An Agenda for a Just Society, Conference Address, Bangladesh Economic Association, December 2004. Stein, Ernesto, et al. (2006), The Politics of Policies, David Rockfeller Center for latin American Studies, Harvard University. Svensson, Jakob, (2005), Eight Questions about Corruption, Journal of Economic Perspectives, Vol. 19, Number 3, Summer, page 19-42 Transparency International (2003), National Integrity Systems, Transparency International Country study report, Bangladesh. Transparency International-Bangladesh, (www.ti-bangladesh.org) Transparency International Bangladesh (2005), Corruption in Bangladesh: A Household Survey Weinstein, Michael A. (2006), Industrial Riots Reveal Bangladesh’s Crisis of Governance, PINR, http://www.pinr.com/report.php?ac=view_printable&report_id=500&language_id=1 Williamson, Oliver E. (2005), The Economics of Governance, AEA Papers and proceedings, Richard T. Ely Lecture, Vol. 95, No. 2, May World Bank, World Development Indicators, 2005 World Economic Forum, The Global Competitiveness Reports, Different Years, 2001-2 to 2005-2006, Palgrave, Macmillan.

49
Appendix
Appendix for Section 2:
2.1 Actors of Governance other than Government:
The other actors, in rural areas, may include influential land lords, associations of peasant farmers, cooperatives, NGOs, research institutes, religious leaders, finance institutions political parties, the military. At the national level, in addition to the above actors, media, lobbyists, international donors, multi-national corporations may play a role in decision-making or in influencing the decision-making process.
2.2 Governance Measurement:
Many believe current indicators provide poor measures of key governance processes. But there have been significant improvements in measuring governance indicators. 2.3 Ten indicators of WSJ-Heritage Index: The Wall Street Journal and the Heritage Foundation (WSJ-Heritage 1997) compiled indices of the overall economic policy environment relating to ten underlying factors, namely, the extent and severity of trade controls, the overall level of taxation and its impact of economic incentives, the extent and severity of government interventions in the economy, the appropriateness of national monetary policy and its contribution to inflation, the extent to which restrictions were placed on capital flows and their impact on foreign investment, the restrictive ness of government controls on banking, the extent of government imposed wage and price controls, the security of property rights and the degree to which they were protected by the government, the extent of government regulation of industry, and the size of black market. The WSJ-Heritage index for each of the variables takes a value from one to five with lower values indicating a policy environment more conducive to economic growth. An overall index of the quality of the national economic environment was derived from the average of the ten WSI-Heritage policy index. Appendix for Section 3: 3.1 World Bank Indices for Governance: World Bank Team led by Daniel Kaufmann (1999, 2005), conducted a pioneer study to estimate governance indices comprehensively and measured perceptions of governance based on several hundred variables for a large number of countries. A total of six dimensions of governance indicators has been constructed based on 352 individual variables taken from 37 different sources, produced by 31 different organizations (Kaufmann et. al., WB, June 2005). These are now recognized as worldwide governance indicators. The aggregate indicators are oriented as such that higher scores correspond to better governance outcomes. The six dimensions of governance indications with brief description are presented below:
1. Voice and Accountability: It measures political, civil and human rights and independence of the media. It includes the process by which those in authority are selected and replaced. It includes a number of indicators measuring various aspects of the political process, civil liberties and political rights. It measures the
50
extent to which citizens of a country are able to participate in the selection of government.
2. Political Instability and violence: It measures perceptions of the likelihood that the government in power will be destabilized or overthrown by possibly unconstitutional or violent means, including terrorism. It has not only a direct effect on the continuity of policies, but also undermines the ability of all citizens to peacefully select and replace those in power.
3. Government Effectiveness: measuring the competence of the bureaucracy and the quality of public service delivery, independence of civil service from political pressure to be able to produce and implement policies and deliver public goods. (To provide efficient and effective public services.)
4. Regulatory Quality: measuring the incidence of market-unfriendly policies such as price controls or inadequate bank supervision, as well as perceptions of the burdens imposed by excessive regulation in areas such as foreign trade and business development.
5. Rule of Law: measuring the quality of contract enforcement, the police, and the courts, as well as the likelihood of crime and violence. The environment in which fair and predictable rules form the basis for economic and social interactions.
6. Control of corruption: measuring the exercise of public power for private gain, including both petty and grand corruption and state picture.
The method used to calculate each sub index gives it approximately a unit normal distribution, with an increase always meaning better outcomes. These measures are based on unobserved components model that aggregates over 300 indicators, ranging from ratings by country experts to survey results. A significance advantage of the aggregation method (such as the UCL) is that the model can estimate margins of error and the margins of error is reduced significantly to a half when information relies on five or more sources. Some of the components that comprise the index include policy factors. More important, given the subjective nature of the underlying polls and surveys, it is possible that the respondents’ answers to questions are influenced by their perception of policies. The measurement challenges continue to remain, and one has to take caution in interpreting the results in terms of ranking. But the margins of errors have declined over the years, and are now substantially lower. As a result, these governance indicators are used worldwide for monitoring performance, country assessment, and research. In the very long run, there is a strong casual impact of institutional quality on per capita incomes worldwide. These estimates suggest that a realistic one-standard –deviation improvement in governance would raise incomes in the long run by about two-to-threefold. Such improvement in governance by one standard deviation is feasible, since it is only a fraction of the difference between the worst and best performers. A few empirical studies consider the average of six governance indicators to capture institutional quality, while few others classify the governance indicators into the political, economic, and institutional dimensions of governance with two indicators in each group.
• Political Dimension: Voice and accountability and Political instability and violence • Economic Dimension: Government Effectiveness and Regulatory burden • Institutional respect dimensions: Rule of Law and Control of corruption
51
3.2 Competitiveness as Complimentary to Governance: The concept of competitiveness remains multifaceted and always needs simplification and judgment. Competitiveness is used in the literature in different ways. A country’s real exchange rate (i.e. relative price and/ or cost indices expressed in some common currency) is used to assess external competitiveness. Intuitively, it is defined as a country’s share of world market for its products. This makes world economy a zero sum game because one country gains at the expense of others. The productivity of the entire economy matters for the standard of living, not just the traded sector. Many nations can improve their prosperity if they can improve productivity. That is why, World Economic Forum (WEF) uses a broader definition of ‘Competitiveness’ that links to the concept of productivity. It is stated as “We think of competitiveness as that collection of factors, policies, and institutions which determine the level of productivity of a country and that, therefore, determine the level of prosperity that can be attained by an economy” (page 3, chapter 1.1, Global Competitiveness Report, 2005-2006). If the assumptions of Hecksher-Ohlin model are relaxed to allow for greater realism with respect to such as scale economies, differentiated products, technological gaps, uncertainty, large firm with market power etc., trade become a non-zero sum game, where all parties gain from trade specialization. The country has to achieve competitive capabilities (competitiveness) to realize that benefits. Competitiveness indices can be used to benchmark national performance and to evaluate the shortcomings of their economies. The methodology to estimate competitiveness index was first developed in 2001 by Jeffrey Sachs and John McArthur and the index is called the Growth Competitiveness Index. There is an improvement in the methodology in the construction of competitiveness index over the years since Jeffrey Sachs and John McArthur developed in 2001. Since then, the World Economic Forum has been publishing (i) Growth Competitiveness Index (GCI) which refers to the aggregate or macroeconomic determinants of productivity, (ii) Business Competitiveness Index (BCI) captures the microeconomic components of productivity. There is another difference between the BCI and GCI. BCI captures the “static” or “level” determinants of productivity of a country, while the GCI is supposed to capture its “dynamic” or “growth”. WEF followed a unified approach 2004-05 that captures both the microeconomic and macroeconomic foundations of competitiveness in a single index, called Global Competitiveness Index. The ability of firms to prosper depends, among other things, on the efficiency of the public institutions, the excellence of the education system, and the overall macroeconomic stability of the country in which they operate. On the other hand, an excellent macro environment does not guarantee national prosperity unless firms create valuable goods and services using efficient methods and processes at the microeconomic level. The Global CI uses a combination of hard data (e.g. university enrollment rates, inflation performance, the state of the public finances, the level of penetration of new technologies such as mobile telephones and the internet) and data drawn from the World Economic Forum’s Executive opinion Survey. World Bank data on corruption, regulatory quality, and the rule of law overlap with some of the areas covered in the competitiveness survey. The correlation between WEF’s competitiveness indicators and the World Bank data are high.

52
We see that there are two types of indices available in the World Economic Forum’s GCR reports: one is Growth Competitiveness Index and the other is “The Global Competitiveness index. The main components of Growth Competitiveness index are: Technology index, public institutions index and Macro-environment index. Global Competitiveness Index consists of also three components built on nine pillars of competitiveness, each of which is critical to productivity and competitiveness in national economies, and the three components are: Basic requirements index, Efficiency enhancers index, and Innovation and sophistication factor index. The indices of Global competitiveness index are composed into sub-indexes as follows: Basic requirements sub index (stage 1: factor-driven)
• Institution (pillar 1) • Infrastructure (pillar 2) • Macro economy (pillar 3) • Health and basic education (pillar 4)
Efficiency enhancers sub index (stage 2: efficiency driven) • Higher education and training (pillar 5) • Market efficiency (pillar 6) • Technology readiness (pillar 7)
Innovation and sophistication factor sub index (stage 3: innovation-driven)
• Business sophistication (pillar 8) • Innovation (pillar 9)
It is observed that institution sub-index exists in both Growth and Global Competitiveness indexes, which are of more relevant to our Governance concept. The nine pillars and stages of development are defined in the section appendix.
3.3 Nine pillars in Global Competitiveness Index (WEF, 2005-06):
Pillar 1: Institution: Lack of transparency in government operations and evidence of corruptions undermine business confidence and lead to misallocation of resources hindering economic growth and competitiveness.
Pillar 2: Infrastructure: Effective modes of transport for goods, people and services such as rail roads, ports, and air transport in a cost-effective manner facilitates growth.
Pillar 3: Macro-economy: Macroeconomic stability such as inflation, budget constraint etc. are ingredients of sustainable growth.
Pillar 4: Health and Primary Education: A healthy workforce and basic education increases the efficiency of each individual worker making the economy more competitiveness and productive.
Pillar 5: Higher Education and Training: Quantity and quality of higher education within an economy are critical for competitiveness for production, R & D, marketing and management, and for technological adaptation in a fast changing globalizing economy. On the job training has become an important of upgrading an economy’s human resources.

53
Pillar 6: Market Efficiency: Market efficiency of various factor markets such as goods market, labor markets and financial markets are crucial for underlying productivity and competitiveness. Labor market efficiency: Flexibility of labor market is a leading determinant of competitiveness. Financial market efficiency: Allocation of resources saved by nation’s citizens to its most productive uses.
Pillar 7: Technological Readiness: Benefit from new technologies and availability of technologies help to sustain rates of growth and productivity.
Pillar 8: Business Sophistication: Quality of individual firm’s operations and strategies Pillar 9: Innovation: capacity to generate new technologies internally and endogenous generation of knowledge and new products. 3.4 Stages of Development and transitions: Stages of Development are set out as follows (WEF, 2005-06):
• Stage 1: Income of less than US $ 2000 • Transition from 1 to 2: Income $ 2000- $ 3000 • Stage 2: Income $ 3000 - $ 9000 • Stage 2 to 3: Income $ 9000 – 17000 • Stage 3: Income more than $ 17000
Economic development is a dynamic process of successive improvement in which economies find increasingly sophisticated ways of producing and competing. In other words, the process of economic development evolves stages. In the most basic stage, called the factor-driven stage, firms compete in price. In the second stage, which we call the efficiency-driven stage, efficient production practices (quality of products) become the main source of competitiveness. Finally in the third stage, which we call innovation-driven stage, successful economies can no longer compete in price or even quality. It is more important for advanced countries than for economies in the early stages of development. 3.5 Principal Component Analysis Principal component analysis (PCA) involves a mathematical procedure that transforms a number of (possibly) correlated variables into a (smaller) number of uncorrelated variables called principal components. The first principal component accounts for as much of the variability in the data as possible, and each succeeding component accounts for as much of the remaining variability as possible. (http://www.fon.hum.uva.nl/praat/manual/Principal_component_analysis.html) 3.6 Global Competitiveness: As reported in World Economic Forum (WEF), Global competitiveness index (Glob-comp) is an improved version of Growth Competitiveness index (Gr-comp), constructed incorporating both macro and micro level data and some elements of governance dimensions. Information on Global competitiveness index is available only for two years.
54
As can be seen in section 2, it has three components: basic requirements, efficiency requirements and innovation. 3.7 Growth Competitiveness: World Economic Forum provides information on Growth Competitiveness index (Gr-comp) pertaining to the period of five years from 2001/02 to 2005/2006. The elements of Growth competitiveness indices are technology, public institution and macroeconomic environment index. Each component of growth competitiveness index has two or more sub-indices. Technology components comprise of three sub-indices: technology sub-index (innovation), ICT sub-index and technology transfer sub-index, while public institution index has two sub-components such as contracts and law sub-index and corruption sub-index, built on twenty seven related activities. Macroeconomic environment index consists of three sub-indices: macroeconomic stability index, government waste and country credit rating. Principal component analysis is applied to identify the components in order of significance. 3.8 Country Competitiveness and Sophistication Index: Recently, Sanjaya Lall and John Weiss (2006) advocate sophistication index to use for country’s competitiveness analysis (page 236) to judge whether a country is gaining or losing competitiveness in goods. An export is more sophisticated the higher the average income of its exporter. A simple comparison of the sophistication index scores with the technology classification suggests a broad link between them. There is no attempt to examine the causal relationship between sophistication index and economic growth. All components of governance and competitiveness are also relevant for export competitiveness. From the governance point of view, export competitiveness may relate particularly with economic governance. Out of six dimensions in governance indicators, two dimensions, Government competitiveness and Regulatory are referred to as economic dimensions of governance indicators. We will bring sophistication index in our analysis. Appendix for Section 4: For Section 4.2: Institutions are defined extensively in the literature. At one end, the notion of institution is to establish the “rules of the game. North defined it as “the formal and informal constraints on political, economic, and social interactions” (North’s, 1990, reprinted in IMF 2003). From this perspective, “good” institutions are viewed as establishing an incentive structure that reduces uncertainty and promotes efficiency – hence contributing to stronger economic performance. Institutions are also defined as the “humanly devised constraints that structure human interactions”. In that context, the institutional hypothesis is about human influences. According to this view, some societies have good institutions that encourage investment in machinery, human capital, and better technologies, and consequently, achieve economic prosperity (Acemoglu et al, 2003). The interaction between institutions and the opportunity to industrialize during the nineteenth century played a central role in the long run development. A country’s institution may be deeply rooted in its history and culture. Acemoglu et al (2001) argued that current institutions are basically manifestations of past institutions, which prevailed over time. But current institutions significantly affect development.

55
For Section 4.3: Technology refers to the body of know-how about the means and methods of producing goods and services. Modern technology is increasingly science-based, but also includes methods of organization as well as physical technique. The application of new technologies, particularly computers and software applications, has been a major factor driving productivity growth in recent decades. www.smartstate.qld.gov.au/strategy/strategy05_15/glossary.shtm

56
Appendix Table 1 Growth Rate of GDP by Sectors 1991/92- 1994/95- 1997/98- 2000/01-Name of Sub-Sector 1994/95 97/98 00/01 2003/04 Agriculture and Forestry -0.43 3.06 5.22 2.33 Crops and Horticulture -1.4 3.05 5.78 1.55 Animal farming 2.42 2.58 2.75 4.73 Fishing 7.73 7.99 4.55 2.55 Manufacturing 11.69 6.66 4.87 6.44 Large and Medium Scale 12.17 6.29 5.02 6.03 Small Scale 10.52 7.6 4.49 7.45 Construction 8.26 8.88 8.68 8.32 Wholesale and Retail Trade 5.51 5.34 6.74 6.42 Hotel and Restaurants 4.98 5.48 6.86 6.99 Transport, Storage and Communications 3.99 5.45 6.63 6.54 Other services 3.7 4.11 4.09 5.33 GDP at constant market price 4.53 5.08 5.36 5.31 Note: GDP at constant market price of 1995/96 in Tk. Source: Statistical Yearbook of Bangladesh, 2004 Monthly Statistical Bulletin Bangladesh, May 2005

57
Appendix Table 2: Sectoral Share (percentages) in GDP Name of Sub-Sector 1991/92 1994/95 1997/98 2000/01 2003/04 Agriculture and Forestry 23.13 20.00 18.87 18.80 17.24 Crops and Horticulture 17.67 14.83 13.99 14.16 12.70 Animal farming 3.50 3.29 3.06 2.84 2.79 Fishing 4.57 5.01 5.44 5.31 4.90 Manufacturing 11.93 14.56 15.23 15.02 15.51 Large and Medium Scale 8.46 10.46 10.83 10.72 10.94 Small Scale 3.47 4.10 4.40 4.30 4.56 Construction 5.74 6.38 7.09 7.79 8.47 Wholesale and Retail Trade 12.05 12.39 12.49 12.99 13.40 Hotel and Restaurants 0.58 0.59 0.59 0.62 0.65 Transport and Communications 8.80 8.66 8.76 9.08 9.40 Other services 33.20 32.42 31.53 30.41 30.43 GDP at constant market price 100.00 100.00 100.00 100.00 100.00 Note: GDP at constant market price of 1995/96 in Tk. Source: Statistical Yearbook of Bangladesh, 2004 Monthly Statistical Bulletin Bangladesh, May 2005