“government does not create jobs; it only creates
DESCRIPTION
“Government does not create jobs; it only creates the conditions that make jobs more or less likely.” Governor Mitchell E. Daniels, Jr. State of the State Address, January 18, 2005. Indiana Economic Development Corporation. - PowerPoint PPT PresentationTRANSCRIPT

04/19/2023
“Government does not create jobs; it only createsthe conditions that make jobs more or less likely.”
Governor Mitchell E. Daniels, Jr.State of the State Address, January 18, 2005

INDIANA ECONOMIC DEVELOPMENT CORPORATION
• The IEDC is a public-private partnership governed by a 12 member board chaired by Governor Mitch Daniels.
• The IEDC is focused exclusively on economic development and has incorporated all state entities with economic development responsibilities.
04/19/2023 2

2011 BUSINESS
DEVELOPMENT REGIONAL
MAP
04/19/2023 Confidential - Draft 3

BUILDING THE ‘BEST SANDBOX’
• AAA Credit Rating
• Financial Stability
• Indiana has the lowest business costs in the Midwest and is one of the top 10 lowest cost locations in the U.S.
– Forbes (Oct. 2010).
• Leading the Nation in Job Growth– Per capita Indiana was 7th in the nation in private sector job growth for
2010
04/19/2023

Executives Rank Indiana Best
A Midwest leader and 16th nationallyBest and Worst States for Business 2010Survey of more than 650 chief executives

CNBC Names IndianaTop State for Business
• Fourth nationally for overall “business friendliness”
04/19/2023

10TH LOWEST BUSINESS COSTS
Source: Forbes magazine, October 2010
Indiana has the 10th lowest business costs in the nation, based on labor, energy and taxes.

October, 2010
1st in the Midwest and 10th nationally Illinois (23rd), Kentucky (19th), Michigan (17th), Ohio(46th)
Best in Midwest for Low Taxes

2010 IN REVIEW• Record Breaking Year
– 200 Projects– 23,017 Projected Job Commitments– $23.02 Projected Average Wage– $4.38 Billion in Projected Capital Investment
04/19/2023

Private Sector Job Projections Year-to-Date
• As of 5/23/11
4,981
9,378
6,301 7,027
6,416
8,442 8,460
-
1,000
2,000
3,000
4,000
5,000
6,000
7,000
8,000
9,000
10,000
2005 2006 2007 2008 2009 2010 2011

Private Sector Investment Projections Year-to-Date
• As of 5/23/11

Total Competitive Projects Year-to-Date
• As of 5/23/11

Hoosier Average Wage
• As of 5/23/11

• Direct state incentives include tax credits, training grants and infrastructure assistance
• Tax credits are performance-based linked to IEDC certification of new jobs• Average time of return on investment: approximately 2 years
Low Cost of Incentives Yields Quicker Return
04/19/2023
2004 2005 2006 2007 2008 2009 2010 2011$0
$5,000
$10,000
$15,000
$20,000
$25,000
$30,000
$35,000
$40,000 $37,652
$11,699 $11,805$8,469 $7,278
$8,701 $9,981 $10,396
• As of 5/23/11

BUSINESS INCENTIVES
• EDGE – Tax Credit for hiring; competitive project.
• HBI – Tax Credit for investment; competitive project.
• SEF – Training Grant; competitive and non-competitive projects.
• IDGF – Community Grant; competitive project.
2011 LEGISLATIVE SUMMARY
• Balanced Budget• Corporate Income Tax Reduction
Reduced over 4 years from 8.5% to 6.5%, beginning in 2012.
• No New Taxes

REASONS FOR SUCCESS
• Assembled experienced economic development team
• Streamlined processes• MARKETABLE PRODUCT
04/19/2023
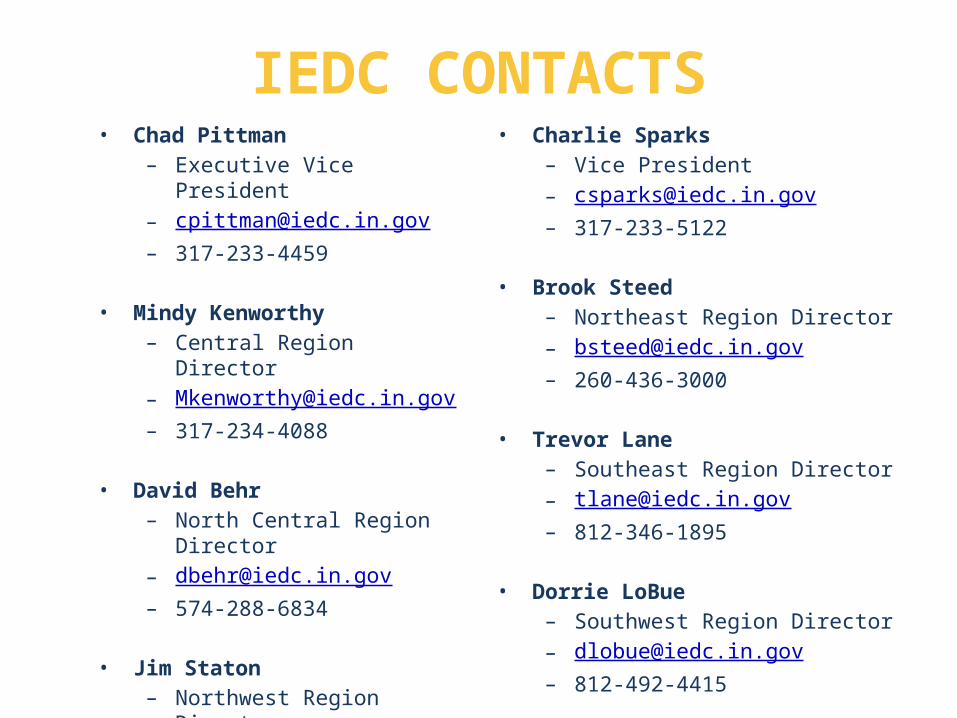
IEDC CONTACTS• Chad Pittman
– Executive Vice President– [email protected]– 317-233-4459
• Mindy Kenworthy– Central Region Director– [email protected]– 317-234-4088
• David Behr– North Central Region Director– [email protected]– 574-288-6834
• Jim Staton– Northwest Region Director– [email protected]– 219-644-3694
• Charlie Sparks – Vice President – [email protected]– 317-233-5122
• Brook Steed– Northeast Region Director– [email protected]– 260-436-3000
• Trevor Lane– Southeast Region Director– [email protected]– 812-346-1895
• Dorrie LoBue– Southwest Region Director– [email protected]– 812-492-4415