government evidence to the low pay commission on the economic
TRANSCRIPT
Government evidence to the Low Pay Commission on the economic effects of the National Minimum Wage
JANUARY 2011

Government economic evidence to the Low Pay Commission, December 2010
2
Contents Executive summary..........................................................................................3
1. Macroeconomic conditions and outlook .......................................................6
2. Evidence on pay ........................................................................................12
3. Impact of the NMW on the labour market ..................................................20
4. Groups identified in the LPC remit .............................................................27
5. Other issues...............................................................................................38
Annex A: International comparison of Minimum Wage rates .........................40
Annex B: Beneficiaries of the 2010 NMW uprating by sex and region ...........41
Annex C: Review of minimum wage research ...............................................42
Annex D: Technical note................................................................................47
Government economic evidence to the Low Pay Commission, December 2010
3
Executive summary The Government welcomes this opportunity to present the Low Pay Commission (LPC) with economic evidence on the National Minimum Wage (NMW) in the LPC’s fourteenth year of operation. This document forms the second half of the Government’s annual submission, covering the economic effects of the NMW. It should be read in conjunction with the previous Government submission on the non-economic evidence.1 The coalition agreement emphasizes the Government’s support for the National Minimum Wage because of the protection it gives low income workers and the incentives to work it provides. The NMW sets a floor for wages in the labour market and the Government closely monitors the evidence of its labour market and wider economic impacts. The main findings of the Government’s assessment on the economic evidence are set out below. Macroeconomic conditions and outlook In the period from the introduction of the NMW in 1999 to 2007, the UK labour market has performed strongly, with the level of employment increasing by around 2.4 million in the nine years to the end of 2007. However, the UK has recently experienced the deepest recession in the post war period. GDP fell for six consecutive quarters, a total decline of 6.5 per cent. Recently there have been signs that a domestic recovery is well underway and GDP has now grown for four consecutive quarters. Although the falls in employment have been smaller than the two previous recessions the effects of the economic downturn are still being felt in the UK labour market. The labour market has reacted flexibly and shown resilience; partly reflecting the effectiveness of regulatory and welfare to work policies. Evidence on pay The last four annual adult NMW upratings have been in-line with average earnings growth. This followed increases in the adult NMW in 2001, 2003 and 2004 which were substantially above average earnings growth. Over the last year (1st October to 1st October) the adult NMW has increased in nominal terms by around 2.2 per cent. This reflects a real rise of 0.2 per cent, when deflated by earnings but a real fall of 2.4 per cent when compared to retail prices. The figure for earnings growth is currently 2.0 per cent over the last year. The NMW as a percentage of the median wage – known as the ‘bite’ - is now around 50.9 per cent, an increase of around five percentage points since 1999. As the NMW has risen, an increasing proportion of the working population are earning wages at or near the statutory minimum. We estimate
1 http://www.bis.gov.uk/assets/biscore/employment-matters/docs/n/10-1153-national-minimum-wage-non-economic-evidence-2010.pdf

Government economic evidence to the Low Pay Commission, December 2010
4
that around 1,080,000 individuals were covered by the October 2010 NMW uprating2. Impact of the NMW on the labour market Empirical studies from the UK have not shown significant evidence that the adult NMW has reduced employment. However, most of the evidence focuses on a period in which there was a growing labour market. The evidence base, both in the UK and internationally, of the possible impact of minimum wages in an economic downturn has only started to emerge. Although there has been an absolute increase there has been a slight decline in the relative share of UK employment in low-paying sectors since 1999 which represents a trend that predates the introduction of the NMW. There have been major revisions to the Office for National Statistics (ONS) data on employee jobs (see Annex D) and therefore changes in the definition of low paid sectors. This has impacted on the analysis of employee job growth. The latest ONS employee jobs data shows that, over the recession period, employment in the (newly constructed) low paid sectors fell by 4.0 per cent compared to 3.5 per cent for the economy as a whole. Last year the data suggested that low paid sectors may be hit less hard than other sectors during the recession. The revisions to the standard industrial classification codes have led to a change in this trend. Over the year to Q2 2009 employee jobs in both the low paying sectors and the whole economy fell by 1.3 per cent. Groups identified in LPC remit Younger workers have been hit hard by the economic downturn, with significant falls in the employment rates of 16-17 year olds and 18-20 year olds. Recent data suggests prospects are improving, but there is still some uncertainty over future outlook. The Government is committed to establishing apprenticeships as a key route to building the national skills base, working with employers to help young people and adults get the skills and qualifications valued by employers. Following the introduction of the hourly £2.50 apprenticeship minimum wage there are important supply and demand side issues that need consideration when reviewing the apprenticeship minimum wage. In order to encourage supply to apprenticeship schemes, an apprentice minimum wage needs to be set at a level which provides appropriate incentives for individuals to participate in schemes. However, too high an increase in the apprentice minimum wage will lead to higher wage costs for employers and this could dissuade employers from providing employment for apprentices. The Government’s main concern over the apprentice minimum wage is in respect of young people because of their vulnerable labour market position. The NMW bite is higher for small firms (59.5 per cent) than for medium or large firms. Also, the proportion of employees earning at or below the NMW is substantially higher for small firms than large firms.
2 See Annex D for further coverage statistics and methodology.
Government economic evidence to the Low Pay Commission, December 2010
5
Younger workers in particular 16-17 year olds and those on apprenticeships as well as small firms are more likely to be affected by NMW upratings. In combination with a high bite for small firms and an increasing bite and coverage of the NMW over time, it is even more important that all the available evidence is considered on the effect on employment when setting the National Minimum Wage rates. Other groups and issues From October 1st 2010, 21 year olds were moved onto the adult NMW rate of £5.93 per hour. BIS estimate that around 90,000 21 year olds were affected by this change3. Using data from the Annual Survey of Hours and Earnings combined with assumptions on how wages would have evolved in the absence of a change in the NMW, BIS estimate that the wage bill for employers will increase by around £42m and that there will be an increase of £6m in non-wage labour costs. In total we estimate (for a one year period only) that labour costs for employers will increase by £48m. From the 1st January 2011 the NMW regulations were amended such that expenses paid to a worker for travel to a temporary workplace, as defined for tax and National Insurance Contributions purposes, will not count towards their NMW pay. HM Treasury prepared a final impact assessment which was published in July 20104. HM Treasury estimate that amending the NMW regulations helps to protect the contributory benefit position of around 90,000 low paid workers.
3 http://www.legislation.gov.uk/uksi/2010/1901/pdfs/uksiem_20101901_en.pdf 4 http://www.hm-treasury.gov.uk/d/consult_minimumwage_expenses_responses.pdf
Government economic evidence to the Low Pay Commission, December 2010
6
1. Macroeconomic conditions and outlook In the period from the introduction of the NMW in 1999 to 2007, the UK labour market has performed strongly, with the level of employment increasing by around 2.4 million in the nine years to the end of 2007. However, the UK has recently experienced the deepest recession in the post war period. GDP fell for six consecutive quarters, a total decline of 6.5 per cent. Recently there have been signs that a domestic recovery is well underway and GDP has now grown for four consecutive quarters. Although the falls in employment have been smaller than the two previous recessions the effects of the economic downturn are still being felt in the UK labour market. The labour market has reacted flexibly and shown resilience; partly reflecting the effectiveness of regulatory and welfare to work policies. Economic growth The global economy is in the early stage of recovery after the most severe and synchronized contraction in 60 years. The UK experienced the deepest recession in the post war period. The UK entered recession in the second quarter of 2008 and remained in recession for six quarters. GDP declined by 6.5 per cent during the recession. In the previous two recessions it has taken around three years for output to reach pre-recession level However, recent ONS data has shown that there are signs that the domestic recovery is well underway. The ONS confirmed that 2010 Q2 growth was 1.2 per cent and the preliminary estimate for 2010 Q3 growth was 0.8 per cent. Domestic demand made positive contributions to growth in both quarters. Outlook The Office for Budget Responsibility (OBR) economic outlook November 2010; forecasts GDP to grow by 1.8 per cent over the year in 2010, an improvement on the interim OBR’s June forecast, reflecting higher than anticipated GDP growth in the second and third quarters of the year. In contrast, the OBR has lowered its expectation for annual GDP growth for 2011 and 2012. In 2011 annual GDP is expected to grow by 2.1% - revised down from previous forecast of 2.3%. In 2012 annual GDP growth was also revised down by 0.2 percentage points to 2.6%. The relatively sluggish medium-term outlook reflects the gradual normalization of credit conditions, efforts to reduce private sector indebtedness and the impact of the Government’s fiscal consolidation.
Government economic evidence to the Low Pay Commission, December 2010
7
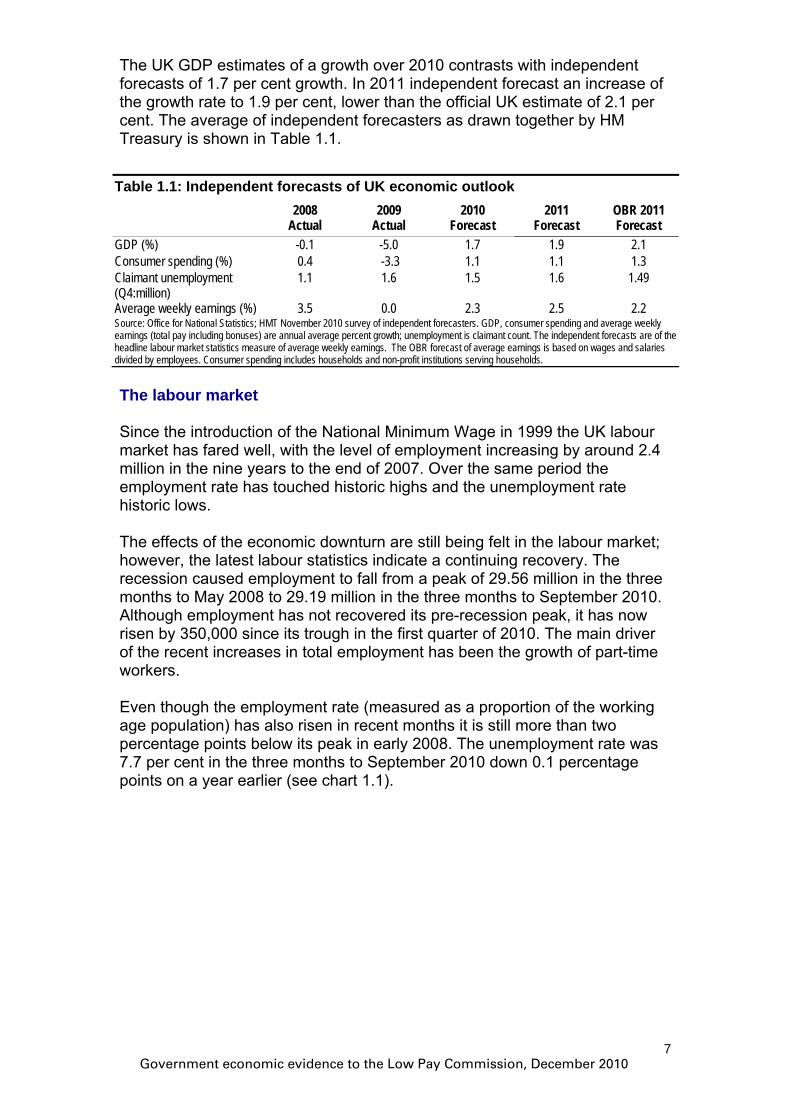
The UK GDP estimates of a growth over 2010 contrasts with independent forecasts of 1.7 per cent growth. In 2011 independent forecast an increase of the growth rate to 1.9 per cent, lower than the official UK estimate of 2.1 per cent. The average of independent forecasters as drawn together by HM Treasury is shown in Table 1.1.
Table 1.1: Independent forecasts of UK economic outlook 2008
Actual 2009
Actual 2010
Forecast 2011
Forecast OBR 2011 Forecast
GDP (%) -0.1 -5.0 1.7 1.9 2.1 Consumer spending (%) 0.4 -3.3 1.1 1.1 1.3 Claimant unemployment (Q4:million)
1.1 1.6 1.5 1.6 1.49
Average weekly earnings (%) 3.5 0.0 2.3 2.5 2.2 Source: Office for National Statistics; HMT November 2010 survey of independent forecasters. GDP, consumer spending and average weekly earnings (total pay including bonuses) are annual average percent growth; unemployment is claimant count. The independent forecasts are of the headline labour market statistics measure of average weekly earnings. The OBR forecast of average earnings is based on wages and salaries divided by employees. Consumer spending includes households and non-profit institutions serving households.
The labour market Since the introduction of the National Minimum Wage in 1999 the UK labour market has fared well, with the level of employment increasing by around 2.4 million in the nine years to the end of 2007. Over the same period the employment rate has touched historic highs and the unemployment rate historic lows. The effects of the economic downturn are still being felt in the labour market; however, the latest labour statistics indicate a continuing recovery. The recession caused employment to fall from a peak of 29.56 million in the three months to May 2008 to 29.19 million in the three months to September 2010. Although employment has not recovered its pre-recession peak, it has now risen by 350,000 since its trough in the first quarter of 2010. The main driver of the recent increases in total employment has been the growth of part-time workers. Even though the employment rate (measured as a proportion of the working age population) has also risen in recent months it is still more than two percentage points below its peak in early 2008. The unemployment rate was 7.7 per cent in the three months to September 2010 down 0.1 percentage points on a year earlier (see chart 1.1).

Chart 1.1: UK labour market
65%66%67%68%69%70%71%72%73%74%75%76%77%78%79%80%
1991
Jan
1992
Jan
1993
Jan
1994
Jan
1995
Jan
1996
Jan
1997
Jan
1998
Jan
1999
Jan
2000
Jan
2001
Jan
2002
Jan
2003
Jan
2004
Jan
2005
Jan
2006
Jan
2007
Jan
2008
Jan
2009
Jan
2010
Jan
Emplo
ymen
t rate
3%
4%
5%
6%
7%
8%
9%
10%
11%
12%
Unem
ploym
ent r
ate
Employment rate (LHS)
Unemployment rate (RHS)
Source: Office for National Statistics, Monthly data, Labour Market Statistics. Employment rate is a proportion of working age. Unemployment rate is a proportion of all aged 16 and over.
The labour market has shown greater resilience in the recent recession than was anticipated by many commentators and also relative to past UK recessions. The recent recession lasted for six quarters and GDP fell by 6.5 per cent – a larger decline in output than in either the early-1980s or early-1990s recessions (Table 1.2). Comparing the contraction of total employment in these recessions illustrates the resilience of the labour market. Over the course of the current recession total employment declined by 600,000. This compares to a decline of 619,000 in total employment over the course of the 1980s recession and a reduction of 910,000 over the course of the 1990’s recession. For each 1 per cent decline in output employment fell by less than a third of 1 per cent in the 2008-09 recession. In the early-1990s recession employment fell by more than 1⅓ per cent for each 1 per cent decline in output. Therefore, given the significant fall in GDP the UK labour market has proven to be relatively tough.
Table 1.2: Fall in output and employment in recessions Percentage change in recession1
1980s 1990s 2008-09 Gross domestic product -5.9 -2.5 -6.5 LFS employment -2.0 -3.4 -2.0 Source: Office for National Statistics. 1 The percentage change is taken from the quarter in which output peaked to the last quarter in which output declined. For the current recession, the change is from 2008 Q1 to the latest data point: 2009 Q3.
Government economic evidence to the Low Pay Commission, December 2010
8

A key reason for the resilience of the labour market is its diversity and dynamism, thereby allowing firms to adjust to the recession in a number of ways. Whilst there has been some degree of reduction in hours and some nominal wage moderation, there is some evidence to suggest that the UK’s liberal regulatory regime and factors such as welfare to work policies, have contributed more towards this good employment performance. Outflow rates from the claimant unemployment count have remained high and so the build-up of long term claimant unemployment has been relatively subdued. The composition of the labour market has changed throughout this current recession. The number of part-time workers has increased significantly since the start of 2008 and still continues to do so. In the three months to September 2010 the number of part-time workers reached an all time high of 7.98 million (since comparable records began in 1992), up from 7.5 million prior to the recent recession. Although part-time work has grown strongly during the recent recession, a significant proportion of workers have taken this as a second choice to a full- time role, but in preference to unemployment. In the three months to September 2010 there were 1.15 million people working part-time because they could not find a full time job. This is the highest figure since comparable records began in 1992. The claimant count fell by 164,000 between October 2009 and July this year, before rising marginally in both August and September. However, the claimant count fell by 3,700 in October 2010, and remains more than 160,000 below its peak late last year. Claimant count outflows rose sharply during the current recession. The number of claimants leaving the claimant count has increased from 206,000 in 2008 Q2 to 340,100 in 2009 Q4. In the three most recent quarters claimant count outflows have eased back a little to 325,600 in 2010 Q3.
Chart 1.2 Standardised Inflows and outflows of claimant unemployment Thousands
160180200220240260280300320340360380400420
1989
Nov
1990
Nov
1991
Nov
1992
Nov
1993
Nov
1994
Nov
1995
Nov
1996
Nov
1997
Nov
1998
Nov
1999
Nov
2000
Nov
2001
Nov
2002
Nov
2003
Nov
2004
Nov
2005
Nov
2006
Nov
2007
Nov
2008
Nov
2009
Nov
Numb
er of
peop
le
Claimant count inflowsClaimant count outflows
Source: Office for National Statistics, Labour Market Statistics, Monthly data
Government economic evidence to the Low Pay Commission, December 2010
9

Government economic evidence to the Low Pay Commission, December 2010
10
Outlook Over the coming five years, the OBR expects total employment to rise from 29.0 million in 2010 to 30.1 million in 2015, an increase of 3½ per cent. The OBR forecast is for a rise in market sector employment of around 1.5 million, partially offset by a fall in general government employment of just over 400,000 between 2010-11 and 2015-16. Over the near term, the OBR forecast that the ILO unemployment rate will pick up slightly, as GDP growth slows in 2011, peaking at 8.1 per cent before falling back again from 2012. In line with this, the OBR also expect the claimant count to pick up over the near term, before falling back again from 2012. Independent forecasters expect the claimant count to rise slightly in 2011 to 1.6 million, the same level as 2009 (see table 1.1). Average weekly earnings The Office for National Statistics has replaced the Average Earnings Index as the lead measure of short term changes in average earnings with the Average Weekly Earnings (AWE) statistic. AWE is a measure of the level of average earnings per job, derived by separately weighting the earnings and employment data for the sampled businesses in each month and then calculating the ratio. Average weekly earnings (including bonuses) growth on a year earlier has fluctuated significantly since the start of 2008 (see Table 1.3). Whole economy AWE grew by more than 3 per cent in 2008, before slowing markedly in 2009. AWE annual growth has picked up and by the three months to September 2010 whole economy AWE growth (including bonuses) was 2.0 per cent on a year earlier, but remains well below the growth rate seen in 2008. Private sector earnings growth slowed relatively more through 2008 and 2009 than earnings growth in the public sector5. The level of the private sector AWE actually fell in 2009, primarily due to substantial falls in the level of bonus payments at the start of the year. Private sector AWE annual growthas picked up gradually through the first three quarters of 2010, to stand at 1.8 per cent in the three months to September. Public sector AWE has been steady since early 2008, but annual growth has slowed to 1.9 per cent in thethree months to September 2010, in part reflecting the public sector pay freeze announced at the June Budget for all workers earning more than
h
21,000.
bonuses
proximates more closely to the 'pure’ arnings growth effect in regular pay.
£ Wages contribution of AWE excluding bonuses and arrears are less volatile than those including bonuses. In 2008, wages contribution grew by 4.0% but slowed sharply in 2009 to 2.4 per cent, and has remained largely unchanged in the first half of 2010. The wage component of the AWE excludinghas been used in order to exclude the effects both of bonuses and employment changes. It, therefore, ape
5 Public sector excluding financial services.
Government economic evidence to the Low Pay Commission, December 2010
11
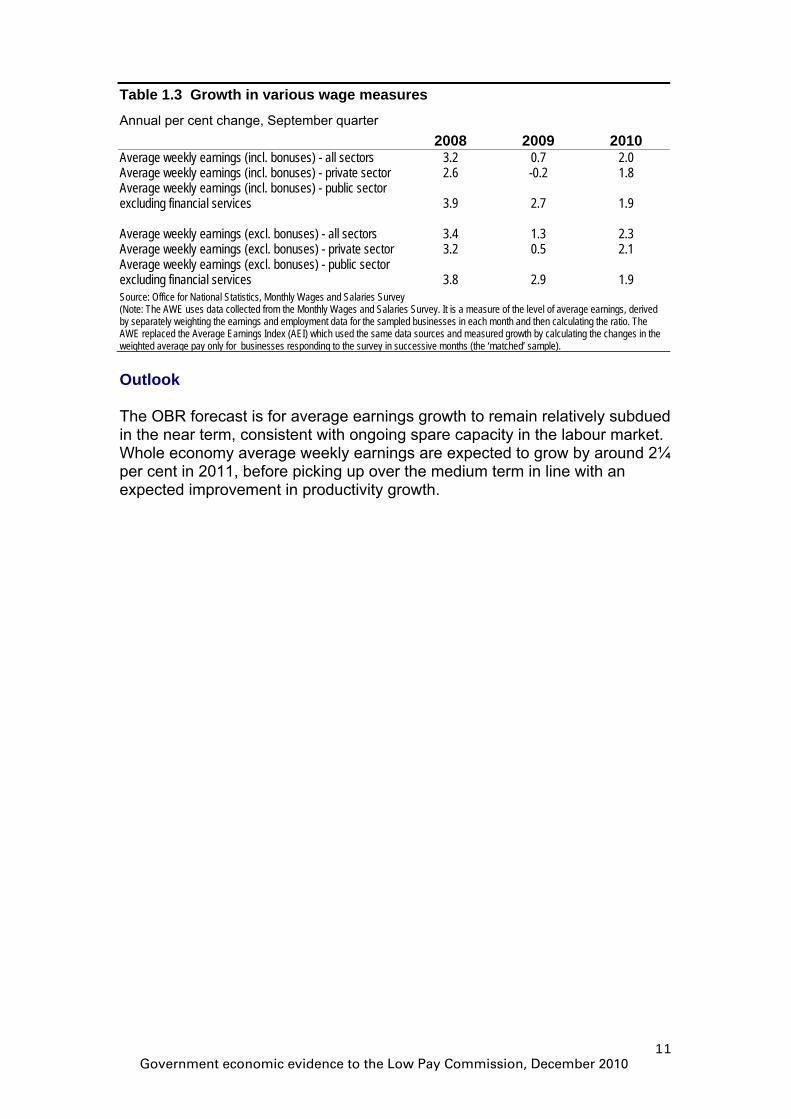
Table 1.3 Growth in various wage measures
Annual per cent change, September quarter 2008 2009 2010
Average weekly earnings (incl. bonuses) - all sectors 3.2 0.7 2.0 Average weekly earnings (incl. bonuses) - private sector Average weekly earnings (inc
2.6 -0.2 l. bonuses) - public sector
xcluding financial services 3.9 2.7 1.9
cl. bonuses) - public sector
ating the changes in the i
1.8
e Average weekly earnings (excl. bonuses) - all sectors 3.4 1.3 2.3 Average weekly earnings (excl. bonuses) - private sector Average weekly earnings (ex
3.2 0.5 2.1
excluding financial services 3.8 2.9 1.9 Source: Office for National Statistics, Monthly Wages and Salaries Survey (Note: The AWE uses data collected from the Monthly Wages and Salaries Survey. It is a measure of the level of average earnings, derived by separately weighting the earnings and employment data for the sampled businesses in each month and then calculating the ratio. The
WE replaced the Average Earnings Index (AEI) which used the same data sources and measured growth by calculAwe ghted average pay only for businesses responding to the survey in successive months (the ‘matched’ sample). Outlook
d 2¼ dium term in line with an
pected improvement in productivity growth.
The OBR forecast is for average earnings growth to remain relatively subduedin the near term, consistent with ongoing spare capacity in the labour market. Whole economy average weekly earnings are expected to grow by arounper cent in 2011, before picking up over the meex
Government economic evidence to the Low Pay Commission, December 2010
12
2. Evidence on pay The last four annual adult NMW upratings have been in-line with average earnings growth. This followed increases in the adult NMW in 2001, 2003 and 2004 which were substantially above average earnings growth. Over the last year (1st October to 1st October) the adult NMW has increased in nominal terms by around 2.2 per cent. This reflects a real rise of 0.2 per cent, when deflated by earnings but a real fall of 2.4 per cent when compared to retail prices. The figure for earnings growth is currently 2.0 per cent over the last year. The NMW as a percentage of the median wage – known as the ‘bite’ - is now around 50.9 per cent, an increase of around five percentage points since 1999. As the NMW has risen, an increasing proportion of the working population are earning wages at or near the statutory minimum. We estimate that around 1,080,000 individuals were covered by the October 2010 NMW uprating6
. Growth in the NMW The NMW has increased substantially faster than both average earnings and prices, especially since 2001. Since it was introduced in April 1999 the adult NMW has risen by around 65 per cent. In comparison, Average Weekly Earnings (total pay including bonuses)7 has risen by only around 52 per cent (see Chart 2.1) between April 1999 and the end of August 2010. The Retail Price Index (RPI) has increased by around 36 per cent, and the CPI rose by around 24 per cent both between April 1999 and September 2010. The October 2010 NMW rise of 2.2 per cent was higher than the latest annual average total pay (including bonuses) growth of around 2.0 per cent8 and in line with annual average regular pay (excluding bonuses) growth of 2.2 per cent. Chart 2.1 shows that average weekly earnings (total pay including bonuses) fell sharply at the beginning of 2009 largely due to falls in bonuses in the finance sector. However, almost a year later, average weekly earnings rose sharply in April 2010.
6 See Annex D for further coverage statistics and methodology. 7 Note changes in ASHE data does not just reflect changes in NMW as, for example, it includes bonuses. 8 This is Average Weekly Earnings growth, total pay including bonuses – three months to September 2010 compared to the three months to September 2009 (series KAC3).
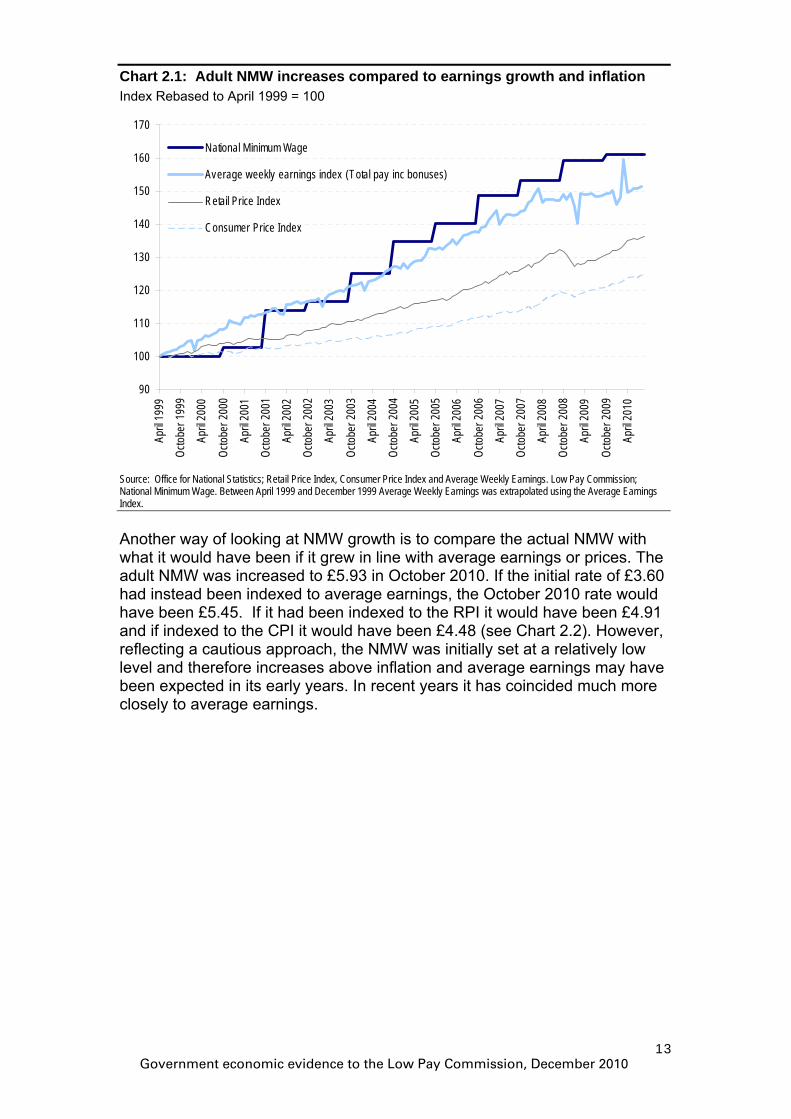
Chart 2.1: Adult NMW increases compared to earnings growth and inflation Index Rebased to April 1999 = 100
90
100
110
120
130
140
150
160
170
April
1999
Octob
er 19
99
April
2000
Octob
er 20
00
April
2001
Octob
er 20
01
April
2002
Octob
er 20
02
April
2003
Octob
er 20
03
April
2004
Octob
er 20
04
April
2005
Octob
er 20
05
April
2006
Octob
er 20
06
April
2007
Octob
er 20
07
April
2008
Octob
er 20
08
April
2009
Octob
er 20
09
April
2010
National Minimum Wage
Average weekly earnings index (Total pay inc bonuses)
Retail Price Index
Consumer Price Index
Source: Office for National Statistics; Retail Price Index, Consumer Price Index and Average Weekly Earnings. Low Pay Commission; National Minimum Wage. Between April 1999 and December 1999 Average Weekly Earnings was extrapolated using the Average Earnings Index.
Another way of looking at NMW growth is to compare the actual NMW with what it would have been if it grew in line with average earnings or prices. The adult NMW was increased to £5.93 in October 2010. If the initial rate of £3.60 had instead been indexed to average earnings, the October 2010 rate would have been £5.45. If it had been indexed to the RPI it would have been £4.91 and if indexed to the CPI it would have been £4.48 (see Chart 2.2). However, reflecting a cautious approach, the NMW was initially set at a relatively low level and therefore increases above inflation and average earnings may have been expected in its early years. In recent years it has coincided much more closely to average earnings.
Government economic evidence to the Low Pay Commission, December 2010
13
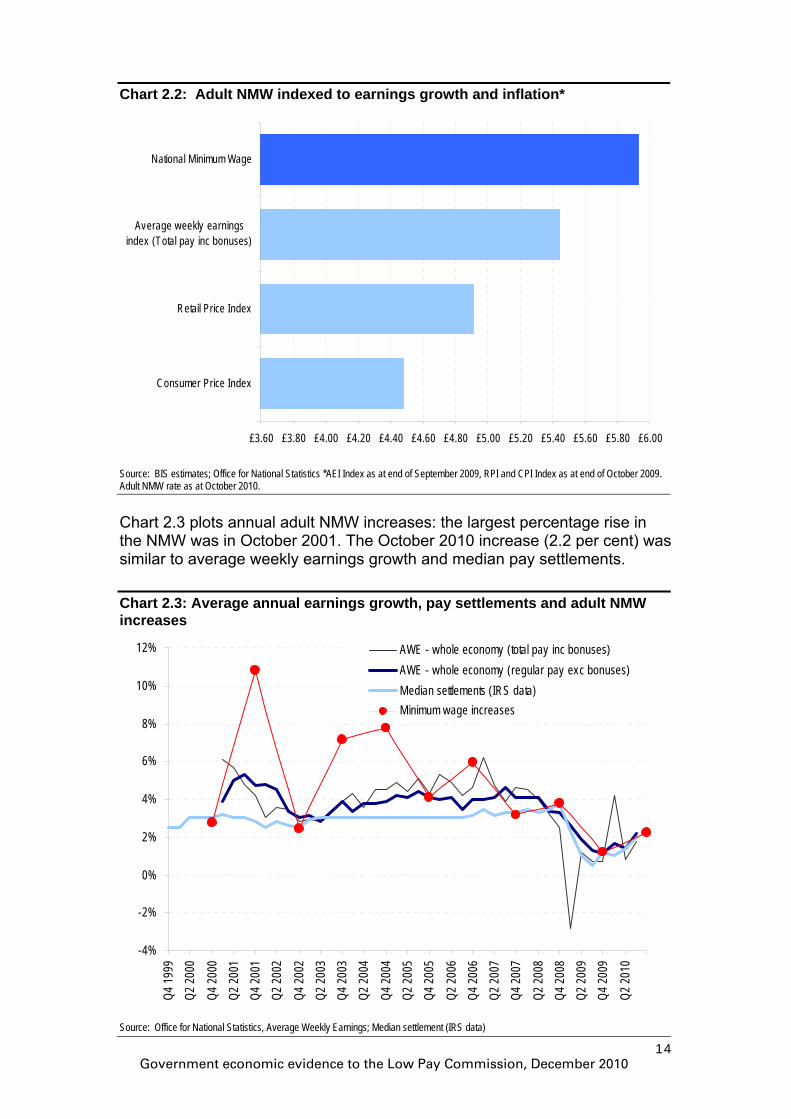
Chart 2.2: Adult NMW indexed to earnings growth and inflation*
£3.60 £3.80 £4.00 £4.20 £4.40 £4.60 £4.80 £5.00 £5.20 £5.40 £5.60 £5.80 £6.00
Consumer Price Index
Retail Price Index
Average weekly earningsindex (Total pay inc bonuses)
National Minimum Wage
Source: BIS estimates; Office for National Statistics *AEI Index as at end of September 2009, RPI and CPI Index as at end of October 2009. Adult NMW rate as at October 2010.
Chart 2.3 plots annual adult NMW increases: the largest percentage rise in the NMW was in October 2001. The October 2010 increase (2.2 per cent) was similar to average weekly earnings growth and median pay settlements.
Chart 2.3: Average annual earnings growth, pay settlements and adult NMW increases
-4%
-2%
0%
2%
4%
6%
8%
10%
12%
Q4 19
99Q2
2000
Q4 20
00Q2
2001
Q4 20
01Q2
2002
Q4 20
02Q2
2003
Q4 20
03Q2
2004
Q4 20
04Q2
2005
Q4 20
05
Q2 20
06Q4
2006
Q2 20
07Q4
2007
Q2 20
08Q4
2008
Q2 20
09Q4
2009
Q2 20
10
AWE - whole economy (total pay inc bonuses)AWE - whole economy (regular pay exc bonuses)Median settlements (IRS data)Minimum wage increases
Source: Office for National Statistics, Average Weekly Earnings; Median settlement (IRS data)
Government economic evidence to the Low Pay Commission, December 2010
14
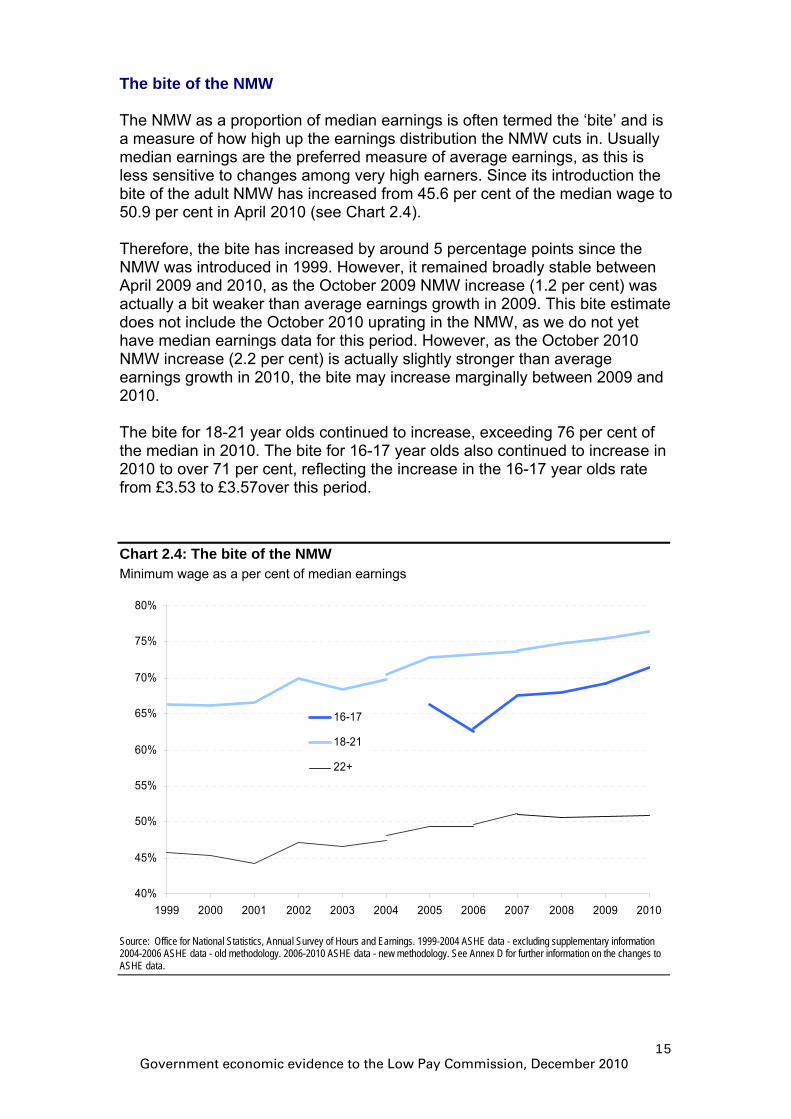
The bite of the NMW The NMW as a proportion of median earnings is often termed the ‘bite’ and is a measure of how high up the earnings distribution the NMW cuts in. Usually median earnings are the preferred measure of average earnings, as this is less sensitive to changes among very high earners. Since its introduction the bite of the adult NMW has increased from 45.6 per cent of the median wage to 50.9 per cent in April 2010 (see Chart 2.4). Therefore, the bite has increased by around 5 percentage points since the NMW was introduced in 1999. However, it remained broadly stable between April 2009 and 2010, as the October 2009 NMW increase (1.2 per cent) was actually a bit weaker than average earnings growth in 2009. This bite estimate does not include the October 2010 uprating in the NMW, as we do not yet have median earnings data for this period. However, as the October 2010 NMW increase (2.2 per cent) is actually slightly stronger than average earnings growth in 2010, the bite may increase marginally between 2009 and 2010. The bite for 18-21 year olds continued to increase, exceeding 76 per cent of the median in 2010. The bite for 16-17 year olds also continued to increase in 2010 to over 71 per cent, reflecting the increase in the 16-17 year olds rate from £3.53 to £3.57over this period.
Chart 2.4: The bite of the NMW Minimum wage as a per cent of median earnings
40%
45%
50%
55%
60%
65%
70%
75%
80%
1999 2000 2001 2002 2003 2004 2005 2006 2007 2008 2009 2010
16-17
18-21
22+
Source: Office for National Statistics, Annual Survey of Hours and Earnings. 1999-2004 ASHE data - excluding supplementary information 2004-2006 ASHE data - old methodology. 2006-2010 ASHE data - new methodology. See Annex D for further information on the changes to ASHE data.
Government economic evidence to the Low Pay Commission, December 2010
15
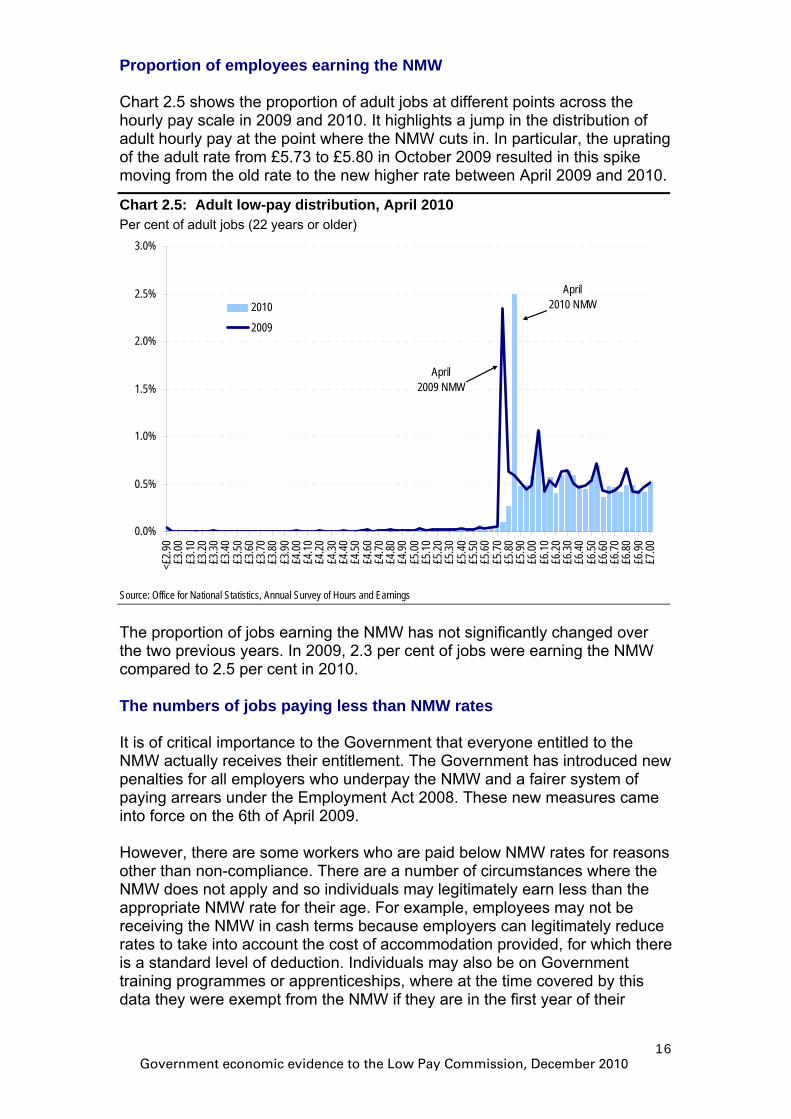
Proportion of employees earning the NMW Chart 2.5 shows the proportion of adult jobs at different points across the hourly pay scale in 2009 and 2010. It highlights a jump in the distribution of adult hourly pay at the point where the NMW cuts in. In particular, the uprating of the adult rate from £5.73 to £5.80 in October 2009 resulted in this spike moving from the old rate to the new higher rate between April 2009 and 2010.
Chart 2.5: Adult low-pay distribution, April 2010 Per cent of adult jobs (22 years or older)
April2010 NMW
April 2009 NMW
0.0%
0.5%
1.0%
1.5%
2.0%
2.5%
3.0%
<£2.9
0£3
.00£3
.10£3
.20£3
.30£3
.40£3
.50£3
.60£3
.70£3
.80£3
.90£4
.00£4
.10£4
.20£4
.30£4
.40£4
.50£4
.60£4
.70£4
.80£4
.90£5
.00£5
.10£5
.20£5
.30£5
.40£5
.50£5
.60£5
.70£5
.80£5
.90£6
.00£6
.10£6
.20£6
.30£6
.40£6
.50£6
.60£6
.70£6
.80£6
.90£7
.00
2010
2009
Source: Office for National Statistics, Annual Survey of Hours and Earnings
The proportion of jobs earning the NMW has not significantly changed over the two previous years. In 2009, 2.3 per cent of jobs were earning the NMW compared to 2.5 per cent in 2010. The numbers of jobs paying less than NMW rates It is of critical importance to the Government that everyone entitled to the NMW actually receives their entitlement. The Government has introduced new penalties for all employers who underpay the NMW and a fairer system of paying arrears under the Employment Act 2008. These new measures came into force on the 6th of April 2009. However, there are some workers who are paid below NMW rates for reasons other than non-compliance. There are a number of circumstances where the NMW does not apply and so individuals may legitimately earn less than the appropriate NMW rate for their age. For example, employees may not be receiving the NMW in cash terms because employers can legitimately reduce rates to take into account the cost of accommodation provided, for which there is a standard level of deduction. Individuals may also be on Government training programmes or apprenticeships, where at the time covered by this data they were exempt from the NMW if they are in the first year of their
Government economic evidence to the Low Pay Commission, December 2010
16

Government economic evidence to the Low Pay Commission, December 2010
17
apprenticeship. (This changed in October 2010 when the Apprentice Minimum Wage was introduced at £2.50/hour). According to the latest Office for National Statistics (ONS) estimates of low pay based on data from the new Annual Survey of Hours and Earnings (ASHE) in spring 2010, there were 271,000 jobs held by people aged 16 or over paying less than the appropriate NMW rate. This is equivalent to 1.1 per cent of all UK jobs. This comprised of 15,000 jobs held by 16-17 year olds, 48,000 jobs held by 18-21 year olds and 207,000 jobs held by those 22 and older. Table 2.1 provides more details of the proportion of jobs paid at hourly wage rates less than the prevailing NMW rate. It should be noted that these estimates are approximate, and subject to revision. Between 1998 (before the introduction of the NMW) and 2010, the number of jobs held by part-time workers earning below the NMW rate fell from 14.1 per cent of part-time jobs to 1.8 per cent. This compares with a decline in the number of jobs held by full-time workers earning below the NMW rates from 2.4 per cent in 1998 to 0.8 per cent in 2010.
Table 2.1. Proportion of UK jobs paid below minimum wage 1998* 2000 2002** 2004 2006 2008 2010 All (18+) 5.6 1 1.4 1.1 All (16+)*** 1.2 1.1 1.1 All 16-17 3.8 3.9 5.4 All 18-21 7.2 2.2 2.7 2.3 2.3 2.6 2.9 All 22+ 5.4 0.9 1.3 1 1.0 0.9 0.9 All men 2.9 0.6 0.8 0.9 0.9 0.8 0.9 All women 8.4 1.3 2 1.4 1.4 1.4 1.2 Men full-time 1.8 0.3 0.5 0.7 0.7 0.7 0.8 part-time 14.4 4 4.4 2.5 2.4 1.3 1.6 Women full-time 3.6 - 0.7 0.8 0.9 1.1 0.8 part-time 14.1 2.3 3.6 2.1 2.2 1.9 1.8 All full-time 2.4 0.4 0.5 0.8 0.8 0.8 0.8 All part-time 14.1 2.6 3.7 2.2 2.2 1.8 1.8 Source: Annual Survey of Hours and Earnings (ASHE); Office for National Statistics Note: - Sample size too small for reliable estimate * Figures for 1998, before the NMW was introduced, are for jobs paid less than £3.00 p/h (aged 18-21) or £3.60 p/h (aged 22 and over). ** Estimates for 1998-2003 are based on a central estimate of the LFS and ASHE. *** Before 2005 the estimates are for employees aged 18 and over, from 2005 the estimates are for those aged 16 and over. Number of jobs paid at less than £3.00 per hour (aged 18-21) or £3.60 per hour (aged 22 and over) for 1998 to 2000. Number of jobs paid at less than £3.50 per hour (aged 18-21) or £4.10 per hour (aged 22 and over) for 2002. Number of jobs paid at less than £3.80 per hour (aged 18-21) or £4.50 per hour (aged 22 and over) for 2004. Number of jobs paid at less than £3.00 per hour (aged 16-17) or £4.25 per hour (aged 18-21) or £5.05 per hour (aged 22 and over) for 2006. Number of jobs paid at less than £3.40 per hour (aged 16-17) or £4.60 per hour (aged 18-21) or £5.52 per hour (aged 22 and over) for 2008. Number of jobs paid at less than £3.57 per hour (aged 16-17) or £4.83 per hour (aged 18-21) or £5.80 per hour (aged 22 and over) for 2010.
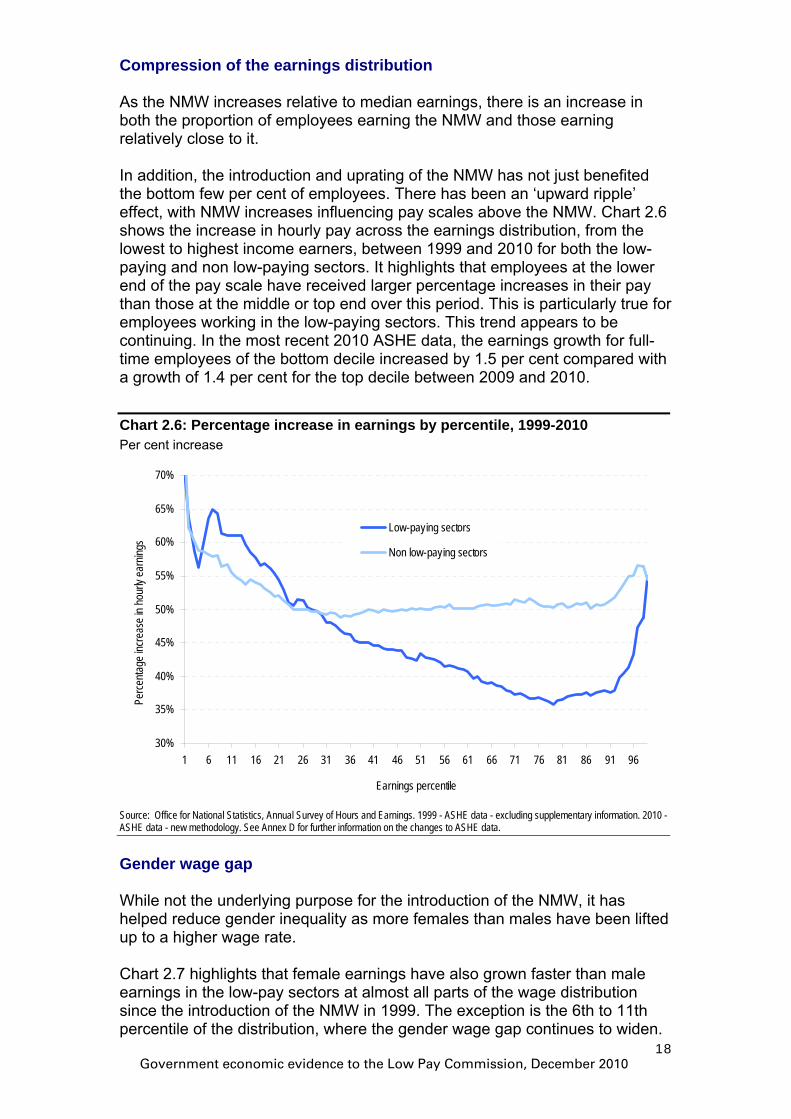
Compression of the earnings distribution As the NMW increases relative to median earnings, there is an increase in both the proportion of employees earning the NMW and those earning relatively close to it. In addition, the introduction and uprating of the NMW has not just benefited the bottom few per cent of employees. There has been an ‘upward ripple’ effect, with NMW increases influencing pay scales above the NMW. Chart 2.6 shows the increase in hourly pay across the earnings distribution, from the lowest to highest income earners, between 1999 and 2010 for both the low-paying and non low-paying sectors. It highlights that employees at the lower end of the pay scale have received larger percentage increases in their pay than those at the middle or top end over this period. This is particularly true for employees working in the low-paying sectors. This trend appears to be continuing. In the most recent 2010 ASHE data, the earnings growth for full-time employees of the bottom decile increased by 1.5 per cent compared with a growth of 1.4 per cent for the top decile between 2009 and 2010.
Chart 2.6: Percentage increase in earnings by percentile, 1999-2010 Per cent increase
30%
35%
40%
45%
50%
55%
60%
65%
70%
1 6 11 16 21 26 31 36 41 46 51 56 61 66 71 76 81 86 91 96
Earnings percentile
Perce
ntage
incre
ase i
n hou
rly ea
rning
s
Low-paying sectors
Non low-paying sectors
Source: Office for National Statistics, Annual Survey of Hours and Earnings. 1999 - ASHE data - excluding supplementary information. 2010 - ASHE data - new methodology. See Annex D for further information on the changes to ASHE data.
Gender wage gap While not the underlying purpose for the introduction of the NMW, it has helped reduce gender inequality as more females than males have been lifted up to a higher wage rate. Chart 2.7 highlights that female earnings have also grown faster than male earnings in the low-pay sectors at almost all parts of the wage distribution since the introduction of the NMW in 1999. The exception is the 6th to 11th percentile of the distribution, where the gender wage gap continues to widen.
Government economic evidence to the Low Pay Commission, December 2010
18
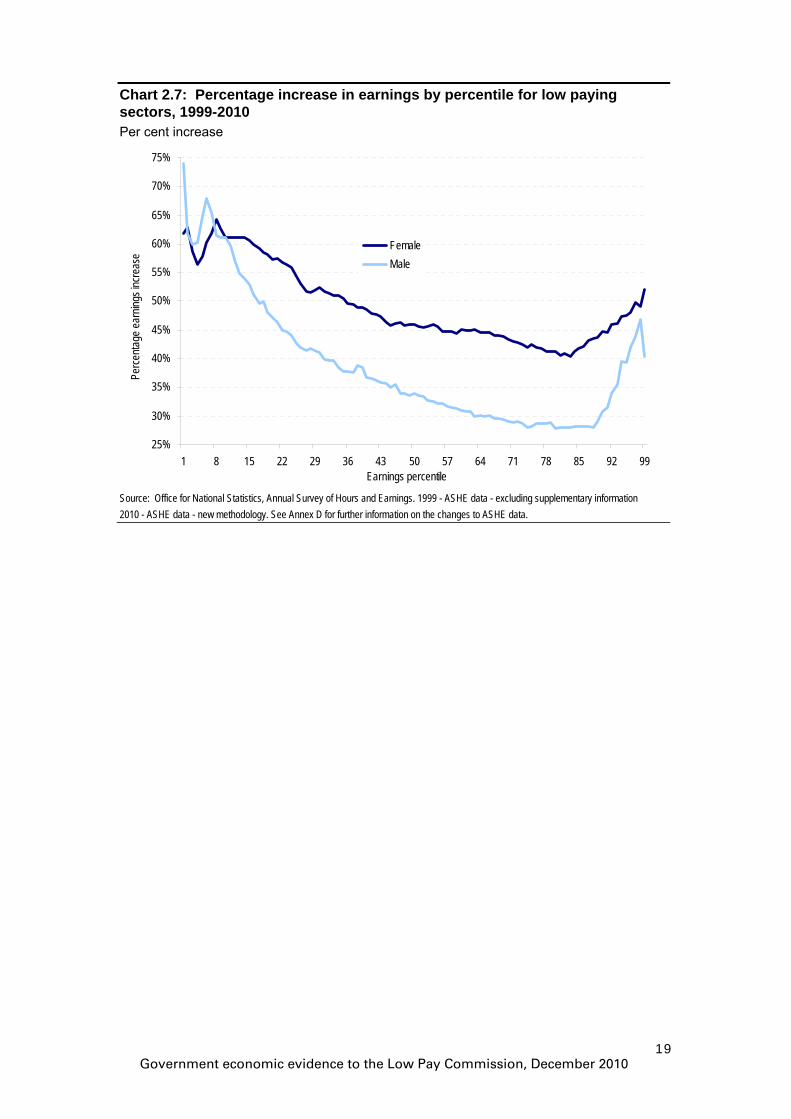
Chart 2.7: Percentage increase in earnings by percentile for low paying sectors, 1999-2010 Per cent increase
25%
30%
35%
40%
45%
50%
55%
60%
65%
70%
75%
1 8 15 22 29 36 43 50 57 64 71 78 85 92 99Earnings percentile
Perce
ntage
earn
ings i
ncre
ase
FemaleMale
Source: Office for National Statistics, Annual Survey of Hours and Earnings. 1999 - ASHE data - excluding supplementary information 2010 - ASHE data - new methodology. See Annex D for further information on the changes to ASHE data.
Government economic evidence to the Low Pay Commission, December 2010
19
3. Impact of the NMW on the labour market Empirical studies from the UK have not shown significant evidence that the adult NMW has reduced employment. However, most of the evidence focuses on a period in which there was a growing labour market. The evidence base, both in the UK and internationally, of the possible impact of minimum wages in an economic downturn has only started to emerge. Although there has been an absolute increase there has been a slight decline in the relative share of UK employment in low-paying sectors since 1999 which represents a trend that predates the introduction of the NMW. There have been major revisions to the Office for National Statistics (ONS) data on employee jobs (see Annex D) and therefore changes in the definition of low paid sectors. This has impacted on the analysis of employee job growth. The latest ONS employee jobs data shows that, over the recession period, employment in the (newly constructed) low paid sectors fell by 4.0 per cent compared to 3.5 per cent for the economy as a whole. Last year the data suggested that low paid sectors may be hit less hard than other sectors during the recession. The revisions to the standard industrial classification codes have led to a change in this trend. Over the year to Q2 2009 employee jobs in both the low paying sectors and the whole economy fell by 1.3 per cent. A simple perfectly competitive model of the labour market would suggest that the introduction of a minimum wage above the market-clearing wage will lead to the supply of workers outstripping demand, resulting in a fall in employment and a rise in ‘involuntary unemployment’. ‘Involuntary unemployment’ will rise also because the high wage will attract new entrants into the labour market increasing the labour supply; but, as supply outstrips demand they will be unable to find jobs. However, if the labour market is not highly competitive or there are labour market frictions, there may be opportunities for firms to limit their employment to restrain wages below the market-clearing wage. In these circumstances a minimum wage will not necessarily lead to increased unemployment, and might even increase employment. Empirical work from the UK has not found significant evidence that the adult NMW has reduced employment. However, most of the evidence focuses on a period in which there was a growing labour market and only very recently is the evidence base, both in the UK and internationally, of the possible impact of minimum wages in an economic downturn emerging. Therefore, this chapter reviews the most recent data on employment using ONS employee jobs and ASHE data for any emerging employment trends in the low paid sectors. This includes analysis up to the second quarter of 2010
Government economic evidence to the Low Pay Commission, December 2010
20
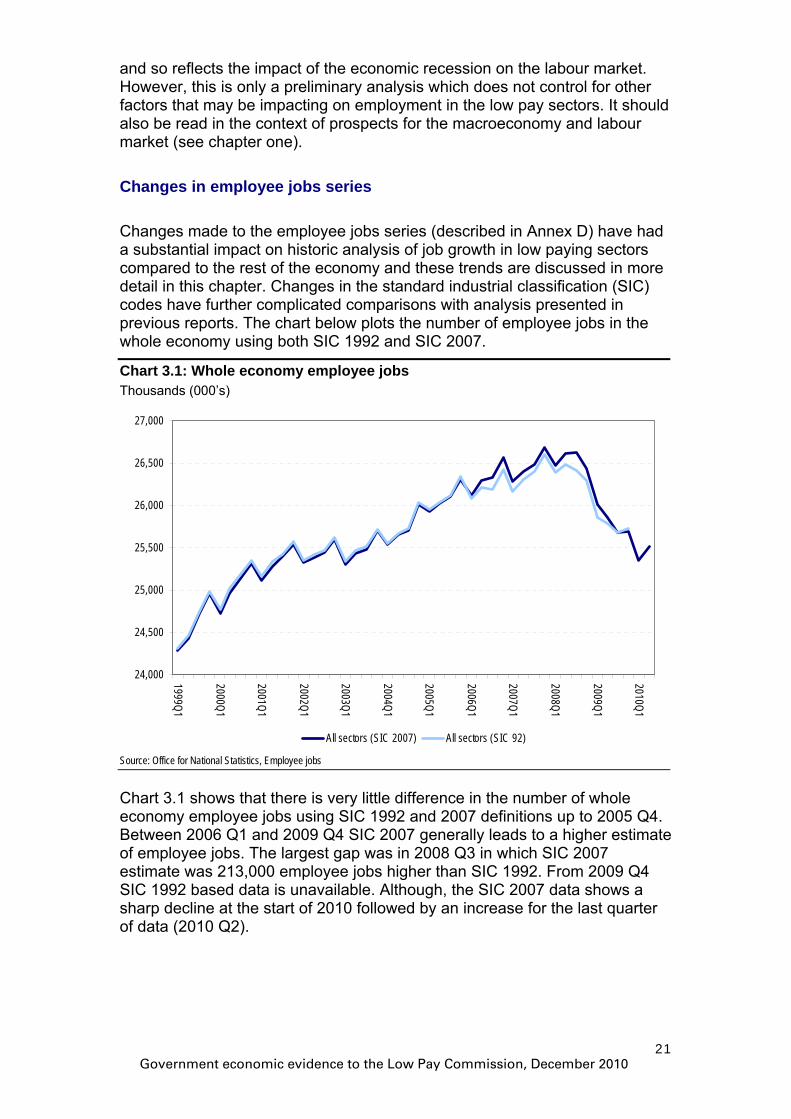
and so reflects the impact of the economic recession on the labour market. However, this is only a preliminary analysis which does not control for other factors that may be impacting on employment in the low pay sectors. It should also be read in the context of prospects for the macroeconomy and labour market (see chapter one). Changes in employee jobs series Changes made to the employee jobs series (described in Annex D) have had a substantial impact on historic analysis of job growth in low paying sectors compared to the rest of the economy and these trends are discussed in more detail in this chapter. Changes in the standard industrial classification (SIC) codes have further complicated comparisons with analysis presented in previous reports. The chart below plots the number of employee jobs in the whole economy using both SIC 1992 and SIC 2007.
Chart 3.1: Whole economy employee jobs Thousands (000’s)
24,000
24,500
25,000
25,500
26,000
26,500
27,000
1999Q1
2000Q1
2001Q1
2002Q1
2003Q1
2004Q1
2005Q1
2006Q1
2007Q1
2008Q1
2009Q1
2010Q1
All sectors (SIC 2007) All sectors (SIC 92)
Source: Office for National Statistics, Employee jobs
Chart 3.1 shows that there is very little difference in the number of whole economy employee jobs using SIC 1992 and 2007 definitions up to 2005 Q4. Between 2006 Q1 and 2009 Q4 SIC 2007 generally leads to a higher estimate of employee jobs. The largest gap was in 2008 Q3 in which SIC 2007 estimate was 213,000 employee jobs higher than SIC 1992. From 2009 Q4 SIC 1992 based data is unavailable. Although, the SIC 2007 data shows a sharp decline at the start of 2010 followed by an increase for the last quarter of data (2010 Q2).
Government economic evidence to the Low Pay Commission, December 2010
21
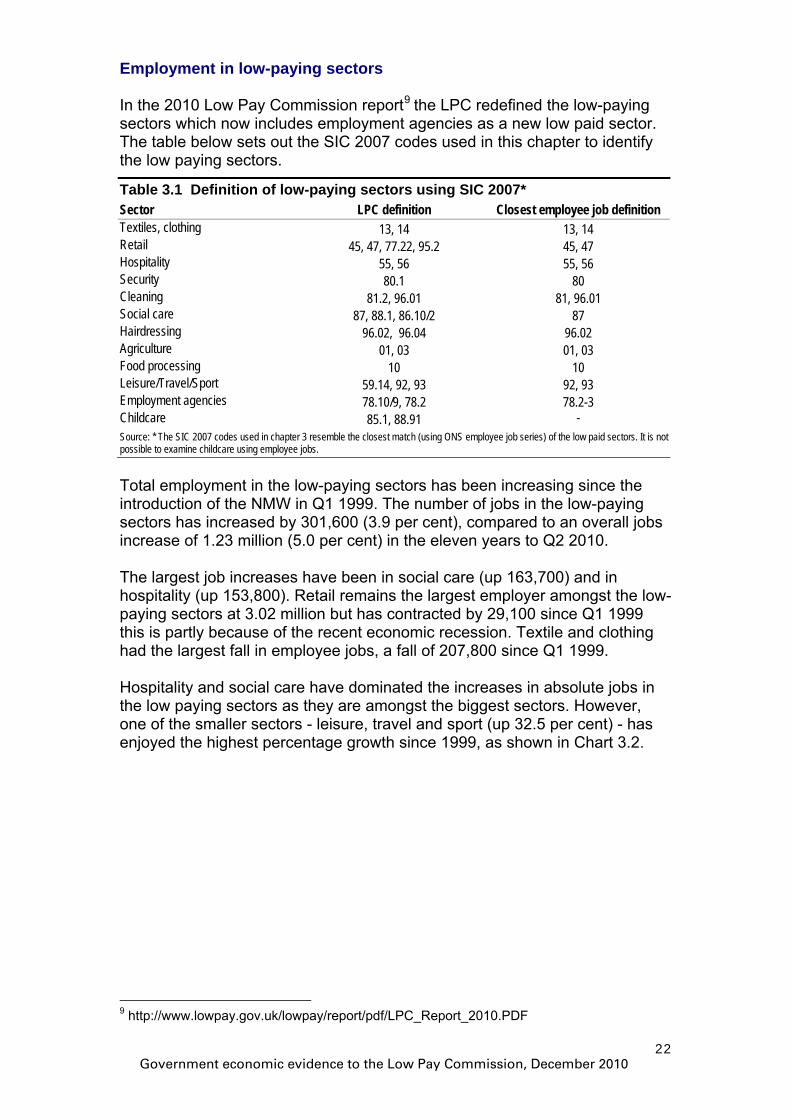
Employment in low-paying sectors In the 2010 Low Pay Commission report9 the LPC redefined the low-paying sectors which now includes employment agencies as a new low paid sector. The table below sets out the SIC 2007 codes used in this chapter to identify the low paying sectors.
Table 3.1 Definition of low-paying sectors using SIC 2007* Sector LPC definition Closest employee job definition Textiles, clothing 13, 14 13, 14 Retail 45, 47, 77.22, 95.2 45, 47 Hospitality 55, 56 55, 56 Security 80.1 80 Cleaning 81.2, 96.01 81, 96.01 Social care 87, 88.1, 86.10/2 87 Hairdressing 96.02, 96.04 96.02 Agriculture 01, 03 01, 03 Food processing 10 10 Leisure/Travel/Sport 59.14, 92, 93 92, 93 Employment agencies 78.10/9, 78.2 78.2-3 Childcare 85.1, 88.91 - Source: * The SIC 2007 codes used in chapter 3 resemble the closest match (using ONS employee job series) of the low paid sectors. It is not possible to examine childcare using employee jobs.
Total employment in the low-paying sectors has been increasing since the introduction of the NMW in Q1 1999. The number of jobs in the low-paying sectors has increased by 301,600 (3.9 per cent), compared to an overall jobs increase of 1.23 million (5.0 per cent) in the eleven years to Q2 2010. The largest job increases have been in social care (up 163,700) and in hospitality (up 153,800). Retail remains the largest employer amongst the low-paying sectors at 3.02 million but has contracted by 29,100 since Q1 1999 this is partly because of the recent economic recession. Textile and clothing had the largest fall in employee jobs, a fall of 207,800 since Q1 1999. Hospitality and social care have dominated the increases in absolute jobs in the low paying sectors as they are amongst the biggest sectors. However, one of the smaller sectors - leisure, travel and sport (up 32.5 per cent) - has enjoyed the highest percentage growth since 1999, as shown in Chart 3.2.
9 http://www.lowpay.gov.uk/lowpay/report/pdf/LPC_Report_2010.PDF
Government economic evidence to the Low Pay Commission, December 2010
22

Chart 3.2: Jobs in major low-paying sectors since 1999 Index Rebased to 1999 Q1 = 100
90
100
110
120
130
140
1999Q1 2000Q1 2001Q1 2002Q1 2003Q1 2004Q1 2005Q1 2006Q1 2007Q1 2008Q1 2009Q1 2010Q1
Hospitality
Cleaning
Social care
Leisure, travel, sport
Employment agencies
Source: Office for National Statistics, Employee jobs
Employment in the low-paying sectors has tended to grow at a slower pace than other sectors between 1999 and 2010. As a consequence, the share of the low-pay sectors in total employment has fallen by about 0.4 percentage points between Q1 1999 and Q1 2010 (see Chart 3.3).
Chart 3.3: Low pay sectors share in total employment Per cent of total employment, Q1
0%
5%
10%
15%
20%
25%
30%
35%
Texti
les, c
lothin
g
Retai
l
Hosp
itality
Secu
rity
Clea
ning
Socia
l car
e
Haird
ress
ing
Agric
ultur
e
Food
proc
essin
g
Leisu
re, tr
avel,
spor
t
Emplo
ymen
tag
encie
s
All lo
w-pa
ying
secto
rs
1996Q1 1999Q1 2010Q1
Source: Office for National Statistics, Employee jobs
Government economic evidence to the Low Pay Commission, December 2010
23
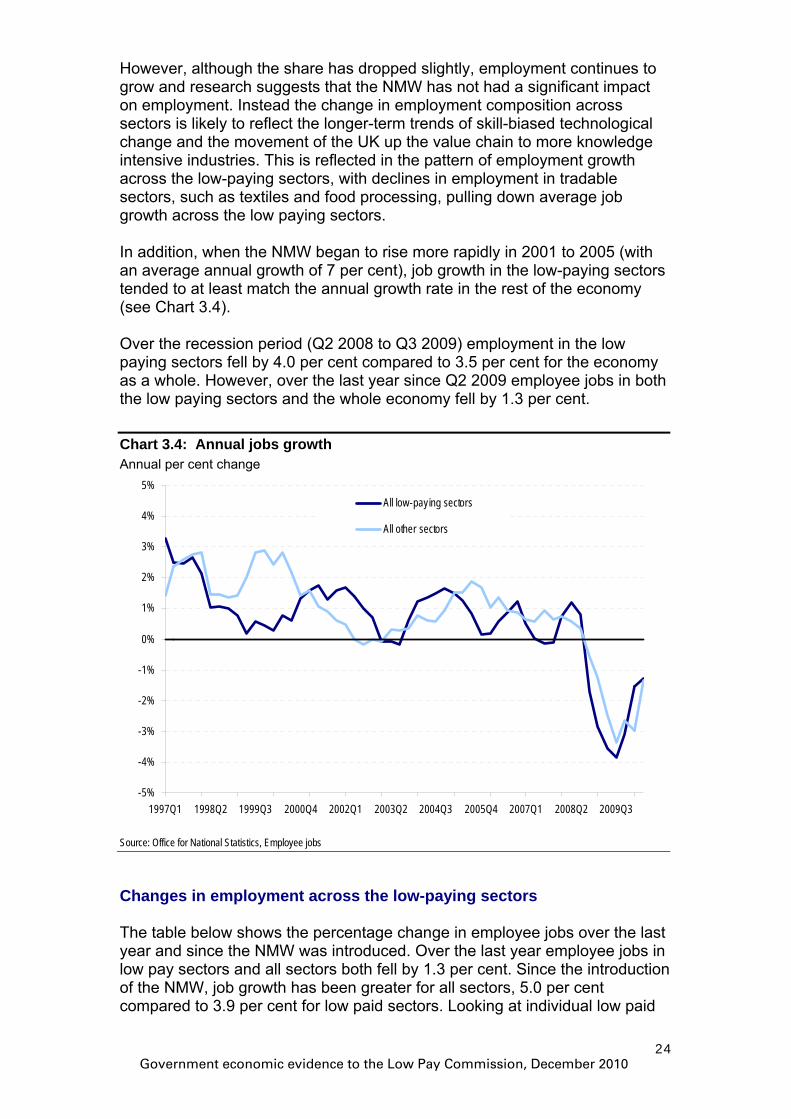
However, although the share has dropped slightly, employment continues to grow and research suggests that the NMW has not had a significant impact on employment. Instead the change in employment composition across sectors is likely to reflect the longer-term trends of skill-biased technological change and the movement of the UK up the value chain to more knowledge intensive industries. This is reflected in the pattern of employment growth across the low-paying sectors, with declines in employment in tradable sectors, such as textiles and food processing, pulling down average job growth across the low paying sectors. In addition, when the NMW began to rise more rapidly in 2001 to 2005 (with an average annual growth of 7 per cent), job growth in the low-paying sectors tended to at least match the annual growth rate in the rest of the economy (see Chart 3.4). Over the recession period (Q2 2008 to Q3 2009) employment in the low paying sectors fell by 4.0 per cent compared to 3.5 per cent for the economy as a whole. However, over the last year since Q2 2009 employee jobs in both the low paying sectors and the whole economy fell by 1.3 per cent.
Chart 3.4: Annual jobs growth Annual per cent change
-5%
-4%
-3%
-2%
-1%
0%
1%
2%
3%
4%
5%
1997Q1 1998Q2 1999Q3 2000Q4 2002Q1 2003Q2 2004Q3 2005Q4 2007Q1 2008Q2 2009Q3
All low-paying sectors
All other sectors
Source: Office for National Statistics, Employee jobs
Changes in employment across the low-paying sectors The table below shows the percentage change in employee jobs over the last year and since the NMW was introduced. Over the last year employee jobs in low pay sectors and all sectors both fell by 1.3 per cent. Since the introduction of the NMW, job growth has been greater for all sectors, 5.0 per cent compared to 3.9 per cent for low paid sectors. Looking at individual low paid
Government economic evidence to the Low Pay Commission, December 2010
24
sectors, retail suffered the largest fall in jobs (5.1 per cent) over the last year. Agriculture had the greatest increase in employee jobs over the last year. Since the introduction of the NMW, social care – the third largest low paying sector – has had strong positive growth. Meanwhile, textiles and clothing has contracted by 73.9 per cent since Q2 1999, reflecting an underlying long term trend of falling employment share.
Table 3.2 Change in Employee Jobs, by Low-paying industry, GB Sector Q2 2010 Change on the year
(since Q2 2009) Change since Q2 1999
(‘000s) (‘000s) (%) (‘000s) (%) Sector All sectors 25,522 -344 -1.3% 1,226 5.0% All low paying sectors 7,950 -101.1 -1.3% 302 3.9% Retail 3,017 -160.7 -5.1% -29 -1.0% Hospitality 1,708 -58.6 -3.3% 154 9.9% Social care 673 35.1 5.5% 164 32.1% Cleaning 589 -4.6 -0.8% 17 3.0% Agriculture 221 44.5 25.2% -17 -7.1% Security 187 13.2 7.6% 59 46.6% Textiles, clothing 73 3.3 4.7% -208 -73.9% Food processing 336 15 4.7% -86 -20.5% Leisure, travel and sport 468 8.2 1.8% 122 35.2% Hairdressing 105 -14.6 -12.2% 26 32.9% Source: Office for National Statistics, Employee jobs
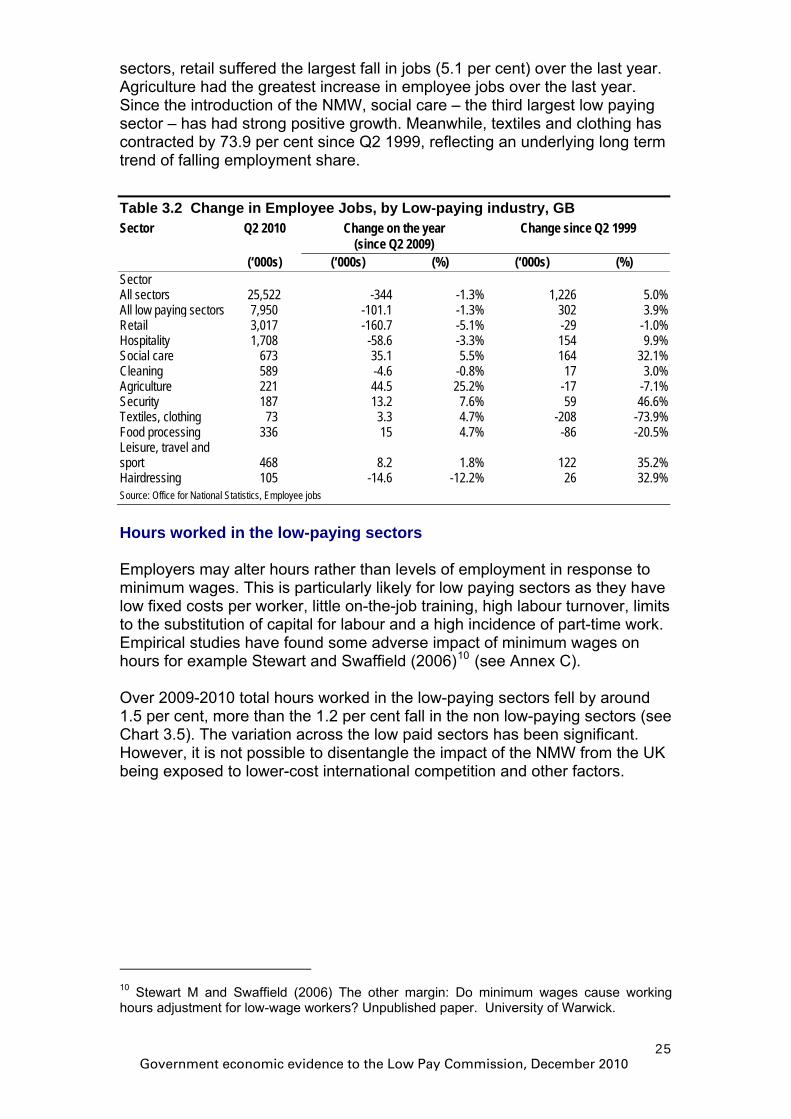
Hours worked in the low-paying sectors Employers may alter hours rather than levels of employment in response to minimum wages. This is particularly likely for low paying sectors as they have low fixed costs per worker, little on-the-job training, high labour turnover, limits to the substitution of capital for labour and a high incidence of part-time work. Empirical studies have found some adverse impact of minimum wages on hours for example Stewart and Swaffield (2006)10 (see Annex C). Over 2009-2010 total hours worked in the low-paying sectors fell by around 1.5 per cent, more than the 1.2 per cent fall in the non low-paying sectors (see Chart 3.5). The variation across the low paid sectors has been significant. However, it is not possible to disentangle the impact of the NMW from the UK being exposed to lower-cost international competition and other factors.
10 Stewart M and Swaffield (2006) The other margin: Do minimum wages cause working hours adjustment for low-wage workers? Unpublished paper. University of Warwick.
Government economic evidence to the Low Pay Commission, December 2010
25
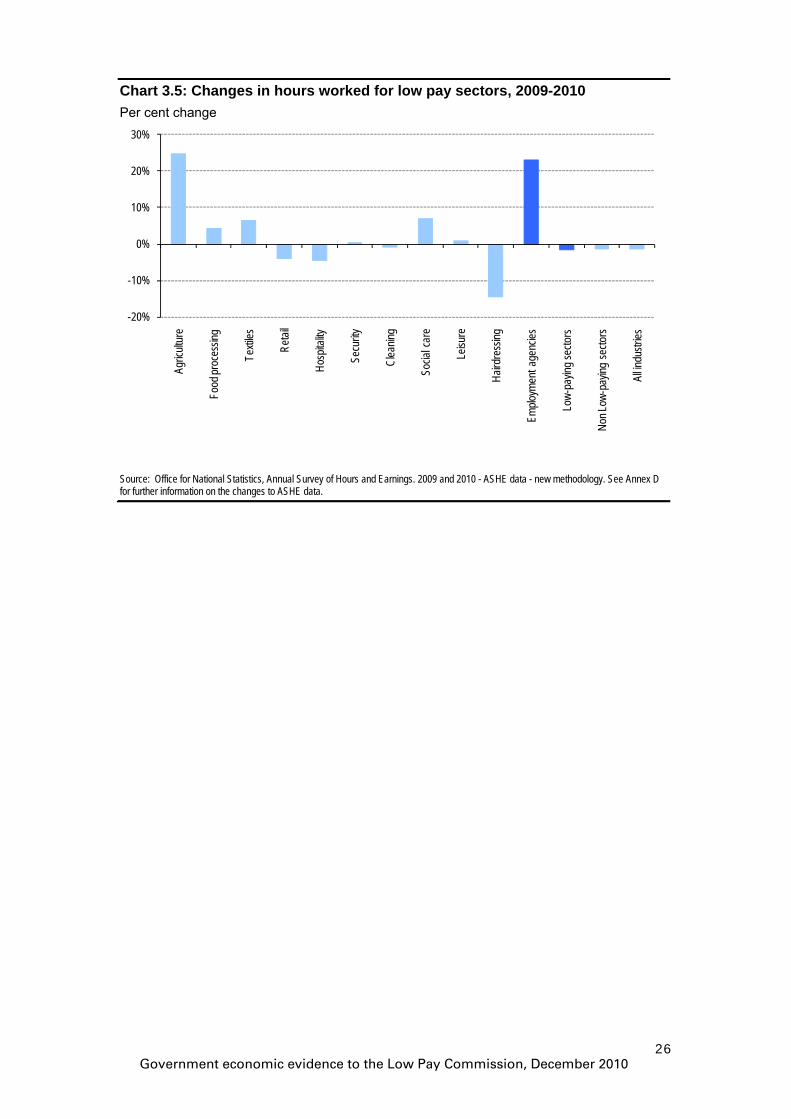
Chart 3.5: Changes in hours worked for low pay sectors, 2009-2010 Per cent change
-20%
-10%
0%
10%
20%
30%
Agric
ultur
e
Food
proc
essin
g
Texti
les
Retai
l
Hosp
itality
Secu
rity
Clea
ning
Socia
l car
e
Leisu
re
Haird
ress
ing
Emplo
ymen
t age
ncies
Low-
payin
g sec
tors
Non L
ow-p
aying
secto
rs
All in
dustr
ies
Source: Office for National Statistics, Annual Survey of Hours and Earnings. 2009 and 2010 - ASHE data - new methodology. See Annex D for further information on the changes to ASHE data.
Government economic evidence to the Low Pay Commission, December 2010
26

4. Groups identified in the LPC remit Younger workers have been hit hard by the economic downturn, with significant falls in the employment rates of 16-17 year olds and 18-20 year olds. Recent data suggests prospects are improving, but there is still some uncertainty over future outlook. The Government is committed to establishing apprenticeships as a key route to building the national skills base, working with employers to help young people and adults get the skills and qualifications valued by employers. Following the introduction of the hourly £2.50 apprenticeship minimum wage there are important supply and demand side issues that need consideration when reviewing the apprenticeship minimum wage. In order to encourage supply to apprenticeship schemes, an apprentice minimum wage needs to be set at a level which provides appropriate incentives for individuals to participate in schemes. However, too high an increase in the apprentice minimum wage will lead to higher wage costs for employers and this could dissuade employers from providing employment for apprentices. The Government’s main concern over the apprentice minimum wage is in respect of young people because of their vulnerable labour market position. The NMW bite is higher for small firms (59.5 per cent) than for medium or large firms. Also, the proportion of employees earning at or below the NMW is substantially higher for small firms than large firms. Younger workers in particular 16-17 year olds and those on apprenticeships as well as small firms are more likely to be affected by NMW upratings. In combination with a high bite for small firms and an increasing bite and coverage of the NMW over time, it is even more important that all the available evidence is considered on the effect on employment when setting the National Minimum Wage rates. Evidence suggests for example Neumark and Wascher 2004 that labour market outcomes of younger workers are more at risk from the uprating of the NMW. This is one of the reasons why there is a lower rate for workers aged below 21. Also, the labour market performance of younger workers tend to be hit hard during and after economic recessions.
Government economic evidence to the Low Pay Commission, December 2010
27
16-17 Age group The minimum wage rate for 16-17 year olds was introduced in October 2004. It was initially set at the rate of £3.00. Apart from 2005 it has been increased every year and has been £3.64 since October 2010. Chart 4.1 shows that the employment rate of 16 and 17 year olds (excluding those in full time education) has generally been in decline. There was a slight improvement in the rate between late 2006 and early 2008, but thereafter the decline was steep due to the impact of recession, which hit younger workers harder. From the beginning of 2010 the rate seems to be rising again as the economy picks up generally. There is no specific evidence of minimum wage having a detrimental impact on employment of this age group. Decline in employment pre-dates this, and partly due to greater participation in full-time education of this age group, as discussed below.
Chart 4.1: Employment, unemployment and inactivity rates of 16-17 year olds, excluding full time students and graduates Per cent of age group, four quarter moving average
0%
10%
20%
30%
40%
50%
60%
70%
Q11997
Q41997
Q31998
Q21999
Q12000
Q42000
Q32001
Q22002
Q12003
Q42003
Q32004
Q22005
Q12006
Q42006
Q32007
Q22008
Q12009
Q42009
Employment rate
Unemployment rate
Inactivity rate
Source: Office for National Statistics, Labour Force Survey. 4-quarter averages. Not seasonally adjusted. See Annex D for further information.
Government economic evidence to the Low Pay Commission, December 2010
28
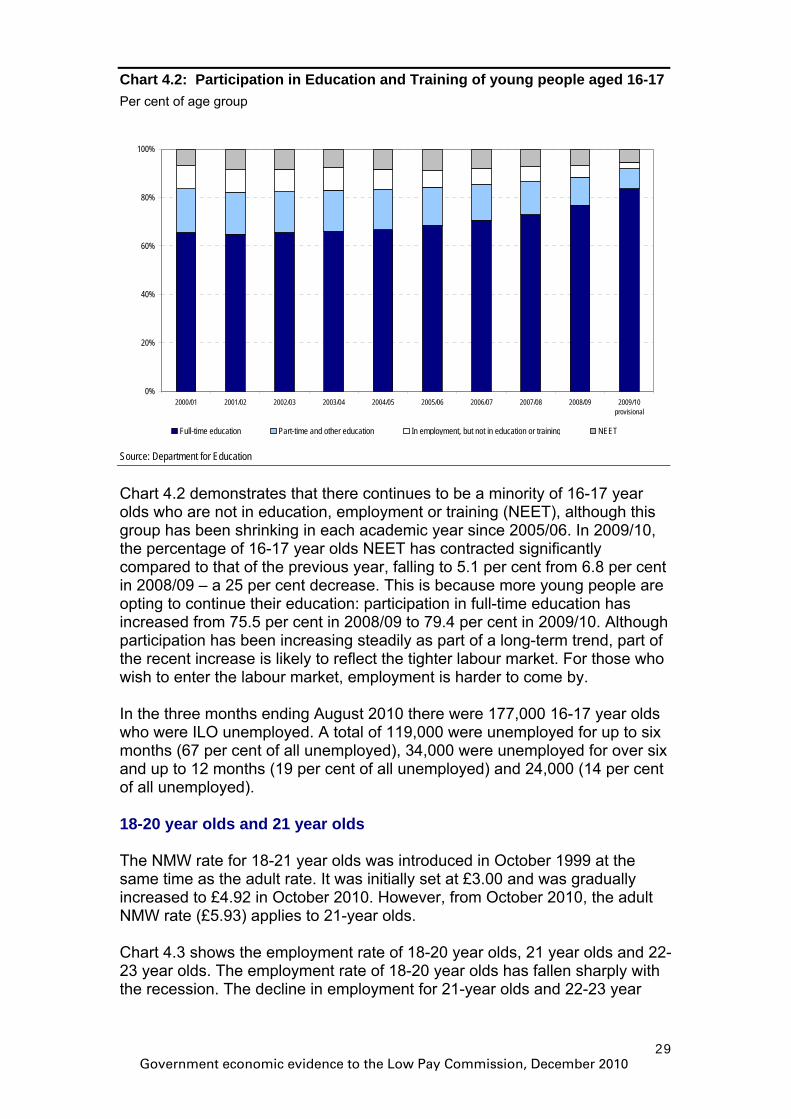
Chart 4.2: Participation in Education and Training of young people aged 16-17Per cent of age group
0%
20%
40%
60%
80%
100%
2000/01 2001/02 2002/03 2003/04 2004/05 2005/06 2006/07 2007/08 2008/09 2009/10provisional
Full-time education Part-time and other education In employment, but not in education or training NEET
Source: Department for Education
Chart 4.2 demonstrates that there continues to be a minority of 16-17 year olds who are not in education, employment or training (NEET), although this group has been shrinking in each academic year since 2005/06. In 2009/10, the percentage of 16-17 year olds NEET has contracted significantly compared to that of the previous year, falling to 5.1 per cent from 6.8 per cent in 2008/09 – a 25 per cent decrease. This is because more young people are opting to continue their education: participation in full-time education has increased from 75.5 per cent in 2008/09 to 79.4 per cent in 2009/10. Although participation has been increasing steadily as part of a long-term trend, part of the recent increase is likely to reflect the tighter labour market. For those who wish to enter the labour market, employment is harder to come by. In the three months ending August 2010 there were 177,000 16-17 year olds who were ILO unemployed. A total of 119,000 were unemployed for up to six months (67 per cent of all unemployed), 34,000 were unemployed for over six and up to 12 months (19 per cent of all unemployed) and 24,000 (14 per cent of all unemployed). 18-20 year olds and 21 year olds The NMW rate for 18-21 year olds was introduced in October 1999 at the same time as the adult rate. It was initially set at £3.00 and was gradually increased to £4.92 in October 2010. However, from October 2010, the adult NMW rate (£5.93) applies to 21-year olds. Chart 4.3 shows the employment rate of 18-20 year olds, 21 year olds and 22-23 year olds. The employment rate of 18-20 year olds has fallen sharply with the recession. The decline in employment for 21-year olds and 22-23 year
Government economic evidence to the Low Pay Commission, December 2010
29
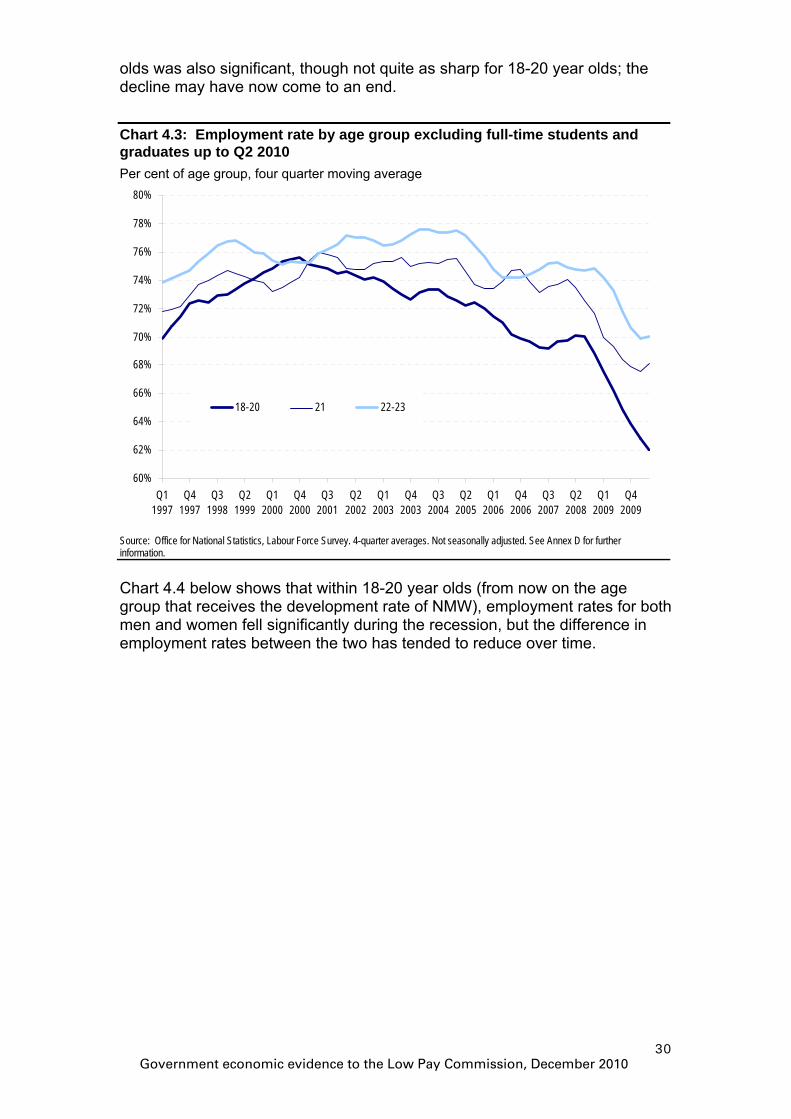
olds was also significant, though not quite as sharp for 18-20 year olds; the decline may have now come to an end.
Chart 4.3: Employment rate by age group excluding full-time students and graduates up to Q2 2010 Per cent of age group, four quarter moving average
60%
62%
64%
66%
68%
70%
72%
74%
76%
78%
80%
Q11997
Q41997
Q31998
Q21999
Q12000
Q42000
Q32001
Q22002
Q12003
Q42003
Q32004
Q22005
Q12006
Q42006
Q32007
Q22008
Q12009
Q42009
18-20 21 22-23
Source: Office for National Statistics, Labour Force Survey. 4-quarter averages. Not seasonally adjusted. See Annex D for further information.
Chart 4.4 below shows that within 18-20 year olds (from now on the age group that receives the development rate of NMW), employment rates for both men and women fell significantly during the recession, but the difference in employment rates between the two has tended to reduce over time.
Government economic evidence to the Low Pay Commission, December 2010
30

Chart 4.4: Employment rate of 18-20 year olds excluding full-time students and graduates up to Q2 2010 Per cent of age group, four quarter moving average
58%
62%
66%
70%
74%
78%
82%
Q11997
Q41997
Q31998
Q21999
Q12000
Q42000
Q32001
Q22002
Q12003
Q42003
Q32004
Q22005
Q12006
Q42006
Q32007
Q22008
Q12009
Q42009
Male
Female
Total
Source: Office for National Statistics, Labour Force Survey. 4-quarter averages. Not seasonally adjusted. See Annex D for further information.
Chart 4.5: Unemployment rate of 18-20 year olds excluding full-time students and graduates up to Q2 2010 Per cent of age group, four quarter moving average
0%
5%
10%
15%
20%
25%
30%
Q11997
Q41997
Q31998
Q21999
Q12000
Q42000
Q32001
Q22002
Q12003
Q42003
Q32004
Q22005
Q12006
Q42006
Q32007
Q22008
Q12009
Q42009
Male
Female
Total
Source: Office for National Statistics, Labour Force Survey. 4-quarter averages. Not seasonally adjusted. See Annex D for further information.
Government economic evidence to the Low Pay Commission, December 2010
31
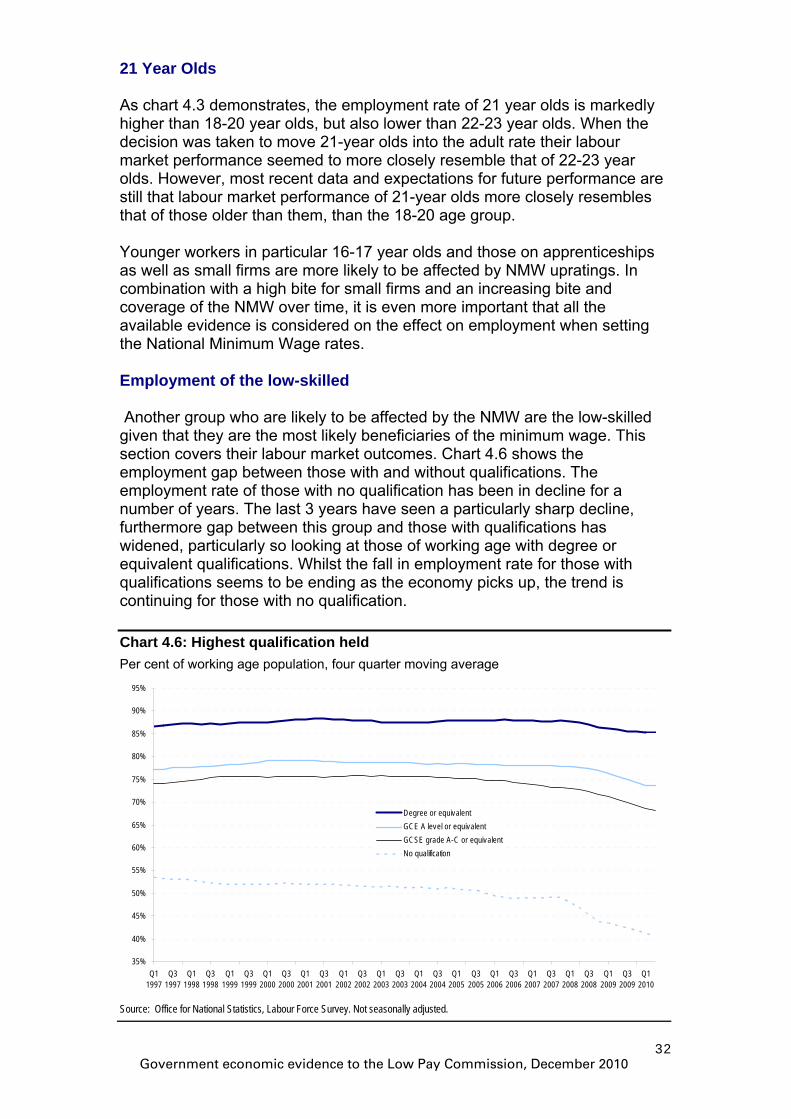
21 Year Olds As chart 4.3 demonstrates, the employment rate of 21 year olds is markedly higher than 18-20 year olds, but also lower than 22-23 year olds. When the decision was taken to move 21-year olds into the adult rate their labour market performance seemed to more closely resemble that of 22-23 year olds. However, most recent data and expectations for future performance are still that labour market performance of 21-year olds more closely resembles that of those older than them, than the 18-20 age group. Younger workers in particular 16-17 year olds and those on apprenticeships as well as small firms are more likely to be affected by NMW upratings. In combination with a high bite for small firms and an increasing bite and coverage of the NMW over time, it is even more important that all the available evidence is considered on the effect on employment when setting the National Minimum Wage rates. Employment of the low-skilled Another group who are likely to be affected by the NMW are the low-skilled given that they are the most likely beneficiaries of the minimum wage. This section covers their labour market outcomes. Chart 4.6 shows the employment gap between those with and without qualifications. The employment rate of those with no qualification has been in decline for a number of years. The last 3 years have seen a particularly sharp decline, furthermore gap between this group and those with qualifications has widened, particularly so looking at those of working age with degree or equivalent qualifications. Whilst the fall in employment rate for those with qualifications seems to be ending as the economy picks up, the trend is continuing for those with no qualification.
Chart 4.6: Highest qualification held Per cent of working age population, four quarter moving average
35%
40%
45%
50%
55%
60%
65%
70%
75%
80%
85%
90%
95%
Q11997
Q31997
Q11998
Q31998
Q11999
Q31999
Q12000
Q32000
Q12001
Q32001
Q12002
Q32002
Q12003
Q32003
Q12004
Q32004
Q12005
Q32005
Q12006
Q32006
Q12007
Q32007
Q12008
Q32008
Q12009
Q32009
Q12010
Degree or equivalentGCE A level or equivalentGCSE grade A-C or equivalentNo qualification
Source: Office for National Statistics, Labour Force Survey. Not seasonally adjusted.
Government economic evidence to the Low Pay Commission, December 2010
32
Minority employment groups This section reports on the recent labour market performance of other vulnerable groups who may be affected by the NMW. Since the introduction of the NMW, 0.3 million more people of working age who are Disability Discrimination Act (DDA) disabled11 and have a work-limiting disability12 entered employment (change in employment levels since 1999 Q1 to 2010 Q2). The employment rate for this group has increased by 3.3 percentage points from 30.0 per cent in 1999 Q1 to 33.3 per cent in 2010 Q2. The unemployment rate has increased by 2.7 percentage points from 13.6 per cent to 16.2 per cent over the same period. Inactivity rates have fallen by 5.1 percentage points from 65.3 per cent in 1999 Q1 to 60.2 per cent in 2010 Q2. Between 2001 Q1 and 2010 Q2 over 1 million more people of working age from ethnic minorities have entered employment. The employment rate of minority groups has increased by 2.7 percentage points over the same period, from 57.7 per cent to 60.3 per cent. The unemployment rate has increased by 1.8 percentage points from 11.5 per cent to 13.3 per cent again over the same period. Inactivity rates have fallen by 4.5 percentage points from 34.9 per cent in 2001 Q1 to 30.4 per cent in 2010 Q2. Since the introduction of the NMW, employment for both males and females has increased by around 1.4 million. The working age employment rate for men decreased by 2.9 percentage points from 78.2 per cent in 1999 Q1 to 75.3 per cent in 2010 Q2. The working age employment rate for women increased by 0.3 percentage points from 68.4 to 68.7 per cent over the same period. The working age unemployment rate for men rose from 7.0 per cent in 1999 Q1 to 8.8 per cent in 2010 Q2, for women the unemployment rate rose from 5.5 per cent to 7.1 per cent over the same period. The working age economic inactivity rate for men increased by 1.6 percentage points from 15.9 per cent in 1999 Q1 to 17.5 per cent in 2010 Q2. For women the economic inactivity rate fell from 27.6 per cent to 26.1 per cent over the same period. Apprenticeships The Government is committed to establishing apprenticeships as a key route to building the national skills base, working with employers to help young people and adults get the skills and qualifications valued by employers. Following the introduction of the hourly £2.50 apprenticeship minimum wage there are important supply and demand side issues that need consideration when reviewing the apprenticeship minimum wage. In order to encourage supply to apprenticeship schemes, an apprentice minimum wage needs to be set at a level which provides appropriate incentives for individuals to
11
The Disability Discrimination Act defines a person as DDA disabled as someone who has a physical or mental impairment that has a substantial and long-term adverse effect on his or her ability to carry out normal day-to-day activities. 12 Change in employment levels since 1999 Q1 to 2009 Q2.
Government economic evidence to the Low Pay Commission, December 2010
33

participate in schemes. However, a too high increase in the apprentice minimum wage will lead to higher wage costs for employers and this could dissuade employers from providing schemes. The Government’s main concern over the apprentice minimum wage is in respect of young people because of their vulnerable labour market position. Following the Government’s acceptance of the Low Pay Commission’s (LPC) 2010 recommendations on apprentice pay, the existing apprentice exemption from the NMW is abolished and replaced by a £2.50 an hour minimum from 1st October 2010. The LPC also recommended transitional arrangements to protect those apprentices in England presently covered by the £95 per week minimum wage. The Government also accepted this recommendation. The purpose of the transitional protection is to ensure that those apprentices on the £95 per week minimum are no worse off when the £2.50 per hour rate is introduced. Following the introduction of the hourly £2.50 apprenticeship minimum wage there are important supply and demand side issues that need consideration when reviewing the apprenticeship minimum wage. In order to encourage supply to apprenticeship schemes, an apprentice minimum wage needs to be set at a level which provides appropriate incentives for individuals to participate in schemes. However, a too high increase in the apprentice minimum wage will lead to higher wage costs for employers and this could dissuade employers from providing schemes. Our main concern over the apprentice minimum wage is in respect of young people because of their vulnerable labour market position. Impact on small firms The NMW as a percentage of the median wage – known as the ‘bite’- is higher for small firms (59.5 per cent) than for medium or large firms. Also the proportion of employees earning at or below the NMW is substantially higher for small firms than large firms. The bite of the NMW Chart 4.7 highlights that the NMW as a per cent of the median wage tends to be higher for smaller firms than for medium and larger firms.
Government economic evidence to the Low Pay Commission, December 2010
34
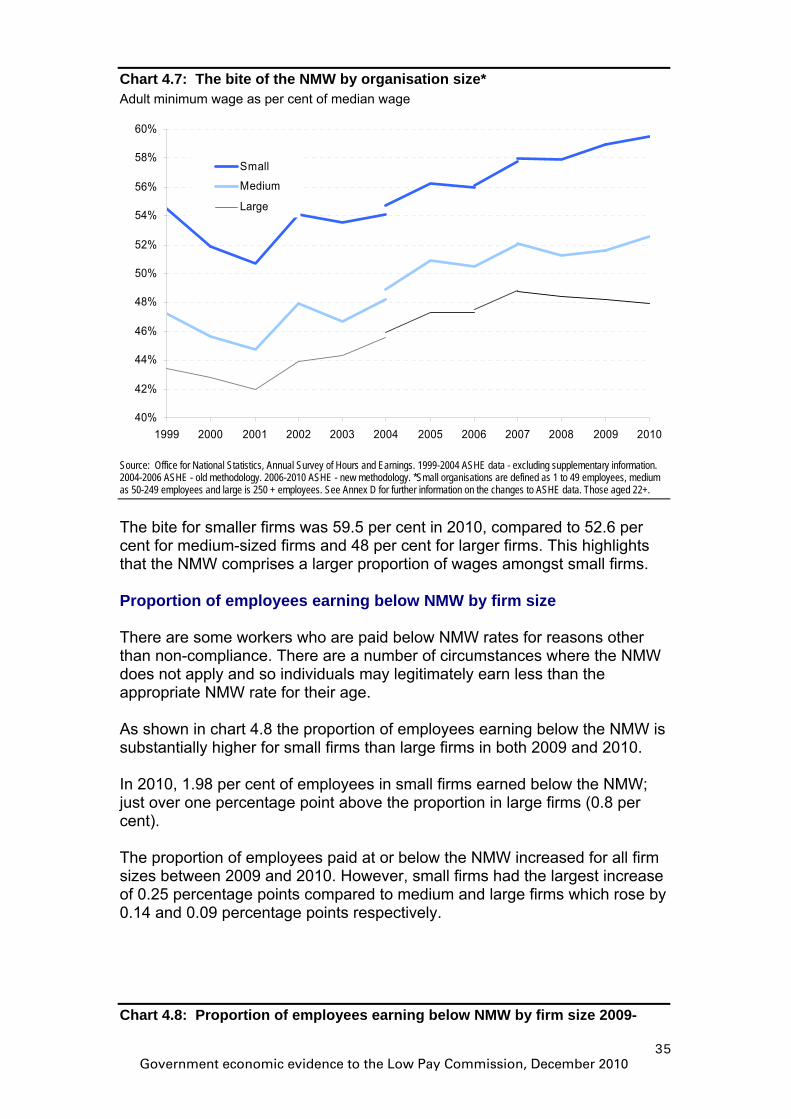
Chart 4.7: The bite of the NMW by organisation size* Adult minimum wage as per cent of median wage
40%
42%
44%
46%
48%
50%
52%
54%
56%
58%
60%
1999 2000 2001 2002 2003 2004 2005 2006 2007 2008 2009 2010
Small
Medium
Large
Source: Office for National Statistics, Annual Survey of Hours and Earnings. 1999-2004 ASHE data - excluding supplementary information. 2004-2006 ASHE - old methodology. 2006-2010 ASHE - new methodology. *Small organisations are defined as 1 to 49 employees, medium as 50-249 employees and large is 250 + employees. See Annex D for further information on the changes to ASHE data. Those aged 22+.
The bite for smaller firms was 59.5 per cent in 2010, compared to 52.6 per cent for medium-sized firms and 48 per cent for larger firms. This highlights that the NMW comprises a larger proportion of wages amongst small firms. Proportion of employees earning below NMW by firm size There are some workers who are paid below NMW rates for reasons other than non-compliance. There are a number of circumstances where the NMW does not apply and so individuals may legitimately earn less than the appropriate NMW rate for their age. As shown in chart 4.8 the proportion of employees earning below the NMW is substantially higher for small firms than large firms in both 2009 and 2010. In 2010, 1.98 per cent of employees in small firms earned below the NMW; just over one percentage point above the proportion in large firms (0.8 per cent). The proportion of employees paid at or below the NMW increased for all firm sizes between 2009 and 2010. However, small firms had the largest increase of 0.25 percentage points compared to medium and large firms which rose by 0.14 and 0.09 percentage points respectively.
Chart 4.8: Proportion of employees earning below NMW by firm size 2009-
Government economic evidence to the Low Pay Commission, December 2010
35
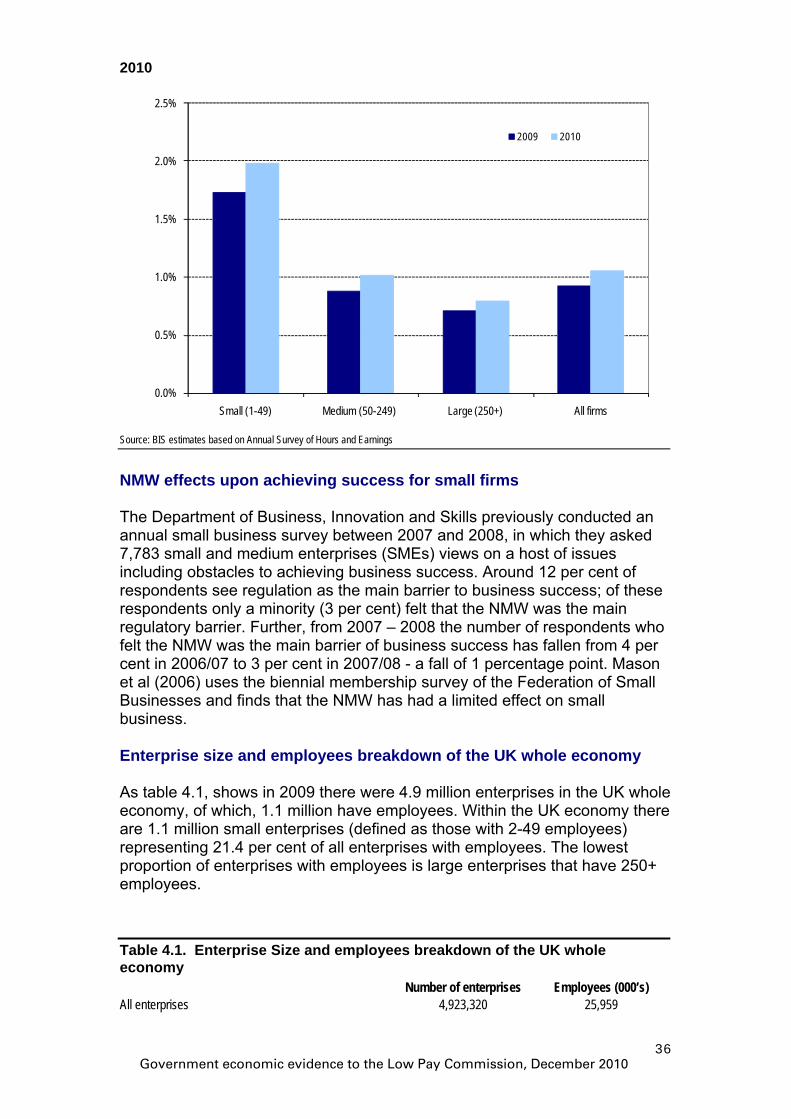
2010
0.0%
0.5%
1.0%
1.5%
2.0%
2.5%
Small (1-49) Medium (50-249) Large (250+) All firms
2009 2010
Source: BIS estimates based on Annual Survey of Hours and Earnings
NMW effects upon achieving success for small firms
sly conducted an
se
size and employees breakdown of the UK whole economy
ole
0+
able 4.1. Enterprise Size and employees breakdown of the UK whole
he Department of Business, Innovation and Skills previouT
annual small business survey between 2007 and 2008, in which they asked 7,783 small and medium enterprises (SMEs) views on a host of issues including obstacles to achieving business success. Around 12 per cent of respondents see regulation as the main barrier to business success; of therespondents only a minority (3 per cent) felt that the NMW was the main regulatory barrier. Further, from 2007 – 2008 the number of respondents who felt the NMW was the main barrier of business success has fallen from 4 per cent in 2006/07 to 3 per cent in 2007/08 - a fall of 1 percentage point. Mason et al (2006) uses the biennial membership survey of the Federation of Small Businesses and finds that the NMW has had a limited effect on small business.
nterpriseE
s table 4.1, shows in 2009 there were 4.9 million enterprises in the UK whAeconomy, of which, 1.1 million have employees. Within the UK economy there are 1.1 million small enterprises (defined as those with 2-49 employees) representing 21.4 per cent of all enterprises with employees. The lowest proportion of enterprises with employees is large enterprises that have 25employees.
Teconomy Number of enterprises Employees (000’s) All enterprises 4,923,320 25,959
Government economic evidence to the Low Pay Commission, December 2010
36
Enterprise with no employees* 3,832,670 746 Enterprise with employees 1,090,650 25,21of which
3 Small (2-49) 1,051,630 6,658
Medium (50-249) Large (250+)
tion and Skills SM statistics for the UK an , whole economy. * "Wit ployees" partnerships comprising only the self-employe er(s), and companies
30,850 3,057 8,170 15,498
Source: Department of Business Innova E d regions 2009 h no emcomprises sole proprietorships and d owner-manag
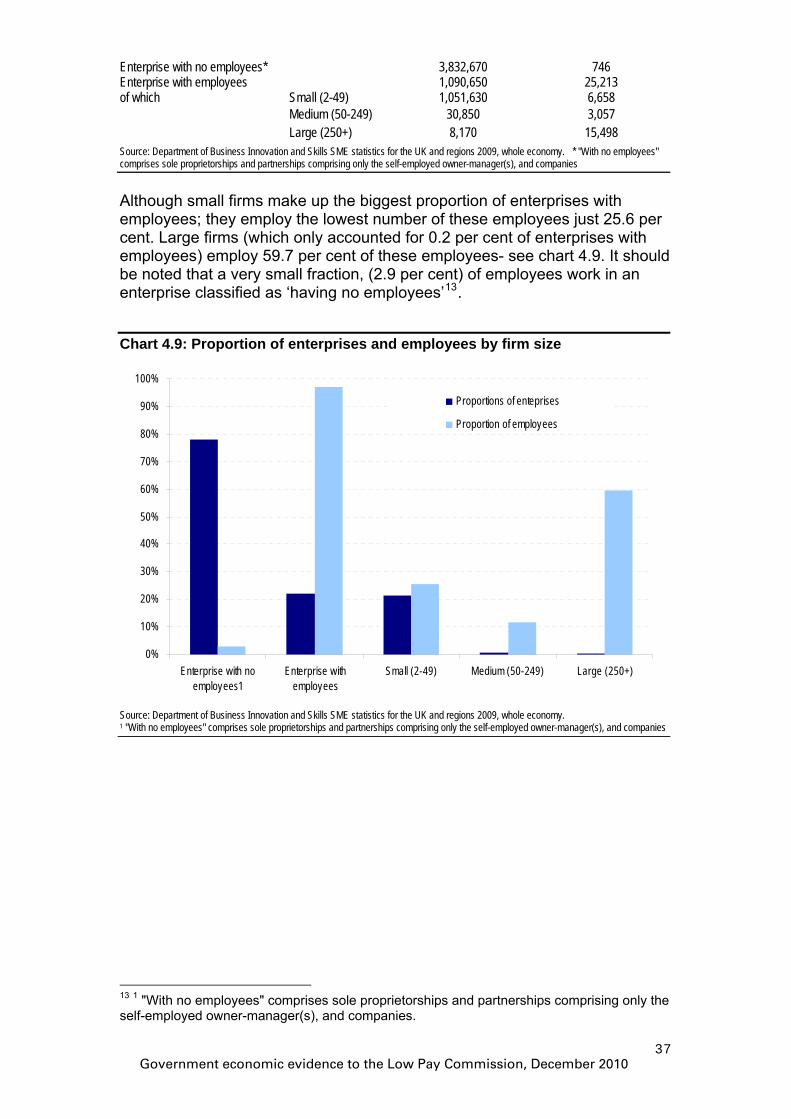
Although sm ll firms ma gest prop of enterprises employees; hey employ t number of these employees just 25.6 per
n
a ke up the big ortion with t the lowes
cent. Large firms (which only accounted for 0.2 per cent of enterprises with mployees) employ 59.7 per cent of these employees- see chart 4.9. It should e
be noted that a very small fraction, (2.9 per cent) of employees work in aenterprise classified as ‘having no employees’13.
Chart 4.9: Proportion of enterprises and employees by firm size
0%
10%
20%
30%
40%
50%
60%
70%
80%
100%
90%
Enterprise with noemployees1
Enterprise withemployees
Small (2-49) Medium (50-249) Large (250+)
Proportions of enteprises
Proportion of employees
Source: Department of Business Innovation and Skills SME statistics for the UK and regions 2009, whole economy. 1 "With no employees" comprises sole proprietorships and partnerships comprising only the self-employed owner-manager(s), and companies
13 1 "With no employees" comprises sole proprietorships and partnerships comprising only the self-employed owner-manager(s), and companies.
Government economic evidence to the Low Pay Commission, December 2010
37
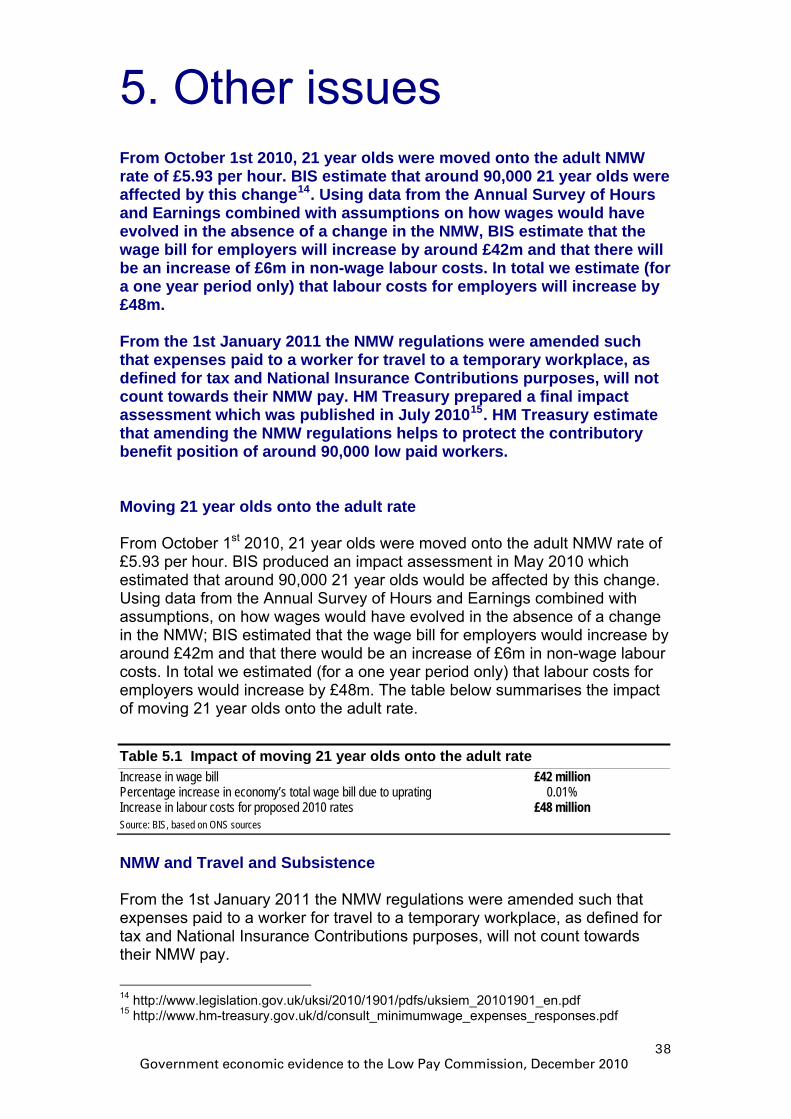
5. Other issues From October 1st 2010, 21 year olds were moved onto the adult NMW rate of £5.93 per hour. BIS estimate that around 90,000 21 year olds were affected by this change14. Using data from the Annual Survey of Hours and Earnings combined with assumptions on how wages would have evolved in the absence of a change in the NMW, BIS estimate that the wage bill for employers will increase by around £42m and that there will be an increase of £6m in non-wage labour costs. In total we estimate (for a one year period only) that labour costs for employers will increase by £48m. From the 1st January 2011 the NMW regulations were amended such that expenses paid to a worker for travel to a temporary workplace, as defined for tax and National Insurance Contributions purposes, will not count towards their NMW pay. HM Treasury prepared a final impact assessment which was published in July 201015. HM Treasury estimate that amending the NMW regulations helps to protect the contributory benefit position of around 90,000 low paid workers. Moving 21 year olds onto the adult rate From October 1st 2010, 21 year olds were moved onto the adult NMW rate of £5.93 per hour. BIS produced an impact assessment in May 2010 which estimated that around 90,000 21 year olds would be affected by this change. Using data from the Annual Survey of Hours and Earnings combined with assumptions, on how wages would have evolved in the absence of a change in the NMW; BIS estimated that the wage bill for employers would increase by around £42m and that there would be an increase of £6m in non-wage labour costs. In total we estimated (for a one year period only) that labour costs for employers would increase by £48m. The table below summarises the impact of moving 21 year olds onto the adult rate.
Table 5.1 Impact of moving 21 year olds onto the adult rate Increase in wage bill £42 million Percentage increase in economy’s total wage bill due to uprating 0.01% Increase in labour costs for proposed 2010 rates £48 million Source: BIS, based on ONS sources
NMW and Travel and Subsistence From the 1st January 2011 the NMW regulations were amended such that expenses paid to a worker for travel to a temporary workplace, as defined for tax and National Insurance Contributions purposes, will not count towards their NMW pay.
14 http://www.legislation.gov.uk/uksi/2010/1901/pdfs/uksiem_20101901_en.pdf 15 http://www.hm-treasury.gov.uk/d/consult_minimumwage_expenses_responses.pdf
Government economic evidence to the Low Pay Commission, December 2010
38
HM Treasury prepared a final impact assessment which was published in July 201016. HM Treasury estimate that amending the NMW regulations helps to protect the contributory benefit position of around 90,000 low paid workers. The Government estimates that on average, a temporary worker earning the National Minimum Wage works 27 hours per week. It is assumed that approximately 33 per cent of their pay is sacrificed to the travel and subsistence scheme. This, along with workers reduced entitlement to working tax credits, results in an expected Exchequer yield of £20m in 2010-11 and £90m for 2011 onwards. This is based on a proposed implementation date of 1st January 2011 and assumes that all businesses will comply with the change of Regulations. The increased Exchequer revenue represents a transfer payment from employers and employees to the Exchequer. It should be noted that it is standard practice for all tax measures that revenue effects or changes in tax yield are not incorporated into the main cost/benefit analysis. This is primarily due to the fact that they are pure transfers and, as they are generally much larger than the other costs and benefits, tend to distort the cost/benefit ratio. This could give a misleading picture of the balance between the costs and benefits of the measure.
16 http://www.hm-treasury.gov.uk/d/consult_minimumwage_expenses_responses.pdf
Government economic evidence to the Low Pay Commission, December 2010
39
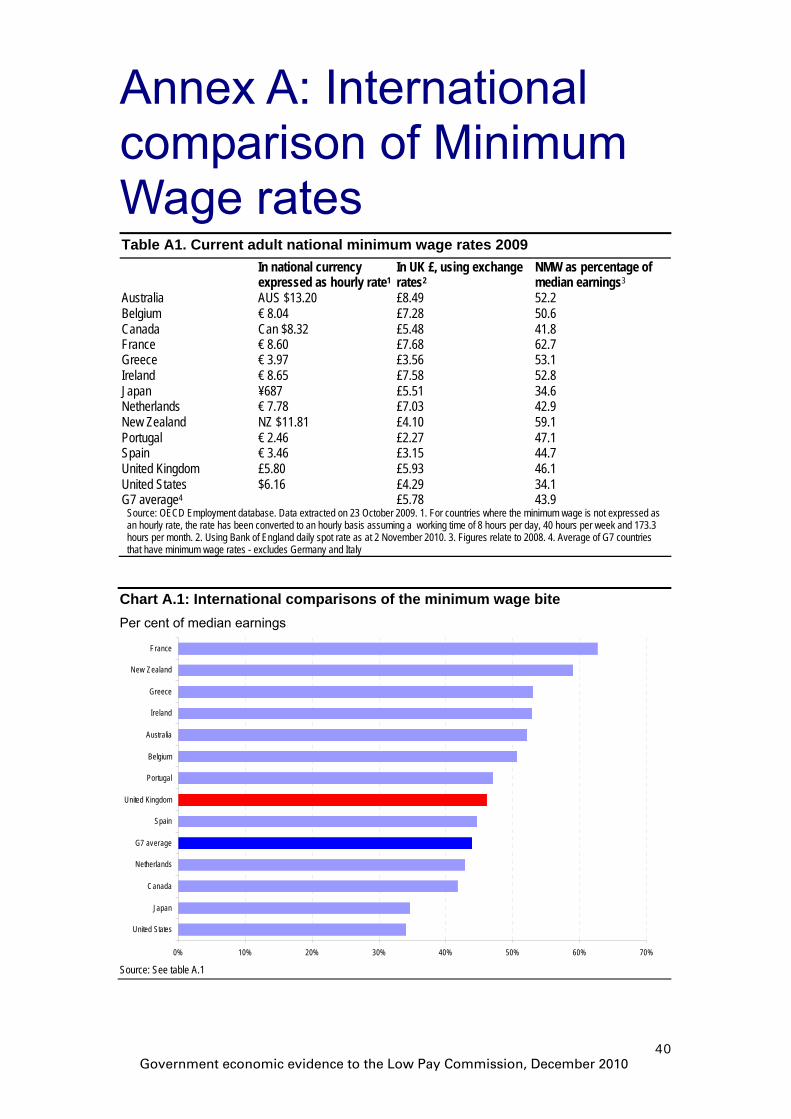
Annex A: International comparison of Minimum Wage rates Table A1. Current adult national minimum wage rates 2009
In national currency expressed as hourly rate1
In UK £, using exchange rates2
NMW as percentage of median earnings3
Australia AUS $13.20 £8.49 52.2 Belgium € 8.04 £7.28 50.6 Canada Can $8.32 £5.48 41.8 France € 8.60 £7.68 62.7 Greece € 3.97 £3.56 53.1 Ireland € 8.65 £7.58 52.8 Japan ¥687 £5.51 34.6 Netherlands € 7.78 £7.03 42.9 New Zealand NZ $11.81 £4.10 59.1 Portugal € 2.46 £2.27 47.1 Spain € 3.46 £3.15 44.7 United Kingdom £5.80 £5.93 46.1 United States $6.16 £4.29 34.1 G7 average4 £5.78 43.9
Source: OECD Employment database. Data extracted on 23 October 2009. 1. For countries where the minimum wage is not expressed as an hourly rate, the rate has been converted to an hourly basis assuming a working time of 8 hours per day, 40 hours per week and 173.3 hours per month. 2. Using Bank of England daily spot rate as at 2 November 2010. 3. Figures relate to 2008. 4. Average of G7 countries that have minimum wage rates - excludes Germany and Italy
Chart A.1: International comparisons of the minimum wage bite Per cent of median earnings
0% 10% 20% 30% 40% 50% 60% 70%
United States
Japan
Canada
Netherlands
G7 average
Spain
United Kingdom
Portugal
Belgium
Australia
Ireland
Greece
New Zealand
France
Source: See table A.1
Government economic evidence to the Low Pay Commission, December 2010
40
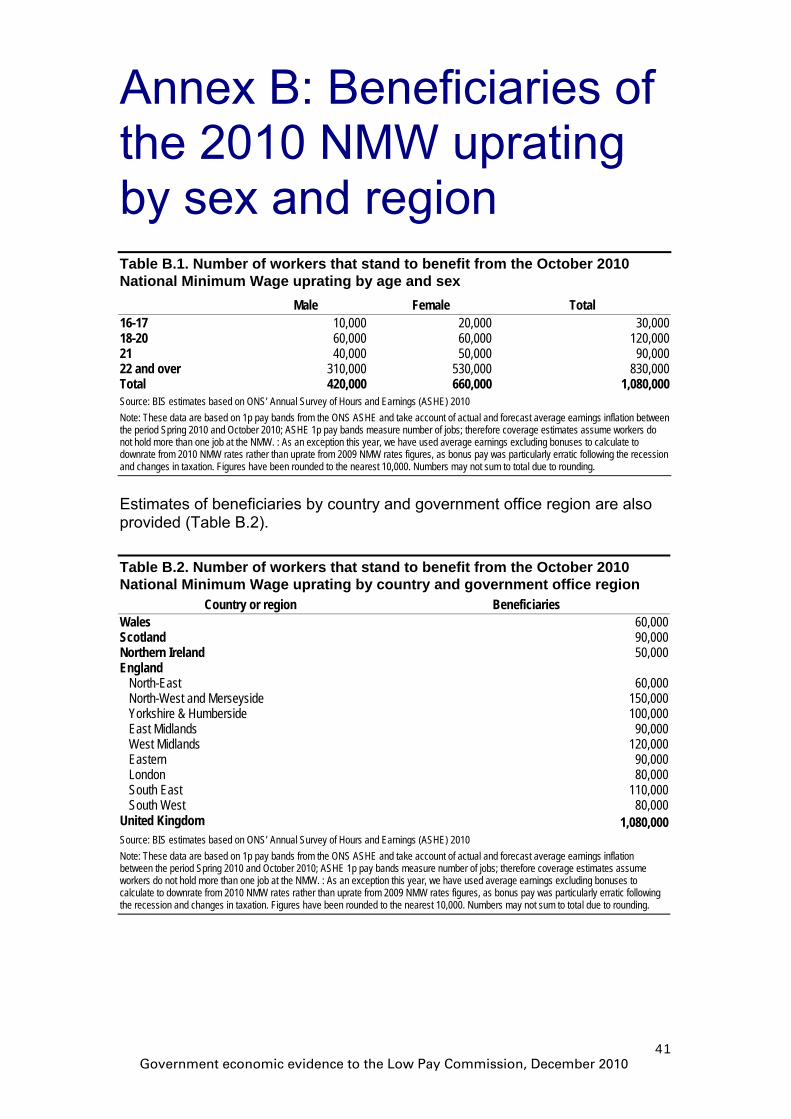
Annex B: Beneficiaries of the 2010 NMW uprating by sex and region
Table B.1. Number of workers that stand to benefit from the October 2010 National Minimum Wage uprating by age and sex Male Female Total 16-17 10,000 20,000 30,000 18-20 60,000 60,000 120,000 21 40,000 50,000 90,000 22 and over 310,000 530,000 830,000 Total 420,000 660,000 1,080,000 Source: BIS estimates based on ONS’ Annual Survey of Hours and Earnings (ASHE) 2010 Note: These data are based on 1p pay bands from the ONS ASHE and take account of actual and forecast average earnings inflation between the period Spring 2010 and October 2010; ASHE 1p pay bands measure number of jobs; therefore coverage estimates assume workers do not hold more than one job at the NMW. : As an exception this year, we have used average earnings excluding bonuses to calculate to downrate from 2010 NMW rates rather than uprate from 2009 NMW rates figures, as bonus pay was particularly erratic following the recession and changes in taxation. Figures have been rounded to the nearest 10,000. Numbers may not sum to total due to rounding.
Estimates of beneficiaries by country and government office region are also provided (Table B.2).
Table B.2. Number of workers that stand to benefit from the October 2010 National Minimum Wage uprating by country and government office region
Country or region Beneficiaries Wales 60,000 Scotland 90,000 Northern Ireland 50,000 England North-East 60,000 North-West and Merseyside 150,000 Yorkshire & Humberside 100,000 East Midlands 90,000 West Midlands 120,000 Eastern 90,000 London 80,000 South East 110,000 South West 80,000 United Kingdom 1,080,000 Source: BIS estimates based on ONS’ Annual Survey of Hours and Earnings (ASHE) 2010 Note: These data are based on 1p pay bands from the ONS ASHE and take account of actual and forecast average earnings inflation between the period Spring 2010 and October 2010; ASHE 1p pay bands measure number of jobs; therefore coverage estimates assume workers do not hold more than one job at the NMW. : As an exception this year, we have used average earnings excluding bonuses to calculate to downrate from 2010 NMW rates rather than uprate from 2009 NMW rates figures, as bonus pay was particularly erratic following the recession and changes in taxation. Figures have been rounded to the nearest 10,000. Numbers may not sum to total due to rounding.
Government economic evidence to the Low Pay Commission, December 2010
41
Annex C: Review of minimum wage research This short review summarises the recent empirical analysis of the labour market impacts of minimum wages. It focuses on UK research but also highlights some international, particularly US, evidence. For completeness this overview considers the recent literature which has been commissioned by the LPC. The evidence presented so far has been in the context of a growing labour market. There is less evidence, from both the UK and internationally, of the impact of minimum wages in periods of economic downturn. This literature review was conducted in November 2008. Employment effects There are three broad approaches to analysing the impact of minimum wages on employment using:
• Individual-level longitudinal data to estimate the impact on individual employment and hours worked. For example, Stewart (2004a and 2004b) compared the employment experience of individual workers affected with those not affected by the minimum wage. He found little evidence that the introduction of the national minimum wage, or the 2000 and 2001 upratings, had an adverse impact on the probability of employment. Dickens and Draca (2005) considered the 2003 uprating, finding insignificant disemployment effects. Similarly, Mulheirn (2008) looked at the 2006 uprating and found no evidence of an adverse employment impact and also found a positive effect on job retention for males from the uprating. Alternatively, Robinson and Wadsworth (2007) investigated the impact of the minimum wage on the incidence of second job holding in Britain. Their results suggest there is little evidence that the extra pay provided by the introduction of the NMW and its subsequent upratings was sufficient to affect the incidence of second job holdings. Jones et al (2006) found that increases in the exit rate from employment, as measured by ASHE, was actually less for the low-paid than the high paid.
• Spatial data to explore whether employment declined more in
areas with a high proportion of low-wage jobs. Stewart (2002) analysed employment changes across 140 areas for the period straddling the introduction of the NMW. Stewart’s estimates show no or negative impacts on employment (for example, a 5 per cent rise in the wages for the 5th and 10th percentile was reflected in a 2 per cent reduction in employment), but the latter was not statistically significant. However, Galindo-Rueda and Pereira (2004) did find that the net growth in employment was slightly less in areas with a relatively high proportion of workers affected by the NMW. While Experian’s (2006) study of the relationship between the NMW bite and regional employment found no association for retail, there was a small negative
Government economic evidence to the Low Pay Commission, December 2010
42

impact on employment in the hospitality sector from the 2003 and 2004 upratings.
• Using firm level data to examine whether or not employment fell
relatively more in those workplaces with a high proportion of low paid individuals. Kersley et al (2004) used the Workplace Employment Relations Survey to find no difference in closure rates between low-paying and other workforces, and low-paying workplaces were less likely to experience a fall in employment of over 25 per cent. Draca et al (2006) also found no correlation between the introduction of the NMW and closures, although they found a fall in profit margins. However, a number of studies of the care home sector have found employment effects. Machin and Wilson (2004) found that those firms affected by the NMW were likely to suffer relative employment falls: for example, a 10 per cent increase in the proportion initially paid below the NMW was associated with 1.3 per cent lower employment growth. There is also evidence of a negative effect on hours.
Overall, while evidence is mixed, there is a lack of strong evidence of negative employment consequences from the introduction and subsequent upratings of the adult National Minimum Wage. However, Neumark and Wascher (2007) argue that the evidence for the UK is not unambiguous. In particular, the existing UK research is limited to estimating short-term effects and there may be longer-term impacts of the minimum wage. In addition, the employment effects of the relatively larger rise in the minimum wage from 2003 to 2006 have not yet been sufficiently studied. A report by the Income Data Service (2006) studied the UK labour market in the last recession and found that the impacts on low-paying sectors were minimal and that the level of employees in hospitality and retail remained relatively stable over this time period. It should be noted past performance does not necessary reflect future performance and in previous recessions the UK did not have a NMW. Indeed there are a much wider range of estimates of the effects of minimum wages on employment in the US. In particular, longer panel studies that incorporate both state and time variation in minimum wages tend to find statistically significant employment effects from minimum wage increases. In contrast, the majority of US studies that found zero or positive effects of the minimum wage on low-skill employment were either short panel data studies or sector-specific case studies (Neumark and Wascher, 2007). One exception to this was a paper by Lutterman (2007) who studied the 1990/91 increase in the federal minimum wage. By estimating the wage corresponding to a constant skill level change over time and using this information to infer each worker’s skill from actual wage paid to this individual. Lutterman evidence showed the increase in minimum wage reduced the employment among unskilled workers, however their employment reduction seems largely compensated for by increased employment among the next skill group, which is likely to be a close substitute.
Government economic evidence to the Low Pay Commission, December 2010
43
Effects on hours worked Employers in low-paying sectors may alter hours rather than levels of employment in response to minimum wages.17 Therefore, it is important to look at the impact on hours worked to understand the impact of the minimum wage on the labour market. There is some evidence that introduction of the UK National Minimum Wage may have led to a reduction of working hours, particularly over the longer–term. For example, Stewart and Swaffield (2006) found a small but insignificant effect of the minimum wage on hours worked in the UK. However, the lagged effect of the minimum wage on hours is always negative, larger in value and generally statistically significant. The study concludes that the introduction of the minimum wage led to the reduction of one to two hours per week for affected workers. Couch and Wittenburg (2001) found that raising the minimum wage reduced the hours of work of teenagers in the US. As a result, they argue that estimates of the elasticity of teen labour demand with respect to the minimum wage based on employment data consistently understate the effect of minimum wage increases on labour utilisation by 10 per cent to 30 per cent. Effects on wage distribution The bottom quarter of the earnings distribution has experienced faster growth than the median since the introduction of the minimum wage, with these increases being greater for those who were lowest paid (Butcher, 2005 and OECD, 2006). This implies an upward ‘ripple effect’ from the National Minimum Wage within the bottom part of the wage distribution. Lam et al (2006) showed that wages for jobs near the minimum level have moved closely with the minimum wage, maintaining differentials. Other studies have found no strong evidence of ripple effects when the NMW was introduced in 1999 or uprated 2000-02 (Dickens and Manning 2004a, 2004b; Dickens and Draca 2005). However, there is evidence of such effects from the 2003 uprating onwards (Butcher 2005 and Dickens and Manning 2006). However, as these ripple effects dissipate as they move up the wage distribution, there has also been compression with the average and median wage. Metcalf (2004) found that workers in the bottom decile of pay experienced above average pay rises between 1998 and 2002, with no effects further up the wage distribution. Cameron and Fernandez (2007) find that the difference between the low paid and the average paid (whether mean or median) has been compressed. However, the upper part of the income distribution has been pulling away from the middle at the same time as the lower part has been compressing the middle. This is an area whether further research is needed. Lam et al (2006) suggest that more analysis of small firms is needed, as a number of low-paying
17 This is because low-pay sectors have low fixed cost per worker, little on-the-job training, high labour turnover, limits to the substitution of capital for labour and a high incidence of part-time work (OECD 2006).
Government economic evidence to the Low Pay Commission, December 2010
44
sectors are dominated by very small firms, where the impact of small pay changes may be large. Effects on younger workers The academic evidence for the impacts of minimum wages on the young are a little more mixed, with somewhat more evidence for disemployment effects than is the case with adults. Neathey, Ritchie and Silverman (2005) found little evidence in the retail and hospitality sectors of a link between the minimum wage and decisions to employ young workers of various ages. However, Frayne and Goodman (2005) found that every 1 per cent increase in the 16–17 year old wage resulted in a 3.6 per cent decrease in employment in hours amongst this group, implying that a minimum wage of £3.00 would reduce employment in hours by around 6 per cent. Several international studies have found evidence that minimum wages can have disemployment effects on the young. Campolieti, Fang and Gunderson (2005) found minimum wage elasticities ranging from −0.3 to −0.5. Wessels (2005) found significant negative effects on teenager labour force participation for 16-19 year olds in the US. Dickerson and Jones (2004) found that a minimum wage set between £2.50 and £4.00 will have negligible effects on education participation of 16-17 year olds. However, Rice (2006) finds that the probability of continued participation of young men in full-time education declines significantly as the expected wage increases, although the effects for young women are smaller and not statistically significant. Based on this analysis, Rice (2006) suggests that the impact of ‘a cautiously set’ minimum wage for 16 and 17 year olds on educational and employment outcomes is likely to be small. A NMW set at a level corresponding to the lowest decile of the observed distribution of actual earnings would reduce the expected participation rate in full-time further education among young males by no more than 1 percentage point. A more generous NMW set at the equivalent of the lower quartile would result in a decline of between 1 and 2.4 percentage points depending on the extent of the spillover effects on the overall distribution of wage offers. Effects on profitability and prices The impact of the minimum wage on employment will be muted the greater the extent to which the rise in labour costs is passed on in the form of higher prices or absorbed in a fall in profits. The impact on overall inflation of the NMW is likely to be small, as the NMW only applies to a relatively small proportion of total jobs. However, there is some evidence of increases in the relative prices of goods and services produced by minimum wage workers. Wadsworth (2007) found prices rose, on average, by an extra 0.8 per cent a year relative to the RPI after the NMW was introduced. Wadsworth (2007) also found that there was considerable variation in the inflation rate movement of individual minimum wage goods, as identified by Wadsworth. Hotels for example experienced a 2 per cent raise
Government economic evidence to the Low Pay Commission, December 2010
45
above general inflation, while the price of pub drinks followed the general price inflation. There is also some limited evidence that the initial introduction of the NMW caused a relative fall in profits in the more affected firms. Draca et al. (2006) found that average profit margins fell for those most affected by the National Minimum Wage by 8 per cent to 11 per cent, compared to the control group of higher-wage firms. Their analysis of a sample of care homes also shows that those that had to raise their wages the most experienced the biggest drop in profits. In a follow-up study, Georgiadis (2006) found a negative association between homes with a larger fraction of affected workers and profitability, but it was not statistically significant. Experian (2006) found that relative gross operating surplus in the retail and hospitality sectors between 1999 and 2004 was lower in regions where the bite of the NMW was strongest but again the association was not statistically significant.
Government economic evidence to the Low Pay Commission, December 2010
46
Annex D: Technical note Annual Survey of Hours and Earnings (ASHE) The ASHE is an annual survey of 1 per cent of the employee workforce. The survey provides information about the levels, distribution and make-up of earnings and hours paid for employees within industries, occupations and regions. While almost everything collected on ASHE is collected on the LFS, the employer rather than the individual reports the information and this means greater accuracy of the reporting on hours worked and wages earned. ASHE has a much lower refusal rate, as employers must supply this information under the trade act and it also has the advantage of being based on payroll records rather than recall. In this report, charts and figures stating the bite of the NMW has been calculated the standard weight of the ASHE, in line with ONS and LPC methodologies. From 2009, ASHE moved from using Standard Industrial Classification 1992 (SIC 92) to SIC 2007. Estimates for 2004-2010 have been produced using ASHE, which replaced the New Earnings Survey (NES) in 2004. ASHE improves on the NES by extending the coverage of the survey sample and introducing weighting. From 1997-2003, estimates are based on NES datasets that have been reworked using ASHE methodology. However, these datasets exclude the supplementary ASHE information and as a result there is an inconsistency between estimates in 2003 and 2004. A further break in the data was also introduced in 2006 when ONS introduced a small number of methodological changes, including changes to the sample design itself as well as the introduction of an automatic occupation coding tool., ONS published two estimates for both 2004 and 2006 to identify these changes – one on the new methodology and one based on the previous methodology; where appropriate these inconsistencies are identified in this report. Finally, the sample size was reduced to 0.8 per cent of employee workforce in the 2007 and 2008 surveys before being restored by Government departments’ in an agreement for funding until 2011. ONS is committed to look at new ways of running the survey from 2012. Employee jobs series The ONS employee job series is derived from a variety of surveys;
• Private sector jobs (except construction and agriculture) come from the Short Term Employer Surveys (STES)
• Construction and agriculture jobs from the LFS
• Public sector jobs come from Public Sector Employment (PSE) estimates using the Quarterly Public Sector Employment Surveys (QPSES) covering LAs, the civil service and public bodies; and administrative sources from the devolved administrations (WAG, SG) and OGDs such as DoH for the NHS and the Home Office for police and probation.
• Finally, employee jobs in Northern Ireland are provided by their ministry for employment (DETINI) from their Quarterly Employer Survey.
Government economic evidence to the Low Pay Commission, December 2010
47

Government economic evidence to the Low Pay Commission, December 2010
48
From 2010 Q1 the series was redeveloped and moved from using Standard Industrial Classification 1992 (SIC 92) to SIC 2007. In addition to changes in SIC codes other major changes to the employee job series included a new ratio estimator which replaced the non-standard ‘matched pairs’ method. Changes were made to the method for apportioning reporting units by their local units. Great Britain quarterly employee jobs series is now benchmarked to the latest Annual Business Inquiry (ABI) estimates for 2007 and 2008. Benchmarking discontinuities have been removed, PSE inputs have been revised, LFS inputs and systems have been revised. There were also changes to the sample design, size allocation and periodicity of the STES. Further information on the redevelopment of the workforce jobs series (of which employee jobs is a component) can be found on the ONS website, see http://www.statistics.gov.uk/StatBase/Product.asp?vlnk=9765&Pos=&ColRank=1&Rank=422 . Labour Force Survey (LFS) The LFS is a quarterly survey of around 52,000 households (120 thousand people) and the source also comes in a number of variants like the household and longitudinal LFS, the rolling annual LFS known as Annual Population Survey (APS) and Integrated Household Survey (IHS) with 300 thousand and 400 thousand households sampled respectively. The LFS is the best estimate of employment and individual socio-economic characteristics and is widely used across Government and wider labour market analytical work. The LFS is not just useful for its frequency, size and flexible structure, but the vast amount of information it collects on an individual’s workplace, job and personal characteristics. The survey is mandated by Europe and every member state is required to carry one out on a periodic basis. From 2009 Q1, the LFS moved from using Standard Industrial Classification 1992 (SIC 92) to SIC 2007. All unemployment estimates comply with the International Labour Organisation (ILO) definition of unemployment. All unemployment rates are shown as the proportion of economically active individuals which are defined as unemployed by the ILO definition. For more information see www.ilo.org.
References Addison J., Blackburn M., Cotti C. (2008) New estimates of the effects of minimum wages in the US Retail Trade Sector. IZA discussion paper No. 3597 Blanchflower, D., Saleheen, J. and Shadforth, C. (2007) The Impact of the Recent Migration from Eastern Europe on the UK Economy, Bank of England. http://www.bankofengland.co.uk/publications/speeches/2007/speech297.pdf Bryan M. and Taylor M. (2006) Identifying and explaining patterns of NMW receipt in Britain 1999-2004. Report to Low Pay Commission. Institute for Social and Economic Research, University of Essex Butcher T. (2005) The hourly earnings distribution before and after the National Minimum Wage. Labour Market Trends. October 2005 Cameron G. and Fernandez R. (2007) The national minimum wage towards a predictable framework. University of Oxford. August 2007. Campolieti, M., Fang, T. and Gunderson, M. (2005). Minimum Wage Impacts on Youth Employment Transitions, 1993-1999. Canadian Journal of Economics, Vol. 38(1): 81-104. Couch K. and Wittenburg (2001) The response of hours of work to increases in the minimum wage. Denvir, A. and Loukas, G. (2007) The impact of the National Minimum Wage: Pay differentials and workplace change. A report for the Low Pay Commission. Institute for Employment Studies. Dickens R. and Draca M. (2005) The employment effects of the October 2003 increase in the National Minimum Wage. Centre for Economic Performance, February. Report prepared for Low Pay Commission. Dickens R. and Manning A. (2004a) Spikes and spillovers: the impact of the National Minimum Wage on the wage distribution in a low-wage sector. Economic Journal, 114 (494), March, C95-C101. Dickens R. and Manning A. (2004b) How the National Minimum Wage reduced wage inequality. Journal of Royal Statistical Society, Series C. Dickerson A. (2007) Longer-term implications of the NMW: A re-examination of employer-provided training. A report to the Low Pay Commission Dickerson, A. and Jones, P. (2004) Estimating the impact of the Minimum Wage on the labour market behaviour of 16-17 year olds. LPC Commissioned Research. Dustmann C., Fabbri F., Preston I. and Wadsworth J. (2003) The local labour market effects of immigration in the UK, Home Office Online Report 06/03. http://eprints.ucl.ac.uk/14331/1/14331.pdf Dustmann, C., Frattini, T. and Preston, I. (2007) A study of migrant workers and the national minimum wage and enforcement issues that arise. Report commissioned by the Low Pay Commission (http://www.econ.ucl.ac.uk/cream/pages/LPC.pdf).
Government economic evidence to the Low Pay Commission, December 2010
49

Draca M., Machin S. and Van Reenen J. (2006) Minimum wages and firm profitability. Centre for Economic Performance Discussion Paper 715, February. Epstein, Heizler (Cohen), O. (2007) Illegal Migration, Enforcement and minimum wage IZA discussion paper No. 2830 Ercolani, M. and Robson, M. (2006) Does Raising the Pay of Low wage employees reduce their rate of sickness absence? Evidence from the impact of minimum wage legislation. Working Paper Experian (2006) Investigating the Sectoral and Regional Effects of the 2003 and 2004 National Minimum Wage Upratings. Report to Low Pay Commission, November. Frayne, C. and Goodman, A. (2004). ‘The impact of introducing a National Minimum Wage for 16-17 year olds on employment and education outcomes’. LPC Commissioned Research. Galindo-Rueda F. and Pereira S. (2004) The Impact of the National Minimum Wage on British Firms. Report to Low Pay Commission, September. Georgiadis A. (2006) Is the Minimum Wage Efficient? Evidence of the Effects of the UK National Minimum Wage in the Residential Care Homes Sector. CMPO Working Paper 06/160, Bristol University. Georgiadis A. (2008) Efficiency wages and the economic effects of the minimum wage: evidence from a low-wage labour market. CEP discussion paper no 857 Gilpin, N., Henty, M., Lemos, S.; Portes, J. and Bullen, C. (2006) The Impact of Free Movement of Workers from Central and Eastern Europe on the UK. http://research.dwp.gov.uk/asd/asd5/WP29.pdf Government Reply to the First Report from the House of Lords Committee on Economic Affairs Session 2007-08 HL Paper 82 (2008) The Economic Impact of Immigration. http://www.parliament.uk/documents/upload/GovernmentResponse.pdf House of Lords Select Committee on Economic Affairs (2008) The Economic Impact of Immigration Volume 1: Report. http://www.publications.parliament.uk/pa/ld200708/ldselect/ldeconaf/82/82.pdf Jones M., Jones R., Latreille P., Murphy P. and Sloane P. (2006) Analysing Flows into and out of the National Minimum Wage. Report to Low Pay Commission, October. Jones M., Jones R., Murphy P. and Sloane P. (2007) A persistence model of the national minimum wage. IZA discussion paper No. 2595. Kersley B., Alpin C., Forth J., Bryson A., Bewley H., Dix G and Oxenbridge S. (2006) Inside the Workplace: Findings from the 2004 Workplace Employment Relations. Survey, London: Routledge. Income Data Services (2006) Monitoring the impact of the national minimum Wage in low-paying sectors. A report to the Low Pay Commission Income Data Services (2006) The impact of economic recession on pay increases and the low paid. A report to the Low Pay Commission
Government economic evidence to the Low Pay Commission, December 2010
50
Lam K., Omerod C., Ritchie F. and Vase, P. (2006) Do company wage policies persist in the face of minimum wages. Labour Market Trends. Office for National Statistics. Lemos, S. and Portes, J. (2008) The impact of migration from the new European Union Member State on Native workers. http://research.dwp.gov.uk/asd/asd5/wp52.pdf Lutterman, E. (2007) Does the minimum wage causes inefficient rationing? IZA discussion paper No. 2713 Mason M., Carter S., and Tagg, S.K. (2006) The effect of the national minimum wage on the UK small business sector: a geographical analysis. Environment and Planning C: Government and Policy, Vol 24, pg 99 -166 Machin, S. (2008) Big idea rising wage inequality. Centre Piece Autumn 2008 Machin S. and Wilson J. (2004) Minimum Wages in a Low-Wage Labour Market: Care Homes in the UK. Economic Journal, 114 (494), March, C102-109. Metcalf D. (2004) The impact of the national minimum wage on the pay distribution, employment and training. Economic Journal. Vol. 114. Issue: 494: C84-C86. Metcalf D. (2007) Why Has The British National Minimum Wage Had Little or No Impact on Employment? London School of Economics. Mulheirn I. (2008) The impact of the 2006 National Minimum wage rise on employment. Economic Labour Market Review, Vol 2, No 9. Neathey, F., Ritchie, H. and Silverman, M. (2005). The employment of young people in the retail and hospitality sectors. LPC Commissioned Research. Neumark D., Schweitzer M. and Wascher W. (2004) Minimum Wage Effects throughout the Wage Distribution. Journal of Human Resources. Vol. 39 (2): 425-50. Neumark D. and Wascher W. (2007) Minimum Wages and Employment. Foundations and Trends in Microeconomics, Vol 3, No 1-2, 1 -187. Nickell, S. and Saleheen, J (2008) The Impact of Immigration on Occupational Wages: Evidence from Britain. http://www.bos.frb.org/economic/wp/wp2008/wp0806.pdf OECD (2007) Improving work prospects for the least skilled – chapter three in OECD Economic Surveys: United Kingdom. Office for National Statistics (2009) Migration Statistics Quarterly Report No.2 August 2009. http://www.statistics.gov.uk/pdfdir/mig0809.pdf Rice P. (2006) Wages and the Education and Employment Choices of Young People: Empirical Analysis for Great Britain. Discussion Papers in Economics and Econometrics. University of Southampton. www.socsci.soon.ac.uk/economics/Research/Discussion_Papers. Robinson H. and Wadsworth J. (2006) The impact of the minimum wage on the incidence of second job holding in Britain. IZA discussion paper No. 2445.
Government economic evidence to the Low Pay Commission, December 2010
51
Government economic evidence to the Low Pay Commission, December 2010
52
Saleheen, J. and Shadforth C. (2006) The Economic Characteristics of Immigrants and their Impact on Supply. Quarterly Bulletin, Vol. 46, No. 4, Bank of England, London. Stewart M. (2002) Estimating the impact of the minimum wage using geographical wage variation. Oxford Bulletin of Economics and Statistics, 64, 583-605. Stewart M. (2004a) The impact of the introduction of the UK minimum wage on the employment probabilities of low wage workers. Journal of the European Economic Association, 2, 67-97. Stewart M. (2004b) The employment effects of the national minimum wage. The Economic Journal, 114, C110-C116. Stewart M. and Swaffield (2006) The other margin: Do minimum wages cause working hours adjustment for low-wage workers? Unpublished paper. University of Warwick. Wadsworth J. (2007) Did the Minimum Wage Change Consumption Patterns? Report to Low Pay Commission. Centre for Economic Performance Working Paper 1517, January. Wessels, W. (2005). ‘Does the Minimum Wage Drive Teenagers Out of the Labour Force?’. Journal of Labour Research, Vol.26(1): 169-76. White G. and Croucher R. (2007) Awareness of the Minimum wage in the hairdressing industry: an evaluation of the DTI/HMRC targeted campaign. A research report for the Low Pay Commission.

© Crown copyright 2011
You may re-use this information (not including logos) free of charge in any format or medium, under the terms of the Open Government Licence. To view this licence, visit http://www.nationalarchives.gov.uk/doc/open-government-licence/ or write to the Information Policy Team, The National Archives, Kew, London TW9 4DU, or e-mail: [email protected].
This publication is also available on our website at http://www.bis.gov.uk
Any enquiries regarding this publication should be sent to: Department for Business, Innovation and Skills 1 Victoria Street London SW1H 0ET Tel: 020 7215 5000 If you require this publication in an alternative format, email [email protected], or call 020 7215 5000. URN 11/P109