government form and public spending: theory and evidence ... · government form and public...
TRANSCRIPT
Revised January 2011
Government Form and Public Spending: Theory and Evidence
from U.S. Municipalities∗
Abstract
There are two main forms of government in U.S. cities: council-manager and mayor-council. This
paper develops a theory of fiscal policy determination under these two forms. The theory predicts
that expected public spending will be lower under mayor-council but that either form of government
could be favored by a majority of citizens. The latter prediction means that the theory is consistent
with the co-existence of both government forms. Support for the former prediction is found in both
a cross-sectional analysis and a panel analysis of changes in government form.
Stephen Coate
Department of Economics
Cornell University
Ithaca NY 14853
Brian Knight
Department of Economics
Brown University
Providence RI 02912
brian [email protected]
∗We are particularly indebted to Alan Auerbach, Ruben Enikolopov, Lynn MacDonald, Torsten Persson,Stephen Ross, Razvan Vlaicu, and two anonymous referees for very helpful comments. We also thank
Tracy Gordon, Peter Marino, Marion Orr, Martin Shefter, Steven Tadelis, Francesco Trebbi, and seminar
participants at Berkeley, Columbia, Maryland, Simon Fraser, and UBC for useful discussions and comments.
Financial support from the National Science Foundation (Grant SES-0452561) is gratefully acknowledged.
1 Introduction
There are two main forms of government in U.S. cities: mayor-council and council-manager.
Under the mayor-council form, a mayor and city council are independently elected by voters
and jointly develop policy. Under the council-manager form, policy-making power resides
with the city council. The council appoints a manager to assist in the administration of city
government functions, but this manager has no authority over policy development and can
be replaced at any time by a vote of the council.1 While some council-manager cities retain
the position of mayor, the role is typically largely ceremonial.2
This paper develops a theory of fiscal policy determination under these two forms of
government. This theory considers a city government charged with choosing among a set of
projects or programs that could be undertaken. It assumes that the passage of projects under
mayor-council requires the support of both the mayor and a majority of council-members,
whereas under council-manager it requires the support of only the council. In addition, it
assumes that voters have only partial information about the policy preferences of candidates
for city-level offices. When voters choose candidates sincerely, these assumptions imply that
expected spending will be lower under mayor-council than under council-manager. Moreover,
this result generally remain true even when voters are sophisticated and choose candidates
accounting for the different biases of the two systems.
The paper also uses the theory to provide a positive analysis of the choice of government
form. It shows that either form of government could be chosen by citizens in a referendum.3
Thus, even though mayor-council leads to lower spending, it is not necessarily majority
1 The mayor-council form is the traditional form of municipal government in the U.S.. The council-
manager form appeared first in 1908 in Staunton, VA and spread widely over the next half century as
part of the municipal reform movement. See Knock (1982) for a historical analysis of the spread of the
council-manager form.
2 In the traditional council-manager form of government there is either no mayor or a council-member
is selected to be mayor by the council. In recent decades, many council-manager cities have chosen to
separately elect a mayor. However, in these cities the mayor typically serves on the council and has less
power than his counter-part in a mayor-council city.
3 While the process by which cities may change their form of government varies across the states, it is
typically the case that a change must be approved by a majority of city residents in a referendum. Referenda
1
preferred. While mayor-council may eliminate some projects which the majority oppose, it
may also remove projects which the majority support. Citizens’ choice of government form
will appropriately balance these benefits and costs. In this way, the theory can explain the
co-existence of both government forms in U.S. cities.
The paper then investigates the theory’s prediction of lower government spending under
mayor-council form. It constructs a dataset that includes form of government and fiscal
policy outcomes based on a large sample of cities covering the years 1982, 1987, 1992,
1997, and 2002. A cross-sectional analysis reveals that spending is significantly lower in
mayor-council cities. A panel analysis of cities that changed their form of government,
also shows that spending falls (rises) following switches to mayor-council (council-manager),
relative to jurisdictions not changing their form of government. The theoretical prediction
is therefore supported. The quantitative magnitudes are large: the panel analysis suggests
that per-capita spending is about 9 percent lower in mayor-council cities. Assuming that
this represents the causal effect of government form, municipal spending as a fraction of
GDP would decrease by 0.16 percent if all cities in the U.S. switched to a mayor-council
form.4
2 Related literature
There is a large literature on the differences between council-manager and mayor-council
cities, dating back at least to the 1960s. Not surprisingly, differences in public spending
across the two forms have been a major focus. Early results were mixed, with some studies
finding higher spending under mayor-council (e.g., Booms (1966) and Lineberry and Fowler
(1967)) and some finding lower spending (e.g., Clark (1968) and Sherbenou (1961)). Later
work tended to the view that there is no difference (e.g., Deno and Mehay (1987), Farnham
can be initiated either by the city council or by petition of citizens.
4 In 2002, per-capita city government spending was about $1,000, or 2.78 percent of per-capita GDP
(which was about $36,000) and around 60 percent of cities were council-manager. Thus, our estimate
implies that average per-capita city government spending was 1037 in council-manager cities and 944 in
mayor-council cities. It follows that if all council-manager cities switched to mayor-council, average per-
capita city government spending would be 944 which is 262 percent of per capita GDP.
2
(1990), Hayes and Chang (1990), and Morgan and Pelissero (1980)).5 This conclusion is
reinforced by the recent work of MacDonald (2008), which is the most sophisticated analysis
to date.6 She uses a large, nationally-representative sample of cities and tracks fiscal policy
outcomes and political institutions over two decades. Although her main focus is on the
effects of the size of the city council, she also investigates the effects of government form.7
In both a cross-sectional analysis and in a fixed effects panel analysis that is identified by
cities changing their form of government over time, she finds no significant differences in
government spending between mayor-council and council-manager.
This work looking at spending differences has largely been atheoretical, offering few ar-
guments for why fiscal policy outcomes might differ across government forms. Early papers
suggested that council-manager cities might have lower costs because managers were pro-
fessionals with training in public administration. This neglects the fact that mayor-council
cities can (and indeed do) hire administrators with such training or select mayors with
managerial skills. Another argument was that city managers were more detached from the
political process and therefore would be more able to hold down costs. However, as Deno and
Mehay (1987) point out, council-members face political pressures and, since the manager is
responsible to the council, these pressures should be effectively conveyed to the manager.
Indeed, perhaps the most persuasive theoretical argument in the literature is that, in either
form, political competition should ensure that spending is in line with the level demanded
by the median voter (Deno and Mehay (1987)).
This paper advances the literature on spending differences under mayor-council and
5 In a study focused on the effect of council size, Baqir (2002) finds that mayor-council form tends to
reduce over-spending associated with larger city councils. That is, the coefficient on the interaction between
council size and mayor-council form is negative and statistically significant. The coefficient on the non-
interacted mayor-council form variable, however, is positive. Thus, the effect of mayor-council form on
per-capita spending depends upon the size of the council, with the effect turning from positive to negative
at a council size of 6, which is also the median council size in the dataset.
6 We developed our empirical analysis independently of MacDonald’s paper and thank Razvan Vlaicu for
bringing it to our attention.
7 MacDonald finds no relationship between the size of the council and government spending, and her
results thus challenge the findings of Baqir (2002) and others that larger city councils produce higher spending
levels.
3
council-manager in two ways. First, it starts with an explicit theory of spending deci-
sions under the two government forms. The model departs from the median voter paradigm
by incorporating realistic imperfections in the political process and delivers a clear predic-
tion about the difference in size of government under the two forms. Second, it reaches an
empirical conclusion at odds with the conventional wisdom in the literature.
In finding empirical differences between the two forms of government, our paper com-
plements three recent papers that identify policy differences in areas other than aggregate
spending. Levin and Tadelis (2010) show that council-manager cities are more likely to
privatize services than mayor-council cities. They suggest that this result may reflect the
explicitly political motivations of mayors, relative to those of city managers. Levin and
Tadelis also show that privatization reduces fiscal costs, so the fact that council-manager
cities are more likely to privatize should lower their costs. This finding does not contradict
ours if, as our theory suggests, council-manager cities undertake more projects in any given
service area. Enikolopov (2007) compares the policies of council-manager and mayor-council
cities with respect to public employment. He finds that the number of full-time public
employees is significantly higher in mayor-council cities, while the number of part-time em-
ployees displays no difference.8 He argues that this is because mayor-council governments
are more likely to value patronage jobs than are council-manager governments. These find-
ings are fully consistent with those of Levin and Tadelis because privatization will reduce
full-time public employment. Vlaicu (2008) finds a relatively large and statistically signif-
icant electoral cycle in police office hiring in mayor-council cities, which is not present in
council-manager cities. This difference in responsiveness is present both in a cross-sectional
analysis and in an analysis of cities that switched their form of government. Vlaicu argues
that his finding reflects the fact that mayors have more incentive to pander to voters than
8 A number of earlier papers explored the effect of government form on municipal wage levels with mixed
results. See, for example, Edwards and Edwards (1982), Ehrenberg (1973), and Ehrenberg and Goldstein
(1975).
4
do city-managers.9
A further related strand of the council-manager versus mayor-council literature is that
seeking to understand why cities adopt one or the other form. Various theories of why cities
switched to council-manager and adopted other related reforms have been offered.10 These
theories typically focus on class or ethnic conflict. A number of papers have explored these
theories empirically, and have found little support for any of them (e.g., Dye and MacManus
(1976), Farnham and Bryant (1985), and Knoke (1982)). Rather, the main empirical finding
has been the importance of regional factors: council-manager cities are most prevalent in
the West and the South. Our theory offers an alternative account of why cities choose one
or the other form.
Our paper also relates to a literature on presidential versus parliamentary forms of gov-
ernment at the national level.11 Under a presidential form of government, the legislature
and executive are independently elected, while under a parliamentary form, the executive
is typically a member of the governing coalition in the legislature and is not independently
elected by voters. At the local level, the mayor-council form is analogous to the presidential
form, while the council-manager form is closer to the parliamentary form. Some papers in
9 Vlaicu develops a two period political agency model which generates this prediction.
10 Switches to council-manager were often accompanied by switches to at-large elections for council-
members and non-partisan elections.
11 Also worth mentioning is the literature on elected versus appointed public officials. This literature seeks
to understand the differences in policy choices made by public officials who are directly elected by the voters
and those who are appointed by other elected politicians (e.g., Alesina and Tabellini (2007), Besley and
Coate (2003), and Maskin and Tirole (2004)). Since city-managers are appointed by the council and mayors
are directly elected by the voters, it may seem that the comparison of the policies made by council-manager
and mayor-council governments falls squarely within the purview of this literature. However, it should be
emphasized that officially city-managers and mayors have very different roles in the policy-making process.
In a mayor-council city, the mayor jointly develops policy along with the council. In a council-manager city,
the manager is an administrator not a policy-maker. The theory of spending decisions presented in this paper
reflects this official distinction by assuming that the manager has no impact on policy in a council-manager
government and therefore plays a very different role from the mayor in a mayor-council government. This
said, we acknowledge that managers may have de facto policy-making power and it may therefore be useful to
apply the insights from the elected versus appointed literature to the council-manager versus mayor-council
question. Theoretical efforts in this direction by Enikolopov (2007) and Vlaicu (2008) should therefore be
regarded as complementary to the theory presented here.
5
this literature are concerned with how fiscal policy differs under the two forms.12 Pers-
son, Roland and Tabellini (2000) examine these issues theoretically in the context of an
infinite-horizon political agency model in which rent-maximizing politicians are imperfectly
controlled by the threat of re-election. They show that a presidential form leads to smaller
government. While this paper’s theory produces a similar finding, the underlying mechanism
is different. In particular, our theory adopts a more optimistic view of the political process,
viewing politicians as heterogeneous actors seeking to move policy in their preferred direc-
tion. This is arguably a more appropriate view for local politics in the U.S. where political
rents appear limited.
On the empirical front, Persson and Tabellini (2003) analyze how fiscal policies differ
across countries with presidential and parliamentary forms of government. They find that
the size of government is significantly smaller in nations with presidential forms.13 In
a panel analysis, Persson and Tabellini (2006) study how becoming a democracy impacts
countries’ economic policies and growth. They find that government spending decreases in
countries who adopt a presidential form of government, but increases in countries who adopt
a parliamentary form. Persson and Tabellini’s empirical results stand in sharp contrast to
the conventional wisdom in the council-manager versus mayor-council literature that there
is little difference in public spending across the two forms. While politics at the national
level is certainly more complicated than at the local level, one might expect similar political
institutions to have similar effects in both contexts. Our empirical analysis suggests that
this may indeed be the case.
12 See Carey (2004) for a broader overview of the literature, the bulk of which focuses on party-related
issues such as the formation of governing coalitions, votes of confidence, etc. These are less relevant in the
municipal context, where many elections are non-partisan (i.e., candidate party affiliations do not appear
on the ballot) and cities are often dominated by a single party.
13 Recently, this finding has been challenged by Blume, Muller, Voigt, and Wolf (2009).
6
3 Theory
This section presents our theory of fiscal policy determination under the two forms of city
government. It outlines the theoretical model and derives the model’s implications for spend-
ing decisions and choice of government form. It then identifies and defends the theory’s key
assumptions.
3.1 The model
The job of the city government is to choose the projects or programs the city should under-
take. There are potential projects indexed by = 1 . Each project is characterized
by a per capita tax cost and a benefit parameter . Citizens differ in the extent to which
they value public programs. There are three preference types: high, moderate, and low,
indexed by ∈ { } respectively. If project is undertaken, a citizen of preference type receives a payoff of − where . The fraction of citizens of preference
type is denoted . Both and are less than 12, implying that the median voter is a
moderate.
We compare two different forms of city government: council-manager and mayor-council.
In the council-manager form, an seat city council is responsible for project decisions. A
project is implemented if and only if it is supported by of the council-members. In the
mayor-council form, project decisions are the responsibility of an − 1 seat city council anda mayor. For a project to be undertaken, it must be supported by − 1 council-membersand the mayor.14 Notice that in both forms the number of politicians is constant at and
the minimum number of supporters needed for a project to be implemented is . All that
differs across the forms is that, under mayor-council, the politician who is the mayor has
additional power.15
14 The motivation for this assumption will be discussed in Section 3.4 below.
15 Our objective is to hold everything constant but the allocation of decision-making authority. Thus,
we are implicitly holding the size of the city administration constant as well. In our conception, when a
city switches from council-manager to mayor-council, the administrator who is the manager in the council-
manager form becomes the city’s chief administrative officer in the mayor-council form. An alternative
7
Under both government forms, politicians are selected by the citizens in elections. Politi-
cians are citizens and thus will also be either high, moderate, or low preference types. Fol-
lowing the citizen-candidate approach, these preferences will govern their decision-making
when in office. At the time of the elections, citizens cannot observe how much candidates
value public programs. They do, however, observe a signal of each candidate’s preference
type ∈ { }.16 The probability that a candidate of signal type ∈ { } has preferencetype ∈ { } is . We assume that =
= and that =
= where
and are positive numbers such that 1 − . Thus, candidates of signal type
are more likely to be high preference types and candidates of signal type are more likely
to be low preference types. Moreover, symmetry prevails in the sense that the likelihood
that a candidate of signal type is a high preference type equals the likelihood that a
candidate of signal type is a low preference type and visa versa. For each seat in the
council and mayor’s office, there are two candidates, one of each signal type. This electoral
process is consistent with either district-based elections, in which council members represent
geographic constituencies, or at-large elections, in which all council-members represent the
entire city.17
When in office, a politician of preference type ∈ { } will support introducingapproach would be to compare an member council with a manager and an member council with a mayor,
under the assumption that the mayor undertakes the manager’s adminstrative work. In this conception, when
a city switches to mayor-council, the number of politicians is increased by one at the same time the number
of adminstrators is reduced by one, so that the total number of city officials (politicians plus adminstrators)
remains constant. Note that the implications for public spending are broadly similar under this alternative
conception. The details are available from the authors upon request.
16 This signal should be thought of as emerging during the campaign as a result of media coverage of
candidates’ backgrounds, televised debates, campaign advertising, newspaper endorsements, etc. It should
not be interpreted as a strategic choice - otherwise, candidates would simply choose to send the signal most
likely to get them elected. In cities with partisan elections, it is natural to expect party affiliation to be one
component of the signal. That said, using a regression discontinuity design, Ferreira and Gyourko (2009)
find that city spending does not differ under Republican and Democratic mayors.
17 In our data, about sixty percent of cities have at-large council elections, and the remaining forty percent
have either single-member district council elections or mixed systems with both district-based and at-large
seats. The procedure for at-large elections varies across municipalities. In some, if there are seats up for
election, each voter can vote for up to candidates, and the candidates with the most votes are elected.
In others, seats are numerically labeled (i.e., Council Seat #1, Council Seat #2, etc) and candidates must
choose which seat to compete for. See Dye and MacManus (2003) for more detail. For an interesting analysis
of the choice between at-large and district-based elections see Aghion, Alesina and Trebbi (2008).
8
project if its benefit/cost ratio exceeds 1. Relabelling as necessary, we may
assume that projects with lower index numbers have higher benefit/cost ratios; that is,
11 22, etc. Let denote the identity of the marginal project for citizens of
preference type ; that is, = max{ : ≥ 1}, and assume that 1
. Under either form of government, projects 1 through will be implemented and
projects + 1 through will not be funded. The uncertainty concerns projects + 1
through . There are three possible outcomes: i) none of these projects are undertaken; ii)
projects + 1 through are funded; and iii) all of these projects are implemented. These
outcomes will depend upon the types of politicians who hold office but in a way that differs
across the form of government.
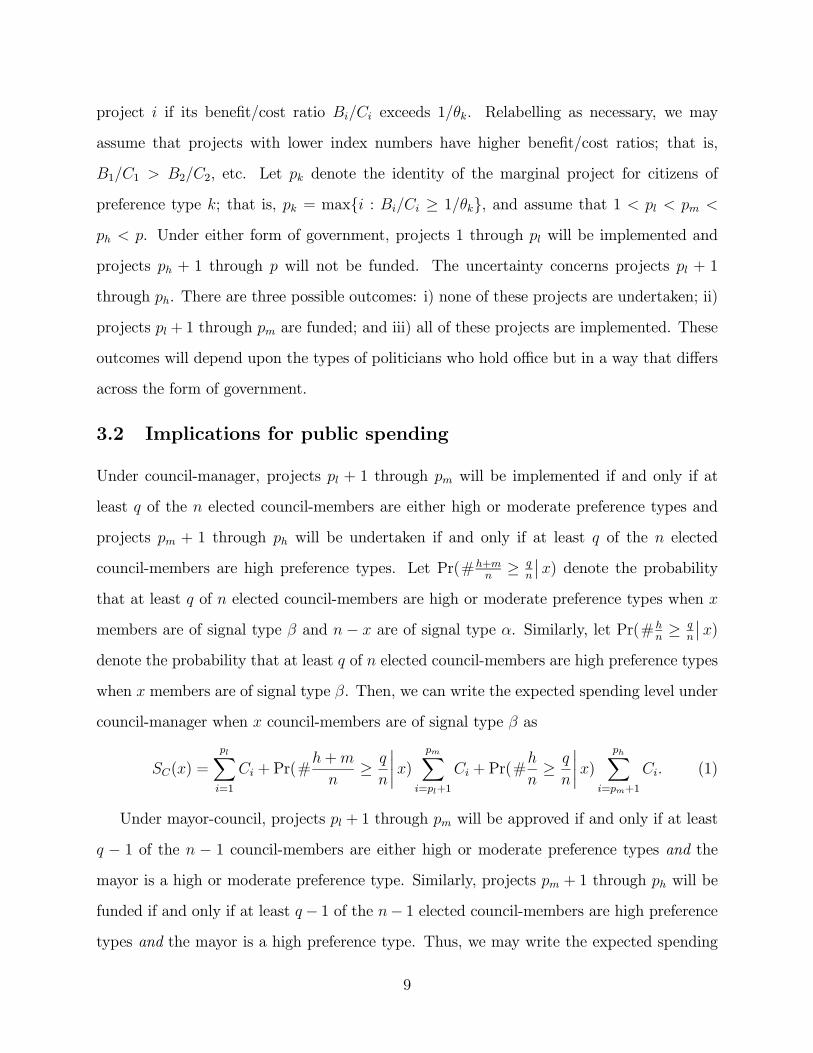
3.2 Implications for public spending
Under council-manager, projects + 1 through will be implemented if and only if at
least of the elected council-members are either high or moderate preference types and
projects + 1 through will be undertaken if and only if at least of the elected
council-members are high preference types. Let Pr(#+≥
¯̄) denote the probability
that at least of elected council-members are high or moderate preference types when
members are of signal type and − are of signal type . Similarly, let Pr(#≥
¯̄)
denote the probability that at least of elected council-members are high preference types
when members are of signal type . Then, we can write the expected spending level under
council-manager when council-members are of signal type as
() =
X=1
+Pr(#+
≥
¯̄̄̄)
X=+1
+Pr(#
≥
¯̄̄̄)
X=+1
(1)
Under mayor-council, projects + 1 through will be approved if and only if at least
− 1 of the − 1 council-members are either high or moderate preference types and themayor is a high or moderate preference type. Similarly, projects + 1 through will be
funded if and only if at least − 1 of the − 1 elected council-members are high preferencetypes and the mayor is a high preference type. Thus, we may write the expected spending
9
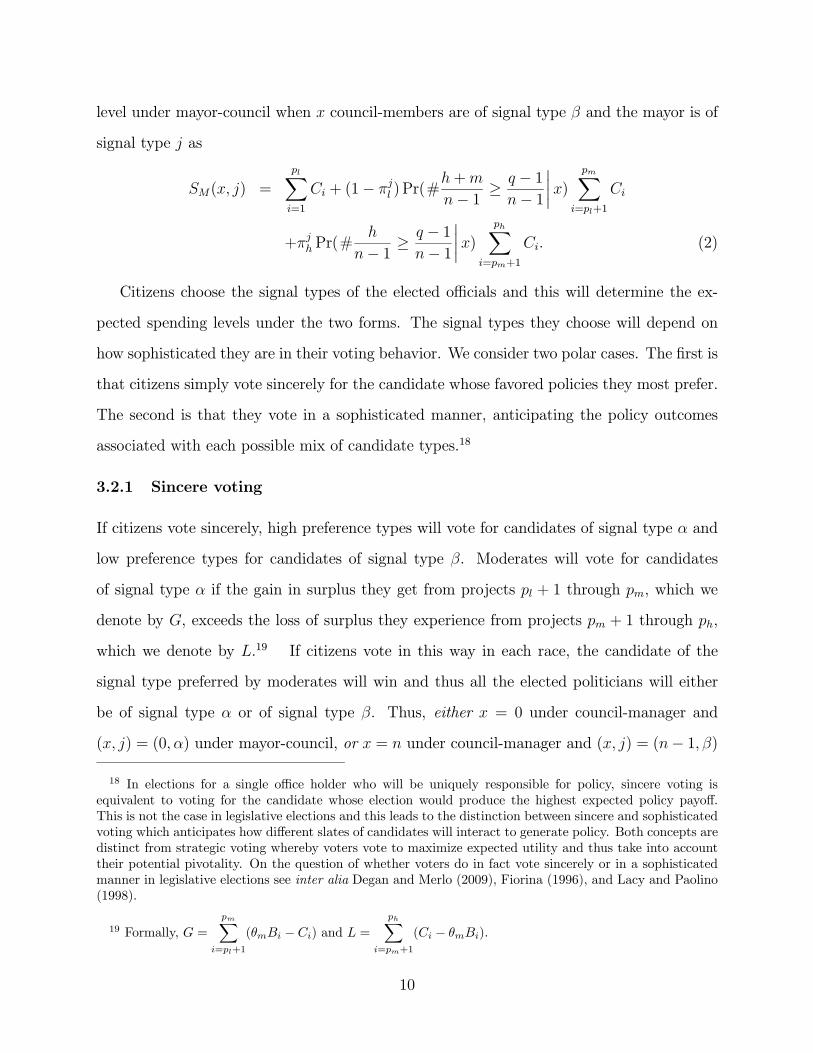
level under mayor-council when council-members are of signal type and the mayor is of
signal type as
( ) =
X=1
+ (1− ) Pr(#
+
− 1 ≥ − 1− 1
¯̄̄̄)
X=+1
+Pr(#
− 1 ≥ − 1− 1
¯̄̄̄)
X=+1
(2)
Citizens choose the signal types of the elected officials and this will determine the ex-
pected spending levels under the two forms. The signal types they choose will depend on
how sophisticated they are in their voting behavior. We consider two polar cases. The first is
that citizens simply vote sincerely for the candidate whose favored policies they most prefer.
The second is that they vote in a sophisticated manner, anticipating the policy outcomes
associated with each possible mix of candidate types.18
3.2.1 Sincere voting
If citizens vote sincerely, high preference types will vote for candidates of signal type and
low preference types for candidates of signal type . Moderates will vote for candidates
of signal type if the gain in surplus they get from projects + 1 through , which we
denote by , exceeds the loss of surplus they experience from projects + 1 through ,
which we denote by .19 If citizens vote in this way in each race, the candidate of the
signal type preferred by moderates will win and thus all the elected politicians will either
be of signal type or of signal type . Thus, either = 0 under council-manager and
( ) = (0 ) under mayor-council, or = under council-manager and ( ) = (− 1 )
18 In elections for a single office holder who will be uniquely responsible for policy, sincere voting is
equivalent to voting for the candidate whose election would produce the highest expected policy payoff.
This is not the case in legislative elections and this leads to the distinction between sincere and sophisticated
voting which anticipates how different slates of candidates will interact to generate policy. Both concepts are
distinct from strategic voting whereby voters vote to maximize expected utility and thus take into account
their potential pivotality. On the question of whether voters do in fact vote sincerely or in a sophisticated
manner in legislative elections see inter alia Degan and Merlo (2009), Fiorina (1996), and Lacy and Paolino
(1998).
19 Formally, =
X=+1
( − ) and =
X=+1
( − ).
10
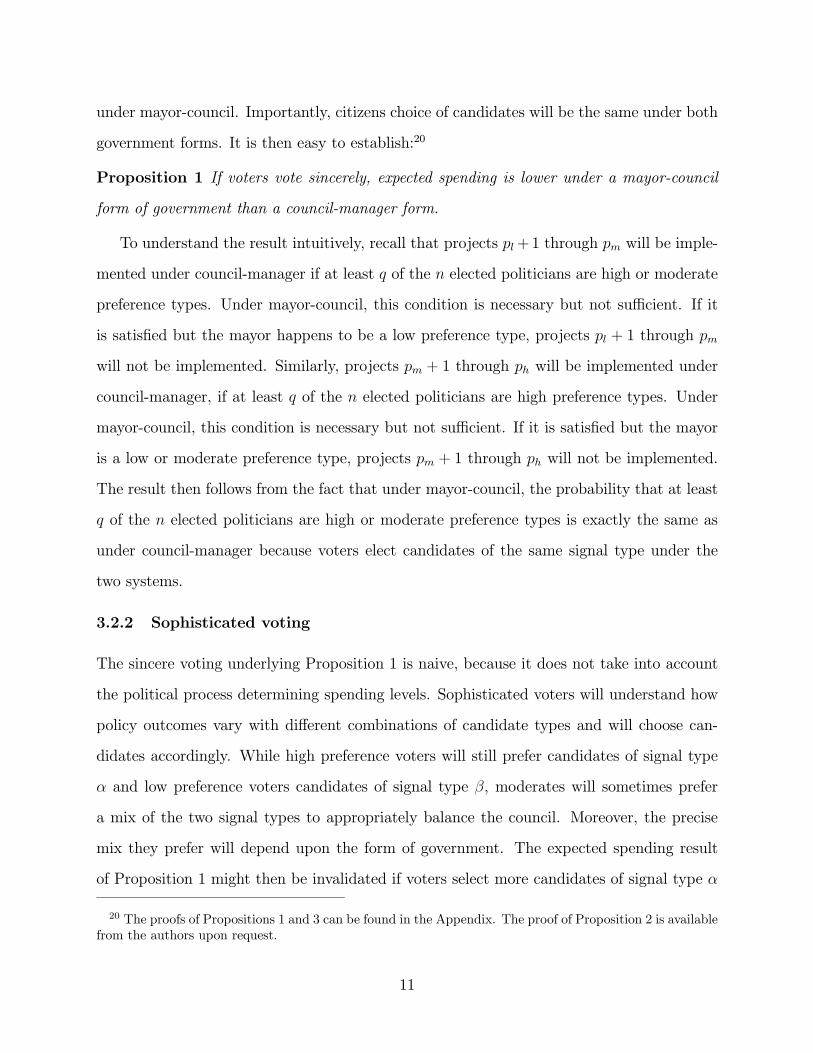
under mayor-council. Importantly, citizens choice of candidates will be the same under both
government forms. It is then easy to establish:20
Proposition 1 If voters vote sincerely, expected spending is lower under a mayor-council
form of government than a council-manager form.
To understand the result intuitively, recall that projects +1 through will be imple-
mented under council-manager if at least of the elected politicians are high or moderate
preference types. Under mayor-council, this condition is necessary but not sufficient. If it
is satisfied but the mayor happens to be a low preference type, projects + 1 through
will not be implemented. Similarly, projects + 1 through will be implemented under
council-manager, if at least of the elected politicians are high preference types. Under
mayor-council, this condition is necessary but not sufficient. If it is satisfied but the mayor
is a low or moderate preference type, projects + 1 through will not be implemented.
The result then follows from the fact that under mayor-council, the probability that at least
of the elected politicians are high or moderate preference types is exactly the same as
under council-manager because voters elect candidates of the same signal type under the
two systems.
3.2.2 Sophisticated voting
The sincere voting underlying Proposition 1 is naive, because it does not take into account
the political process determining spending levels. Sophisticated voters will understand how
policy outcomes vary with different combinations of candidate types and will choose can-
didates accordingly. While high preference voters will still prefer candidates of signal type
and low preference voters candidates of signal type , moderates will sometimes prefer
a mix of the two signal types to appropriately balance the council. Moreover, the precise
mix they prefer will depend upon the form of government. The expected spending result
of Proposition 1 might then be invalidated if voters select more candidates of signal type
20 The proofs of Propositions 1 and 3 can be found in the Appendix. The proof of Proposition 2 is available
from the authors upon request.
11
under mayor-council.
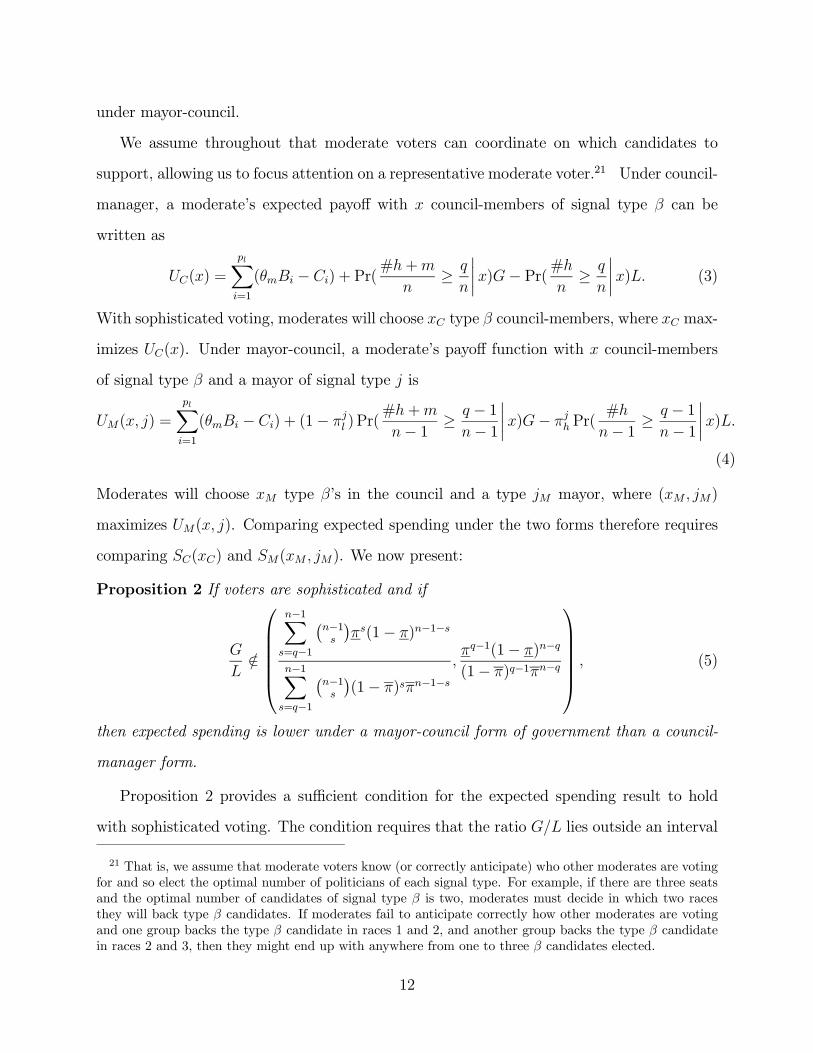
We assume throughout that moderate voters can coordinate on which candidates to
support, allowing us to focus attention on a representative moderate voter.21 Under council-
manager, a moderate’s expected payoff with council-members of signal type can be
written as
() =
X=1
( − ) + Pr(#+
≥
¯̄̄̄)− Pr( #
≥
¯̄̄̄) (3)
With sophisticated voting, moderates will choose type council-members, where max-
imizes (). Under mayor-council, a moderate’s payoff function with council-members
of signal type and a mayor of signal type is
( ) =
X=1
( − ) + (1− ) Pr(
#+
− 1 ≥ − 1− 1
¯̄̄̄)−
Pr(
#
− 1 ≥ − 1− 1
¯̄̄̄).
(4)
Moderates will choose type ’s in the council and a type mayor, where ( )
maximizes ( ). Comparing expected spending under the two forms therefore requires
comparing () and ( ). We now present:
Proposition 2 If voters are sophisticated and if
∈
⎛⎜⎜⎜⎜⎜⎝−1X
=−1
¡−1
¢(1− )−1−
−1X=−1
¡−1
¢(1− )−1−
−1(1− )−
(1− )−1−
⎞⎟⎟⎟⎟⎟⎠ (5)
then expected spending is lower under a mayor-council form of government than a council-
manager form.
Proposition 2 provides a sufficient condition for the expected spending result to hold
with sophisticated voting. The condition requires that the ratio lies outside an interval
21 That is, we assume that moderate voters know (or correctly anticipate) who other moderates are voting
for and so elect the optimal number of politicians of each signal type. For example, if there are three seats
and the optimal number of candidates of signal type is two, moderates must decide in which two races
they will back type candidates. If moderates fail to anticipate correctly how other moderates are voting
and one group backs the type candidate in races 1 and 2, and another group backs the type candidate
in races 2 and 3, then they might end up with anywhere from one to three candidates elected.
12

determined by , , and the parameters ( ). This turns out to be a very mild requirement.
To see this, consider the case of = 3 and = 2. The condition in this case amounts to
∈³(2−)1−2
(1−)(1−)
´. Note first that, if , then the condition will necessarily be satisfied
since, by assumption, and 1−. If , on the other hand, there exist feasible
combinations of and for which the condition will not be satisfied. Figure 1 depicts these
feasible sets for equal to 025, 050, and 075. Evidently, when compared with the
set of all and satisfying the assumptions and 1 − , these sets represent a
small part of the parameter space. Moreover, for larger values of , the set of parameter
values violating the condition is even smaller.22 Thus, Proposition 2 can be interpreted as
implying that the expected spending result of Proposition 1 will typically hold even with
sophisticated voters.
Proposition 2 naturally raises the question of whether the expected spending result will
fail when (5) is not satisfied. The answer is not necessarily, but possibly. The Appendix
presents an example with = 3 and = 2 in which the parameters ( ) violate (5)
and the probability of approving projects +1 through and projects +1 through
is higher under mayor-council. Obviously, this implies that the expected spending level will
be higher under mayor-council.
To sum up, in principle, sophisticated voting could undermine the spending difference
between the two forms of government if voters select candidates who are more likely to be low
preference types under council-manager. However, the analysis suggests that this will not be
the case. Admittedly, the model is restrictive in assuming that voters have only two signal
types of candidates from which to choose. Moreover, introducing multiple types of candidates
would make the model very intractable. Nonetheless, the analysis demonstrates that the
spending result is at least somewhat robust to relaxing the sincere voting assumption.
22 The most common council sizes in our dataset are 5 members and 7 members.
13
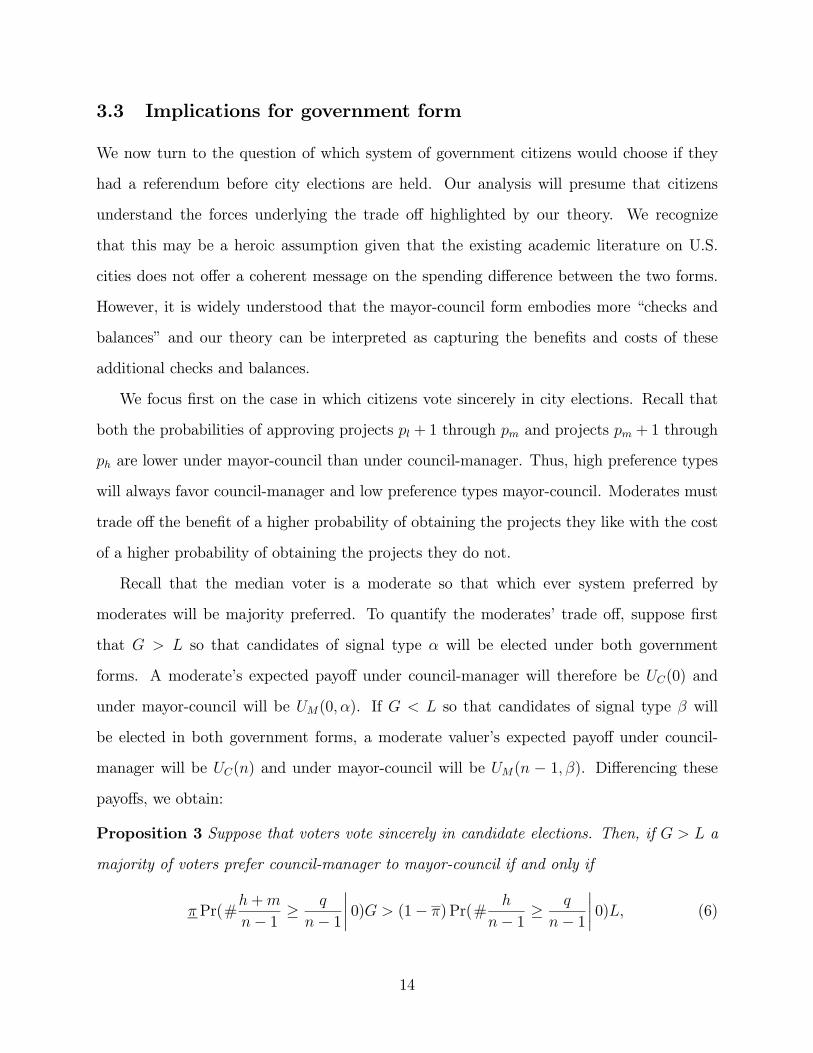
3.3 Implications for government form
We now turn to the question of which system of government citizens would choose if they
had a referendum before city elections are held. Our analysis will presume that citizens
understand the forces underlying the trade off highlighted by our theory. We recognize
that this may be a heroic assumption given that the existing academic literature on U.S.
cities does not offer a coherent message on the spending difference between the two forms.
However, it is widely understood that the mayor-council form embodies more “checks and
balances” and our theory can be interpreted as capturing the benefits and costs of these
additional checks and balances.
We focus first on the case in which citizens vote sincerely in city elections. Recall that
both the probabilities of approving projects + 1 through and projects + 1 through
are lower under mayor-council than under council-manager. Thus, high preference types
will always favor council-manager and low preference types mayor-council. Moderates must
trade off the benefit of a higher probability of obtaining the projects they like with the cost
of a higher probability of obtaining the projects they do not.
Recall that the median voter is a moderate so that which ever system preferred by
moderates will be majority preferred. To quantify the moderates’ trade off, suppose first
that so that candidates of signal type will be elected under both government
forms. A moderate’s expected payoff under council-manager will therefore be (0) and
under mayor-council will be (0 ). If so that candidates of signal type will
be elected in both government forms, a moderate valuer’s expected payoff under council-
manager will be () and under mayor-council will be ( − 1 ). Differencing thesepayoffs, we obtain:
Proposition 3 Suppose that voters vote sincerely in candidate elections. Then, if a
majority of voters prefer council-manager to mayor-council if and only if
Pr(#+
− 1 ≥
− 1
¯̄̄̄0) (1− ) Pr(#
− 1 ≥
− 1
¯̄̄̄0) (6)
14

and if a majority of voters prefer council-manager to mayor-council if and only if
Pr(#+
− 1 ≥
− 1
¯̄̄̄− 1) (1− ) Pr(#
− 1 ≥
− 1
¯̄̄̄− 1) (7)
To understand this result intuitively, consider the case in which . The term
multiplying on the left hand side of inequality (6) is the probability that under mayor-
council, more than of the −1 council-members will be high or moderate preference typesbut the mayor will be a low preference type. This is precisely the circumstance under which
projects + 1 through will be rejected under mayor-council but would not have been
under council-manager. Similarly, the term multiplying on the right hand side of inequality
(6) is the probability that under mayor-council, more than of the − 1 council-memberswill be high preference types and the mayor will not be a high preference type. This is the
probability that projects + 1 through will be rejected under mayor-council but would
not be under council-manager. Essentially, therefore, the median voter’s choice between
council-manager and mayor-council involves trading off an expected benefit and an expected
cost. The benefit is that mayor-council will eliminate projects that would be implemented
under council-manager that the median voter does not want. The cost is that mayor-council
will eliminate projects that would be implemented under council-manager that the median
voter wants.
The most important point to note from this proposition is that, even though mayor-
council produces lower expected spending levels, it is not necessarily preferred by a majority
of voters. Thus, the theory can explain the fact that both government forms co-exist. It is
clear from (6) and (7) that council-manager will be more likely to be favored by voters when
the surplus from projects that low preference types would remove (i.e., ) is high relative
to the loss from projects that high preference types would add (i.e., ). It is also clear that,
when and there is only a very small chance that candidates of signal type are low
preference types (i.e., ≈ 0) then mayor-council dominates. For in this case there is littlechance that desirable projects will be rejected under either form of government and hence
the median voter just wants to maximize the chance that undesirable projects are rejected.
15
Similarly, when and there is only a very small chance that candidates of signal type
are high preference types (i.e., ≈ 0) then there is no chance that undesirable projectswill be approved and the median voter just wants to maximize the chance that desirable
projects are approved. Council-manager therefore dominates.
Note that Proposition 3 assumes that moderate voters understand the difference in spend-
ing between mayor-council and council-manager when choosing the form of government but
nonetheless vote sincerely in candidate elections. For the purposes of this exercise, therefore,
it may be more logically consistent to assume sophisticated voting in candidate elections.
However, as shown above, with sophisticated voting, except possibly in a very small part
of the parameter space, both the probabilities of approving projects + 1 through and
projects + 1 through , are lower under a mayor-council form of government. Thus, in
choosing between the two forms, moderate voters must again trade off the same expected
benefit and cost. All that differs is that the expectations are more complex because they
depend upon voters’ endogenous choice of candidates.
3.4 Discussion
Our theory of fiscal policy determination under mayor-council and council-manager forms of
government makes three key assumptions. First, candidates for public office have heteroge-
neous preferences over public programs which, while governing their behavior if elected, are
not perfectly observed by voters. Second, under council-manager, programs are implemented
if and only if they receive support from the required majority of the council. Third, under
mayor-council, programs are funded if and only if they receive support from the required
majority of the council and the mayor.
The first assumption is necessary to generate a difference between the two forms. If
all politicians had the same preferences or, alternatively, if voters could perfectly observe
politicians’ preferences and elect only those who shared the majority preference, then the
two forms of government would deliver exactly the same project choices.23 While such
23 This conclusion would be in line with Deno and Mehay (1987) and the median voter approach to local
16
unobservable heterogeneity seems uncontroversial, one might argue that politicians will not
indulge their preferences when in office because of the fear of not being re-elected. However,
as a matter of fact, the rewards to holding office at the city level are not large. Moreover, even
if the rewards of office were large, re-election incentives will be dampened by the fact that
politicians are collectively responsible for project decisions. Indeed, there is much empirical
evidence to the effect that politicians follow their policy preferences even when holding offices
that are highly prestigious (see, for example, Levitt (1996) on U.S. senators).24
The main content of the second assumption is that the city manager has no independent
influence on policy choices under council-manager. This is the case despite the fact that
the manager, with the cooperation of city administrators, typically prepares the budget for
the council in council-manager cities. The justification for this assumption is either that the
council is able to appoint a manager who shares the policy preferences of the majority of its
members or that the threat of being fired by the council is sufficient to deter the manager
from indulging his preferences.25
The third assumption is key for the spending result because it creates an asymmetry
between the blocking and passing of projects. In particular, while both the council and
the mayor can unilaterally block projects, the approval of both executive and legislature is
necessary to fund projects. If we had assumed, for example, that a project was implemented
unless it was opposed by both a majority of the council and the mayor, the asymmetry would
go in the other direction and the spending result would be reversed.26 Our motivation for
politics more generally.
24 On this general topic see also Dye and MacManus (2003) who argue that “electoral accountability” has
little direct influence over city council-members. Consistent with our model, they argue that any congruence
between the views of citizens and council-members comes from “belief sharing” (p.381).
25 By all acounts, turnover among city managers is frequent and the time spent in any given city is brief. In
a sample of 120 larger council-manager cities, Ammons and Bosse (2005) found that the median completed
tenure of departing city managers was just five years.
26 An alternative assumption would build in a status quo bias by assuming that the addition of new
projects could be blocked by either the mayor or the council, but the removal of existing projects could be
blocked by either the mayor or the council. In the language of Tsebelis (1995), both the mayor and council
would be “veto players” in the sense of being able to block change. In this case, expected spending would
display more path dependence under mayor-council, but would not necessarily be lower.
17
this assumption comes from studying the way in which budgeting works in mayor-council
cities. A crude description of the process is that the mayor, with the cooperation of city
administrators, prepares a budget which provides a detailed list of the programs that are
to be financed. This is sent to the city council who make amendments to the budget and
approve it. While practices vary across cities, in many mayor-council governments the council
can only amend the mayor’s budget by removing support for programs.27 This process will
result in only programs that have the support of both the mayor and the majority of council-
members being approved, which is our assumption.
In reality, things are more complicated than this simple description suggests, and proce-
dures vary considerably across mayor-council cities. In some cases, at the budget preparation
stage, the mayor may be required to obtain input from an executive committee, which can
contain key members of the council. In other cases, the council may be able to add programs
to the mayor’s budget. At the budget approval stage, the mayor may be able to selectively
veto the council’s amendments or veto the whole package. The council may then be able to
override the mayor’s vetoes with a super-majority vote.28 Despite this variation, we feel
that our assumption is the natural place to start. The mayor’s role in the budget prepara-
tion process gives him/her the agenda-setting ability to focus resources on the projects and
programs that he/she supports. The fact that the council has to approve the budget gives
27 Unfortunately, there is no national database of city budgetary procedures, and our research was thus
limited to case studies. Examples of large cities with this budgetary procedure include Cleveland, New York,
Boston, and San Francisco. We found no cities in which the council could introduce new programs to the
mayor’s budget. See Rubin (1990) and Mullin et al (2004) for additional details. This budgetary process
is also in place in a number of countries with presidential form of governments (see Shugart and Haggard
(2001)). For example, the current Chilean constitution allows Congress to amend each spending item in the
president’s budget downwards only and disallows the transfer of funds across different programs. Baldez
and Carey (1999) provide a theoretical and empirical analysis of the impact of this constitution on policy
outcomes in Chile. In their theoretical work, they use a two player (congress and president) game theoretic
model with two dimensions of spending to compare outcomes under the Chilean constitution with what
would happen under two alternative stylized constitutional rules.
28While the use of such selective vetos does not seem to be important in practice, if it were then our model
would still be a valid description of policy outcomes under mayor-council. The − 1 would just change froma majority to a super-majority. However, the comparison between council-manager would change because
the used would be majoritarian. It seems likely that such a change would make it harder to approve
projects under mayor-council and hence strengthen the result.
18
it the ability to strike out programs from the mayor’s wish list. Even when the council can,
in principle, add new programs, its ability to do so is likely to be somewhat constrained.29
Council-members will typically have little time to devote to crafting their own budgetary
programs. Not only is there a limited time period in which to respond to the mayor’s budget,
but, in the vast majority of cities, council-members work only part-time (see, for example,
Ross and Levine (2006)). In addition, council-members will also have much less information
than the executive about the costs of different budgetary options and such information that
they do have will typically be provided by the executive. Finally, mayors often have powers
of impoundment, in which they can unilaterally withhold funds for projects that have been
approved in the budget.30
4 Evidence
This section investigates the theoretical prediction that ceteris paribus public spending will
be lower under mayor-council than council-manager. It begins by describing the data and
then turns to the econometric analysis of the relationship between government form and
public finances.
4.1 Data
Our empirical analysis uses information on political institutions, government finances, and
city demographics. These three pieces of information are derived from three separate data
sources. Our data on political institutions come from the Municipal Form of Government sur-
vey, which is conducted by the International City/County Management Association (ICMA)
29 In the words of Dye and MacManus (2003): “Council members do not usually serve as either general
policy innovators or general policy leaders. The role of the council is largely passive, granting or withholding
approval in the name of the community when presented with proposals from a leadership outside of itself.”
(p. 380 italics in the original).
30 While these powers are designed to be used only in emergency situations, such as midyear budget
shortfalls, they have sometimes been used in order to block projects supported by the council but not the
mayor. For example, Mayor Guliani attempted to block spending on council priorities during a 1994 budget
shortfall in New York City (New York Times, December 2, 1994).
19

every five years. In particular, we have data from survey years 1981, 1986, 1991, 1996, and
2001. In each year, surveys are sent to roughly 7,000-8,000 municipalities with response
rates in any given year ranging from 50 to 70 percent. This incomplete response rate makes
the panel unbalanced. While ICMA mails surveys to all cities with population greater than
2,500, they only send surveys to a select set of cities with population below 2,500. Given
that this set may not be representative of all small cities, we focus only on those cities with
population in excess of 2,500.
For the cross-sectional analysis, we rely on the survey question regarding whether the city
has a mayor-council or council-manager form of government. In addition to mayor-council
and council-manager forms, a smaller number of municipalities have either a commission,
town meeting, or representative town meeting form.31 Given that over 90 percent of
municipalities have either council-manager or mayor-council forms, our analysis will ignore
these other forms of government.
The panel analysis uses information on changes in government form for specific cities over
time. There are two possible measures of such changes in the ICMA data. One measure
compares the form of government reported in the current survey to that in the previous
survey. The other relies on separate survey questions in which respondents are asked whether
or not their city changed its form of government in the past five years.32 For several
reasons, we choose the latter measure over the former. First, the panel is unbalanced due
to an incomplete response rate, and we thus cannot compare the current to the prior form
of government for many observations in the data. Second, according to our contacts at
ICMA, the former measure overstates the true degree of switching in government form over
the past twenty years; this overstatement may be due to measurement error associated with
survey respondents in different years having disparate interpretations of the city’s form of
government.33 The latter measure, by contrast, provides a more realistic account of the
31 The latter two forms are found disproportionately in New England towns.
32 If so, they are also asked to report the previous and current form of government.
33 In the 2001 ICMA survey, for example, respondents are asked to indicate their city’s current form of gov-
20

recent degree of switching in government form.
Given that we are using different measures of government form in the cross-sectional
and panel analyses, we delete observations in which these two measures are inconsistent
with one another. In particular, for those cities included in the prior survey, we delete
those observations in which the respondent reported that the city changed their form of
government, say, from x to y in the previous five years, but whose form of government
did not change from x in the prior survey to y in the current survey. Likewise, we also
delete observations in which the form of government changed from x in the prior survey to
y in the current survey but in which the respondent did not report a change in the form
of government over the prior five years. For purposes of clarification, note that we cannot
check for internal inconsistency if the city was not included in the prior survey, and we thus
include these cities in the analysis.34 Also, since we cannot check the prior survey for
the first year of the sample, 1982, we exclude these observations from our cross-sectional
analysis.35 This process removes roughly 4,000 observations from 1982 plus about 1,000
post-1982 observations, which represents about 7 percent of the original post-1982 dataset.
Given that historical movements towards council-manager form were often associated
with broader reforms in municipal political institutions, it is important to control for other
ernment as defined by its charter, ordinance, or state law, and are given five different choices: mayor-council,
council-manager, commission, town meeting, and representative town meeting. Mayor-council is described
as “Elected council or board serves as the legislative body. The chief elected official is head of government,
with significant administrative authority, generally elected separately from the council.” Council-manager
is described as “Elected council or board and chief elected official (e.g., mayor) are responsible for mak-
ing policy. A professional administrator appointed by the board or council has full responsibility for the
day-to-day operations of the government.” While these definitions are certainly correct, the fact that many
council-manager cities now separately elect a mayor does create the possibility for confusion. Direct evidence
of confusion on the part of respondents comes from the large number of cases in which cities switch form in
one survey year and then switch back in the following survey year. In particular, we found over 200 cases
in the ICMA data of such double switching, and we suspect that this is evidence of confusion rather than
instances in which the city actually changed their government form twice in 10 years.
34 As a robustness check, we also undertook the analysis with a more conservative measure of switching
which excludes such cities. This yields very similar results.
35 This choice does not substantively affect our cross-sectional results. In particular, the 1982 results are
qualitatively similar to those in the other years of our analysis. Note also that the 1982 observations are
implicitly included in our panel analysis, since the first set of observations is based upon changes between
1982 and 1987.
21
political institutions in order to isolate the effect of government form. In particular, we
include in our cross-sectional analysis three other key measures in the ICMA data: the size
of the city council, the fraction of council members elected on an at-large basis, and an
indicator for voter access to the citizen initiative. While these measures are included in the
cross-sectional regressions, we exclude them from the panel analysis since our key variables
are measured in first differences. Due to the incomplete response rate in the ICMA data
and the lack of consistent survey questions regarding recent changes in these three other
political institutions, including these measures would significantly reduce our sample sizes
in the panel analysis.
Our data on government finances come from the Census of Governments for fiscal years
1982, 1987, 1992, 1997, and 2002. We assume that the government in place during 1981 was
responsible for setting the budget for fiscal year 1982, the 1986 government was responsible
for the 1987 budget, etc. Our measure of public spending is general expenditure per-capita,
which excludes government spending on utilities, liquor stores, and insurance trusts.36 In
order to make the measures comparable across time, we convert all spending to 2002 dollars
by using the CPI deflator.
Finally, city demographics, which are used as control variables, come from the decennial
Census. In our baseline analysis, we employ five measures of citizen preferences for public
spending: per-capita income, the fraction of residents with a high school degree, the fraction
over age 65, the fraction of residents who are black, and income inequality, as proxied by
the ratio of mean to median income. To construct city-level measures of these demographic
variables, we use GeoLytics CDs. We match the 1980 Census demographics with the 1981
political institutions, the 1990 Census demographics with the 1991 political institutions,
and the 2000 Census demographics with the 2001 political institutions.37 For the 1986
36 In addition to spending measures, we have also analyzed revenue measures at the city level and find
broadly similar results. This suggests that any spending differences between mayor-council form and council-
manager form are not driven by differences in budget deficits.
37 Similarly to the government spending measures, we convert all income to 2002 dollars using the CPI
deflator.
22
political institutions, we average the Census demographics from 1980 and 1990, and we
use an analogous procedure for computing demographics to match with the 1996 political
institutions.
Tables 1, 2, and 3 provide summary statistics for our data set. Table 1 provides a
breakdown of government form for the different years of our sample. As shown, the fraction
of mayor-council cities in the data fell from about 47 percent in 1987 to about 39 percent in
2002. As shown in Table 2, however, switching between government form by specific cities
according to our measure is relatively rare. In particular, we have 71 city-year observations,
or less than one percent of the sample, switching from mayor-council to council-manager,
and only 32 city-year observations switching from council-manager to mayor-council. There
are two possible explanations for this discrepancy between Tables 1 and 2. First, as noted
above, our measure of switching reflected in Table 2 is conservative and may not capture
some switches. Second, the decline in the prevalence of mayor-council form documented
in Table 1 may be due to changes in the composition of the sample. For example, the
trend away from council-manager form may reflect the fact that newly incorporated cities
are more likely to be council-manager form. Indeed, when restricting the sample to those
municipalities included in the sample in all of the survey years, we see only a very small
trend in the direction of council-manager form.
As shown in Table 3, mayor-council cities in our dataset do indeed spend about 16
percent less on a per-capita basis than do council-manager cities, and this difference is sta-
tistically significant at conventional levels, providing preliminary support for the theoretical
prediction. Regarding population, mayor-council cities average about 24,000 residents and
are smaller than council-manager cities, which average almost 29,000 residents. In terms of
demographics, citizens in mayor-council cities are on average older, poorer, less educated,
and more likely to be black than their counterparts in council-manager cities. In terms of
other political institutions, mayor-council cities tend to have somewhat larger councils, have
fewer members elected on an at-large basis, and are less likely to use the citizen initiative.
23
4.2 Cross-sectional analysis
For the cross-sectional analysis, we estimate the parameters of the following regression model:
ln() = 1 ln() + 2MC +α3X + + (8)
Here represents government spending in municipality , represents municipal popu-
lation, MC indicates the presence of mayor-council form relative to council-manager form,
and X represents a vector of municipality characteristics.38 We also include a set of state
fixed effects (), which are designed to capture both regional patterns in form of govern-
ment as well as the responsibilities of municipal governments relative to other localities.39
Finally, represents unobserved determinants of municipal spending. We measure the
per-capita spending variable in logs in order to reduce the influence of outliers and to provide
a percentage change measure of the effects of government form.
In order to interpret our results from this cross-sectional analysis as a test of the ceteris
paribus prediction regarding government spending from the theoretical model, the key iden-
tifying assumption is that unobserved determinants of public spending () are independent
of government form; that is, E(|MC = 1) = E(|MC = 0). As will be shown below,
this identifying assumption is different from that in the panel analysis.
Table 4 reports the results from this cross-sectional analysis separately by year. As
shown, mayor-council form is associated with lower government spending per-capita and
this result is statistically significant at the 99-percent level in each year. This result is of
large magnitude from an economic perspective, with mayor-council being associated with a
difference in government spending of between 7 and 15 percent. Given the summary statistics
38While we assume here a log-linear relationship between spending and population, we have also estimated
specifications that include dummy variables for population quintiles. Results from these specifications, which
account for any non-linearities in the relationship between spending and population, are similar to those
presented in Table 4.
39 As noted in Section 2.1, it is well established that there are significant regional differences in the
adoption of the council-manager form.
24
in Table 3, this represents a difference in government spending of roughly $70 to $150 per-
capita on an annual basis. Regarding city demographics, per-capita spending is increasing
in population, per-capita income, the fraction of the population over age 65, the fraction
black, and income inequality. In terms of other political institutions, we find, similarly to
Baqir (2002), that government spending is increasing in the size of the city council. Finally,
we find that access to the citizen initiative tends to increase spending. This finding is at
odds with Matsusaka (1995), who finds that the initiative reduces government spending by
4 percent at the state level.
Interestingly, the measured effects of government form on public spending are stronger in
magnitude in the early years of the analysis, 1987 and 1992, relative to the final year of the
analysis, 2002. One possible explanation for this trend in the coefficients is a convergence in
the forms of government over time. As noted earlier, council-manager cities have increasingly
chosen to separately elect a mayor. According to some sources, the powers allocated to these
mayors have also increased.40 Thus, the distinctions between mayor-council and council-
manager form may have become less sharp over time, and this could explain the smaller
estimated difference between mayor-council cities and council-manager cities in the latter
years of our analysis.41
4.3 Panel analysis
We next conduct a panel analysis focusing on changes in government form within cities over
time. Given that our switching measure is in first differences, our panel analysis is based
upon taking first differences of the key variables in equation (8) above and estimating the
following regression specification:
40 See DeSantis and Renner (2002) and Frederickson, Johnson, and Wood (2004).
41 The smaller estimated difference may also reflect greater errors in the categorization of government
form. Such errors may be expected to increase as council-manager governments adopt more features of
mayor-council governments and visa versa.
25
∆ ln() = 1∆ ln() + 2∆MC +α3∆X + + +∆ (9)
where indexes time and is a series of survey year dummies.42
In order to interpret results from this panel analysis as causal, the key identifying as-
sumption is that changes in unobserved determinants of public spending (∆) are in-
dependent of changes in government form over time; that is, E(∆|∆MC = 1) =
E(∆|∆MC = 0) = E(∆|∆ = −1) This differs from the cross-sectional identi-fying assumption, which requires that unoberved determinants of public spending are inde-
pendent of government form at a given point in time. Thus, relative to the cross-sectional
analysis, the panel analysis controls for all time-invariant city characteristics but requires
cases in which cities change their form of government and that these changes are unrelated
to other trends in unobserved city characteristics. Given the differences in both these iden-
tifying assumptions and the associated sources of variation, we view the cross-sectional and
panel analyses as complementary.
As reported in the first column of Table 5, we find that switches to mayor-council (council-
manager) form are associated with a reduction (increase) in spending of just over 9 percent,
relative to jurisdictions with no change in government form in that year. Again, these
effects are statistically significant at conventional levels and are large in magnitude.43 In
contrast to the cross-sectional results above, we find that increases in population and income
inequality are associated with declines in per-capita spending.44
The regression model in equation (9) implicitly assumes that switches from council-
42 We include state fixed effects in this specification in order to control for differential trends in spending
across states. We have also esimated panel specifications without state fixed effects, and the results are
robust to this change.
43 We have also estimated specifications accounting for potential clustering in spending growth within
cities over time, and the standard errors are similar to those presented in Table 5.
44 As noted above, given the unbalanced nature of the ICMA data and the lack of questions regarding
recent change in other political institutions, we do not include these measures in the panel analysis. Note
that including these measures only strengthens the effects of government form on public spending. These
results are available from the authors.
26
manager to mayor-council (∆MC = 1) have equal and opposite effects of switches from
mayor-council to council-manager (∆MC = −1), relative to jurisdictions experiencing nochange in government form (∆MC = 0). We next relax this symmetry assumption by
estimating the following panel-data regression model:
∆ ln() = 1∆ ln() + 3[∆MC = 1] + 4[∆MC = −1]
+α5∆X + + +∆ (10)
As shown in the second column of Table 5, we find that, as hypothesized, switches to
mayor-council are associated with lower government spending and that switches to council-
manager are associated with higher government spending; the latter coefficient, however,
is not statistically different from zero at conventional levels. Again, both of these results
should be considered relative to jurisdictions with no changes in government form in that
year (∆MC = 0). Also, we can reject the null hypothesis that spending changes in similar
ways following switches to and from mayor-council form (i.e., that 3 = 4) at conventional
significance levels We fail to reject, however, the symmetry assumption implicitly imposed
in equation (9) (i.e., that 3 = −4) at conventional significance levels.In interpreting these results, it should be noted that, if our identifying assumption is not
satisfied, then these results may reflect changes in unobserved determinants of public spend-
ing rather than the true effect of government form. One potential reason that our assumption
may be violated involves trends in unobserved determinants of public spending. Suppose, for
example, that, relative to cities not changing their form of government, cities switching to
mayor-council form tend to have unobserved determinants that are trending downwards over
time and that cities switching to council-manager form tend to have unobserved determi-
nants that are trending upwards. Then, our panel specification, which compares cities with
switches to cities without switches, will suggest that spending is lower (higher) following a
switch to mayor-council (council-manager) form even if government form has no true effect
of public spending.
27
To address this possibility of differences in trends, we first estimate a panel specification
similar to that in equation (9) but with city-specific indicators as controls. This specification
compares changes in government spending within cities over time. That is, the effect of
government form is identified by comparing the change in spending following a change in
the form of government to changes in spending in the same city during periods in which the
form of government did not change. Assuming that these underlying differences in trends
are linear in nature, then including these controls will drive our key coefficients to zero if
there is no true effect of government form. As shown in column 1 of Table 6, however, the
key coefficient is similar to that in column 1 of Table 5 when including these city-specific
indicators. While the standard error is larger, reflecting the large number of additional
parameters to be estimated, the coefficient remains statistically significant at the 90 percent
level. As shown in the second column, which relaxes the symmetry assumption, the results
are again similar to those in Table 5, and the differences between the two key coefficients
remain statistically significant at the 90-percent level.
As a second attempt to address possible differences in trends in unobserved determinants
of public spending, we examine changes in public spending for cities that are about to
undergo a change in government form. That is, we conduct a placebo test in which we
replace ∆MC in equation (9) with ∆MC+1 If our baseline panel results are simply
capturing trends in unobserved determinants of public spending, then we would expect to
see a correlation between current changes in spending and future changes in government
form. As shown in column 3 of Table 6, we find that future changes in government form are
uncorrelated with current changes in government spending. Similarly, as shown in column
4, where we break out future changes to mayor-council form from future changes to council
manager form, we again find no correlations.
As a final attempt to address concerns regarding violations to our key identifying as-
sumption in the panel analysis, we examine cities that considered, but did not implement,
a change in form of government. We refer to these cases as failed changes. The idea behind
this placebo analysis is that these cities with failed changes may be more comparable to
28
cities with actual changes than those cities that did not even consider a change since, in the
cities with failed changes, there were at least some elements within the city that preferred a
change in form of government. That is, if changes in government form are driven by changes
in unobserved determinants of public spending, then failed changes should be as well. To
identify these cities that considered, but did not implement, changes, we use survey questions
from ICMA regarding attempts to change the form of government within the city.45 Then,
we code cities that attempted, but did not implement, a change in form of government as
failed changes.
As shown in column 5 of Table 6, we find that cities with failed changes in government
form experienced no changes in government spending, relative to cities that did not attempt
a change in government. Moreover, the coefficient on actual changes remains similar to that
in Table 5, and the differences in the coefficients between failed changes and actual changes
is statistically significant at the 99 percent level. The results in column 6 tell a similar story,
with neither failed changes to mayor-council form nor failed changes to council-manager
form having a statistically significant effect on government spending, and the coefficients on
the actual changes are similar to those in the baseline panel analysis, as reported in Table 5.
4.4 Comparison to MacDonald
As noted in Section 2, MacDonald (2008) uses a similar data set and set of techniques,
but reaches the conclusion that there are no significant differences in public spending across
the two forms of government. In the appendix, we attempt to reconcile the results from
these two analyses. We find that the differences in the cross-sectional results appear to be
driven by differences in the population threshold. While MacDonald excluded cities with
population below 10,000, we excluded cities with population below 2,500. Regarding the
panel analysis, the differences appear to be driven by differences in the switching measure
45 For example, in the ICMA 1991 survey, cities were asked ”Since January 1, 1987, have there been any
attempts to change your municipality’s structure of government?” Cities then check items that describe the
changes that were proposed, with one of the possibilities being a change in the form of government. Unfor-
tunately, the data lack information on why these attempts failed whereas other attempts were successful.
29
used. While MacDonald used a measure based upon comparison of reported government
form across survey years, we use a more conservative measure based upon a reported change
in form of government.
5 Conclusion
This paper has made two contributions. The first is to offer a theory of fiscal policy de-
termination under the two main forms of government found in U.S. cities: mayor-council
and council-manager. This theory offers a simple vision of how government form matters.
It implies that expected public spending will be lower under mayor-council. It also implies
that either system could be chosen by voters in a referendum. This means that the theory
is consistent with the co-existence of both government forms.
The second contribution of the paper is to empirically investigate the prediction of the
theory as regards spending. Our findings support the theory. This is a major departure
from prior work, which has come to the conclusion that there is no difference in size of
government under the two forms. Independently of the forces that might be generating this
result, the finding suggests an important revision to the conventional wisdom about urban
public finance in the U.S.. It is also notable that the finding is consonant with Persson and
Tabellini’s empirical findings concerning the difference between size of government across
countries with presidential and parliamentary forms of government.
30

References
Aghion, P., Alesina, A. and F. Trebbi, (2008), “Electoral Rules and Minority Repre-
sentation in U.S. Cities,” Quarterly Journal of Economics, 123(1), 325-357.
Alesina, A. and G. Tabellini, (2007), “Bureaucrats or Politicians? Part I: A Single
Policy Task,” American Economic Review, 97(1), 169-179.
Ammons, D. and M. Bosse, (2005), “Tenure of City Managers: Examining the Dual
Meanings of ‘Average Tenure’,” State and Local Government Review, 37(1), 61-71.
Baldez, L. and J. Carey, (1999), “Presidential Agenda Control and Spending Policy:
Lessons from General Pinochet’s Constitution,” American Journal of Political Science,
43(1), 29-55.
Baqir, R., (2002), “Districting and Government Overspending,” Journal of Political
Economy, 110(6), 1318-1354.
Besley, T. and S. Coate, (2003), “Elected versus Appointed Regulators: Theory and
Evidence,” Journal of the European Economic Association, 1(5), 1176-1206.
Blume, L., Muller, J., Voigt, S. and C. Wolf, (2009), “The Economic Effects of Consti-
tutions: Replicating - and Extending - Persson and Tabellini,” Public Choice, 139(1-2),
197-225.
Booms, B., (1966), “City Government Form and Public Expenditures,” National Tax
Journal, 187-199.
Carey, J., (2004), “Presidential versus Parliamentary Government,” in C. Menard and
M. Shirley (eds), Handbook of New Institutional Genomics, Amsterdam: Kluwer Aca-
demic Publishers, 91-122.
Clark, T., (1968), “Community Structure, Decision-Making, Budget Expenditures, and
Urban Renewal in 51 American Communities,” American Sociological Review, 33(4),
576-593.
Degan, A. and A. Merlo, (2009), “Do Voters vote Ideologically?” Journal of Economic
Theory, 144(5), 1868-1894.
Deno, K. and S. Mehay, (1987), “Muncipal Management Structure and Fiscal Perfor-
mance: Do City Managers Make a Difference?” Southern Economic Journal, 53(3),
627-642.
DeSantis, V. and T. Renner, (2002), “City Government Structures: An Attempt at
Clarification,” State and Local Government Review, 34(2), 95-104.
Dye, T. and S. MacManus, (1976), “Predicting City Government Structure,” American
Journal of Political Science, 20(2), 257-271.
31
Dye, T. and S. MacManus, (2003), Politics in States and Communities, 11th Edition,
Upper Saddle River, NJ: Prentice Hall.
Edwards, L. and F. Edwards, (1982), “Public Unions, Local Government Structure
and the Compensation of Municipal Sanitation Workers,” Economic Inquiry, 20(3),
405-425.
Ehrenberg, R., (1973), “Municipal Government Structure, Unionization, and the
Wages of Firefighters,” Industrial and Labor Relations Review, 27(1), 36-48.
Ehrenberg, R. and G. Goldstein, (1975), “A Model of Public Sector Wage Determina-
tion,” Journal of Urban Economics, 2(3), 223-245.
Enikolopov, R., (2007), “Politicians, Bureaucrats, and Patronage,” mimeo, Harvard
University.
Farnham, P., (1990), “The Impact of Citizen Influence on Local Government Expen-
diture,” Public Choice, 64, 201-212.
Farnham, P. and S. Bryant, (1985), “Form of Local Government: Structural Policies
of Citizen Choice,” Social Science Quarterly, 386-400.
Ferreira, F. and J. Gyourko, (2009), “Do Political Parties Matter? Evidence from U.S.
Cities,” Quarterly Journal of Economics, 124(1), 399-422.
Fiorina, M., (1996), Divided Government, Needham Heights, MA: Allyn & Bacon.
Frederickson, H.G., Johnson, G. and C. Wood, (2004), “The Changing Structure of
American Cities: A Study of the Diffusion of Innovation,” Public Administration Re-
view, 64(3), 320-330.
Hayes, K. and S. Chang, (1990), “The Relative Efficiency of City Manager and Mayor-
Council Forms of Government,” Southern Economic Journal, 57(1), 167-177.
Knoke, D., (1982), “The Spread of Municipal Reform: Temporal, Spatial, and Social
Dynamics,” American Journal of Sociology, 87(6), 1314-1339.
Lacy, D. and P. Paolino, (1998), “Downsian Voting and the Separation of Powers,”
American Journal of Political Science, 42(4), 1180-1199.
Levin, J. and S. Tadelis, (2010), “Contracting for Government Services: Theory and
Evidence from U.S. Cities,” Journal of Industrial Economics, 58(4), in press.
Levitt, S., (1996), “How do Senators Vote? Disentangling the Role of Voter Pref-
erences, Party Affiliation and Senator Ideology,” American Economic Review, 86(3),
425-441.
Lineberry, R. and E. Fowler, (1967), “Reformism and Public Policies in American
Cities,” American Political Science Review, 61(3), 701-716.
32
MacDonald, L., (2008), “The Impact of Government Structure on Local Public Ex-
penditures,” Public Choice, 136, 457-473.
Maskin, E. and J. Tirole, (2004), “The Politician and the Judge: Accountability in
Government,” American Economic Review, 94(4), 1034-1054.
Matsusaka, J., (1995), “Fiscal Effects of the Voter Initiative: Evidence from the Last
30 Years,” Journal of Political Economy, 103, 587-623.
Morgan, D. and J. Pelissero, (1980), “Urban Policy: Does Political Structure Matter?”
American Political Science Review, 74(4), 999-1006.
Mullin, M., Peele, G. and B. Cain, (2004), “City Caesars?: Institutional Structure and
Mayoral Success in Three California Cities,” Urban Affairs Quarterly, 40(1), 19-43.
Persson, T., Roland, G. and G. Tabellini, (2000), “Comparative Politics and Public
Finance,” Journal of Political Economy, 108(6), 1121-1161.
Persson, T. and G. Tabellini, (2003), The Economic Effects of Constitutions, Cam-
bridge, MA: MIT Press.
Persson, T. and G. Tabellini, (2006), “Democracy and Development: Devil in the
Details,” American Economic Review, 96(2), 319-324.
Ross, B. and M. Levine, (2006), Urban Politics, 7th Edition, Belmont, CA: Thomson
Wadsworth.
Rubin, I., (1990), The Politics of Public Budgeting, 2nd Edition, Chatham, NJ:
Chatham House Publishers.
Sherbenou, E., (1961), “Class, Participation, and the Council-Manager Plan,” Public
Administration Review, 21(3), 131-135.
Shugart, M. and S. Haggard, (2001), “Institutions and Public Policy in Presidential
Systems,” in S. Haggard and M. McCubbins (eds), Presidents, Parliaments, and Pol-
icy, Cambridge, U.K.: Cambridge University Press, 64-102.
Tsebelis, G., (1995), “Decision Making in Political Systems: Veto Players in Presi-
dentialism, Parliamentarism, Multicameralism and Multipartyism,” British Journal of
Political Science, 25(3), 289-325.
Vlaicu, R., (2008), “Executive Performance under Direct and Hierarchical Account-
ability Structures,” mimeo, University of Maryland.
33
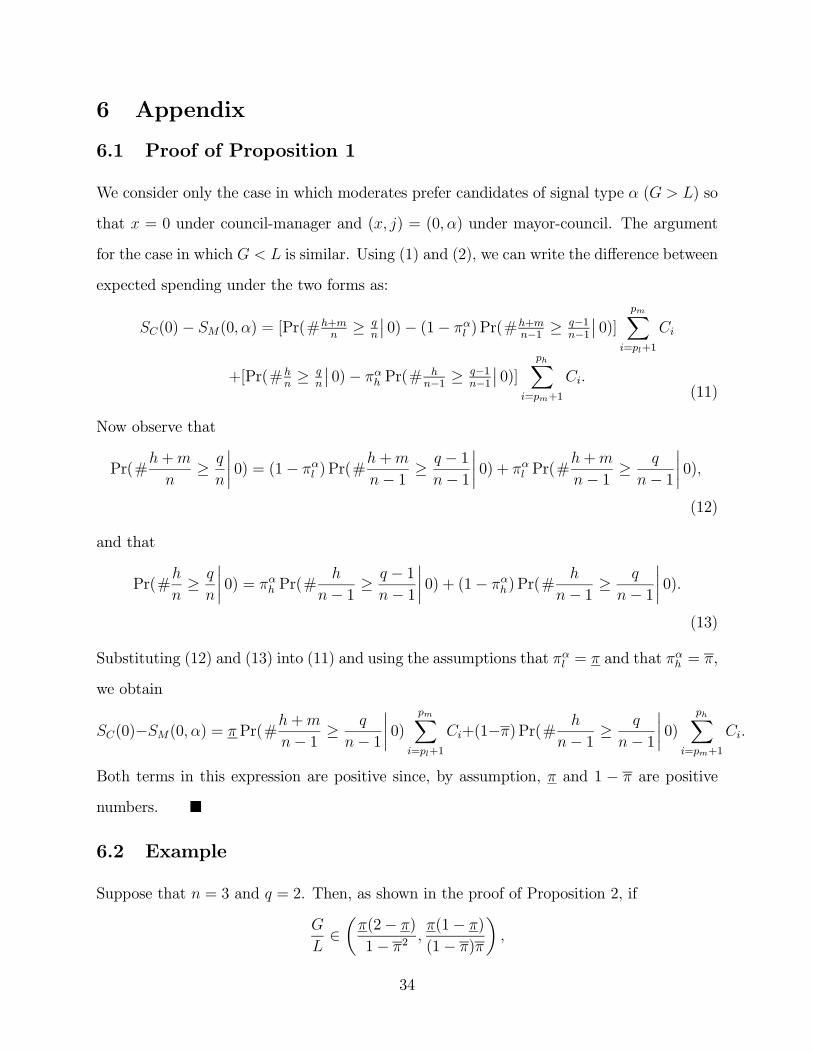
6 Appendix
6.1 Proof of Proposition 1
We consider only the case in which moderates prefer candidates of signal type ( ) so
that = 0 under council-manager and ( ) = (0 ) under mayor-council. The argument
for the case in which is similar. Using (1) and (2), we can write the difference between
expected spending under the two forms as:
(0)− (0 ) = [Pr(#+≥
¯̄0)− (1− ) Pr(#
+−1 ≥ −1
−1¯̄0)]
X=+1
+[Pr(#≥
¯̄0)− Pr(#
−1 ≥ −1
−1¯̄0)]
X=+1
(11)
Now observe that
Pr(#+
≥
¯̄̄̄0) = (1− ) Pr(#
+
− 1 ≥ − 1− 1
¯̄̄̄0) + Pr(#
+
− 1 ≥
− 1
¯̄̄̄0)
(12)
and that
Pr(#
≥
¯̄̄̄0) = Pr(#
− 1 ≥ − 1− 1
¯̄̄̄0) + (1− ) Pr(#
− 1 ≥
− 1
¯̄̄̄0)
(13)
Substituting (12) and (13) into (11) and using the assumptions that = and that = ,
we obtain
(0)−(0 ) = Pr(#+
− 1 ≥
− 1
¯̄̄̄0)
X=+1
+(1−) Pr(#
− 1 ≥
− 1
¯̄̄̄0)
X=+1
Both terms in this expression are positive since, by assumption, and 1 − are positive
numbers. ¥
6.2 Example
Suppose that = 3 and = 2. Then, as shown in the proof of Proposition 2, if
∈µ(2− )
1− 2(1− )
(1− )
34
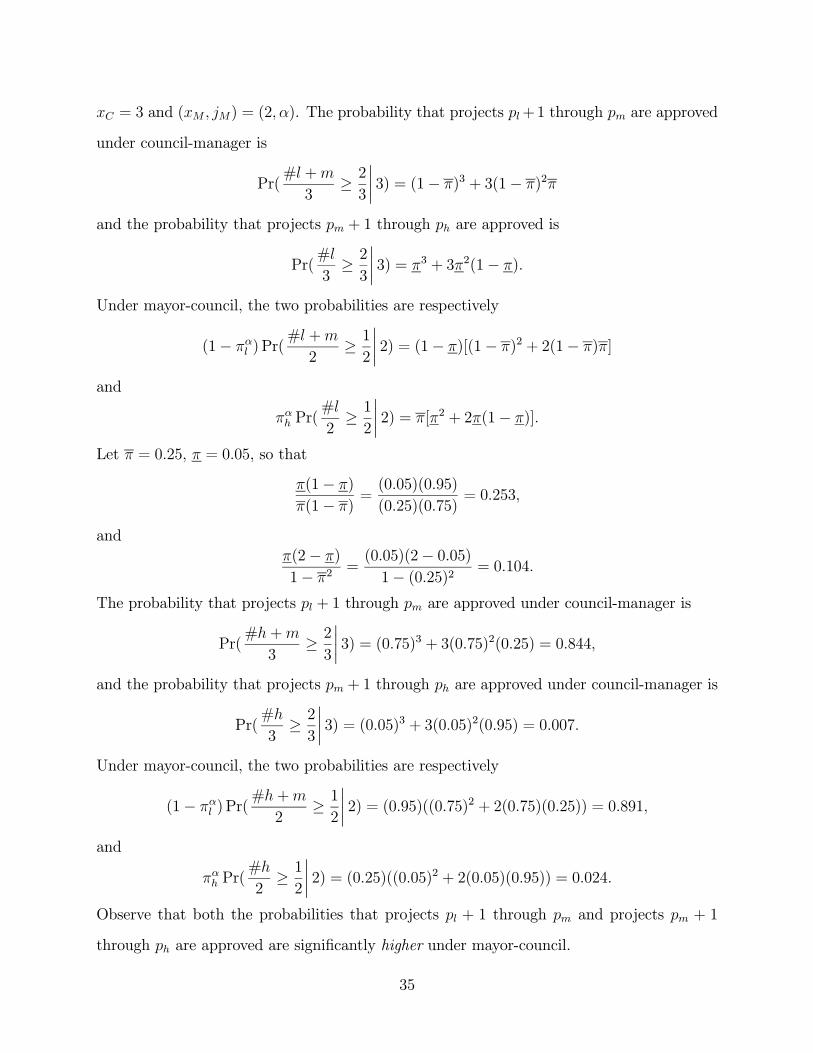
= 3 and ( ) = (2 ). The probability that projects +1 through are approved
under council-manager is
Pr(# +
3≥ 23
¯̄̄̄3) = (1− )3 + 3(1− )2
and the probability that projects + 1 through are approved is
Pr(#
3≥ 23
¯̄̄̄3) = 3 + 32(1− )
Under mayor-council, the two probabilities are respectively
(1− ) Pr(# +
2≥ 12
¯̄̄̄2) = (1− )[(1− )2 + 2(1− )]
and
Pr(#
2≥ 12
¯̄̄̄2) = [2 + 2(1− )]
Let = 025, = 005, so that
(1− )
(1− )=(005)(095)
(025)(075)= 0253
and
(2− )
1− 2=(005)(2− 005)1− (025)2 = 0104
The probability that projects + 1 through are approved under council-manager is
Pr(#+
3≥ 23
¯̄̄̄3) = (075)3 + 3(075)2(025) = 0844
and the probability that projects + 1 through are approved under council-manager is
Pr(#
3≥ 23
¯̄̄̄3) = (005)3 + 3(005)2(095) = 0007
Under mayor-council, the two probabilities are respectively
(1− ) Pr(#+
2≥ 12
¯̄̄̄2) = (095)((075)2 + 2(075)(025)) = 0891
and
Pr(#
2≥ 12
¯̄̄̄2) = (025)((005)2 + 2(005)(095)) = 0024
Observe that both the probabilities that projects + 1 through and projects + 1
through are approved are significantly higher under mayor-council.
35
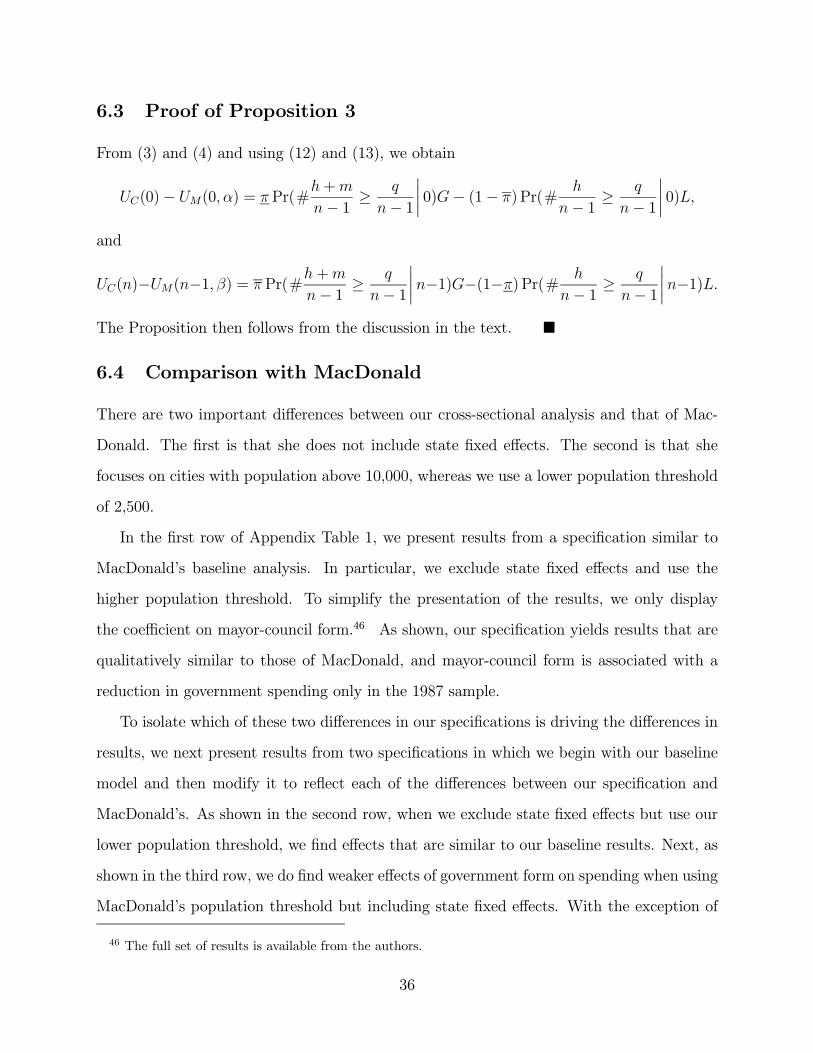
6.3 Proof of Proposition 3
From (3) and (4) and using (12) and (13), we obtain
(0)− (0 ) = Pr(#+
− 1 ≥
− 1
¯̄̄̄0)− (1− ) Pr(#
− 1 ≥
− 1
¯̄̄̄0)
and
()−(−1 ) = Pr(#+
− 1 ≥
− 1
¯̄̄̄−1)−(1−) Pr(#
− 1 ≥
− 1
¯̄̄̄−1)
The Proposition then follows from the discussion in the text. ¥
6.4 Comparison with MacDonald
There are two important differences between our cross-sectional analysis and that of Mac-
Donald. The first is that she does not include state fixed effects. The second is that she
focuses on cities with population above 10,000, whereas we use a lower population threshold
of 2,500.
In the first row of Appendix Table 1, we present results from a specification similar to
MacDonald’s baseline analysis. In particular, we exclude state fixed effects and use the
higher population threshold. To simplify the presentation of the results, we only display
the coefficient on mayor-council form.46 As shown, our specification yields results that are
qualitatively similar to those of MacDonald, and mayor-council form is associated with a
reduction in government spending only in the 1987 sample.
To isolate which of these two differences in our specifications is driving the differences in
results, we next present results from two specifications in which we begin with our baseline
model and then modify it to reflect each of the differences between our specification and
MacDonald’s. As shown in the second row, when we exclude state fixed effects but use our
lower population threshold, we find effects that are similar to our baseline results. Next, as
shown in the third row, we do find weaker effects of government form on spending when using
MacDonald’s population threshold but including state fixed effects. With the exception of
46 The full set of results is available from the authors.
36
the 1992 analysis, the results are similar to those in the first row, and mayor-council form
is associated with a reduction in government spending in only two out of the four years.
Note that this statistical insignificance reflects not only the smaller coefficients but also the
reduction in power associated with focusing on this subsample of the dataset.
Our panel analysis also differs from that of MacDonald in two ways. In addition to
differences in the population threshold, she uses a measure of switching that is based upon
comparisons of reported government form across survey years. As noted above, we use a
more conservative measure based upon whether or not cities explicitly reported a change in
form of government.47 In the first row of Appendix Table 2, we present results from a fixed
effects regression in levels that is similar to MacDonald’s baseline panel analysis. Again,
to simplify the presentation of the results, we only display the coefficient on mayor-council
form.48 As shown, we too find no effects of government form on public spending when
running a fixed effects panel data regression similar to MacDonald.
To isolate which of these three differences in specification is driving the difference in
results between our panel analyses, we again present two specifications in which we begin
with our baseline model and then modify it to reflect each of the differences between our
specification and MacDonald. As shown in the second row, when we use her measure of
switching but our lower population threshold, we find that mayor-council form is associated
with a statistically significant reduction in government spending. But the magnitude is much
smaller than in our baseline panel analysis, which suggested a larger reduction of around 9
percent. As shown in the third row, running our specification with her higher population
threshold also serves to strengthen the panel results.49
In summary, the differences in the cross-sectional results between the two papers seem
47 Note that her panel analysis includes municipality fixed effects and thus state fixed effects are implicitly
included. We should also note that she presents an alternative specification with no population threshhold.
This is different from our analysis, which uses a 2,500 population threshhold.
48 The full set of results is available from the author.
49 This final finding is consistent with MacDonald’s analysis, where she finds somewhat stronger effects
of council-manager form when using the 10,000 population threshold, relative to a specification with no
population threshold, although neither of these coefficients are statistically significant in her analysis.
37

to be driven largely by differences in the population threshold. This suggests that the
effect of form of government is larger in smaller cities. However, in the panel analysis, our
results are strengthened by focusing on the set of larger population cities, casting doubt
on this conclusion. While we do not have any definitive explanation for these population-
related differences between the cross-sectional and panel analyses, it is nonetheless reassuring
that our results are not entirely driven by these small cities. Relative to MacDonald, the
differences in the panel results seem to be largely driven by differences in the switching
measure. Her reported switching rates are much higher than ours, and, as argued above,
our measure more accurately reflects the recent degree of switching in government form.
Moreover, any measurement error associated with this measure of switching may bias her
estimated effects of government form towards zero.
38