government-funded specialist homelessness services
TRANSCRIPT

Australian Institute of Health and Welfare Canberra
Cat. no. HOU 238
Government-funded specialist homelessness services
SAAP National Data Collection annual report
2009–10
Australia Appendix
June 2011

The Australian Institute of Health and Welfare is Australia’s national health and welfare statistics and information agency. The Institute’s mission is
better information and statistics for better health and wellbeing.
© Australian Institute of Health and Welfare 2011
This work is copyright. Apart from any use as permitted under the Copyright Act 1968, no part may be reproduced without prior written permission from the Australian Institute of Health and Welfare. Requests and enquiries concerning reproduction and rights should be directed to the Head of the Communications, Media and Marketing Unit, Australian Institute of Health and Welfare, GPO Box 570, Canberra ACT 2601.
A complete list of the Institute’s publications is available from the Institute’s website <www.aihw.gov.au>.
ISSN 1445-503X ISBN 978-1-74249-160-8
Suggested citation Australian Institute of Health and Welfare (AIHW) 2011. Government-funded specialist homelessness services: SAAP National Data Collection annual report 2009–10: Australia appendix. Cat. no. HOU 238. Canberra: AIHW.
Australian Institute of Health and Welfare Board Chair Hon. Peter Collins, AM, QC
Director David Kalisch
Any enquiries about or comments on this publication should be directed to: Communications, Media and Marketing Unit Australian Institute of Health and Welfare GPO Box 570 Canberra ACT 2601 Phone: (02) 6244 1032 Email: [email protected]
Published by the Australian Institute of Health and Welfare
Please note that there is the potential for minor revisions of data in this report. Please check the online version at <www.aihw.gov.au> for any amendments.

iii
Contents Appendix 1 Data tables .................................................................................................................... 1
Appendix 2 The SAAP National Data Collection ..................................................................... 30
Appendix 3 Weighting ................................................................................................................... 33
Appendix 4 Interpretation of tables ............................................................................................. 35
Appendix 5 Counting rules and glossary ................................................................................... 36
Appendix 6 Abbreviations and symbols .................................................................................... 48
Appendix 7 Client Collection form .............................................................................................. 49
List of tables ........................................................................................................................................ 57


Government-funded specialist homelessness services 2009–10: Australia appendix 1
Appendix 1 Data tables
Table A1: Funding to agencies, by reporting period, 2006–07 to 2009–10
Reporting period Funded agencies
(number)
Agreement funding ($’000)
Additional state/territory
funding ($’000)
Total allocation ($’000)
Mean funding per
agency ($’000)
2006–07 1,539 340,821 26,440 367,261 239
2007–08 1,562 356,456 27,491 383,947 246
2008–09 1,532 397,823 8,070 405,892 265
2009–10 1,559 438,399 4,197 442,596 284
Notes 1. Inclusion or exclusion of agencies from the SAAP NDC is determined by the state and territory governments responsible for administering
the government response to homelessness. 2. Not all funded agencies are required to participate in data collection (see Table A2). 3. Funding to agencies excludes funds not allocated directly to agencies, such as funds allocated for administration and training. 4. ‘Agreement funding’ refers to funding provided jointly by the Australian Government and the state and territory governments under the
following agreements: from 1 July 2006 to 31 December 2008, ‘agreement funding’ refers to funding provided under the SAAP V Agreement; from 1 January 2009 to 30 June 2009, ‘agreement funding’ refers to funding provided under the NAHA; from 1 July 2009 to 30 June 2010, ‘agreement funding’ refers to funding provided under the NAHA, NPAH and other national partnership agreements. Not all jurisdictions have included NPAH and other partnership agreement funding or agencies for the 2009–10 year.
5. ‘Additional state/territory funding’ refers to funding provided by the states and territories over and above the amounts determined in the above agreements.
6. Agencies may also receive funding from other sources. This is not included. 7. Caution should be used when comparing data across years because of changes in policy and service delivery arrangements.
Sources: Administrative Data and Client Collections.
Table A2: Client Collection: agency participation rates and records returned with informed consent and valid consent, by reporting period, 2006–07 to 2009–10
Reporting period
Participating agencies(a
(number)
Agency participation
rate (%)
Records returned
(number)
Records returned with
consent (%)
Records returned with
valid consent(b) (%)
2006–07 1,456 87.2 192,591 87.2 81.1
2007–08 1,444 92.1 202,835 88.6 82.5
2008–09 1,433 93.7 199,277 90.2 85.0
2009–10 1,434 93.3 215,812 90.0 85.2
(a) ‘Agencies’ refers to the number of agencies that should have been participating in the reference period. Refer to Appendix 5. Not all funded agencies are required to participate in the Client Collection (see Table 1.1). Consequently, some funded agencies are not included in this table.
(b) ‘Valid consent’ here refers to records with a valid statistical linkage key (refer to Appendix 5).
Notes 1. Table based on records returned from participating agencies during the reference period. 2. Inclusion or exclusion of agencies from the SAAP NDC is determined by the state and territory governments responsible for administering
the government response to homelessness. 3. Caution should be used when comparing data across years because of changes in policy and service delivery arrangements.
Sources: Administrative Data and Client Collections.

2 Government-funded specialist homelessness services 2009–10: Australia appendix
Table A3: Total support for clients and accompanying children, by reporting period, 2006–07 to 2009–10
Reporting period Total periods of
support Total people
supported People per 10,000
population Average periods of support per person
2006–07 307,000 187,900 91 1.63
2007–08 327,600 202,500 96 1.62
2008–09 323,600 204,900 95 1.58
2009–10 351,200 219,900 100 1.60
Notes 1. Number excluded due to errors and omissions (weighted): 0. 2. ‘Per 10,000 population’ shows how many people out of every 10,000 in the population used government-funded specialist homelessness
services. The rate is estimated by comparing the number of clients and accompanying children in the reporting year with the estimated resident population at the start of the reporting year. Note that this may not match data reported in previous reports due to adjustments in ABS population estimates.
3. Caution should be used when comparing data across years because of changes in policy and service delivery arrangements. 4. Figures have been weighted to adjust for agency non-participation and client non-consent.
Sources: Client Collection; ABS 2010a.
Table A4: Support periods and clients, by reporting period, 2006–07 to 2009–10
2006–07 2007–08 2008–09 2009–10
Support periods (number) 207,700 220,300 212,400 230,700
With accommodation(a)(b) (per cent) 38.2 34.4 32.7 28.8
Without accommodation (per cent) 61.8 65.6 67.3 71.2
Daily average support periods (number) 29,700 34,200 36,500 40,800
Nightly average support periods with accommodation (number) 8,800 9,100 8,400 9,100
Clients (number) 118,800 125,600 125,800 135,700
Per 10,000 population aged 10+ years(c) (number) 65 67 66 70
Clients with one period of support (per cent) 72.8 72.7 72.6 72.8
Mean number of support periods per client 1.75 1.75 1.69 1.70
(a) Accommodation data are reported differently in Victoria to other jurisdictions (see Box 1.1 in the main report). If Victoria is excluded from the calculations, the proportion of support periods with accommodation was: 49% in 2006-07; 42% in 2007–08; 42% in 2008–09; and 38% in 2009–10.
(b) In South Australia, a large number of agencies do not provide accommodation, they provide support services only. (c) ‘Per 10,000 population aged 10+ years’ shows how many people out of every 10,000 aged 10 years and over in the population became a
client. The rate per 10,000 population is estimated by comparing the number of clients aged 10 years and over in the reporting year with the estimated resident population aged 10 years and over at the start of the reporting year. Note that this may not match data reported in previous reports due to adjustments in ABS population estimates.
Notes 1. Number excluded due to errors and omissions (weighted): 0 clients and support periods; 2,456 nightly support periods with accommodation
in 2006–07, 1,450 in 2007–08, 3,773 in 2008–09, 2,014 in 2009–10. 2. Caution should be used when comparing data across years because of changes in policy and service delivery arrangements. 3. Support period figures have been weighted to adjust for agency non-participation. 4. Client figures have been weighted to adjust for agency non-participation and client non-consent.
Sources: Client Collection; ABS 2010a.

Government-funded specialist homelessness services 2009–10: Australia appendix 3
Table A5: Accompanying child support periods and accompanying children, by reporting period, 2006–07 to 2009–10
2006–07 2007–08 2008–09 2009–10
Accompanying child support periods (number) 99,300 107,300 111,200 120,400
With accommodation(a)(b)(c) (per cent) 39.3 35.3 31.4 28.7
Without accommodation (per cent) 60.7 64.7 68.6 71.3
Daily average accompanying child support periods (number) 18,500 21,800 23,800 26,300
Nightly average accompanying child support periods with accommodation (number) 6,500 6,700 6,200 7,100
Accompanying children (number) 69,100 76,900 79,100 84,100
Per 10,000 population aged 0–17 years(d) (number) 141 155 158 166
Accompanying children with one period of support (per cent) 79.2 82.1 80.0 79.3
Mean number of accompanying child support periods per accompanying child 1.43 1.39 1.40 1.43
(a) Dates of support and accommodation are not collected for accompanying children. For the purposes of calculating the number of accompanying child support periods with and without a period of accommodation, accompanying children are assumed to be accommodated if their parent or guardian was accommodated.
(b) Accommodation data are reported differently in Victoria to other jurisdictions (see Box 1.1 in the main report).. If Victoria is excluded from the calculations, the proportion of accompanying child support periods with accommodation was: 44% in 2006-07; 40% in 2007–08; 38% in 2008–09; and 36% in 2009–10.
(c) In South Australia, a large number of agencies do not provide accommodation, they provide support services only. (d) ‘Per 10,000 population aged 0–17 years’ shows how many people out of every 10,000 aged 17 years and under in the population
accompanied a client. The rate per 10,000 population is estimated by comparing the number of accompanying children aged 17 years and under in the reporting year with the estimated resident population aged 17 years and under at the start of the reporting year. Note that this may not match data reported in previous reports due to adjustments in ABS population estimates.
Notes 1. Number excluded due to errors and omissions (weighted): 0 accompanying child support periods and accompanying children; 929 nightly
accompanying child support periods with accommodation in 2006–07, 723 in 2007–08, 2,330 in 2008–09, 996 in 2009–10. 2. Caution should be used when comparing data across years because of changes in policy and service delivery arrangements. 3. Accompanying child support period figures have been weighted to adjust for agency non-participation. 4. Accompanying children figures have been weighted to adjust for agency non-participation and client non-consent.
Sources: Client Collection; ABS 2010a.

4 Government-funded specialist homelessness services 2009–10: Australia appendix
Table A6: Clients: age by sex, 2009–10 (per cent)
Age
Percentage of all clients Percentage of sex group Total
Male Female Male Female Per cent Number
Under 15 years 1.0 1.7 2.7 2.8 2.8 3,800
15–19 years 6.5 10.5 17.2 17.0 17.1 23,200
20–24 years 4.8 10.0 12.7 16.2 14.8 20,100
25–29 years 3.8 8.2 9.9 13.3 12.0 16,300
30–34 years 4.2 7.9 11.1 12.7 12.1 16,400
35–39 years 4.7 7.9 12.2 12.7 12.5 17,000
40–44 years 4.1 6.0 10.7 9.7 10.1 13,700
45–49 years 3.4 4.1 8.8 6.6 7.4 10,100
50–54 years 2.3 2.5 6.0 4.0 4.8 6,500
55–59 years 1.4 1.4 3.7 2.3 2.8 3,800
60–64 years 0.9 0.8 2.3 1.3 1.7 2,300
65 years and over 1.0 0.9 2.6 1.5 1.9 2,600
Total 38.0 62.0 100.0 100.0 100.0 . .
Total (number) 51,600 84,100 51,600 84,100 . . 135,700
Mean age (years) . . . . 33.9 31.4 . . 32.3
Median age (years) . . . . 33 30 . . 31
Notes 1. Number excluded due to errors and omissions (weighted): 0. 2. Clients aged 0–17 years: 16,600 (6,400 males, 10,200 females). 3. Figures have been weighted to adjust for agency non-participation and client non-consent.
Source: Client Collection.

Government-funded specialist homelessness services 2009–10: Australia appendix 5
Table A7: Clients: rate per 10,000 population aged 10 years and over by age and sex and mean and median age of all clients by sex, by reporting period, 2006–07 to 2009–10
Clients aged 10+ years All clients
Reporting period
Under 15 years
15–19 years
20–24 years
25–44 years
45–64 years
65+ years Total
Mean age
(years)
Median age
(years)
Male clients
2006–07 10 111 80 72 33 10 51 33.2 32
2007–08 11 115 80 71 35 9 52 33.2 32
2008–09 12 112 79 68 35 9 51 33.2 32
2009–10 12 115 79 72 39 10 54 33.9 33
Female clients
2006–07 19 198 160 120 34 7 79 30.7 29
2007–08 21 204 165 126 37 7 83 30.8 29
2008–09 21 199 166 123 38 7 81 30.8 29
2009–10 19 197 174 130 43 8 86 31.4 30
All clients
2006–07 15 154 119 96 33 8 65 31.6 30
2007–08 16 158 122 98 36 8 67 31.7 30
2008–09 16 154 121 95 36 8 66 31.7 30
2009–10 15 154 125 101 41 9 70 32.3 31
Notes 1. Number excluded due to errors and omissions (weighted): 0. 2. The rate per 10,000 population is estimated by comparing the number of clients aged 10 years and over in the reporting year with the
estimated resident population aged 10 years and over at the start of the reporting year. Note this may not match data reported in previous reports due to adjustments in ABS population estimates.
3. Caution should be used when comparing data across years because of changes in policy and service delivery arrangements. 4. Figures have been weighted to adjust for agency non-participation and client non-consent.
Source: Client Collection; ABS 2010a.

6 Government-funded specialist homelessness services 2009–10: Australia appendix
Table A8: Accompanying children: age, by sex, 2009–10
Age
Percentage of all accompanying children
Percentage of sex group Total
Male Female Male Female Per cent Number
0–4 years 22.4 21.6 44.7 43.5 44.1 37,100
5–9 years 14.1 13.7 28.1 27.6 27.9 23,500
10–14 years 10.0 10.4 19.9 20.9 20.4 17,200
15–17 years 3.7 3.9 7.3 7.9 7.6 6,400
Total 50.3 49.7 100.0 100.0 100.0 . .
Total (number) 42,300 41,800 42,300 41,800 . . 84,100
Mean age (years) . . . . 6.3 6.4 . . 6.3
Median age (years) . . . . 5 6 . . 5
Notes 1. Number excluded due to errors and omissions (weighted): 0. 2. Figures have been weighted to adjust for agency non-participation and client non-consent.
Source: Client Collection.
Table A9: Accompanying children: rate per 10,000 population aged 0–17 years by age and mean and median age, by reporting period, 2006–07 to 2009–10
Reporting period 0–4
years 5–9
years 10–14 years
15–17 years Total
Mean age (years)
Median age (years)
2006–07 236 147 102 50 141 6.2 5
2007–08 254 163 112 61 155 6.2 5
2008–09 254 163 115 66 158 6.3 5
2009–10 260 173 122 73 166 6.3 5
Notes 1. Number excluded due to errors and omissions (weighted): 0. 2. The rate per 10,000 population is estimated by comparing the number of accompanying children aged 17 years and under in the reporting
year with the estimated resident population aged 17 years and under at the start of the reporting year. Note this may not match data reported in previous reports due to adjustments in ABS population estimates.
3. Caution should be used when comparing data across years because of changes in policy and service delivery arrangements. 4. Figures have been weighted to adjust for agency non-participation and client non-consent.
Source: Client Collection; ABS 2010a.

Government-funded specialist homelessness services 2009–10: Australia appendix 7
Table A10: Clients: Aboriginal and Torres Strait Islander status by sex, by reporting period, 2006–07 to 2009–10 (per cent)
Aboriginal and Torres Strait Islander status 2006–07 2007–08 2008–09 2009–10
Male clients
Aboriginal and Torres Strait Islander people 13.2 13.0 13.7 13.6
Non-Indigenous 86.8 87.0 86.3 86.4
Total 100.0 100.0 100.0 100.0
Total (number) 42,200 45,200 45,100 48,900
Female clients
Aboriginal and Torres Strait Islander people 21.5 20.9 20.5 20.6
Non-Indigenous 78.5 79.1 79.5 79.4
Total 100.0 100.0 100.0 100.0
Total (number) 67,700 73,700 74,300 80,100
All clients
Aboriginal and Torres Strait Islander people 18.3 17.9 18.0 18.0
Non-Indigenous 81.7 82.1 82.0 82.0
Total 100.0 100.0 100.0 100.0
Total (number) 109,900 118,900 119,500 129,000
Notes 1. Number excluded due to errors and omissions (weighted): 8,911 in 2006–07; 6,686 in 2007–08; 6,338 in 2008–09; 6,705 in 2009–10. 2. Caution should be used when comparing data across years because of changes in policy and service delivery arrangements. 3. Figures have been weighted to adjust for agency non-participation and client non-consent.
Source: Client Collection.
Table A11: Accompanying children: Aboriginal and Torres Strait Islander status, by reporting period, 2006–07 to 2009–10 (per cent)
Aboriginal and Torres Strait Islander status 2006–07 2007–08 2008–09 2009–10
Aboriginal and Torres Strait Islander people 27.0 26.1 25.1 25.6
Non-Indigenous 73.0 73.9 74.9 74.4
Total 100.0 100.0 100.0 100.0
Total (number) 65,600 73,300 74,300 79,200
Notes 1. Number excluded due to errors and omissions (weighted): 3,506 in 2006–07; 3,645 in 2007–08; 4,749 in 2008–09; 4,980 in 2009–10. 2. Caution should be used when comparing data across years because of changes in policy and service delivery arrangements. 3. Figures have been weighted to adjust for agency non-participation and client non-consent.
Source: Client Collection.

8 Government-funded specialist homelessness services 2009–10: Australia appendix
Table A12: Clients: top 5 countries of birth in 2009–10, by reporting period, 2006–07 to 2009–10 (per cent)
Country of birth 2006–07 2007–08 2008–09 2009–10
Australia (including external territories) 86.0 85.3 84.4 83.6
New Zealand 2.1 2.0 2.2 2.3
Sudan 1.0 1.2 1.2 1.2
England 0.9 0.9 0.9 0.9
Vietnam 0.7 0.7 0.7 0.7
Other 9.4 10.0 10.6 11.3
Total 100.0 100.0 100.0 100.0
Total (number) 114,800 120,700 121,100 130,500
Notes 1. Number excluded due to errors and omissions (weighted): 4,093 in 2006–07; 4,839 in 2007–08; 4,752 in 2008–09; 5,200 in 2009–10. 2. Caution should be used when comparing data across years because of changes in policy and service delivery arrangements. 3. Figures have been weighted to adjust for agency non-participation and client non-consent.
Source: Client Collection.
Table A13: Accompanying children: top 5 countries of birth in 2009–10, by reporting period, 2006–07 to 2009–10 (per cent)
Country of birth 2006–07(a) 2007–08(b) 2008–09(c) 2009–10
Australia (including external territories) 94.7 93.5 93.1 93.9
New Zealand 1.0 1.0 1.3 1.0
Sudan 1.0 1.5 1.4 1.0
Kenya 0.2 0.2 0.2 0.2
Somalia 0.2 0.2 0.3 0.2
Other 2.9 3.6 3.8 3.7
Total 100.0 100.0 100.0 100.0
Total (number) 66,800 74,400 75,700 80,400
(a) In 2006–07 the top 5 countries of birth were: Australia 94.7%; Sudan 1.0%; New Zealand 1.0%; Vietnam 0.2%; and Ethiopia 0.2%. (b) In 2007–08 the top 5 countries of birth were: Australia 93.5%; Sudan 1.5%; New Zealand 1.0%; Somalia 0.2%; and Vietnam 0.2%. (c) In 2008–09 the top 5 countries of birth were: Australia 93.1%; Sudan 1.4%; New Zealand 1.3%; Somalia 0.3%; and Kenya 0.2%.
Notes 1. Number excluded due to errors and omissions (weighted): 2,291 in 2006–07; 2,531 in 2007–08; 3,318 in 2008–09; 3,778 in 2009–10. 2. Caution should be used when comparing data across years because of changes in policy and service delivery arrangements. 3. Figures have been weighted to adjust for agency non-participation and client non-consent.
Source: Client Collection.

Government-funded specialist homelessness services 2009–10: Australia appendix 9
Table A14: Support periods: client group, by reporting period, 2006–07 to 2009–10 (per cent)
Client group 2006–07 2007–08 2008–09 2009–10
Male alone, under 25 10.9 11.1 10.9 10.3
Male alone, 25+ 26.8 25.5 24.4 25.1
Female alone, under 25 13.3 13.5 13.2 12.6
Female alone, 25+ 18.5 18.6 17.4 18.1
Couple no children 2.7 2.9 3.3 3.5
Couple with children 3.7 4.1 4.8 4.8
Male with children 1.3 1.3 1.4 1.6
Female with children 22.3 22.3 23.4 23.1
Other 0.5 0.6 1.1 1.0
Total 100.0 100.0 100.0 100.0
Total (number) 203,100 214,800 208,500 227,100
Notes 1. Number excluded due to errors and omissions (weighted): 4,558 in 2006–07; 5,548 in 2007–08; 3,877 in 2008–09; 3,609 in 2009–10. 2. Caution should be used when comparing data across years because of changes in policy and service delivery arrangements. 3. Figures have been weighted to adjust for agency non-participation and client non-consent.
Source: Client Collection.

10 Government-funded specialist homelessness services 2009–10: Australia appendix
Table A15: Support periods: main reason for seeking assistance, by reporting period, 2006–07 to 2009–10 (per cent)
Main reason for seeking assistance 2006–07 2007–08 2008–09 2009–10
Interpersonal relationships 44.8 44.0 44.6 43.7
Time out from family/other situation 7.9 7.4 7.5 7.4
Relationship/family breakdown 9.8 10.2 10.4 10.1
Interpersonal conflict 2.7 2.8 2.7 2.5
Sexual abuse 0.6 0.6 0.7 0.5
Domestic/family violence 22.4 21.6 22.0 22.0
Physical/emotional abuse 1.4 1.4 1.2 1.2
Financial 13.9 14.1 13.3 15.9
Gambling 0.3 0.3 0.2 0.2
Budgeting problems 4.3 4.6 4.1 5.1
Rent too high 0.9 1.1 1.4 1.3
Other financial difficulty 8.5 8.1 7.6 9.2
Accommodation 18.3 19.4 19.6 19.0
Overcrowding issues 2.6 2.9 3.3 3.2
Eviction/asked to leave 6.9 7.1 6.9 6.6
Emergency accommodation ended 3.1 2.8 2.1 2.3
Previous accommodation ended 5.7 6.6 7.2 6.9
Health 9.4 9.3 8.8 7.9
Mental health issues 1.8 1.8 1.8 1.9
Problematic drug/alcohol/substance use 5.7 5.5 5.0 4.2
Psychiatric illness 0.7 0.7 0.8 0.7
Other health issues 1.1 1.2 1.2 1.1
Other reasons 13.5 13.2 13.8 13.5
Gay/lesbian/transgender issues 0.1 0.2 0.3 0.2
Recently left institution 1.2 1.4 1.4 1.2
Recent arrival to area with no means of support 3.1 2.8 2.6 2.1
Itinerant 2.4 2.4 2.8 2.6
Other 6.7 6.5 6.7 7.3
Total 100.0 100.0 100.0 100.0
Total (number) 199,300 211,800 205,000 222,100
Notes 1. Number excluded due to errors and omissions (weighted): 8,444 in 2006–07; 8,491 in 2007–08; 7,409 in 2008–09; 8,618 in 2009–10. 2. Caution should be used when comparing data across years because of changes in policy and service delivery arrangements. 3. Figures have been weighted to adjust for agency non-participation and client non-consent.
Source: Client Collection.

Government-funded specialist homelessness services 2009–10: Australia appendix 11
Table A16: Support periods: main reason for seeking assistance, by client group, 2009–10 (per cent)
Main reason for seeking assistance
Male alone
under 25
Male alone
25+
Female alone
under 25
Female alone
25+
Couple no
children
Couple with
children
Male with
children
Female with
children Other
Interpersonal relationships 41.8 17.0 59.1 55.3 23.6 18.2 29.5 64.2 51.2
Time out from family/ other situation 12.0 7.3 13.3 5.7 6.3 4.3 3.6 4.5 6.0
Relationship/ family breakdown 21.1 5.2 21.1 5.1 8.1 6.6 18.0 8.5 15.5
Interpersonal conflict 4.7 2.3 3.8 2.0 2.9 2.2 2.1 1.4 3.3
Sexual abuse 0.3 0.1 1.5 0.6 0.2 0.2 0.2 0.5 0.7
Domestic/family violence 3.1 1.7 17.7 40.1 5.2 4.4 4.9 47.7 24.2
Physical/emotional abuse 0.7 0.5 1.7 1.7 1.0 0.5 0.7 1.6 1.5
Financial 11.7 25.2 8.1 15.7 22.8 23.8 22.3 9.8 5.6
Gambling 0.2 0.6 — 0.1 0.1 0.1 0.1 — —
Budgeting problems 3.6 8.5 2.1 4.3 8.1 8.4 6.8 3.4 1.1
Rent too high 0.7 1.1 0.6 1.2 2.3 3.9 2.9 1.6 1.6
Other financial difficulty 7.2 15.0 5.4 10.0 12.2 11.4 12.4 4.8 3.0
Accommodation 22.8 18.4 17.4 11.2 31.2 42.1 32.0 17.6 21.2
Overcrowding issues 2.9 1.0 3.2 1.1 6.7 11.4 7.6 5.0 3.7
Eviction/asked to leave 8.3 5.1 6.1 3.9 11.2 17.3 11.3 6.5 8.8
Emergency accommodation ended 3.0 3.4 2.1 1.7 3.4 2.8 2.4 1.4 1.4
Previous accommodation ended 8.6 9.0 6.0 4.5 9.8 10.6 10.6 4.7 7.3
Health 5.9 19.2 3.4 7.0 5.8 2.6 3.9 1.7 5.0
Mental health issues 1.8 3.7 1.4 2.3 0.9 0.7 1.2 0.4 1.0
Problematic drug/alcohol/substance use 3.3 11.5 1.2 2.8 2.8 0.6 1.1 0.6 3.1
Psychiatric illness 0.4 1.9 0.2 0.7 0.3 0.1 0.3 0.1 0.2
Other health issues 0.4 2.1 0.6 1.2 1.8 1.2 1.2 0.6 0.6
Other reasons 17.8 20.3 12.0 10.8 16.6 13.3 12.4 6.7 17.0
Gay/lesbian/ transgender issues 1.0 0.1 0.8 0.1 — — — — —
Recently left institution 2.7 2.4 0.6 0.9 0.5 0.3 1.1 0.2 0.5
Recent arrival to area with no means of support 2.1 3.6 1.4 1.3 3.5 3.8 2.3 1.0 1.9
Itinerant 3.4 4.4 2.5 1.8 3.6 1.6 2.2 1.2 2.6
Other 8.6 9.9 6.8 6.7 9.0 7.5 6.8 4.3 12.0
Total 100.0 100.0 100.0 100.0 100.0 100.0 100.0 100.0 100.0
Total (number) 22,600 54,500 27,900 39,900 7,700 10,600 3,500 51,300 1,900
Notes 1. Number excluded due to errors and omissions (weighted): 10,869. 2. Figures have been weighted to adjust for agency non-participation and client non-consent.
Source: Client Collection.

12 Government-funded specialist homelessness services 2009–10: Australia appendix
Table A17: Closed support periods: length of support, by reporting period, 2006–07 to 2009–10 (per cent)
Length of support 2006–07 2007–08 2008–09 2009–10
1 week or less 50.6 47.0 43.9 46.6
>1 week–1 month 17.2 15.8 16.2 14.3
>1–3 months 18.4 21.4 22.5 21.5
>3–6 months 7.1 8.2 9.0 9.0
>6 months 6.7 7.5 8.5 8.5
Total 100.0 100.0 100.0 100.0
Total (number) 177,900 187,000 176,800 188,400
Mean length (days) 50 56 63 64
Median length (days) 7 10 14 11
Notes 1. Number excluded due to errors and omissions (weighted): 0. 2. Caution should be used when comparing data across years because of changes in policy and service delivery arrangements. 3. Figures have been weighted to adjust for agency non-participation.
Source: Client Collection.
Table A18: Closed support periods: mean and median length of support by client group, by reporting period, 2006–07 to 2009–10 (days)
Client group
Mean Median
2006–07 2007–08 2008–09 2009–10 2006–07 2007–08 2008–09 2009–10
Male alone, under 25 55 62 65 71 12 16 17 18
Male alone, 25+ 33 39 40 45 3 4 5 3
Female alone, under 25 61 69 72 74 13 18 21 21
Female alone, 25+ 34 44 48 47 2 4 7 5
Couple no children 57 69 63 64 20 27 25 20
Couple with children 97 102 105 93 40 44 42 39
Male with children 80 85 96 74 30 35 36 28
Female with children 68 73 83 85 18 25 30 28
Other 89 103 112 108 18 29 40 31
Notes 1. Number excluded due to errors and omissions (weighted): 3,486 in 2006–07; 3,930 in 2007–08; 2,808 in 2008–09; 2,407 in 2009–10. 2. Caution should be used when comparing data across years because of changes in policy and service delivery arrangements. 3. Figures have been weighted to adjust for agency non-participation and client non-consent.
Source: Client Collection.

Government-funded specialist homelessness services 2009–10: Australia appendix 13
Table A19: Closed support periods in which clients were accommodated(a)(b): total length of accommodation, by reporting period, 2006–07 to 2009–10 (per cent)
Length of accommodation 2006–07 2007–08 2008–09 2009–10
1 day to 1 week 44.2 41.7 39.7 39.5
>1 week–1 month 25.2 24.1 24.0 23.2
>1–3 months 17.6 19.8 21.3 21.3
>3–6 months 6.1 7.3 7.3 7.8
>6 months 6.9 7.2 7.6 8.2
Total 100.0 100.0 100.0 100.0
Total (number) 62,200 56,600 49,200 47,800
Mean length (days) 50 54 57 60
Median length (days) 10 12 13 14
Accommodation starting and ending on the same date (number) 4,300 6,700 6,000 5,200
Total closed support periods with accommodation (number) 66,600 63,400 55,200 53,000
(a) Accommodation data are reported differently in Victoria to other jurisdictions (see Box 1.1 in the main report). If Victoria is excluded from the calculations: in 2006–07 the mean length of accommodation was 42 days, the median length of accommodation was 9 days; in 2007–08 the mean length of accommodation was 48 days, the median length of accommodation was 10 days; in 2008–09 the mean length of accommodation was 54 days, the median length of accommodation was 12 days; and in 2009–10 the mean length of accommodation was 57 days, the median length of accommodation was 13 days.
(b) In South Australia, a large number of agencies do not provide accommodation, they provide support services only.
Notes 1. Number excluded due to errors and omissions (weighted): 2,287 in 2006–07; 1,302 in 2007–08; 3,057 in 2008–09; 1,720 in 2009–10. 2. Caution should be used when comparing data across years because of changes in policy and service delivery arrangements. 3. Figures have been weighted to adjust for agency non-participation.
Source: Client Collection.

14 Government-funded specialist homelessness services 2009–10: Australia appendix
Table A20: Closed support periods in which clients were accommodated(a)(b): mean and median length of accommodation by client group, by reporting period, 2006–07 to 2009–10 (days)
Client group
Mean Median
2006–07 2007–08 2008–09 2009–10 2006–07 2007–08 2008–09 2009–10
Male alone, under 25 44 48 47 56 11 13 13 14
Male alone, 25+ 37 41 41 44 9 11 12 12
Female alone, under 25 51 55 54 59 11 13 13 13
Female alone, 25+ 35 41 41 42 7 7 8 8
Couple no children 66 84 61 69 16 23 14 18
Couple with children 148 165 167 157 87 94 91 97
Male with children 123 137 144 129 70 84 75 69
Female with children 65 70 79 81 15 18 22 21
Other 114 108 104 92 41 33 18 21
(a) Accommodation data are reported differently in Victoria to other jurisdictions (see Box 1.1 in the main report). (b) In South Australia, a large number of agencies do not provide accommodation, they provide support services only.
Notes 1. Number excluded due to errors and omissions (weighted): 3,214 in 2006–07; 2,376 in 2007–08; 3,950 in 2008–09; 2,521 in 2009–10. 2. Table excludes accommodation that started and ended on the same date. 3. Caution should be used when comparing data across years because of changes in policy and service delivery arrangements. 4. Figures have been weighted to adjust for agency non-participation and client non-consent.
Source: Client Collection.

Government-funded specialist homelessness services 2009–10: Australia appendix 15
Table A21: Closed support periods: type of support required by clients, by reporting period, 2006–07 to 2009–10 (per cent) Type of support 2006–07 2007–08 2008–09 2009–10 Housing/accommodation 63.1 61.4 63.0 58.3
SAAP/CAP accommodation(a)(b)(c) 45.0 41.2 39.1 35.0 Assistance to obtain/maintain short-term accommodation 14.2 14.1 18.9 19.0 Assistance to obtain/maintain medium-term accommodation 9.8 10.9 10.5 10.0 Assistance to obtain/maintain independent housing 22.2 22.8 26.4 25.3
Financial/employment 39.5 38.9 40.4 41.6 Assistance to obtain/maintain government allowance 8.7 9.0 12.5 10.7 Employment and training assistance 5.5 5.4 6.0 6.4 Financial assistance/material aid 32.3 31.2 31.9 34.7 Financial counselling and support 8.9 9.4 10.3 8.9
Personal support 57.6 54.7 57.6 58.1 Incest/sexual assault 2.1 2.0 1.9 1.1 Domestic/family violence 20.5 19.9 21.2 21.3 Family/relationship 14.7 16.3 16.6 15.6 Emotional support 50.8 48.6 51.1 51.7 Assistance with problem gambling 0.7 0.5 0.4 0.3
General support/advocacy 78.4 79.0 78.6 78.5 Living skills/personal development 17.1 17.0 18.7 17.3 Assistance with legal issues/court support 10.2 10.1 10.3 10.9 Advice/information 70.9 71.5 71.7 71.0 Retrieval/storage/removal of belongings 16.0 15.0 15.6 14.6 Advocacy/liaison on behalf of client 36.4 37.3 40.8 42.6
Specialist services 30.0 26.2 27.2 25.6 Psychological services 6.3 4.7 4.6 4.6 Specialist counselling services 6.6 6.4 6.8 6.6 Psychiatric services 2.7 2.6 2.4 2.5 Pregnancy support 1.4 1.4 1.3 1.2 Family planning support 1.1 1.1 0.9 0.9 Drug/alcohol support or intervention 7.3 6.2 7.4 6.5 Physical disability services 0.3 0.2 0.2 0.3 Intellectual disability services 0.3 0.3 0.3 0.3 Culturally specific services 5.7 5.2 5.6 5.8 Interpreter services 1.2 1.1 1.1 1.4 Assistance with immigration services 0.9 0.8 0.9 0.9 Health/medical services 13.6 11.6 11.9 11.5
Basic support/other n.e.s. 49.2 47.4 49.1 49.3 Meals 33.7 31.2 32.0 29.5 Laundry/shower facilities 31.7 28.3 28.4 26.3 Recreation 17.9 16.2 16.5 16.0 Transport 21.9 20.7 21.2 21.2 Other 11.2 12.5 16.1 18.4
No needs recorded 0.5 0.5 0.7 0.6 Total (number) 172,400 181,000 171,200 180,900 (a) Accommodation data are reported differently in Victoria to other jurisdictions (see Box 1.1 in the main report).. If Victoria is excluded from the
calculations, the proportion of closed support periods in which ‘SAAP/CAP accommodation’ was required was 58% in 2006–07; 51% in 2007–08; 51% in 2008–09; and 47% in 2009–10.
(b) In South Australia, a large number of agencies do not provide accommodation, they provide support services only. (c) ‘SAAP/CAP accommodation’ refers to what is now known as ‘specialist homelessness accommodation’. Notes 1. Number excluded due to errors and omissions (weighted) (closed support periods with no information on support requirements or provision):
5,540 in 2006–07; 5,945 in 2007–08; 5,607 in 2008–09; 7,556 in 2009–10. 2. Clients were able to receive multiple types of support, so the percentages do not add to 100. 3. A client may require more than one type of support within a broad type of assistance. 4. Caution should be used when comparing data across years because of changes in policy and service delivery arrangements. 5. Figures have been weighted to adjust for agency non-participation. Source: Client Collection.

16 Government-funded specialist homelessness services 2009–10: Australia appendix
Table A22: Closed support periods: type of support required by clients, by client group, 2009–10 (per cent)
Type of support
Male alone
under 25
Male alone
25+
Female alone
under 25
Female alone
25+
Couple no
children
Couple with
children
Male with
children
Female with
children Other Housing/accommodation 69.6 53.8 65.8 46.2 63.5 69.7 63.8 64.5 59.3
SAAP/CAP accommodation(a)(b)(c) 42.9 38.2 36.4 25.5 20.5 29.5 25.5 37.4 31.3 Assistance to obtain/ maintain short-term accommodation 26.0 16.1 24.3 13.8 25.1 22.6 23.7 18.7 18.1 Assistance to obtain/ maintain medium-term accommodation 16.0 9.0 15.0 4.7 9.9 13.3 11.1 10.3 7.7 Assistance to obtain/ maintain independent housing 26.0 17.9 27.0 19.7 39.7 45.9 39.7 34.9 29.0
Financial/employment 46.5 45.5 42.0 37.9 48.9 46.7 44.6 44.2 31.4 Assistance to obtain/ maintain government allowance 17.3 8.5 15.2 8.4 7.6 6.7 6.0 12.6 8.0 Employment and training assistance 15.8 3.9 12.8 3.4 6.1 6.3 4.5 4.7 7.5 Financial assistance/material aid 33.8 40.3 31.1 33.0 42.2 40.2 39.4 37.8 22.7 Financial counselling and support 11.7 6.2 10.1 7.1 11.0 15.5 11.1 11.3 7.7
Personal support 55.0 40.5 65.4 65.5 46.9 55.0 48.9 76.4 62.1 Incest/sexual assault 0.7 0.2 2.5 1.4 0.6 0.5 0.3 1.8 0.9 Domestic/family violence 3.9 1.8 18.2 38.3 6.6 6.9 5.5 47.5 22.7 Family/relationship 19.7 6.8 24.1 14.4 11.9 16.5 14.8 21.8 21.7 Emotional support 51.0 38.9 57.9 56.8 44.0 50.5 45.1 66.5 50.2 Assistance with problem gambling 0.4 0.6 0.1 0.2 0.2 0.4 0.4 0.2 0.1
General support/advocacy 81.0 74.6 81.6 78.2 78.9 81.9 81.1 84.8 70.1 Living skills/personal development 32.9 13.2 29.9 11.9 13.4 15.4 13.6 16.3 16.0 Assistance with legal issues/court support 10.0 3.8 9.8 16.0 6.1 6.2 7.5 18.9 5.7 Advice/information 72.4 66.7 72.8 71.0 73.0 76.5 76.6 79.2 63.1 Retrieval/storage/removal of belongings 19.1 26.9 12.3 8.6 9.0 5.7 5.5 9.9 6.9 Advocacy/liaison on behalf of client 44.4 33.5 45.9 46.0 47.6 51.2 49.0 54.6 45.8
Specialist services 26.0 26.1 26.2 26.7 18.3 17.0 16.6 30.8 27.5 Psychological services 4.6 4.8 4.7 5.6 3.4 2.5 3.6 4.5 6.5 Specialist counselling services 5.1 2.7 7.3 8.6 3.5 4.2 5.1 12.3 6.5 Psychiatric services 2.3 4.5 1.5 2.8 2.1 0.8 1.1 1.1 2.3 Pregnancy support 0.1 — 2.9 0.5 2.3 2.3 0.2 2.5 4.1 Family planning support 0.5 0.1 2.0 0.3 0.9 1.8 1.0 1.7 1.1 Drug/alcohol support or intervention 10.8 11.0 5.5 5.2 4.6 3.2 3.9 3.0 4.1 Physical disability services 0.2 0.2 0.2 0.4 0.3 0.4 0.4 0.3 0.6 Intellectual disability services 0.7 0.2 0.5 0.3 0.2 0.4 0.3 0.3 0.5 Culturally specific services 4.6 1.9 5.7 7.8 3.5 4.3 4.7 10.8 6.9 Interpreter services 0.4 0.3 0.8 2.3 0.5 1.1 1.0 3.0 1.4 Assistance with immigration services 0.2 0.2 0.9 1.6 0.2 0.5 0.3 2.0 0.9 Health/medical services 13.5 14.8 12.8 9.5 8.8 7.0 4.6 11.5 9.4
Basic support/other n.e.s. 56.6 58.9 51.9 43.4 36.4 32.2 30.8 46.2 38.8 Meals 40.6 41.6 32.9 24.4 16.9 9.8 11.5 22.1 13.4 Laundry/shower facilities 35.1 40.1 27.8 20.2 11.9 5.9 5.1 20.4 11.7 Recreation 25.7 15.7 23.7 14.1 6.2 4.2 4.1 14.6 10.3 Transport 30.8 12.3 31.1 19.3 15.1 13.9 11.6 26.1 17.0 Other 15.6 21.7 15.7 19.1 14.6 15.3 16.3 22.0 19.9
No needs recorded 0.6 0.3 0.5 0.5 1.0 1.1 0.7 0.7 1.3 Total (number) 18,600 47,600 22,100 34,000 6,200 7,600 2,600 39,200 1,400 (a) Accommodation data are reported differently in Victoria to other jurisdictions (see Box 1.1 in the main report).. (b) In South Australia, a large number of agencies do not provide accommodation, they provide support services only. (c) ‘SAAP/CAP accommodation’ refers to what is now known as ‘specialist homelessness accommodation’. Notes 1. Number excluded due to errors and omissions (weighted): 9,323 (including those with no information on support requirements or provision). 2. Clients were able to receive multiple types of support, so the percentages do not add to 100. 3. A client may require more than one type of support within a broad type of assistance. 4. Figures have been weighted to adjust for agency non-participation and client non-consent. Source: Client Collection.

Government-funded specialist homelessness services 2009–10: Australia appendix 17
Table A23: Type of support required by clients in closed support periods, by provision, 2009–10
Part a: Individual types of support required in closed support periods, by provision (percentage of closed support periods)
Not provided Provided Closed
support periods
(number) Type of support
Neither provided
nor referred
Referred only
Sub-total
Provided only
Provided and
referred Sub-total Total
Housing/accommodation SAAP/CAP accommodation(a)(b)(c) 6.5 7.0 13.5 81.1 5.4 86.5 100.0 63,300 Assistance to obtain/maintain short-term accommodation 7.1 9.3 16.4 61.4 22.2 83.6 100.0 34,300 Assistance to obtain/maintain medium-term accommodation 11.6 10.1 21.7 50.2 28.1 78.3 100.0 18,100 Assistance to obtain/maintain independent housing 7.0 8.5 15.5 62.7 21.8 84.5 100.0 45,700
Financial/employment Assistance to obtain/maintain government allowance 4.6 7.7 12.3 64.0 23.6 87.6 100.0 19,300 Employment and training assistance 13.7 15.0 28.7 46.2 25.1 71.3 100.0 11,600 Financial assistance/material aid 2.2 4.5 6.7 82.4 10.9 93.3 100.0 62,800 Financial counselling and support 8.1 12.1 20.2 60.2 19.6 79.8 100.0 16,100
Personal support Incest/sexual assault 7.8 16.7 24.5 55.2 20.3 75.5 100.0 2,100 Domestic/family violence 2.8 3.0 5.8 83.3 10.9 94.2 100.0 38,600 Family/relationship 4.9 4.1 9.0 79.7 11.3 91.0 100.0 28,200 Emotional support 1.5 0.5 2.0 92.8 5.2 98.0 100.0 93,600 Assistance with problem gambling 15.1 15.5 30.6 48.9 20.5 69.4 100.0 600
General support/advocacy Living skills/personal development 4.2 1.7 5.9 88.7 5.4 94.1 100.0 31,400 Assistance with legal issues/ court support 4.8 10.9 15.7 54.9 29.4 84.3 100.0 19,700 Advice/information 0.7 0.2 0.9 93.5 5.6 99.1 100.0 128,500 Retrieval/storage/removal of belongings 2.1 1.5 3.6 93.0 3.4 96.4 100.0 26,300 Advocacy/liaison on behalf of client 1.2 1.3 2.5 88.3 9.1 97.4 100.0 77,000
Specialist services Psychological services 10.2 22.7 32.9 40.8 26.4 67.2 100.0 8,400 Specialist counselling services 7.0 30.8 37.8 35.7 26.5 62.2 100.0 12,000 Psychiatric services 14.6 31.5 46.1 39.2 14.7 53.9 100.0 4,500 Pregnancy support 7.5 13.6 21.1 46.8 32.1 78.9 100.0 2,100 Family planning support 9.2 16.2 25.4 49.3 25.3 74.6 100.0 1,500 Drug/alcohol support or intervention 11.1 12.2 23.3 54.0 22.7 76.7 100.0 11,800 Physical disability services 26.9 32.7 59.6 20.9 19.5 40.4 100.0 500 Intellectual disability services 29.1 27.8 56.9 21.8 21.3 43.1 100.0 600 Culturally specific services 3.1 5.7 8.8 72.1 19.1 91.2 100.0 10,500 Interpreter services 2.6 7.5 10.1 54.4 35.4 89.8 100.0 2,500 Assistance with immigration issues 3.8 12.8 16.6 42.7 40.6 83.3 100.0 1,600 Health/medical services 6.7 26.8 33.5 46.7 19.9 66.6 100.0 20,800
Basic support/other n.e.s. Meals 1.0 1.2 2.2 95.3 2.5 97.8 100.0 53,300 Laundry/shower facilities 0.9 0.4 1.3 97.7 1.0 98.7 100.0 47,600 Recreation 1.6 0.9 2.5 95.4 2.1 97.5 100.0 29,000 Transport 2.3 1.6 3.9 92.9 3.3 96.2 100.0 38,300 Other 2.1 1.9 4.0 87.2 8.9 96.1 100.0 33,300
(continued)

18 Government-funded specialist homelessness services 2009–10: Australia appendix
Table A23 (continued): Type of support required by clients in closed support periods, by provision, 2009–10 Part b: Broad types of support required in closed support periods, by provision (percentage of distinct types of support required)
Not provided Provided Distinct types of support
required (number)
Closed support periods
(number) Broad type of support
Neither provided
nor referred Referred
only Subtotal Provided
only
Provided and
referred Subtotal Total
Housing/ accommodation(a)(b) 7.4 8.2 15.6 68.2 16.2 84.4 100.0 161,300 105,500
Financial/ employment 4.7 7.3 12.0 72.1 15.9 88.0 100.0 109,800 75,300
Personal support 2.5 2.0 4.5 87.7 7.8 95.5 100.0 163,000 105,100
General support/ advocacy 1.6 1.6 3.2 88.8 8.0 96.8 100.0 283,000 142,000
Specialist services 8.0 20.7 28.7 48.3 23.0 71.3 100.0 77,000 46,300
Basic support/ other n.e.s. 1.5 1.2 2.7 94.1 3.3 97.4 100.0 201,500 89,200
Total (%) 3.5 4.7 8.2 81.4 10.4 91.8 100.0 . . . .
Total (number) 34,900 47,200 82,100 810,200 103,300 913,500 . . 995,600 179,900
(a) Accommodation data are reported differently in Victoria to other jurisdictions (see Box 1.1 in the main report).. (b) In South Australia, a large number of agencies do not provide accommodation, they provide support services only. (c) ‘SAAP/CAP accommodation’ refers to what is now known as ‘specialist homelessness accommodation’.
Notes for tables A23 and A24 1. Number excluded due to errors and omissions (weighted) (closed support periods with no information on support requirements or provision):
5,607 in 2008–09; 7,556 in 2009–10. 2. In broad groups of support types, a client may require more than one type of support within the group. The percentages for broad groups
relate to all needs and not to support periods. For individual types of support, a need can be recorded only once within a support period, so the percentages relate to support periods.
3. Caution should be used when comparing data across years because of changes in policy and service delivery arrangements. 4. Figures have been weighted to adjust for agency non-participation.
Source: Client Collection.
Table A24: Broad types of support required in closed support periods, by provision, 2008–09 (percentage of distinct types of support required)
Not provided Provided Distinct types of support
required (number)
Closed support periods
(number) Broad type of support
Neither provided
nor referred Referred
only Subtotal Provided
only
Provided and
referred Subtotal Total
Housing/ accommodation(a)(b) 6.9 9.7 16.6 68.6 14.8 83.4 100.0 162,500 107,800
Financial/ employment 5.2 8.5 13.7 73.3 13.1 86.4 100.0 103,900 69,100
Personal support 2.8 2.3 5.1 88.7 6.2 94.9 100.0 156,000 98,600
General support/ advocacy 2.0 2.0 4.0 89.4 6.6 96.0 100.0 269,000 134,500
Specialist services 7.7 22.2 29.9 50.8 19.4 70.2 100.0 74,500 46,500
Basic support/ other n.e.s. 1.9 1.4 3.3 94.1 2.6 96.7 100.0 195,400 84,000
Total (%) 3.7 5.5 9.2 82.0 8.8 90.8 100.0 . . . .
Total (number) 35,800 52,900 88,700 788,000 84,600 872,600 . . 961,400 170,000

Government-funded specialist homelessness services 2009–10: Australia appendix 19
Table A25: Closed accompanying child support periods: type of support required for accompanying children, by reporting period, 2006–07 to 2009–10 (per cent)
Type of support 2006–07 2007–08 2008–09 2009–10
Accommodation 65.7 62.5 64.3 60.2
SAAP/CAP accommodation(a)(b)(c) 65.7 62.5 64.3 60.2
School liaison/child care 28.5 25.3 23.8 22.6
School liaison 12.6 10.9 11.1 10.9
Child care 20.1 17.7 16.2 16.0
Personal support 21.1 19.5 19.2 19.6
Help with behavioural problems 8.1 7.6 8.4 9.3
Sexual/physical abuse support 2.8 1.8 2.5 3.0
Skills education 6.2 5.9 5.6 7.3
Structured play/skill development 13.4 13.1 12.3 13.3
General support/advocacy 43.6 47.1 49.4 51.3
Access arrangements 4.5 4.4 4.3 4.5
Advice/information 29.3 33.0 36.1 39.6
Advocacy 27.6 28.4 31.5 31.8
Specialist services 20.3 20.1 20.4 20.9
Specialist counselling 5.7 4.8 5.4 6.1
Culturally specific services 8.3 8.3 8.3 9.1
Health/medical services 10.2 10.2 10.7 11.3
Basic support/other n.e.s. 60.6 56.2 53.2 54.9
Meals 39.5 37.3 34.6 33.1
Showers/hygiene 36.2 34.2 31.1 29.9
Recreation 29.4 26.6 25.5 25.2
Transport 37.3 34.3 31.8 29.1
Other 14.8 14.7 17.8 22.3
No needs recorded 0.8 0.7 0.4 0.8
Total (number) 44,200 47,100 46,700 47,800
(a) Accommodation data are reported differently in Victoria to other jurisdictions (see Box 1.1 in the main report).. If Victoria is excluded from the calculations, the proportion of closed accompanying child support periods in which ‘SAAP/CAP accommodation’ was required was 70% in 2006–07; 65% in 2007–08; 65% in 2008–09; and 62% in 2009–10.
(b) In South Australia, a large number of agencies do not provide accommodation, they provide support services only. (c) ‘SAAP/CAP accommodation’ refers to what is now known as ‘specialist homelessness accommodation’.
Notes 1. Number excluded due to errors and omissions (weighted) (closed support periods with no information on support requirements or provision):
38,089 in 2006–07; 40,340 in 2007–08; 43,374 in 2008–09; 47,512 in 2009–10. In the majority of these, ‘no assistance’ was indicated as required for the accompanying child.
2. Accompanying children were able to receive multiple types of support, so the percentages do not add to 100. 3. An accompanying child may require more than one type of support within a broad type of assistance. 4. Caution should be used when comparing data across years because of changes in policy and service delivery arrangements. 5. Figures have been weighted to adjust for agency non-participation.
Source: Client Collection.
20 Government-funded specialist homelessness services 2009–10: Australia appendix
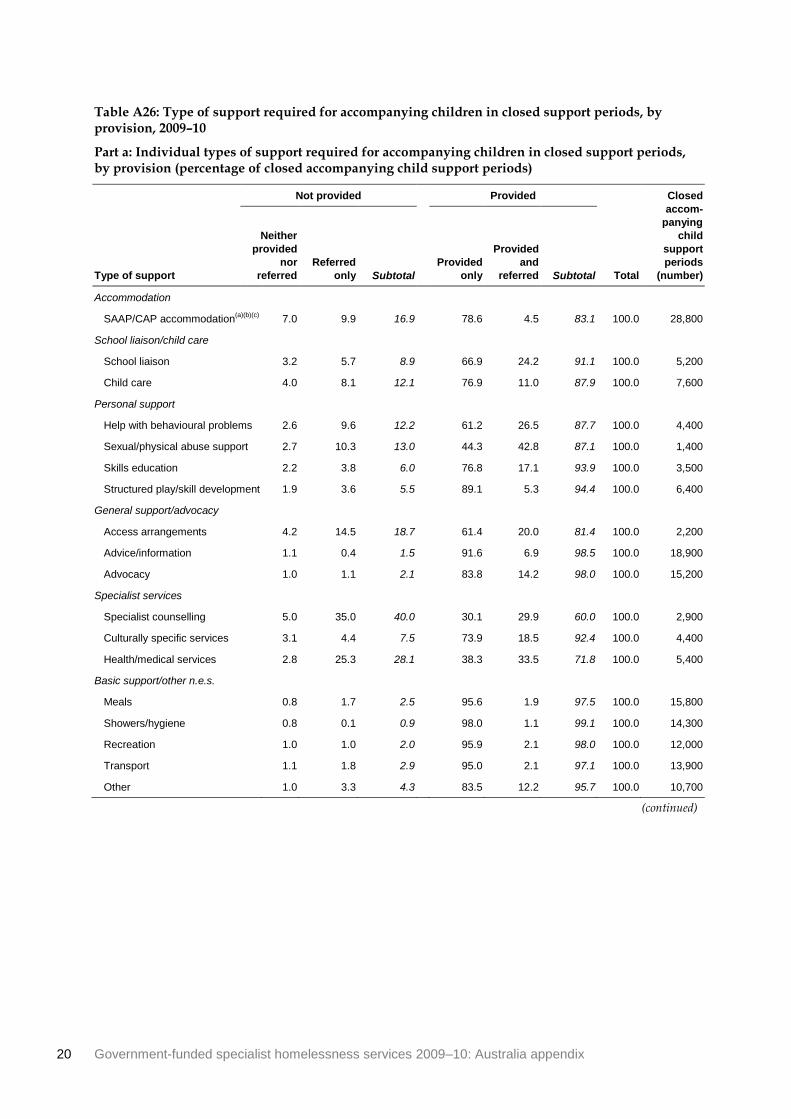
Table A26: Type of support required for accompanying children in closed support periods, by provision, 2009–10
Part a: Individual types of support required for accompanying children in closed support periods, by provision (percentage of closed accompanying child support periods)
Not provided Provided Closed accom-
panying child
support periods
(number) Type of support
Neither provided
nor referred
Referred only Subtotal
Provided only
Provided and
referred Subtotal Total
Accommodation
SAAP/CAP accommodation(a)(b)(c) 7.0 9.9 16.9 78.6 4.5 83.1 100.0 28,800
School liaison/child care
School liaison 3.2 5.7 8.9 66.9 24.2 91.1 100.0 5,200
Child care 4.0 8.1 12.1 76.9 11.0 87.9 100.0 7,600
Personal support
Help with behavioural problems 2.6 9.6 12.2 61.2 26.5 87.7 100.0 4,400
Sexual/physical abuse support 2.7 10.3 13.0 44.3 42.8 87.1 100.0 1,400
Skills education 2.2 3.8 6.0 76.8 17.1 93.9 100.0 3,500
Structured play/skill development 1.9 3.6 5.5 89.1 5.3 94.4 100.0 6,400
General support/advocacy
Access arrangements 4.2 14.5 18.7 61.4 20.0 81.4 100.0 2,200
Advice/information 1.1 0.4 1.5 91.6 6.9 98.5 100.0 18,900
Advocacy 1.0 1.1 2.1 83.8 14.2 98.0 100.0 15,200
Specialist services
Specialist counselling 5.0 35.0 40.0 30.1 29.9 60.0 100.0 2,900
Culturally specific services 3.1 4.4 7.5 73.9 18.5 92.4 100.0 4,400
Health/medical services 2.8 25.3 28.1 38.3 33.5 71.8 100.0 5,400
Basic support/other n.e.s.
Meals 0.8 1.7 2.5 95.6 1.9 97.5 100.0 15,800
Showers/hygiene 0.8 0.1 0.9 98.0 1.1 99.1 100.0 14,300
Recreation 1.0 1.0 2.0 95.9 2.1 98.0 100.0 12,000
Transport 1.1 1.8 2.9 95.0 2.1 97.1 100.0 13,900
Other 1.0 3.3 4.3 83.5 12.2 95.7 100.0 10,700
(continued)

Government-funded specialist homelessness services 2009–10: Australia appendix 21
Table A26 (continued): Type of support required for accompanying children in closed support periods, by provision, 2009–10 Part b: Broad types of support required for accompanying children in closed support periods, by provision (percentage of distinct types of support required) Not provided Provided
Distinct types of support
required (number)
Closed accom-
panying child
support periods
(number) Broad type of support
Neither provided
nor referred
Referred only
Sub- total
Provided only
Provided and
referred Sub- total Total
Accommodation(a)(b) 7.0 9.9 16.9 78.6 4.5 83.1 100.0 28,800 28,800
School liaison/ child care 3.7 7.1 10.8 72.8 16.4 89.2 100.0 12,800 10,800
Personal support 2.3 6.0 8.3 74.4 17.3 91.7 100.0 15,800 9,400
General support/ advocacy 1.2 1.5 2.7 86.5 10.7 97.2 100.0 36,300 24,500
Specialist services 3.4 20.4 23.8 48.7 27.5 76.2 100.0 12,700 10,000
Basic support/ other n.e.s. 0.9 1.5 2.4 94.1 3.5 97.6 100.0 66,800 26,300
Total (%) 2.5 5.1 7.6 83.2 9.1 92.4 100.0 . . . .
Total (number) 4,400 8,800 13,200 144,100 15,800 159,900 . . 173,100 47,400 (a) Accommodation data are reported differently in Victoria to other jurisdictions (see Box 1.1 in the main report). (b) In South Australia, a large number of agencies do not provide accommodation, they provide support services only. (c) ‘SAAP/CAP accommodation’ refers to what is now known as ‘specialist homelessness accommodation’. Notes for tables A26 and A27 1. Number excluded due to errors and omissions (weighted) (closed support periods with no information on support requirements or provision):
43,374 in 2008–09; 47,512 in 2009–10. In the majority of these, ‘no assistance’ was indicated as required for the accompanying child. 2. In broad groups of support types, an accompanying child may require more than one type of support within the group. The percentages for
broad groups relate to all needs and not to support periods. For individual types of support, a need can be recorded only once within a support period, so the percentages relate to accompanying child support periods.
3. Caution should be used when comparing data across years because of changes in policy and service delivery arrangements. 4. Figures have been weighted to adjust for agency non-participation. Source: Client Collection.
Table A27: Broad types of support required for accompanying children in closed support periods, by provision, 2008–09 (percentage of distinct types of support required)
Not provided Provided
Distinct types of support
required (number)
Closed accom-
panying child
support periods
(number) Broad type of support
Neither provided
nor referred
Referred only
Sub- total
Provided only
Provided and
referred Sub- total Total
Accommodation(a) 7.8 8.9 16.7 78.8 4.5 83.3 100.0 30,000 30,000
School liaison/ child care 5.0 9.1 14.1 72.6 13.2 85.8 100.0 12,800 11,100
Personal support 4.0 7.8 11.8 75.6 12.6 88.2 100.0 13,400 9,000
General support/ advocacy 1.9 4.4 6.3 86.5 7.2 93.7 100.0 33,600 23,000
Specialist services 4.4 22.6 27.0 49.9 23.0 72.9 100.0 11,400 9,500
Basic support/ other n.e.s. 1.4 1.4 2.8 94.5 2.7 97.2 100.0 65,800 24,800
Total (%) 3.3 5.9 9.2 83.8 6.9 90.8 100.0 . . . .
Total (number) 5,500 9,900 15,400 140,000 11,600 151,600 . . 167,000 46,500

22 Government-funded specialist homelessness services 2009–10: Australia appendix
Table A28: Closed support periods: main source of income immediately before and after a support period, by reporting period, 2008–09 to 2009–10 (per cent)
Closed support periods in which clients needed
assistance to obtain/maintain a pension or benefit All closed support periods
Main source of income Before After Before After
2008–09
No income 17.4 7.8 9.7 6.9
Government payments 75.6 84.8 81.9 84.1
Other 7.0 7.4 8.4 9.1
Total 100.0 100.0 100.0 100.0
Total (number) 20,100 18,900 160,400 147,700
2009–10
No income 17.7 7.7 8.5 6.1
Government payments 73.8 83.5 83.3 85.2
Other 8.4 8.8 8.2 8.7
Total 100.0 100.0 100.0 100.0
Total (number) 18,900 17,700 170,100 158,500
Notes 1. Number excluded due to errors and omissions (weighted): 16,804 before support (including ‘Don’t know’), 29,564 after support (including
‘Don’t know’ and ‘Client left without providing any information’) in 2008–09; 18,300 before support (including ‘Don’t know’), 29,976 after support (including ‘Don’t know’ and ‘Client left without providing any information’) in 2009–10.
2. Caution should be used when comparing data across years because of changes in policy and service delivery arrangements. 3. Figures have been weighted to adjust for agency non-participation and client non-consent.
Source: Client Collection.
Table A29: Closed support periods: main source of income immediately after a support period by length of support, by reporting period, 2008–09 to 2009–10 (per cent)
After support 1 week or
less >1 week– 1 month
>1–3 months
>3–6 months
>6 months
Total
Per cent Number
2008–09
No income 8.1 7.3 5.9 5.1 4.5 6.9 10,200
Government payments 84.8 84.6 84.3 81.5 81.8 84.1 124,200
Other 7.1 8.1 9.9 13.4 13.7 9.1 13,400
Total 100.0 100.0 100.0 100.0 100.0 100.0 . .
Total (number) 63,500 23,800 34,000 13,600 12,900 . . 147,700
2009–10
No income 6.4 6.3 6.1 5.4 4.4 6.1 9,600
Government payments 86.9 85.1 83.7 82.9 83.0 85.2 135,100
Other 6.7 8.6 10.2 11.8 12.6 8.7 13,800
Total 100.0 100.0 100.0 100.0 100.0 100.0 . .
Total (number) 72,900 22,500 34,500 14,800 13,800 . . 158,500
Notes 1. Number excluded due to errors and omissions (weighted): 29,564 (including ‘Don’t know’ and ‘Client left without providing any information’)
in 2008–09; 29,976 (including ‘Don’t know’ and ‘Client left without providing any information’) in 2009–10. 2. Caution should be used when comparing data across years because of changes in policy and service delivery arrangements. 3. Figures have been weighted to adjust for agency non-participation and client non-consent.
Source: Client Collection.

Government-funded specialist homelessness services 2009–10: Australia appendix 23
Table A30: Closed support periods: employment status in the week before and after a support period, 2008–09 to 2009–10 (per cent)
Closed support periods in which clients needed
assistance in employment and training All closed support periods
Employment status Before After Before After
2008–09
Employed full/part time 10.0 20.3 10.0 11.9
Unemployed (looking for work) 34.0 30.2 21.7 20.5
Not in labour force 56.1 49.5 68.3 67.6
Total 100.0 100.0 100.0 100.0
Total (number) 10,400 9,300 159,600 144,900
2009–10
Employed full/part time 10.8 20.7 9.3 11.1
Unemployed (looking for work) 33.5 29.6 26.1 25.4
Not in labour force 55.6 49.7 64.6 63.5
Total 100.0 100.0 100.0 100.0
Total (number) 11,400 10,500 169,200 155,700
Notes 1. Number excluded due to errors and omissions (weighted): 17,613 before support (including ‘Don’t know’), 32,325 after support (including
‘Don’t know’ and ‘Client left without providing any information’) in 2008–09; 19,226 before support (including ‘Don’t know’), 32,781 after support (including ‘Don’t know’ and ‘Client left without providing any information’) in 2009–10.
2. Caution should be used when comparing data across years because of changes in policy and service delivery arrangements. 3. Figures have been weighted to adjust for agency non-participation and client non-consent.
Source: Client Collection.
Table A31: Closed support periods: employment status in the week after a support period, by length of support, 2008–09 to 2009–10 (per cent)
After support 1 week or less
>1 week– 1 month
>1–3 months
>3–6 months
>6 months
Total
Per cent Number
2008–09
Employed full/part time 8.1 10.9 13.9 18.6 20.8 11.9 17,300
Unemployed (looking for work) 21.8 22.4 21.0 16.5 13.5 20.5 29,700
Not in labour force 70.2 66.7 65.2 64.9 65.7 67.6 98,000
Total 100.0 100.0 100.0 100.0 100.0 100.0 . .
Total (number) 62,600 23,200 33,300 13,300 12,600 . . 144,900
2009–10
Employed full/part time 7.0 11.3 13.9 16.6 19.5 11.1 17,200
Unemployed (looking for work) 32.4 21.5 20.6 17.2 15.5 25.4 39,600
Not in labour force 60.6 67.2 65.5 66.3 65.0 63.5 98,900
Total 100.0 100.0 100.0 100.0 100.0 100.0
Total (number) 72,200 21,900 33,700 14,400 13,400 . . 155,700
Notes 1. Number excluded due to errors and omissions (weighted): 32,325 (including ‘Don’t know’ and ‘Client left without providing any information’)
in 2008–09; 32,781 (including ‘Don’t know’ and ‘Client left without providing any information’) in 2009–10. 2. Caution should be used when comparing data across years because of changes in policy and service delivery arrangements. 3. Figures have been weighted to adjust for agency non-participation and client non-consent.
Source: Client Collection.

24 Government-funded specialist homelessness services 2009–10: Australia appendix
Table A32: Closed support periods: type of house/dwelling immediately before and after a support period, by reporting period, 2008–09 to 2009–10 (per cent)
Type of house/dwelling
Closed support periods in which clients needed assistance to obtain/maintain
independent housing All closed support periods
Before After Before After
2008–09
Improvised dwelling/sleeping rough 9.1 2.6 11.9 7.1
Improvised dwelling/car/tent/squat 5.9 1.9 5.9 3.0
Street/park/in the open 3.3 0.7 6.0 4.1
House/dwelling 85.6 93.9 83.3 89.0
House/flat 69.2 79.3 65.8 70.2
Caravan 2.8 2.3 2.0 1.7
Boarding/rooming house 7.2 7.5 8.5 10.2
Hostel/hotel/motel 6.4 4.8 7.0 6.9
Institutional setting 5.2 3.5 4.8 3.9
Hospital 0.8 0.4 0.8 0.5
Psychiatric institution 0.8 0.3 0.6 0.3
Prison/youth training centre 1.3 0.5 1.2 0.6
Other institutional setting 2.3 2.2 2.1 2.4
Total 100.0 100.0 100.0 100.0
Total (number) 43,400 35,800 160,500 132,200
2009–10
Improvised dwelling/sleeping rough 8.2 2.4 12.1 7.1
Improvised dwelling/car/tent/squat 5.6 1.7 6.3 3.2
Street/park/in the open 2.6 0.8 5.8 3.9
House/dwelling 87.1 94.7 83.4 89.4
House/flat 71.6 80.7 65.6 69.8
Caravan 2.6 2.1 1.8 1.5
Boarding/rooming house 6.7 7.4 9.2 11.0
Hostel/hotel/motel 6.3 4.5 6.8 7.0
Institutional setting 4.7 2.9 4.4 3.5
Hospital 0.8 0.4 0.9 0.5
Psychiatric institution 0.6 0.3 0.5 0.3
Prison/youth training centre 1.2 0.6 1.1 0.5
Other institutional setting 2.1 1.6 1.9 2.1
Total 100.0 100.0 100.0 100.0
Total (number) 46,000 38,900 169,800 142,800
Notes 1. Number excluded due to errors and omissions (weighted): 16,773 before support (including ‘Don’t know’), 45,067 after support (including
‘Don’t know’ and ‘Client left without providing any information’) in 2008–09; 18,686 before support (including ‘Don’t know’), 45,610 after support (including ‘Don’t know’ and ‘Client left without providing any information’) in 2009–10.
2. Caution should be used when comparing data across years because of changes in policy and service delivery arrangements. 3. Figures have been weighted to adjust for agency non-participation and client non-consent.
Source: Client Collection.

Government-funded specialist homelessness services 2009–10: Australia appendix 25
Table A33: Closed support periods: type of tenure immediately before and after a support period, by reporting period, 2008–09 to 2009–10 (per cent)
Type of tenure
Closed support periods in which clients needed assistance to
obtain/maintain independent housing All closed support
periods
Before After Before After
2008–09
SAAP/CAP funded accommodation(a) 13.1 11.8 12.7 14.9
SAAP/CAP crisis/short-term accommodation 9.1 5.8 8.5 8.6
SAAP/CAP medium/long-term accommodation 2.3 4.4 2.1 4.3
Other SAAP/CAP funded accommodation 1.7 1.6 2.0 2.1
No tenure 13.9 5.0 16.7 10.8
Institutional setting 3.5 2.0 3.2 2.3
Improvised dwelling/sleeping rough 7.8 1.8 10.5 5.8
Other 2.6 1.3 3.0 2.7
Tenure 73.0 83.2 70.6 74.3
Purchasing/purchased own home 2.9 1.9 4.3 3.7
Private rental 30.1 39.3 27.2 30.3
Public housing rental 8.5 15.0 10.0 12.8
Community housing rental 3.4 6.7 5.4 7.7
Rent-free accommodation 8.7 4.8 8.0 5.6
Boarding 19.5 15.5 15.7 14.2
Total 100.0 100.0 100.0 100.0
Total (number) 41,500 34,600 150,100 124,700
2009–10
SAAP/CAP funded accommodation(a) 12.1 10.4 11.5 14.0
SAAP/CAP crisis/short-term accommodation 8.4 4.9 7.3 7.5
SAAP/CAP medium/long-term accommodation 2.0 3.9 1.9 3.9
Other SAAP/CAP funded accommodation 1.8 1.7 2.3 2.6
No tenure 12.5 5.0 16.9 10.7
Institutional setting 3.1 1.8 3.0 2.1
Improvised dwelling/sleeping rough 6.8 1.9 10.7 5.5
Other 2.6 1.4 3.2 3.1
Tenure 75.4 84.5 71.6 75.2
Purchasing/purchased own home 3.3 2.6 4.4 4.0
Private rental 31.7 40.7 26.9 29.9
Public housing rental 7.9 13.7 10.2 13.0
Community housing rental 3.5 6.4 4.9 6.9
Rent-free accommodation 8.8 5.3 7.9 5.8
Boarding 20.2 15.7 17.2 15.6
Total 100.0 100.0 100.0 100.0
Total (number) 44,200 37,600 160,400 135,400 (a) ‘SAAP/CAP funded accommodation’ refers to what is now known as ‘specialist homelessness accommodation’. Notes 1. Number excluded due to errors and omissions (weighted): 27,200 before support (including ‘Don’t know’), 52,562 after support (including
‘Don’t know’ and ‘Client left without providing any information’) in 2008–09; 28,067 before support (including ‘Don’t know’), 53,039 after support (including ‘Don’t know’ and ‘Client left without providing any information’) in 2009–10.
2. Caution should be used when comparing data across years because of changes in policy and service delivery arrangements. 3. Figures have been weighted to adjust for agency non-participation and client non-consent. Source: Client Collection.

26 Government-funded specialist homelessness services 2009–10: Australia appendix
Table A34: Closed support periods: type of house/dwelling occupied immediately after a support period by length of support, by reporting period, 2008–09 to 2009–10 (per cent)
After support 1 week or less
>1 week– 1 month
>1–3 months
>3–6 months
>6 months
Total
Per cent Number
2008–09
Improvised dwelling/sleeping rough 12.1 5.5 3.3 1.9 1.7 7.1 9,400
House/dwelling 84.0 89.3 93.2 94.5 95.3 89.0 117,700
Institutional setting 3.9 5.2 3.6 3.6 2.9 3.9 5,200
Total 100.0 100.0 100.0 100.0 100.0 100.0 . .
Total (number) 55,900 20,300 30,800 12,700 12,300 . . 132,200
2009–10
Improvised dwelling/sleeping rough 11.6 5.1 2.8 2.5 2.6 7.1 10,100
House/dwelling 85.2 89.8 93.8 94.1 94.4 89.4 127,700
Institutional setting 3.2 5.1 3.4 3.4 2.9 3.5 5,000
Total 100.0 100.0 100.0 100.0 100.0 100.0 . .
Total (number) 64,700 19,400 31,700 13,800 13,200 . . 142,800
Notes 1. Number excluded due to errors and omissions (weighted): 45,067 (including ‘Don’t know’ and ‘Client left without providing any information’)
in 2008–09; 45,610 (including ‘Don’t know’ and ‘Client left without providing any information’) in 2009–10. 2. Caution should be used when comparing data across years because of changes in policy and service delivery arrangements. 3. Figures have been weighted to adjust for agency non-participation and client non-consent.
Source: Client Collection.
Table A35: Closed support periods: type of tenure immediately after a support period by length of support, by reporting period, 2008–09 to 2009–10 (per cent)
After support
1 week
or less >1 week– 1 month
>1–3 months
>3–6 months
>6 months
Total
Per cent Number
2008–09
SAAP/CAP funded accommodation(a) 17.5 15.9 13.5 11.7 8.6 14.9 18,600
No tenure 16.7 9.7 6.1 4.7 4.0 10.8 13,400
Tenure 65.8 74.3 80.4 83.6 87.4 74.3 92,700
Total 100.0 100.0 100.0 100.0 100.0 100.0 . .
Total (number) 52,300 19,100 29,300 12,200 11,800 . . 124,700
2009–10
SAAP/CAP funded accommodation(a) 16.4 15.1 12.8 10.3 8.2 14.0 19,000
No tenure 15.8 9.8 5.8 5.3 5.2 10.7 14,500
Tenure 67.8 75.1 81.4 84.5 86.6 75.2 101,800
Total 100.0 100.0 100.0 100.0 100.0 100.0 . .
Total (number) 60,900 18,200 30,200 13,300 12,700 . . 135,400
(a) ‘SAAP/CAP funded accommodation’ refers to what is now known as ‘specialist homelessness accommodation’.
Notes 1. Number excluded due to errors and omissions (weighted): 52,562 (including ‘Don’t know’ and ‘Client left without providing any information’)
in 2008–09; 53,039 (including ‘Don’t know’ and ‘Client left without providing any information’) in 2009–10. 2. Caution should be used when comparing data across years because of changes in policy and service delivery arrangements. 3. Figures have been weighted to adjust for agency non-participation and client non-consent.
Source: Client Collection.

Government-funded specialist homelessness services 2009–10: Australia appendix 27
Table A36: Closed support periods: living situation immediately before and after a support period, by reporting period, 2008–09 to 2009–10 (per cent)
Living situation Before After
2008–09
With both parents 2.5 2.0
With one parent and parent’s spouse/partner 1.8 1.2
With one parent 4.1 3.4
With foster family 0.3 0.2
With relatives/friends temporary 15.0 10.5
With relatives/friends long-term 3.6 4.6
With spouse/partner 8.6 6.6
With spouse/partner and child(ren) 11.6 9.0
Alone 24.5 27.9
Alone with child(ren) 12.2 18.2
With other unrelated persons 14.8 15.4
Other 1.0 1.1
Total 100.0 100.0
Total (number) 159,700 133,700
2009–10
With both parents 2.3 1.8
With one parent and parent’s spouse/partner 1.6 1.1
With one parent 3.8 3.3
With foster family 0.3 0.2
With relatives/friends temporary 14.5 10.3
With relatives/friends long-term 3.9 5.1
With spouse/partner 8.2 6.5
With spouse/partner and child(ren) 11.3 8.8
Alone 25.6 28.9
Alone with child(ren) 12.5 18.1
With other unrelated persons 15.0 14.7
Other 1.1 1.2
Total 100.0 100.0
Total (number) 168,800 142,800
Notes 1. Number excluded due to errors and omissions (weighted): 17,543 before support (including ‘Don’t know’), 43,529 after support (including
‘Don’t know’ and ‘Client left without providing any information’) in 2008–09; 19,635 before support (including ‘Don’t know’), 45,638 after support (including ‘Don’t know’ and ‘Client left without providing any information’) in 2009–10.
2. Caution should be used when comparing data across years because of changes in policy and service delivery arrangements. 3. Figures have been weighted to adjust for agency non-participation and client non-consent.
Source: Client Collection.

28 Government-funded specialist homelessness services 2009–10: Australia appendix
Table A37: Closed support periods: student status immediately before and after a support period, by age, 2008–09 to 2009–10 (per cent)
5–17 years 18+ years Total
Student status Before After Before After Before After
2008–09
Not a student 53.7 52.5 95.4 95.0 90.7 90.4
Primary/secondary student 38.1 37.7 1.0 0.9 5.2 4.8
Post-secondary student/employment training 8.2 9.8 3.6 4.2 4.1 4.8
Total 100.0 100.0 100.0 100.0 100.0 100.0
Total (number) 17,800 15,400 139,600 128,400 157,400 143,800
2009–10
Not a student 51.3 49.6 95.2 94.6 90.7 90.3
Primary/secondary student 39.8 39.1 0.9 0.8 4.9 4.5
Post-secondary student/employment training 8.9 11.2 3.9 4.6 4.4 5.2
Total 100.0 100.0 100.0 100.0 100.0 100.0
Total (number) 17,100 14,700 150,600 139,900 167,700 154,600
Notes 1. Number excluded due to errors and omissions (weighted): 18,451 before support (including ‘Don’t know’), 32,100 after support (including
‘Don’t know’ and ‘Client left without providing any information’) in 2008–09; 19,336 before support (including ‘Don’t know’), 32,520 after support (including ‘Don’t know’ and ‘Client left without providing any information’) in 2009–10.
2. Table excludes closed support periods for clients aged 4 years and under. 3. Caution should be used when comparing data across years because of changes in policy and service delivery arrangements. 4. Figures have been weighted to adjust for agency non-participation and client non-consent.
Source: Client Collection.

Government-funded specialist homelessness services 2009–10: Australia appendix 29
Table A38: Closed support periods: existence of a case management plan by the end of a support period, by reporting period, 2006–07 to 2009–10 (per cent)
Case management plan 2006–07 2007–08 2008–09 2009–10
Yes 55.1 59.5 60.7 60.6
No, client did not agree to one 10.2 7.6 7.0 6.9
No, support period too short 33.2 31.9 28.4 28.1
No, other reason 1.6 0.9 4.0 4.5
Total 100.0 100.0 100.0 100.0
Total (number) 160,600 169,900 166,100 177,100
Notes 4. Number excluded due to errors and omissions (weighted): 17,313 in 2006–07; 17,085 in 2007–08; 10,690 in 2008–09; 11,310 in 2009–10. 5. Caution should be used when comparing data across years because of changes in policy and service delivery arrangements. 6. Figures have been weighted to adjust for agency non-participation.
Source: Client Collection.
Table A39: Closed support periods where a case management plan was in place by the end of a support period: achievement of goals, by reporting period, 2006–07 to 2009–10 (per cent)
Achievement of goals 2006–07 2007–08 2008–09 2009–10
All goals achieved 38.3 39.3 44.0 45.5
Most or some goals achieved 54.6 54.1 50.4 49.2
No goals achieved 7.1 6.6 5.5 5.3
Total 100.0 100.0 100.0 100.0
Total (number) 87,500 99,800 100,000 106,900
Notes 1. Number excluded due to errors and omissions (weighted): 949 in 2006–07; 1,309 in 2007–08; 726 in 2008–09; 522 in 2009–10. 2. Caution should be used when comparing data across years because of changes in policy and service delivery arrangements. 3. Figures have been weighted to adjust for agency non-participation.
Source: Client Collection.

30 Government-funded specialist homelessness services 2009–10: Australia appendix
Appendix 2 The SAAP National Data Collection The 2009–10 data from government-funded specialist homelessness agencies was collected in the SAAP National Data Collection (SAAP NDC). In 2009–10, the SAAP NDC consisted of three distinct components, each of which can be thought of as a separate collection—the Client Collection; the Administrative Data Collection; and the Demand for Accommodation Collection (see Box A2.1). This report mainly presents analysis of the Client Collection. Some analysis of funding using the Administrative Data Collection is also included to provide context. A further report will contain data from the Demand for Accommodation Collection (AIHW 2011j).
Box A2.1: The SAAP National Data Collection
The SAAP NDC consists of distinct components, each of which can be thought of as a separate collection. In 2009–10, three collections were run: • The Client Collection—collects information about clients and their accompanying
children. Data are recorded by service providers (agencies) during, or immediately following, contact with clients and are then returned after support has ended or, for ongoing clients, at the end of the reporting period (30 June). Data collected include information on: demographics, such as age, sex and country of birth for clients and accompanying children; the types of support required by, and provided to, each client and accompanying child; and the client’s situation before and after receiving support. Some data items require consent from the client to collect. Data are collected in relation to support periods. A support period is a discrete period of time over which a person receives ongoing support from a government-funded specialist homelessness agency. A person may have one or more periods of support within a year. To calculate the number of people associated with these periods of support, a statistical linkage key (SLK) is created for each person receiving support where consent was provided to record this information. In this way, people with multiple periods of support can be ascertained and estimates of the number of people can be made.
• The Administrative Data Collection—consists of general information about the agencies providing accommodation and support to people who are homeless or at risk of homelessness. Details about these agencies are submitted by the departments that administer the government response to homelessness in each state and territory. The information provided for the Administrative Data Collection includes the client target group of each agency, whether the agency is required to participate in data collection, and details of funding.
• The Demand for Accommodation Collection—measures the level of turn-away from specialist homelessness accommodation by collecting information about the number of met and unmet requests for accommodation. It is conducted annually over 2 separate weeks.
See Appendix 5 for more information.

Government-funded specialist homelessness services 2009–10: Australia appendix 31
A new collection reflecting the changed arrangements under the NAHA and the national partnership agreements is planned to replace the SAAP NDC on 1 July 2011. Until the implementation of this new collection, for continuity in reporting data from the SAAP NDC the terminology and labels of data produced under the SAAP V agreement have been retained. For example, ‘SAAP/CAP accommodation’ continues to be reported as a type of support but now refers to what is known as ‘specialist homelessness accommodation’.
Funding to agencies In 2009–10, 1,559 specialist homelessness agencies received government funding for all or part of the year (Table A1). Not all funded agencies were required to participate in data collection. In 2009–10, 1,434 agencies were required to participate (Table A2).
Funding to agencies in 2009–10 was provided jointly by the Australian Government and the state and territory governments under the NAHA and national partnership agreements. The states and territories were also able to provide additional funding over and above the amounts determined in these agreements.
Readers should note that not all jurisdictions have included NPAH and other partnership agreement funding or agencies for the 2009–10 year.
Agency participation and client consent The participation of agencies in the SAAP NDC has generally been high, as have the rates of consent and valid consent obtained from clients (Table A2). This is important as, to ensure that the data collected accurately reflect the work done, it is essential that there is both a high level of participation in the collection among funded agencies and a high level of consent provided by clients. A weighting system has been developed to adjust for incomplete responses, both in terms of agencies that did not participate and clients who did not consent (see Appendix 3 for further detail).
Readers should note that the number and profile of agencies change each year as a result of agency closures, the amalgamation or splitting of agencies, the opening of new agencies, or the reclassification of service delivery models or target groups. Inclusion or exclusion from the collection and changes in agency status and type are determined by the state and territory governments responsible for administering the government response to homelessness.

32 Government-funded specialist homelessness services 2009–10: Australia appendix
Accompanying children Consent in the case of accompanying children is more complicated than that for clients. Young children are not able to understand the purpose of the collection and cannot, therefore, give informed consent. In addition, the question concerning the age at which young people are able to give consent has no simple, universally accepted answer.
For the purposes of the SAAP NDC, consent can be obtained from either the parent/guardian or the child, depending on family circumstances and whether or not the child is judged able to comprehend what is being asked of her/him. In cases where there is a strong objection from the parent/guardian about the data collection, the wishes of the parent/guardian take precedence.
Consent is obtained at the client support period level, not the accompanying child support period level, and a client may choose to provide consent for their details to be recorded but not wish to record those of their accompanying child.

Government-funded specialist homelessness services 2009–10: Australia appendix 33
Appendix 3 Weighting In order to provide accurate data about all clients presenting at specialist homelessness agencies, the data collected in the Client Collection must be adjusted for agency non-participation and, if necessary, client non-consent.
The simplest way of adjusting for non-participation and non-consent is to scale up estimates at the total level. This assumes that, on average, the demographic characteristics and circumstances of people are the same regardless of whether data about them were reported to the AIHW. There may, however, be some differences between the profiles of support periods with and without consent. Consequently, distributions based only on support periods with consent may differ from those that would have been obtained had consent been provided in all cases. The AIHW has therefore developed an adjustment scheme that allows for differences between support periods with consent and those without. The scheme also adjusts estimates to allow for agency non-participation (if this occurs), for clients who give valid consent for some support periods but not for others (referred to as ‘mixed consent’), and for clients who do not give consent in any of their periods of support. The scheme is outlined below.
There is no strictly objective method that can be applied to the data from the Client Collection to adjust estimates for incomplete response. Karmel (1999:23, 26) describes the statistical assumptions underlying the adjustment scheme developed by the AIHW. The scheme has the following features:
• the collection is divided into specified groups, or strata. Within the strata, it is assumed that support periods with valid consent (that is, with consent and a valid statistical linkage key) represent those without valid consent. This means that the characteristics of support periods within each stratum are assumed not to depend on whether valid consent was obtained. The strata are defined in terms of characteristics available for all support periods in participating agencies
• if there are any non-participating agencies within a state or territory, it is assumed that, on average, participating and non-participating agencies provide a similar volume and profile of support
• some clients have mixed consent. Assumptions about the extent and nature of mixed consent are made to estimate the number of clients and the average number of support periods per client. Adjustments made for clients with mixed consent within subgroups are derived using simulation techniques and by-product data from the Client Collection
• for support period level estimates, two weights for adjusting estimates are derived: – a non-participation weight: a range of information is available for all support periods
in participating agencies, and estimates using these data are adjusted only for agency non-participation
– a full non-participation non-consent weight: for estimates using data that require consent, weights that adjust for both agency non-participation and client non-consent are used.
It is possible for these two weighting schemes to give slightly different estimates for the same item. Because estimates derived using the non-participation weights are based on a

34 Government-funded specialist homelessness services 2009–10: Australia appendix
much larger sample than those using the full non-participation non-consent weights, the former (where available) are preferred because of their greater accuracy
• for client and accompanying child level estimates, only one weight is derived because valid consent is required to derive these estimates. A weight is derived for each record with at least one period with valid consent. Note that consent is not obtained separately for accompanying children and is the same as the consent recorded for the parent/guardian. In estimates of numbers of clients and accompanying children, inaccuracies caused by identical statistical linkage keys for a small number and changing linkage key information for the same client or accompanying child are not considered in the adjustment scheme.
In this report and its supplements, all estimates of clients, support periods, accompanying children and accompanying child support periods obtained using data from the Client Collection have been adjusted for agency non-participation and, where applicable, client non-consent using the scheme just outlined.

Government-funded specialist homelessness services 2009–10: Australia appendix 35
Appendix 4 Interpretation of tables When interpreting the tables in this report, the following should be noted:
• the main unit used in the table (for example, percentages, numbers or dollars) is shown at the end of the table title. If no unit is given there, the units used are given in the body of the table.
• in tables by state and territory, the number of clients in each state and territory is calculated based on their first visit in that state or territory. The support periods for a particular client may have been at agencies in more than one state or territory. Consequently, the number of clients by state and territory does not sum to the national figure. The same is true for accompanying children
• records with missing data (due to either errors or omissions) are not included in the percentages or numbers in a table. Care should be taken when interpreting and using figures in a table if the numbers of errors and omissions are relatively high (as a rule of thumb, more than one-third the size of the number of records included in the table)
• components may not add to totals because of rounding. For rounding conventions, refer to Appendix 5
• in a number of tables clients may have more than one response so the percentages will not add to 100. A note to the table will indicate whether this is the case.
In general, numbered notes at the bottom of the tables indicate:
• the number of records excluded from the table because of errors and omissions in the data
• any additional information needed to interpret the table.

36 Government-funded specialist homelessness services 2009–10: Australia appendix
Appendix 5 Counting rules and glossary Accurate interpretation of the analyses presented in this report requires an understanding of the concepts and terms used in the SAAP NDC.
In this report, the following rules and definitions have been used. For detailed descriptions of categories and other terms used in this report, please refer to the collectors manual (AIHW 2005).
Accommodated client
A client is considered to be accommodated during a support period if the support type of ‘SAAP/CAP accommodation’ (specialist homelessness accommodation) was provided and/or a date of accommodation was provided.
Accommodation period
The period during which a client was in specialist homelessness accommodation (also referred to as a period of accommodation). A client may have no accommodation periods or one or more accommodation periods within a support period.
The dates on which each accommodation period began and ended during the support period are collected for clients, but not for accompanying children. It can, however, be reasonably assumed that an accompanying child will have the same accommodation period start and end dates as their parent(s) or guardian(s) in the majority of cases.
Accompanying child
A person aged under 18 years who:
• has a parent or guardian who is a client; and
• accompanies that client to a an agency any time during that client’s support period; and/or
• receives assistance directly as a consequence of a parent or guardian’s support period.
Tables detailing the characteristics of individual accompanying children generally present data collected during the child’s first accompanying child support period in the reporting period.
Accompanying child requiring assistance
An accompanying child is said to require assistance if any information concerning the need for or provision of support (including referrals) has been reported for the child (refer to question 23 of the client form, Appendix 7).

Government-funded specialist homelessness services 2009–10: Australia appendix 37
Accompanying child support period
Each support period in which the child either accompanies a parent or guardian to an agency or receives assistance as a result of a parent or guardian’s support period.
Within an accompanying child support period, the child may receive one-off assistance and/or support over a period of time. Because the child may not be supported for the entire duration of a parent’s or guardian’s support period, it is not possible to assess the exact length of support for an accompanying child. However, it can be reasonably assumed that an accompanying child will have the same support period start and end dates as their parent(s) or guardian(s) in the majority of cases.
The number of accompanying child support periods is calculated by summing the number of accompanying children reported for each support period.
Age The age of the client or accompanying child is calculated from their date of birth and is either their age at the beginning of the support period or their age on the first day of the reporting period (1 July), whichever is the later.
Agency An organisation or establishment that receives a specified amount of NAHA/national partnership funds to provide specialist homelessness services to people experiencing or at risk of homelessness. Agencies may also receive funding from other sources.
Agency inclusion is determined by the state and territory departments responsible for administering the government response to homelessness. Not all funded agencies are required to participate in data collection (see participating agency).
Alpha code A predetermined combination of letters from a client’s or accompanying child’s name, together with a letter designating their sex. See also valid alpha code and statistical linkage key.
At imminent risk of homelessness
Includes people who are at risk of losing their housing because of factors that do not pose a threat to their safety; for example, interpersonal conflicts that do not involve violence. A person who requires the support of an agency worker to maintain their current housing situation and live independently in the community may also be considered to be at risk of becoming homeless.

38 Government-funded specialist homelessness services 2009–10: Australia appendix
Client A person who is homeless or at imminent risk of homelessness who:
• is accommodated by an agency; or
• enters into an ongoing support relationship with an agency; or
• receives support or assistance from an agency which entails generally 1 hour or more of a worker’s time, either with that client directly or on behalf of that client, on a given day.
This includes people who are aged 18 years or older and people of any age not accompanied by a parent or guardian.
Client records from operational agencies are included in the analyses presented in this report if:
• the client’s support period ended in the reporting period; or
• the client’s support period started on or before the end of the reporting period and either was ongoing at the end of the reporting period (30 June) or the end date of the support period was unknown and the record was entered by the AIHW before the data entry close-off date for the reporting period; and
• a valid statistical linkage key was provided.
Tables detailing the characteristics of individual clients generally present data collected during the client’s first support period in the reporting period.
Closed accompanying child support periods
An accompanying child support period associated with a closed support period.
Closed support period
A support period that had finished on or before the end of the reporting period—30 June.

Government-funded specialist homelessness services 2009–10: Australia appendix 39
Client group For the purposes of this report clients are grouped into the following categories based on the family unit the person was supported with:
• Male alone, under 25—males aged under 25 years who presented ‘alone or with unrelated person(s)’
• Male alone, 25+—males aged 25 years and over who presented ‘alone or with unrelated person(s)’
• Female alone, under 25—females aged under 25 years who presented ‘alone or with unrelated person(s)’
• Female alone, 25+—females aged 25 years and over who presented ‘alone or with unrelated person(s)’
• Couple no children—refers to a married or defacto couple presenting together without children or other family members
• Couple with children—refers to a married or defacto couple presenting together with at least one child who either accompanies them or is provided with assistance as a consequence of their parent or guardian’s support
• Male with children—a single male presenting with at least one child who either accompanies them or is provided with assistance as a consequence of their parent or guardian’s support
• Female with children—a single female presenting with at least one child who either accompanies them or is provided with assistance as a consequence of their parent or guardian’s support
• Other—used to record all other groups of related individuals. For example, siblings and multigenerational families.

40 Government-funded specialist homelessness services 2009–10: Australia appendix
Homeless person A person who does not have access to safe, secure and adequate housing. A person is considered not to have access to safe, secure and adequate housing if the only housing to which they have access:
• damages, or is likely to damage, their health; or
• threatens their safety; or
• marginalises them through failing to provide access to:
– adequate personal amenities, or
– the economic and social supports that a home normally affords; or
• places them in circumstances which threaten or adversely affect the adequacy, safety, security and affordability of that housing; or
• has no security of tenure; that is, they have no legal right to continued occupation of their home.
A person is also considered homeless if he or she is living in accommodation provided by an agency or some other form of emergency accommodation.
House/dwelling The Client Collection specifies 10 categories of house or dwelling type for clients:
• improvised dwelling/car/tent/squat
• street/park/in the open
• house/flat
• caravan
• boarding/rooming house
• hostel/hotel/motel
• hospital
• psychiatric institution
• prison/youth training centre
• other institutional setting.

Government-funded specialist homelessness services 2009–10: Australia appendix 41
Income source The Client Collection specifies 22 distinct categories for the main income source of clients. In this report, the categories are combined into three groups:
• no income—including no income and no income, registered/awaiting benefit
• government payments—including Newstart; Youth Allowance; Community Development Employment Program (CDEP); ABSTUDY; Austudy; Disability Support Pension; Age Pension; Parenting Payment; Department of Veterans’ Affairs (DVA) payment (support or pension); and any other government allowance or benefit
• other income—including Workcover or compensation; maintenance or child support; wages or salary or income from a client’s own business; spouse or partner’s income; and any other income source not specified above.
Informed consent For the purposes of the SAAP NDC, informed consent is a statement by the client that he or she agrees to have personal information recorded and sent to the AIHW for analysis. The protocols of the collection state that the client must be given appropriate information about why the information is being recorded and what the information will be used for.
Length of accommodation
Accommodation length is obtained by summing the individual accommodation period lengths reported for a support period. An individual accommodation length is obtained by subtracting the accommodation start date from the accommodation finish date for those periods with valid dates. If a client starts and ends accommodation on the same date, the length of accommodation is recorded as zero.
A support period with accommodation may begin before the start of the financial year. For this report, length of accommodation is the total length of accommodation within a support period, not the length of accommodation within the financial year.
Length of support The length of support is calculated by subtracting the support period start date from the support period finish date.
A support period may begin before the start of the financial year. For this report, length of support refers to the length of the entire support period, not the length of support within the financial year.
The categories used in this report are: • 1 week or less—less than 1 day to 7 days • >1 week–1 month—8 days to 28 days • >1 month–3 months—29 days to 91 days • >3 months–6 months—92 days to 182 days • >6 months—183 days and onwards.

42 Government-funded specialist homelessness services 2009–10: Australia appendix
Living situation The Client Collection specifies 11 distinct categories for the living situation of clients and allows agencies to record other types of living situation not listed on the data form:
• with both parents • with one parent and parent’s spouse/partner • with one parent • with foster family • with relatives/friends temporary • with relatives/friends long-term • with spouse/partner • with spouse/partner and child(ren) • alone with child(ren) • alone • with other unrelated persons • other.
Main reason for seeking assistance
This report presents individual main reasons and includes a subtotal for five distinct groupings. The subtotals are:
• Interpersonal relationships—time out from family/other situation; relationship/family breakdown; interpersonal conflict; sexual abuse; domestic/family violence; physical/emotional abuse
• Financial—gambling; budgeting problems; rent too high; other financial difficulty
• Accommodation—overcrowding issues; eviction/asked to leave; emergency accommodation ended; previous accommodation ended
• Health—mental health issues; problematic drug/alcohol/substance use; psychiatric illness; other health issues
• Other reasons—gay/lesbian/transgender issues; recently left institution; recent arrival to area with no means of support; itinerant; other.
Mean For non-funding support periods or client-level items, the mean value of an item is the weighted arithmetic average of the item using relevant records with valid values.
For funding items, the mean is the total funding as reported, divided by the relevant number of units.

Government-funded specialist homelessness services 2009–10: Australia appendix 43
Median The median is the fiftieth percentile of a distribution. This is the value of an item such that half (using weights) of relevant records with valid values are below this value and half are above it.
Missing values Records that are not available for analysis are shown in table notes. The number of such records for each table is calculated in the following order of precedence:
• records not available because of errors • records not available because of omissions.
In tables involving subpopulations, it is impossible to determine whether a given record should be included or excluded if data are missing for the variable(s) defining the subpopulation in the analysis. Such records are generally not included in the missing count for these tables.
Not employed Either ‘unemployed (looking for work)’ or ‘not in the labour force’.
Ongoing support period
A support period is considered ongoing at the end of the reporting period if each of the following conditions is met:
• no support end-date is provided • no after-support information is provided • the corresponding client form was received in the month
following the end of the reporting period.
Ongoing support periods are generally not included in tables relating to duration of support or accommodation.
Ongoing support relationship
An ongoing support relationship exists between an agency and a person if some assistance has been provided to that person, and it is expected that future contact will occur between the person and the agency for the purpose of providing additional assistance. Future contact can be assumed if:
• a definite appointment has been made with the person to work through particular problems/issues; or
• an agreement has been reached with the person to work through particular problems/issues even if a specific appointment has not been made; or
• the agency expects the client to return for more assistance within a month.
However, an invitation to return to the agency in the future if the need arises does not constitute an ongoing support relationship. It is seen to be an offer to enter into a new support period or to provide assistance at some future time.

44 Government-funded specialist homelessness services 2009–10: Australia appendix
Participating agency/ participation rate
The participation status of an agency is determined by their status in the Administrative Data Collection as well as by their participation in the SAAP NDC during the reference period.
The Administrative Data Collection contains information on all funded agencies. These agencies fall into one of two categories—non-participating agencies and participating agencies.
Non-participating agencies are funded, but are not required to participate in data collection. They are excluded from the calculation of the participation rate, but are included in tables relating to agency funding.
Participating agencies are those that are required to return data for the reference period. With some exceptions, these form the basis for the calculation of the participation rate. Participating agencies are not considered ‘in scope’ for the reference period if they were not able to participate in the collection for that year. For example, the Administrative Data Collection indicated that they were closed for the entire reference period and they did not return any data.
Per 10,000 population
Calculated by dividing the population in the designated group by the estimated resident Australian population in that group and multiplying by 10,000.
Percentages Percentages presented in the report are based on valid values only; that is, records without values for the relevant data item are excluded from the denominator before percentages are calculated.
Primary target group
Refers to the primary target group of the agency; that is, the primary characteristics of persons to whom a service is targeted. There are six classifications used by the SAAP NDC. These are:
• young people • single men only • single women only • families • women and children escaping domestic violence • cross-target/multiple/general.
Referral For the purposes of the SAAP NDC, a referral involves a formal process: not simply the provision of information. A (formal) referral occurs when an agency contacts another organisation and that organisation accepts the person concerned for an appointment or interview. A referral has not been provided if the person is not accepted for an appointment or interview.

Government-funded specialist homelessness services 2009–10: Australia appendix 45
Rounding Weighted numbers of support periods and clients are generally
rounded to the nearest 100.
Percentages in tables are rounded to 1 decimal place. Percentages in text are rounded to the nearest whole number.
Figures may not add or match between tables and text due to rounding.
Statistical linkage key (SLK)
A derived variable that allows demographic data about the same client to be combined across support periods without the name of the client being recorded.
See also valid statistical linkage key.
Support/service Assistance, other than supported accommodation, provided to a client or accompanying child as part of a support period.
See also type of support/service.
Support period Commences when a client begins to receive support and/or supported accommodation from an agency. The support period is considered to finish when:
• the client ends the relationship with the agency; or • the agency ends the relationship with the client.
If it is not clear whether the agency or the client has ended the relationship, the support period is assumed to have ended if no assistance has been provided to the client for a period of 1 month. In such a case, the date the support period ended is the last contact with the client.
Support periods from operational agencies are included in the analyses presented in this report if:
• the client’s support period ended in the reporting period; or • the client’s support period started on or before the end of the
reporting period and either was ongoing at the end of the reporting period (30 June) or the end date of the support period was unknown and the record was entered by the AIHW before the data entry close-off date for the reporting period.
Support period with accommodation
A support period in which a support type of ‘SAAP/CAP accommodation’ was provided and/or a date of ‘SAAP/CAP accommodation’ was provided.
Tenure Tenure describes a person’s legal right to occupy a dwelling; that is, whether the dwelling they occupied immediately before and after support was owned, being purchased or rented. If a dwelling was being rented, information is also collected on whether that renting is in the private rental market, public housing or community housing. Clients may also be boarding or living rent-free or have no tenure.

46 Government-funded specialist homelessness services 2009–10: Australia appendix
Type of support The Client Collection specifies 34 distinct types of support for clients and 17 distinct types of support for accompanying children and allows agencies to record other types not listed on the data form.
For clients, this report presents individual service or support types and includes a subtotal for six distinct groupings. The major classifications for clients are:
• housing or accommodation—‘SAAP/CAP accommodation’; assistance to obtain or maintain short-term accommodation; assistance to obtain or maintain medium-term accommodation; and assistance to obtain or maintain independent housing
• financial or employment—assistance to obtain or maintain a government allowance; employment and training assistance; financial assistance or material aid; and financial counselling and support
• personal support—incest or sexual assault support; domestic or family violence support; family or relationship support; emotional support; and assistance with problem gambling
• general support or advocacy—living skills or personal development; assistance with legal issues or court support; advice or information; retrieval, storage or removal of personal belongings; and advocacy or liaison on behalf of client
• specialist services—psychological services; specialist counselling services; psychiatric services; pregnancy support; family planning support; drug or alcohol support or intervention; physical disability services; intellectual disability services; culturally specific services; interpreter services; assistance with immigration issues; and health or medical services
• basic support and other not elsewhere specified (n.e.s.)—meals; laundry or shower facilities; recreation; transport; and other support.
For accompanying children, this report presents individual service or support types and includes a subtotal for six distinct groupings. The major classifications for accompanying children are:
• accommodation—‘SAAP/CAP accommodation’ • school liaison or child care—school liaison; and child care • personal support—help with behavioural problems; sexual or
physical abuse support; skills education; and structured play or skill development
• general support or advocacy—access arrangements; advice or information; and advocacy
• specialist services—specialist counselling; culturally specific services; and health or medical services

Government-funded specialist homelessness services 2009–10: Australia appendix 47
• basic support and other not elsewhere specified (n.e.s.)—meals; showers or hygiene; recreation; transport; and other support.
Note that support for accompanying children is recorded on only one parent’s/guardian’s form when a couple presents to an agency.
For further information, refer to Appendix 7 for the form and to the collectors manual (AIHW 2005) for the definitions.
Unaccompanied client
A client who presented ‘alone or with an unrelated person(s)’.
Unmet need An unmet need occurs when an agency worker assesses that a client needs a support service during their support period, and that service is not provided or referred.
Valid alpha code An alpha code that is given with informed consent, containing only letters from the alphabet or the numeral ‘2’ (to indicate a short name) and ends in either M or F to indicate the sex.
Valid consent Refers to a valid statistical linkage key.
Valid date of birth For the purposes of the SAAP NDC, a valid date of birth is one that is provided with informed consent; and has the day and month of birth completed and not estimated; and the year of birth completed either estimated or not estimated.
Valid statistical linkage key (SLK)
For the purposes of the SAAP NDC, a valid SLK comprises a valid alpha code and valid date of birth.

48 Government-funded specialist homelessness services 2009–10: Australia appendix
Appendix 6 Abbreviations and symbols
Abbreviations ABS Australian Bureau of Statistics
ACT Australian Capital Territory
AIHW Australian Institute of Health and Welfare
CAP Crisis Accommodation Program
NAHA National Affordable Housing Agreement
No. number
NPAH National Partnership Agreement on Homelessness
NSW New South Wales
NT Northern Territory
Qld Queensland
SA South Australia
SAAP Supported Accommodation Assistance Program
SAAP NDC SAAP National Data Collection
SLK statistical linkage key
Tas Tasmania
THM Transitional Housing Management program
VHDC Victorian Homelessness Data Collection
Vic Victoria
WA Western Australia
Symbols in tables . . not applicable
— nil or rounded to zero (including null cells)
n.a. not available
n.e.s. not elsewhere specified

Government-funded specialist homelessness services 2009–10: Australia appendix 49
Appendix 7 Client Collection form

50 Government-funded specialist homelessness services 2009–10: Australia appendix

Government-funded specialist homelessness services 2009–10: Australia appendix 51

52 Government-funded specialist homelessness services 2009–10: Australia appendix

Government-funded specialist homelessness services 2009–10: Australia appendix 53

54 Government-funded specialist homelessness services 2009–10: Australia appendix

Government-funded specialist homelessness services 2009–10: Australia appendix 55

56 Government-funded specialist homelessness services 2009–10: Australia appendix

Government-funded specialist homelessness services 2009–10: Australia appendix 57
List of tables Table A1: Funding to agencies, by reporting period, 2006–07 to 2009–10 .................................. 1
Table A2: Client Collection: agency participation rates and records returned with informed consent and valid consent, by reporting period, 2006–07 to 2009–10 ...... 1
Table A3: Total support for clients and accompanying children, by reporting period, 2006–07 to 2009–10 ............................................................................................................ 2
Table A4: Support periods and clients, by reporting period, 2006–07 to 2009–10 ..................... 2
Table A5: Accompanying child support periods and accompanying children, by reporting period, 2006–07 to 2009–10 ............................................................................. 3
Table A6: Clients: age by sex, 2009–10 ............................................................................................. 4
Table A7: Clients: rate per 10,000 population aged 10 years and over by age and sex and mean and median age of all clients by sex, by reporting period, 2006–07 to 2009–10 ........................................................................................................................... 5
Table A8: Accompanying children: age, by sex, 2009–10 .............................................................. 6
Table A9: Accompanying children: rate per 10,000 population aged 0–17 years by age and mean and median age, by reporting period, 2006–07 to 2009–10 ....................... 6
Table A10: Clients: Aboriginal and Torres Strait Islander status by sex, by reporting period, 2006–07 to 2009–10 .............................................................................................. 7
Table A11: Accompanying children: Aboriginal and Torres Strait Islander status, by reporting period, 2006–07 to 2009–10 ............................................................................. 7
Table A12: Clients: top 5 countries of birth in 2009–10, by reporting period, 2006–07 to 2009–10 ........................................................................................................................... 8
Table A13: Accompanying children: top 5 countries of birth in 2009–10, by reporting period, 2006–07 to 2009–10 .............................................................................................. 8
Table A14: Support periods: client group, by reporting period, 2006–07 to 2009–10 ................. 9
Table A15: Support periods: main reason for seeking assistance, by reporting period, 2006–07 to 2009–10 .......................................................................................................... 10
Table A16: Support periods: main reason for seeking assistance, by client group, 2009–10 ............................................................................................................................. 11
Table A17: Closed support periods: length of support, by reporting period, 2006–07 to 2009–10 ......................................................................................................................... 12
Table A18: Closed support periods: mean and median length of support by client group, by reporting period, 2006–07 to 2009–10......................................................... 12

58 Government-funded specialist homelessness services 2009–10: Australia appendix
Table A19: Closed support periods in which clients were accommodated: total length of accommodation, by reporting period, 2006–07 to 2009–10 .................................. 13
Table A20: Closed support periods in which clients were accommodated: mean and median length of accommodation by client group, by reporting period, 2006–07 to 2009–10 .......................................................................................................... 14
Table A21: Closed support periods: type of support required by clients, by reporting period, 2006–07 to 2009–10 ............................................................................................ 15
Table A22: Closed support periods: type of support required by clients, by client group, 2009–10 ................................................................................................................. 16
Table A23: Type of support required by clients in closed support periods, by provision, 2009–10 ............................................................................................................................. 17
Table A24: Broad types of support required in closed support periods, by provision, 2008–09 ............................................................................................................................. 18
Table A25: Closed accompanying child support periods: type of support required for accompanying children, by reporting period, 2006–07 to 2009–10 .......................... 19
Table A26: Type of support required for accompanying children in closed support periods, by provision, 2009–10 ...................................................................................... 20
Table A27: Broad types of support required for accompanying children in closed support periods, by provision, 2008–09 ....................................................................... 21
Table A28: Closed support periods: main source of income immediately before and after a support period, by reporting period, 2008–09 to 2009–10 ............................. 22
Table A29: Closed support periods: main source of income immediately after a support period by length of support, by reporting period, 2008–09 to 2009–10 ................... 22
Table A30: Closed support periods: employment status in the week before and after a support period, 2008–09 to 2009–10 ............................................................................. 23
Table A31: Closed support periods: employment status in the week after a support period, by length of support, 2008–09 to 2009–10 ...................................................... 23
Table A32: Closed support periods: type of house/dwelling immediately before and after a support period, by reporting period, 2008–09 to 2009–10 ............................. 24
Table A33: Closed support periods: type of tenure immediately before and after a support period, by reporting period, 2008–09 to 2009–10 ......................................... 25
Table A34: Closed support periods: type of house/dwelling occupied immediately after a support period by length of support, by reporting period, 2008–09 to 2009–10 ......................................................................................................................... 26
Table A35: Closed support periods: type of tenure immediately after a support period by length of support, by reporting period, 2008–09 to 2009–10 ............................... 26

Government-funded specialist homelessness services 2009–10: Australia appendix 59
Table A36: Closed support periods: living situation immediately before and after a support period, by reporting period, 2008–09 to 2009–10 ......................................... 27
Table A37: Closed support periods: student status immediately before and after a support period, by age, 2008–09 to 2009–10 ................................................................ 28
Table A38: Closed support periods: existence of a case management plan by the end of a support period, by reporting period, 2006–07 to 2009–10 ................................. 29
Table A39: Closed support periods where a case management plan was in place by the end of a support period: achievement of goals, by reporting period, 2006–07 to 2009–10 .......................................................................................................... 29