government of karnataka 2012.pdf · government of karnataka report on ... sri m.a. basith,...
TRANSCRIPT

No. DES 10 OF 2014
GOVERNMENT OF KARNATAKA
REPORT
ON
MEDICAL CERTIFICATION OF
CAUSE OF DEATH
2012
Office of the Chief Registrar of Births & Deaths
and
Directorate of Economics & Statistics
Bangalore
PREFACE
The Report for the year 2012 is the thirty-second in the series of the
publication presenting statistics on causes of death obtained through the Civil
Registration System under the registration of Births and Deaths Act, 1969.
2. Statistical analysis of causes of death forms an important mortality
data base, which is the backbone of National Health Policy and Planning. The
main aim of this report is to build mortality statistics, which is of vital
importance to know the leading causes of deaths, as they are essential for
prioritizing Public Health Programmes not only for the country as a whole but
also equally important at regional/sub-regional level.
3. This report is based on the data on medically certified deaths received
from Teaching, District, Specialised and General hospitals of the Karnataka
State. Data on medically certified deaths received from 1375 hospitals of the
state has been tabulated in conformity with the ICD-Tenth Revision. The
Statistics on causes of death have been presented, cross tabulating them by age
and sex. The time series data on medically certified deaths by major cause
groups for the previous six years have also been added. Sri M.A. Basith,
Consultant, Planning Department has reviewed the Report and offered
suggestions for improvement, many of which have been incorporated in the
Report.
4. I take this opportunity to express my sincere gratitude to the
authorities of hospitals for furnishing the data, on the basis of which the Report
has become possible. I am thankful to each one of them for their continued co-
operation and shall be the strength in the years to come.
5. The data was processed in the Division dealing with Civil Registration,
National Sample Survey, etc., of the Directorate.
Suggestions for improvement of the publication are most welcome.
Bangalore K. LAKSHMIPATHY
Date : 26.03.2014 Director & Chief Registrar of
Births and Deaths

Description Page No
Preface
Executive Summary I - IV
CHAPTERS
Chapter - I : Introduction 1-2
Chapter - II : Scheme of MCCD - Status of Implementation 3-6
Chapter - III : Distribution of Deaths by Cause 7-45
Chapter - IV : Specific Cause of Mortality in Different Age Groups 46-60
APPENDICES
Appendix - I : Statistical Tables (1 to 7) 61-99
Appendix - II : MCCD Form No:4/4A Medical Certification of Cause of Death - 100-101
(Form No. 4/4A)
Appendix - III : Major Groups and the description of ICD-10 102-103
TABLE OF CONTENTS
-:o0o:-

I
EXECUTIVE SUMMARY ==
Reliable cause specific mortality statistics is required on a regular basis by
Administrators, Policy Planners, Researchers and other Professionals for evidence-
based decision making with regard to resource allocation, monitoring of indicators,
identifying the Priorities for programmes and other related activities in the area of
Public Health. Keeping this in view, the Scheme of Medical Certification of Cause of
Death (MCCD) was introduced in the Country under the provisions of Registration of
Births and Deaths (RBD) Act, 1969. Section 10(2) of the Act empowers the State
government to enforce the provision relating to Medical Certification of Cause of
Death (MCCD) in specified areas taking into consideration the availability of medical
facilities. Section 10(3) of the Act provides for issuing a certificate of the cause of
death by the medical practitioner who has attended on the deceased at the time of
death.
Methodology: The necessary data is collected in the Prescribed forms (Form No.4
for Hospital deaths and Form No.4A for Non-institutional Deaths). Both these forms
have been designed by World Health Organisation (WHO) and are supposed to be
filled-up by the medical professionals attending to the deceased at the time of terminal
illness. Thereafter, these forms are to be sent to the concerned Registrars of Births and
Deaths for onward transmission to the Chief Registrar Office for tabulation as per
National List based on International Classification of Death (ICD). The State
subsequently send it to the Office of the Registrar General, India in the form of
Statistical Table-9 for consolidation at the National level.
Scope of the report: The report on Medical Certification of Cause of Death – 2012 is
based upon 125180 (Males: 79719and Females: 45461) medically certified deaths
(31.78 per cent of total registered deaths) supplied by 1375 Hospitals. As mentioned
above, owing to different levels of efficiency of medical certification across the State,
the number of deaths reported therein may lack the representative feature in the strict
sense, however, it may be sufficient to throw some valuable insight into deaths by
various cause groups and their gravity.
Overall Findings:
During the year 2012, following are eight leading cause groups of deaths
constituting around 88.80 per cent of total deaths:
I. Diseases of Circulatory System (30.57 per cent).
II. Certain Infectious and Parasitic diseases (10.85 per cent).
III. Injury, Poisoning and certain other consequences of External
causes (10.81 per cent).
IV. Certain condition originating in the perinatal period (9.27 per cent)
II
V. Diseases of the Respiratory System (8.03 per cent).
VI. Diseases of the Digestive System (6.57 per cent)
VII. Endocrine, Nutritional and Metabolic Diseases (6.48 per cent).
VIII. Neoplasm (6.22 per cent).
Among the “Diseases of the circulatory system” deaths, “Ischemic Heart
Diseases” (IHD) account for the highest number of deaths (42.36 per cent).
Around every 13th
medically certified death has been reported to be causes by
Ischemic Heart Disease alone.
The major group “Certain Infectious and Parasitic Diseases” which is the
second leading cause of death is mainly constituted by “Respiratory Tuberculosis
and septicemia”. Under this major group, the share of these two diseases are
36.81 per cent and 18.76 percent respectively. The Respiratory Tuberculosis
alone accounts for 4.00 per cent of the total medically certified deaths.
The third leading cause group “Injury, Poisoning and certain other consequences
of External causes” has a major constituent “Poisonings by drugs and Biological
substances and Toxic effects of substances chiefly non-medicinal as to source”
contributing around 31.77 per cent of the total deaths under this cause group and
3.43 per cent of total medically certified deaths.
The fourth leading group “Certain conditions originating in the perinatal
period” accounting for 9.27 per cent of the total medically certified deaths.
“Slow fetal growth, fetal malnutrition and immaturity” accounts for 42.40 per
cent of the deaths under the group and 3.93 percent of total medically certified
deaths.
The major group “Diseases of the Respiratory System” is the fifth leading cause
“Other Lower Respiratory Disorders” accounting for around 33.45 per cent of
the total deaths. The other major cause in this group is “Pneumonia” Causing
24.87 per cent of death, under total medically certified deaths, “Pneumonia”
alone accounts for 2.00 per cent.
The major group comprising “Diseases of Digestive System” is the sixth leading
cause accounting for 6.57per cent of the total medically certified deaths. Among
the deaths due to disorders of digestive system “Diseases of the Liver” alone
accounts for 68.30 per cent of the total deaths in this group.

III
The group of “Endocrine, Nutritional and Metabolic Diseases” is the seventh
leading cause group accounting for 6.48 per cent of the total medically certified
deaths. Under this cause group, “Diabetes Mellitus” group alone accounts for
88.55 per cent of total deaths reported and 5.73 per cent of total medically
certified deaths.
The eighth leading cause group, Neoplasms (cancer) is responsible for 6.22 per
cent of the total medically certified deaths, of which “Malignant Neoplasm of
digestive organs” accounts for 27.25 per cent which is around one-third of
deaths. This is followed by “Malignant Neoplasms of Lymphoid, Haematopoietic
and Related tissue” accounts for one-seventh of deaths (13.50%).
Age-wise: [TABLE-2]
Every tenth reported medically certified deaths has been of the infants (age less
than 1 year).
About 86.65 per cent of infant deaths have been reported to be caused by
„Certain conditions originating in the perinatal period’.
Among the children aged 1-4 years “Certain Infectious and Parasitic Diseases”
have taken the highest toll of 32.46 per cent. In the age group 5-14 years also
“Certain Infectious and Parasitic Diseases” claimed the topmost position with
the share of 29.29 per cent.
In the age-group of 15-24 and 25-34 years, major group. “Injury Poisoning &
certain other consequences of External causes” is the first among the leading
causes contributing around 47.25 per cent and 35.61 per cent respectively. It
implies that these age-group of youth and adolescent are more vulnerable to
injuries and poisoning related deaths.
In the age-group 35-44 years, the first two leading causes “Diseases of
Circulatory System” and “Injury, Poisoning and certain other consequences of
External causes” are having shares of 23.67 and 18.41 per cent respectively.
For all the age-groups of 45 years and above “Diseases of Circulatory System”
is the first leading cause of death. The percentage contribution of this cause
group for 45 years and above, to respective age-group totals have been
increasing with age. The percentage share of this cause group to the total
medically certified deaths for these ages varies from 31.90 per cent to 48.62 per
cent.
The highest number of deaths (25995 i.e., 20.77 per cent of total) as expected
has been reported for the age-group 70 years and above.

IV
Gender-wise:
The contributions of male and female deaths in the total medically certified cases
has been reported to be 63.68 per cent and 36.32 per cent respectively.
There is no significant difference for both males and females as far as eight
leading causes are concerned, except for Neoplasm, Endocrine, Nutritional and
Metabolic diseases and Diseases of Digestive System deaths.
The percentage of female neoplasm deaths to total female medically certified
deaths is 7.12 per cent as compared to the corresponding male figure of 5.70 per
cent. On the contrary, the percentage of female digestive system deaths to total
female medically certified deaths is just 3.35 per cent as compared to the
corresponding male figure of 8.40 per cent.
CHAPTER CHAPTER CHAPTER CHAPTER ---- IIII
INTRODUCTIONINTRODUCTIONINTRODUCTIONINTRODUCTION

1
CHAPTER - I
INTRODUCTION :
The age, sex and cause specific mortality rates are important indicators for
evidence based monitoring of health trends in the population. The statistics on causes
of death is essential for planners, administrators and medical professionals in
undertaking appropriate curative and preventive measures for various health problems.
It may also play an important role in furtherance of medical research and may
contribute immensely in improving the methods of diagnosis and analysis. Under the
system of Registration of Births and Deaths, the scheme of Medical Certification of
Cause of Death forms an integral part of the Vital Statistics System which aims at
providing a reliable database for generating cause specific mortality statistics on a
regular basis.
1.2 Medical Research is currently facing stiff challenges from the spread of a
variety of ailments like Cancer, AIDS, Heart Diseases, Juvenile diabetes, non-
communicable diseases, Swine flu and Chickungunya etc. For tackling these issues,
good documentation of information on the causes of death is indispensable.
Recognising this fact and in order to draw the profile of different natural and manmade
causes of death, the international community of Medical Professionals, under the aegis
of World Health Organisation have codified most of the disease labeling them
“International Classification of Diseases (ICD)”.
1.3 This ICD is customised to the Indian conditions under the scheme of “Medical
Certification of Cause of Death (MCCD)”. Important demographic indicators like
Infant Mortality Rate, Maternal Mortality Rate and Child Mortality Rate are derived
using the information on MCCD.
1.4 This report is based on the 10th
revision of ICD. The statistics presented in this
report, give information on cause specific mortality cross classified by sex and age-
groups. The prescribed Form No. 4 (Annexure-II) has to be carefully filled by the
physician who examines / attends / treats the deceased during the period of his / her
last illness. This form, which clearly spells out the various causes of death is the basis
of this survey results.
1.5 Meaning & Scope of Cause of Death: The term ‘cause of death’ has been
defined as to go back to the root / underlying cause. It is “the morbid condition to
which can be traced the sequences of events ultimately resulting in death”. The form
prescribed for certification has two parts, Part-I for recording the diseases suffered by
the deceased in a specific sequence to facilitate segregation of the underlying cause
from the immediate cause and Part-II for other significant morbid conditions, even if
they were not responsible for the death.

2
1.6 The scheme of Medical Certification of Cause of Death has got the statutory
backing under sections 10(2) and 10(3), 17(1)(b) and 23(3) of the Registration of
Births and Deaths Act, 1969.
The provisions relating to MCCD in Registration of Births & Deaths Act, 1969
are as follows:
Section 10(2) : In any area, the State Government having regard to the facilities
available therein in this behalf may require that a certificate as to the cause of death
shall be obtained by Registrar from such person and in such form as may be
prescribed.
Section 10(3) : Where the State Government has required under sub-section (2) that a
certificate as to the cause of death shall be obtained. In the event of the death of any
person who, during his last illness, was attended by a medical practitioner, the medical
practitioner shall, after the death of that person, forthwith, issue without charging any
fee, to the person required under this Act to give information concerning the death, a
certificate in the prescribed form stating to the best of his knowledge and belief the
cause of death; and the certificate shall be received and delivered by such person to the
Registrar at the time of giving information concerning the death as required by this
Act.
Section 17(1) (b) : Subject to any rules made in this behalf by the State Government,
including rules relating to the payment of fees and postal charges, any person may
obtain an extract from registration records relating to any death; provided that no
extract relating to any death, issued to any person, shall disclose the particulars
regarding the cause of death as entered in the register.
Section 23(3) : Any medical practitioner who neglects or refuses to issue a certificate
under sub-section (3) of section 10 and any person who neglects or refuses to deliver
such certificates shall be punishable with fine which may extend to fifty rupees.
1.7 The report is presented in 4 chapters and 3 appendices. Chapters II, III and IV
deals with ‘Scheme of Medical Certification of Cause of Death: Status of
implementation’, ‘Distribution of Deaths by Cause’ and ‘Specific Cause of Mortality
in different age group’ respectively.

CHAPTER CHAPTER CHAPTER CHAPTER ---- IIIIIIII
SCHEME OF MCCDSCHEME OF MCCDSCHEME OF MCCDSCHEME OF MCCD ::::
STATUS OF IMPLEMENTATIONSTATUS OF IMPLEMENTATIONSTATUS OF IMPLEMENTATIONSTATUS OF IMPLEMENTATION

3
CHAPTER - II
Scheme of MCCD : Status of Implementation :
The RBD Act, 1969 provides for compulsory registration of births and deaths
in the country. The scheme of MCCD was introduced in the State during the year
1967 with 44 selected hospitals. It was extended to 168 hospitals by 1990. 350
hospitals with bed-strength of 20 or more in towns and cities with a lakh or more
population (as per 1981 census) were covered in 1991. This expansion was taken up
as per the recommendations of the workshop on “Statistics of Cause of Death” held
during 1986 at New Delhi.
2.2 In order to take the MCCD Scheme forward in a systematic manner in the
country, the Registrar General, India has been impressing upon all the States / Union
Territories to bring all hospitals (Government & Private) and private medical
practitioners under its coverage, both in rural as well as urban areas by imposing issue
of Notification. In this context, the Government of Karnataka has been issued
Notification to bring all Government and Private medical institutions and private
medical practitioners under the scheme of Medical Certification of Cause of Death.
By 2012, 1375 hospitals have been brought under the scheme. The scheme’s ambit is
confined mostly to institutional deaths. Though the sample is representative, sweeping
generalisations are not recommended, since a large no. of rural events remain outside
the ambit of the survey.
MCCD Status : State Scenario : Flow of Data and Processing :
2.3 The certificates of cause(s) of death certified by the doctors were sent in the
prescribed Form (No.4) directly from the institutions covered under the scheme of
MCCD on a monthly basis to this Directorate. They were scrutinised & coded as per
ICD-10th
Revision & Table-9 derived as per the National list prescribed / designed by
the Registrar General, India. Data was processed at the Inhouse Computer Centre of
the CNL Division of the Directorate.
2.4 As per the reported information, the number of hospitals covered and reporting
data on MCCD, District-wise and Sex-wise classification in the State is presented in
the Statement-1.
4
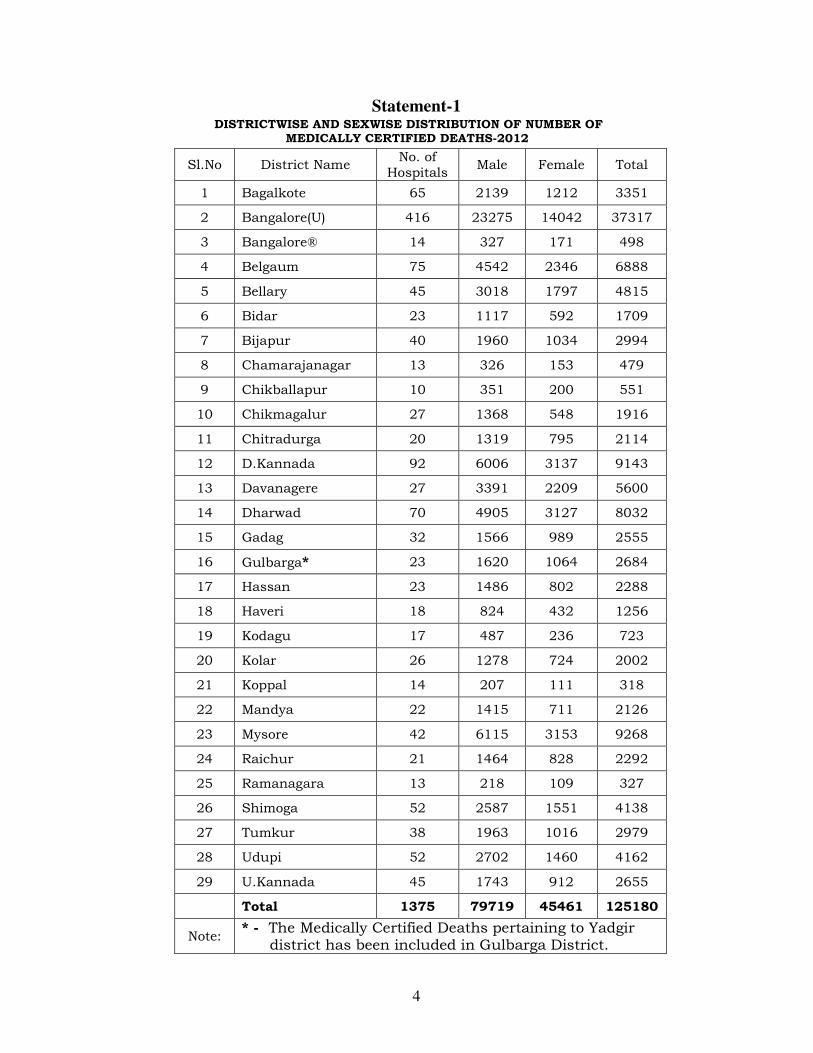
Statement-1
DISTRICTWISE AND SEXWISE DISTRIBUTION OF NUMBER OF
MEDICALLY CERTIFIED DEATHS-2012
Sl.No District Name No. of
Hospitals Male Female Total
1 Bagalkote 65 2139 1212 3351
2 Bangalore(U) 416 23275 14042 37317
3 Bangalore® 14 327 171 498
4 Belgaum 75 4542 2346 6888
5 Bellary 45 3018 1797 4815
6 Bidar 23 1117 592 1709
7 Bijapur 40 1960 1034 2994
8 Chamarajanagar 13 326 153 479
9 Chikballapur 10 351 200 551
10 Chikmagalur 27 1368 548 1916
11 Chitradurga 20 1319 795 2114
12 D.Kannada 92 6006 3137 9143
13 Davanagere 27 3391 2209 5600
14 Dharwad 70 4905 3127 8032
15 Gadag 32 1566 989 2555
16 Gulbarga* 23 1620 1064 2684
17 Hassan 23 1486 802 2288
18 Haveri 18 824 432 1256
19 Kodagu 17 487 236 723
20 Kolar 26 1278 724 2002
21 Koppal 14 207 111 318
22 Mandya 22 1415 711 2126
23 Mysore 42 6115 3153 9268
24 Raichur 21 1464 828 2292
25 Ramanagara 13 218 109 327
26 Shimoga 52 2587 1551 4138
27 Tumkur 38 1963 1016 2979
28 Udupi 52 2702 1460 4162
29 U.Kannada 45 1743 912 2655
Total 1375 79719 45461 125180
Note: * - The Medically Certified Deaths pertaining to Yadgir district has been included in Gulbarga District.
5
2.5 During 2012, a total of 125180 medically certified deaths were reported, of
which 79719 and 45461 pertained to males and females respectively. Among 3939
hospitals in the State 1375 (34.91%) hospitals were covered under Medical
Certification of Cause of Death.
Out of 416 hospitals in Bangalore district, the district had reported 37317
deaths covering 29.80 per cent of total deaths.
The next highest number of hospitals (92) in Dakshina Kannada district
covered under Medical Certification of Cause of Death accounted for 9143 deaths (7.3
per cent).
Less than 500 deaths were reported in the districts of Bangalore (R) (0.4%),
Chamarajanagar (0.4%), Koppala (0.3%) and Ramanagar (0.3%).
Growth in the Medical Certification of Cause of Death :
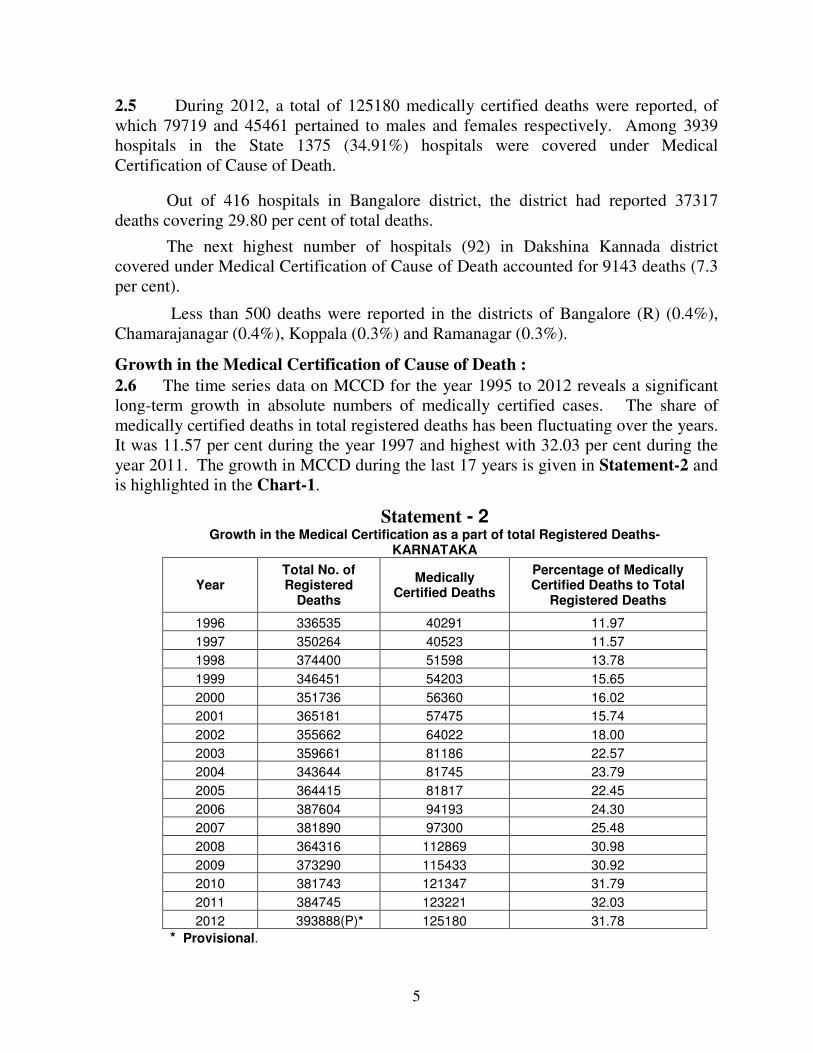
2.6 The time series data on MCCD for the year 1995 to 2012 reveals a significant
long-term growth in absolute numbers of medically certified cases. The share of
medically certified deaths in total registered deaths has been fluctuating over the years.
It was 11.57 per cent during the year 1997 and highest with 32.03 per cent during the
year 2011. The growth in MCCD during the last 17 years is given in Statement-2 and
is highlighted in the Chart-1.
Statement - 2 Growth in the Medical Certification as a part of total Registered Deaths-
KARNATAKA
Year Total No. of Registered
Deaths
Medically Certified Deaths
Percentage of Medically Certified Deaths to Total
Registered Deaths
1996 336535 40291 11.97
1997 350264 40523 11.57
1998 374400 51598 13.78
1999 346451 54203 15.65
2000 351736 56360 16.02
2001 365181 57475 15.74
2002 355662 64022 18.00
2003 359661 81186 22.57
2004 343644 81745 23.79
2005 364415 81817 22.45
2006 387604 94193 24.30
2007 381890 97300 25.48
2008 364316 112869 30.98
2009 373290 115433 30.92
2010 381743 121347 31.79
2011 384745 123221 32.03
2012 393888(P)* 125180 31.78
* Provisional.

6
CHART – 1
Growth in MCCD in Karnataka 1996-2012
33
65
35
35
02
64
37
44
00
34
64
51
35
17
36
36
51
81
35
56
62
35
96
61
34
36
44
36
44
15
38
76
04
38
18
90
36
43
16
37
32
90
38
17
43
38
47
45
39
38
88
40
29
1
40
52
3
51
59
8
54
20
3
56
36
0
57
47
5
64
02
2
81
18
6
81
74
5
81
81
7
94
19
3
97
30
0
11
28
69
11
54
33
12
13
47
12
32
21
12
51
80
30000
130000
230000
330000
430000
530000
19
96
19
97
19
98
19
99
20
00
20
01
20
02
20
03
20
04
20
05
20
06
20
07
20
08
20
09
20
10
20
11
20
12
Years
No.o
f d
eath
s
Total No. of Registered Deaths
Medically Certified Deaths
Growth in the Medical Certification of Cause of Death at All India Level:
2.8 The time series data on MCCD for the year 2004 to 2008 reveals a significant
long-term growth in absolute numbers of medically certified cases. The share of
medically certified deaths in total registered deaths has been increasing over the years.
It was 14.2 per cent during the year 2004 and highest with 19.3 per cent during the
year 2008. The growth in MCCD during the last 5 years of India is given in
Statement-2A..
Statement – 2A
Growth in the Medical Certification as a part of Total Registered Deaths –
INDIA
Year Total No. of Registered
Deaths
Medically Certified Deaths
Percentage of Medically Certified Deaths to Total
Registered Deaths
2004 4258440 603260 14.2
2005 4560901 650507 14.3
2006 4327664 720047 16.6
2007 4219770 798546 18.9
2008 4560901 878339 19.3

CHAPTER CHAPTER CHAPTER CHAPTER ---- IIIIIIIIIIII
SCHEME OF MCCD :SCHEME OF MCCD :SCHEME OF MCCD :SCHEME OF MCCD :
DISTRIBUTION OF DEATHS DISTRIBUTION OF DEATHS DISTRIBUTION OF DEATHS DISTRIBUTION OF DEATHS
BY CAUSEBY CAUSEBY CAUSEBY CAUSE

7
CHAPTER – III
Distribution of Deaths by Causes
3.1 The data on Medical Certification of Cause of Death has been presented as per the
National list based on 10th
revision of ICD, to facilitate meaningful comparison and
drawing valid conclusions thereof. This chapter aims at summarising the findings of data
reported on medically certified deaths from 1375 hospitals by age, sex and major cause
groups. During 2012, a total of 125180 medically certified deaths were reported, of
which 79719 and 45465 pertained to males and females respectively. The age-wise
distribution of such deaths by sex is presented in the Statement-3 & Chart-2.
Statement – 3
Age and Sex Distribution of Medically Certified Deaths – 2012
Sl. No
Age
Group
Male Female Total
No.of Medically certified Deaths
Percentage to
No.of Medically certified Deaths
Percentage to
No.of Medically certified Deaths
Percent-age
to total Medically certified deaths
Total Male
deaths Under MCCD
Total
Medically certified deaths
Total Female
deaths Under MCCD
Total
Medically certified deaths
1 Below 1
Year 7962 9.99 6.36 5436 11.96 4.34 13398 10.70
2 1-4 809 1.01 0.65 648 1.43 0.52 1457 1.16
3 5-14 1095 1.37 0.87 899 1.98 0.72 1994 1.59
4 15-24 2817 3.53 2.25 2929 6.44 2.34 5746 4.59
5 25-34 5405 6.78 4.32 3557 7.82 2.84 8962 7.16
6 35-44 8932 11.20 7.14 4167 9.17 3.33 13099 10.46
7 45-54 11702 14.68 9.35 4974 10.94 3.97 16676 13.32
8 55-64 13477 16.91 10.77 6318 13.90 5.05 19795 15.81
9 65-69 8216 10.31 6.56 4486 9.87 3.58 12702 10.15
10 70 &
above 15694 19.69 12.54 10301 22.66 8.23 25995 20.77
11 Age Not
Stated 3610 4.53 2.88 1746 3.84 1.39 5356 4.28
Total 79719 100.00 63.68 45461 100.00 36.32 125180 100.00
Note: Due to rounding off total may not tally with aggregate.

8
Chart - 2
DISTRIBUTION OF MEDICALLY CERTIFIED DEATHS BY
AGE AND SEX UNDER MCCD – 2012
3.2 Statement-3 indicates the contribution of male and female deaths in the total
medically certified cases were reported to be 63.68 per cent and 36.32 per cent
respectively. It seems that more males are admitted to hospital during last moments as
compared to females. Among the males those who crossed 70 years stood first followed
by those in the age group 55-64 and 45-54 years. These three age-groups put together
formed 51.28 per cent of deaths. Age group 35-44 years also had a significant place with
11.20 per cent. Infant deaths occupied the 5th
place (9.99 per cent). Least vulnerable were
those in the age group 1-4 years.
Among the females also 70 plus had the largest share, followed by those in the
age group 55-64 years. Both put together contributed 36.56 per cent deaths. Infant deaths
took 3rd
position with 11.96 per cent, 23.43 per cent deaths were from the prime age
group of 15-44 years. Least vulnerable was again in the age group 1-4 years.
3.3 The eight leading cause groups of deaths viz., Diseases of the circulatory system
(I00-I99), Certain Infectious and Parasitic Diseases (A00-B99), Injury, Poisoning and
certain other consequences of external causes (S00-T98), Certain conditions
originating in the perinatal period (P00-P96), Diseases of the Respiratory System (J00-
J98), Diseases of the Digestive System (K00-K92), Endocrine, Nutritional and
Metabolic Diseases (E00-E89) and Neoplasm (C00-D48) had taken together account for
about 88.80 per cent of the total medically certified deaths which is detailed in
Statement-4.
9
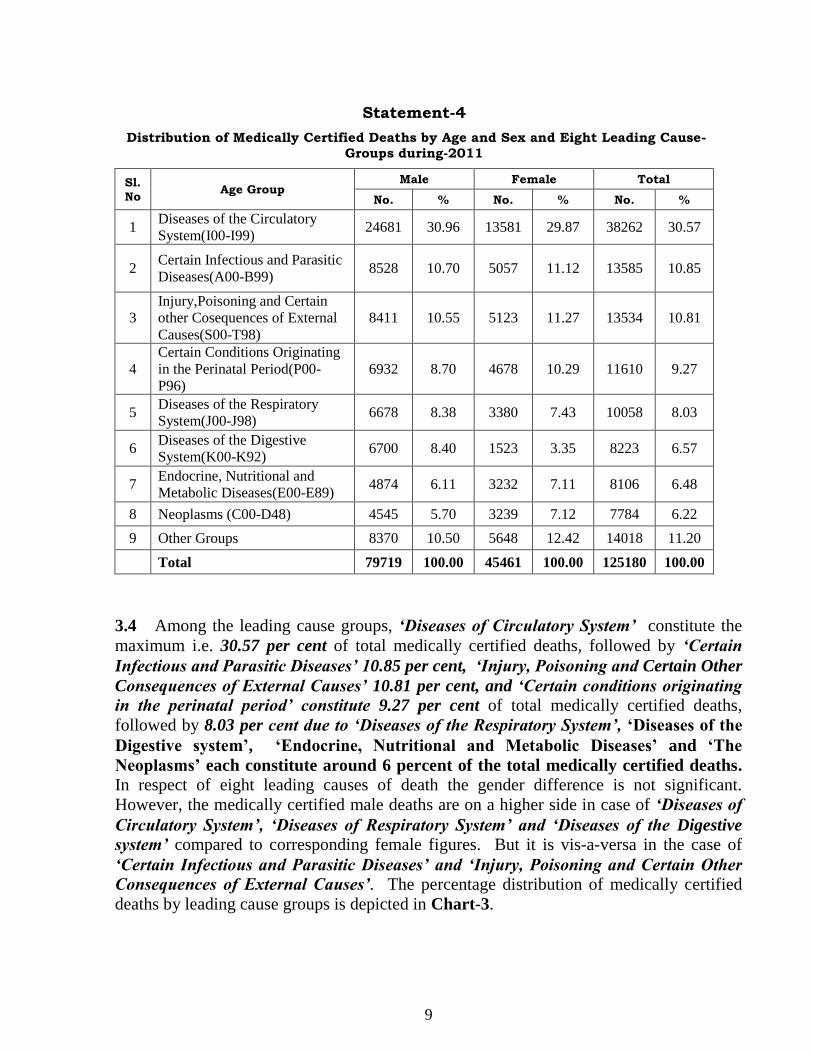
Statement-4
Distribution of Medically Certified Deaths by Age and Sex and Eight Leading Cause-
Groups during-2011
Sl.
No Age Group
Male Female Total
No. % No. % No. %
1 Diseases of the Circulatory
System(I00-I99) 24681 30.96 13581 29.87 38262 30.57
2 Certain Infectious and Parasitic
Diseases(A00-B99) 8528 10.70 5057 11.12 13585 10.85
3
Injury,Poisoning and Certain
other Cosequences of External
Causes(S00-T98)
8411 10.55 5123 11.27 13534 10.81
4
Certain Conditions Originating
in the Perinatal Period(P00-
P96)
6932 8.70 4678 10.29 11610 9.27
5 Diseases of the Respiratory
System(J00-J98) 6678 8.38 3380 7.43 10058 8.03
6 Diseases of the Digestive
System(K00-K92) 6700 8.40 1523 3.35 8223 6.57
7 Endocrine, Nutritional and
Metabolic Diseases(E00-E89) 4874 6.11 3232 7.11 8106 6.48
8 Neoplasms (C00-D48) 4545 5.70 3239 7.12 7784 6.22
9 Other Groups 8370 10.50 5648 12.42 14018 11.20
Total 79719 100.00 45461 100.00 125180 100.00
3.4 Among the leading cause groups, „Diseases of Circulatory System‟ constitute the
maximum i.e. 30.57 per cent of total medically certified deaths, followed by „Certain
Infectious and Parasitic Diseases‟ 10.85 per cent, „Injury, Poisoning and Certain Other
Consequences of External Causes‟ 10.81 per cent, and „Certain conditions originating
in the perinatal period‟ constitute 9.27 per cent of total medically certified deaths,
followed by 8.03 per cent due to „Diseases of the Respiratory System‟, „Diseases of the
Digestive system‟, „Endocrine, Nutritional and Metabolic Diseases‟ and „The
Neoplasms‟ each constitute around 6 percent of the total medically certified deaths. In respect of eight leading causes of death the gender difference is not significant.
However, the medically certified male deaths are on a higher side in case of „Diseases of
Circulatory System‟, „Diseases of Respiratory System‟ and „Diseases of the Digestive
system‟ compared to corresponding female figures. But it is vis-a-versa in the case of
„Certain Infectious and Parasitic Diseases‟ and „Injury, Poisoning and Certain Other
Consequences of External Causes‟. The percentage distribution of medically certified
deaths by leading cause groups is depicted in Chart-3.

10
Chart - 3
PERCENTAGE DISTRIBUTION OF DEATHS UNDER MCCD
BY LEADING CAUSE GROUP – 2012
Diseases of the
Digestive System
(K00-K92),
6.57
Endocrine, Nutritional
and M etabolic
Diseases
(E00-E89), 6.48
Neoplasms (C00-D48),
6.22
Diseases of the
Respiratory System
(J00-J98),
8.03Certain Conditions
Originating in the
Perinatal Period
(P00-P96),
9.27
Injury,Poisoning and
Certain other
Cosequences of
External Causes(S00-
T98),
10.81
Certain Infectious and
Parasitic Diseases
(A00-B99),
10.85
Diseases of the
Circulatory System
(I00-I99),
30.57
Other Groups,
11.20
3.5 The percentage distribution of eight major cause groups of death for the period
1996 to 2012 is presented in the Statement-5.

11
Statement – 5
Percentage Distribution of 8 leading Major Cause Groups of Deaths during
1996 - 2012
Year
Leading major cause groups of deaths (As per ICD-10)
Diseases of the circu-latory system
Certain Infectious and Parasitic Diseases
Injury Poisoning & certain other consequences of external causes
Certain conditions originating
in the Perinatal
period
Diseases of the Respira-tory System
Endocrine, Nutritional & Metabolic Diseases
Neo-plasm
Diseases of the Digestive System
Other Groups
Total
1996 21.10 14.40 15.80 10.20 7.50 4.70 4.20 6.40 15.70 100.00
1997 22.00 14.60 16.00 10.90 6.10 4.60 4.40 6.50 14.90 100.00
1998 22.10 15.50 15.30 9.30 6.40 4.80 4.50 6.60 15.50 100.00
1999 21.60 17.30 15.40 9.30 6.70 4.60 4.30 6.30 14.50 100.00
2000 26.31 15.16 9.21 10.27 6.42 4.68 3.85 7.25 16.85 100.00
2001 24.98 13.12 15.03 10.49 5.04 5.05 4.95 6.15 15.19 100.00
2002 25.32 12.32 13.63 10.39 5.22 5.95 4.45 6.26 16.46 100.00
2003 25.56 12.32 11.62 10.01 5.52 6.39 5.36 6.29 16.93 100.00
2004 25.65 12.24 11.48 9.54 5.43 6.29 6.20 6.45 16.72 100.00
2005 26.98 12.72 10.28 9.68 5.97 6.81 5.67 6.38 15.51 100.00
2006 27.51 12.03 10.19 7.71 6.52 8.07 5.86 6.55 15.56 100.00
2007 25.29 13.02 11.28 8.77 7.22 6.72 5.68 6.33 15.69 100.00
2008 28.78 11.12 10.16 8.32 7.56 6.84 6.25 5.96 15.01 100.00
2009 28.26 11.23 9.75 8.95 7.47 6.88 6.77 6.04 14.65 100.00
2010 30.69 11.45 8.66 8.90 8.58 6.42 6.24 6.48 12.59 100.00
2011 29.97 10.68 11.20 9.33 7.90 6.36 6.15 6.55 11.85 100.00
2012 30.57 10.85 10.81 9.27 8.03 6.57 6.22 6.48 11.20 100.00
Note: 1. - ' Others' include to remaining major cause group.
2. - Data in above table may not be strictly comparable over the reporting years due to
switchover in the use of ICD-9 to ICD-10 in the State in tabulation from 1996
onwards and basic data on MCCD is for the years 1996 to 2012.
The data reveals that, the group of „Diseases of the Circulatory System‟ has
not only occupied the position of top-most killer, but its percentage to total deaths has
registered an increasing trend over the year. The major cause group „Certain Infectious
and Parasitic Diseases‟ has shown on an average, a declining trend in its share to total
deaths over the years.
12
3.5.1 The proportion of deaths due to „Injury, Poisoning and Certain Other
Consequences of External Causes‟ has exhibited a fluctuating pattern over the years.
3.5.2 The group of „Diseases of Certain Conditions Originating in Perinatal Period‟
which is the prime causes of deaths among infants, has shown more or less a declining
trend in percentage term over the years.
3.5.3 The share of medically certified deaths due to „Diseases of Respiratory System‟
has varied in the range of 5.04 to 8.03 per cent during the period of 1996 to 2012, thus
accounting for around 5 to 7 deaths per hundred reported medically certified deaths. What
is important is that the proportion of deaths due to „Diseases of Respiratory System‟ has
shown an increasing tendency since 2007.
3.5.4 The share of medically certified deaths due to „Endocrine, Nutritional and
Metabolic Diseases‟ has shown an increasing trend over the years.
3.5.5 The percentage of deaths due to „Neoplasms‟ has varied from 3.85 per cent to 6.48
per cent over the years. In 2012, the percentage of medically certified deaths due to
„Diseases of Digestive System‟ is 6.48 as against 7.25 in 2000. The share of deaths due to
this cause has an average of 6 per cent since 1996 except in the year 2000 (7.25 per cent).
3.5.6 The groups “other than” the eight leading ones viz., Diseases of the Skin and
Subcutaneous Tissue, Pregnancy, Child Birth and the Puerperium, Congenital
Malformations, Deformations and Chromosomal Abnormalities etc., constitutes less
than 17 per cent of the total medically certified deaths since 1995.
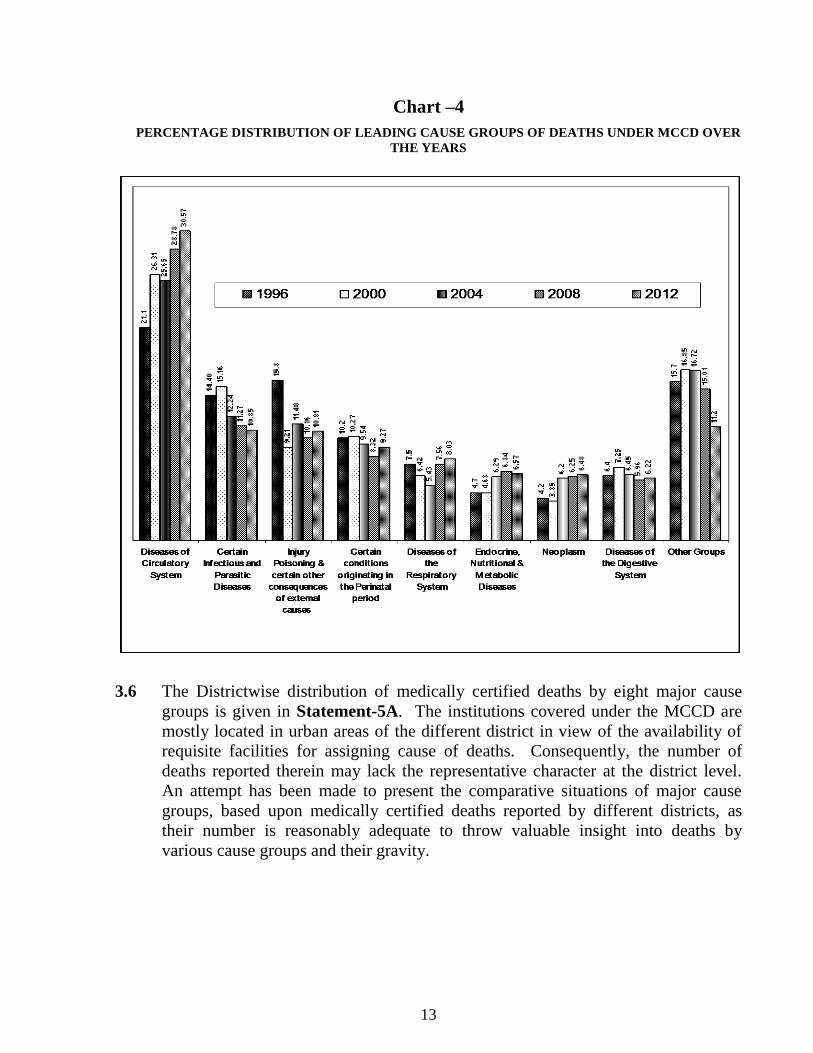
3.5.7 The Chart-4 shows the percentage share of leading cause groups of death in
Medical Certification of Cause of Death for the years 1996, 2000, 2004, 2008 and 2012.
13
Chart –4
PERCENTAGE DISTRIBUTION OF LEADING CAUSE GROUPS OF DEATHS UNDER MCCD OVER
THE YEARS
3.6 The Districtwise distribution of medically certified deaths by eight major cause
groups is given in Statement-5A. The institutions covered under the MCCD are
mostly located in urban areas of the different district in view of the availability of
requisite facilities for assigning cause of deaths. Consequently, the number of
deaths reported therein may lack the representative character at the district level.
An attempt has been made to present the comparative situations of major cause
groups, based upon medically certified deaths reported by different districts, as
their number is reasonably adequate to throw valuable insight into deaths by
various cause groups and their gravity.

14
Statement - 5A Districtwise Distribution of Medically Certified Deaths by Eight Leading Cause-Groups during -2012
Sl.
No
Dis
tric
t N
ame
Dis
ease
s o
f th
e C
ircu
lato
ry S
yst
em
(I0
0-I
99
)
Cer
tain
Infe
ctio
us
and
P
aras
itic
Dis
ease
s
(A0
0-B
99
)
Inju
ry, P
ois
onin
g
and
C
erta
in o
ther
Con
sequ
ence
s o
f
Ex
tern
al C
ause
s
(S0
0-T
98
)
Cer
tain
Condit
ions
Ori
gin
atin
g i
n t
he
Per
inat
al P
erio
d
(P0
0-P
96
)
Dis
ease
s o
f th
e
Res
pir
ato
ry
Sy
stem
(J00
-J98
)
Dis
ease
s o
f th
e
Dig
esti
ve
Sy
stem
(K0
0-K
92
)
Endocr
ine,
Nutr
itio
nal
an
d
Met
aboli
c
Dis
ease
s(E
00
-E8
9)
Neo
pla
sms
(C00
-D48
)
Oth
er G
rou
ps
To
tal
1 Bagalkote 32.44 10.03 6.45 17.67 7.82 10.53 1.91 1.46 11.70 100
2 Bangalore(U) 35.91 7.98 8.20 4.02 7.05 7.09 9.44 9.54 10.76 100
3 Bangalore(R) 21.08 14.46 21.49 5.82 11.65 5.02 6.02 5.62 8.84 100
4 Belgaum 27.80 11.60 11.95 12.56 8.20 6.29 4.66 3.60 13.34 100
5 Bellary 21.04 16.49 16.82 11.03 8.25 7.71 3.55 1.87 13.25 100
6 Bidar 18.90 9.95 15.68 20.13 4.15 19.84 2.28 1.35 7.72 100
7 Bijapur 24.85 12.63 9.29 13.59 8.58 10.12 4.64 2.81 13.49 100
8 Chamarajanagar 38.20 7.31 8.14 5.43 12.94 4.18 8.77 2.51 12.53 100
9 Chikballapur 35.57 10.71 13.07 2.18 12.89 9.26 2.90 2.72 10.71 100
10 Chikmagalur 48.85 3.08 14.25 3.55 14.51 3.18 3.76 2.77 6.05 100
11 Chitradurga 38.88 6.95 24.55 6.62 9.32 3.03 2.74 1.37 6.53 100
12 D.Kannada 25.91 9.62 9.59 5.70 8.70 6.55 9.94 12.82 11.17 100
13 Davanagere 22.96 13.43 10.68 16.23 11.30 6.07 4.21 2.73 12.38 100
14 Dharwad 21.97 11.60 14.26 17.33 6.18 5.78 4.49 5.44 12.95 100
15 Gadag 26.93 22.27 5.99 9.04 8.49 7.36 5.83 2.43 11.66 100
16 Gulbarga* 21.16 15.31 11.03 25.48 6.37 5.66 1.75 2.01 11.21 100
17 Hassan 29.02 9.31 17.53 9.44 12.59 5.68 3.19 2.67 10.58 100
18 Haveri 54.78 7.25 7.48 14.73 3.74 2.07 1.27 1.27 7.40 100
19 Kodagu 34.44 7.61 11.76 9.82 8.99 7.33 3.87 5.39 10.79 100
20 Kolar 19.98 15.33 13.24 8.74 13.89 5.64 5.84 4.10 13.24 100
21 Koppal 34.59 12.58 15.09 2.20 13.52 5.66 4.40 1.57 10.38 100
22 Mandya 28.13 10.25 10.30 11.81 13.12 5.55 5.60 3.01 12.23 100
23 Mysore 27.92 12.72 12.73 10.81 5.57 5.15 9.09 5.33 10.68 100
24 Raichur 29.67 17.32 12.48 15.14 6.54 4.84 2.36 1.96 9.69 100
25 Ramanagara 25.69 13.46 16.82 11.01 11.01 6.73 3.36 3.06 8.87 100
26 Shimoga 33.78 11.21 12.32 14.79 4.71 4.54 4.30 4.83 9.50 100
27 Tumkur 36.93 13.80 11.41 6.58 9.00 4.13 4.57 2.62 10.98 100
28 Udupi 30.59 12.69 8.70 2.84 7.33 7.40 6.44 11.94 12.09 100
29 U.Kannada 38.76 10.09 5.84 5.31 16.08 4.75 2.71 4.63 11.83 100
Total 30.57 10.85 10.81 9.27 8.03 6.57 6.48 6.22 11.20 100
Note: * - The information pertaining to Yadgir District has been included in Gulbarga District.
15
3.6.1 As depicted in the Statement 5A, more than twenty per cent of total medically
certified deaths reported from all of the districts belong to the cause group
Diseases of Circulatory System. In Haveri as high as 54.78 percent of deaths
(nearly 5 out of 10 deaths), have been reported to be medically certified as
Circulatory system deaths as against Bidar which has reported as low as 18.90
percent (nearly 2 out of 10 deaths) with the corresponding figure for all reporting
districts taken together to be 30.57 percent (nearly 3 out of 10 deaths).
3.6.2 The group Certain Infectious & Parasitic Diseases constitutes 10.85 percent of
medically certified deaths for all the reporting districts taken together. Its share in
total medically certified deaths of Chikmagalur district as low as 3.08 percent as
against 22.27 percent in Gadag district.
3.6.3 The share of major cause group Injury, Poisoning and Certain other
Consequences of External Causes reported high in case of Chitradurga district
24.55 per cent whereas it is low in Gadag district 5.99 per cent in their respective
totals of medically certified deaths.
3.6.4 The percentage of medically certified deaths due to Certain Conditions
Originating in the Perinatal Period is in the range of 10 to 25 per cent in
Bagalkote, Belgaum, Bellary, Bidar, Bijapur, Davanagere, Dharwad, Gulbarga,
Haveri, Mandya, Mysore, Raichur, Ramanagar and Shimoga districts, whereas in
other districts it is less than 10 per cent.
3.6.5 The group, Diseases of Respiratory System constitutes 10 per cent or more of
medically certified deaths in eleven districts, viz., Bangalore (R),
Chamarajanagar, Chickballapur, Chikmagalur, Davanagere, Hassan, Kolar,
Koppal, Mandya, Ramanagar and Uttara Kannada districts.
3.6.6 The share of medically certified deaths due to Diseases of the Digestive System
is reported high in the Bidar district as 19.84 per cent whereas it is reported low
in the district of Haveri as 2.07 per cent. Whereas in other districts its
percentage accounting for around 3 to 10 per cent.
3.6.7 The share of medically certified deaths due to Endocrine, Nutritional and
Metabolic Diseases exceeded 5 per cent of total medically certified only in the
10 districts viz., Bangalore(U), Bangalore(R), Chamarajanagar, Dakshina
Kannada, Gadag, Kolar, Mandya, Mysore and Udupi.
3.6.8 The percentage share of Neoplasms deaths is reported as highest as 12 per cent in
case of medically certified deaths reported from Dakshina Kannada District,
whereas the share of this major group in case of Haveri district which has
reported the lowest as 1.27 per cent to the total medical certification of death.

16
Leading Causes of Deaths
3.7 Diseases of the Circulatory System (IX):
It is the topmost ranking major group of disease, constituting 30.57per cent of
total medically certified deaths. It accounts for 30.96 per cent of males and 29.87 per cent
of female deaths in their respective totals of medically certified deaths. The distribution
of major components under this cause group is presented in Statement-6 and is depicted
in Chart-5.
Statement - 6
DISTRIBUTION OF MAJOR CAUSES OF DEATHS AMONG DISEASES OF
CIRCULATORY SYSTEM UNDER MCCD-2012
Sl. No
CAUSE OF DEATH
Male Female Total % to Total
Medically Certified
Deaths
No. % No. % No. %
1 Ischaemic Heart Diseases 10698 43.35 5509 40.56 16207 42.36 12.95
2 Cerebro Vascular Diseases 5538 22.44 2734 20.13 8272 21.62 6.61
3
Diseases of Pulmonary
Circulation and other
forms of Heart Diseases
4552 18.44 2642 19.45 7194 18.80 5.75
4 Hypertensive Diseases 2584 10.47 1674 12.33 4258 11.13 3.40
5
Acute Rheumatic Fever
and Chronic Rheumatic
Heart Diseases
704 2.85 760 5.60 1464 3.83 1.17
6 Others 605 2.45 262 1.93 867 2.27 0.69
Total Medically Certified
Deaths due to Diseases of
Circulatory System
24681 100 13581 100 38262 100 30.57
Deaths due to Diseases of
Circulatory system as
percentage to total
medically certified deaths
30.95 29.87 30.57

17
Chart – 5
PERCENTAGE DISTRIBUTION OF MEDICALLY CERTIFIED DEATHS DUE TO
DISEASES OF CIRCULATORY SYSTEM – 2012
Ischaemic Heart
Diseases, 42.36
Others,
2.27
Acute Rheumatic Fever
and Chronic Rheumatic
Heart Diseases,
3.83
Hypertensive Diseases,
11.13
Diseases of Pulmonary
Circulat ion and other
forms of Heart Diseases,
18.80
Cerebro Vascular
Diseases,
21.62
3.7.1 The Sub-group „Ischemic Heart Diseases (IHD)‟ characterized by reduced blood
supply to the heart muscle, usually due to coronary artery disease (arthrosclerosis of the
Coronary arteries) accounts for the highest no.of deaths (42.36 per cent) under the major
group „Diseases of Circulatory System‟. Furthermore, around every 13th
medically
certified deaths has been reported to be caused by IHD alone. The sub group
„Cerebrovascular Diseases‟ is reported to be the second highest cause of deaths
constituting 21.62 per cent of the Circulatory system deaths followed by „Diseases of
Pulmonary Circulation and other forms of heart Diseases (18.80 per cent)‟ and
„Hypertensive Diseases (11.13 per cent)‟. The percentages of male deaths to female
deaths are more in the cause group of Ischemic Heart Diseases and Cerebro Vascular
Diseases. It is vis-a-versa in the cause group of Diseases of Pulmonary Circulation and
Other Forms of Heart Diseases and Hypertensive Diseases.
3.7.2 The age distribution of medically certified deaths due to „Diseases of Circulatory
System‟ has been given in Statement-7 and highlighted in Chart-6. The age distribution
under this cause group is in consonance with the general epidemiology of circulatory
system which increase with age.

18
Statement -7
AGE DISTRIBUTION OF DEATHS DUE TO DISEASES OF
CIRCULATORY SYSTEM UNDER MCCD-2012
Sl.
No Age Group
Male Female Total
No. % No. % No. %
1 Below 1 Year 0 0 19 0.14 19 0.05
2 1-4 35 0.14 22 0.16 57 0.15
3 5-14 61 0.25 55 0.4 116 0.3
4 15-24 153 0.62 117 0.86 270 0.71
5 25-34 813 3.29 430 3.17 1243 3.25
6 35-44 2195 8.89 906 6.67 3101 8.1
7 45-54 3848 15.59 1472 10.84 5320 13.9
8 55-64 5291 21.44 2514 18.51 7805 20.4
9 65-69 3722 15.08 2140 15.76 5862 15.32
10 70 & above 7364 29.84 5274 38.83 12638 33.03
11 Age Not Stated 1199 4.86 632 4.65 1831 4.79
Total 24681 100 13581 100 38262 100
Chart - 6
AGE DISTRIBUTION OF DEATHS DUE TO “DISEASES OF
CIRCULATORY SYSTEM” UNDER MCCD - 2012
4.3 4.73 4.46
61.0
51.78
57.72
29.84
38.83
33.03
0
10
20
30
40
50
60
70
Male Female Total
Less than 34 35 - 69 70 & above

19
3.8 Certain Infectious and Parasitic Diseases (I):
It is the second leading cause group of disease accounting for 10.85 per cent of
total medically certified deaths, which constitute 10.70 per cent of male and 11.12 per
cent of female medically certified deaths of their respective totals. The distribution of
major components under this cause group is shown in the Statement-8 and is depicted in
Chart-7.
Statement-8
Distribution of Major Causes of Deaths among Certain Infectious and parasitic Diseases Under MCCD-2012
Sl.
No Cause of Death
Male Female Total % to Total
Medically
Certified
Deaths No. % No. % No. %
1
Respiratory
Tuberculosis(A15-A16) 3458 40.55 1543 30.51 5001 36.81 4.00
2 Septicaemia(A40-A41) 1421 16.66 1128 22.31 2549 18.76 2.04
3
Diarrhoea and
Gastroenteritis of Presumed
Infectious Origin(A09) 687 8.06 568 11.23 1255 9.24 1.00
4
Tuberculosis of Nervous
System(A17) 482 5.65 283 5.60 765 5.63 0.61
5 Other Arthopod-Borne
Viral Fevers and Viral
Haemorrhagic Fevers 352 4.13 283 5.60 635 4.67 0.51
6
Tuberculosis of Other
Organs and Miliary
Tuberculosis(A18-A19) 380 4.46 243 4.81 623 4.59 0.50
7 Other Viral
Encephalitis(A83.1-
A83.9,A84-A86) 331 3.88 202 3.99 533 3.92 0.43
8 Others 1417 16.62 807 15.95 2224 16.37 1.78
Total Medically Certified
Deaths due to Certain
Infectious and Parasitic
Diseases
8528 100.00 5057 100.00 13585 100.00 10.85
Deaths due to Infectious
and Parasitic Disease as
percentage to total
medically certified deaths
10.70 11.12 10.85

20
Chart – 7
PERCENTAGE DISTRIBUTION OF MEDICALLY CERTIFIED DEATHS
DUE TO CERTAIN INFECTIOUS & PARASITIC DISEASES – 2012
Tuberculosis of Other
Organs and M iliary
Tuberculosis(A18-A19),
4.59
Other Arthopod-Borne
Viral Fevers and Viral
Haemorrhagic Fevers,
4.67
Tuberculosis of
Nervous System(A17),
5.63
Diarrhoea and
Gastroenteritis of
Presumed Infectious
Origin(A09), 9.24
Other Viral
Encephalitis(A83.1-
A83.9,A84-A86), 3.92
Others,
16.37
Septicaemia
(A40-A41), 18.76
Respiratory
Tuberculosis(
A15-A16), 36.81
3.8.1 Among the Certain Infectious and Parasitic Diseases, „Respiratory Tuberculosis‟
is the highest reported medically certified cause of mortality, constituting around 36.81
per cent followed by „Septicemia‟ (18.76 per cent). Under this group, percentage of
Respiratory Tuberculosis deaths in females is 30.51 per cent as against 40.45 per cent of
males out of their respective totals. The share of „Diarrhoea & Gastroenteritis of
presumed Infectious Origin‟, „Tuberculosis of Nervous System‟, „Other Arthopad
Borne Fevers and Viral Haemarrhagic fevers‟, „Tuberculosis of other organs and
miliary tuberculosis‟ and „Other Viral Encephalitis‟ in the total deaths under this group
are 9.24, 5.63, 4.67, 4.59 and 3.92 per cent respectively.
3.8.2 The age distribution of medically certified deaths due to „Certain Infectious and
Parasitic Diseases‟ has been given in below Statement-9 and is presented in
Chart-8.
21
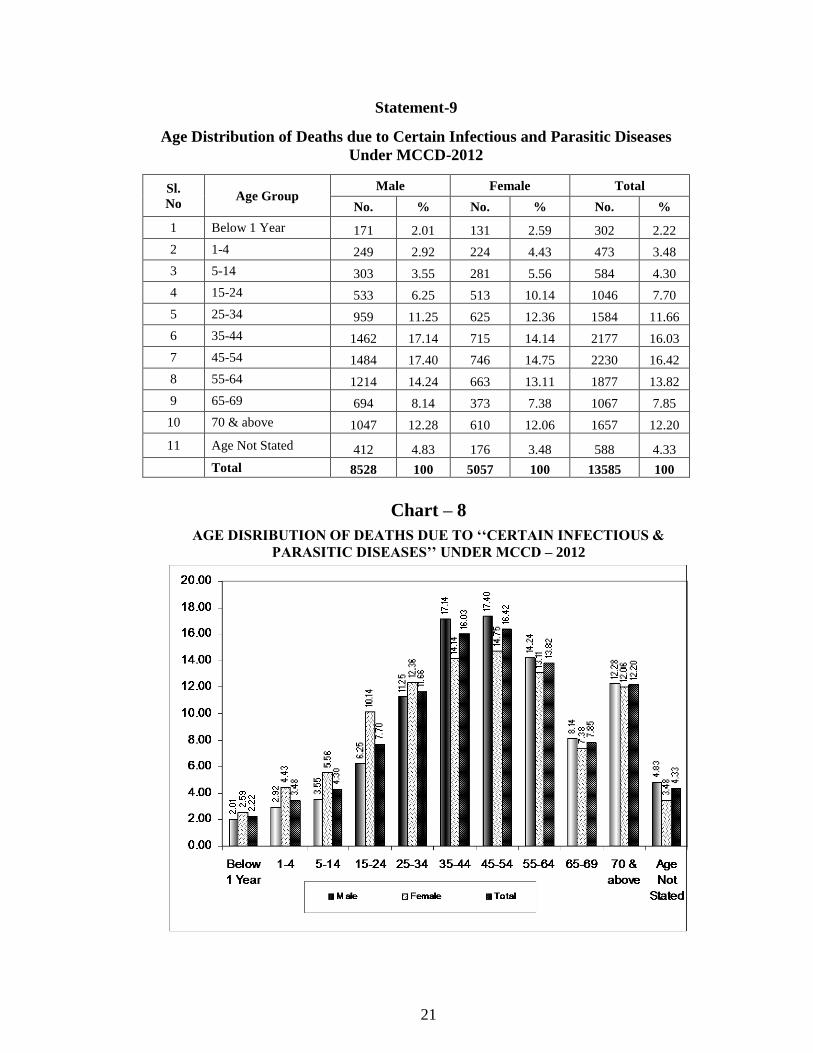
Statement-9
Age Distribution of Deaths due to Certain Infectious and Parasitic Diseases
Under MCCD-2012
Sl.
No Age Group
Male Female Total
No. % No. % No. %
1 Below 1 Year 171 2.01 131 2.59 302 2.22
2 1-4 249 2.92 224 4.43 473 3.48
3 5-14 303 3.55 281 5.56 584 4.30
4 15-24 533 6.25 513 10.14 1046 7.70
5 25-34 959 11.25 625 12.36 1584 11.66
6 35-44 1462 17.14 715 14.14 2177 16.03
7 45-54 1484 17.40 746 14.75 2230 16.42
8 55-64 1214 14.24 663 13.11 1877 13.82
9 65-69 694 8.14 373 7.38 1067 7.85
10 70 & above 1047 12.28 610 12.06 1657 12.20
11 Age Not Stated 412 4.83 176 3.48 588 4.33
Total 8528 100 5057 100 13585 100
Chart – 8
AGE DISRIBUTION OF DEATHS DUE TO „„CERTAIN INFECTIOUS &
PARASITIC DISEASES‟‟ UNDER MCCD – 2012

22
As shown in the Statement-9, the highest incidence of deaths (16.42 per cent) is reported
for the age group 45-54 years, closely followed by age groups 35-44 years (16.03 per
cent) and 55-64 years (13.82 per cent). The age-group 25-64 years has contributed to
around 57.93 per cent of total deaths under the cause group „Certain Infectious and
Parasitic Diseases‟
3.9 Injury Poisoning and Certain other Consequences of External Causes (XIX):
It is the third leading cause group responsible for 10.81 per cent of total medically
certified deaths. This has caused 10.55 per cent of male and 11.27 per cent of female
deaths. Under this cause group „Poisonings by drugs and biological substances and
toxic effects of substances chiefly non-medicinal as to source‟ alone have contributed to
31.77 per cent of the total deaths, this is followed by „Burns and Corrosions‟ (26.77 per
cent) and „Other Injuries of specified and unspecified and multiple body regions‟ with
2714 male and 617 female deaths (24.61 per cent). Death due to Burns and corrosions
among females is 51.20 per cent as compared to 11.89 per cent among males, under this
major group. The distribution of chief constituents of the major cause group is given in
the Statement-10 and is depicted in Chart-9.
Statement-10
Distribution of Deaths due to Injury, Poisoning and Certain other consequences of External causes Under MCCD-2012
Sl.
No Cause of Death
Male Female Total % To
Total
Medically
Certified
Deaths
No. % No. % No. %
1
Poisonings by drugs and Biological
substances and toxic effects of substances
chiefly non-medicinal as to source
2946 35.03 1354 26.43 4300 31.77 3.44
2 Burns and Corrosions 1000 11.89 2623 51.20 3623 26.77 2.89
3 Other injuries of specified, unspecified and
multiple body regions 2714 32.27 617 12.04 3331 24.61 2.66
4 Intracranial and Internal Injuries Including
Nerves 850 10.11 208 4.06 1058 7.82 0.85
5 Others 901 1071 321 6.27 1222 9.03 0.98
Total Medically Certified Deaths due to
Diseases of Injury, Poisoning and Certain
Other Consequences of External causes.
8411 100.00 5123 100.00 13534 100.00 10.81
Deaths due to Injury, Poisoning and Certain
other consequences of External causes as
percentage to total medically certified deaths
10.55 11.27 10.81

23
Chart - 9
PERCENTAGE DISTRIUBTION OF DEATHS DUE TO INJURY, POISONING &
CERTAIN OTHER CONSEQUENCES OF EXTERNAL CAUSES
UNDER MCCD – 2012
Intracranial and Internal
Injuries Including Nerves,
7.82
Other injuries of
specified,unspecified and
multiple body regions,
24.61
Burns and Corrosions,
26.77
Poisonings by drugs and
Bio logical substances
and toxic effects of
substances chiefly non-
medicinal as to source,
31.77
Others,
9.03
3.9.1 As revealed from the Statement-11, the highest share of deaths (23.58 per cent) is
reported for the age group 25-34 years. This is followed by age groups 15-24 years (20.06
per cent) and 35-44 years (17.82 per cent). These three age-groups together accounts for
about 61 per cent of deaths, implying that the working age groups is much more prone to
deaths due to this major group. Age-groupwise distribution of deaths due to „Injury,
Poisoning and Certain Other Consequences of External Cause‟ is presented in
Chart-10

24
Statement-11
Age Distribution of Deaths due to Injury,Poisoning and Certain other
consequences of External causes Under MCCD-2012
Sl.
No Age Group
Male Female Total
No. % No. % No. %
1 Below 1 Year 14 0.17 25 0.49 39 0.29
2 1-4 79 0.94 62 1.21 141 1.04
3 5-14 242 2.88 190 3.71 432 3.19
4 15-24 1356 16.12 1359 26.53 2715 20.06
5 25-34 1847 21.96 1344 26.23 3191 23.58
6 35-44 1570 18.67 842 16.44 2412 17.82
7 45-54 1292 15.36 481 9.39 1773 13.10
8 55-64 860 10.22 242 4.72 1102 8.14
9 65-69 269 3.20 121 2.36 390 2.88
10 70 & above 421 5.01 244 4.76 665 4.91
11 Age Not Stated 461 5.48 213 4.16 674 4.98
Total 8411 100.00 5123 100.00 13534 100.00
Chart – 10
AGE DISTRIBUTION OF DEATHS DUE TO INJURY, POISONING AND CERTAIN
OTHER CONSEQUENCES OF EXTERNAL CAUSES UNDER MCCD-2012
3.9.2 Further analysis of deaths due to „Injury, Poisonings and Certain Other
Consequences of External Causes‟, reveals that the absolute number of reported deaths
caused by „Burns and Corrosion‟ in case of females is more than two (2) times to that of

25
males. As detailed in the Statement-12, the highest number of deaths due to „Burns and
Corrosion‟ is concentrated in the age group 15-44 years, constituting around 75.57 per
cent of deaths under this sub-group. The shares of this age group in the deaths due to
„Poisonings by drugs & Biological Substances and Toxic effects of substances chiefly
non-medicinal as to source‟ and „Other Injuries of specified, unspecified and multiple
Body Regions‟ are around 60 per cent and 49 per cent respectively.
Statement-12
AGE DISTRIBUTION OF DEATHS DUE TO POISONING, BURNS CORROSIONS AND
OTHER INJURIES UNDER MCCD-2012
Sl.
No
Age Group
(In Years)
Age Distribution of Deaths Due to
Poisonings by drugs and
Biological substances and toxic effects of
substances chiefly non-
medicinal as to source
Burns and
Corrosions
Other injuries of
specified,
unspecified and
multiple body regions
1 Below 1 year 0.30 0.39 0.30
2 1-4 0.72 1.21 1.23
3 5-14 2.21 4.63 3.36
4 15-24 20.83 25.56 13.09
5 25-34 22.37 31.88 18.28
6 35-44 17.14 18.13 17.98
7 45-54 15.05 7.07 15.67
8 55-64 9.12 2.93 12.73
9 65-69 2.95 1.24 4.41
10 70 & above 3.16 3.09 8.11
11 Age Not Stated 6.14 3.86 4.83
Total 100.00 100.00 100.00
3.10 Certain Conditions Originating in the Perinatal Period (XVI):
The group of diseases relating to „Certain conditions originating in the Perinatal
Period‟ is the fourth leading cause of death, accounting 9.27 per cent of the total
medically certified deaths. This has contributed to 8.70 per cent of male and 10.29 per
cent of female medically certified deaths. The distribution of major causes of deaths
under this group is shown in the Statement-13 and is portrayed in the Chart-11

26
Statement-13
Distribution of Deaths due to Certain Conditions Originating in the
Perinatal Period Under MCCD-2012
Sl.
No Cause of Death
Male Female Total % To Total
Medically
Certified
Deaths No. % No. % No. %
1
Slow fetal growth,fetal
Malnutrition and
Immaturity
2902 41.86 2021 43.20 4923 42.40 3.93
2
Hypoxia,Birth Asphyxia
and other Respiratory
conditions
2671 38.53 1736 37.11 4407 37.96 3.52
3
All other conditions
originating in the perinatal
period
1314 18.96 901 19.26 2215 19.08 1.77
4 Others 45 0.65 20 0.43 65 0.56 0.05
Total Medically Certified
Deaths due to certain
Conditions Originating in
the Perinatal Period
6932 100.00 4678 100.00 11610 100.00 9.27
Deaths due to certain
Conditions Originating in
the Perinatal Period as
percentage to total
Medically Certified Deaths
8.70 10.29 9.27
Chart – 11
PERCENTAGE DISTRIBUTION OF MEDICALLY CERTIFIED DEATHS DUE
TO CERTAIN CONDITIONS ORIGINATING IN PERINATAL PERIOD –2012
Hypoxia,Birth
Asphyxia and other
Respiratory
conditions,
37.96
All o ther conditions
originating in the
perinatal period,
19.08
Slow fetal growth,fetal
M alnutrition and
Immaturity ,
42.40
Others,
0.56

27
3.11 Diseases of the Respiratory System (X):
The major group of Diseases of Respiratory System is the fifth leading cause,
responsible for 8.03 per cent of the total medically certified deaths. This has contributed
to 8.38 per cent of male and 7.43 per cent of female deaths. The distribution of chief
constituents of the major cause group is given Statement-14 and is presented in
Chart-12.
Statement – 14
Distribution of Deaths due Diseases of Respiratory system Under
MCCD-2012
Sl.No Cause of Death
Male Female Total % To Total
Medically
Certified
Deaths No. % No. % No. %
1 Other Lower Respiratory Disorders 2412 36.12 952 28.17 3364 33.45 2.69
2 Pneumonia 1604 24.02 897 26.54 2501 24.87 2.00
3 All other Diseases of the Respiratory
System 1606 24.05 881 26.07 2487 24.73 1.99
4 Asthma 644 9.64 441 13.05 1085 10.79 0.87
5 Others 412 6.17 209 6.18 621 6.17 0.50
Total Medically Certified Deaths
due to Diseases of Respiratory
System
6678 100.00 3380 100.00 10058 100.00 8.03
Deaths due to Diseases of Respiratory
system as percentage to total
medically certified deaths
8.38 7.43 8.03
Chart – 12 PERCENTAGE DISTRIBUTION OF DEATHS DUE TO DISEASES OF
RESPIRATORY SYSTEM UNDER MCCD – 2012
All other Diseases
of the Respiratory
System,
24.73
Asthma,
10.79
Others,
6.17
Pneumonia,
24.87
Other Low er
Respiratory
Disorders, 33.45

28
3.11.1 „Other lower Respiratory disorders‟, is the leading cause of death, has caused
30 out of every hundred reported deaths under the major cause group. It is followed by
„Pneumonia‟ an inflammatory illness of the lung and also one of the leading cause of
death in this major group constitutes about 24.87 per cent of the deaths. „All other
Diseases of the Respiratory System‟ has caused 24 out of every hundred reported deaths.
The percentage share of Pneumonia to the total medically certified deaths is 2 percent
with the corresponding share of Asthma being 0.87 per cent. The age composition of
deaths due to „Diseases of Respiratory System‟ is presented in Statement-15 and is
highlighted in Chart-13.
Statement – 15
Age Distribution of Deaths due to Diseases of Respiratory system Under
MCCD-2012
Sl.
No Age Group
Male Female Total
No. % No. % No. %
1 Below 1 Year 11 0.16 5 0.15 16 0.16
2 1-4 65 0.97 62 1.83 127 1.26
3 5-14 74 1.11 63 1.86 137 1.36
4 15-24 123 1.84 143 4.23 266 2.64
5 25-34 285 4.27 191 5.65 476 4.73
6 35-44 732 10.96 380 11.24 1112 11.06
7 45-54 1019 15.26 404 11.95 1423 14.15
8 55-64 1270 19.02 514 15.21 1784 17.74
9 65-69 851 12.74 409 12.10 1260 12.53
10 70 & above 1896 28.39 1061 31.39 2957 29.40
11 Age Not Stated 352 5.27 148 4.38 500 4.97
Total 6678 100.00 3380 100.00 10058 100.00
Chart – 13
AGE DISTRIBUTION OF DEATHS DUE TO DISEASES OF RESPIRATORY
SYSTEM UNDER MCCD – 2012
29
3.11.2 The age group ‟70 and above years‟ has reported maximum incidence of deaths
(29.40 per cent) under the major cause group followed by the age group ‟55-64 years‟
with 17.74 per cent of deaths due to „Diseases of Respiratory system‟. The children of
age group 0-4 have contributed to only 1.42 per cent of total deaths, under this major
cause group. The major chunk of deaths under this cause group is concentrated in the age
group ‟45 year and above‟, constituting around 74 per cent of deaths. The percentages of
female deaths aged 34 years and below to total female deaths under this cause group are
on a higher side as compared to corresponding figures for males (i.e. 13.72 per cent for
females compared to 8.35 per cent of males).
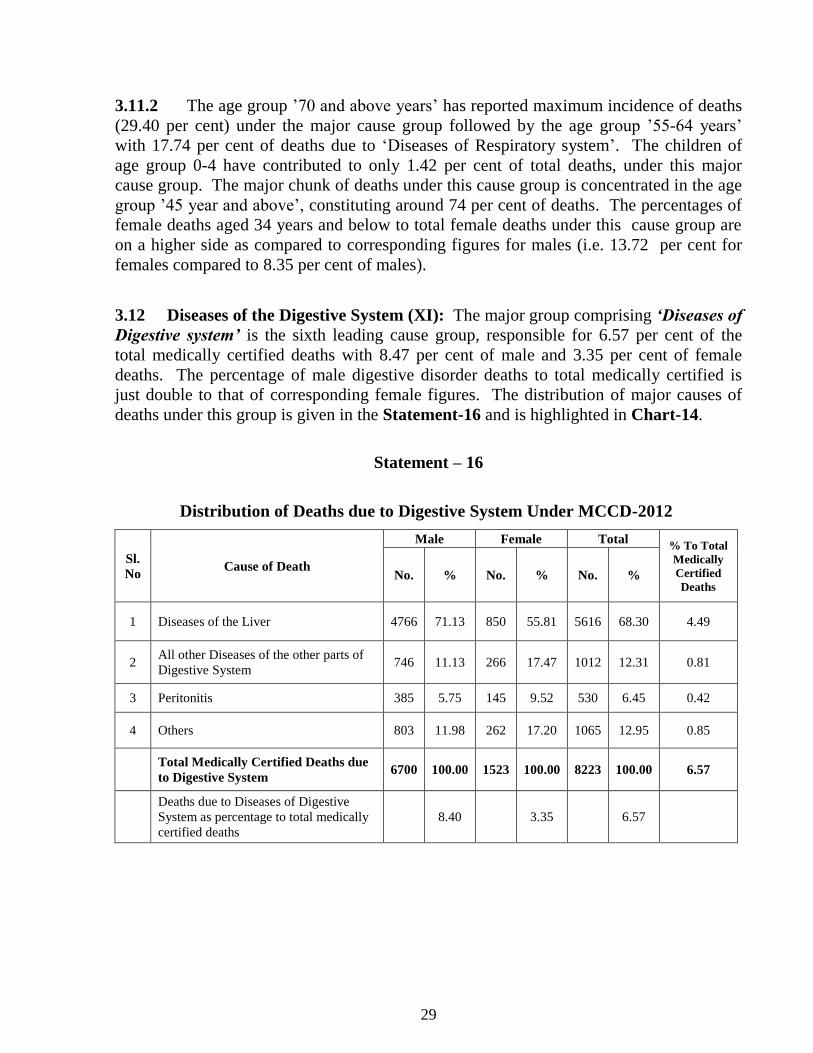
3.12 Diseases of the Digestive System (XI): The major group comprising „Diseases of
Digestive system‟ is the sixth leading cause group, responsible for 6.57 per cent of the
total medically certified deaths with 8.47 per cent of male and 3.35 per cent of female
deaths. The percentage of male digestive disorder deaths to total medically certified is
just double to that of corresponding female figures. The distribution of major causes of
deaths under this group is given in the Statement-16 and is highlighted in Chart-14.
Statement – 16
Distribution of Deaths due to Digestive System Under MCCD-2012
Sl.
No Cause of Death
Male Female Total % To Total
Medically
Certified
Deaths No. % No. % No. %
1 Diseases of the Liver 4766 71.13 850 55.81 5616 68.30 4.49
2 All other Diseases of the other parts of
Digestive System 746 11.13 266 17.47 1012 12.31 0.81
3 Peritonitis 385 5.75 145 9.52 530 6.45 0.42
4 Others 803 11.98 262 17.20 1065 12.95 0.85
Total Medically Certified Deaths due
to Digestive System 6700 100.00 1523 100.00 8223 100.00 6.57
Deaths due to Diseases of Digestive
System as percentage to total medically
certified deaths
8.40 3.35 6.57

30
CHART – 14
PERCENTAGE DISTRIBUTION OF DEATHS DUE TO DIGESTIVE SYSTEM
UNDER MCCD – 2012
All o ther Diseases of
the other parts of
Digestive System,
12.31
Others,
12.95
Diseases of the Liver,
68.30
Peritonitis,
6.45
3.12.1 Among the deaths due to disorders of digestive system, „Diseases of the Liver‟
account for 68.30 per cent of the total medically certified deaths in this group. The share
of liver diseases is about 5 per cent among the total medically certified deaths. „All other
Diseases of the other parts of the Digestive System‟ and „Peritonitis‟ also have
responsible for 12.31 per cent and 6.45 per cent of total deaths under this major cause
group.
3.12.2 The Statement-17 reveals that the age group ‟45-54 years‟ have reported the
maximum deaths (23.39 per cent) under the major group „Diseases of Digestive System‟.
As high as 91.08 per cent of the total deaths caused by digestive system disorder are
concentrated in the age-group 25 years and above. This is highlighted in Chart-15..

31
Statement - 17
Age Distribution of Deaths due to Digestive System Under
MCCD-2012
Sl.
No Age Group
Male Female Total
No. % No. % No. %
1 Below 1 Year 0 0 0 0 0 0
2 1-4 11 0.16 3 0.20 14 0.17
3 5-14 25 0.37 17 1.12 42 0.51
4 15-24 155 2.31 113 7.42 268 3.26
5 25-34 640 9.55 138 9.06 778 9.46
6 35-44 1359 20.28 218 14.31 1577 19.18
7 45-54 1638 24.45 285 18.71 1923 23.39
8 55-64 1359 20.28 299 19.63 1658 20.16
9 65-69 533 7.96 127 8.34 660 8.03
10 70 & above 642 9.58 251 16.48 893 10.86
11 Age Not Stated 338 5.04 72 4.73 410 4.99
Total 6700 100.00 1523 100.00 8223 100.00
CHART - 15
AGE DISTRIBUTION OF DEATHS DUE TO DISEASES OF DIGESTIVE
SYSTEM UNDER MCCD – 2012
32
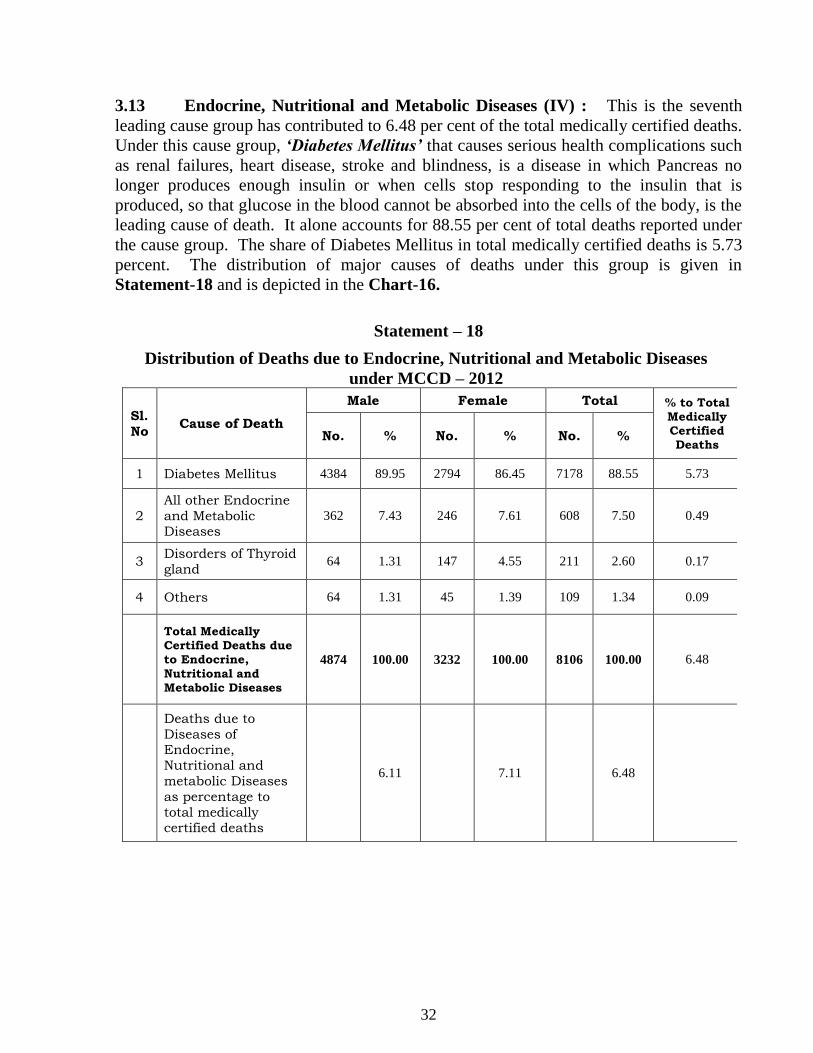
3.13 Endocrine, Nutritional and Metabolic Diseases (IV) : This is the seventh
leading cause group has contributed to 6.48 per cent of the total medically certified deaths.
Under this cause group, „Diabetes Mellitus‟ that causes serious health complications such
as renal failures, heart disease, stroke and blindness, is a disease in which Pancreas no
longer produces enough insulin or when cells stop responding to the insulin that is
produced, so that glucose in the blood cannot be absorbed into the cells of the body, is the
leading cause of death. It alone accounts for 88.55 per cent of total deaths reported under
the cause group. The share of Diabetes Mellitus in total medically certified deaths is 5.73
percent. The distribution of major causes of deaths under this group is given in
Statement-18 and is depicted in the Chart-16.
Statement – 18
Distribution of Deaths due to Endocrine, Nutritional and Metabolic Diseases
under MCCD – 2012
Sl.
No Cause of Death
Male Female Total % to Total Medically Certified Deaths
No. % No. % No. %
1 Diabetes Mellitus 4384 89.95 2794 86.45 7178 88.55 5.73
2
All other Endocrine
and Metabolic Diseases
362 7.43 246 7.61 608 7.50 0.49
3 Disorders of Thyroid
gland 64 1.31 147 4.55 211 2.60 0.17
4 Others 64 1.31 45 1.39 109 1.34 0.09
Total Medically Certified Deaths due to Endocrine,
Nutritional and Metabolic Diseases
4874 100.00 3232 100.00 8106 100.00 6.48
Deaths due to
Diseases of Endocrine,
Nutritional and
metabolic Diseases
as percentage to
total medically certified deaths
6.11 7.11 6.48

33
Chart – 16
PERCENTAGE DISTRIBUTION OF DEATHS DUE TO ENDOCRINE,
NUTRITIONAL AND METABOLIC DISEASES UNDER MCCD – 2012
All o ther
Endocrine and
M etabolic
Diseases, 7.50
Disorders of
Thyroid gland,
2.60
Others,
1.34
Diabetes M ellitus,
88.55
3.13.1 The incidence of „Diabetes Mellitus‟ death is reported to be the highest for the
age group 70 and above (37.32 per cent). The Statement-19 reveals that the deaths due
to this disease are concentrated in the age 45 years and above, contributing around 87 per
cent of the total Diabetes Mellitus deaths under MCCD.
Statement – 19
Age Distribution of Deaths Due to Diabetes Mellitus Under MCCD – 2012
Sl.
No Age Group
Male Female Total
No. % No. % No. %
1 Below 1 year 0 0 0 0 0 0
2 1-4 0 0 0 0 0 0
3 5-14 0 0 0 0 0 0
4 15-24 16 0.36 19 0.68 35 0.49
5 25-34 64 1.46 30 1.07 94 1.31
6 35-44 294 6.71 154 5.51 448 6.24
7 45-54 579 13.21 311 11.13 890 12.40
8 55-64 954 21.76 573 20.51 1527 21.27
9 65-69 672 15.33 444 15.89 1116 15.55
10 70 & above 1566 35.72 1113 39.84 2679 37.32
11 Age Not Stated 239 5.45 150 5.37 389 5.42
Total 4384 100.00 2794 100.00 7178 100.00

34
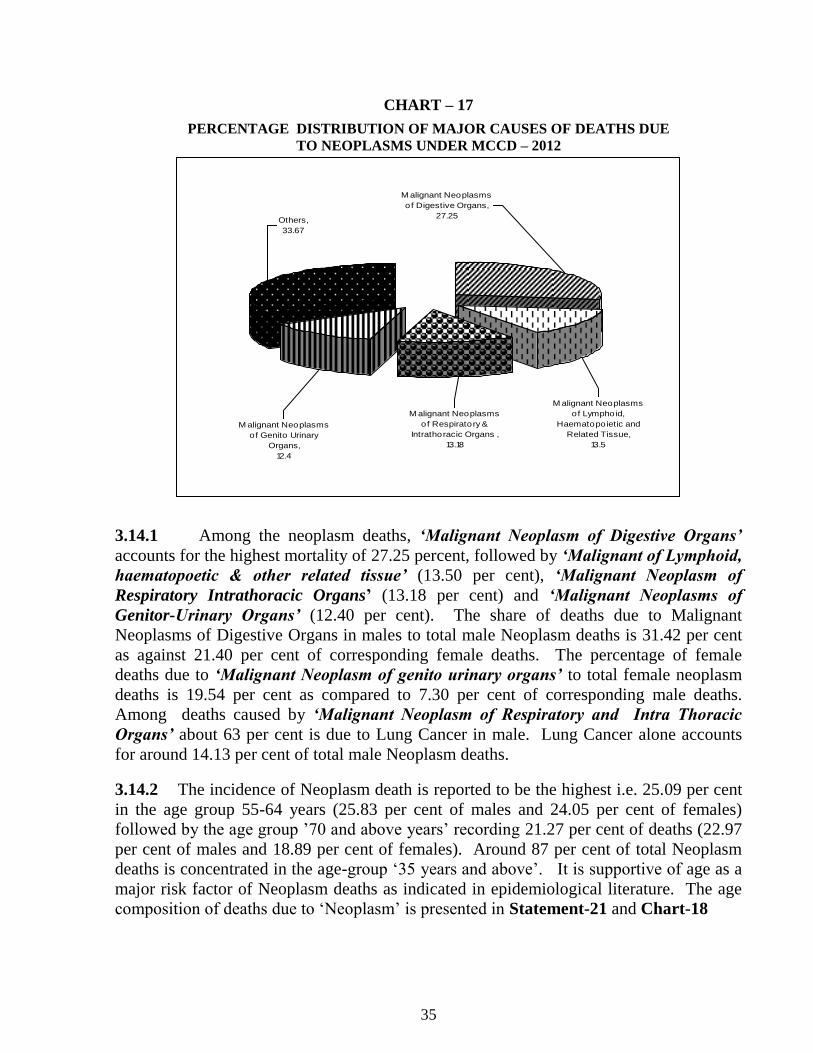
3.14. Neoplasms (II) : The eighth leading cause, Neoplasm, which is commonly
known as Cancer, is responsible for 6.22 per cent of the total medically certified deaths.
The share of deaths due to Neoplasms in total female deaths is 7.12 per cent as compared
to the corresponding figure of 5.70 per cent in case of males. Among total female
medically certified deaths, it is the seventh leading cause of death. The distribution of
major causes of deaths under the group is given in the Statement-20 and depicted in
Chart-17.
Statement- 20
Distribution of Major Causes of Deaths Due to Neoplasms under MCCD–2012
Sl.
No Cause of Death
Male Female Total % to Total Medically Certified Deaths No. % No. % No. %
1 Malignant Neoplasms of
Digestive Organs 1428 31.42 693 21.4 2121 27.25 1.69
2 Malignant Neoplasms of Lymphoid, Haematopoietic
and Related Tissue 680 14.96 371 11.45 1051 13.5 0.84
3
Malignant Neoplasms of
Respiratory &
Intrathoracic Organs 808 17.78 218 6.73 1026 13.18 0.82
4 Malignant Neoplasms of
Genito Urinary Organs 332 7.3 633 19.54 965 12.4 0.77
5 Others 1297 28.54 1324 40.88 2621 33.67 2.09
Total Medically Certified
Deaths due to Neoplasms 4545 100 3239 100 7784 100 6.22
Deaths due to Neoplasms as percentage to total
Medically Certified Deaths 5.7 7.12 6.22
35
CHART – 17
PERCENTAGE DISTRIBUTION OF MAJOR CAUSES OF DEATHS DUE
TO NEOPLASMS UNDER MCCD – 2012
M alignant Neoplasms
of Respiratory &
Intrathoracic Organs ,
13.18
M alignant Neoplasms
of Lymphoid,
Haematopoietic and
Related Tissue,
13.5
M alignant Neoplasms
of Digestive Organs,
27.25Others,
33.67
M alignant Neoplasms
of Genito Urinary
Organs,
12.4
3.14.1 Among the neoplasm deaths, „Malignant Neoplasm of Digestive Organs‟
accounts for the highest mortality of 27.25 percent, followed by „Malignant of Lymphoid,
haematopoetic & other related tissue‟ (13.50 per cent), „Malignant Neoplasm of
Respiratory Intrathoracic Organs‟ (13.18 per cent) and „Malignant Neoplasms of
Genitor-Urinary Organs‟ (12.40 per cent). The share of deaths due to Malignant
Neoplasms of Digestive Organs in males to total male Neoplasm deaths is 31.42 per cent
as against 21.40 per cent of corresponding female deaths. The percentage of female
deaths due to „Malignant Neoplasm of genito urinary organs‟ to total female neoplasm
deaths is 19.54 per cent as compared to 7.30 per cent of corresponding male deaths.
Among deaths caused by „Malignant Neoplasm of Respiratory and Intra Thoracic
Organs‟ about 63 per cent is due to Lung Cancer in male. Lung Cancer alone accounts
for around 14.13 per cent of total male Neoplasm deaths.
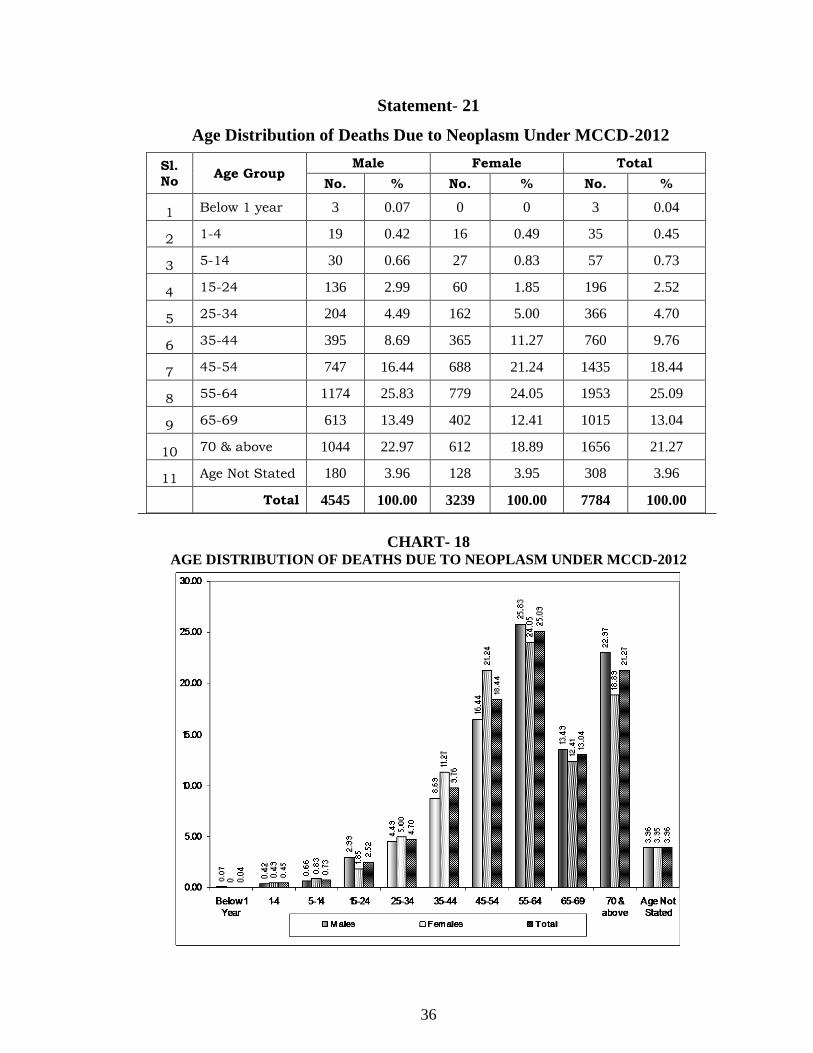
3.14.2 The incidence of Neoplasm death is reported to be the highest i.e. 25.09 per cent
in the age group 55-64 years (25.83 per cent of males and 24.05 per cent of females)
followed by the age group ‟70 and above years‟ recording 21.27 per cent of deaths (22.97
per cent of males and 18.89 per cent of females). Around 87 per cent of total Neoplasm
deaths is concentrated in the age-group „35 years and above‟. It is supportive of age as a
major risk factor of Neoplasm deaths as indicated in epidemiological literature. The age
composition of deaths due to „Neoplasm‟ is presented in Statement-21 and Chart-18
36
Statement- 21
Age Distribution of Deaths Due to Neoplasm Under MCCD-2012
Sl.
No Age Group
Male Female Total
No. % No. % No. %
1 Below 1 year 3 0.07 0 0 3 0.04
2 1-4 19 0.42 16 0.49 35 0.45
3 5-14 30 0.66 27 0.83 57 0.73
4 15-24 136 2.99 60 1.85 196 2.52
5 25-34 204 4.49 162 5.00 366 4.70
6 35-44 395 8.69 365 11.27 760 9.76
7 45-54 747 16.44 688 21.24 1435 18.44
8 55-64 1174 25.83 779 24.05 1953 25.09
9 65-69 613 13.49 402 12.41 1015 13.04
10 70 & above 1044 22.97 612 18.89 1656 21.27
11 Age Not Stated 180 3.96 128 3.95 308 3.96
Total 4545 100.00 3239 100.00 7784 100.00
CHART- 18 AGE DISTRIBUTION OF DEATHS DUE TO NEOPLASM UNDER MCCD-2012
37
Other causes of Death
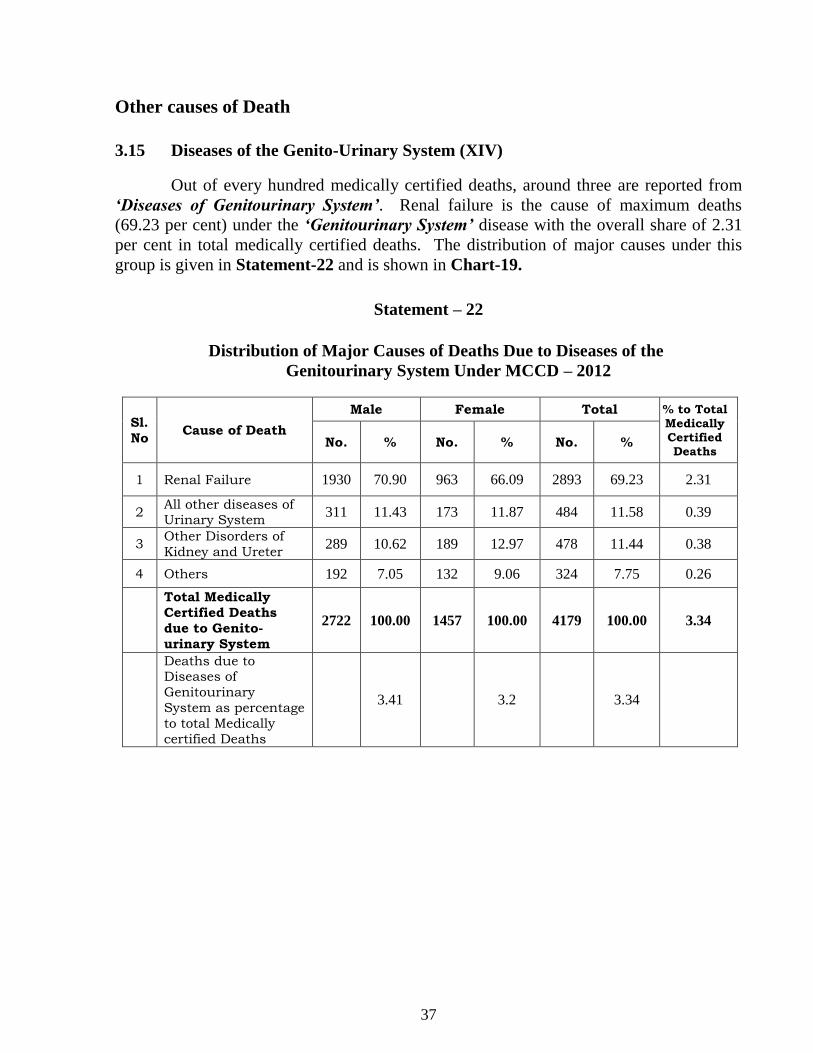
3.15 Diseases of the Genito-Urinary System (XIV)
Out of every hundred medically certified deaths, around three are reported from
„Diseases of Genitourinary System‟. Renal failure is the cause of maximum deaths
(69.23 per cent) under the „Genitourinary System‟ disease with the overall share of 2.31
per cent in total medically certified deaths. The distribution of major causes under this
group is given in Statement-22 and is shown in Chart-19.
Statement – 22
Distribution of Major Causes of Deaths Due to Diseases of the
Genitourinary System Under MCCD – 2012
Sl.
No Cause of Death
Male Female Total % to Total Medically Certified Deaths
No. % No. % No. %
1 Renal Failure 1930 70.90 963 66.09 2893 69.23 2.31
2 All other diseases of Urinary System
311 11.43 173 11.87 484 11.58 0.39
3 Other Disorders of
Kidney and Ureter 289 10.62 189 12.97 478 11.44 0.38
4 Others 192 7.05 132 9.06 324 7.75 0.26
Total Medically
Certified Deaths
due to Genito-
urinary System
2722 100.00 1457 100.00 4179 100.00 3.34
Deaths due to Diseases of
Genitourinary
System as percentage
to total Medically
certified Deaths
3.41 3.2 3.34

38
CHART – 19
PERCENTAGE DISTRIBUTION OF MAJOR CAUSES OF DEATHS DUE TO
DISEASES OF THE GENITOURINARY SYSTEM UNDER MCCD – 2012
Other Disorders of
Kidney and Ureter,
11.58
All other diseases of
Urinary System,
11.44 Others,
7.75
Renal Failure,
69.23
3.15.1 The incidence of „Renal failure‟ death is reported to be, the highest for the age
„70 and above years’ (23.75 per cent). The Statement-23 reveals that the deaths due to
this disease are concentrated in the age 45 years and above, contributing around 80 per
cent of total deaths reported under MCCD due to renal failure.
Statement – 23
Age Distribution of Deaths Due to Renal Failure Under MCCD-2012
Sl.
No Age Group
Male Female Total
No. % No. % No. %
1 Below 1 year 0 0 0 0 0 0
2 1-4 0 0 0 0 0 0
3 5-14 0 0 0 0 0 0
4 15-24 0 0 0 0 0 0
5 25-34 95 4.92 63 6.54 158 5.46
6 35-44 215 11.14 99 10.28 314 10.85
7 45-54 340 17.62 164 17.03 504 17.42
8 55-64 425 22.02 213 22.12 638 22.05
9 65-69 321 16.63 153 15.89 474 16.38
10 70 & above 452 23.42 235 24.40 687 23.75
11 Age Not stated 82 4.25 36 3.74 118 4.08
Total 1930 100.00 963 100.00 2893 100.00
39
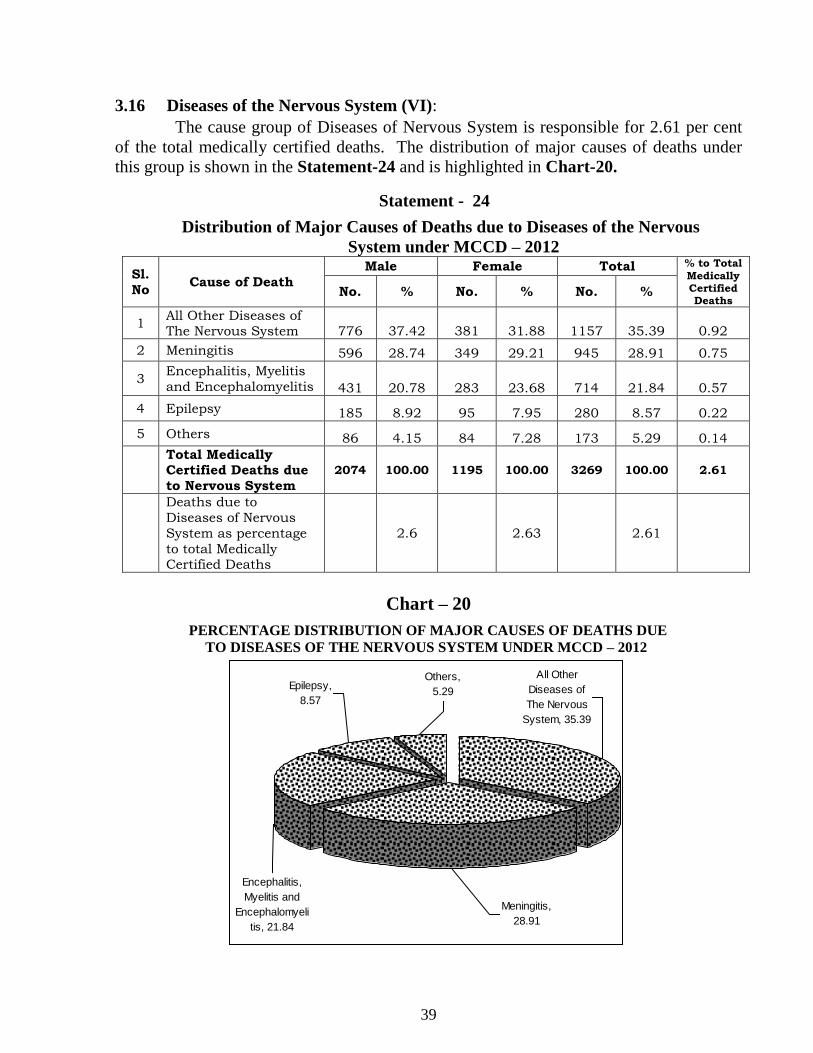
3.16 Diseases of the Nervous System (VI):
The cause group of Diseases of Nervous System is responsible for 2.61 per cent
of the total medically certified deaths. The distribution of major causes of deaths under
this group is shown in the Statement-24 and is highlighted in Chart-20.
Statement - 24
Distribution of Major Causes of Deaths due to Diseases of the Nervous
System under MCCD – 2012
Sl.
No Cause of Death
Male Female Total % to Total
Medically Certified Deaths
No. % No. % No. %
1 All Other Diseases of The Nervous System 776 37.42 381 31.88 1157 35.39 0.92
2 Meningitis 596 28.74 349 29.21 945 28.91 0.75
3 Encephalitis, Myelitis
and Encephalomyelitis 431 20.78 283 23.68 714 21.84 0.57
4 Epilepsy 185 8.92 95 7.95 280 8.57 0.22
5 Others 86 4.15 84 7.28 173 5.29 0.14
Total Medically Certified Deaths due
to Nervous System
2074 100.00 1195 100.00 3269 100.00 2.61
Deaths due to
Diseases of Nervous
System as percentage
to total Medically Certified Deaths
2.6 2.63 2.61
Chart – 20
PERCENTAGE DISTRIBUTION OF MAJOR CAUSES OF DEATHS DUE
TO DISEASES OF THE NERVOUS SYSTEM UNDER MCCD – 2012
Encephalitis,
Myelitis and
Encephalomyeli
tis, 21.84
Meningitis,
28.91
All Other
Diseases of
The Nervous
System, 35.39
Others,
5.29Epilepsy,
8.57

40
„All other Diseases of the Nervous System‟ accounts for the maximum (35.39 per
cent) deaths reported under this group, followed by „Meningitis‟ (28.91 per cent) and
„Encephalitis Myelitis and Encephalomyelitis‟ (21.84 per cent). The share of
„Meningitis‟ in the total medically certified deaths is about 0.75 per cent.
3.16.1 The age group ‟70 & above‟ has reported the maximum deaths (13.58 per cent)
under the major group „Diseases of the Nervous System‟, this is followed by age groups
55-64 and 35.44 years have share equal percentage (11.35 per cent). Viewed from the
angle of age, it affects worstly the age group below 1 year (9.3 per cent). The distribution
of age-wise deaths is depicted in Statement-25 and Chart-21.
Statement – 25 Agewise Distribution of Deaths Due to Diseases of the Nervous System
Under MCCD-2012
Sl.No Age Group Male Female Total
No. % No. % No. %
1 Below 1 Year 184 8.87 120 10.04 304 9.3
2 1-4 151 7.28 102 8.54 253 7.74
3 5-14 146 7.04 115 9.62 261 7.98
4 15-24 174 8.39 146 12.22 320 9.79
5 25-34 174 8.39 79 6.61 253 7.74
6 35-44 249 12.01 122 10.21 371 11.35
7 45-54 213 10.27 107 8.95 320 9.79
8 55-64 260 12.54 111 9.29 371 11.35
9 65-69 148 7.14 84 7.03 232 7.10
10 70 & above 276 13.31 168 14.06 444 13.58
11 Age Not Stated 99 4.77 41 3.43 140 4.28
Total 2074 100.00 1195 100.00 3269 100.00
Chart- 21
AGE DISTRIBUTION OF DEATHS DUE TO DISEASES OF THE
NERVOUS SYSTEM UNDR MCCD – 2012

41
3.17 Diseases of the Blood and Blood Forming Organs and Certain Disorders
involving the Immune Mechanism (III):
The diseases under this cause group have contributed to 1.61 per cent of the total
medically certified deaths. This cause group accounts for 1.40 per cent of total male and
1.96 per cent of total female medically certified deaths. “Other Anaemias” is the major
cause constitutes around 80 per cent of total deaths reported in the cause group and 1.29
per cent of the total medically certified deaths. The distribution of major causes of deaths
under this group is presented in Statement-26.
Statement-26
Distribution of Major Causes of Deaths due to Diseases of the Blood and Blood
forming organs and Certain Disorders involving the Immune Mechanism Under
MCCD-2012
Sl.
No Cause of Death
Male Female Total % To Total
Medically
Certified
Deaths No. % No. % No. %
1 Other Anaemias 884 78.93 727 81.41 1611 80.03 1.29
2 Others 236 21.07 166 18.59 402 19.97 0.32
Total Medically Certified
Deaths due to Blood and Blood
forming organs and Immunity
Mechanism
1120 100.00 893 100.00 2013 100.00 1.61
Deaths due to Diseases of Blood
and Blood forming organs and
Immunity Mechanism as
percentage to total medically
certified deaths
1.4 1.96 1.61
3.18 Congenital Malformations, Deformations and Chromosomal
Abnormalities (XVII)
Merely 1618 deaths are reportedly caused by „Congenital Malformations,
deformations and Chromosomal abnormalities‟, constituting about 1.29 per cent of the
total medically certified deaths. The majority of these deaths occur for age less than one
year (1105 or 67.87 per cent). Under this cause group, about 56.89 per cent deaths are
caused by malformation of various Circulatory System.

42
Statement – 27
Distribution of Deaths due to 'Congenital Malformations, Deformations
and Chromosomal Abnormalities‟ under MCCD – 2012
Sl.
No Cause of Death
Age Group (In years)
Percentage
to total <1
1 year and above
(Including age not
specified)
Total
1 Spina Bifida 25 5 30 1.85
2 Congenital Malformations of
the Circulatory System 675 246 921 56.89
3
All other Congenital
Malformations, Deformations
& Chromosomal
Abnormalities
405 263 668 41.26
Total 1105 514 1619
Percentage to Total 66.25 31.75 100.00
3.19. Symptoms, Signs and Abnormal Clinical & Laboratory Findings,
not elsewhere classified (N.E.C) (XVIII).
This leading major cause group responsible for 0.99 per cent of the total
medically certified deaths of which 0.99 per cent of males and 0.98 per cent of female
death. The high prevalence of causes of death being reported under this cause from the
hospitals reporting Medical Certification of Cause of Death data, clearly suggests about
the deficiency in clarification especially improper classification of causes of deaths by the
attending doctors. As depicted in the Statement-28. “All other Symptoms, Signs and
Abnormal Clinical & Laboratory Findings Not Elsewhere Classified” accounted for
0.63 per cent of the total deaths in this group.
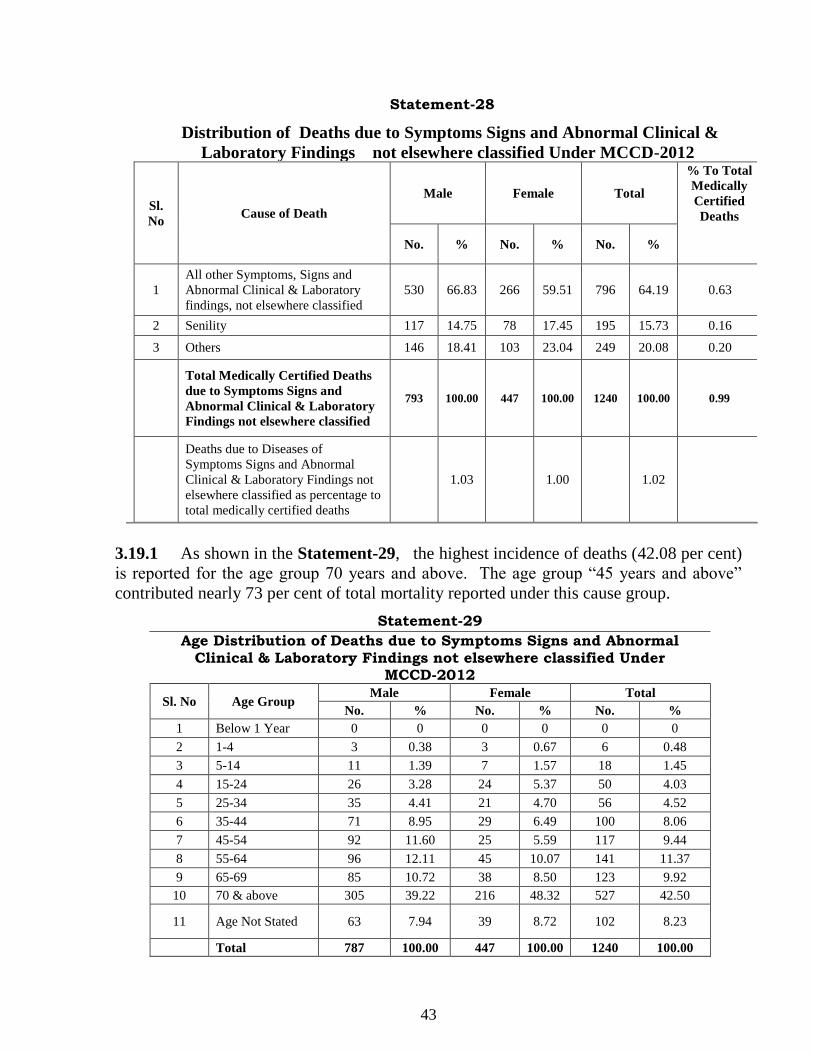
43
Statement-28
Distribution of Deaths due to Symptoms Signs and Abnormal Clinical &
Laboratory Findings not elsewhere classified Under MCCD-2012
Sl.
No Cause of Death
Male Female Total
% To Total
Medically
Certified
Deaths
No. % No. % No. %
1
All other Symptoms, Signs and
Abnormal Clinical & Laboratory
findings, not elsewhere classified
530 66.83 266 59.51 796 64.19 0.63
2 Senility 117 14.75 78 17.45 195 15.73 0.16
3 Others 146 18.41 103 23.04 249 20.08 0.20
Total Medically Certified Deaths
due to Symptoms Signs and
Abnormal Clinical & Laboratory
Findings not elsewhere classified
793 100.00 447 100.00 1240 100.00 0.99
Deaths due to Diseases of
Symptoms Signs and Abnormal
Clinical & Laboratory Findings not
elsewhere classified as percentage to
total medically certified deaths
1.03 1.00 1.02
3.19.1 As shown in the Statement-29, the highest incidence of deaths (42.08 per cent)
is reported for the age group 70 years and above. The age group “45 years and above”
contributed nearly 73 per cent of total mortality reported under this cause group.
Statement-29
Age Distribution of Deaths due to Symptoms Signs and Abnormal Clinical & Laboratory Findings not elsewhere classified Under
MCCD-2012
Sl. No Age Group Male Female Total
No. % No. % No. %
1 Below 1 Year 0 0 0 0 0 0
2 1-4 3 0.38 3 0.67 6 0.48
3 5-14 11 1.39 7 1.57 18 1.45
4 15-24 26 3.28 24 5.37 50 4.03
5 25-34 35 4.41 21 4.70 56 4.52
6 35-44 71 8.95 29 6.49 100 8.06
7 45-54 92 11.60 25 5.59 117 9.44
8 55-64 96 12.11 45 10.07 141 11.37
9 65-69 85 10.72 38 8.50 123 9.92
10 70 & above 305 39.22 216 48.32 527 42.50
11 Age Not Stated 63 7.94 39 8.72 102 8.23
Total 787 100.00 447 100.00 1240 100.00
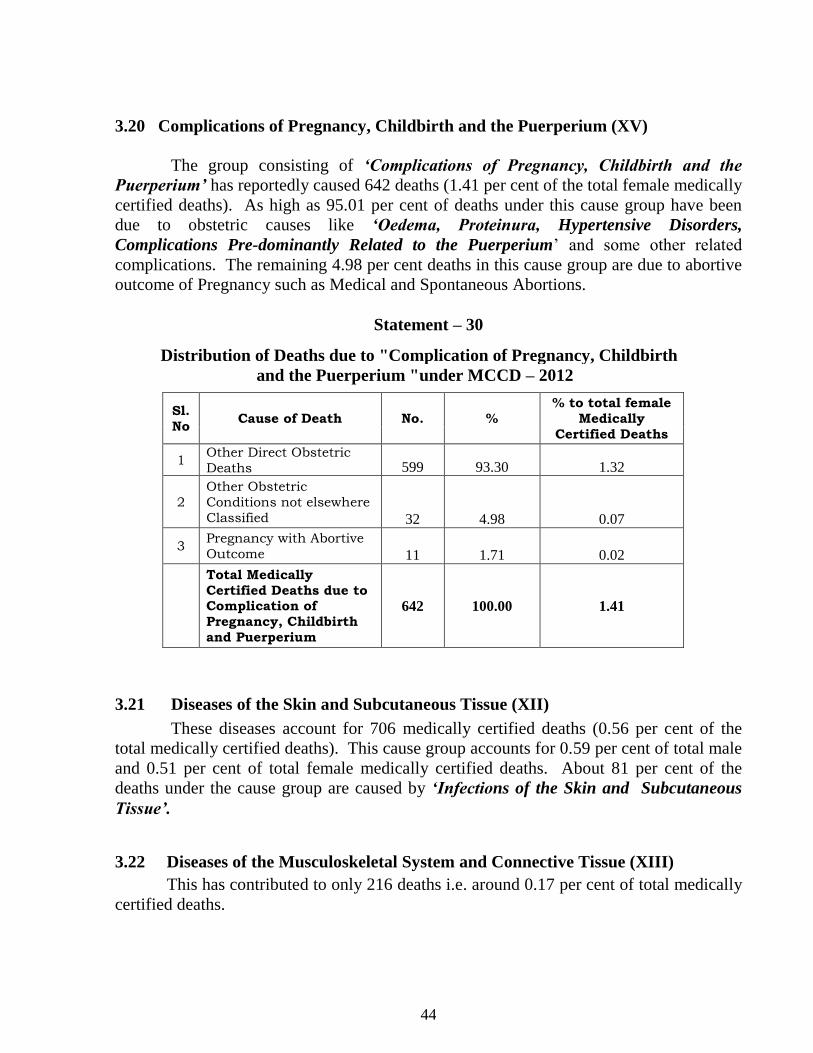
44
3.20 Complications of Pregnancy, Childbirth and the Puerperium (XV)
The group consisting of „Complications of Pregnancy, Childbirth and the
Puerperium‟ has reportedly caused 642 deaths (1.41 per cent of the total female medically
certified deaths). As high as 95.01 per cent of deaths under this cause group have been
due to obstetric causes like „Oedema, Proteinura, Hypertensive Disorders,
Complications Pre-dominantly Related to the Puerperium‟ and some other related
complications. The remaining 4.98 per cent deaths in this cause group are due to abortive
outcome of Pregnancy such as Medical and Spontaneous Abortions.
Statement – 30
Distribution of Deaths due to "Complication of Pregnancy, Childbirth
and the Puerperium "under MCCD – 2012
Sl.
No Cause of Death No. %
% to total female
Medically
Certified Deaths
1 Other Direct Obstetric
Deaths 599 93.30 1.32
2
Other Obstetric
Conditions not elsewhere
Classified 32 4.98 0.07
3 Pregnancy with Abortive
Outcome 11 1.71 0.02
Total Medically
Certified Deaths due to Complication of
Pregnancy, Childbirth
and Puerperium
642 100.00 1.41
3.21 Diseases of the Skin and Subcutaneous Tissue (XII)
These diseases account for 706 medically certified deaths (0.56 per cent of the
total medically certified deaths). This cause group accounts for 0.59 per cent of total male
and 0.51 per cent of total female medically certified deaths. About 81 per cent of the
deaths under the cause group are caused by „Infections of the Skin and Subcutaneous
Tissue‟.
3.22 Diseases of the Musculoskeletal System and Connective Tissue (XIII)
This has contributed to only 216 deaths i.e. around 0.17 per cent of total medically
certified deaths.

45
3.23 Mental and Behavioural Disorders (V)
The group relating to Mental and Behavioural disorders accounts for 125 deaths
(0.10 per cent of total medically certified deaths). The age group 25-64 years constitutes
around 87 per cent of total deaths due to „Mental and Behavioural Disorders‟. Under
this cause group, the deaths due to “Schizophrenia, Schizotypal & Delusional Disorders”
constitutes the highest share (25.6 per cent) of total deaths. The ratio of males to females
was disproportionate in this group (101 males to 24 females). The distribution of major
causes of deaths under this group is presented in Statement-31.
Statement – 31
Distribution of Deaths due to 'Mental and Behavioural Disorders'
under MCCD – 2012
Sl.
No Cause of Death
Age Group % to
Total <15 15-24 25-34 35-44 45-54 55-64 Others Total
1
Schizophrenia, Schizotypal &
Delusional
Disorders
0 2 6 28 23 12 8 79 63.2
2
Mental And Behavioural
Disorders due to
Psychoactive
Substance use
0 3 5 4 8 4 8 32 25.6
3
All Other Mental
Behavioural Disorders
1 0 1 2 4 3 3 14 11.2
Total 1 5 12 34 35 19 19 125 100.00
Percentage to
total 0.80 4.00 9.60 27.20 28.00 15.20 15.20 100.00
3.24 The least harmful major causes are Diseases of the Eye and Adnexa (VII) and
Diseases of the Ear and Mastoid Process (VIII). No significant mortality is reported due
to these causes. They are reporting merely 6 and 3 deaths from each group respectively.
CHAPTER CHAPTER CHAPTER CHAPTER ---- IIIIVVVV
SCHEME OF MCCD :SCHEME OF MCCD :SCHEME OF MCCD :SCHEME OF MCCD :
SSSSPECIFIC CAUSE OFPECIFIC CAUSE OFPECIFIC CAUSE OFPECIFIC CAUSE OF MORTALITY MORTALITY MORTALITY MORTALITY
IN DIFFERENT AGE GROUPS IN DIFFERENT AGE GROUPS IN DIFFERENT AGE GROUPS IN DIFFERENT AGE GROUPS

46
CHAPTER- IV
SPECIFIC CAUSE OF MORTALITY IN DIFFERENT
AGE GROUPS
This chapter analyses the specific cause of mortality among different age groups by
gender.
4.1. Infants: Out of the total medically certified deaths, around one-tenth has been
reported for the Infants (children who could not complete their first birthday). The
shares of male and female deaths to the corresponding totals of medically certified deaths
are 9.99 per cent and 11.95 per cent respectively. The maximum incidence of death under
this age group (86.65 per cent) has been reported to be caused by „Certain conditions
originating in the perinatal period‟, which includes diseases Slow Fetal Growth, Fetal
Malnutrition and Immaturity, Hypoxia, Birth Asphyxia and other Respiratory
Conditions (80.36 per cent). This is followed by „Congenital Malformations,
Deformations & Chromosomal Abnormalities‟ (8.25 per cent) of which Congenital
Malformations of the Circulatory System (61.08 per cent) is the major constituent.
„Diseases of the Nervous System‟ which contribute to about 2.27 per cent of the total
infant deaths, assume third rank, having Meningitis (60.20 per cent) as the major killers.
The distribution of mortality among infants by major cause groups has been given in
Statement-32 and is highlighted in Chart -22.
Statement – 32
Distribution of Mortality among Infants by Major Cause Group
Sl.No
Major Cause Group Male Female Total
No. % No. % No. %
1 Certain Conditions Originating in the Perinatal
Period (P00-P96)
6932 87.06 4678 86.06 11610 86.65
2
Congenital Malformations,
Deformations & Chromosomal
Abnormalities(Q00-Q99)
647 8.13 458 8.43 1105 8.25
3 Diseases of the Nervous
System(G00-G98) 184 2.31 120 2.21 304 2.27
4 Certain Infectious and
Parasitic Diseases (A00-B99) 171 2.15 131 2.41 302 2.25
5 Other Major Groups 28 0.35 49 0.9 77 0.57
Total Medically Certified
Deaths in the age group
< 1 year
7962 100.00 5436 100.00 13398 100.00
Deaths in the age group <1 year as percentage to total
Medically certified Deaths
9.99 11.96 10.70

47
Chart – 22
PERCENTAGE DISTRIBUTION OF MORTALITY AMONG INFANTS
BY MAJOR CAUSE GROUP
Congenital
Malformations,Defor
mations &
Chromosomal
Abnormalities(Q00-
Q99), 8.25
Certain Conditions
Originating in the
Perinatal Period
(P00-P96),
86.65
Other Major Groups,
0.57
Certain Infectious and
Parasitic Diseases
(A00-B99), 2.25
Diseases of the
Nervous System
(G00-G98),
2.27
4.2 Children aged 1-4 year: Of the total medically certified deaths, 1.16 per cent has
been reported from this age-group, accounting for 1.10 per cent and 1.43 per cent of total
male and female medically certified deaths respectively. „Certain infectious and Parasitic
Diseases‟ rank first, constituting 32.46 per cent of total medically certified deaths in the
age group under which Other Arthopod Born Viral Fevers and Viral Haemorrhagic
fevers (19.87 per cent), Diarrhoea and Gastro enteritis of Presumed Infectious Origin
(15.43 per cent) and Septicaemia (14.16 per cent) are the major constituents.. Congenital
Malformations, Deformations and Chromosomal Abnormalities is the second leading
cause contribute around 17.71 per cent of total medically certified deaths in the age group.
Congenital Malformations of the Circulatory System is the leading cause contribute
around 50 per cent of the deaths in Congenital Abnormalities group. The third leading
cause group of deaths, „Diseases of the Nervous System‟ is responsible for 17.36 per cent
of deaths in this age group. „Meningitis‟ have taken about 43.08 per cent of the total
deaths under this cause group. The distribution of mortality in the age group 1-4 years by
major cause group has been given in Statement -33 and Chart 23.
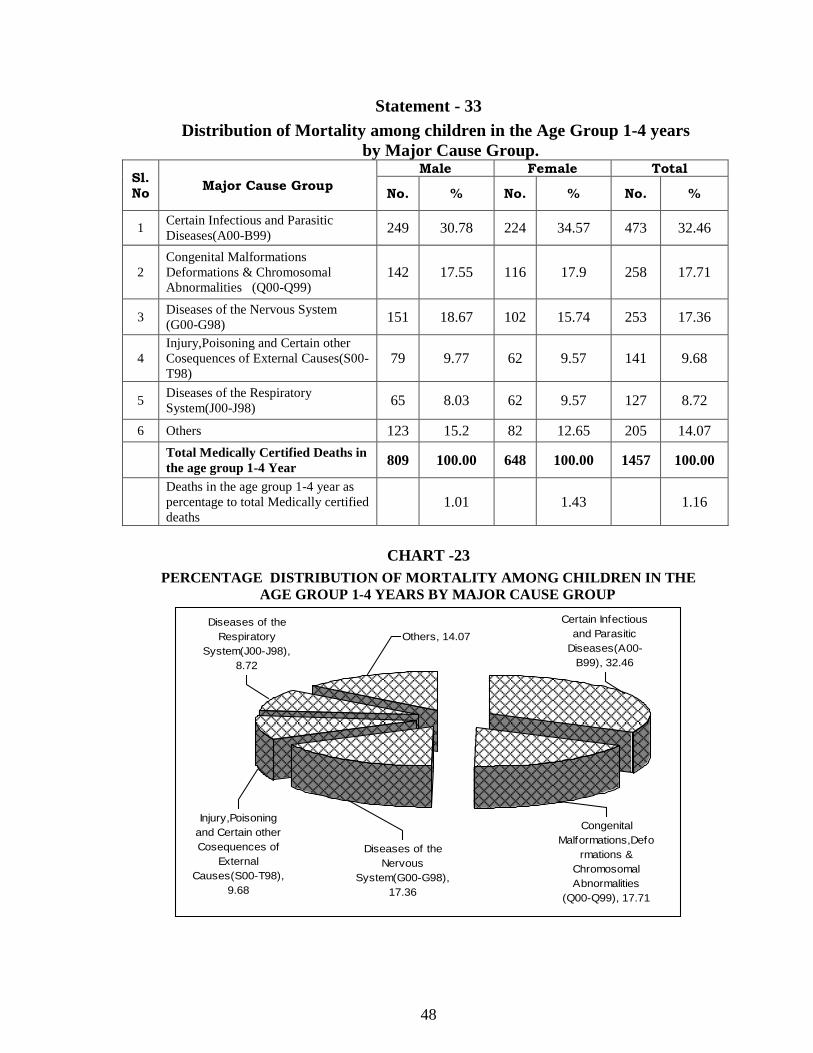
48
Statement - 33
Distribution of Mortality among children in the Age Group 1-4 years
by Major Cause Group.
Sl. No
Major Cause Group
Male Female Total
No. % No. % No. %
1 Certain Infectious and Parasitic
Diseases(A00-B99) 249 30.78 224 34.57 473 32.46
2
Congenital Malformations
Deformations & Chromosomal
Abnormalities (Q00-Q99) 142 17.55 116 17.9 258 17.71
3 Diseases of the Nervous System
(G00-G98) 151 18.67 102 15.74 253 17.36
4
Injury,Poisoning and Certain other
Cosequences of External Causes(S00-
T98) 79 9.77 62 9.57 141 9.68
5 Diseases of the Respiratory
System(J00-J98) 65 8.03 62 9.57 127 8.72
6 Others 123 15.2 82 12.65 205 14.07
Total Medically Certified Deaths in
the age group 1-4 Year 809 100.00 648 100.00 1457 100.00
Deaths in the age group 1-4 year as
percentage to total Medically certified
deaths 1.01 1.43 1.16
CHART -23
PERCENTAGE DISTRIBUTION OF MORTALITY AMONG CHILDREN IN THE
AGE GROUP 1-4 YEARS BY MAJOR CAUSE GROUP
Injury,Poisoning
and Certain other
Cosequences of
External
Causes(S00-T98),
9.68
Diseases of the
Nervous
System(G00-G98),
17.36
Diseases of the
Respiratory
System(J00-J98),
8.72
Others, 14.07
Congenital
Malformations,Defo
rmations &
Chromosomal
Abnormalities
(Q00-Q99), 17.71
Certain Infectious
and Parasitic
Diseases(A00-
B99), 32.46

49
4.3 Children aged 5-14 years: The share of this age group in the total medically
certified deaths is 1.59 per cent, constituting 1.37 per cent and 1.98 per cent of total male
and female medically certified deaths respectively. Of the total reported deaths under this
age group, the share of „Certain infectious and Parasitic Diseases‟ is 29.29 per cent
followed by Injury, Poisoning and Certain other Consequences of External Causes
(21.66 per cent), Diseases of the Nervous System (13.09 per cent), Congenital
Malformation, Deformation & Chromosomal Abnormalities (9.53 per cent) and
Diseases of Respiratory System (6.87 per cent). The Distribution of mortality in the age
group 5-14 years, by major cause groups is given in Statement- 34 and Chart - 24.
Statement – 34
Distribution of Mortality among children in the Age Group 5-14 years
by Major Cause Groups
Sl.No Major Cause Group Male Female Total
No. % No. % No. %
1 Certain Infectious and Parasitic
Diseases(A00-B99) 303 27.67 281 31.26 584 29.29
2
Injury, Poisoning and Certain other
Consequences of External
Causes(S00-T98)
242 22.1 190 21.13 432 21.66
3 Diseases of the Nervous system(G00-
G98) 146 13.33 115 12.79 261 13.09
4
Congenital Malformations,
Deformations & Chromosomal
Abnormalities(Q00-Q99) 118 10.78 72 8.01 190 9.53
5 Diseases of the Respiratory
System(J00-J98) 74 6.76 63 7.01 137 6.87
6
Diseases of the Blood & Blood
Forming Organs and Certain
Disorders Involving the Immune
Mechanism(D50-D89)
71 6.48 56 6.23 127 6.37
7 Diseases of the Circulatory
System(I00-I99) 61 5.57 55 6.12 116 5.82
8 Other Major Groups 80 7.31 67 7.45 147 7.37
Total Medically Certified Deaths in
the age group 5-14 Year 1095 100 899 100 1994 100
Deaths in the age group 5-14 year as
percentage to total Medically certified
deaths
1.37 1.98 1.59

50
CHART – 24
PERCENTAGE DISTRIBUTION OF MORTALITY AMONG CHILDREN IN
THE AGE GROUP 5-14 YEARS BY MAJOR CAUSE GROUPS
Diseases of the Blood &
Blood Forming Organs
and Certain Disorders
Involving the Immune
M echanism(D50-D89),
6.37
Diseases of the
Respiratory System(J00-
J98), 6.87
Diseases of the
Circulatory System(I00-
I99), 5.82
Congenital
M alformations,Deforma
tions & Chromosomal
Abnormalities(Q00-
Q99), 9.53
Diseases of the
Nervous system(G00-
G98), 13.09
Other M ajor Groups,
7.37
Certain Infectious and
Parasitic Diseases(A00-
B99), 29.29
Injury, Poisoning and
Certain other
Cosequences of
External Causes(S00-
T98), 21.66
4.4 Persons aged 15-24 years: This age-group has contributed to 4.59 per cent of the
total medically certified deaths and the share of male and female deaths to the
corresponding total being 3.53per cent and 6.54 per cent respectively. The category
consisting of “Injury, Poisoning & certain other consequences of External causes” has
caused the maximum deaths 47.25 per cent of total deaths reported under this age group.
“Certain Infectious and Parasitic Diseases”, “Diseases of the Nervous System” and
“Diseases of the Circulatory System” are other leading causes of deaths, accounting for
18.20 per cent, 5.57 cent and 4.70 per cent of deaths respectively. The distribution of
mortality in the age group 15-24 years, by major cause groups has been shown in
Statement - 35 and Chart-25.

51
Statement – 35
Distribution of Mortality among persons in the Age Group 15-24 years by
Major Cause Groups
Sl.
No Major Cause Group
Male Female Total
No. % No. % No. %
1
Injury, Poisoning and Certain
other Consequences of
External Causes(S00-T98) 1356 48.14 1359 46.4 2715 47.25
2 Certain Infectious and
Parasitic Diseases(A00-B99) 533 18.92 513 17.51 1046 18.2
3 Diseases of the Nervous
System(G00-G98) 174 6.18 146 4.98 320 5.57
4 Diseases of the Circulatory
System(I00-I99) 153 5.43 117 3.99 270 4.7
5 Diseases of the Digestive
System(K00-K92) 155 5.5 113 3.86 268 4.66
6 Diseases of the Respiratory
System(J00-J98) 123 4.37 143 4.88 266 4.63
7 Others 323 11.47 538 18.37 861 14.98
Total Medically Certified
Deaths in the age group 15-
24 Year
2817 100 2929 100 5746 100
Deaths in the age group 15-
24 year as percentage to total
Medically certified deaths 3.53 6.44 4.59
Chart – 25 PERCENTAGE DISTRIBUTION OF MORTALITY AMONG PERSONS IN
THE AGE GROUP 15-24 YEARS BY MAJOR CAUSE GROUPS
Injury,Poisoning and
Certain other
Consequences of
External Causes
(S00-T98), 47.25
Others,
14.98
Diseases of the
Respiratory System
(J00-J98), 4.63
Certain Infectious and
Parasitic Diseases(A00-
B99), 18.2
Diseases of the Nervous
System(G00-G98), 5.57
Diseases of the
Circulatory System(I00-
I99), 4.7
Diseases of the
Digestive System(K00-
K92), 4.66
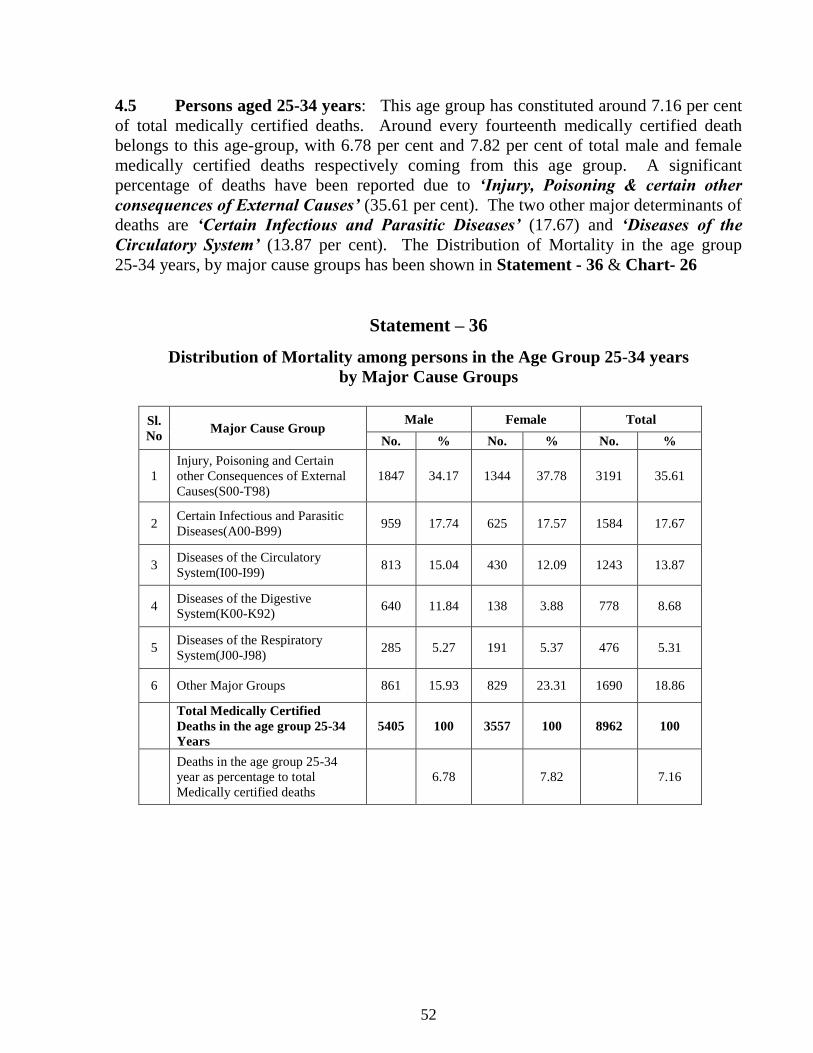
52
4.5 Persons aged 25-34 years: This age group has constituted around 7.16 per cent
of total medically certified deaths. Around every fourteenth medically certified death
belongs to this age-group, with 6.78 per cent and 7.82 per cent of total male and female
medically certified deaths respectively coming from this age group. A significant
percentage of deaths have been reported due to „Injury, Poisoning & certain other
consequences of External Causes‟ (35.61 per cent). The two other major determinants of
deaths are „Certain Infectious and Parasitic Diseases‟ (17.67) and „Diseases of the
Circulatory System‟ (13.87 per cent). The Distribution of Mortality in the age group
25-34 years, by major cause groups has been shown in Statement - 36 & Chart- 26
Statement – 36
Distribution of Mortality among persons in the Age Group 25-34 years
by Major Cause Groups
Sl.
No Major Cause Group
Male Female Total
No. % No. % No. %
1
Injury, Poisoning and Certain
other Consequences of External
Causes(S00-T98)
1847 34.17 1344 37.78 3191 35.61
2 Certain Infectious and Parasitic
Diseases(A00-B99) 959 17.74 625 17.57 1584 17.67
3 Diseases of the Circulatory
System(I00-I99) 813 15.04 430 12.09 1243 13.87
4 Diseases of the Digestive
System(K00-K92) 640 11.84 138 3.88 778 8.68
5 Diseases of the Respiratory
System(J00-J98) 285 5.27 191 5.37 476 5.31
6 Other Major Groups 861 15.93 829 23.31 1690 18.86
Total Medically Certified
Deaths in the age group 25-34
Years
5405 100 3557 100 8962 100
Deaths in the age group 25-34
year as percentage to total
Medically certified deaths
6.78 7.82 7.16

53
Chart -26
PERCENTAGE DISTRIBUTION OF MORTALITY AMONG PERSONS IN
THE AGE GROUP 25-34 YEARS BY MAJOR CAUSE GROUPS
Other Majo r Gro ups
(18.86%)
Dis eas es o f the
Res pira to ry Sys tem
(J 00-J 98)
( 5.31%)
Dis eas es o f the
Diges tive Sys tem
(K00-K92)
( 8.68%)
Dis eas es o f the
Circula to ry Sys tem
(I00-I99)
( 13.87%)
Injury,P o is o ning and
Certa in o ther
Co s equences o f
Externa l Caus es
(S00-T98)
( 35.61%)
Certa in Infec tio us and
P aras itic Dis eas es
(A00-B99)
( 17.67%)
4.6 Persons aged 35-44 years : The overall contribution of this age-group in total
medically certified deaths is 10.46 per cent, accounting for 11.20 per cent for male and
9.17 per cent of female deaths. „Diseases of the Circulatory System‟, „Injury Poisoning
and Certain other Consequences of External Causes‟, „Certain Infectious and Parasitic
Diseases‟, „Diseases of Digestive System‟, „Diseases of Respiratory System‟ and
„Neoplasms‟ are leading cause groups of deaths together contributing around 85.03 per
cent of total deaths under this age-group. The distribution of mortality in the age group
35-44 years, by major cause group has been presented in Statement-37 and Chart-27.

54
Statement -37
Distribution of Mortality among persons in the Age Group 35-44 years
by Major Cause Groups
Sl.
No Major Cause group
Male Female Total
No. % No. % No. %
1 Diseases of the Circulatory
System(I00-I99) 2195 24.57 906 21.74 3101 23.67
2
Injury,Poisoning and Certain
other Cosequences of External
Causes(S00-T98)
1570 17.58 842 20.21 2412 18.41
3 Certain Infectious and Parasitic
Diseases(A00-B99) 1462 16.37 715 17.16 2177 16.62
4 Diseases of the Digestive
System(K00-K92) 1359 15.21 218 5.23 1577 12.04
5 Diseases of the Respiratory
System(J00-J98) 732 8.2 380 9.12 1112 8.49
6 Neoplasms (C00-D48) 395 4.42 365 8.76 760 5.8
7 Other Major Groups 1219 13.65 741 17.78 1960 14.96
Total Medically Certified
Deaths in the age group 35-44
Years
8932 100 4167 100 13099 100
Deaths in the age group 35-44
year as percentage to total
Medically certified deaths
11.2 9.17 10.46
Chart – 27 PERCENTAGE DISTRIBUTION OF MORTALITY AMONG PERSONS IN THE AGE
GROUP 35-44 YEARS BY MAJOR CAUSE GROUPS
Certa in Infec tio us
and P aras itic
Dis eas es
(A00-B99)
( 16.62%)
Injury,P o is o ning and
Certa in o ther
Co s equences o f
Externa l Caus es
(S00-T98)
(18.41%)
Dis eas es o f the
Diges tive Sys tem
(K00-K92)
(12.04%)
Other Majo r Gro ups
(14.96%)
Dis eas es o f the
Circula to ry Sys tem
(I00-I99)
( 23.67%)
Neo plas ms
(C00-D48)
( 5.8%)
Dis eas es o f the
Res pira to ry Sys tem
(J 00-J 98)
( 8.49%)
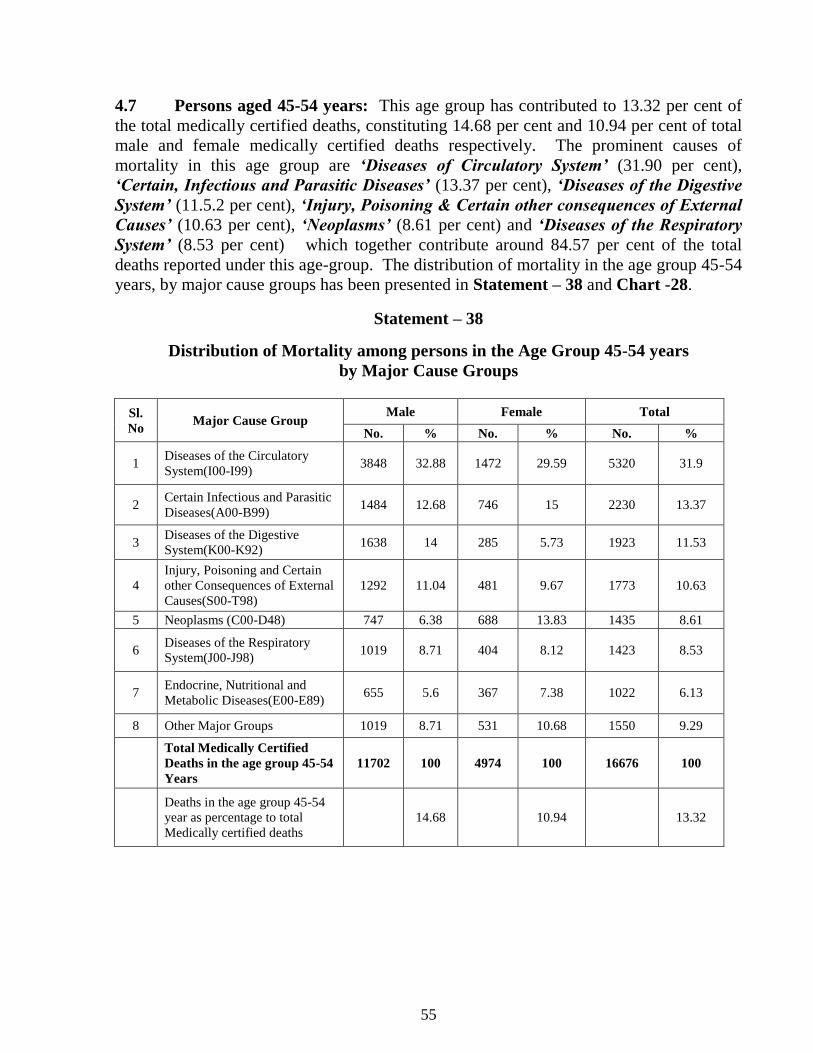
55
4.7 Persons aged 45-54 years: This age group has contributed to 13.32 per cent of
the total medically certified deaths, constituting 14.68 per cent and 10.94 per cent of total
male and female medically certified deaths respectively. The prominent causes of
mortality in this age group are „Diseases of Circulatory System‟ (31.90 per cent),
„Certain, Infectious and Parasitic Diseases‟ (13.37 per cent), „Diseases of the Digestive
System‟ (11.5.2 per cent), „Injury, Poisoning & Certain other consequences of External
Causes‟ (10.63 per cent), „Neoplasms‟ (8.61 per cent) and „Diseases of the Respiratory
System‟ (8.53 per cent) which together contribute around 84.57 per cent of the total
deaths reported under this age-group. The distribution of mortality in the age group 45-54
years, by major cause groups has been presented in Statement – 38 and Chart -28.
Statement – 38
Distribution of Mortality among persons in the Age Group 45-54 years
by Major Cause Groups
Sl.
No Major Cause Group
Male Female Total
No. % No. % No. %
1 Diseases of the Circulatory
System(I00-I99) 3848 32.88 1472 29.59 5320 31.9
2 Certain Infectious and Parasitic
Diseases(A00-B99) 1484 12.68 746 15 2230 13.37
3 Diseases of the Digestive
System(K00-K92) 1638 14 285 5.73 1923 11.53
4
Injury, Poisoning and Certain
other Consequences of External
Causes(S00-T98)
1292 11.04 481 9.67 1773 10.63
5 Neoplasms (C00-D48) 747 6.38 688 13.83 1435 8.61
6 Diseases of the Respiratory
System(J00-J98) 1019 8.71 404 8.12 1423 8.53
7 Endocrine, Nutritional and
Metabolic Diseases(E00-E89) 655 5.6 367 7.38 1022 6.13
8 Other Major Groups 1019 8.71 531 10.68 1550 9.29
Total Medically Certified
Deaths in the age group 45-54
Years
11702 100 4974 100 16676 100
Deaths in the age group 45-54
year as percentage to total
Medically certified deaths
14.68 10.94 13.32

56
Chart – 28
PERCENTAGE DISTRIBUTION OF MORTALITY AMONG PERSONS IN
THE AGE GROUP 45-54 YEARS BY MAJOR CAUSE GROUPS
Injury,Poisoning and
Certain other
Consequences of
External Causes
(S00-T98)
( 10.63%)
Diseases of the
Digestive System
(K00-K92)
( 11.53%)
Neoplasms
(C00-D48)
( 8.61%)
Diseases of the
Respiratory System
(J00-J98)
( 8.53%)
Endocrine, Nutritional
and Metabolic Diseases
(E00-E89)
( 6.13%)
Other Major Groups
( 9.29%)
Diseases of the
Circulatory System
(I00-I99)
( 31.90%)
Certain Infectious and
Parasitic Diseases
(A00-B99)
( 13.37%)
4.8 Persons aged 55-64 years: This age group has a share of 15.81 per cent in the
total medically certified deaths, accounting for 16.91 per cent and 13.90 per cent of total
male and female medically certified deaths respectively. „Diseases of the Circulatory
System‟ have contributed to the maximum number (39.43 per cent) of total deaths in this
age-group, followed by Neoplasms (9.87 per cent). In the Circulatory System deaths
“Ischaemic Heart Diseases” have taken the highest toll contributing around 44 per cent
of total deaths. Around 91 per cent of the deaths under the cause group, Endorine,
Nutritional and Metabolic Diseases is due to „Diabetes Mellitus‟. The cause group
„Certain Infectious and Parasitic Diseases‟ is responsible for 9.48 per cent of the total
deaths under this age group „Respiratory Tuberculosis‟ constituted 44 per cent of total
deaths (Refer Table-2). The distribution of mortality in the age group 55-64 years by
major cause group has been highlighted in the Statement-39 and Chart – 29.

57
Statement -39
Distribution of Mortality among persons in the Age Group 55-64 years
by Major Cause Groups
Sl.
No Major Cause Group
Male Female Total
No. % No. % No. %
1 Diseases of the Circulatory
System(I00-I99) 5291 39.26 2514 39.79 7805 39.43
2 Neoplasms (C00-D48) 1174 8.71 779 12.33 1953 9.87
3 Certain Infectious and Parasitic
Diseases(A00-B99) 1214 9.01 663 10.49 1877 9.48
4 Diseases of the Respiratory
System(J00-J98) 1270 9.42 514 8.14 1784 9.01
5 Endocrine, Nutritional and
Metabolic Diseases(E00-E89) 1035 7.68 648 10.26 1683 8.50
6 Diseases of the Digestive
System(K00-K92) 1359 10.08 299 4.73 1658 8.38
7
Injury, Poisoning and Certain
other Consequences of External
Causes(S00-T98)
860 6.38 242 3.83 1102 5.57
8 Other major Groups 1274 9.45 659 10.43 1933 9.77
Total Medically Certified
Deaths in the age group
55-64 Years
13477 100.00 6318 100.00 19795 100.00
Deaths in the age group 55-64
year as percentage to total
Medically certified deaths
16.91 13.9 15.81
Chart – 29 PERCENTAGE DISTRIBUTION OF MORTALITY AMONG PERSONS IN
THE AGE GROUP 55-64 YEARS BY MAJOR CAUSE GROUPS
End o c rine ,
N ut rit io na l and
M e t ab o lic D is e as e s
( E0 0 - E8 9 )
( 8 .50 %)
D is e as e s o f t he
D ig e s t ive S ys t e m
( K0 0 - K9 2 )
( 8 .3 8 %)
Injury ,P o is o ning and
C e rt a in o t he r
C o s e q ue nc e s o f
Ext e rna l C aus e s
( S 0 0 - T9 8 )
( 5 .57%)
Ot he r majo r Gro up s
( 9 .77%)
D is e as e s o f t he
R e s p ira t o ry S ys t e m
( J0 0 - J9 8 )
( 9 .0 1%)
C e rt a in Inf e c t io us
and P aras it ic
D is e as e s
( A 0 0 - B 9 9 )
( 9 .4 8 %)
N e o p las ms
( C 0 0 - D 4 8 )
( 9 .8 7%)
D is e as e s o f t he
C irc ula t o ry S ys t e m
( I0 0 - I9 9 )
( 3 9 .4 3 %)
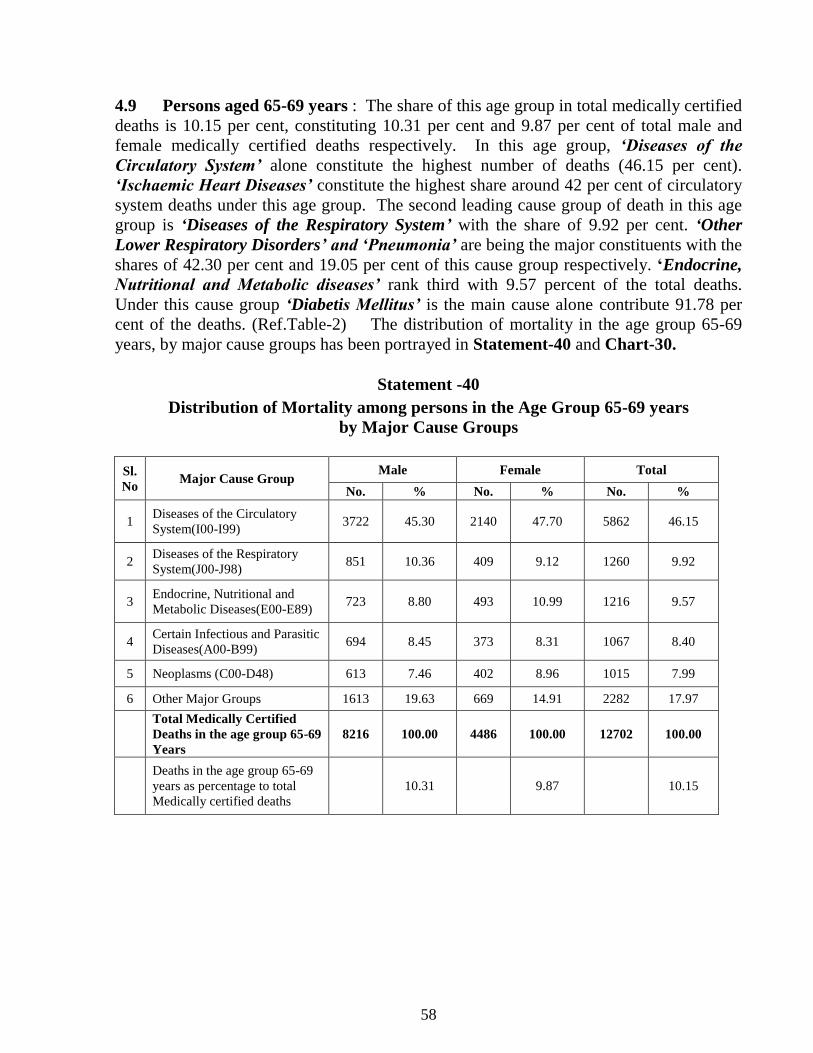
58
4.9 Persons aged 65-69 years : The share of this age group in total medically certified
deaths is 10.15 per cent, constituting 10.31 per cent and 9.87 per cent of total male and
female medically certified deaths respectively. In this age group, „Diseases of the
Circulatory System‟ alone constitute the highest number of deaths (46.15 per cent).
„Ischaemic Heart Diseases‟ constitute the highest share around 42 per cent of circulatory
system deaths under this age group. The second leading cause group of death in this age
group is „Diseases of the Respiratory System‟ with the share of 9.92 per cent. „Other
Lower Respiratory Disorders‟ and „Pneumonia‟ are being the major constituents with the
shares of 42.30 per cent and 19.05 per cent of this cause group respectively. ‘Endocrine,
Nutritional and Metabolic diseases‟ rank third with 9.57 percent of the total deaths.
Under this cause group „Diabetis Mellitus‟ is the main cause alone contribute 91.78 per
cent of the deaths. (Ref.Table-2) The distribution of mortality in the age group 65-69
years, by major cause groups has been portrayed in Statement-40 and Chart-30.
Statement -40
Distribution of Mortality among persons in the Age Group 65-69 years
by Major Cause Groups
Sl.
No Major Cause Group
Male Female Total
No. % No. % No. %
1 Diseases of the Circulatory
System(I00-I99) 3722 45.30 2140 47.70 5862 46.15
2 Diseases of the Respiratory
System(J00-J98) 851 10.36 409 9.12 1260 9.92
3 Endocrine, Nutritional and
Metabolic Diseases(E00-E89) 723 8.80 493 10.99 1216 9.57
4 Certain Infectious and Parasitic
Diseases(A00-B99) 694 8.45 373 8.31 1067 8.40
5 Neoplasms (C00-D48) 613 7.46 402 8.96 1015 7.99
6 Other Major Groups 1613 19.63 669 14.91 2282 17.97
Total Medically Certified
Deaths in the age group 65-69
Years
8216 100.00 4486 100.00 12702 100.00
Deaths in the age group 65-69
years as percentage to total
Medically certified deaths
10.31 9.87 10.15

59
Chart-30
PERCENTAGE DISTRIBUTION OF MORTALITY AMONG PERSONS IN
THE AGE GROUP 65-69 YEARS BY MAJOR CAUSE GROUPS
Other Major
Groups (17.97%)
Neoplasms
(C00-D48)
( 7.99%)
Certain Infectious
and Parasitic
Diseases
(A00-B99)
( 8.40%)
Endocrine,
Nutritional and
Metabolic Diseases
(E00-E89)
( 9.57%)
Diseases of the
Respiratory System
(J00-J98)
( 9.92%)
Diseases of the
Circulatory System
(I00-I99)
( 46.15%)
4.10 Old aged Persons 70 years and above: This age group, as expected, has
reported the maximum incidence (20.77 per cent) of total medically certified deaths. As
high as 19.69 per cent and 22.69 per cent of total male and female medically certified
deaths have respectively been reported from this age group. In this age group „Diseases
of the Circulatory System‟ alone contribute 48.62 per cent of deaths. Ischemic Heart
Diseases constitute maximum number (46.03 per cent) of Circulatory system deaths under
this age group. The major group of „Diseases of Respiratory System‟ is the second
leading cause of death with 11.38 per cent of total deaths under this age group „Other
Lower Respiratory Disorders‟ and „Pnumonia‟ are the major constituents of Diseases of
Respiratory system with the shares of 69.66 per cent and 35.17 per cent respectively.
With the share of 11.33 per cent, „Endocrine, Nutritional and Metabolic Diseases‟ is the
third leading cause group of death in this age group. Under this age cause group,
„Diabetes Mellitus‟ is the only cause account for about 91 per cent deaths (Ref. Table-2).
The distribution of mortality in the age group 70 years and above, by major cause group
has been presented in Statement-41 & Chart-31.
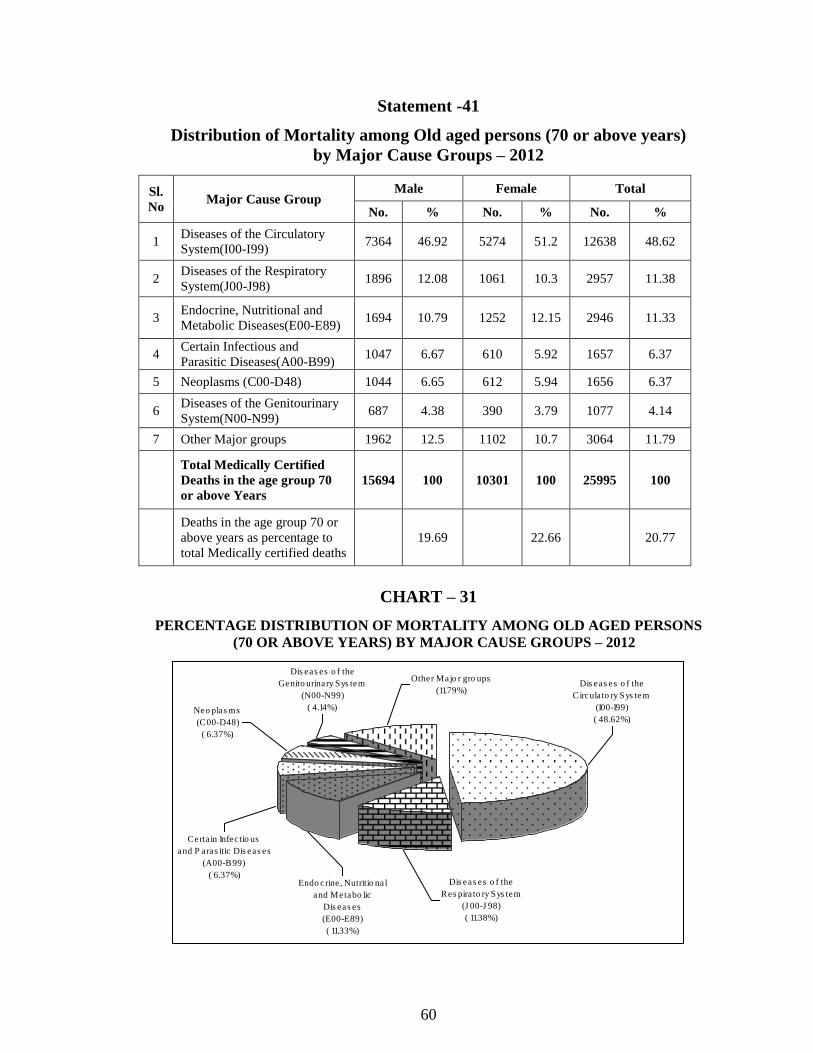
60
Statement -41
Distribution of Mortality among Old aged persons (70 or above years)
by Major Cause Groups – 2012
Sl.
No Major Cause Group
Male Female Total
No. % No. % No. %
1 Diseases of the Circulatory
System(I00-I99) 7364 46.92 5274 51.2 12638 48.62
2 Diseases of the Respiratory
System(J00-J98) 1896 12.08 1061 10.3 2957 11.38
3 Endocrine, Nutritional and
Metabolic Diseases(E00-E89) 1694 10.79 1252 12.15 2946 11.33
4 Certain Infectious and
Parasitic Diseases(A00-B99) 1047 6.67 610 5.92 1657 6.37
5 Neoplasms (C00-D48) 1044 6.65 612 5.94 1656 6.37
6 Diseases of the Genitourinary
System(N00-N99) 687 4.38 390 3.79 1077 4.14
7 Other Major groups 1962 12.5 1102 10.7 3064 11.79
Total Medically Certified
Deaths in the age group 70
or above Years
15694 100 10301 100 25995 100
Deaths in the age group 70 or
above years as percentage to
total Medically certified deaths
19.69 22.66 20.77
CHART – 31
PERCENTAGE DISTRIBUTION OF MORTALITY AMONG OLD AGED PERSONS
(70 OR ABOVE YEARS) BY MAJOR CAUSE GROUPS – 2012
Neo plas ms
(C00-D48)
( 6.37%)
Dis eas es o f the
Genito urinary Sys tem
(N00-N99)
( 4.14%)
Certa in Infec tio us
and P aras itic Dis eas es
(A00-B99)
( 6.37%)Endo crine , Nutritio na l
and Metabo lic
Dis eas es
(E00-E89)
( 11.33%)
Dis eas es o f the
Res pira to ry Sys tem
(J 00-J 98)
( 11.38%)
Other Majo r gro ups
(11.79%)Dis eas es o f the
Circula to ry Sys tem
(I00-I99)
( 48.62%)

APPENDICESAPPENDICESAPPENDICESAPPENDICES

APPENDIX – I
LIST OF STATISTICAL TABLES
Table Number
Description Page Nos.
1
Medically certified deaths by Age, sex and Major
Cause Groups (Based upon Tenth Revision of
ICD) during 2012
61 - 63
2
Medically certified deaths by age and sex
according to National List (Based upon Tenth
Revision of ICD) during 2012
64 - 88
3
Medically certified deaths by Sex and Major
Cause Groups (Based upon Tenth Revision of
ICD) during 2005-2012
89 - 90
4
Percentage Distribution of Medically Certified
Deaths by Sex and Major cause Groups (Based
upon Tenth Revision of I.C.D.) during 2005-2012
91 - 92
5
Percentage Distribution of Medically Certified
Deaths by Age, Sex and Major cause Groups
(Based upon Tenth Revision of I.C.D.) during
2012
93 - 95
6
Percentage Distribution of Medically Certified
Deaths by Over Age Groups by Sex and Major
cause Groups (Based upon Tenth Revision of
I.C.D.) during 2012
96 - 98
7
Percentage Distribution of Medically Certified
Deaths due to Tuberculosis, Diabetes Mellitus
and Ischemic Heart Diseases from 2005-2012
99
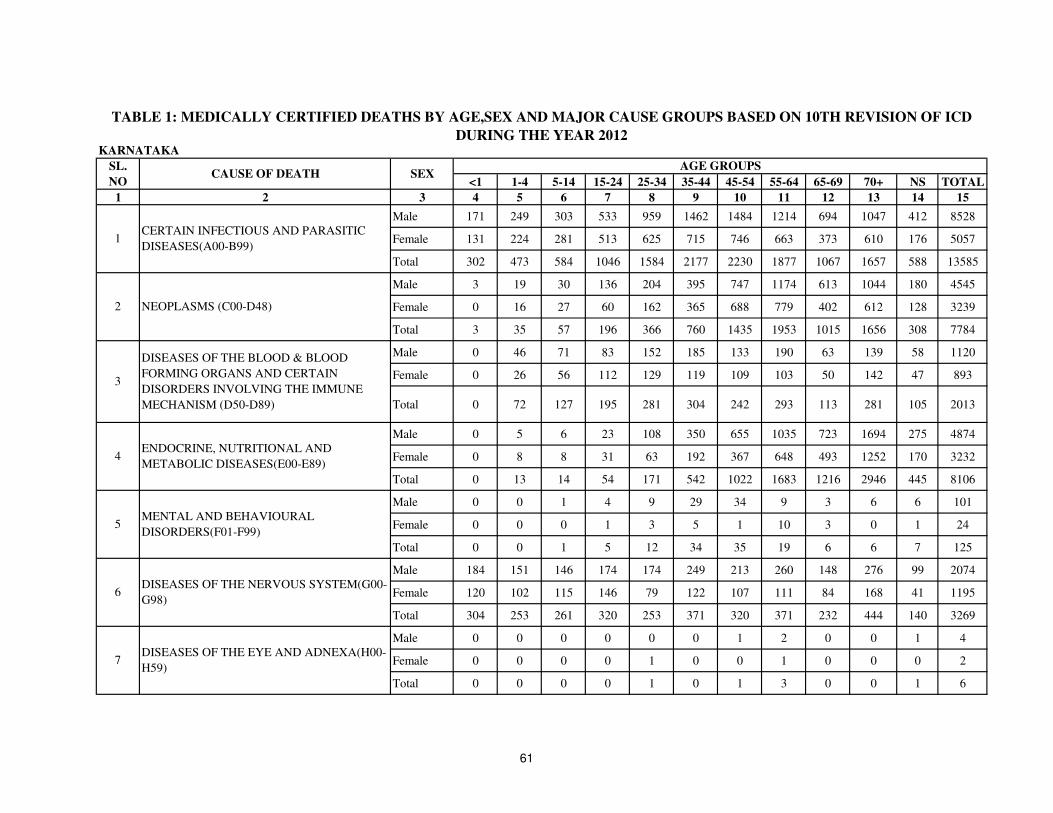
<1 1-4 5-14 15-24 25-34 35-44 45-54 55-64 65-69 70+ NS TOTAL
1 2 3 4 5 6 7 8 9 10 11 12 13 14 15
Male 171 249 303 533 959 1462 1484 1214 694 1047 412 8528
Female 131 224 281 513 625 715 746 663 373 610 176 5057
Total 302 473 584 1046 1584 2177 2230 1877 1067 1657 588 13585
Male 3 19 30 136 204 395 747 1174 613 1044 180 4545
Female 0 16 27 60 162 365 688 779 402 612 128 3239
Total 3 35 57 196 366 760 1435 1953 1015 1656 308 7784
Male 0 46 71 83 152 185 133 190 63 139 58 1120
Female 0 26 56 112 129 119 109 103 50 142 47 893
Total 0 72 127 195 281 304 242 293 113 281 105 2013
Male 0 5 6 23 108 350 655 1035 723 1694 275 4874
Female 0 8 8 31 63 192 367 648 493 1252 170 3232
Total 0 13 14 54 171 542 1022 1683 1216 2946 445 8106
Male 0 0 1 4 9 29 34 9 3 6 6 101
Female 0 0 0 1 3 5 1 10 3 0 1 24
Total 0 0 1 5 12 34 35 19 6 6 7 125
Male 184 151 146 174 174 249 213 260 148 276 99 2074
Female 120 102 115 146 79 122 107 111 84 168 41 1195
Total 304 253 261 320 253 371 320 371 232 444 140 3269
Male 0 0 0 0 0 0 1 2 0 0 1 4
Female 0 0 0 0 1 0 0 1 0 0 0 2
Total 0 0 0 0 1 0 1 3 0 0 1 6
SEXAGE GROUPS
TABLE 1: MEDICALLY CERTIFIED DEATHS BY AGE,SEX AND MAJOR CAUSE GROUPS BASED ON 10TH REVISION OF ICD
DURING THE YEAR 2012KARNATAKA
SL.
NOCAUSE OF DEATH
7DISEASES OF THE EYE AND ADNEXA(H00-
H59)
4ENDOCRINE, NUTRITIONAL AND
METABOLIC DISEASES(E00-E89)
5MENTAL AND BEHAVIOURAL
DISORDERS(F01-F99)
6DISEASES OF THE NERVOUS SYSTEM(G00-
G98)
CERTAIN INFECTIOUS AND PARASITIC
DISEASES(A00-B99)1
2 NEOPLASMS (C00-D48)
3
DISEASES OF THE BLOOD & BLOOD
FORMING ORGANS AND CERTAIN
DISORDERS INVOLVING THE IMMUNE
MECHANISM (D50-D89)
61

<1 1-4 5-14 15-24 25-34 35-44 45-54 55-64 65-69 70+ NS TOTAL
1 2 3 4 5 6 7 8 9 10 11 12 13 14 15
SEXAGE GROUPS
TABLE 1: MEDICALLY CERTIFIED DEATHS BY AGE,SEX AND MAJOR CAUSE GROUPS BASED ON 10TH REVISION OF ICD
DURING THE YEAR 2012KARNATAKA
SL.
NOCAUSE OF DEATH
Male 0 0 0 0 0 0 0 0 2 0 0 2
Female 0 0 0 0 0 0 0 0 1 0 0 1
Total 0 0 0 0 0 0 0 0 3 0 0 3
Male 0 35 61 153 813 2195 3848 5291 3722 7364 1199 24681
Female 19 22 55 117 430 906 1472 2514 2140 5274 632 13581
Total 19 57 116 270 1243 3101 5320 7805 5862 12638 1831 38262
Male 11 65 74 123 285 732 1019 1270 851 1896 352 6678
Female 5 62 63 143 191 380 404 514 409 1061 148 3380
Total 16 127 137 266 476 1112 1423 1784 1260 2957 500 10058
Male 0 11 25 155 640 1359 1638 1359 533 642 338 6700
Female 0 3 17 113 138 218 285 299 127 251 72 1523
Total 0 14 42 268 778 1577 1923 1658 660 893 410 8223
Male 0 0 0 0 27 48 89 105 56 133 18 476
Female 0 0 0 0 23 18 32 52 30 65 10 230
Total 0 0 0 0 50 66 121 157 86 198 28 706
Male 0 0 0 9 7 13 14 22 16 34 9 124
Female 0 0 0 1 6 11 18 19 14 16 7 92
Total 0 0 0 10 13 24 32 41 30 50 16 216
Male 0 4 7 15 145 274 443 590 438 687 119 2722
Female 0 4 8 15 96 132 239 318 201 390 54 1457
Total 0 8 15 30 241 406 682 908 639 1077 173 4179
13
DISEASES OF THE MUSCULOSKELETAL
SYSTEM AND CONNECTIVE TISSUE(M00-
M99)
14DISEASES OF THE GENITOURINARY
SYSTEM(N00-N99)
10DISEASES OF THE RESPIRATORY
SYSTEM(J00-J98)
11DISEASES OF THE DIGESTIVE
SYSTEM(K00-K92)
12DISEASES OF THE SKIN AND
SUBCUTANEOUS TISSUE(L00-L98)
8DISEASES OF THE EAR AND MASTOID
PROCESS(H60-H95)
9DISEASES OF THE CIRCULATORY
SYSTEM(I00-I99)
62

<1 1-4 5-14 15-24 25-34 35-44 45-54 55-64 65-69 70+ NS TOTAL
1 2 3 4 5 6 7 8 9 10 11 12 13 14 15
SEXAGE GROUPS
TABLE 1: MEDICALLY CERTIFIED DEATHS BY AGE,SEX AND MAJOR CAUSE GROUPS BASED ON 10TH REVISION OF ICD
DURING THE YEAR 2012KARNATAKA
SL.
NOCAUSE OF DEATH
Male 0 0 0 0 0 0 0 0 0 0 0 0
Female 0 0 0 282 246 113 0 0 0 0 1 642
Total 0 0 0 282 246 113 0 0 0 0 1 642
Male 6932 0 0 0 0 0 0 0 0 0 0 6932
Female 4678 0 0 0 0 0 0 0 0 0 0 4678
Total 11610 0 0 0 0 0 0 0 0 0 0 11610
Male 647 142 118 27 0 0 0 0 0 6 20 954
Female 458 116 72 12 0 0 0 0 0 3 7 665
Total 1105 258 190 39 0 0 0 0 0 9 27 1619
Male 0 3 11 26 35 71 92 96 85 311 63 793
Female 0 3 7 24 21 29 25 45 38 216 39 447
Total 0 6 18 50 56 100 117 141 123 527 102 1240
Male 14 79 242 1356 1847 1570 1292 860 269 421 461 8411
Female 25 62 190 1359 1344 842 481 242 121 244 213 5123
Total 39 141 432 2715 3191 2412 1773 1102 390 665 674 13534
Male 14 79 242 1356 1847 1570 1292 860 269 421 461 8411
Female 25 62 190 1359 1344 842 481 242 121 244 213 5123
Total 39 141 432 2715 3191 2412 1773 1102 390 665 674 13534
MALE 7962 809 1095 2817 5405 8932 11702 13477 8216 15694 3610 79719
FEMALE 5436 648 899 2929 3557 4167 4974 6318 4486 10301 1746 45461
TOTAL 13398 1457 1994 5746 8962 13099 16676 19795 12702 25995 5356 125180
ALL CAUSES
19
INJURY,POISONING AND CERTAIN OTHER
COSEQUENCES OF EXTERNAL CAUSES
(S00-T98)
16CERTAIN CONDITIONS ORIGINATING IN
THE PERINATAL PERIOD(P00-P96)
20EXTERNAL CAUSES OF MORBIDITY AND
MORTALITY(V01-Y89)
17
CONGENITAL MALFORMATIONS,
DEFORMATIONS & CHROMOSOMAL
ABNORMALITIES (Q00-Q99)
18
SYMPTOMS,SIGNS AND ABNORMAL
CLINICAL & LABORATORY FINDINGS,
NOT ELSEWHERE CLASSIFIED(R00-R99)
15PREGNANCY, CHILDBIRTH AND THE
PUERPERIUM (O00-O99)
63

<1 1-4 5-14 15-24 25-34 35-44 45-54 55-64 65-69 70+ NS TOTAL
1 2 3 4 5 6 7 8 9 10 11 12 13 14 15
I CERTAIN INFECTIOUS AND PARASITIC DISEASES(A00-B99) Male 171 249 303 533 959 1462 1484 1214 694 1047 412 8528
Female 131 224 281 513 625 715 746 663 373 610 176 5057
Total 302 473 584 1046 1584 2177 2230 1877 1067 1657 588 13585
1 INTESTINAL INFECTIOUS DISEASES(A00-A09) Male 115 41 37 35 44 82 80 116 56 155 44 805
Female 81 49 22 42 40 54 58 94 44 142 35 661
Total 196 90 59 77 84 136 138 210 100 297 79 1466
1 CHOLERA(A00) Male 0 0 0 0 0 0 0 0 0 1 0 1
Female 0 0 0 0 0 0 1 0 0 0 0 1
2 TYPHOID FEVER AND PARATYPHOID FEVERS(A01) Male 0 2 5 3 10 15 12 4 4 8 3 66
Female 0 4 2 5 16 6 3 3 0 5 1 45
3 FOOD POISONING(A02,A05) Male 0 0 0 1 0 2 1 1 0 0 0 5
Female 0 1 0 0 2 0 2 0 0 0 0 5
4 SHIGELLOSIS(A03) Male 0 0 0 2 2 2 4 1 0 0 0 11
Female 0 1 0 0 0 0 0 0 0 0 0 1
5 AMOEBIASIS(A06) Male 4 6 3 0 0 3 1 3 1 7 6 34
Female 8 3 1 2 0 4 2 5 3 7 2 37
6 DIARRHOEA AND GASTROENTERITIS OF PRESUMED INFECTIOUS ORIGIN(A09) Male 111 33 29 29 32 60 62 107 51 138 35 687
Female 73 40 19 34 20 43 50 86 41 130 32 568
7 OTHER INTESTINAL INFECTIOUS DISEASES(A04,A07-A08) Male 0 0 0 0 0 0 0 0 0 1 0 1
Female 0 0 0 1 2 1 0 0 0 0 0 4
2 TUBERCULOSIS(A15-A19) Male 11 43 35 247 565 817 820 647 435 489 211 4320
Female 8 26 48 240 257 369 396 299 196 173 57 2069
Total 19 69 83 487 822 1186 1216 946 631 662 268 6389
1 RESPIRATORY TUBERCULOSIS(A15-A16) Male 0 12 10 155 407 640 681 577 384 429 163 3458
Female 0 8 26 153 188 277 317 243 150 139 42 1543
2 TUBERCULOSIS OF NERVOUS SYSTEM(A17) Male 10 26 17 58 95 90 81 32 18 26 29 482
Female 7 13 13 48 35 47 43 33 25 11 8 283
3 TUBERCULOSIS OF OTHER ORGANS AND MILIARY TUBERCULOSIS(A18-A19) Male 1 5 8 34 63 87 58 38 33 34 19 380
Female 1 5 9 39 34 45 36 23 21 23 7 243
TABLE 2 : MEDICALLY CERTIFIED DEATHS BY AGE , SEX AND MAJOR CAUSE GROUPS BASED ON 10TH REVISION OF ICD DURING THE YEAR 2012
KARNATAKA
SL.
NO.CAUSE OF DEATH SEX
AGE GROUPS
64

<1 1-4 5-14 15-24 25-34 35-44 45-54 55-64 65-69 70+ NS TOTAL
1 2 3 4 5 6 7 8 9 10 11 12 13 14 15
TABLE 2 : MEDICALLY CERTIFIED DEATHS BY AGE , SEX AND MAJOR CAUSE GROUPS BASED ON 10TH REVISION OF ICD DURING THE YEAR 2012
KARNATAKA
SL.
NO.CAUSE OF DEATH SEX
AGE GROUPS
3 OTHER BACTERIAL DISEASES(A20-A49) Male 4 38 58 90 145 258 310 236 103 304 71 1617
Female 2 40 49 117 175 129 155 166 88 230 52 1203
Total 6 78 107 207 320 387 465 402 191 534 123 2820
1 PLAGUE(A20) Male 0 0 0 0 0 0 0 0 0 0 0 0
Female 0 0 0 0 0 0 0 0 0 0 0 0
2 LEPROSY(A30) Male 0 0 0 0 0 1 3 2 1 2 1 10
Female 0 0 0 0 0 0 0 3 0 0 0 3
3 NEONATAL TETANUS(A33) Male 1 0 0 0 0 0 0 0 0 0 0 1
Female 2 0 0 0 0 0 0 0 0 0 0 2
4 OTHER TETANUS(A34-A35) Male 0 3 1 7 0 4 10 6 2 9 3 45
Female 0 2 1 3 0 0 2 4 1 8 0 21
5 DIPTHERIA(A36) Male 2 0 3 0 0 0 0 0 0 0 0 5
Female 0 0 1 0 0 0 0 0 0 0 0 1
6 WHOOPING COUGH(A37) Male 1 0 0 0 0 0 0 0 0 0 0 1
Female 0 1 0 0 0 0 0 0 0 0 0 1
7 MENINGOCOCCAL INFECTION(A39) Male 0 0 1 0 0 0 0 0 0 1 0 2
Female 0 0 0 0 0 0 1 0 0 0 0 1
8 SEPTICAEMIA(A40-A41) Male 0 32 46 74 126 235 268 208 92 278 62 1421
Female 0 35 41 111 173 122 146 155 80 217 48 1128
9 ALL OTHER TYPES OF BACTERIAL DISEASES(A21-A28,A31-A32,A38,A42-A49) Male 0 3 7 9 19 18 29 20 8 14 5 132
Female 0 2 6 3 2 7 6 4 7 5 4 46
4 INFECTIONS WITH A PREDOMINANTLY SEXUAL MODE OF Male 0 0 0 0 0 0 1 2 0 0 0 3
TRANSMISSION (A50-A64) Female 0 0 0 1 1 0 1 0 0 0 0 3
Total 0 0 0 1 1 0 2 2 0 0 0 6
1 SYPHILIS(A50-A53) Male 0 0 0 0 0 0 1 0 0 0 0 1
Female 0 0 0 0 0 0 1 0 0 0 0 1
2 OTHER TYPES OF INFECTIONS WITH A PREDOMINANTLY SEXUAL MODE OF Male 0 0 0 0 0 0 0 2 0 0 0 2
TRANSMISSION (A54-A64) Female 0 0 0 1 1 0 0 0 0 0 0 2
65

<1 1-4 5-14 15-24 25-34 35-44 45-54 55-64 65-69 70+ NS TOTAL
1 2 3 4 5 6 7 8 9 10 11 12 13 14 15
TABLE 2 : MEDICALLY CERTIFIED DEATHS BY AGE , SEX AND MAJOR CAUSE GROUPS BASED ON 10TH REVISION OF ICD DURING THE YEAR 2012
KARNATAKA
SL.
NO.CAUSE OF DEATH SEX
AGE GROUPS
5 VIRAL DISEASES(A70-A74 & A80-B34) Male 41 120 148 104 161 253 203 125 72 76 63 1366
Female 40 99 138 83 116 129 100 59 30 43 31 868
Total 81 219 286 187 277 382 303 184 102 119 94 2234
1 ACUTE POLIOMYELITIS(A80) Male 0 0 0 0 0 0 0 0 0 0 0 0
Female 0 0 0 0 0 0 0 0 0 0 0 0
2 RABIES(A82) Male 0 1 14 3 6 11 11 4 4 4 3 61
Female 0 2 3 0 2 6 1 0 0 0 1 15
3 JAPANESE ENCEPHALITIS(A83.0) Male 0 0 0 0 0 0 0 0 0 0 0 0
Female 0 0 0 0 0 0 0 0 0 0 1 1
4 OTHER VIRAL ENCEPHALITIS(A83.1-A83.9,A84-A86) Male 15 45 59 33 18 32 41 32 31 13 12 331
Female 15 36 43 21 16 12 19 9 10 14 7 202
5 DENGUE FEVER(A90) Male 0 10 16 19 6 3 1 7 1 1 1 65
Female 0 13 18 9 3 2 2 5 1 2 0 55
6 OTHER ARTHOPOD-BORNE VIRAL FEVERS AND VIRAL HAEMORRHAGIC FEVERS Male 16 53 52 32 45 41 39 25 9 24 16 352
(A91-A94, A96-A99) Female 15 41 68 24 25 19 30 18 11 19 13 283
7 SMALLPOX(B03) Male 0 0 0 0 0 0 0 0 0 0 0 0
Female 0 0 0 0 0 0 0 0 0 0 0 0
8 MEASLES(B05) Male 1 2 0 0 0 0 0 0 0 0 0 3
Female 2 1 0 0 0 0 0 0 0 0 0 3
9 ACUTE HEPATITIS(B16) Male 0 0 0 0 6 5 9 5 3 6 2 36
Female 0 0 0 2 0 6 3 2 0 0 0 13
10 OTHER VIRAL HEPATITIS(B15, B17-B19) Male 0 6 5 16 36 53 43 23 13 18 15 228
Female 0 2 5 24 25 29 18 12 2 5 4 126
11 HUMAN IMMUNODEFICIENCY VIRUS[HIV]DISEASE (B20-B24) Male 0 0 0 0 40 106 58 27 11 4 13 259
Female 0 0 0 0 44 51 27 12 4 2 4 144
12 ALL OTHER TYPES OF VIRAL DISEASES (A70-A74,A81,A87-A89,A95, Male 9 3 2 1 4 2 1 2 0 6 1 31
B00-B02,B04,B06-B09 & B25-B34) Female 8 4 1 3 1 4 0 1 2 1 1 26
66

<1 1-4 5-14 15-24 25-34 35-44 45-54 55-64 65-69 70+ NS TOTAL
1 2 3 4 5 6 7 8 9 10 11 12 13 14 15
TABLE 2 : MEDICALLY CERTIFIED DEATHS BY AGE , SEX AND MAJOR CAUSE GROUPS BASED ON 10TH REVISION OF ICD DURING THE YEAR 2012
KARNATAKA
SL.
NO.CAUSE OF DEATH SEX
AGE GROUPS
6 PROTOZOAL DISEASES (B50-B64) Male 0 2 17 37 31 26 41 39 22 19 6 240
Female 0 7 12 19 21 19 15 15 14 13 0 135
Total 0 9 29 56 52 45 56 54 36 32 6 375
1 MALARIA(B50-B54) Male 0 2 16 37 31 25 39 39 22 19 6 236
Female 0 7 12 19 20 18 15 14 14 13 0 132
2 ALL OTHER TYPES OF PROTOZOAL DISEASES(B55-B64) Male 0 0 1 0 0 1 2 0 0 0 0 4
Female 0 0 0 0 1 1 0 1 0 0 0 3
7 OTHER CERTAIN INFECTIOUS AND PARASITIC DISEASES & LATE EFFECTS Male 0 5 8 20 13 26 29 49 6 4 17 177
OF INFECTIOUS DISEASES (A65-A69 & A75-A79,B35-B49,B65-B94 & B99) Female 0 3 12 11 15 15 21 30 1 9 1 118
Total 0 8 20 31 28 41 50 79 7 13 18 295
1 FILARIASIS(B74) Male 0 0 0 2 0 0 0 0 0 1 0 3
Female 0 0 0 0 0 0 0 0 0 0 0 0
2 OTHER HELMINTHIASIS(B65-B73,B75,B77-B83) Male 0 1 0 1 0 1 0 1 0 0 1 5
Female 0 0 0 1 0 0 2 0 0 1 0 4
3 OTHER SPIROCHAETAL DISEASES AND RICKETTSIOSES(A65-A69 & A75-A79) Male 0 3 0 1 2 1 2 2 0 0 1 12
Female 0 3 0 3 0 3 3 1 0 2 0 15
4 ALL OTHER INFECTIOUS AND PARASITIC DISEASES & LATE EFFECTS OF INFECTIOUS Male 0 1 8 16 11 24 27 46 6 3 15 157
AND PARASITIC DISEASES (B35-B49,B65,B76,B85-B94 &B99) Female 0 0 12 7 15 12 16 29 1 6 1 99
II NEOPLASMS (C00-D48) Male 3 19 30 136 204 395 747 1174 613 1044 180 4545
Female 0 16 27 60 162 365 688 779 402 612 128 3239
Total 3 35 57 196 366 760 1435 1953 1015 1656 308 7784
8 MALIGNANT NEOPLASMS OF LIP, ORAL CAVITY AND PHARYNX (C00-C14) Male 0 0 0 0 16 42 105 117 48 78 17 423
Female 0 0 0 0 1 19 37 39 27 48 6 177
Total 0 0 0 0 17 61 142 156 75 126 23 600
1 MALIGNANT NEOPLASMS OF LIP, ORAL CAVITY AND PHARYNX (C00-C14) Male 0 0 0 0 16 42 105 117 48 78 17 423
Female 0 0 0 0 1 19 37 39 27 48 6 177
9 MALIGNANT NEOPLASMS OF DIGESTIVE ORGANS (C15-C26) Male 0 0 0 0 38 111 224 414 222 363 56 1428
Female 0 0 0 0 26 49 142 174 105 166 31 693
Total 0 0 0 0 64 160 366 588 327 529 87 2121
67

<1 1-4 5-14 15-24 25-34 35-44 45-54 55-64 65-69 70+ NS TOTAL
1 2 3 4 5 6 7 8 9 10 11 12 13 14 15
TABLE 2 : MEDICALLY CERTIFIED DEATHS BY AGE , SEX AND MAJOR CAUSE GROUPS BASED ON 10TH REVISION OF ICD DURING THE YEAR 2012
KARNATAKA
SL.
NO.CAUSE OF DEATH SEX
AGE GROUPS
1 MALIGNANT NEOPLASM OF OESOPHAGUS (C15) Male 0 0 0 0 4 12 42 86 43 73 13 273
Female 0 0 0 0 3 13 27 32 16 32 4 127
2 MALIGNANT NEOPLASM OF STOMACH (C16) Male 0 0 0 0 6 19 50 104 53 79 11 322
Female 0 0 0 0 6 8 39 43 27 30 8 161
3 MALIGNANT NEOPLASMS OF SMALL INTESTINE INCLUDING DUODENUM (C17) Male 0 0 0 0 0 0 2 11 0 1 0 14
Female 0 0 0 0 0 0 5 2 0 0 0 7
4 MALIGNANT NEOPLASM OF COLON (C18) Male 0 0 0 0 7 9 14 42 13 38 5 128
Female 0 0 0 0 4 4 12 18 5 34 6 83
5 MALIGNANT NEOPLASMS OF RECTOSIGMOID JUNCTION,RECTUM,ANUS AND ANAL Male 0 0 0 0 9 19 22 21 27 28 5 131
CANAL (C19-C21) Female 0 0 0 0 6 8 16 19 6 16 7 78
6 MALIGNANT NEOPLASMS OF LIVER AND INTRAHEPATIC BILE DUCTS (C22) Male 0 0 0 0 8 21 64 99 51 108 17 368
Female 0 0 0 0 2 3 25 34 33 24 3 124
7 MALIGNANT NEOPLASM OF PANCREAS (C25) Male 0 0 0 0 3 17 15 24 17 26 2 104
Female 0 0 0 0 3 11 11 16 8 15 0 64
8 OTHER MALIGNANT NEOPLASM OF DIGESTIVE ORGANS (C23-C24,C26) Male 0 0 0 0 1 14 15 27 18 10 3 88
Female 0 0 0 0 2 2 7 10 10 15 3 49
10 MALIGNANT NEOPLASMS OF RESPIRATORY & INTRATHORACIC ORGANS Male 0 0 0 0 10 52 144 257 111 198 36 808
(C30-C39) Female 0 0 0 0 9 14 44 51 33 55 12 218
Total 0 0 0 0 19 66 188 308 144 253 48 1026
1 MALIGNANT NEOPLASM OF LARYNX (C32) Male 0 0 0 0 0 4 29 45 15 34 13 140
Female 0 0 0 0 1 1 4 2 3 9 4 24
2 MALIGNANT NEOPLASMS OF TRACHEA, BRONCHUS AND LUNG (C33-C34) Male 0 0 0 0 9 45 110 204 95 157 22 642
Female 0 0 0 0 8 13 37 45 28 46 7 184
3 OTHER MALIGNANT NEOPLASMS OF RESPIRATORY AND INTRATHORACIC ORGANS Male 0 0 0 0 1 3 5 8 1 7 1 26
(C30-C31,C37-C39) Female 0 0 0 0 0 0 3 4 2 0 1 10
68
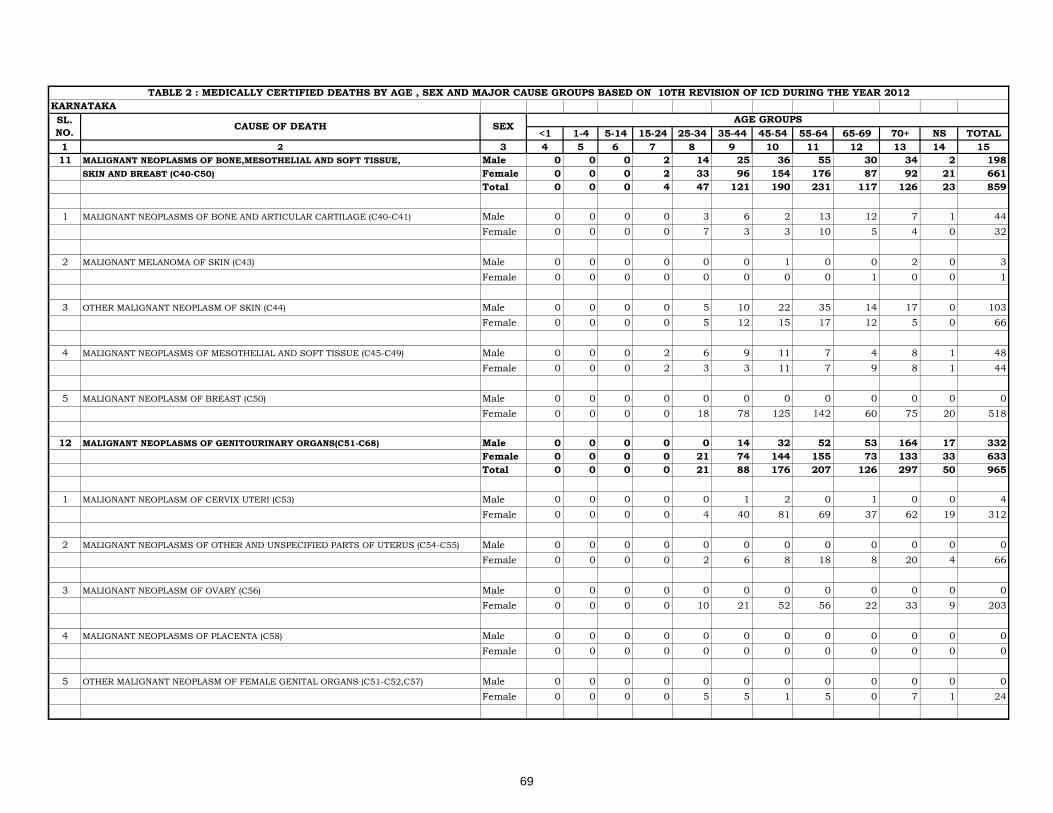
<1 1-4 5-14 15-24 25-34 35-44 45-54 55-64 65-69 70+ NS TOTAL
1 2 3 4 5 6 7 8 9 10 11 12 13 14 15
TABLE 2 : MEDICALLY CERTIFIED DEATHS BY AGE , SEX AND MAJOR CAUSE GROUPS BASED ON 10TH REVISION OF ICD DURING THE YEAR 2012
KARNATAKA
SL.
NO.CAUSE OF DEATH SEX
AGE GROUPS
11 MALIGNANT NEOPLASMS OF BONE,MESOTHELIAL AND SOFT TISSUE, Male 0 0 0 2 14 25 36 55 30 34 2 198
SKIN AND BREAST (C40-C50) Female 0 0 0 2 33 96 154 176 87 92 21 661
Total 0 0 0 4 47 121 190 231 117 126 23 859
1 MALIGNANT NEOPLASMS OF BONE AND ARTICULAR CARTILAGE (C40-C41) Male 0 0 0 0 3 6 2 13 12 7 1 44
Female 0 0 0 0 7 3 3 10 5 4 0 32
2 MALIGNANT MELANOMA OF SKIN (C43) Male 0 0 0 0 0 0 1 0 0 2 0 3
Female 0 0 0 0 0 0 0 0 1 0 0 1
3 OTHER MALIGNANT NEOPLASM OF SKIN (C44) Male 0 0 0 0 5 10 22 35 14 17 0 103
Female 0 0 0 0 5 12 15 17 12 5 0 66
4 MALIGNANT NEOPLASMS OF MESOTHELIAL AND SOFT TISSUE (C45-C49) Male 0 0 0 2 6 9 11 7 4 8 1 48
Female 0 0 0 2 3 3 11 7 9 8 1 44
5 MALIGNANT NEOPLASM OF BREAST (C50) Male 0 0 0 0 0 0 0 0 0 0 0 0
Female 0 0 0 0 18 78 125 142 60 75 20 518
12 MALIGNANT NEOPLASMS OF GENITOURINARY ORGANS(C51-C68) Male 0 0 0 0 0 14 32 52 53 164 17 332
Female 0 0 0 0 21 74 144 155 73 133 33 633
Total 0 0 0 0 21 88 176 207 126 297 50 965
1 MALIGNANT NEOPLASM OF CERVIX UTERI (C53) Male 0 0 0 0 0 1 2 0 1 0 0 4
Female 0 0 0 0 4 40 81 69 37 62 19 312
2 MALIGNANT NEOPLASMS OF OTHER AND UNSPECIFIED PARTS OF UTERUS (C54-C55) Male 0 0 0 0 0 0 0 0 0 0 0 0
Female 0 0 0 0 2 6 8 18 8 20 4 66
3 MALIGNANT NEOPLASM OF OVARY (C56) Male 0 0 0 0 0 0 0 0 0 0 0 0
Female 0 0 0 0 10 21 52 56 22 33 9 203
4 MALIGNANT NEOPLASMS OF PLACENTA (C58) Male 0 0 0 0 0 0 0 0 0 0 0 0
Female 0 0 0 0 0 0 0 0 0 0 0 0
5 OTHER MALIGNANT NEOPLASM OF FEMALE GENITAL ORGANS (C51-C52,C57) Male 0 0 0 0 0 0 0 0 0 0 0 0
Female 0 0 0 0 5 5 1 5 0 7 1 24
69

<1 1-4 5-14 15-24 25-34 35-44 45-54 55-64 65-69 70+ NS TOTAL
1 2 3 4 5 6 7 8 9 10 11 12 13 14 15
TABLE 2 : MEDICALLY CERTIFIED DEATHS BY AGE , SEX AND MAJOR CAUSE GROUPS BASED ON 10TH REVISION OF ICD DURING THE YEAR 2012
KARNATAKA
SL.
NO.CAUSE OF DEATH SEX
AGE GROUPS
6 MALIGNANT NEOPLASM OF PROSTATE (C61) Male 0 0 0 0 0 1 11 24 29 84 10 159
Female 0 0 0 0 0 0 0 0 0 0 0 0
7 OTHER MALIGNANT NEOPLASM OF MALE GENITAL ORGANS (C60-C62,C63) Male 0 0 0 0 0 8 11 10 6 17 1 53
Female 0 0 0 0 0 0 0 0 0 0 0 0
8 MALIGNANT NEOPLASM OF BLADDER (C67) Male 0 0 0 0 0 3 2 11 7 30 3 56
Female 0 0 0 0 0 2 2 5 2 9 0 20
9 OTHER MALIGNANT NEOPLASM OF URINARY TRACT (C64-C66,C68) Male 0 0 0 0 0 1 6 7 10 33 3 60
Female 0 0 0 0 0 0 0 2 4 2 0 8
13 MALIGNANT NEOPLASMS OF EYE,BRAIN AND OTHER PARTS OF CENTRAL Male 0 3 4 10 10 16 33 26 28 17 4 151
NERVOUS SYSTEM (C69-C72) Female 0 3 6 2 15 13 18 24 3 16 6 106
Total 0 6 10 12 25 29 51 50 31 33 10 257
1 MALIGNANT NEOPLASMS OF EYE & ADNEXA (C69) Male 0 1 0 0 0 0 1 0 0 0 0 2
Female 0 1 0 0 0 0 0 2 0 0 0 3
2 MALIGNANT NEOPLASMS OF MENINGES,BRAIN AND OTHER PARTS OF CENTRAL Male 0 2 4 10 10 16 32 26 28 17 4 149
NERVOUS SYSTEM (C70-C72) Female 0 2 6 2 15 13 18 22 3 16 6 103
14 MALIGNANT NEOPLASMS OF OTHER AND UNSPECIFIED SITES Male 0 0 0 17 15 60 68 148 46 101 27 482
(C73-C80 & C97) Female 0 2 1 10 17 40 64 89 47 57 13 340
Total 0 2 1 27 32 100 132 237 93 158 40 822
1 MALIGNANT NEOPLASMS OF OTHER ILL-DEFINED, SECONDARY, UNSPECIFIED Male 0 0 0 17 15 60 68 148 46 101 27 482
AND MULTIPLE SITES (C73-C80 & C97) Female 0 2 1 10 17 40 64 89 47 57 13 340
15 MALIGNANT NEOPLASMS OF LYMPHOID, HAEMATOPOIETIC AND RELATED Male 3 16 26 107 98 71 98 99 69 72 21 680
TISSUE (C81-C96) Female 0 8 20 46 34 55 71 65 26 40 6 371
Total 3 24 46 153 132 126 169 164 95 112 27 1051
1 HODGKIN'S DISEASE(C81) Male 0 0 0 0 0 0 0 0 0 0 0 0
Female 0 0 0 0 0 1 0 0 0 0 0 1
2 NON HODGKIN'S LYMPHOMA(C82-C85) Male 0 0 1 30 33 27 35 40 26 25 9 226
Female 0 0 2 18 16 15 23 23 4 13 1 115
70
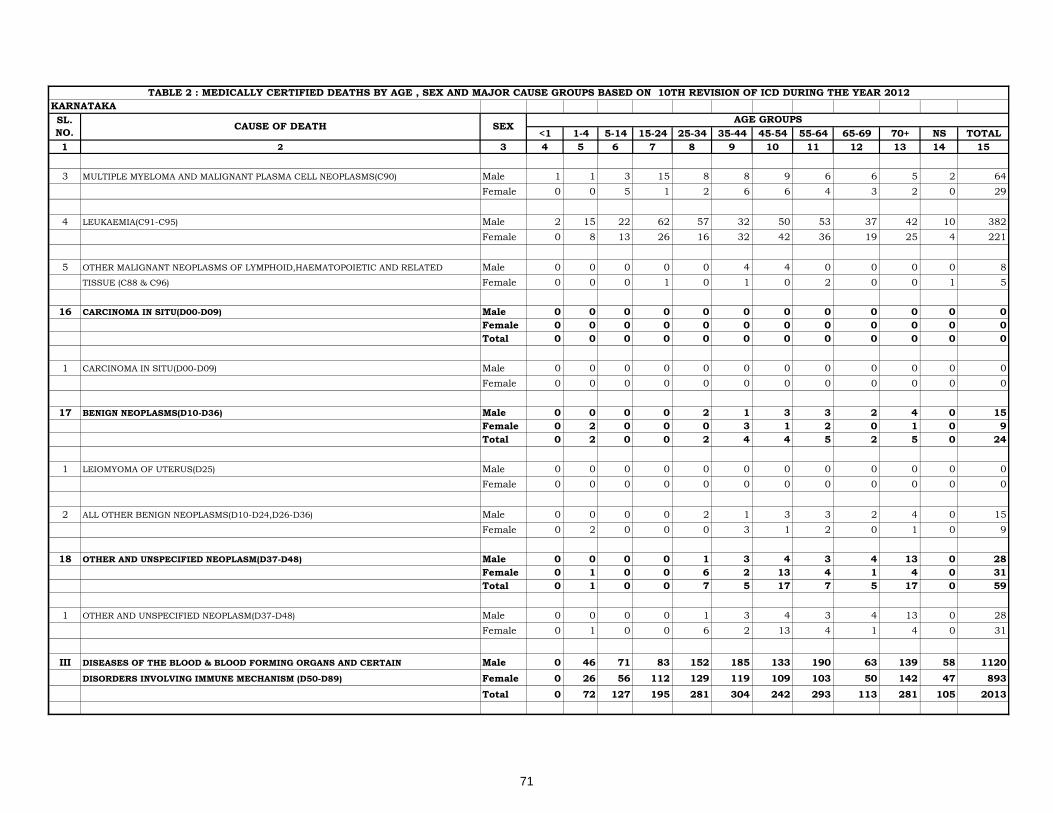
<1 1-4 5-14 15-24 25-34 35-44 45-54 55-64 65-69 70+ NS TOTAL
1 2 3 4 5 6 7 8 9 10 11 12 13 14 15
TABLE 2 : MEDICALLY CERTIFIED DEATHS BY AGE , SEX AND MAJOR CAUSE GROUPS BASED ON 10TH REVISION OF ICD DURING THE YEAR 2012
KARNATAKA
SL.
NO.CAUSE OF DEATH SEX
AGE GROUPS
3 MULTIPLE MYELOMA AND MALIGNANT PLASMA CELL NEOPLASMS(C90) Male 1 1 3 15 8 8 9 6 6 5 2 64
Female 0 0 5 1 2 6 6 4 3 2 0 29
4 LEUKAEMIA(C91-C95) Male 2 15 22 62 57 32 50 53 37 42 10 382
Female 0 8 13 26 16 32 42 36 19 25 4 221
5 OTHER MALIGNANT NEOPLASMS OF LYMPHOID,HAEMATOPOIETIC AND RELATED Male 0 0 0 0 0 4 4 0 0 0 0 8
TISSUE (C88 & C96) Female 0 0 0 1 0 1 0 2 0 0 1 5
16 CARCINOMA IN SITU(D00-D09) Male 0 0 0 0 0 0 0 0 0 0 0 0
Female 0 0 0 0 0 0 0 0 0 0 0 0
Total 0 0 0 0 0 0 0 0 0 0 0 0
1 CARCINOMA IN SITU(D00-D09) Male 0 0 0 0 0 0 0 0 0 0 0 0
Female 0 0 0 0 0 0 0 0 0 0 0 0
17 BENIGN NEOPLASMS(D10-D36) Male 0 0 0 0 2 1 3 3 2 4 0 15
Female 0 2 0 0 0 3 1 2 0 1 0 9
Total 0 2 0 0 2 4 4 5 2 5 0 24
1 LEIOMYOMA OF UTERUS(D25) Male 0 0 0 0 0 0 0 0 0 0 0 0
Female 0 0 0 0 0 0 0 0 0 0 0 0
2 ALL OTHER BENIGN NEOPLASMS(D10-D24,D26-D36) Male 0 0 0 0 2 1 3 3 2 4 0 15
Female 0 2 0 0 0 3 1 2 0 1 0 9
18 OTHER AND UNSPECIFIED NEOPLASM(D37-D48) Male 0 0 0 0 1 3 4 3 4 13 0 28
Female 0 1 0 0 6 2 13 4 1 4 0 31
Total 0 1 0 0 7 5 17 7 5 17 0 59
1 OTHER AND UNSPECIFIED NEOPLASM(D37-D48) Male 0 0 0 0 1 3 4 3 4 13 0 28
Female 0 1 0 0 6 2 13 4 1 4 0 31
III DISEASES OF THE BLOOD & BLOOD FORMING ORGANS AND CERTAIN Male 0 46 71 83 152 185 133 190 63 139 58 1120
DISORDERS INVOLVING IMMUNE MECHANISM (D50-D89) Female 0 26 56 112 129 119 109 103 50 142 47 893
Total 0 72 127 195 281 304 242 293 113 281 105 2013
71

<1 1-4 5-14 15-24 25-34 35-44 45-54 55-64 65-69 70+ NS TOTAL
1 2 3 4 5 6 7 8 9 10 11 12 13 14 15
TABLE 2 : MEDICALLY CERTIFIED DEATHS BY AGE , SEX AND MAJOR CAUSE GROUPS BASED ON 10TH REVISION OF ICD DURING THE YEAR 2012
KARNATAKA
SL.
NO.CAUSE OF DEATH SEX
AGE GROUPS
19 DISEASES OF THE BLOOD & BLOOD FORMING ORGANS AND CERTAIN Male 0 46 71 83 152 185 133 190 63 139 58 1120
DISORDERS INVOLVIN IMMUNE MECHANISM (D50-D89) Female 0 26 56 112 129 119 109 103 50 142 47 893
Total 0 72 127 195 281 304 242 293 113 281 105 2013
1 THALASSAEMIA(D56) Male 0 3 5 0 0 0 0 0 0 0 1 9
Female 0 2 1 0 0 0 0 0 0 0 0 3
2 OTHER ANAEMIAS(D50-D55,D57-D64) Male 0 20 51 64 119 159 99 157 49 119 47 884
Female 0 14 44 76 114 99 87 80 40 130 43 727
3 ALL OTHER DISEASES OF BLOOD & BLOOD FORMING ORGANS (D65-D77) Male 0 22 15 18 28 20 30 33 13 20 8 207
Female 0 10 10 30 12 17 18 23 10 12 4 146
4 CERTAIN DISORDERS INVOLVING THE IMMUNE MECHANISM(D80-D89) Male 0 1 0 1 5 6 4 0 1 0 2 20
Female 0 0 1 6 3 3 4 0 0 0 0 17
IV ENDOCRINE, NUTRITIONAL AND METABOLIC DISEASES(E00-E89) Male 0 5 6 23 108 350 655 1035 723 1694 275 4874
Female 0 8 8 31 63 192 367 648 493 1252 170 3232
Total 0 13 14 54 171 542 1022 1683 1216 2946 445 8106
20 MALNUTRITION(E40-E46) Male 0 3 3 1 2 2 11 9 1 12 2 46
Female 0 4 4 5 6 0 3 7 3 11 2 45
Total 0 7 7 6 8 2 14 16 4 23 4 91
1 KWASHIORKOR(E40) Male 0 1 2 0 0 2 2 3 1 3 2 16
Female 0 1 1 2 4 0 1 5 3 3 2 22
2 NUTRITIONAL MARASMUS(E41) Male 0 1 1 0 2 0 8 5 0 6 0 23
Female 0 2 2 0 1 0 1 1 0 3 0 10
3 OTHER PROTEIN-ENERGY MALNUTRITION(E42-E46) Male 0 1 0 1 0 0 1 1 0 3 0 7
Female 0 1 1 3 1 0 1 1 0 5 0 13
21 ENDOCRINE,OTHER NUTRITIONAL AND METABOLIC DISEASES Male 0 2 3 22 106 348 644 1026 722 1682 273 4828
(E00-E34 & E50-E89) Female 0 4 4 26 57 192 364 641 490 1241 168 3187
Total 0 6 7 48 163 540 1008 1667 1212 2923 441 8015
1 DISORDERS OF THYROID GLAND(E00-E07) Male 0 0 0 0 10 11 11 9 5 16 2 64
Female 0 0 0 0 16 14 27 28 19 36 7 147
72

<1 1-4 5-14 15-24 25-34 35-44 45-54 55-64 65-69 70+ NS TOTAL
1 2 3 4 5 6 7 8 9 10 11 12 13 14 15
TABLE 2 : MEDICALLY CERTIFIED DEATHS BY AGE , SEX AND MAJOR CAUSE GROUPS BASED ON 10TH REVISION OF ICD DURING THE YEAR 2012
KARNATAKA
SL.
NO.CAUSE OF DEATH SEX
AGE GROUPS
2 DIABETES MELLITUS(E10-E14) Male 0 0 0 16 64 294 579 954 672 1566 239 4384
Female 0 0 0 19 30 154 311 573 444 1113 150 2794
3 ALL OTHER NUTRITIONAL DEFICIENCIES(E50-E64) Male 0 0 0 0 2 4 8 2 0 1 1 18
Female 0 0 0 0 0 0 0 0 0 0 0 0
4 ALL OTHER ENDOCRINE AND METABOLIC DISEASES(E15-E34 & E65-E89) Male 0 2 3 6 30 39 46 61 45 99 31 362
Female 0 4 4 7 11 24 26 40 27 92 11 246
V MENTAL AND BEHAVIOURAL DISORDERS (F01-F99) Male 0 0 1 4 9 29 34 9 3 6 6 101
Female 0 0 0 1 3 5 1 10 3 0 1 24
Total 0 0 1 5 12 34 35 19 6 6 7 125
22 MENTAL AND BEHAVIOURAL DISORDERS (F01-F99) Male 0 0 1 4 9 29 34 9 3 6 6 101
Female 0 0 0 1 3 5 1 10 3 0 1 24
Total 0 0 1 5 12 34 35 19 6 6 7 125
1 MENTAL AND BEHAVIOURAL DISORDERS DUE TO PSYCHOACTIVE SUBSTANCE USE Male 0 0 0 2 4 24 23 8 1 2 4 68
(F10-F19) Female 0 0 0 0 2 4 0 4 1 0 0 11
2 SCHIZOPHRENIA, SCHIZOTYPAL & DELUSIONAL DISORDERS(F20-F29) Male 0 0 0 2 4 3 7 0 2 3 1 22
Female 0 0 0 1 1 1 1 4 1 0 1 10
3 ALL OTHER MENTAL BEHAVIOURAL DISORDERS(F01-F09,F30-F99) Male 0 0 1 0 1 2 4 1 0 1 1 11
Female 0 0 0 0 0 0 0 2 1 0 0 3
VI DISEASES OF THE NERVOUS SYSTEM(G00-G98) Male 184 151 146 174 174 249 213 260 148 276 99 2074
Female 120 102 115 146 79 122 107 111 84 168 41 1195
Total 304 253 261 320 253 371 320 371 232 444 140 3269
23 INFLAMMATORY DISEASES OF THE CENTRAL NERVOUS SYTEM(G00-G09) Male 175 121 84 119 99 144 83 112 59 53 51 1100
Female 104 85 77 103 52 67 44 68 51 42 15 708
Total 279 206 161 222 151 211 127 180 110 95 66 1808
1 MENINGITIS(G00 & G03) Male 113 66 27 61 53 107 40 50 26 27 26 596
Female 70 43 17 54 20 45 21 38 19 19 3 349
2 ENCEPHALITIS,MYELITIS AND ENCEPHALOMYELITIS(G04) Male 62 55 55 45 28 29 30 49 31 23 24 431
Female 33 42 56 31 15 13 15 28 30 16 4 283
73
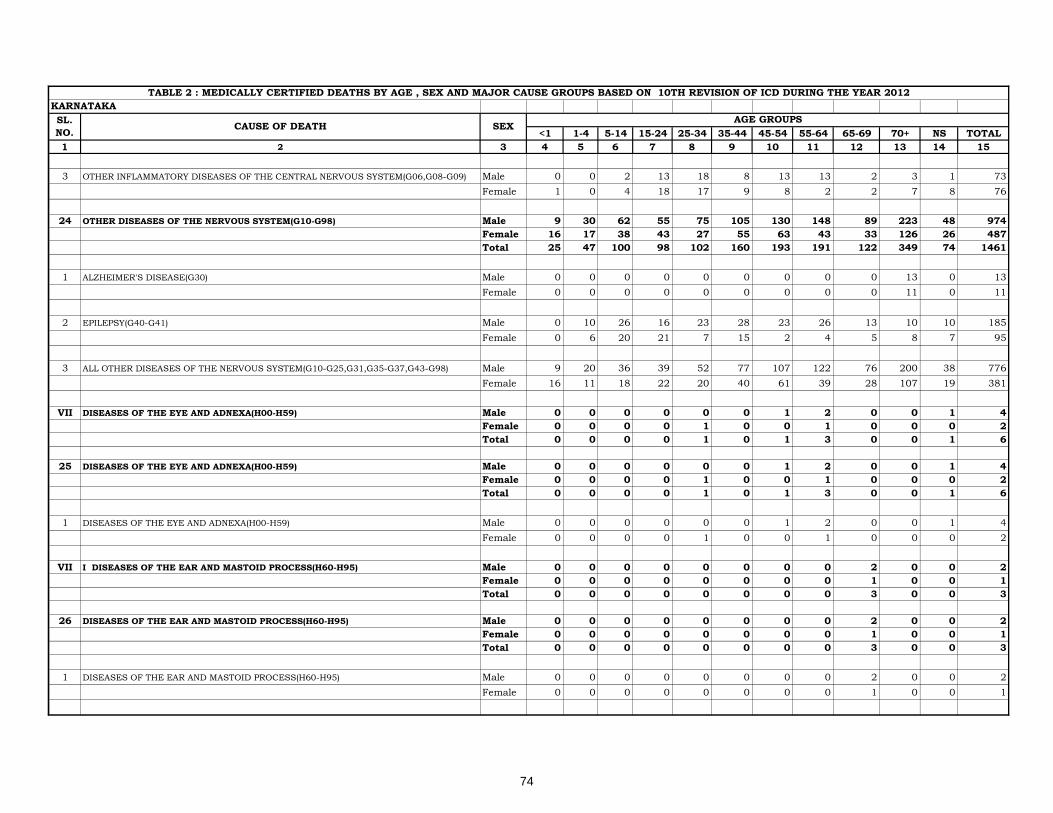
<1 1-4 5-14 15-24 25-34 35-44 45-54 55-64 65-69 70+ NS TOTAL
1 2 3 4 5 6 7 8 9 10 11 12 13 14 15
TABLE 2 : MEDICALLY CERTIFIED DEATHS BY AGE , SEX AND MAJOR CAUSE GROUPS BASED ON 10TH REVISION OF ICD DURING THE YEAR 2012
KARNATAKA
SL.
NO.CAUSE OF DEATH SEX
AGE GROUPS
3 OTHER INFLAMMATORY DISEASES OF THE CENTRAL NERVOUS SYSTEM(G06,G08-G09) Male 0 0 2 13 18 8 13 13 2 3 1 73
Female 1 0 4 18 17 9 8 2 2 7 8 76
24 OTHER DISEASES OF THE NERVOUS SYSTEM(G10-G98) Male 9 30 62 55 75 105 130 148 89 223 48 974
Female 16 17 38 43 27 55 63 43 33 126 26 487
Total 25 47 100 98 102 160 193 191 122 349 74 1461
1 ALZHEIMER'S DISEASE(G30) Male 0 0 0 0 0 0 0 0 0 13 0 13
Female 0 0 0 0 0 0 0 0 0 11 0 11
2 EPILEPSY(G40-G41) Male 0 10 26 16 23 28 23 26 13 10 10 185
Female 0 6 20 21 7 15 2 4 5 8 7 95
3 ALL OTHER DISEASES OF THE NERVOUS SYSTEM(G10-G25,G31,G35-G37,G43-G98) Male 9 20 36 39 52 77 107 122 76 200 38 776
Female 16 11 18 22 20 40 61 39 28 107 19 381
VII DISEASES OF THE EYE AND ADNEXA(H00-H59) Male 0 0 0 0 0 0 1 2 0 0 1 4
Female 0 0 0 0 1 0 0 1 0 0 0 2
Total 0 0 0 0 1 0 1 3 0 0 1 6
25 DISEASES OF THE EYE AND ADNEXA(H00-H59) Male 0 0 0 0 0 0 1 2 0 0 1 4
Female 0 0 0 0 1 0 0 1 0 0 0 2
Total 0 0 0 0 1 0 1 3 0 0 1 6
1 DISEASES OF THE EYE AND ADNEXA(H00-H59) Male 0 0 0 0 0 0 1 2 0 0 1 4
Female 0 0 0 0 1 0 0 1 0 0 0 2
VII I DISEASES OF THE EAR AND MASTOID PROCESS(H60-H95) Male 0 0 0 0 0 0 0 0 2 0 0 2
Female 0 0 0 0 0 0 0 0 1 0 0 1
Total 0 0 0 0 0 0 0 0 3 0 0 3
26 DISEASES OF THE EAR AND MASTOID PROCESS(H60-H95) Male 0 0 0 0 0 0 0 0 2 0 0 2
Female 0 0 0 0 0 0 0 0 1 0 0 1
Total 0 0 0 0 0 0 0 0 3 0 0 3
1 DISEASES OF THE EAR AND MASTOID PROCESS(H60-H95) Male 0 0 0 0 0 0 0 0 2 0 0 2
Female 0 0 0 0 0 0 0 0 1 0 0 1
74
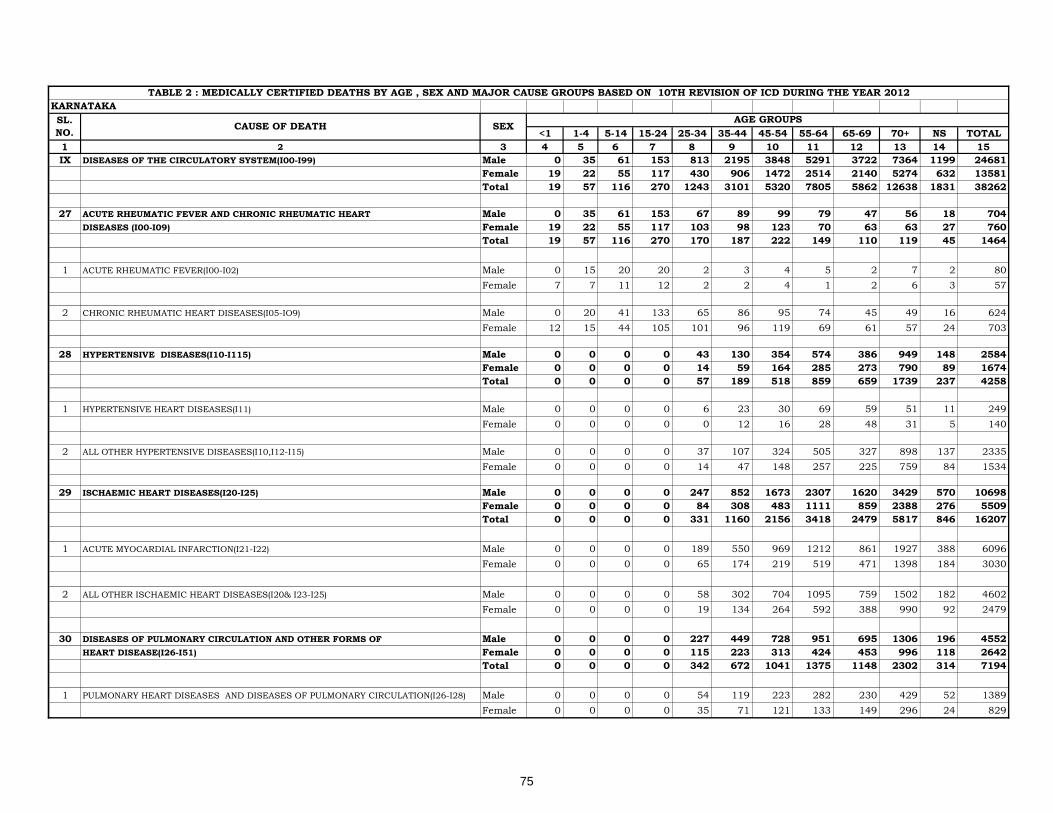
<1 1-4 5-14 15-24 25-34 35-44 45-54 55-64 65-69 70+ NS TOTAL
1 2 3 4 5 6 7 8 9 10 11 12 13 14 15
TABLE 2 : MEDICALLY CERTIFIED DEATHS BY AGE , SEX AND MAJOR CAUSE GROUPS BASED ON 10TH REVISION OF ICD DURING THE YEAR 2012
KARNATAKA
SL.
NO.CAUSE OF DEATH SEX
AGE GROUPS
IX DISEASES OF THE CIRCULATORY SYSTEM(I00-I99) Male 0 35 61 153 813 2195 3848 5291 3722 7364 1199 24681
Female 19 22 55 117 430 906 1472 2514 2140 5274 632 13581
Total 19 57 116 270 1243 3101 5320 7805 5862 12638 1831 38262
27 ACUTE RHEUMATIC FEVER AND CHRONIC RHEUMATIC HEART Male 0 35 61 153 67 89 99 79 47 56 18 704
DISEASES (I00-I09) Female 19 22 55 117 103 98 123 70 63 63 27 760
Total 19 57 116 270 170 187 222 149 110 119 45 1464
1 ACUTE RHEUMATIC FEVER(I00-I02) Male 0 15 20 20 2 3 4 5 2 7 2 80
Female 7 7 11 12 2 2 4 1 2 6 3 57
2 CHRONIC RHEUMATIC HEART DISEASES(I05-IO9) Male 0 20 41 133 65 86 95 74 45 49 16 624
Female 12 15 44 105 101 96 119 69 61 57 24 703
28 HYPERTENSIVE DISEASES(I10-I115) Male 0 0 0 0 43 130 354 574 386 949 148 2584
Female 0 0 0 0 14 59 164 285 273 790 89 1674
Total 0 0 0 0 57 189 518 859 659 1739 237 4258
1 HYPERTENSIVE HEART DISEASES(I11) Male 0 0 0 0 6 23 30 69 59 51 11 249
Female 0 0 0 0 0 12 16 28 48 31 5 140
2 ALL OTHER HYPERTENSIVE DISEASES(I10,I12-I15) Male 0 0 0 0 37 107 324 505 327 898 137 2335
Female 0 0 0 0 14 47 148 257 225 759 84 1534
29 ISCHAEMIC HEART DISEASES(I20-I25) Male 0 0 0 0 247 852 1673 2307 1620 3429 570 10698
Female 0 0 0 0 84 308 483 1111 859 2388 276 5509
Total 0 0 0 0 331 1160 2156 3418 2479 5817 846 16207
1 ACUTE MYOCARDIAL INFARCTION(I21-I22) Male 0 0 0 0 189 550 969 1212 861 1927 388 6096
Female 0 0 0 0 65 174 219 519 471 1398 184 3030
2 ALL OTHER ISCHAEMIC HEART DISEASES(I20& I23-I25) Male 0 0 0 0 58 302 704 1095 759 1502 182 4602
Female 0 0 0 0 19 134 264 592 388 990 92 2479
30 DISEASES OF PULMONARY CIRCULATION AND OTHER FORMS OF Male 0 0 0 0 227 449 728 951 695 1306 196 4552
HEART DISEASE(I26-I51) Female 0 0 0 0 115 223 313 424 453 996 118 2642
Total 0 0 0 0 342 672 1041 1375 1148 2302 314 7194
1 PULMONARY HEART DISEASES AND DISEASES OF PULMONARY CIRCULATION(I26-I28) Male 0 0 0 0 54 119 223 282 230 429 52 1389
Female 0 0 0 0 35 71 121 133 149 296 24 829
75

<1 1-4 5-14 15-24 25-34 35-44 45-54 55-64 65-69 70+ NS TOTAL
1 2 3 4 5 6 7 8 9 10 11 12 13 14 15
TABLE 2 : MEDICALLY CERTIFIED DEATHS BY AGE , SEX AND MAJOR CAUSE GROUPS BASED ON 10TH REVISION OF ICD DURING THE YEAR 2012
KARNATAKA
SL.
NO.CAUSE OF DEATH SEX
AGE GROUPS
2 OTHER FORMS OF HEART DISEASES(I30-I51) Male 0 0 0 0 173 330 505 669 465 877 144 3163
Female 0 0 0 0 80 152 192 291 304 700 94 1813
31 CEREBROVASCULAR DISEASES(I60-I69) Male 0 0 0 0 207 577 880 1230 891 1515 238 5538
Female 0 0 0 0 101 199 355 574 447 955 103 2734
Total 0 0 0 0 308 776 1235 1804 1338 2470 341 8272
1 CEREBROVASCULAR DISEASES(I60-I69) Male 0 0 0 0 207 577 880 1230 891 1515 238 5538
Female 0 0 0 0 101 199 355 574 447 955 103 2734
32 OTHER DISEASES OF THE CIRCULATORY SYSTEM(I70-I99) Male 0 0 0 0 22 98 114 150 83 109 29 605
Female 0 0 0 0 13 19 34 50 45 82 19 262
Total 0 0 0 0 35 117 148 200 128 191 48 867
1 ATHEROSCLEROSIS(I70) Male 0 0 0 0 3 8 14 20 10 21 3 79
Female 0 0 0 0 3 3 6 7 5 13 4 41
2 ARTERIAL EMBOLISM AND THROMBOSIS(I74) Male 0 0 0 0 1 5 4 1 2 6 1 20
Female 0 0 0 0 2 0 3 4 3 3 0 15
3 OTHER DISEASES OF ARTERIES, ARTERIOLES & CAPILLARIES(I71-I73 & I77-I78) Male 0 0 0 0 3 6 13 38 19 38 8 125
Female 0 0 0 0 1 3 4 16 10 22 4 60
4 PHLEBITIS,THROMBOPHLEBITIS,VENOUS EMBOLISM AND THROMBOSIS(I80-I82) Male 0 0 0 0 12 48 51 49 23 29 10 222
Female 0 0 0 0 5 8 11 9 10 18 4 65
5 ALL OTHER DISEASES OF THE CIRCULATORY SYSTEM(I83-I99) Male 0 0 0 0 3 31 32 42 29 15 7 159
Female 0 0 0 0 2 5 10 14 17 26 7 81
X DISEASES OF THE RESPIRATORY SYSTEM(J00-J98) Male 11 65 74 123 285 732 1019 1270 851 1896 352 6678
Female 5 62 63 143 191 380 404 514 409 1061 148 3380
Total 16 127 137 266 476 1112 1423 1784 1260 2957 500 10058
33 DISEASES OF THE UPPER RESPIRATORY TRACT(J00-J06 & J30-J39) Male 8 10 2 2 2 5 6 7 11 12 0 65
Female 4 4 2 1 1 2 1 4 1 6 0 26
Total 12 14 4 3 3 7 7 11 12 18 0 91
1 ACUTE PHARYNGITIS AND ACUTE TONSILLITIS(J02-J03) Male 6 7 2 0 0 1 1 1 0 0 0 18
Female 4 3 2 0 0 0 0 0 0 1 0 10
76

<1 1-4 5-14 15-24 25-34 35-44 45-54 55-64 65-69 70+ NS TOTAL
1 2 3 4 5 6 7 8 9 10 11 12 13 14 15
TABLE 2 : MEDICALLY CERTIFIED DEATHS BY AGE , SEX AND MAJOR CAUSE GROUPS BASED ON 10TH REVISION OF ICD DURING THE YEAR 2012
KARNATAKA
SL.
NO.CAUSE OF DEATH SEX
AGE GROUPS
2 ACUTE LARYNGITIS AND TRACHEITIS(J04) Male 0 2 0 0 0 0 0 0 0 0 0 2
Female 0 0 0 0 0 0 0 0 0 0 0 0
3 OTHER ACUTE UPPER RESPIRATORY INFECTIONS(J00-J01 & J05-J06) Male 2 0 0 0 0 0 0 0 0 0 0 2
Female 0 0 0 1 0 0 0 0 0 0 0 1
4 ALL OTHER DISEASES OF UPPER RESPIRATORY TRACT(J30-J39) Male 0 1 0 2 2 4 5 6 11 12 0 43
Female 0 1 0 0 1 2 1 4 1 5 0 15
34 LOWER RESPIRATORY DISEASES(J20-J22 & J40-J47) Male 1 2 0 0 36 240 390 676 529 1140 195 3209
Female 1 0 0 0 28 117 171 241 216 617 78 1469
Total 2 2 0 0 64 357 561 917 745 1757 273 4678
1 ACUTE BRONCHITIS AND ACUTE BRONCHIOLITIS(J20-J21) Male 0 0 0 0 0 0 0 2 2 2 0 6
Female 0 0 0 0 0 0 0 1 0 2 0 3
2 BRONCHITIS, CHRONIC AND UNSPECIFIED EMPHYSEMA(J40-J43) Male 0 0 0 0 1 12 8 26 20 67 13 147
Female 0 0 0 0 3 2 4 10 8 44 2 73
3 ASTHMA(J45-J46) Male 0 0 0 0 6 53 95 116 109 228 37 644
Female 0 0 0 0 6 22 46 73 73 190 31 441
4 OTHER LOWER RESPIRATORY DISORDERS(J22,J44 & J47) Male 1 2 0 0 29 175 287 532 398 843 145 2412
Female 1 0 0 0 19 93 121 157 135 381 45 952
35 OTHER DISEASES OF THE RESPIRATORY SYSTEM(J10-J18,J60-J98) Male 2 53 72 121 247 487 623 587 311 744 157 3404
Female 0 58 61 142 162 261 232 269 192 438 70 1885
Total 2 111 133 263 409 748 855 856 503 1182 227 5289
1 INFLUENZA(J10-J11) Male 0 1 0 0 2 5 4 1 2 0 1 16
Female 0 0 2 1 2 2 4 2 0 2 0 15
2 PNEUMONIA(J12-J18) Male 0 37 48 53 106 175 257 279 157 414 78 1604
Female 0 39 35 69 66 135 103 129 83 204 34 897
3 PLEURISY(J90) Male 0 0 2 9 17 31 30 26 15 39 9 178
Female 0 0 1 2 4 16 11 19 13 22 4 92
77
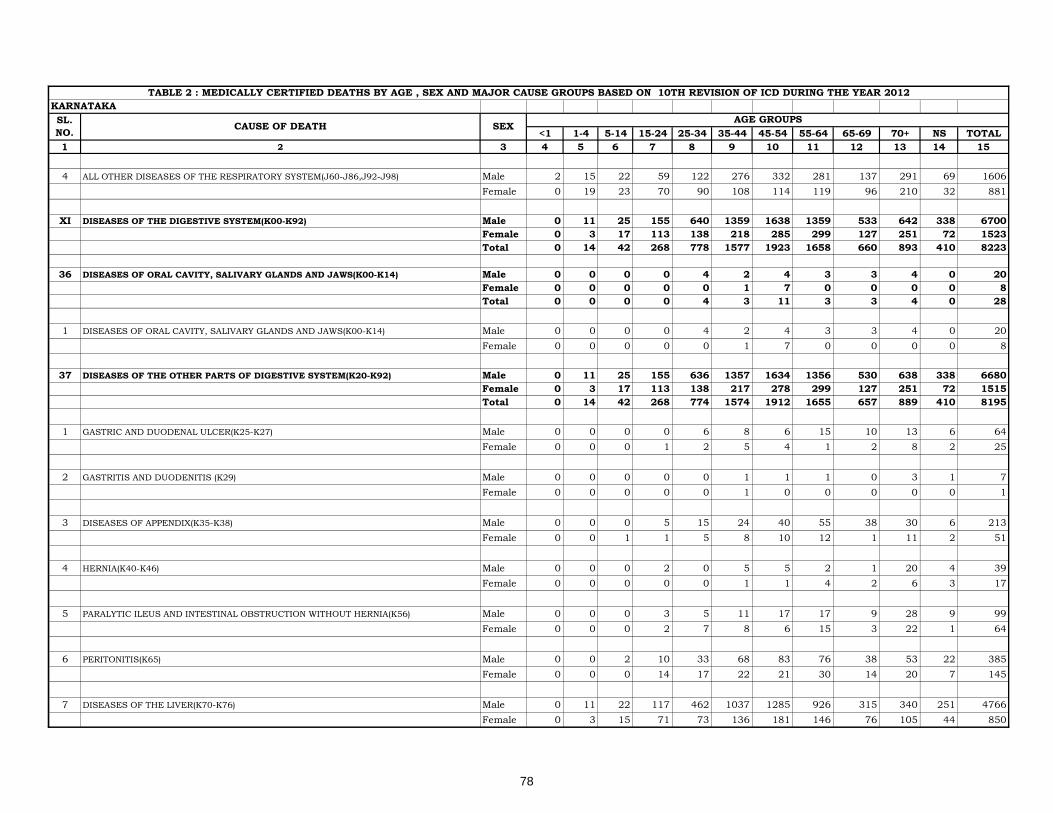
<1 1-4 5-14 15-24 25-34 35-44 45-54 55-64 65-69 70+ NS TOTAL
1 2 3 4 5 6 7 8 9 10 11 12 13 14 15
TABLE 2 : MEDICALLY CERTIFIED DEATHS BY AGE , SEX AND MAJOR CAUSE GROUPS BASED ON 10TH REVISION OF ICD DURING THE YEAR 2012
KARNATAKA
SL.
NO.CAUSE OF DEATH SEX
AGE GROUPS
4 ALL OTHER DISEASES OF THE RESPIRATORY SYSTEM(J60-J86,J92-J98) Male 2 15 22 59 122 276 332 281 137 291 69 1606
Female 0 19 23 70 90 108 114 119 96 210 32 881
XI DISEASES OF THE DIGESTIVE SYSTEM(K00-K92) Male 0 11 25 155 640 1359 1638 1359 533 642 338 6700
Female 0 3 17 113 138 218 285 299 127 251 72 1523
Total 0 14 42 268 778 1577 1923 1658 660 893 410 8223
36 DISEASES OF ORAL CAVITY, SALIVARY GLANDS AND JAWS(K00-K14) Male 0 0 0 0 4 2 4 3 3 4 0 20
Female 0 0 0 0 0 1 7 0 0 0 0 8
Total 0 0 0 0 4 3 11 3 3 4 0 28
1 DISEASES OF ORAL CAVITY, SALIVARY GLANDS AND JAWS(K00-K14) Male 0 0 0 0 4 2 4 3 3 4 0 20
Female 0 0 0 0 0 1 7 0 0 0 0 8
37 DISEASES OF THE OTHER PARTS OF DIGESTIVE SYSTEM(K20-K92) Male 0 11 25 155 636 1357 1634 1356 530 638 338 6680
Female 0 3 17 113 138 217 278 299 127 251 72 1515
Total 0 14 42 268 774 1574 1912 1655 657 889 410 8195
1 GASTRIC AND DUODENAL ULCER(K25-K27) Male 0 0 0 0 6 8 6 15 10 13 6 64
Female 0 0 0 1 2 5 4 1 2 8 2 25
2 GASTRITIS AND DUODENITIS (K29) Male 0 0 0 0 0 1 1 1 0 3 1 7
Female 0 0 0 0 0 1 0 0 0 0 0 1
3 DISEASES OF APPENDIX(K35-K38) Male 0 0 0 5 15 24 40 55 38 30 6 213
Female 0 0 1 1 5 8 10 12 1 11 2 51
4 HERNIA(K40-K46) Male 0 0 0 2 0 5 5 2 1 20 4 39
Female 0 0 0 0 0 1 1 4 2 6 3 17
5 PARALYTIC ILEUS AND INTESTINAL OBSTRUCTION WITHOUT HERNIA(K56) Male 0 0 0 3 5 11 17 17 9 28 9 99
Female 0 0 0 2 7 8 6 15 3 22 1 64
6 PERITONITIS(K65) Male 0 0 2 10 33 68 83 76 38 53 22 385
Female 0 0 0 14 17 22 21 30 14 20 7 145
7 DISEASES OF THE LIVER(K70-K76) Male 0 11 22 117 462 1037 1285 926 315 340 251 4766
Female 0 3 15 71 73 136 181 146 76 105 44 850
78

<1 1-4 5-14 15-24 25-34 35-44 45-54 55-64 65-69 70+ NS TOTAL
1 2 3 4 5 6 7 8 9 10 11 12 13 14 15
TABLE 2 : MEDICALLY CERTIFIED DEATHS BY AGE , SEX AND MAJOR CAUSE GROUPS BASED ON 10TH REVISION OF ICD DURING THE YEAR 2012
KARNATAKA
SL.
NO.CAUSE OF DEATH SEX
AGE GROUPS
8 CHOLELITHIASIS AND CHOLECYSTITIS(K80-K81) Male 0 0 0 1 3 1 9 6 3 12 2 37
Female 0 0 0 0 7 1 5 8 6 11 1 39
9 DISORDERS OF THE PANCREAS(K85-K86) Male 0 0 0 5 57 94 69 39 31 20 9 324
Female 0 0 0 7 10 7 14 2 5 8 4 57
10 ALL OTHER DISEASES OF THE OTHER PARTS OF DIGESTIVE SYSTEM(K20-K22,K28,K30-K31,Male 0 0 1 12 55 108 119 219 85 119 28 746
K50-K55,K57-K63,K66,K82-K83 & K90-K92) Female 0 0 1 17 17 28 36 81 18 60 8 266
XII DISEASES OF THE SKIN AND SUBCUTANEOUS TISSUE(L00-L98) Male 0 0 0 0 27 48 89 105 56 133 18 476
Female 0 0 0 0 23 18 32 52 30 65 10 230
Total 0 0 0 0 50 66 121 157 86 198 28 706
38 DISEASES OF THE SKIN AND SUBCUTANEOUS TISSUE(L00-L98) Male 0 0 0 0 27 48 89 105 56 133 18 476
Female 0 0 0 0 23 18 32 52 30 65 10 230
Total 0 0 0 0 50 66 121 157 86 198 28 706
1 INFECTIONS OF THE SKIN AND SUBCUTANEOUS TISSUE(L00-L98) Male 0 0 0 0 19 35 71 94 49 124 17 409
Female 0 0 0 0 7 9 21 39 28 52 6 162
2 ALL OTHER DISEASES OF THE SKIN AND SUBCUTANEOUS TISSUE(L10-L98) Male 0 0 0 0 8 13 18 11 7 9 1 67
Female 0 0 0 0 16 9 11 13 2 13 4 68
XIII DISEASES OF THE MUSCULOSKELETAL SYSTEM AND CONNECTIVE Male 0 0 0 9 7 13 14 22 16 34 9 124
TISSUE(M00-M99) Female 0 0 0 1 6 11 18 19 14 16 7 92
Total 0 0 0 10 13 24 32 41 30 50 16 216
39 DISEASES OF THE MUSCULOSKELETAL SYSTEM AND CONNECTIVE Male 0 0 0 9 7 13 14 22 16 34 9 124
TISSUE(M00-M99) Female 0 0 0 1 6 11 18 19 14 16 7 92
Total 0 0 0 10 13 24 32 41 30 50 16 216
1 RHEUMATOID ARTHRITIS AND OTHER INFLAMMATORY POLYARTHROPATHIES Male 0 0 0 1 1 2 4 7 4 11 2 32
(M05-M13) Female 0 0 0 0 1 7 7 11 7 12 4 49
2 OSTEOMYELITIS(M86) Male 0 0 0 0 0 0 0 1 0 1 0 2
Female 0 0 0 0 0 0 0 0 1 0 0 1
3 ALL OTHER DISEASES OF THE MUSCULOSKELETAL SYSTEM AND CONNECTIVE TISSUE Male 0 0 0 8 6 11 10 14 12 22 7 90
(M00-M02,M15-M43,M45-M85,M87-M99) Female 0 0 0 1 5 4 11 8 6 4 3 42
79

<1 1-4 5-14 15-24 25-34 35-44 45-54 55-64 65-69 70+ NS TOTAL
1 2 3 4 5 6 7 8 9 10 11 12 13 14 15
TABLE 2 : MEDICALLY CERTIFIED DEATHS BY AGE , SEX AND MAJOR CAUSE GROUPS BASED ON 10TH REVISION OF ICD DURING THE YEAR 2012
KARNATAKA
SL.
NO.CAUSE OF DEATH SEX
AGE GROUPS
XIV DISEASES OF THE GENITOURINARY SYSTEM(N00-N99) Male 0 4 7 15 145 274 443 590 438 687 119 2722
Female 0 4 8 15 96 132 239 318 201 390 54 1457
Total 0 8 15 30 241 406 682 908 639 1077 173 4179
40 DISEASES OF URINARY SYSTEM(N00-N39) Male 0 4 7 15 142 270 437 566 428 664 116 2649
Female 0 4 8 13 93 131 228 315 199 385 54 1430
Total 0 8 15 28 235 401 665 881 627 1049 170 4079
1 GLOMERULAR DISEASES(INCLUDING NEPHRITIC SYNDROME)(N00-N07) Male 0 4 6 5 10 12 10 3 0 2 0 52
Female 0 3 5 3 6 4 7 3 1 5 0 37
2 RENAL TUBULO-INTERSTITIAL DISEASES(N10-N15) Male 0 0 1 3 2 3 9 10 10 15 5 58
Female 0 1 1 5 3 12 12 10 8 11 3 66
3 RENAL FAILURE(N17-N19) Male 0 0 0 0 95 215 340 425 321 452 82 1930
Female 0 0 0 0 63 99 164 213 153 235 36 963
4 UROLITHIASIS(N20-N23) Male 0 0 0 0 0 0 3 1 3 2 0 9
Female 0 0 0 0 0 1 0 0 0 0 1 2
5 OTHER DISORDERS OF KIDNEY AND URETER(N25-N28) Male 0 0 0 5 23 23 52 72 58 63 15 311
Female 0 0 2 2 15 7 24 41 22 56 4 173
6 ALL OTHER DISEASES OF URINARY SYSTEM(N30-N39) Male 0 0 0 2 12 17 23 55 36 130 14 289
Female 0 0 0 3 6 8 21 48 15 78 10 189
41 OTHER DISEASES OF THE GENITOURINARY SYSTEM(N40-N99) Male 0 0 0 0 3 4 6 24 10 23 3 73
Female 0 0 0 2 3 1 11 3 2 5 0 27
Total 0 0 0 2 6 5 17 27 12 28 3 100
1 HYPERPLASIA OF PROSTATE(N40) Male 0 0 0 0 0 0 1 1 1 11 0 14
Female 0 0 0 0 0 0 0 0 0 0 0 0
2 ALL OTHER DISEASES OF MALE GENITAL ORGANS(N41-N50) Male 0 0 0 0 3 4 5 23 9 12 3 59
Female 0 0 0 0 0 0 0 0 0 0 0 0
3 SALPINGITIS AND OOPHORITIS(N70) Male 0 0 0 0 0 0 0 0 0 0 0 0
Female 0 0 0 0 0 0 2 0 1 0 0 3
80

<1 1-4 5-14 15-24 25-34 35-44 45-54 55-64 65-69 70+ NS TOTAL
1 2 3 4 5 6 7 8 9 10 11 12 13 14 15
TABLE 2 : MEDICALLY CERTIFIED DEATHS BY AGE , SEX AND MAJOR CAUSE GROUPS BASED ON 10TH REVISION OF ICD DURING THE YEAR 2012
KARNATAKA
SL.
NO.CAUSE OF DEATH SEX
AGE GROUPS
4 ALL OTHER DISEASES OF FEMALE GENITAL ORGANS(N60-N64,N71-N76,N80-N99) Male 0 0 0 0 0 0 0 0 0 0 0 0
Female 0 0 0 2 3 1 9 3 1 5 0 24
XV PREGNANCY, CHILDBIRTH AND THE PUERPERIUM (O00-O99) Female 0 0 0 282 246 113 0 0 0 0 1 642
Total 0 0 0 282 246 113 0 0 0 0 1 642
42 PREGNANCY WITH ABORTIVE OUTCOME (O00-O08) Male 0 0 0 0 0 0 0 0 0 0 0 0
Female 0 0 0 16 12 4 0 0 0 0 0 32
Total 0 0 0 16 12 4 0 0 0 0 0 32
1 SPONTANEOUS ABORTION (O03) Male 0 0 0 0 0 0 0 0 0 0 0 0
Female 0 0 0 0 0 0 0 0 0 0 0 0
2 MEDICAL ABORTION(O04) Male 0 0 0 0 0 0 0 0 0 0 0 0
Female 0 0 0 0 0 0 0 0 0 0 0 0
3 OTHER PREGNANCIES WITH ABORTIVE OUTCOME(O00-O02 & O05-O08) Male 0 0 0 0 0 0 0 0 0 0 0 0
Female 0 0 0 16 12 4 0 0 0 0 0 32
43 OTHER DIRECT OBSTETRIC DEATHS (O10-O92) Male 0 0 0 0 0 0 0 0 0 0 0 0
Female 0 0 0 264 230 105 0 0 0 0 0 599
Total 0 0 0 264 230 105 0 0 0 0 0 599
1 OEDEMA,PROTEINURIA AND HYPERTENSIVE DISORDERS IN PREGNANCY,CHILD Male 0 0 0 0 0 0 0 0 0 0 0 0
BIRTH AND PUERPERIUM (O10-O16) Female 0 0 0 61 46 18 0 0 0 0 0 125
2 INFECTIONS OF GENITOURINARY TRACT IN PREGNANCY(O23) Male 0 0 0 0 0 0 0 0 0 0 0 0
Female 0 0 0 0 0 0 0 0 0 0 0 0
3 OBSTRUCTED LABOUR(O64-O66) Male 0 0 0 0 0 0 0 0 0 0 0 0
Female 0 0 0 1 0 1 0 0 0 0 0 2
4 COMPLICATIONS PRE-DOMINANTLY RELATED TO THE PUERPERIUM(O85-O92) Male 0 0 0 0 0 0 0 0 0 0 0 0
Female 0 0 0 104 80 36 0 0 0 0 0 220
5 OTHER COMPLICATIONS OF PREGNANCY AND DELIVERY(O20-022,O24-O63,O67-O75, O80-Male 0 0 0 0 0 0 0 0 0 0 0 0
Female 0 0 0 98 104 50 0 0 0 0 0 252
81
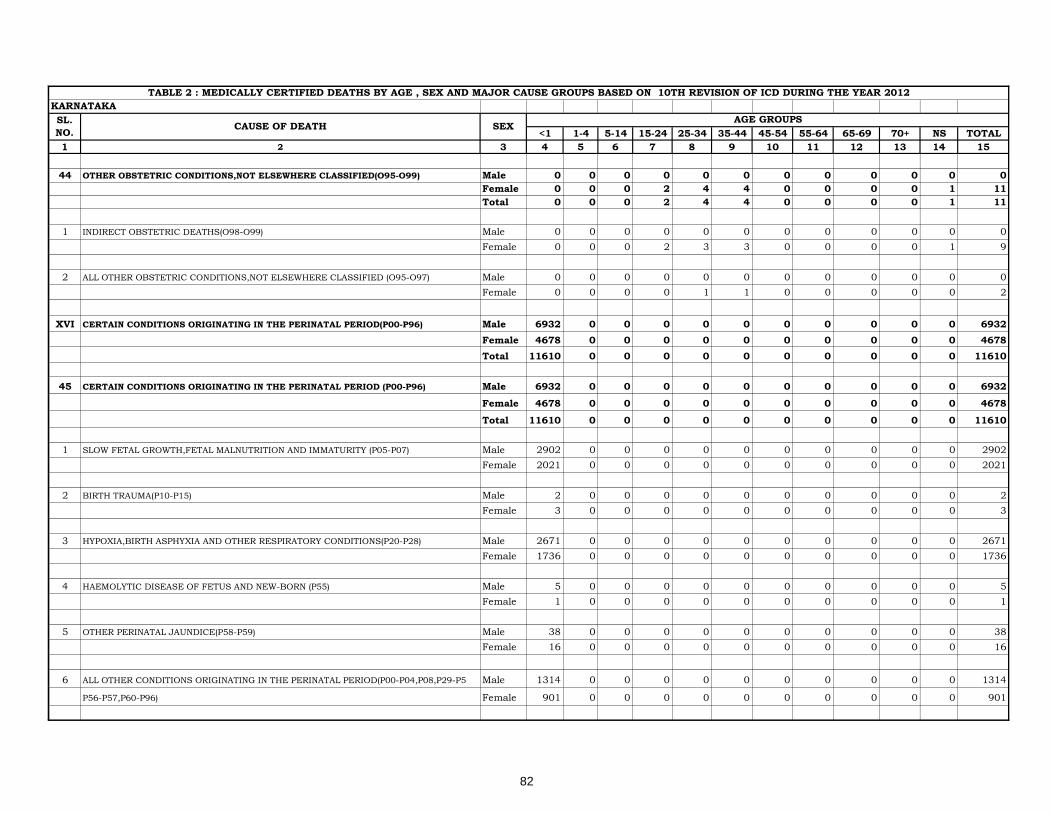
<1 1-4 5-14 15-24 25-34 35-44 45-54 55-64 65-69 70+ NS TOTAL
1 2 3 4 5 6 7 8 9 10 11 12 13 14 15
TABLE 2 : MEDICALLY CERTIFIED DEATHS BY AGE , SEX AND MAJOR CAUSE GROUPS BASED ON 10TH REVISION OF ICD DURING THE YEAR 2012
KARNATAKA
SL.
NO.CAUSE OF DEATH SEX
AGE GROUPS
44 OTHER OBSTETRIC CONDITIONS,NOT ELSEWHERE CLASSIFIED(O95-O99) Male 0 0 0 0 0 0 0 0 0 0 0 0
Female 0 0 0 2 4 4 0 0 0 0 1 11
Total 0 0 0 2 4 4 0 0 0 0 1 11
1 INDIRECT OBSTETRIC DEATHS(O98-O99) Male 0 0 0 0 0 0 0 0 0 0 0 0
Female 0 0 0 2 3 3 0 0 0 0 1 9
2 ALL OTHER OBSTETRIC CONDITIONS,NOT ELSEWHERE CLASSIFIED (O95-O97) Male 0 0 0 0 0 0 0 0 0 0 0 0
Female 0 0 0 0 1 1 0 0 0 0 0 2
XVI CERTAIN CONDITIONS ORIGINATING IN THE PERINATAL PERIOD(P00-P96) Male 6932 0 0 0 0 0 0 0 0 0 0 6932
Female 4678 0 0 0 0 0 0 0 0 0 0 4678
Total 11610 0 0 0 0 0 0 0 0 0 0 11610
45 CERTAIN CONDITIONS ORIGINATING IN THE PERINATAL PERIOD (P00-P96) Male 6932 0 0 0 0 0 0 0 0 0 0 6932
Female 4678 0 0 0 0 0 0 0 0 0 0 4678
Total 11610 0 0 0 0 0 0 0 0 0 0 11610
1 SLOW FETAL GROWTH,FETAL MALNUTRITION AND IMMATURITY (P05-P07) Male 2902 0 0 0 0 0 0 0 0 0 0 2902
Female 2021 0 0 0 0 0 0 0 0 0 0 2021
2 BIRTH TRAUMA(P10-P15) Male 2 0 0 0 0 0 0 0 0 0 0 2
Female 3 0 0 0 0 0 0 0 0 0 0 3
3 HYPOXIA,BIRTH ASPHYXIA AND OTHER RESPIRATORY CONDITIONS(P20-P28) Male 2671 0 0 0 0 0 0 0 0 0 0 2671
Female 1736 0 0 0 0 0 0 0 0 0 0 1736
4 HAEMOLYTIC DISEASE OF FETUS AND NEW-BORN (P55) Male 5 0 0 0 0 0 0 0 0 0 0 5
Female 1 0 0 0 0 0 0 0 0 0 0 1
5 OTHER PERINATAL JAUNDICE(P58-P59) Male 38 0 0 0 0 0 0 0 0 0 0 38
Female 16 0 0 0 0 0 0 0 0 0 0 16
6 ALL OTHER CONDITIONS ORIGINATING IN THE PERINATAL PERIOD(P00-P04,P08,P29-P5 Male 1314 0 0 0 0 0 0 0 0 0 0 1314
P56-P57,P60-P96) Female 901 0 0 0 0 0 0 0 0 0 0 901
82

<1 1-4 5-14 15-24 25-34 35-44 45-54 55-64 65-69 70+ NS TOTAL
1 2 3 4 5 6 7 8 9 10 11 12 13 14 15
TABLE 2 : MEDICALLY CERTIFIED DEATHS BY AGE , SEX AND MAJOR CAUSE GROUPS BASED ON 10TH REVISION OF ICD DURING THE YEAR 2012
KARNATAKA
SL.
NO.CAUSE OF DEATH SEX
AGE GROUPS
XVII CONGENITAL MALFORMATIONS,DEFORMATIONS & CHROMOSOMAL Male 647 142 118 27 0 0 0 0 0 0 20 954
ABNORMALITIES (Q00-Q99) Female 458 116 72 12 0 0 0 0 0 0 7 665
Total 1105 258 190 39 0 0 0 0 0 0 27 1619
46 CONGENITAL MALFORMATIONS,DEFORMATIONS & CHROMOSOMAL Male 647 142 118 27 0 0 0 0 0 0 20 954
ABNORMALITIES (Q00-Q99) Female 458 116 72 12 0 0 0 0 0 0 7 665
Total 1105 258 190 39 0 0 0 0 0 0 27 1619
1 SPINA BIFIDA(Q05) Male 13 1 0 0 0 0 0 0 0 0 2 16
Female 12 1 1 0 0 0 0 0 0 0 0 14
2 CONGENITAL MALFORMATIONS OF THE CIRCULATORY SYSTEM(Q20-Q28) Male 383 61 51 13 0 0 0 0 0 0 13 521
Female 292 68 31 9 0 0 0 0 0 0 0 400
3 CLEFT LIP AND CLEFT PALATE(Q35-Q37) Male 0 0 0 0 0 0 0 0 0 0 0 0
Female 0 0 0 0 0 0 0 0 0 0 0 0
4 ALL OTHER CONGENITAL MALFORMATIONS,DEFORMATIONS & CHROMOSOMAL Male 251 80 67 14 0 0 0 0 0 0 5 417
ABNORMALITIES ELSEWHERE CLASSIFIED(Q00-Q04,Q06-Q07,Q10-Q18,Q30-Q34,Q38-Q99) Female 154 47 40 3 0 0 0 0 0 0 7 251
XVIII SYMPTOMS,SIGNS AND ABNORMAL CLINICAL & LABORATORY FINDINGS, FMale 0 3 11 26 35 71 92 96 85 311 63 793
NOT ELSEWHERE CLASSIFIED (R00-R99) Female 0 3 7 24 21 29 25 45 38 216 39 447
Total 0 6 18 50 56 100 117 141 123 527 102 1240
47 SYMPTOMS,SIGNS AND ABNORMAL CLINICAL & LABORATORY FINDINGS Male 0 3 11 26 35 71 92 96 85 311 63 793
NOT ELSEWHERE CLASSIFIED (R00-R99) Female 0 3 7 24 21 29 25 45 38 216 39 447
Total 0 6 18 50 56 100 117 141 123 527 102 1240
1 ABDOMINAL AND PELVIC PAIN(R10) Male 0 0 0 3 1 2 1 6 2 3 2 20
Female 0 0 0 1 1 2 1 1 2 3 4 15
2 ASCITES(R18) Male 0 0 0 0 0 0 0 0 0 0 0 0
Female 0 0 0 0 0 0 0 0 0 0 0 0
3 SOMNOLENCE, STUPOR AND COMA(R40) Male 0 0 0 0 0 0 0 0 0 0 0 0
Female 0 0 0 0 0 0 0 0 0 0 0 0
4 FEVER OF UNKNOWN ORIGIN(R50) Male 0 1 1 2 4 2 5 3 0 6 2 26
Female 0 0 1 2 1 2 4 6 0 3 3 22
83
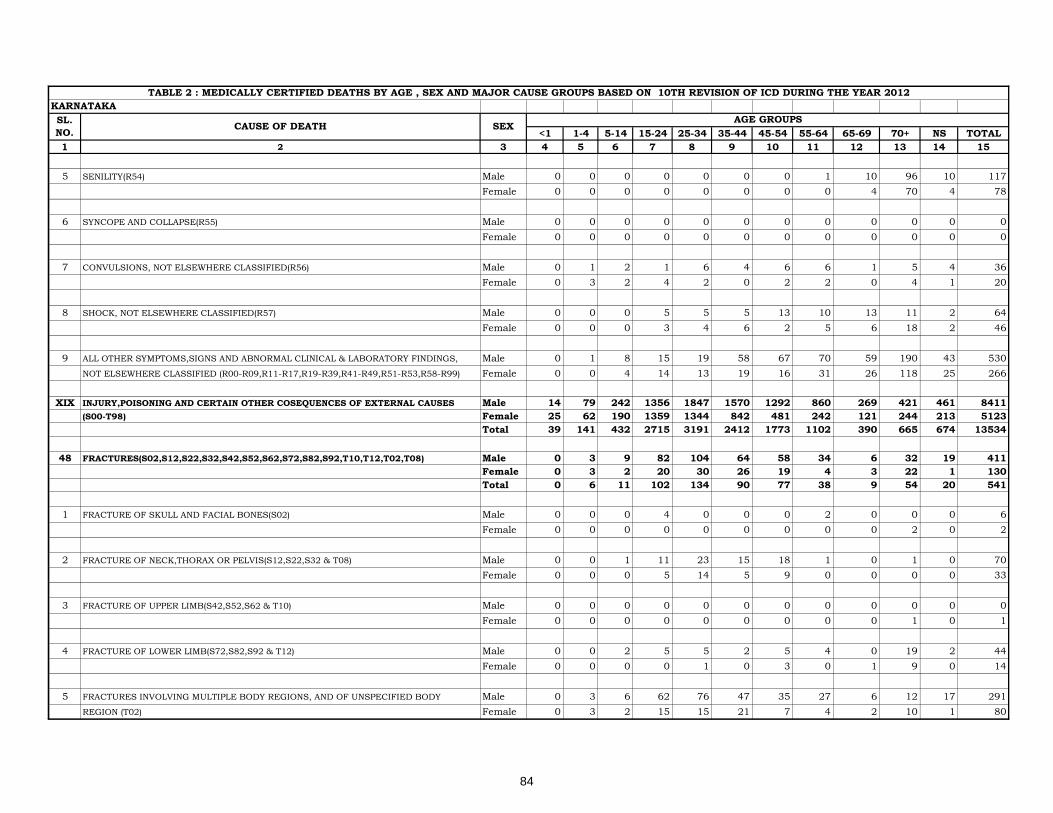
<1 1-4 5-14 15-24 25-34 35-44 45-54 55-64 65-69 70+ NS TOTAL
1 2 3 4 5 6 7 8 9 10 11 12 13 14 15
TABLE 2 : MEDICALLY CERTIFIED DEATHS BY AGE , SEX AND MAJOR CAUSE GROUPS BASED ON 10TH REVISION OF ICD DURING THE YEAR 2012
KARNATAKA
SL.
NO.CAUSE OF DEATH SEX
AGE GROUPS
5 SENILITY(R54) Male 0 0 0 0 0 0 0 1 10 96 10 117
Female 0 0 0 0 0 0 0 0 4 70 4 78
6 SYNCOPE AND COLLAPSE(R55) Male 0 0 0 0 0 0 0 0 0 0 0 0
Female 0 0 0 0 0 0 0 0 0 0 0 0
7 CONVULSIONS, NOT ELSEWHERE CLASSIFIED(R56) Male 0 1 2 1 6 4 6 6 1 5 4 36
Female 0 3 2 4 2 0 2 2 0 4 1 20
8 SHOCK, NOT ELSEWHERE CLASSIFIED(R57) Male 0 0 0 5 5 5 13 10 13 11 2 64
Female 0 0 0 3 4 6 2 5 6 18 2 46
9 ALL OTHER SYMPTOMS,SIGNS AND ABNORMAL CLINICAL & LABORATORY FINDINGS, Male 0 1 8 15 19 58 67 70 59 190 43 530
NOT ELSEWHERE CLASSIFIED (R00-R09,R11-R17,R19-R39,R41-R49,R51-R53,R58-R99) Female 0 0 4 14 13 19 16 31 26 118 25 266
XIX INJURY,POISONING AND CERTAIN OTHER COSEQUENCES OF EXTERNAL CAUSES Male 14 79 242 1356 1847 1570 1292 860 269 421 461 8411
(S00-T98) Female 25 62 190 1359 1344 842 481 242 121 244 213 5123
Total 39 141 432 2715 3191 2412 1773 1102 390 665 674 13534
48 FRACTURES(S02,S12,S22,S32,S42,S52,S62,S72,S82,S92,T10,T12,T02,T08) Male 0 3 9 82 104 64 58 34 6 32 19 411
Female 0 3 2 20 30 26 19 4 3 22 1 130
Total 0 6 11 102 134 90 77 38 9 54 20 541
1 FRACTURE OF SKULL AND FACIAL BONES(S02) Male 0 0 0 4 0 0 0 2 0 0 0 6
Female 0 0 0 0 0 0 0 0 0 2 0 2
2 FRACTURE OF NECK,THORAX OR PELVIS(S12,S22,S32 & T08) Male 0 0 1 11 23 15 18 1 0 1 0 70
Female 0 0 0 5 14 5 9 0 0 0 0 33
3 FRACTURE OF UPPER LIMB(S42,S52,S62 & T10) Male 0 0 0 0 0 0 0 0 0 0 0 0
Female 0 0 0 0 0 0 0 0 0 1 0 1
4 FRACTURE OF LOWER LIMB(S72,S82,S92 & T12) Male 0 0 2 5 5 2 5 4 0 19 2 44
Female 0 0 0 0 1 0 3 0 1 9 0 14
5 FRACTURES INVOLVING MULTIPLE BODY REGIONS, AND OF UNSPECIFIED BODY Male 0 3 6 62 76 47 35 27 6 12 17 291
REGION (T02) Female 0 3 2 15 15 21 7 4 2 10 1 80
84
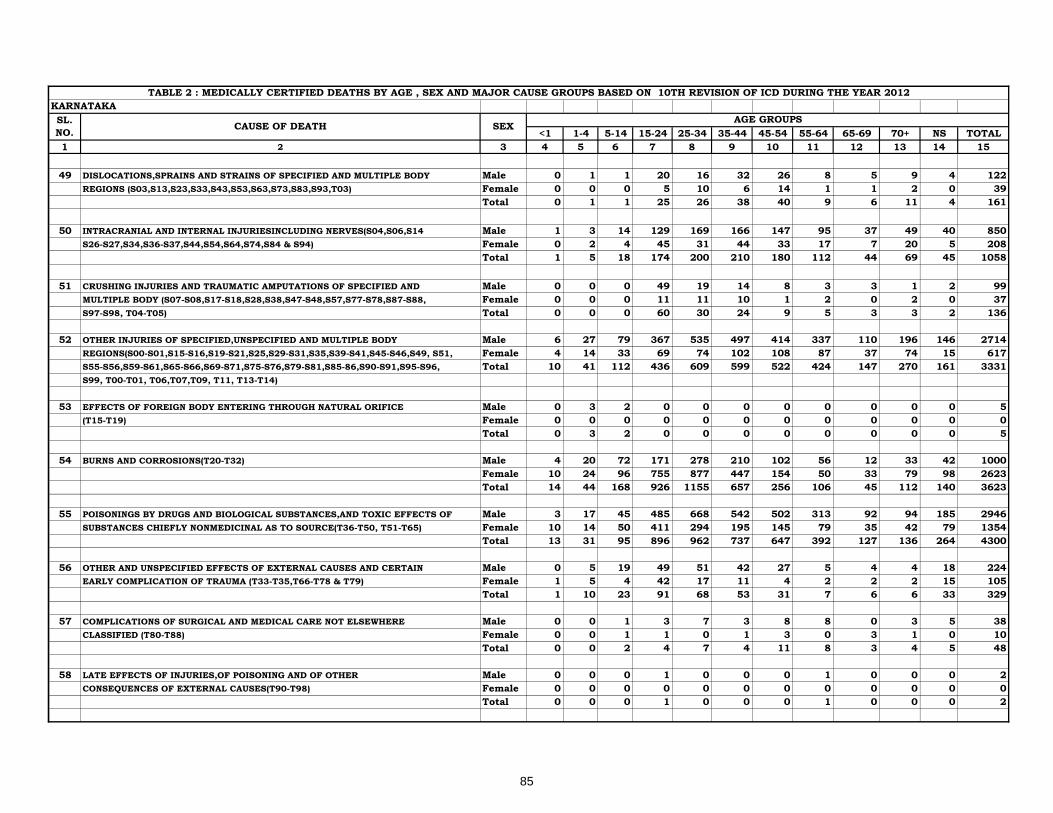
<1 1-4 5-14 15-24 25-34 35-44 45-54 55-64 65-69 70+ NS TOTAL
1 2 3 4 5 6 7 8 9 10 11 12 13 14 15
TABLE 2 : MEDICALLY CERTIFIED DEATHS BY AGE , SEX AND MAJOR CAUSE GROUPS BASED ON 10TH REVISION OF ICD DURING THE YEAR 2012
KARNATAKA
SL.
NO.CAUSE OF DEATH SEX
AGE GROUPS
49 DISLOCATIONS,SPRAINS AND STRAINS OF SPECIFIED AND MULTIPLE BODY Male 0 1 1 20 16 32 26 8 5 9 4 122
REGIONS (S03,S13,S23,S33,S43,S53,S63,S73,S83,S93,T03) Female 0 0 0 5 10 6 14 1 1 2 0 39
Total 0 1 1 25 26 38 40 9 6 11 4 161
50 INTRACRANIAL AND INTERNAL INJURIESINCLUDING NERVES(S04,S06,S14 Male 1 3 14 129 169 166 147 95 37 49 40 850
S26-S27,S34,S36-S37,S44,S54,S64,S74,S84 & S94) Female 0 2 4 45 31 44 33 17 7 20 5 208
Total 1 5 18 174 200 210 180 112 44 69 45 1058
51 CRUSHING INJURIES AND TRAUMATIC AMPUTATIONS OF SPECIFIED AND Male 0 0 0 49 19 14 8 3 3 1 2 99
MULTIPLE BODY (S07-S08,S17-S18,S28,S38,S47-S48,S57,S77-S78,S87-S88, Female 0 0 0 11 11 10 1 2 0 2 0 37
S97-S98, T04-T05) Total 0 0 0 60 30 24 9 5 3 3 2 136
52 OTHER INJURIES OF SPECIFIED,UNSPECIFIED AND MULTIPLE BODY Male 6 27 79 367 535 497 414 337 110 196 146 2714
REGIONS(S00-S01,S15-S16,S19-S21,S25,S29-S31,S35,S39-S41,S45-S46,S49, S51, Female 4 14 33 69 74 102 108 87 37 74 15 617
S55-S56,S59-S61,S65-S66,S69-S71,S75-S76,S79-S81,S85-86,S90-S91,S95-S96, Total 10 41 112 436 609 599 522 424 147 270 161 3331
S99, T00-T01, T06,T07,T09, T11, T13-T14)
53 EFFECTS OF FOREIGN BODY ENTERING THROUGH NATURAL ORIFICE Male 0 3 2 0 0 0 0 0 0 0 0 5
(T15-T19) Female 0 0 0 0 0 0 0 0 0 0 0 0
Total 0 3 2 0 0 0 0 0 0 0 0 5
54 BURNS AND CORROSIONS(T20-T32) Male 4 20 72 171 278 210 102 56 12 33 42 1000
Female 10 24 96 755 877 447 154 50 33 79 98 2623
Total 14 44 168 926 1155 657 256 106 45 112 140 3623
55 POISONINGS BY DRUGS AND BIOLOGICAL SUBSTANCES,AND TOXIC EFFECTS OF Male 3 17 45 485 668 542 502 313 92 94 185 2946
SUBSTANCES CHIEFLY NONMEDICINAL AS TO SOURCE(T36-T50, T51-T65) Female 10 14 50 411 294 195 145 79 35 42 79 1354
Total 13 31 95 896 962 737 647 392 127 136 264 4300
56 OTHER AND UNSPECIFIED EFFECTS OF EXTERNAL CAUSES AND CERTAIN Male 0 5 19 49 51 42 27 5 4 4 18 224
EARLY COMPLICATION OF TRAUMA (T33-T35,T66-T78 & T79) Female 1 5 4 42 17 11 4 2 2 2 15 105
Total 1 10 23 91 68 53 31 7 6 6 33 329
57 COMPLICATIONS OF SURGICAL AND MEDICAL CARE NOT ELSEWHERE Male 0 0 1 3 7 3 8 8 0 3 5 38
CLASSIFIED (T80-T88) Female 0 0 1 1 0 1 3 0 3 1 0 10
Total 0 0 2 4 7 4 11 8 3 4 5 48
58 LATE EFFECTS OF INJURIES,OF POISONING AND OF OTHER Male 0 0 0 1 0 0 0 1 0 0 0 2
CONSEQUENCES OF EXTERNAL CAUSES(T90-T98) Female 0 0 0 0 0 0 0 0 0 0 0 0
Total 0 0 0 1 0 0 0 1 0 0 0 2
85

<1 1-4 5-14 15-24 25-34 35-44 45-54 55-64 65-69 70+ NS TOTAL
1 2 3 4 5 6 7 8 9 10 11 12 13 14 15
TABLE 2 : MEDICALLY CERTIFIED DEATHS BY AGE , SEX AND MAJOR CAUSE GROUPS BASED ON 10TH REVISION OF ICD DURING THE YEAR 2012
KARNATAKA
SL.
NO.CAUSE OF DEATH SEX
AGE GROUPS
XX EXTERNAL CAUSES OF MORBIDITY AND MORTALITY(V01-Y89) Male 14 79 242 1356 1847 1570 1292 860 269 421 461 8411
Female 25 62 190 1359 1344 842 481 242 121 244 213 5123
Total 39 141 432 2715 3191 2412 1773 1102 390 665 674 13534
E48 TRANSPORT ACCIDENTS(V01-V99) Male 5 18 64 371 511 482 379 311 88 172 133 2534
Female 1 14 23 60 73 105 109 69 31 57 15 557
Total 6 32 87 431 584 587 488 380 119 229 148 3091
1 RAILWAY ACCIDENTS(V05,V15,V80.6,V81) Male 0 0 0 3 3 4 0 2 0 0 1 13
Female 0 1 0 1 0 2 0 0 0 0 0 4
2 MOTOR VEHICLE TRAFFIC ACCIDENTS(V02-V04,V09.2-V09.3,V12-V14,V20-V29,V30-V39 Male 5 17 64 367 508 478 378 309 88 171 132 2517
V50-V59,V60-V69,V70-V79,V80.3-V80.5,V82.1,V87.0-V87.5&V87.7-V87.8, V88.0, V88.5,V89.2)Female 1 13 23 59 73 103 109 69 31 57 15 553
3 OTHER ROAD VEHICLE ACCIDENTS(V01,V06,V09.0-V09.1,V10-V11,V16-V18,V80.0-V80. Male 0 1 0 0 0 0 0 0 0 1 0 2
V82.0,V82.2-V82.9,V87.9,V88.0-V88.5,V88.7-V88.9 & V89.0-V89.1) Female 0 0 0 0 0 0 0 0 0 0 0 0
4 WATER TRANSPORT ACCIDENTS(V90-V94) Male 0 0 0 0 0 0 0 0 0 0 0 0
Female 0 0 0 0 0 0 0 0 0 0 0 0
5 AIR AND SPACE TRANSPORT ACCIDENTS(V95-V97) Male 0 0 0 0 0 0 0 0 0 0 0 0
Female 0 0 0 0 0 0 0 0 0 0 0 0
6 ALL OTHER TRANSPORT ACCIDENTS(V09.1,V09.9,V19,V83-V86,V89.3,V89.9 & V98-V99) Male 0 0 0 1 0 0 1 0 0 0 0 2
Female 0 0 0 0 0 0 0 0 0 0 0 0
E49 ACCIDENTAL FALLS(W00-W19) Male 1 2 4 26 24 23 28 18 6 17 12 161
Female 3 2 0 1 1 6 3 4 2 14 0 36
Total 4 4 4 27 25 29 31 22 8 31 12 197
E50 ACCIDENTAL DROWING AND SUBMERSION(W65-W74) Male 0 3 7 7 6 0 4 3 1 2 0 33
Female 1 0 2 3 1 2 0 0 1 0 1 11
Total 1 3 9 10 7 2 4 3 2 2 1 44
E51 EXPOSURE TO SMOKE, FIRE AND FLAMES(X00-X09) Male 4 23 69 129 225 174 83 51 13 30 43 844
Female 11 30 96 655 761 381 140 42 28 73 90 2307
Total 15 53 165 784 986 555 223 93 41 103 133 3151
E52 ACCIDENTAL POISOINING BY AND EXPOSURE TO NOXIOUS SUBSTANCES Male 2 4 11 68 73 77 62 52 11 15 25 400
(X40-X49) Female 3 1 4 74 33 25 19 8 9 5 10 191
Total 5 5 15 142 106 102 81 60 20 20 35 591
86

<1 1-4 5-14 15-24 25-34 35-44 45-54 55-64 65-69 70+ NS TOTAL
1 2 3 4 5 6 7 8 9 10 11 12 13 14 15
TABLE 2 : MEDICALLY CERTIFIED DEATHS BY AGE , SEX AND MAJOR CAUSE GROUPS BASED ON 10TH REVISION OF ICD DURING THE YEAR 2012
KARNATAKA
SL.
NO.CAUSE OF DEATH SEX
AGE GROUPS
E53 INTENTIONAL SELF-HARM(SUICIDE-ATTEMPTED)(X60-X84) Male 0 0 12 418 637 480 407 231 66 69 151 2471
Female 0 0 30 424 352 202 116 56 24 28 80 1312
Total 0 0 42 842 989 682 523 287 90 97 231 3783
E54 ASSAULT(HOMICIDE)(X85-Y09) Male 0 0 1 39 34 26 19 9 13 7 6 154
Female 2 0 1 27 21 19 5 2 3 2 4 86
Total 2 0 2 66 55 45 24 11 16 9 10 240
E55 OTHER VIOLENCE(Y10-Y36) Male 0 0 1 14 18 15 20 13 4 0 3 88
Female 0 0 1 10 2 6 3 2 0 1 0 25
Total 0 0 2 24 20 21 23 15 4 1 3 113
1 EVENT OF UNDERTERMINED INTENT(Y10-Y34) Male 0 0 1 14 18 15 20 13 4 0 3 88
Female 0 0 1 10 2 6 3 2 0 1 0 25
2 LEGAL INTERVENTION(Y35) Male 0 0 0 0 0 0 0 0 0 0 0 0
Female 0 0 0 0 0 0 0 0 0 0 0 0
3 OPERATIONS OF WAR(Y36) Male 0 0 0 0 0 0 0 0 0 0 0 0
Female 0 0 0 0 0 0 0 0 0 0 0 0
E56 COMPLICATIONS OF MEDICAL AND SURGICAL CARE(Y40-Y84) Male 0 0 1 8 8 4 4 4 1 2 4 36
Female 0 0 0 1 0 0 1 1 0 0 0 3
Total 0 0 1 9 8 4 5 5 1 2 4 39
1 DRUGS,MEDICAMENTS AND BIOLOGICAL SUBSTANCES CAUSING ADVERSE EFFECTS Male 0 0 0 5 7 2 0 3 0 1 1 19
IN THERAPEUTIC USE (Y40-Y59) Female 0 0 0 0 0 0 0 0 0 0 0 0
2 MISADVENTURES DURING SURGICAL AND MEDICAL CARE, ADVERSE INCIDENTS IN Male 0 0 1 3 1 2 4 1 1 1 3 17
DIAGNOSTIC & THERAPEUTIC USE,ABNORMAL REACTIONS AND LATE Female 0 0 0 1 0 0 1 1 0 0 0 3
COMPLICATIONS(Y60-Y69,Y70-Y82, Y83-Y84)
E57 OTHER EXTERNAL CAUSES OF ACCIDENTAL INJURY,NOT ELSEWHERE CLASSIFIED Male 2 29 72 276 311 289 286 168 66 107 84 1690
(W20-W64,W75-W99,X10-X39,X50-X59) Female 4 15 33 104 100 96 85 58 23 64 13 595
Total 6 44 105 380 411 385 371 226 89 171 97 2285
1 ACCIDENTS CAUSED BY MACHINERY,AND BY CUTTING PIERCING INSTRUMENTS Male 0 0 0 1 0 0 0 0 0 0 0 1
(W24-W31) Female 0 0 0 0 0 0 0 0 0 0 0 0
87

<1 1-4 5-14 15-24 25-34 35-44 45-54 55-64 65-69 70+ NS TOTAL
1 2 3 4 5 6 7 8 9 10 11 12 13 14 15
TABLE 2 : MEDICALLY CERTIFIED DEATHS BY AGE , SEX AND MAJOR CAUSE GROUPS BASED ON 10TH REVISION OF ICD DURING THE YEAR 2012
KARNATAKA
SL.
NO.CAUSE OF DEATH SEX
AGE GROUPS
2 ACCIDENTS CAUSED BY FIREARM MISSILE(W32-W34) Male 0 0 0 0 0 0 0 0 0 0 0 0
Female 0 0 0 0 0 0 0 0 0 0 0 0
3 BITES OF SNAKES AND OTHER VENOMOUS ANIMALS(X20-X27) Male 1 8 24 41 19 26 39 23 11 10 10 212
Female 2 6 17 15 18 25 25 21 4 15 8 156
4 SUN STROKE(X32) Male 0 0 0 0 0 0 0 0 0 0 0 0
Female 0 0 0 0 0 0 0 0 0 0 0 0
5 ALL OTHER ACCIDENTS INCLUDING LATE EFFECTS(W20-W23,W35-W64,W75-W99 Male 1 21 48 234 292 263 247 145 55 97 74 1477
X10-X19,X28-X29,X30-X31,X33-X39 & X50-X59) Female 2 9 16 89 82 71 60 37 19 49 5 439
E58 LATE EFFECTS OF EXTERNAL CAUSES OF MORBIDITY AND MORTALITY Male 0 0 0 0 0 0 0 0 0 0 0 0
(Y85-Y89) Female 0 0 0 0 0 0 0 0 0 0 0 0
Total 0 0 0 0 0 0 0 0 0 0 0 0
ALL CAUSES MALE 7962 809 1095 2817 5405 8932 11702 13477 8216 15694 3610 79719
(MAJOR GROUP 1 TO XIX) FEMALE 5436 648 899 2929 3557 4167 4974 6318 4486 10301 1746 45461
TOTAL 13398 1457 1994 5746 8962 13099 16676 19795 12702 25995 5356 125180
88

2005 2006 2007 2008 2009 2010 2011 2012
1 2 3 5 6 7 8 9 10 11 12
1CERTAIN INFECTIOUS AND PARASITIC
DISEASES(A00-B99)
M
F
T
6978
3430
10408
7531
3801
11332
8512
4152
12664
8183
4365
12548
8317
4646
12963
8876
5024
13900
8477
4689
13166
8528
5057
13585
2 NEOPLASMS (C00-D48)
M
F
T
2764
1878
4624
3163
2358
5521
3291
2238
5529
4117
2940
7057
4594
3219
7813
4367
3200
7567
4366
3213
7579
4545
3239
7784
3
DISEASES OF THE BLOOD & BLOOD FORMING
ORGANS AND CERTAIN DISORDERS INVOLVING
THE IMMUNE MECHANISM(D50-D89)
M
F
T
749
803
1552
829
957
1786
885
916
1801
999
1024
2023
1005
1049
2054
1018
973
1991
1097
912
2009
1120
893
2013
4ENDOCRINE, NUTRITIONAL AND METABOLIC
DISEASES(E00-E89)
M
F
T
3460
2110
5570
4667
2937
7604
4124
2415
6539
4623
3094
7717
4853
3091
7944
4630
3156
7786
4599
3237
7836
4874
3232
8106
5MENTAL AND BEHAVIOURAL DISORDERS
(F01-F99)
M
F
T
312
30
342
195
34
229
241
35
276
122
24
146
100
38
138
89
24
113
74
31
105
101
24
125
6 DISEASES OF THE NERVOUS SYSTEM(G00-G98)
M
F
T
1698
903
2601
1659
1061
2720
1824
1069
2893
1929
1235
3164
2117
1215
3332
2009
1279
3288
2001
1162
3163
2074
1195
3269
7 DISEASES OF THE EYE AND ADNEXA(H00-H59)
M
F
T
1
1
2
0
1
1
0
0
0
2
0
2
2
2
4
1
0
1
2
1
3
4
2
6
8DISEASES OF THE EAR AND MASTOID
PROCESS(H60-H95)
M
F
T
3
1
4
0
0
0
3
0
3
2
0
2
1
3
4
0
2
2
5
3
8
2
1
3
9DISEASES OF THE CIRCULATORY
SYSTEM(I00-I99)
M
F
T
14387
7691
22078
16478
9430
25908
15947
8661
24608
20910
11569
32479
20847
11769
32616
23941
13304
37245
23749
13184
36933
24681
13581
38262
10DISEASES OF THE RESPIRATORY
SYSTEM(J00-J98)
M
F
T
3349
1535
4884
4075
2066
6141
4883
2141
7024
5665
2864
8529
5639
2980
8619
6740
3670
1040
6451
3280
9731
6678
3380
10058
TABLE-3 : Medically Certified Deaths by Sex and Major Cause Groups (based upon tenth revision of ICD) during 2005-2012
Major
Group
No.
Cause of Death Sex
YEAR
89

2005 2006 2007 2008 2009 2010 2011 2012
1 2 3 5 6 7 8 9 10 11 12
TABLE-3 : Medically Certified Deaths by Sex and Major Cause Groups (based upon tenth revision of ICD) during 2005-2012
Major
Group
No.
Cause of Death Sex
YEAR
11DISEASES OF THE DIGESTIVE
SYSTEM(K00-K92)
M
F
T
3986
1235
5221
4914
1254
6168
4897
1265
6162
5279
1450
6729
5468
1501
6969
6225
1634
7859
6466
1608
8074
6700
1523
8223
12DISEASES OF THE SKIN AND SUBCUTANEOUS
TISSUE(L00-L98)
M
F
T
342
202
544
399
169
568
395
198
593
464
240
704
486
257
743
463
225
688
508
264
772
476
230
706
13
DISEASES OF THE MUSCULOSKELETAL SYSTEM
AND CONNECTIVE
TISSUE(M00-M99)
M
F
T
48
59
107
39
50
89
35
31
66
51
58
109
54
46
100
88
66
154
107
84
191
124
92
216
14DISEASES OF THE GENITOURINARY SYSTEM(N00-
N99)
M
F
T
1611
871
2482
1773
1030
2803
2101
1089
3190
2302
1195
3497
2446
1379
3825
2766
1413
4179
2544
1528
4072
2722
1457
4179
15PREGNANCY, CHILDBIRTH AND THE
PUERPERIUM (O00-O99)
M
F
T
0
574
574
0
568
568
0
652
652
0
649
649
0
611
611
0
848
848
0
841
841
0
642
642
16CERTAIN CONDITIONS ORIGINATING IN THE
PERINATAL PERIOD(P00-P96)
M
F
T
4760
3160
7920
4278
2988
7266
5173
3361
8534
5555
3831
9386
6204
4127
10331
6798
4004
10802
7090
4412
11502
6932
4678
11610
17CONGENITAL MALFORMATIONS,DEFORMATIONS
& CHROMOSOMAL ABNORMALITIES(Q00-Q99)
M
F
T
528
389
917
618
388
1006
663
486
1149
979
650
1629
1034
756
1790
1020
676
1696
1101
704
1805
954
665
1619
18
SYMPTOMS,SIGNS AND ABNORMAL CLINICAL &
LABORATORY FINDINGS, NOT ELSEWHERE
CLASSIFIED (R000-R99)
M
F
T
2224
1331
3555
2930
1957
4887
2838
1804
4642
3122
1911
5033
2601
1720
4321
1297
1018
2315
1019
611
1630
793
447
1240
19
INJURY,POISONING AND CERTAIN OTHER
CONSEQUENCES OF EXTERNAL
CAUSES(S00-T98)
M
F
T
5463
2951
8414
5960
3636
9596
7022
3953
10975
7272
4194
11466
7315
3941
11256
6523
3980
10503
8861
4940
13801
8411
5123
13534
M
F
T
52663
29154
81817
59508
34685
94193
62834
34466
97300
71576
41293
112869
73083
42350
115433
76851
44496
121347
78517
44704
123221
79719
45461
125180
ALL CAUSES
90

2005 2006 2007 2008 2009 2010 2011 2012
1 2 3 5 6 7 8 9 10 11 12
1CERTAIN INFECTIOUS AND PARASITIC
DISEASES(A00-B99)
M
F
T
13.25
11.77
12.72
12.66
12.05
12.03
13.55
12.05
13.02
11.43
10.57
11.12
11.38
10.97
11.23
11.55
11.29
11.45
10.80
10.49
10.68
10.70
11.12
10.85
2 NEOPLASMS (C00-D48)
M
F
T
5.25
6.44
5.67
5.32
6.80
5.86
5.24
6.49
5.68
5.75
7.12
6.25
6.29
7.60
6.77
5.68
7.19
6.24
5.56
7.19
6.15
5.70
7.12
6.22
3
DISEASES OF THE BLOOD & BLOOD FORMING
ORGANS AND CERTAIN DISORDERS INVOLVING
THE IMMUNE MECHANISM (D50-D89)
M
F
T
1.42
2.75
1.90
1.39
2.76
1.90
1.41
2.66
1.85
1.40
2.48
1.79
1.38
2.48
1.78
1.32
2.19
1.64
1.40
2.04
1.63
1.40
1.96
1.61
4ENDOCRINE, NUTRITIONAL AND METABOLIC
DISEASES(E00-E89)
M
F
T
6.57
7.24
6.81
7.84
8.47
8.07
6.56
7.01
6.72
6.46
7.49
6.84
6.64
7.30
6.88
6.02
7.09
6.42
5.86
7.24
6.36
6.11
7.11
6.48
5MENTAL AND BEHAVIOURAL DISORDERS
(F01-F99)
M
F
T
0.59
0.10
0.42
0.33
0.10
0.24
0.38
0.10
0.28
0.17
0.06
0.13
0.14
0.09
0.12
0.12
0.05
0.09
0.09
0.07
0.09
0.13
0.05
0.10
6DISEASES OF THE NERVOUS
SYSTEM(G00-G98)
M
F
T
3.22
3.10
3.18
2.79
3.06
2.89
2.90
3.10
2.97
2.70
2.99
2.80
2.90
2.87
2.89
2.16
2.87
2.71
2.55
2.60
2.57
2.60
2.63
2.61
7DISEASES OF THE EYE AND
ADNEXA(H00-H59)
M
F
T
0.00
0.00
0.00
0.00
0.00
0.00
0.00
0.00
0.00
0.00
0.00
0.00
0.00
0.00
0.00
0.00
0.00
0.00
0.00
0.00
0.00
0.01
0.00
0.00
8DISEASES OF THE EAR AND MASTOID
PROCESS(H60-H95)
M
F
T
0.01
0.00
0.00
0.00
0.00
0.00
0.00
0.00
0.00
0.00
0.00
0.00
0.00
0.01
0.00
0.00
0.00
0.00
0.01
0.01
0.01
0.00
0.00
0.00
9DISEASES OF THE CIRCULATORY
SYSTEM(I00-I99)
M
F
T
27.32
26.38
26.98
27.69
27.19
27.51
25.38
25.13
25.29
29.21
28.02
28.78
28.53
27.79
28.26
31.15
29.90
30.69
30.25
29.49
29.97
30.96
29.87
30.57
10DISEASES OF THE RESPIRATORY
SYSTEM(J00-J98)
M
F
T
6.36
5.27
5.97
6.85
5.96
6.52
7.77
6.21
7.22
7.91
6.94
7.56
7.72
7.04
7.47
8.77
8.25
8.58
8.22
7.34
7.90
8.38
7.43
8.03
YEAR
TABLE-4 : PERCENTAGE DISTRIBUTION OF MEDICALLY CERTIFIED DEATHS BY AGE, SEX AND MAJOR
CAUSE GROUPS (BASED UPON TENTH REVISION ICD) DURING 2005 TO 2012
Major
Group No.Cause of Death Sex
91

2005 2006 2007 2008 2009 2010 2011 2012
1 2 3 5 6 7 8 9 10 11 12
YEAR
TABLE-4 : PERCENTAGE DISTRIBUTION OF MEDICALLY CERTIFIED DEATHS BY AGE, SEX AND MAJOR
CAUSE GROUPS (BASED UPON TENTH REVISION ICD) DURING 2005 TO 2012
Major
Group No.Cause of Death Sex
11DISEASES OF THE DIGESTIVE
SYSTEM(K00-K92)
M
F
T
7.57
4.24
6.38
8.26
3.62
6.55
7.79
3.67
6.33
7.38
3.51
5.96
7.48
3.54
6.04
8.10
3.67
6.48
8.24
3.60
6.55
8.40
3.35
6.57
12DISEASES OF THE SKIN AND SUBCUTANEOUS
TISSUE(L00-L98)
M
F
T
0.65
0.69
0.66
0.67
0.49
0.60
0.63
0.57
0.61
0.65
0.58
0.62
0.66
0.61
0.64
0.60
0.51
0.57
0.65
0.59
0.63
0.60
0.51
0.56
13
DISEASES OF THE MUSCULOSKELETAL SYSTEM
AND CONNECTIVE
TISSUE(M00-M99)
M
F
T
0.09
0.20
0.13
0.07
0.14
0.09
0.06
0.09
0.07
0.07
0.14
0.10
0.07
0.11
0.09
0.11
0.15
0.13
0.14
0.19
0.16
0.16
0.20
0.17
14DISEASES OF THE GENITOURINARY SYSTEM(N00-
N99)
M
F
T
3.06
2.99
3.03
2.98
2.97
2.98
3.34
3.16
3.28
3.22
2.89
3.10
3.35
3.26
3.31
3.60
3.18
3.44
3.24
3.42
3.30
3.41
3.20
3.34
15PREGNANCY, CHILDBIRTH AND THE
PUERPERIUM (O00-O99)
M
F
T
0.00
1.97
0.70
0.00
1.64
0.60
0.00
1.89
0.67
0.00
1.57
0.58
0.00
1.44
0.53
0.00
1.91
0.70
0.00
1.88
0.68
0.00
1.41
0.51
16CERTAIN CONDITIONS ORIGINATING IN THE
PERINATAL PERIOD(P00-P96)
M
F
T
9.04
10.84
9.68
7.19
8.61
7.71
8.23
9.75
8.77
7.76
9.28
8.32
8.49
9.74
8.95
8.85
9.00
8.90
9.03
9.87
9.33
8.70
10.29
9.27
17
CONGENITAL MALFORMATIONS,
DEFORMATIONS & CHROMOSOMAL
ABNORMALITIES(Q00-Q99)
M
F
T
1.00
1.33
1.12
1.04
1.12
1.07
1.06
1.41
1.18
1.37
1.57
1.44
1.41
1.79
1.55
1.33
1.52
1.40
1.40
1.57
1.46
1.20
1.46
1.29
18
SYMPTOMS, SIGNS AND ABNORMAL CLINICAL &
LABORATORY FINDINGS, NOT ELSEWHERE
CLASSIFIED (R00-R99)
M
F
T
4.22
4.57
4.35
4.92
5.64
5.19
4.52
5.23
4.77
4.36
4.63
4.46
3.56
4.06
3.74
1.69
2.29
1.91
1.30
1.37
1.32
0.99
0.98
0.99
19
INJURY, POISONING AND CERTAIN OTHER
CONSEQUENCES OF EXTERNAL
CAUSES(S00-T98)
M
F
T
10.37
10.12
10.28
10.02
10.48
10.19
11.18
11.47
11.28
10.16
10.16
10.16
10.01
9.31
9.75
8.49
8.94
8.66
11.29
11.05
11.20
10.55
11.27
10.81
M
F
T
100.00
100.00
100.00
100.00
100.00
100.00
100.00
100.00
100.00
100.00
100.00
100.00
100.00
100.00
100.00
100.00
100.00
100.00
100.00
100.00
100.00
100.00
100.00
100.00ALL CAUSES
92

<1 1-4 5-14 15-24 25-34 35-44 45-54 55-64 65-69 70+ NS TOTAL
1 2 3 4 5 6 7 8 9 10 11 12 13 14 15
Male 2.15 30.78 27.67 18.92 17.74 16.37 12.68 9.01 8.45 6.67 11.41 10.70
Female 2.41 34.57 31.26 17.51 17.57 17.16 15.00 10.49 8.31 5.92 10.08 11.12
Total 2.25 32.46 29.29 18.20 17.67 16.62 13.37 9.48 8.40 6.37 10.98 10.85
Male 0.04 2.35 2.74 4.83 3.77 4.42 6.38 8.71 7.46 6.65 4.99 5.70
Female 0.00 2.47 3.00 2.05 4.55 8.76 13.83 12.33 8.96 5.94 7.33 7.12
Total 0.02 2.40 2.86 3.41 4.08 5.80 8.61 9.87 7.99 6.37 5.75 6.22
Male 0.00 5.69 6.48 2.95 2.81 2.07 1.14 1.41 0.77 0.89 1.61 1.40
Female 0.00 4.01 6.23 3.82 3.63 2.86 2.19 1.63 1.11 1.38 2.69 1.96
Total 0.00 4.94 6.37 3.39 3.14 2.32 1.45 1.48 0.89 1.08 1.96 1.61
Male 0.00 0.62 0.55 0.82 2.00 3.92 5.60 7.68 8.80 10.79 7.62 6.11
Female 0.00 1.23 0.89 1.06 1.77 4.61 7.38 10.26 10.99 12.15 9.74 7.11
Total 0.00 0.89 0.70 0.94 1.91 4.14 6.13 8.50 9.57 11.33 8.31 6.48
Male 0.00 0.00 0.09 0.14 0.17 0.32 0.29 0.07 0.04 0.04 0.17 0.13
Female 0.00 0.00 0.00 0.03 0.08 0.12 0.02 0.16 0.07 0.00 0.06 0.05
Total 0.00 0.00 0.05 0.09 0.13 0.26 0.21 0.10 0.05 0.02 0.13 0.10
Male 2.31 18.67 13.33 6.18 3.22 2.79 1.82 1.93 1.80 1.76 2.74 2.60
Female 2.21 15.74 12.79 4.98 2.22 2.93 2.15 1.76 1.87 1.63 2.35 2.63
Total 2.27 17.36 13.09 5.57 2.82 2.83 1.92 1.87 1.83 1.71 2.61 2.61
Male 0.00 0.00 0.00 0.00 0.00 0.00 0.01 0.01 0.00 0.00 0.03 0.01
Female 0.00 0.00 0.00 0.00 0.03 0.00 0.00 0.02 0.00 0.00 0.00 0.00
Total 0.00 0.00 0.00 0.00 0.01 0.00 0.01 0.02 0.00 0.00 0.02 0.00
7DISEASES OF THE EYE AND
ADNEXA(H00-H59)
5MENTAL AND BEHAVIOURAL
DISORDERS(F01-F99)
6DISEASES OF THE NERVOUS
SYSTEM(G00-G98)
3
DISEASES OF THE BLOOD & BLOOD
FORMING ORGANS AND CERTAIN
DISORDERS INVOLVING THE IMMUNE
MECHANISM (D50-D89)
4ENDOCRINE, NUTRITIONAL AND
METABOLIC DISEASES(E00-E89)
1CERTAIN INFECTIOUS AND PARASITIC
DISEASES(A00-B99)
2 NEOPLASMS (C00-D48)
TABLE 5: PERCENTAGE DISTRIBUTION OF MEDICALLY CERTIFIED DEATHS BY AGE, SEX AND MAJOR CAUSE GROUPS BASED ON 10TH REVISION
OF ICD DURING THE YEAR 2012
KARNATAKA
SL.
NOCAUSE OF DEATH SEX
AGE GROUPS
93
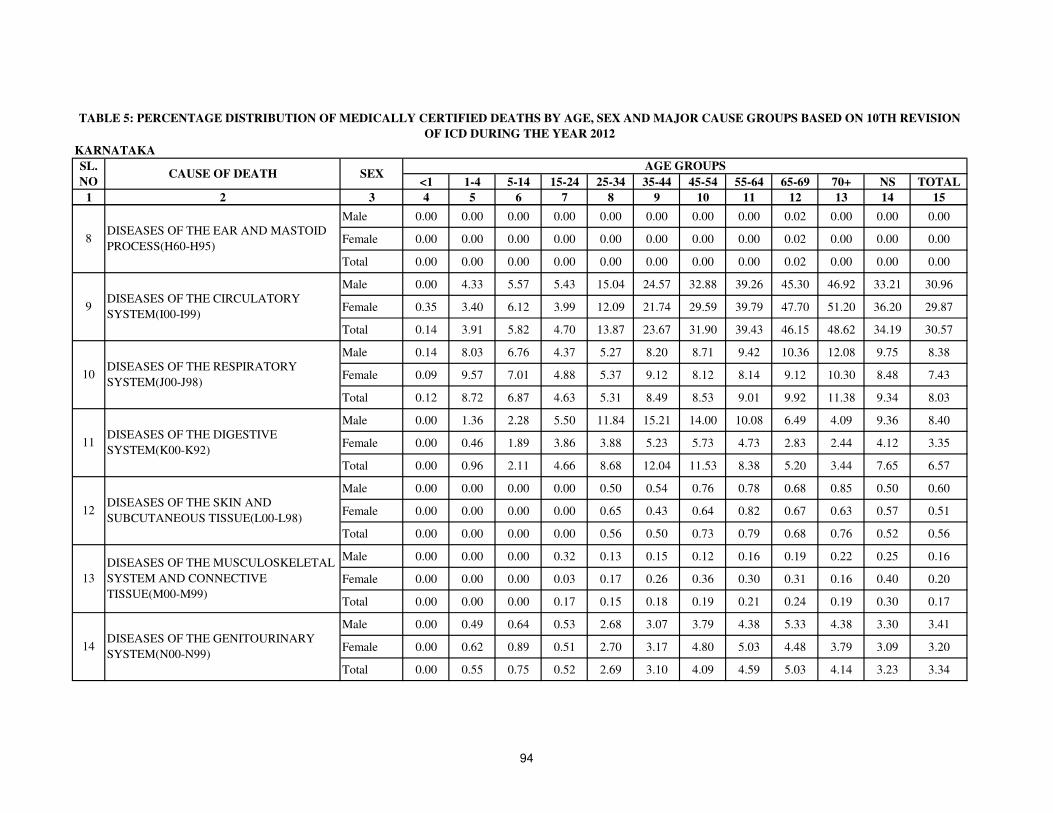
<1 1-4 5-14 15-24 25-34 35-44 45-54 55-64 65-69 70+ NS TOTAL
1 2 3 4 5 6 7 8 9 10 11 12 13 14 15
TABLE 5: PERCENTAGE DISTRIBUTION OF MEDICALLY CERTIFIED DEATHS BY AGE, SEX AND MAJOR CAUSE GROUPS BASED ON 10TH REVISION
OF ICD DURING THE YEAR 2012
KARNATAKA
SL.
NOCAUSE OF DEATH SEX
AGE GROUPS
Male 0.00 0.00 0.00 0.00 0.00 0.00 0.00 0.00 0.02 0.00 0.00 0.00
Female 0.00 0.00 0.00 0.00 0.00 0.00 0.00 0.00 0.02 0.00 0.00 0.00
Total 0.00 0.00 0.00 0.00 0.00 0.00 0.00 0.00 0.02 0.00 0.00 0.00
Male 0.00 4.33 5.57 5.43 15.04 24.57 32.88 39.26 45.30 46.92 33.21 30.96
Female 0.35 3.40 6.12 3.99 12.09 21.74 29.59 39.79 47.70 51.20 36.20 29.87
Total 0.14 3.91 5.82 4.70 13.87 23.67 31.90 39.43 46.15 48.62 34.19 30.57
Male 0.14 8.03 6.76 4.37 5.27 8.20 8.71 9.42 10.36 12.08 9.75 8.38
Female 0.09 9.57 7.01 4.88 5.37 9.12 8.12 8.14 9.12 10.30 8.48 7.43
Total 0.12 8.72 6.87 4.63 5.31 8.49 8.53 9.01 9.92 11.38 9.34 8.03
Male 0.00 1.36 2.28 5.50 11.84 15.21 14.00 10.08 6.49 4.09 9.36 8.40
Female 0.00 0.46 1.89 3.86 3.88 5.23 5.73 4.73 2.83 2.44 4.12 3.35
Total 0.00 0.96 2.11 4.66 8.68 12.04 11.53 8.38 5.20 3.44 7.65 6.57
Male 0.00 0.00 0.00 0.00 0.50 0.54 0.76 0.78 0.68 0.85 0.50 0.60
Female 0.00 0.00 0.00 0.00 0.65 0.43 0.64 0.82 0.67 0.63 0.57 0.51
Total 0.00 0.00 0.00 0.00 0.56 0.50 0.73 0.79 0.68 0.76 0.52 0.56
Male 0.00 0.00 0.00 0.32 0.13 0.15 0.12 0.16 0.19 0.22 0.25 0.16
Female 0.00 0.00 0.00 0.03 0.17 0.26 0.36 0.30 0.31 0.16 0.40 0.20
Total 0.00 0.00 0.00 0.17 0.15 0.18 0.19 0.21 0.24 0.19 0.30 0.17
Male 0.00 0.49 0.64 0.53 2.68 3.07 3.79 4.38 5.33 4.38 3.30 3.41
Female 0.00 0.62 0.89 0.51 2.70 3.17 4.80 5.03 4.48 3.79 3.09 3.20
Total 0.00 0.55 0.75 0.52 2.69 3.10 4.09 4.59 5.03 4.14 3.23 3.34
13
DISEASES OF THE MUSCULOSKELETAL
SYSTEM AND CONNECTIVE
TISSUE(M00-M99)
14DISEASES OF THE GENITOURINARY
SYSTEM(N00-N99)
10DISEASES OF THE RESPIRATORY
SYSTEM(J00-J98)
11DISEASES OF THE DIGESTIVE
SYSTEM(K00-K92)
12DISEASES OF THE SKIN AND
SUBCUTANEOUS TISSUE(L00-L98)
8DISEASES OF THE EAR AND MASTOID
PROCESS(H60-H95)
9DISEASES OF THE CIRCULATORY
SYSTEM(I00-I99)
94
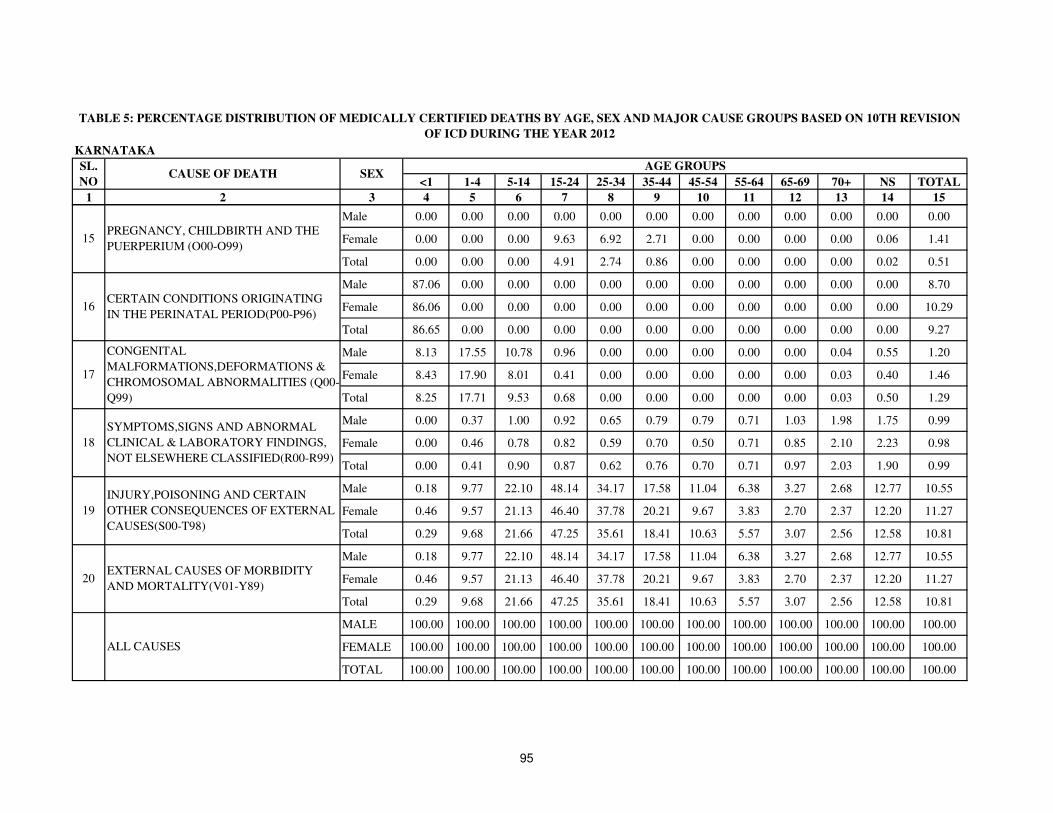
<1 1-4 5-14 15-24 25-34 35-44 45-54 55-64 65-69 70+ NS TOTAL
1 2 3 4 5 6 7 8 9 10 11 12 13 14 15
TABLE 5: PERCENTAGE DISTRIBUTION OF MEDICALLY CERTIFIED DEATHS BY AGE, SEX AND MAJOR CAUSE GROUPS BASED ON 10TH REVISION
OF ICD DURING THE YEAR 2012
KARNATAKA
SL.
NOCAUSE OF DEATH SEX
AGE GROUPS
Male 0.00 0.00 0.00 0.00 0.00 0.00 0.00 0.00 0.00 0.00 0.00 0.00
Female 0.00 0.00 0.00 9.63 6.92 2.71 0.00 0.00 0.00 0.00 0.06 1.41
Total 0.00 0.00 0.00 4.91 2.74 0.86 0.00 0.00 0.00 0.00 0.02 0.51
Male 87.06 0.00 0.00 0.00 0.00 0.00 0.00 0.00 0.00 0.00 0.00 8.70
Female 86.06 0.00 0.00 0.00 0.00 0.00 0.00 0.00 0.00 0.00 0.00 10.29
Total 86.65 0.00 0.00 0.00 0.00 0.00 0.00 0.00 0.00 0.00 0.00 9.27
Male 8.13 17.55 10.78 0.96 0.00 0.00 0.00 0.00 0.00 0.04 0.55 1.20
Female 8.43 17.90 8.01 0.41 0.00 0.00 0.00 0.00 0.00 0.03 0.40 1.46
Total 8.25 17.71 9.53 0.68 0.00 0.00 0.00 0.00 0.00 0.03 0.50 1.29
Male 0.00 0.37 1.00 0.92 0.65 0.79 0.79 0.71 1.03 1.98 1.75 0.99
Female 0.00 0.46 0.78 0.82 0.59 0.70 0.50 0.71 0.85 2.10 2.23 0.98
Total 0.00 0.41 0.90 0.87 0.62 0.76 0.70 0.71 0.97 2.03 1.90 0.99
Male 0.18 9.77 22.10 48.14 34.17 17.58 11.04 6.38 3.27 2.68 12.77 10.55
Female 0.46 9.57 21.13 46.40 37.78 20.21 9.67 3.83 2.70 2.37 12.20 11.27
Total 0.29 9.68 21.66 47.25 35.61 18.41 10.63 5.57 3.07 2.56 12.58 10.81
Male 0.18 9.77 22.10 48.14 34.17 17.58 11.04 6.38 3.27 2.68 12.77 10.55
Female 0.46 9.57 21.13 46.40 37.78 20.21 9.67 3.83 2.70 2.37 12.20 11.27
Total 0.29 9.68 21.66 47.25 35.61 18.41 10.63 5.57 3.07 2.56 12.58 10.81
MALE 100.00 100.00 100.00 100.00 100.00 100.00 100.00 100.00 100.00 100.00 100.00 100.00
FEMALE 100.00 100.00 100.00 100.00 100.00 100.00 100.00 100.00 100.00 100.00 100.00 100.00
TOTAL 100.00 100.00 100.00 100.00 100.00 100.00 100.00 100.00 100.00 100.00 100.00 100.00
ALL CAUSES
19
INJURY,POISONING AND CERTAIN
OTHER CONSEQUENCES OF EXTERNAL
CAUSES(S00-T98)
20EXTERNAL CAUSES OF MORBIDITY
AND MORTALITY(V01-Y89)
16CERTAIN CONDITIONS ORIGINATING
IN THE PERINATAL PERIOD(P00-P96)
17
CONGENITAL
MALFORMATIONS,DEFORMATIONS &
CHROMOSOMAL ABNORMALITIES (Q00-
Q99)
18
SYMPTOMS,SIGNS AND ABNORMAL
CLINICAL & LABORATORY FINDINGS,
NOT ELSEWHERE CLASSIFIED(R00-R99)
15PREGNANCY, CHILDBIRTH AND THE
PUERPERIUM (O00-O99)
95

<1 1-4 5-14 15-24 25-34 35-44 45-54 55-64 65-69 70+ NS TOTAL
1 2 3 4 5 6 7 8 9 10 11 12 13 14 15
Male 2.01 2.92 3.55 6.25 11.25 17.14 17.40 14.24 8.14 12.28 4.83 100.00
Female 2.59 4.43 5.56 10.14 12.36 14.14 14.75 13.11 7.38 12.06 3.48 100.00
Total 2.22 3.48 4.30 7.70 11.66 16.03 16.42 13.82 7.85 12.20 4.33 100.00
Male 0.07 0.42 0.66 2.99 4.49 8.69 16.44 25.83 13.49 22.97 3.96 100.00
Female 0.00 0.49 0.83 1.85 5.00 11.27 21.24 24.05 12.41 18.89 3.95 100.00
Total 0.04 0.45 0.73 2.52 4.70 9.76 18.44 25.09 13.04 21.27 3.96 100.00
Male 0.00 4.11 6.34 7.41 13.57 16.52 11.88 16.96 5.63 12.41 5.18 100.00
Female 0.00 2.91 6.27 12.54 14.45 13.33 12.21 11.53 5.60 15.90 5.26 100.00
Total 0.00 3.58 6.31 9.69 13.96 15.10 12.02 14.56 5.61 13.96 5.22 100.00
Male 0.00 0.10 0.12 0.47 2.22 7.18 13.44 21.24 14.83 34.76 5.64 100.00
Female 0.00 0.25 0.25 0.96 1.95 5.94 11.36 20.05 15.25 38.74 5.26 100.00
Total 0.00 0.16 0.17 0.67 2.11 6.69 12.61 20.76 15.00 36.34 5.49 100.00
Male 0.00 0.00 0.99 3.96 8.91 28.71 33.66 8.91 2.97 5.94 5.94 100.00
Female 0.00 0.00 0.00 4.17 12.50 20.83 4.17 41.67 12.50 0.00 4.17 100.00
Total 0.00 0.00 0.80 4.00 9.60 27.20 28.00 15.20 4.80 4.80 5.60 100.00
Male 8.87 7.28 7.04 8.39 8.39 12.01 10.27 12.54 7.14 13.31 4.77 100.00
Female 10.04 8.54 9.62 12.22 6.61 10.21 8.95 9.29 7.03 14.06 3.43 100.00
Total 9.30 7.74 7.98 9.79 7.74 11.35 9.79 11.35 7.10 13.58 4.28 100.00
Male 0.00 0.00 0.00 0.00 0.00 0.00 25.00 50.00 0.00 0.00 25.00 100.00
Female 0.00 0.00 0.00 0.00 50.00 0.00 0.00 50.00 0.00 0.00 0.00 100.00
Total 0.00 0.00 0.00 0.00 16.67 0.00 16.67 50.00 0.00 0.00 16.67 100.00
7DISEASES OF THE EYE AND ADNEXA
(H00-H59)
5MENTAL AND BEHAVIOURAL
DISORDERS(F01-F99)
6DISEASES OF THE NERVOUS SYSTEM
(G00-G98)
3
DISEASES OF THE BLOOD & BLOOD
FORMING ORGANS AND CERTAIN
DISORDERS INVOLVING THE IMMUNE
MECHANISM (D50-D89)
4ENDOCRINE, NUTRITIONAL AND
METABOLIC DISEASES(E00-E89)
1CERTAIN INFECTIOUS AND PARASITIC
DISEASES(A00-B99)
2 NEOPLASMS (C00-D48)
TABLE 6: PERCENTAGE DISTRIBUTION OF MEDICALLY CERTIFIED DEATHS OVER AGE GROUPS BY SEX AND MAJOR CAUSE GROUPS BASED ON
10TH REVISION OF ICD DURING THE YEAR 2012
KARNATAKA
SL.
NO.CAUSE OF DEATH SEX
AGE GROUPS
96

<1 1-4 5-14 15-24 25-34 35-44 45-54 55-64 65-69 70+ NS TOTAL
1 2 3 4 5 6 7 8 9 10 11 12 13 14 15
TABLE 6: PERCENTAGE DISTRIBUTION OF MEDICALLY CERTIFIED DEATHS OVER AGE GROUPS BY SEX AND MAJOR CAUSE GROUPS BASED ON
10TH REVISION OF ICD DURING THE YEAR 2012
KARNATAKA
SL.
NO.CAUSE OF DEATH SEX
AGE GROUPS
Male 0.00 0.00 0.00 0.00 0.00 0.00 0.00 0.00 100.00 0.00 0.00 100.00
Female 0.00 0.00 0.00 0.00 0.00 0.00 0.00 0.00 100.00 0.00 0.00 100.00
Total 0.00 0.00 0.00 0.00 0.00 0.00 0.00 0.00 100.00 0.00 0.00 100.00
Male 0.00 0.14 0.25 0.62 3.29 8.89 15.59 21.44 15.08 29.84 4.86 100.00
Female 0.14 0.16 0.40 0.86 3.17 6.67 10.84 18.51 15.76 38.83 4.65 100.00
Total 0.05 0.15 0.30 0.71 3.25 8.10 13.90 20.40 15.32 33.03 4.79 100.00
Male 0.16 0.97 1.11 1.84 4.27 10.96 15.26 19.02 12.74 28.39 5.27 100.00
Female 0.15 1.83 1.86 4.23 5.65 11.24 11.95 15.21 12.10 31.39 4.38 100.00
Total 0.16 1.26 1.36 2.64 4.73 11.06 14.15 17.74 12.53 29.40 4.97 100.00
Male 0.00 0.16 0.37 2.31 9.55 20.28 24.45 20.28 7.96 9.58 5.04 100.00
Female 0.00 0.20 1.12 7.42 9.06 14.31 18.71 19.63 8.34 16.48 4.73 100.00
Total 0.00 0.17 0.51 3.26 9.46 19.18 23.39 20.16 8.03 10.86 4.99 100.00
Male 0.00 0.00 0.00 0.00 5.67 10.08 18.70 22.06 11.76 27.94 3.78 100.00
Female 0.00 0.00 0.00 0.00 10.00 7.83 13.91 22.61 13.04 28.26 4.35 100.00
Total 0.00 0.00 0.00 0.00 7.08 9.35 17.14 22.24 12.18 28.05 3.97 100.00
Male 0.00 0.00 0.00 7.26 5.65 10.48 11.29 17.74 12.90 27.42 7.26 100.00
Female 0.00 0.00 0.00 1.09 6.52 11.96 19.57 20.65 15.22 17.39 7.61 100.00
Total 0.00 0.00 0.00 4.63 6.02 11.11 14.81 18.98 13.89 23.15 7.41 100.00
Male 0.00 0.15 0.26 0.55 5.33 10.07 16.27 21.68 16.09 25.24 4.37 100.00
Female 0.00 0.27 0.55 1.03 6.59 9.06 16.40 21.83 13.80 26.77 3.71 100.00
Total 0.00 0.19 0.36 0.72 5.77 9.72 16.32 21.73 15.29 25.77 4.14 100.00
13
DISEASES OF THE MUSCULOSKELETAL
SYSTEM AND CONNECTIVE TISSUE
(M00-M99)
14DISEASES OF THE GENITOURINARY
SYSTEM(N00-N99)
10DISEASES OF THE RESPIRATORY
SYSTEM(J00-J98)
11DISEASES OF THE DIGESTIVE
SYSTEM(K00-K92)
12DISEASES OF THE SKIN AND
SUBCUTANEOUS TISSUE(L00-L98)
8DISEASES OF THE EAR AND MASTOID
PROCESS(H60-H95)
9DISEASES OF THE CIRCULATORY
SYSTEM(I00-I99)
97

<1 1-4 5-14 15-24 25-34 35-44 45-54 55-64 65-69 70+ NS TOTAL
1 2 3 4 5 6 7 8 9 10 11 12 13 14 15
TABLE 6: PERCENTAGE DISTRIBUTION OF MEDICALLY CERTIFIED DEATHS OVER AGE GROUPS BY SEX AND MAJOR CAUSE GROUPS BASED ON
10TH REVISION OF ICD DURING THE YEAR 2012
KARNATAKA
SL.
NO.CAUSE OF DEATH SEX
AGE GROUPS
Male 0.00 0.00 0.00 0.00 0.00 0.00 0.00 0.00 0.00 0.00 0.00 0.00
Female 0.00 0.00 0.00 43.93 38.32 17.60 0.00 0.00 0.00 0.00 0.16 100.00
Total 0.00 0.00 0.00 43.93 38.32 17.60 0.00 0.00 0.00 0.00 0.16 100.00
Male 100.00 0.00 0.00 0.00 0.00 0.00 0.00 0.00 0.00 0.00 0.00 100.00
Female 100.00 0.00 0.00 0.00 0.00 0.00 0.00 0.00 0.00 0.00 0.00 100.00
Total 100.00 0.00 0.00 0.00 0.00 0.00 0.00 0.00 0.00 0.00 0.00 100.00
Male 67.82 14.88 12.37 2.83 0.00 0.00 0.00 0.00 0.00 0.63 2.10 100.00
Female 68.87 17.44 10.83 1.80 0.00 0.00 0.00 0.00 0.00 0.45 1.05 100.00
Total 68.25 15.94 11.74 2.41 0.00 0.00 0.00 0.00 0.00 0.56 1.67 100.00
Male 0.00 0.38 1.39 3.28 4.41 8.95 11.60 12.11 10.72 39.22 7.94 100.00
Female 0.00 0.67 1.57 5.37 4.70 6.49 5.59 10.07 8.50 48.32 8.72 100.00
Total 0.00 0.48 1.45 4.03 4.52 8.06 9.44 11.37 9.92 42.50 8.23 100.00
Male 0.17 0.94 2.88 16.12 21.96 18.67 15.36 10.22 3.20 5.01 5.48 100.00
Female 0.49 1.21 3.71 26.53 26.23 16.44 9.39 4.72 2.36 4.76 4.16 100.00
Total 0.29 1.04 3.19 20.06 23.58 17.82 13.10 8.14 2.88 4.91 4.98 100.00
Male 0.17 0.94 2.88 16.12 21.96 18.67 15.36 10.22 3.20 5.01 5.48 100.00
Female 0.49 1.21 3.71 26.53 26.23 16.44 9.39 4.72 2.36 4.76 4.16 100.00
Total 0.29 1.04 3.19 20.06 23.58 17.82 13.10 8.14 2.88 4.91 4.98 100.00
MALE 9.99 1.01 1.37 3.53 6.78 11.20 14.68 16.91 10.31 19.69 4.53 100.00
FEMALE 11.96 1.43 1.98 6.44 7.82 9.17 10.94 13.90 9.87 22.66 3.84 100.00
TOTAL 10.70 1.16 1.59 4.59 7.16 10.46 13.32 15.81 10.15 20.77 4.28 100.00
ALL CAUSES
19
INJURY,POISONING AND CERTAIN
OTHER CONSEQUENCES OF EXTERNAL
CAUSES (S00-T98)
20EXTERNAL CAUSES OF MORBIDITY AND
MORTALITY(V01-Y89)
16CERTAIN CONDITIONS ORIGINATING IN
THE PERINATAL PERIOD(P00-P96)
17
CONGENITAL MALFORMATIONS,
DEFORMATIONS & CHROMOSOMAL
ABNORMALITIES (Q00-Q99)
18
SYMPTOMS,SIGNS AND ABNORMAL
CLINICAL & LABORATORY FINDINGS,
NOT ELSEWHERE CLASSIFIED (R00-R99)
15PREGNANCY, CHILDBIRTH AND THE
PUERPERIUM (O00-O99)
98

Male Female Total Male Female Total Male Female Total Male Female Total
2005 7.55 5.34 6.77 5.80 6.29 5.98 11.80 9.70 11.05 64.37 35.63 100.00
2006 6.40 4.54 5.72 7.21 7.64 7.37 13.05 11.23 12.38 63.18 36.82 100.00
2007 6.83 4.65 6.07 5.87 6.38 6.04 11.21 10.13 10.83 64.94 35.06 100.00
2008 5.86 4.17 5.24 5.77 6.62 6.08 13.50 11.63 12.81 63.42 36.58 100.00
2009 5.47 3.70 4.82 6.15 6.58 6.30 12.75 11.21 12.18 63.31 36.69 100.00
2010 5.29 3.72 4.72 5.29 6.11 5.59 13.91 12.43 13.37 63.33 36.67 100.00
2011 5.24 3.72 4.69 5.12 6.20 5.51 12.77 11.47 12.30 63.72 36.28 100.00
2012 5.42 4.55 5.10 5.50 6.15 5.73 13.42 12.12 12.95 63.68 36.32 100.00
Table - 7 : Percentage distribution of Medically Certified Deaths due to Tuberculosis, Diabetis Mellitus
and Ischaemic Heart Diseases from 2005-2012
Year
Total MCCD Deaths due to Total MCCD Deaths
Tuberculosis Diabetis Mellitus Ischaemic Heart Disease
99

APPENDIX-II
Name of the Hospital…………………………………………
I hereby certify that the person whose particulars are given below died in the hospital in Ward No……………on…………..
at………….A.M./P.M.
Name of the Deceased For use of
Statistical Office
Sex
1. Male
2. Female
Interval between on
set & death approx
I
(a) …………………………………. ………………. ………………
State the disease, injury or Due to (or as a consequences of)
complication which caused death, not the
mode ofdying such as heart
failure, asthenia, etc.
Antecedent Cause (b) …………………………………………………………………. ………………
Morbid conditions, if any, giving rise Due to (or as a consequences of)
to the above Cause, stating underlying (c) …………………………………… ………………. ………………
conditions last
II
Other significant conditions contributing ………………………………………….. ………………. ………….
to the death but not related to the ………………………………………….. ………………. ………….
disease or conditions causing it
Manner of death How did the injury occur?
1. Natural 2. Accident 3. Suicide 4.Homicide
5. Pending investigation
If yes, was there a delivery? 1.Yes 2.No.
Name and signature of the Medical Attendant certifying the cause of death
Date of verification……………………………...______________________
Certified that Shri/Smt/Kum……………………………….S/W/D/of Shri ……………………………………….
R/O……………………was admitted to the hospital on …………… and expired on ……………..
Doctor…………………………………………………………….
(Medical Supdt
Name of the hospital)
Note: Except manner of death given in Form No-4, there will be no change in the content of Form No-4A.
To be sent to Registrar along with Form No.2 (Death Report)
Age at Death
CAUSE OF DEATH
FORM NO. 4/4A
(See Rule 7)
MEDICAL CERTIFICATE OF CAUSE OF DEATH
(Hospital in-patients/non-institutional deaths. Not to be used for still births)
If less than one month,
age in Days
If less than one
SEE REVERSE FOR INSTRUCTION
(To be detached and handed over to the relative of the deceased).
day, age in Hours
If 1 year or more,age
in Years
If less than 1 year, age
in Months
Immediate Cause
If deceased was a female, was pregnancy the death associated with? 1. Yes 2. No
100

101
MEDICAL CERTIFICATE OF CAUSE OF DEATH
Direction for completing the form No.4/4A
Name of deceased: To be given in full. Do not use initials. If deceased is an infant, not yet named at time of death, write.
Son of (S/o) or „Daughter of (D/o), followed by names of mother and father.
Age: If the deceased was over 1 year of age, give age in completed years. If the deceased was below 1 year of age, give age
in months and if below 1 month give age in completed number of days, and if below one day, in hours.
Cause of Death: This part of the form should always be completed by the attending physician personally.
The certificate of cause of death is divided into two parts, I and II. Part I is again divided into three parts, lines (a)(b)(c). If a
single morbid condition completely explains the deaths, then this will be written on line (a) of Part I, and nothing
more need be written in the rest of Part I or in Part II, or example, small pox, lobar pneumonia, cardiac beriberi,
are sufficient cause of death and usually nothing more is needed.
Often, however, a number of morbid conditions will have been present at death, and the doctor must then complete the
certificate in the proper manner so that the correct underlying cause will be tabulated. First, enter in Part I(a) the
immediate cause of death. This does not mean the mode of dying, e.g. heart failure, respiratory failure, etc.
These terms should not appear on the certificate at all since they are modes of dying and not causes of death. Next
consider whether the immediate cause is complication or delayed result of some other cause. If so, enter the
antecedent cause in Part I, line (b). Some times there will be three stages in the course of events leading to death.
If so, line (c) will be completed. The underlying cause to be tabulated is always written last in Part I.
Morbid conditions or injuries may be present which were not directly related to the train of events causing death but which
contributed in some way to the fatal outcome. Sometimes the doctor finds it difficult to decide especially for
infant deaths, which of several independent conditions was the primary cause of death; but only one cause can be
tabulated, so the doctor must decide. If the other diseases are not effects of the underlying cause, they are entered
in Part II.
Do not write two or more conditions on a single line. Please write the names of the diseases (in full) in the certificates as
legibly as possible to avoid the risk of their being misread.
Onset: Complete the column for interval between onset and death whenever possible, even if very approximately, e.g. “from
birth” “several years”.
Accidental or violent deaths: Both the external cause and the nature of the injury are needed and should be stated. The
doctor or hospital should always be able to describe the injury, stating the part of the body injured, and should give
the external cause in full when this is shown. Example: (a) Hypostatic pneumonia; (b) Fracture of neck of femur,
(c) Fall from ladder at home.
Maternal deaths: Be sure to answer the questions on pregnancy and delivery. This information is needed for all women of
child- bearing age, even though the pregnancy may have had nothing to do with the death.
Old age or senility: Old age (or senility should be not given as a cause of death if a more specific cause is known. If old age
was a contributory factor; it should be entered in Part II. Example (a) Chronic bronchitis, of old age.
Completeness of information: A complete cause history is not wanted, but, if the information is available enough details
should be given to enable the underlying cause to be properly classified.
Example : Anaemia- Give type of anaemia, if known, Neoplasm-Indicate whether benign or malignant, and site with or
primary neoplasm, whenever possible, Heart disease-Describe the condition specially; if congestive heart failure,
chronic on pulmonale, etc., are mentioned, give the antecedent conditions. Tetanus-Describe the antecedent
injury, if known. Operation-State the condition for which the operation was performed. Dysentery-Specify
whether bacillary amoebic etc., if know. Complications of pregnancy or delivery-Describe the complication
specifically. Tuberculosis-Give organs affected.
Symptomatic statement: Convulsions, diarrhoeas, fever, ascites, jaundice, debility, etc., are symptoms which may be due to
any one of a number of different conditions. Sometimes nothing more is known but whenever possible, give the
disease which caused the symptom.
Manner of Death: Deaths not due to external cause should be identified as “Natural”. If the cause of death is known, but it
is not known whether it was the result of an accident suicide or homicide and is subject to further investigation, the
cause of death should invariably be filled in and the manner of death should be shown as “Pending investigation‟.
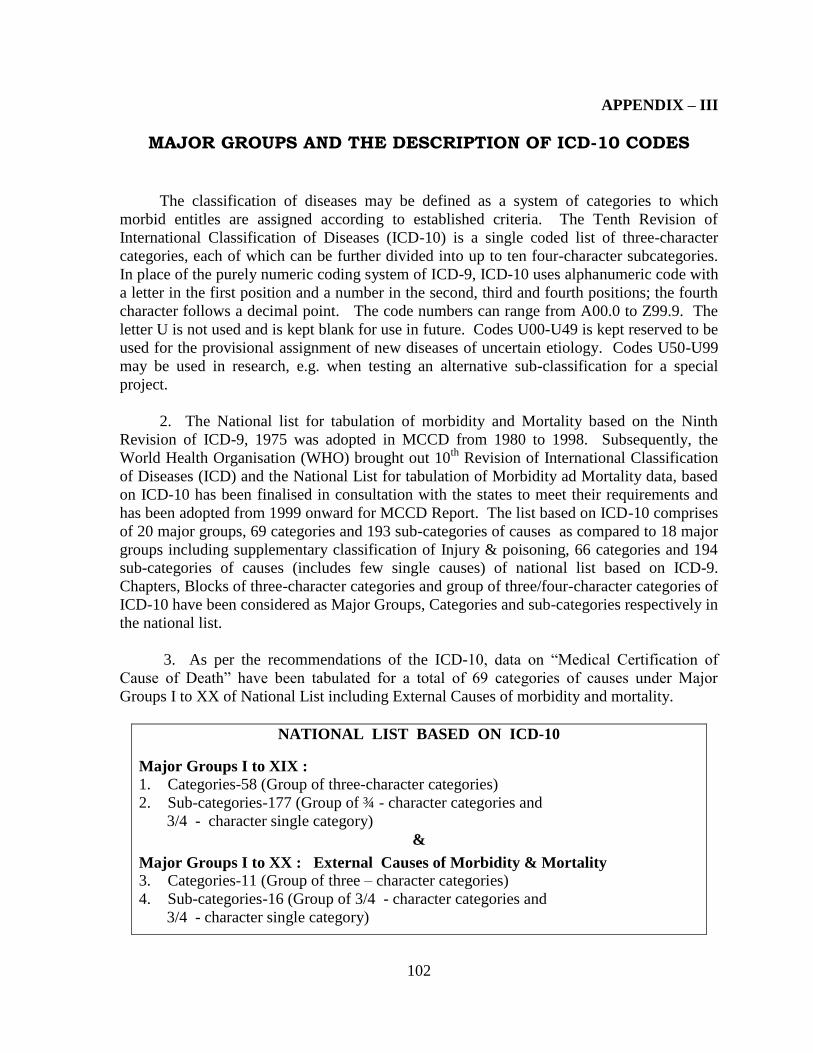
102
APPENDIX – III
MAJOR GROUPS AND THE DESCRIPTION OF ICD-10 CODES
The classification of diseases may be defined as a system of categories to which
morbid entitles are assigned according to established criteria. The Tenth Revision of
International Classification of Diseases (ICD-10) is a single coded list of three-character
categories, each of which can be further divided into up to ten four-character subcategories.
In place of the purely numeric coding system of ICD-9, ICD-10 uses alphanumeric code with
a letter in the first position and a number in the second, third and fourth positions; the fourth
character follows a decimal point. The code numbers can range from A00.0 to Z99.9. The
letter U is not used and is kept blank for use in future. Codes U00-U49 is kept reserved to be
used for the provisional assignment of new diseases of uncertain etiology. Codes U50-U99
may be used in research, e.g. when testing an alternative sub-classification for a special
project.
2. The National list for tabulation of morbidity and Mortality based on the Ninth
Revision of ICD-9, 1975 was adopted in MCCD from 1980 to 1998. Subsequently, the
World Health Organisation (WHO) brought out 10th
Revision of International Classification
of Diseases (ICD) and the National List for tabulation of Morbidity ad Mortality data, based
on ICD-10 has been finalised in consultation with the states to meet their requirements and
has been adopted from 1999 onward for MCCD Report. The list based on ICD-10 comprises
of 20 major groups, 69 categories and 193 sub-categories of causes as compared to 18 major
groups including supplementary classification of Injury & poisoning, 66 categories and 194
sub-categories of causes (includes few single causes) of national list based on ICD-9.
Chapters, Blocks of three-character categories and group of three/four-character categories of
ICD-10 have been considered as Major Groups, Categories and sub-categories respectively in
the national list.
3. As per the recommendations of the ICD-10, data on “Medical Certification of
Cause of Death” have been tabulated for a total of 69 categories of causes under Major
Groups I to XX of National List including External Causes of morbidity and mortality.
NATIONAL LIST BASED ON ICD-10
Major Groups I to XIX :
1. Categories-58 (Group of three-character categories)
2. Sub-categories-177 (Group of ¾ - character categories and
3/4 - character single category)
&
Major Groups I to XX : External Causes of Morbidity & Mortality
3. Categories-11 (Group of three – character categories)
4. Sub-categories-16 (Group of 3/4 - character categories and
3/4 - character single category)

103
The descriptions for all Major Groups of the National list based on ICD-10 are as
under :
Major
Cause
Groups
DESCRIPTION AND ICD CODES
I
II
III
IV
V
VI
VII
VIII
IX
X
XI
XII
XIII
XIV
XV
XVI
XVII
XVIII
XIX
XX
*XXI
Certain Infectious and Parasitic diseases (A00-B99)
Neoplasms (C00-D48)
Diseases of the blood and blood forming organs and certain disorders involving
the immune mechanism (D50-D89)
Endocrine, nutritional and metabolic diseases (E00-E89)
Mental and behavioral disorders (F01-F99)
Diseases of the nervous system (G00-G98)
Diseases of the eye and Adnexa (H00-H59)
Diseases of the ear and mastoid process (H60-H95)
Diseases of the circulatory system (I00-I99)
Diseases of the respiratory system (J00-J98)
Diseases of the digestive system (K00-K92)
Diseases of the skin and subcutaneous tissue (L00-L98)
Diseases of the musculoskeletal system and connective tissue (M00-M99)
Diseases of the genitourinary system (N00-N99)
Pregnancy, childbirth and the puerperium (O00-O99)
Certain conditions originating in the perinatal period (P00-P96)
Congenital malformations, deformation and chromosomal abnormalities
(Q00-Q99)
Symptoms, signs and abnormal clinical and laboratory findings, n.e.c.
(R00-R99)
Injury, poisoning and certain other consequences of external causes
(S00-T98)
External causes of morbidity and mortality (V01-Y89)
Factors influencing health status and contact with health services (Z00-Z99)
* Not in use in India

TEAM INVOLVED IN THE PUBLICATION OF THIS REPORT
1. Sri. U. R. SUBRAMANYA JOINT CHIEF REGISTRAR
2. Sri. B. ASHOK KUMAR DEPUTY CHIEF REGISTRAR
3. Smt. G. VANAJAKSHI ASSISTANT CHIEF REGISTRAR (I/c)
4. Smt. N. YASHODA ASSISTANT STATISTICAL OFFICER
5.Smt. N. CHANDRAVATHI TYPIST