government of andhra pradesh - ipr.ap.nic.inipr.ap.nic.in/images/whitepapers/finances and economic...
TRANSCRIPT
GOVERNMENT OF ANDHRA PRADESH
WHITE PAPER ON STATE
FINANCES AND ECONOMIC
GROWTH
JANUARY 1, 2019
FINANCE DEPARTMENT

1
INTRODUCTION
1. The Andhra Pradesh Reorganization Act, 2014, an Act of the Indian Parliament
bifurcated the erstwhile State of Andhra Pradesh into Telangana and Andhra Pradesh,
effective from June 2, 2014. Post bifurcation, the residuary State of Andhra Pradesh is the
eighth largest State by area in India, comprising 13 districts with an overall population of
4.9 crore (as per Census 2011) out of which 29.6% reside in urban areas.
ECONOMIC GROWTH
2. Government of Andhra Pradesh has been striving hard to rebuild the State post
bifurcation. Not only has the State got to confront the challenges arising due to un-
scientific State bifurcation, but also deal with the unwillingness of Government of India
even to implement the statutory provisions of AP Reorganisation Act 2014, Special
Category Status and other assurances. This has made the task of rebuilding the State all
the more difficult. Despite the hostile treatment and non-conducive environment, Andhra
Pradesh has not derailed from the path of large scale development by resolving to
overcome the challenges arising from State re-organization, taking the crisis as an
opportunity and redefining our development agenda, and by putting in place an effective
vision and strategy that ushers in holistic socio-economic development of the new State.
3. The Government of A.P. have taken up innovative initiatives such as 7 Missions,
5 Grids, 5 Campaigns apart from rolling-out workable interventions to put the State
economy on track in such a way that the Vision is translated into reality and there is
complete transformation of our society towards ‘Prosperity with Happiness’.
4. Besides that, the State Government has evolved a historic monitoring strategy
encompassing five themes: 1. Gross Value Added (GVA), 2. Sustainable Development
Goals – (17), 3.SamajaVikasam-(10) assurances, 4. Kutumba Vikasam-(15) assurances, 5.
Key Performance Indicators (KPI). Mission mode and targeted approach has been adopted
towards attainment of holistic development of the State by ensuring inclusive and
sustainable growth.
5. District wise untapped resources have been identified under each sector and a
comprehensive plan has been prepared for achieving low hanging fruits initially apart from
preparing perspective plans to achieve medium/ long term goals under each sector by
2
using the available resources meticulously to sustain the economy at desired pace. Besides
the above, the Government have taken up various initiatives such as i) Adoption of global
best practices, ii) Continuous capacity building initiatives for all stake holders, iii)
Identification of Growth Engines in each sector which contribute around 80% of GVA for
focussed action, iv) Effective coordination and convergence among the departments
concerned, and vi) Periodical reviews and monitoring of implementation of all schemes
under each sector at all levels.
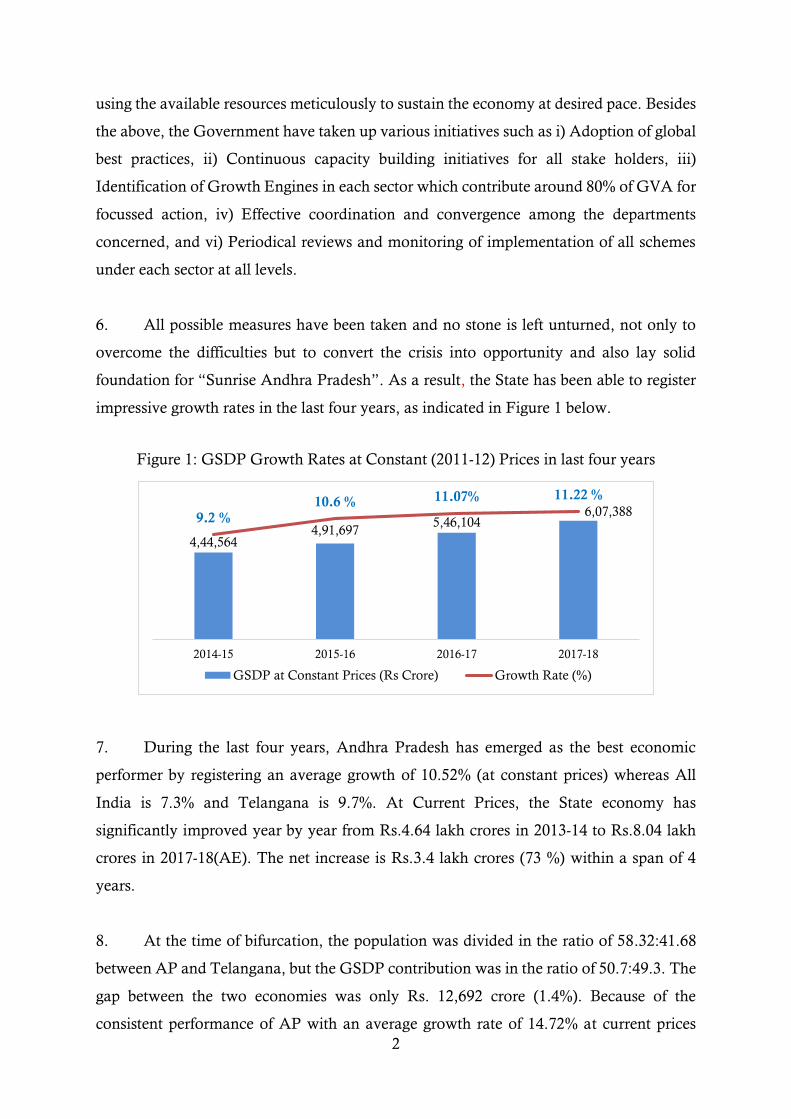
6. All possible measures have been taken and no stone is left unturned, not only to
overcome the difficulties but to convert the crisis into opportunity and also lay solid
foundation for “Sunrise Andhra Pradesh”. As a result, the State has been able to register
impressive growth rates in the last four years, as indicated in Figure 1 below.
Figure 1: GSDP Growth Rates at Constant (2011-12) Prices in last four years
7. During the last four years, Andhra Pradesh has emerged as the best economic
performer by registering an average growth of 10.52% (at constant prices) whereas All
India is 7.3% and Telangana is 9.7%. At Current Prices, the State economy has
significantly improved year by year from Rs.4.64 lakh crores in 2013-14 to Rs.8.04 lakh
crores in 2017-18(AE). The net increase is Rs.3.4 lakh crores (73 %) within a span of 4
years.
8. At the time of bifurcation, the population was divided in the ratio of 58.32:41.68
between AP and Telangana, but the GSDP contribution was in the ratio of 50.7:49.3. The
gap between the two economies was only Rs. 12,692 crore (1.4%). Because of the
consistent performance of AP with an average growth rate of 14.72% at current prices
4,44,564 4,91,697
5,46,1046,07,388
9.2 %10.6 % 11.07% 11.22 %
2014-15 2015-16 2016-17 2017-18
GSDP at Constant Prices (Rs Crore) Growth Rate (%)
3
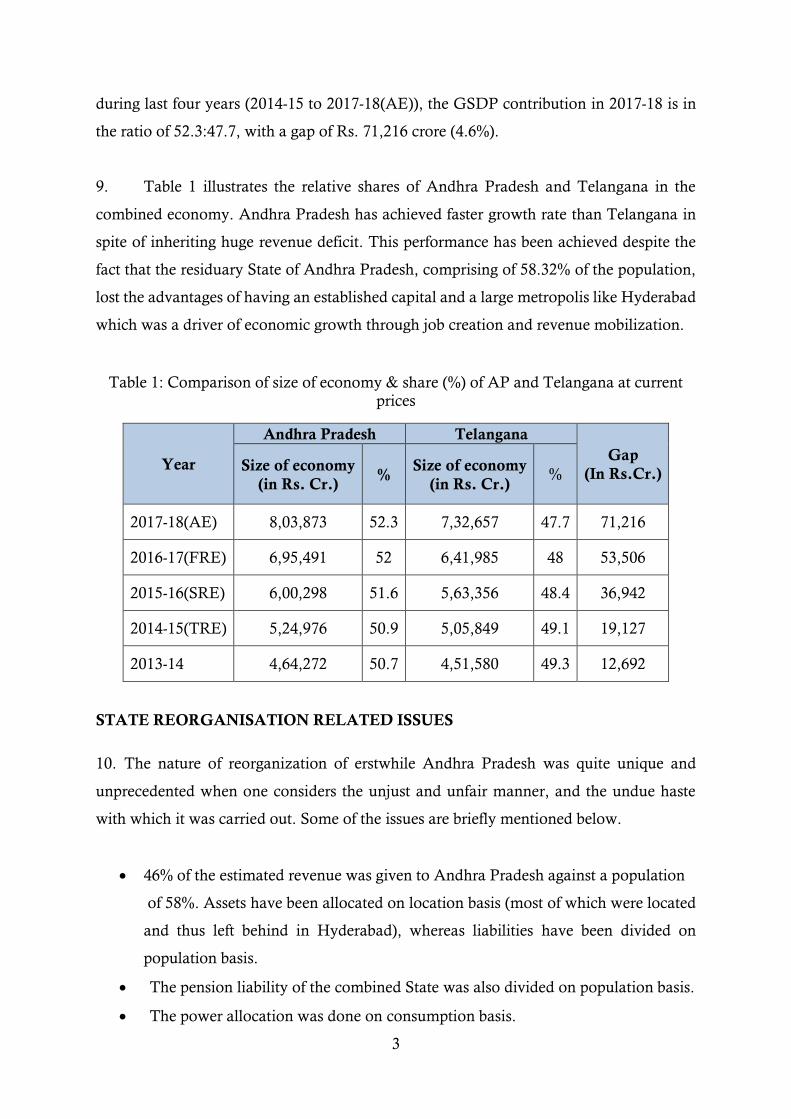
during last four years (2014-15 to 2017-18(AE)), the GSDP contribution in 2017-18 is in
the ratio of 52.3:47.7, with a gap of Rs. 71,216 crore (4.6%).
9. Table 1 illustrates the relative shares of Andhra Pradesh and Telangana in the
combined economy. Andhra Pradesh has achieved faster growth rate than Telangana in
spite of inheriting huge revenue deficit. This performance has been achieved despite the
fact that the residuary State of Andhra Pradesh, comprising of 58.32% of the population,
lost the advantages of having an established capital and a large metropolis like Hyderabad
which was a driver of economic growth through job creation and revenue mobilization.
Table 1: Comparison of size of economy & share (%) of AP and Telangana at current prices
Year
Andhra Pradesh Telangana
Gap
(In Rs.Cr.) Size of economy
(in Rs. Cr.) %
Size of economy
(in Rs. Cr.) %
2017-18(AE) 8,03,873 52.3 7,32,657 47.7 71,216
2016-17(FRE) 6,95,491 52 6,41,985 48 53,506
2015-16(SRE) 6,00,298 51.6 5,63,356 48.4 36,942
2014-15(TRE) 5,24,976 50.9 5,05,849 49.1 19,127
2013-14 4,64,272 50.7 4,51,580 49.3 12,692
STATE REORGANISATION RELATED ISSUES
10. The nature of reorganization of erstwhile Andhra Pradesh was quite unique and
unprecedented when one considers the unjust and unfair manner, and the undue haste
with which it was carried out. Some of the issues are briefly mentioned below.
46% of the estimated revenue was given to Andhra Pradesh against a population
of 58%. Assets have been allocated on location basis (most of which were located
and thus left behind in Hyderabad), whereas liabilities have been divided on
population basis.
The pension liability of the combined State was also divided on population basis.
The power allocation was done on consumption basis.
4
Refund of taxes, a liability, was allocated on population ratio, whereas deferred
tax collections, which is an asset, is given on location basis (being treated as the
location of the Head Office, which are mostly in Hyderabad). This alone has
caused a huge loss of about Rs. 3,800 crore to the State of Andhra Pradesh.
The State of Andhra Pradesh lost its capital city, institutions, manufacturing
centers and service sector hubs while inheriting the drought prone and cyclone hit
areas.
11. At the time of the State’s bifurcation, the Government of India acknowledged that
the fiscal, economic and social conditions of the residuary State of Andhra Pradesh will
be adversely affected. However, Government of India has not fulfilled the assurances given
by it. Despite the adversities that arose due to bifurcation of the State and non-cooperative
attitude of the Government of India in not fulfilling the assurances and provisions of
APRA 2014, the State has strived hard and improved its economic and social conditions.
NATURE OF STATE ECONOMY
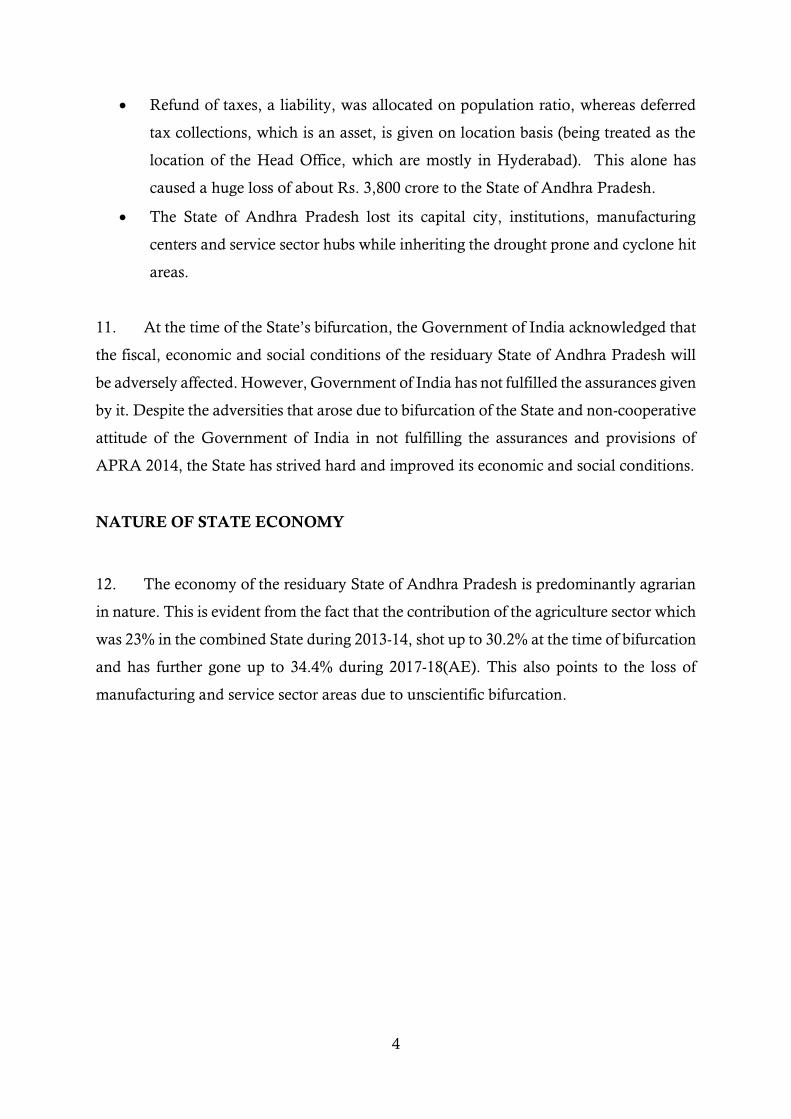
12. The economy of the residuary State of Andhra Pradesh is predominantly agrarian
in nature. This is evident from the fact that the contribution of the agriculture sector which
was 23% in the combined State during 2013-14, shot up to 30.2% at the time of bifurcation
and has further gone up to 34.4% during 2017-18(AE). This also points to the loss of
manufacturing and service sector areas due to unscientific bifurcation.
5
Figure 2: Changing nature of State Economy post bifurcation
13. Geographically, the State is uniquely placed which makes it prone to both drought
and cyclones simultaneously. Out of the 13 districts, 5 districts viz. Ananthapur, Chittoor,
Kadapa, Kurnool and Prakasam, are chronically drought prone. The average annual
rainfall in the State is 966 mm, two-thirds of which is received during the south-west
monsoon period (June to September). The distribution of rainfall is highly uneven. Table
3 indicates the variation registered in annual rainfall since 2014-15.
Table 3: Variation of Annual Rainfall (%)
Year Rainfall deviation from normal
2014-15 -37.3%
2015-16 -5.5%
2016-17 -29.9%
2017-18 -14.4%
2018-19 (1st June to 30th December) -31.8%
14. Andhra Pradesh has the third largest drought prone area after Rajasthan and
Karnataka. The problem of high rainfall variability is compounded by high runoff in semi-
arid drought prone areas of the State. Presence of hard rock in large areas limits the scope
for groundwater exploitation. Hence, the impact of droughts is extremely severe in
vulnerable areas.
15. Though the monsoons have not been favourable in the last four years, the
agriculture and allied sector has seen an average growth rate of 11%, whereas the national
average growth has been 2.4%. In absolute terms, at current prices the agriculture and
30.2
25.2
44.6
30.4
25.5
44.1
34.4
22.1
43.5
Agriculture Industry Services
Sectoral Composition (%) of Andhra Pradesh at Current Price
At the time of Bifurcation 2013-14 2014-15 2017-18 AE
6
allied sector has significantly increased from Rs. 1.28 lakh crore during 2013-14 to Rs. 2.53
lakh crore during 2017-18(AE). The net increase of Rs. 1.25 lakh crore, almost doubled
(97%), within a span of four years. This is a result of the efforts of the government focusing
on agriculture and allied sectors like horticulture and aquaculture with convergence
approach and effective management of natural resources leading to sustainability.
16. The industry sector significantly increased from Rs.1.07 lakh crores during 2013-
14 to Rs.1.62 lakh crores during 2017-18(AE) at current prices. The net increase is Rs.0.55
lakh crores (51%). The government is promoting the industrial activities, attracting the
investments both indigenously and abroad through creating effective eco- system leading
to No.1 position in Ease of Doing Business.
17. The service sector significantly increased from Rs.1.90 lakh crores during 2013-
14 to Rs.3.20 lakh crores during 2017-18(AE) at current prices. The net increase is Rs.1.30
lakh crores (68%). There has been a consistent growth in service sector because of shifting
of administration from Hyderabad to Amaravati, boost to tourism sector, growth in
industry sector due to ease of doing business, and fillip to ports and infrastructure sector.
Establishing prestigious educational institutions viz. NIT, IIT, IIM, and IISc. would give
further impetus to service sector.
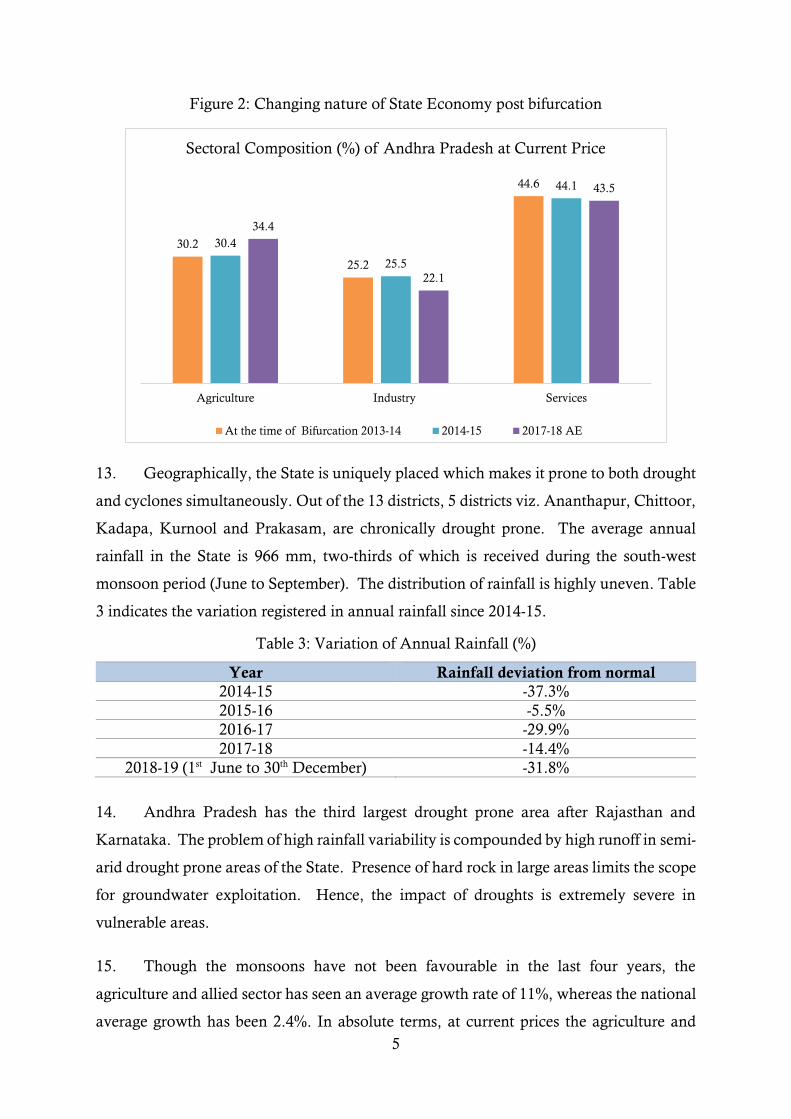
18. The Service sector which generates higher tax revenue and higher per capita
income, contributes only 43.55% to the economy of Andhra Pradesh, which is
considerably lower compared to other Southern states viz., Telangana (63.8%), Tamil
Nadu (53.36%), Karnataka (66.27%), Kerala (64.41%) and All India average of 53.85%.
7
Figure 3: Sectoral Composition (%) of Southern State Economies 2017-18(AE)
19. The impact of change in structure of the economy towards predominantly agrarian
can be seen on per capita income. As can been seen from the Table 4, the per capita income
of the combined state of Andhra Pradesh was Rs.89,214 for the year 2013-14. The per
capita income of 13 districts of residuary Andhra Pradesh for the same year stood at Rs.
82,870 whereas it was Rs.1,12,162 for the state of Telangana, highlighting the loss of
higher income generating areas to Telangana.
Table 4: Per capita Income on NSDP (Rs) of Southern States and All India
States 2013-14 2014-15 2015-16 2016-17 2017-18
AP (combined)
2004-05 Base
89,214 - - -
Andhra Pradesh 82,870 93,903 1,07,276 1,23,664 1,42,054
Telangana 1,12,162 1,24,104 1,40,840 1,59,856 1,81,034
Tamil Nadu 1,16,236 1,28,372 1,40,441 1,50,036 1,66,934
Karnataka 1,18,829 1,30,024 1,48,110 1,61,936 1,81,788
Kerala 1,23,388 1,35,537 1,47,568 1,62,750 1,80,518
All India 79,118 86,647 94,731 1,03,870 1,12,835
20. In 2014-15, the PCI of Andhra Pradesh was 8.4% higher than the national PCI. In
2017-18, it is 25.9% more than the national PCI. The year on year growth rate of PCI is
13.31% in 2014-15, 14.24% in 2015-16, 15.28% in 2016-17 and 14.87% in 2017-18. In
absolute terms the increase in PCI is Rs. 59,184 (71%) within the span of last four years.
34.37
14.28 12.58 10.82 12.5117.09
22.09 21.92
34.05
22.91 23.08
29.06
43.54
63.8
53.37
66.27 64.41
53.85
Andhra Pradesh Telangana Tamil Nadu Karnataka Kerala India
Agriculture Industry Services
8
21. Despite the highest average PCI growth (14.4%) in the country during last four
years, Andhra Pradesh with a per capita income of Rs 1.42 lakh continues to lag behind
the other Southern Indian states, three of which have crossed the mark of Rs.1.8 lakh per
capita income, amounting to a huge debilitating gap of around Rs 38,000+ per person in
Andhra Pradesh.
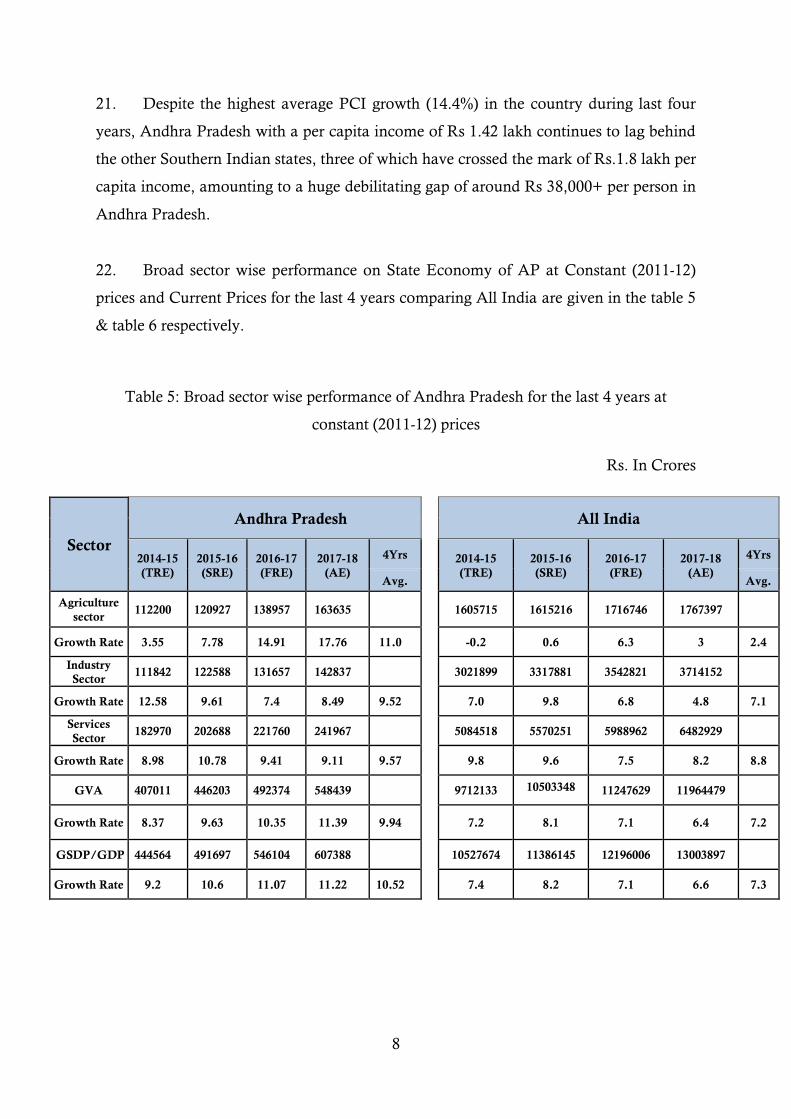
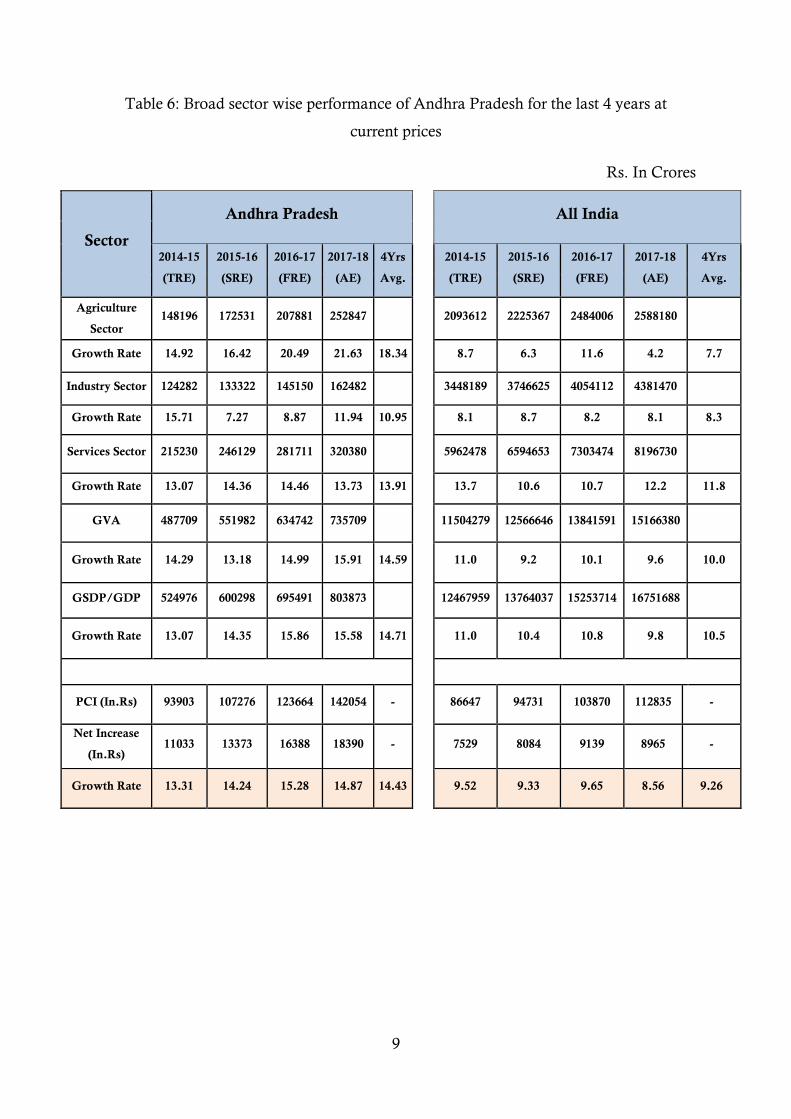
22. Broad sector wise performance on State Economy of AP at Constant (2011-12)
prices and Current Prices for the last 4 years comparing All India are given in the table 5
& table 6 respectively.
Table 5: Broad sector wise performance of Andhra Pradesh for the last 4 years at
constant (2011-12) prices
Rs. In Crores
Sector
Andhra Pradesh
All India
2014-15
(TRE)
2015-16
(SRE)
2016-17
(FRE)
2017-18
(AE)
4Yrs 2014-15
(TRE)
2015-16
(SRE)
2016-17
(FRE)
2017-18
(AE)
4Yrs
Avg. Avg.
Agriculture
sector 112200 120927 138957 163635 1605715 1615216 1716746 1767397
Growth Rate 3.55 7.78 14.91 17.76 11.0 -0.2 0.6 6.3 3 2.4
Industry
Sector 111842 122588 131657 142837 3021899 3317881 3542821 3714152
Growth Rate 12.58 9.61 7.4 8.49 9.52 7.0 9.8 6.8 4.8 7.1
Services
Sector 182970 202688 221760 241967 5084518 5570251 5988962 6482929
Growth Rate 8.98 10.78 9.41 9.11 9.57 9.8 9.6 7.5 8.2 8.8
GVA 407011 446203 492374 548439 9712133 10503348 11247629 11964479
Growth Rate 8.37 9.63 10.35 11.39 9.94 7.2 8.1 7.1 6.4 7.2
GSDP/GDP 444564 491697 546104 607388 10527674 11386145 12196006 13003897
Growth Rate 9.2 10.6 11.07 11.22 10.52 7.4 8.2 7.1 6.6 7.3
9
Table 6: Broad sector wise performance of Andhra Pradesh for the last 4 years at
current prices
Rs. In Crores
Sector
Andhra Pradesh
All India
2014-15
(TRE)
2015-16
(SRE)
2016-17
(FRE)
2017-18
(AE)
4Yrs
Avg.
2014-15
(TRE)
2015-16
(SRE)
2016-17
(FRE)
2017-18
(AE)
4Yrs
Avg.
Agriculture
Sector 148196 172531 207881 252847 2093612 2225367 2484006 2588180
Growth Rate 14.92 16.42 20.49 21.63 18.34 8.7 6.3 11.6 4.2 7.7
Industry Sector 124282 133322 145150 162482 3448189 3746625 4054112 4381470
Growth Rate 15.71 7.27 8.87 11.94 10.95 8.1 8.7 8.2 8.1 8.3
Services Sector 215230 246129 281711 320380 5962478 6594653 7303474 8196730
Growth Rate 13.07 14.36 14.46 13.73 13.91 13.7 10.6 10.7 12.2 11.8
GVA 487709 551982 634742 735709 11504279 12566646 13841591 15166380
Growth Rate 14.29 13.18 14.99 15.91 14.59 11.0 9.2 10.1 9.6 10.0
GSDP/GDP 524976 600298 695491 803873 12467959 13764037 15253714 16751688
Growth Rate 13.07 14.35 15.86 15.58 14.71 11.0 10.4 10.8 9.8 10.5
PCI (In.Rs) 93903 107276 123664 142054 - 86647 94731 103870 112835 -
Net Increase
(In.Rs) 11033 13373 16388 18390 - 7529 8084 9139 8965 -
Growth Rate 13.31 14.24 15.28 14.87 14.43 9.52 9.33 9.65 8.56 9.26
10
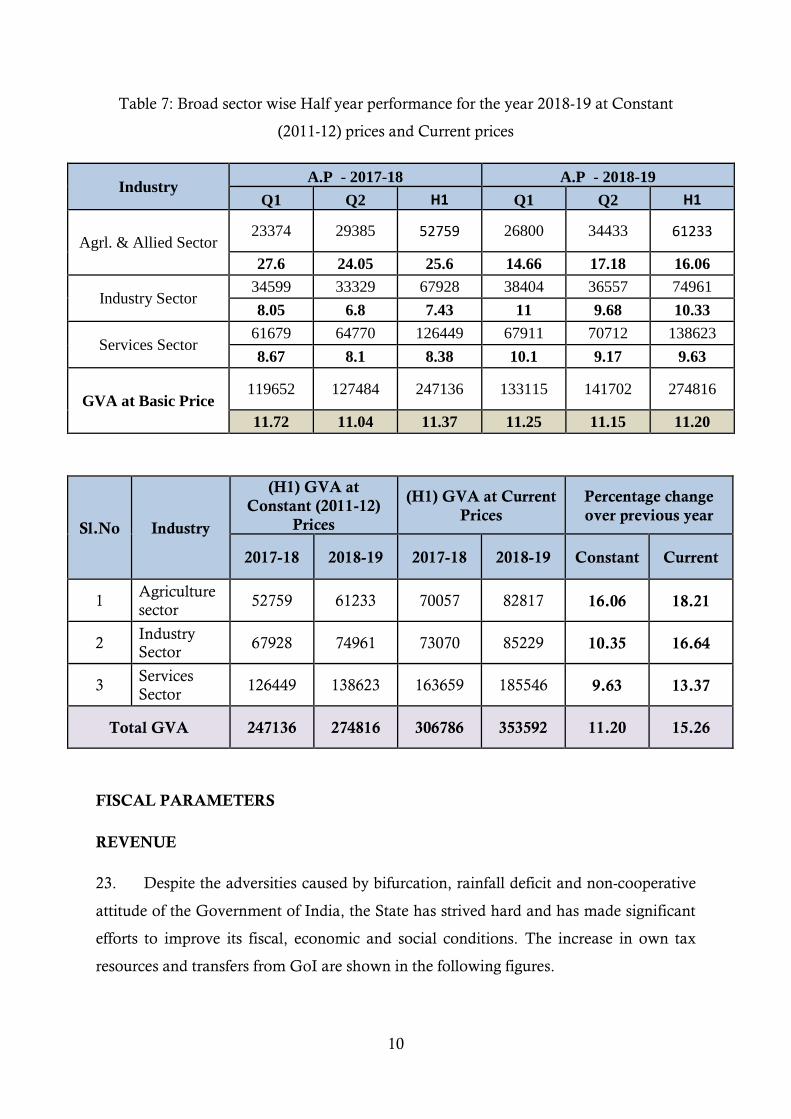
Table 7: Broad sector wise Half year performance for the year 2018-19 at Constant
(2011-12) prices and Current prices
Industry A.P - 2017-18 A.P - 2018-19
Q1 Q2 H1 Q1 Q2 H1
Agrl. & Allied Sector 23374 29385 52759 26800 34433 61233
27.6 24.05 25.6 14.66 17.18 16.06
Industry Sector 34599 33329 67928 38404 36557 74961
8.05 6.8 7.43 11 9.68 10.33
Services Sector 61679 64770 126449 67911 70712 138623
8.67 8.1 8.38 10.1 9.17 9.63
GVA at Basic Price 119652 127484 247136 133115 141702 274816
11.72 11.04 11.37 11.25 11.15 11.20
Sl.No Industry
(H1) GVA at
Constant (2011-12)
Prices
(H1) GVA at Current
Prices
Percentage change
over previous year
2017-18 2018-19 2017-18 2018-19 Constant Current
1 Agriculture
sector 52759 61233 70057 82817 16.06 18.21
2 Industry Sector
67928 74961 73070 85229 10.35 16.64
3 Services
Sector 126449 138623 163659 185546 9.63 13.37
Total GVA 247136 274816 306786 353592 11.20 15.26
FISCAL PARAMETERS
REVENUE
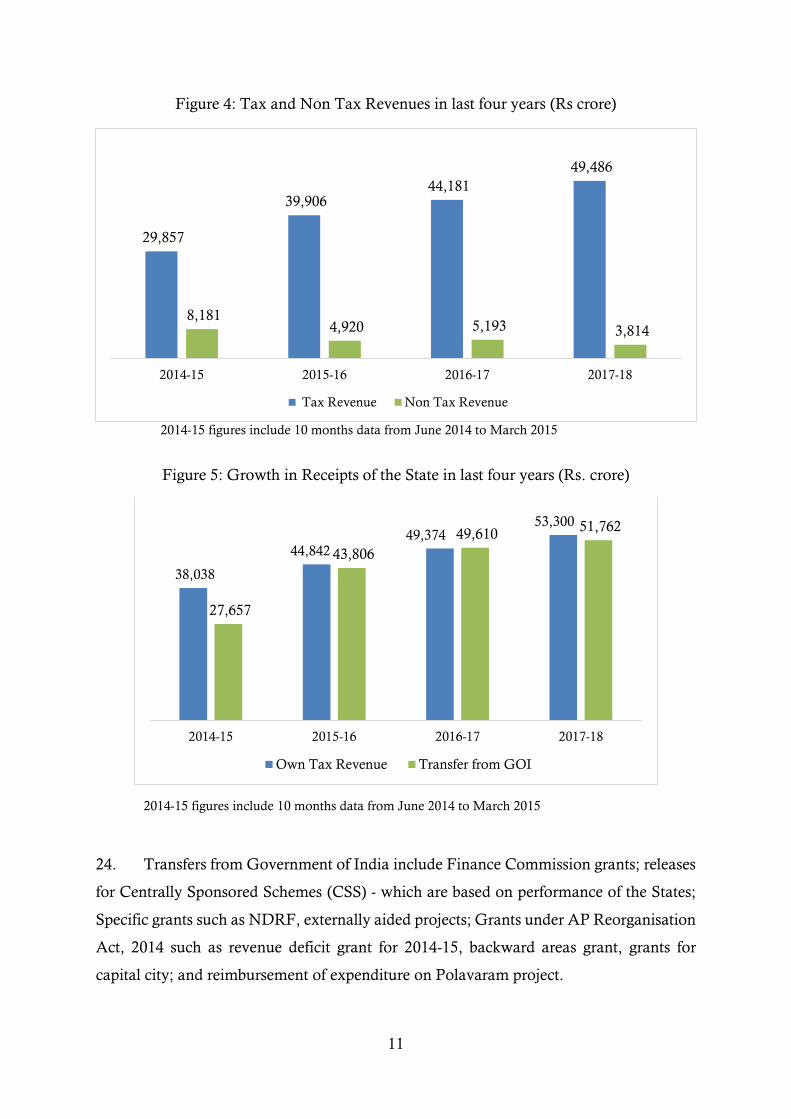
23. Despite the adversities caused by bifurcation, rainfall deficit and non-cooperative
attitude of the Government of India, the State has strived hard and has made significant
efforts to improve its fiscal, economic and social conditions. The increase in own tax
resources and transfers from GoI are shown in the following figures.
11
Figure 4: Tax and Non Tax Revenues in last four years (Rs crore)
2014-15 figures include 10 months data from June 2014 to March 2015
Figure 5: Growth in Receipts of the State in last four years (Rs. crore)
2014-15 figures include 10 months data from June 2014 to March 2015
24. Transfers from Government of India include Finance Commission grants; releases
for Centrally Sponsored Schemes (CSS) - which are based on performance of the States;
Specific grants such as NDRF, externally aided projects; Grants under AP Reorganisation
Act, 2014 such as revenue deficit grant for 2014-15, backward areas grant, grants for
capital city; and reimbursement of expenditure on Polavaram project.
29,857
39,906 44,181
49,486
8,181 4,920 5,193 3,814
2014-15 2015-16 2016-17 2017-18
Tax Revenue Non Tax Revenue
38,038
44,842 49,374
53,300
27,657
43,806
49,610 51,762
2014-15 2015-16 2016-17 2017-18
Own Tax Revenue Transfer from GOI
12
25. Out of these, the Finance Commission grants are received by all States as per the
award of Finance Commissions and it is a constitutional mandate for Government of India
to fulfil. As mentioned earlier, the Government of India has not fulfilled its assurances of
providing financial assistance under APRA, 2014. Therefore, the increase in flow of funds
from the Centre to the State have been on account of greater effort made by the State to
tap more resources under CSS. Measures have been taken to streamline the process of
submission of proposals and utilisation certificates of CSS funds in a timely manner.
26. The tax revenue as percentage of GSDP was 6.71%, 6.32% and 6.16% as against
7.98 %, 8.26% and 8.31% projected by the 14th Finance Commission during 2015-16,
2016-17 and 2017-18 respectively. This is because the State is yet to develop the tax base
after losing the main hub of economic activity, Hyderabad. Since the major contribution
to GSDP of residuary State is from agriculture and contribution from service sector is
lower, the tax to GSDP ratio is also low.
EXPENDITURE
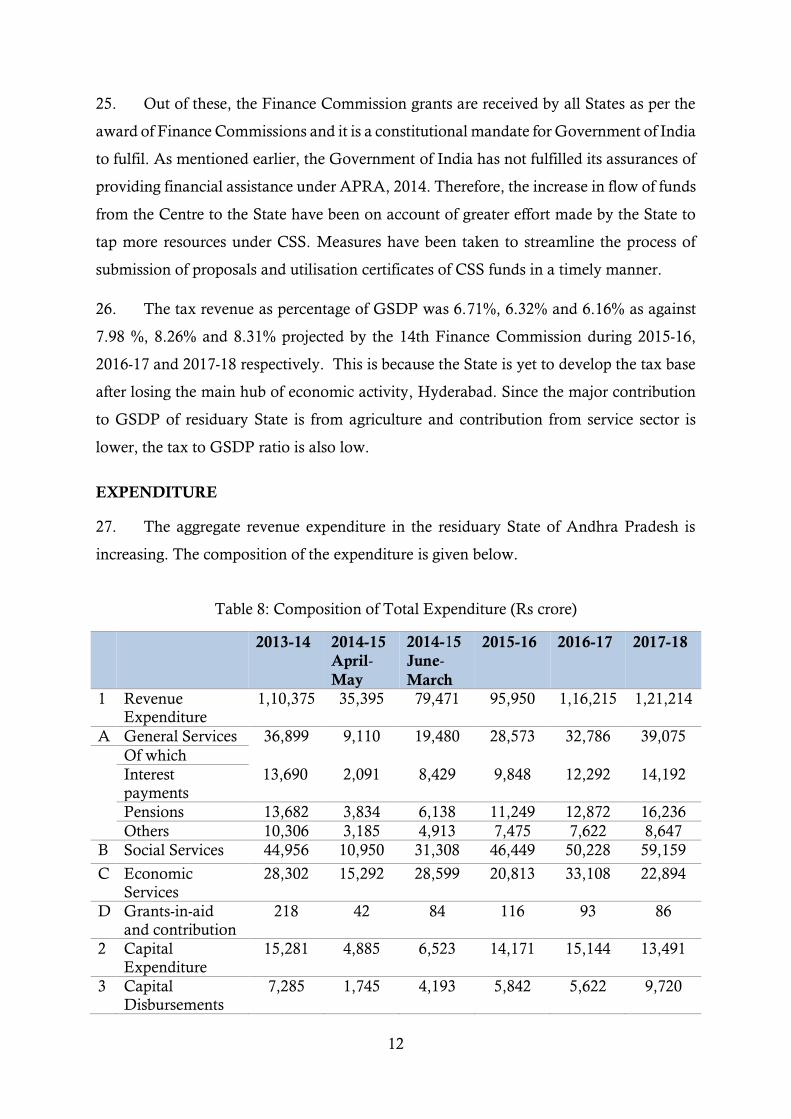
27. The aggregate revenue expenditure in the residuary State of Andhra Pradesh is
increasing. The composition of the expenditure is given below.
Table 8: Composition of Total Expenditure (Rs crore)
2013-14 2014-15
April-
May
2014-15
June-
March
2015-16 2016-17 2017-18
1 Revenue Expenditure
1,10,375 35,395 79,471 95,950 1,16,215 1,21,214
A General Services 36,899 9,110 19,480 28,573 32,786 39,075
Of which
Interest
payments
13,690 2,091 8,429 9,848 12,292 14,192
Pensions 13,682 3,834 6,138 11,249 12,872 16,236
Others 10,306 3,185 4,913 7,475 7,622 8,647
B Social Services 44,956 10,950 31,308 46,449 50,228 59,159
C Economic
Services
28,302 15,292 28,599 20,813 33,108 22,894
D Grants-in-aid
and contribution
218 42 84 116 93 86
2 Capital
Expenditure
15,281 4,885 6,523 14,171 15,144 13,491
3 Capital
Disbursements
7,285 1,745 4,193 5,842 5,622 9,720
13
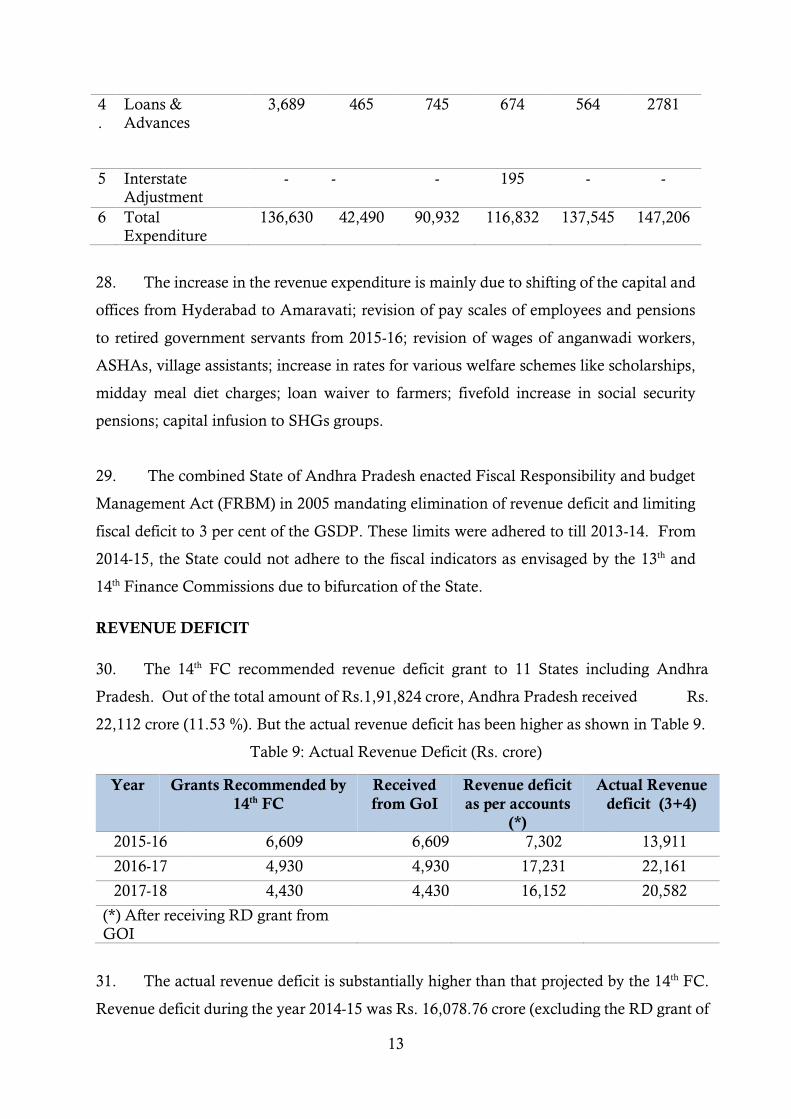
4
.
Loans &
Advances
3,689 465 745 674 564 2781
5 Interstate Adjustment
- - - 195 - -
6 Total
Expenditure
136,630 42,490 90,932 116,832 137,545 147,206
28. The increase in the revenue expenditure is mainly due to shifting of the capital and
offices from Hyderabad to Amaravati; revision of pay scales of employees and pensions
to retired government servants from 2015-16; revision of wages of anganwadi workers,
ASHAs, village assistants; increase in rates for various welfare schemes like scholarships,
midday meal diet charges; loan waiver to farmers; fivefold increase in social security
pensions; capital infusion to SHGs groups.
29. The combined State of Andhra Pradesh enacted Fiscal Responsibility and budget
Management Act (FRBM) in 2005 mandating elimination of revenue deficit and limiting
fiscal deficit to 3 per cent of the GSDP. These limits were adhered to till 2013-14. From
2014-15, the State could not adhere to the fiscal indicators as envisaged by the 13th and
14th Finance Commissions due to bifurcation of the State.
REVENUE DEFICIT
30. The 14th FC recommended revenue deficit grant to 11 States including Andhra
Pradesh. Out of the total amount of Rs.1,91,824 crore, Andhra Pradesh received Rs.
22,112 crore (11.53 %). But the actual revenue deficit has been higher as shown in Table 9.
Table 9: Actual Revenue Deficit (Rs. crore)
Year Grants Recommended by
14th FC
Received
from GoI
Revenue deficit
as per accounts
(*)
Actual Revenue
deficit (3+4)
2015-16 6,609 6,609 7,302 13,911
2016-17 4,930 4,930 17,231 22,161
2017-18 4,430 4,430 16,152 20,582
(*) After receiving RD grant from
GOI
31. The actual revenue deficit is substantially higher than that projected by the 14th FC.
Revenue deficit during the year 2014-15 was Rs. 16,078.76 crore (excluding the RD grant of
14
Rs. 2,303 crore). The revenue gap in the subsequent years was on the same lines but
Government of India is giving lower amounts as revenue deficit grants which has created a
financial stress on the State finances.
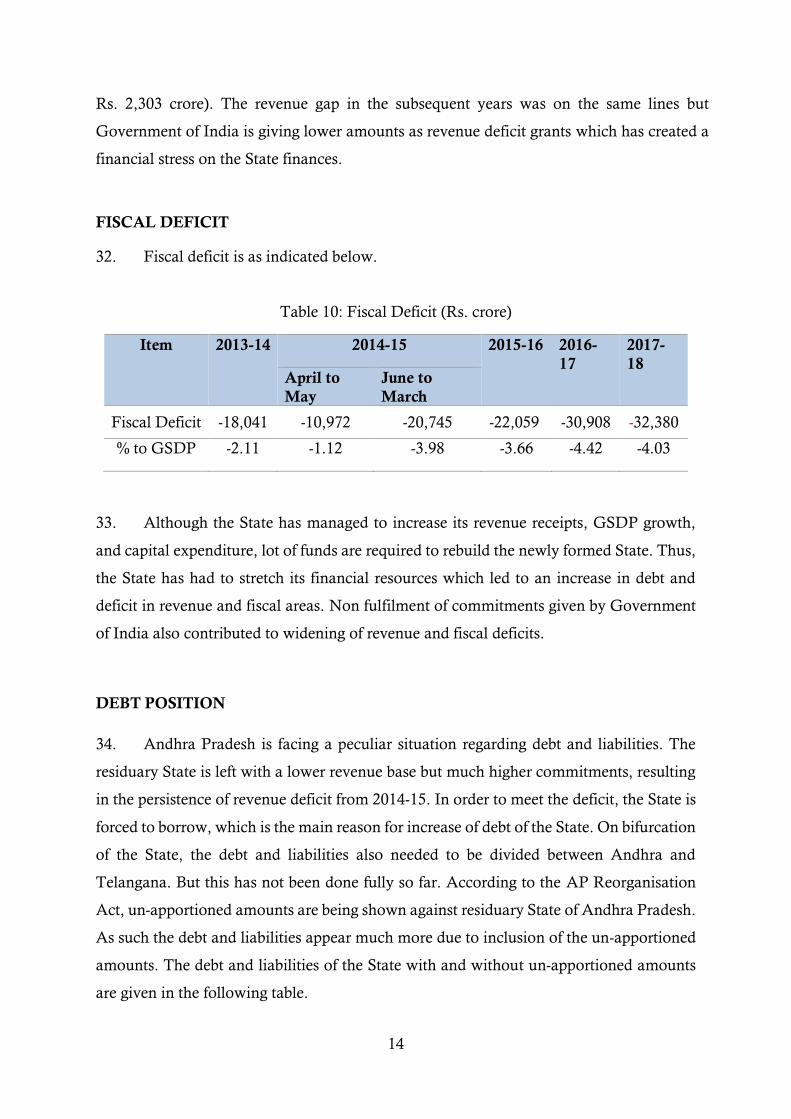
FISCAL DEFICIT
32. Fiscal deficit is as indicated below.
Table 10: Fiscal Deficit (Rs. crore)
Item 2013-14 2014-15 2015-16 2016-
17
2017-
18 April to
May
June to
March
Fiscal Deficit -18,041 -10,972 -20,745 -22,059 -30,908 -32,380
% to GSDP -2.11 -1.12 -3.98 -3.66 -4.42 -4.03
33. Although the State has managed to increase its revenue receipts, GSDP growth,
and capital expenditure, lot of funds are required to rebuild the newly formed State. Thus,
the State has had to stretch its financial resources which led to an increase in debt and
deficit in revenue and fiscal areas. Non fulfilment of commitments given by Government
of India also contributed to widening of revenue and fiscal deficits.
DEBT POSITION
34. Andhra Pradesh is facing a peculiar situation regarding debt and liabilities. The
residuary State is left with a lower revenue base but much higher commitments, resulting
in the persistence of revenue deficit from 2014-15. In order to meet the deficit, the State is
forced to borrow, which is the main reason for increase of debt of the State. On bifurcation
of the State, the debt and liabilities also needed to be divided between Andhra and
Telangana. But this has not been done fully so far. According to the AP Reorganisation
Act, un-apportioned amounts are being shown against residuary State of Andhra Pradesh.
As such the debt and liabilities appear much more due to inclusion of the un-apportioned
amounts. The debt and liabilities of the State with and without un-apportioned amounts
are given in the following table.
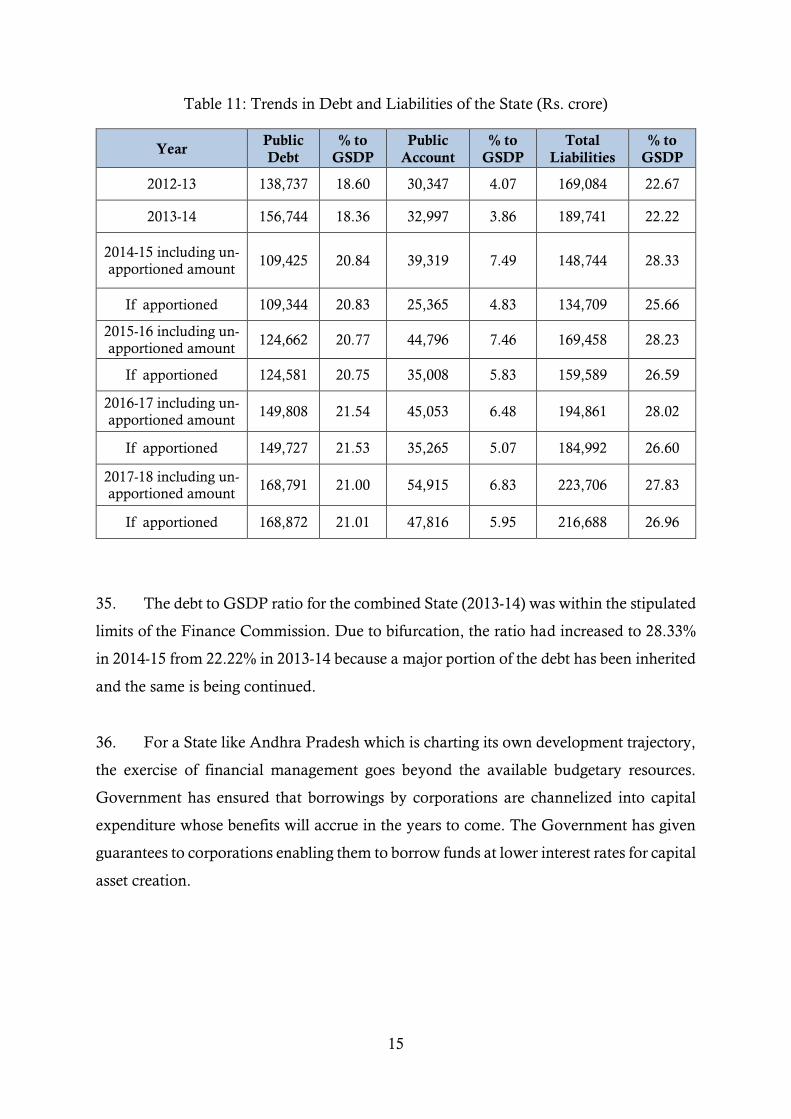
15
Table 11: Trends in Debt and Liabilities of the State (Rs. crore)
Year Public
Debt % to
GSDP Public
Account % to
GSDP Total
Liabilities % to
GSDP
2012-13 138,737 18.60 30,347 4.07 169,084 22.67
2013-14 156,744 18.36 32,997 3.86 189,741 22.22
2014-15 including un-apportioned amount
109,425 20.84 39,319 7.49 148,744 28.33
If apportioned 109,344 20.83 25,365 4.83 134,709 25.66
2015-16 including un-apportioned amount
124,662 20.77 44,796 7.46 169,458 28.23
If apportioned 124,581 20.75 35,008 5.83 159,589 26.59
2016-17 including un-apportioned amount
149,808 21.54 45,053 6.48 194,861 28.02
If apportioned 149,727 21.53 35,265 5.07 184,992 26.60
2017-18 including un-apportioned amount
168,791 21.00 54,915 6.83 223,706 27.83
If apportioned 168,872 21.01 47,816 5.95 216,688 26.96
35. The debt to GSDP ratio for the combined State (2013-14) was within the stipulated
limits of the Finance Commission. Due to bifurcation, the ratio had increased to 28.33%
in 2014-15 from 22.22% in 2013-14 because a major portion of the debt has been inherited
and the same is being continued.
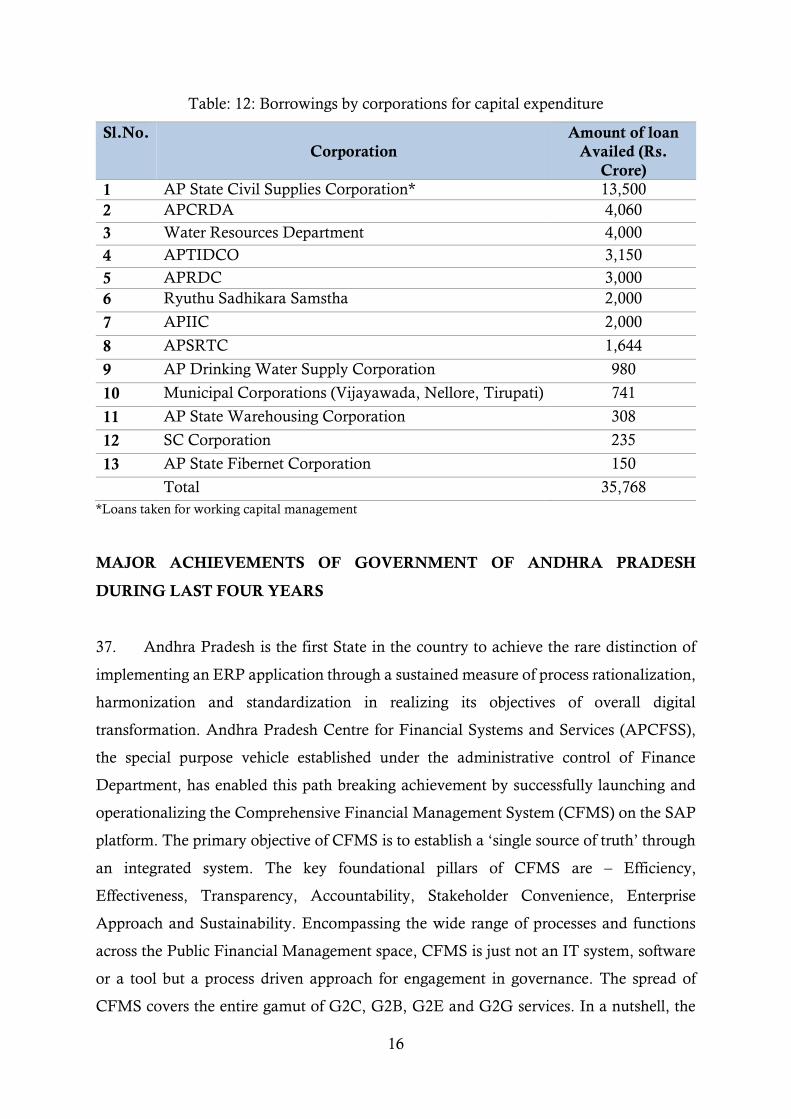
36. For a State like Andhra Pradesh which is charting its own development trajectory,
the exercise of financial management goes beyond the available budgetary resources.
Government has ensured that borrowings by corporations are channelized into capital
expenditure whose benefits will accrue in the years to come. The Government has given
guarantees to corporations enabling them to borrow funds at lower interest rates for capital
asset creation.
16
Table: 12: Borrowings by corporations for capital expenditure
Sl.No.
Corporation
Amount of loan
Availed (Rs.
Crore)
1 AP State Civil Supplies Corporation* 13,500
2 APCRDA 4,060
3 Water Resources Department 4,000
4 APTIDCO 3,150
5 APRDC 3,000
6 Ryuthu Sadhikara Samstha 2,000
7 APIIC 2,000
8 APSRTC 1,644
9 AP Drinking Water Supply Corporation 980
10 Municipal Corporations (Vijayawada, Nellore, Tirupati) 741
11 AP State Warehousing Corporation 308
12 SC Corporation 235
13 AP State Fibernet Corporation 150
Total 35,768
*Loans taken for working capital management
MAJOR ACHIEVEMENTS OF GOVERNMENT OF ANDHRA PRADESH
DURING LAST FOUR YEARS
37. Andhra Pradesh is the first State in the country to achieve the rare distinction of
implementing an ERP application through a sustained measure of process rationalization,
harmonization and standardization in realizing its objectives of overall digital
transformation. Andhra Pradesh Centre for Financial Systems and Services (APCFSS),
the special purpose vehicle established under the administrative control of Finance
Department, has enabled this path breaking achievement by successfully launching and
operationalizing the Comprehensive Financial Management System (CFMS) on the SAP
platform. The primary objective of CFMS is to establish a ‘single source of truth’ through
an integrated system. The key foundational pillars of CFMS are – Efficiency,
Effectiveness, Transparency, Accountability, Stakeholder Convenience, Enterprise
Approach and Sustainability. Encompassing the wide range of processes and functions
across the Public Financial Management space, CFMS is just not an IT system, software
or a tool but a process driven approach for engagement in governance. The spread of
CFMS covers the entire gamut of G2C, G2B, G2E and G2G services. In a nutshell, the
17
transformation and gains that are realized and are in the process of being realized are as
follows:
i. Better fiscal management – through the inherent tie up between the budgetary and
expenditure functions/processes there is an improved level of expenditure control
with transparency and accountability.
ii. Paradigm shifts in the functioning of treasuries, where the need for the
departmental users and public to visit the treasuries is drastically reduced thereby
saving a lot of productive time, financial and human capital and free that for
development priorities
iii. End to End paperless transactions – first to submit full accounts online and reduce
movement of paper, storage of paper and enhance retrieval of documents.
iv. Seamless integrations – integrate within the system and across the legacy systems
through a standardized approach of recording financial events, while ensuring the
internal controls over transaction processing.
v. Functional structured approach for all financial management functions under one
umbrella for the purpose of transparency, accuracy and timeliness.
vi. Evolving standard data classification within CFMS and propagating the same
across the other core systems to ensure transaction processing along with
implementing right internal controls over data entry, simplifying the interpretation
of rules, eliminating duplicate data entry and harmonizing and standardizing the
processes.
vii. Standardization of accounting processes - Works Accounts are migrated to the
Treasury mode (first state to do so end to end in the country) through dispensing
of transitory accounts; dispensing with suspense accounts and streamlined judicial
transactions.
viii. Near zero accounting of misclassifications, posting errors and elimination of the
wanting vouchers epidemic.
ix. Ease of use - a citizen, a business, or an employee are enabled to conduct their
transactions with the Government in an end to end online mode. The ease of
conducting this transaction at the comfort of home or office and online through
Web, mobile or a tablet is a major change.
x. Introduction of Multiple modes of payment – net Banking, debit card or credit card
- through a payment aggregator service enabled seamless auto reconciliation and
18
improvement in the overall revenue realization cycles, thereby bettering the
revenue forecasts for the State for better deficit management.
xi. Direct integration with RBI eKuber 2.0 platform enabling seamless payments to
the beneficiaries across the spectrum avoiding leakages and parking of funds.
xii. Ability to track expenditure on all grants and schemes to the last level including in
PD Accounts.
xiii. A top down and bottom up mapping of all Offices, Positions and Relationships
between them is available at one source.
xiv. Collation of historical and transactional data at one common source pacing the
way for robust data analytics.
xv. Unique identity to all persons through their life cycle with GoAP.
xvi. Validation of vendor records through Aadhar and PAN & duplicate/redundancies
elimination.
xvii. Wherever feasible, manual interventions are removed by implementing rules
engines for seamless processing, like reconciliations through eKuber etc.
xviii. Ability to track self-drawls and curtail excess drawls and also control parking of
funds outside government.
38. The Government also carried out debt swap to replace high cost loans of various
corporations with low cost loans and thereby achieved reduction in expenditure on interest
payments. As a result of this prudent financial exercise, saving of nearly Rs. 573 crore in
interest payments per year has been achieved.
39. In the past four years, the Government of Andhra Pradesh has taken several
measures for the welfare of the regular/contract/outsourcing/NMR/contingent
employees. These include:
i. A fitment of 43% of the Basic Pay was allowed for fixing the pay in the Revised
Scales of Pay 2015 as against 29% recommended by the 10th Pay Revision
Commission to the regular Government Employees.
ii. Permission has been accorded to the relevant recruiting agencies for filling up of
about 29,000 vacant posts.
iii. Remuneration to the outsourcing employees has been enhanced.
iv. Remuneration of contract employees has been enhanced by 50%.
19
v. Remuneration equivalent to the minimum of time scale in the Revised pay scales,
2015 has been extended to the Full Time/NMR/Daily Wage/Consolidated
pay/Part-time employees, who are appointed before the crucial date of 25-11-1993
and working in Government Departments.
vi. Benefit of funeral charges (obsequies charges) of Rs.15,000/- has been extended to
the deceased contract and outsourcing persons.
CONCLUSION
40. The economy of residuary Andhra Pradesh has inherent weaknesses. It is an
agrarian economy, has a low tax base and hence suffers from revenue disability. The
inheritance of huge debt due to unscientific bifurcation, non-co-operative attitude of
Government of India in fulfilling assurances have further put stress on the fiscal position
of the State. However, the financial impediments are being overcome by mobilising low
interest finance and debt restructuring. The Government has always encouraged and
embraced innovative ideas and convergence approach to achieve greater outcomes with
limited resources. The vision is to increase the gross value added in the economy on a
sustainable basis, develop an ecosystem for wealth creation which will lead to poverty
alleviation. In order to ensure long term economic growth sustainability and wealth
creation, the Government is focussed on strategic management of natural resources.
Government is making all out efforts to increase water conservation by adoption of
effective water management techniques, and increase availability of water for agriculture,
industry and drinking through capital expenditure on major irrigation projects like
Polavaram and others. Core infrastructure in villages is being developed on saturation
mode including concrete roads, gram panchayat buildings, school buildings, anganwadi
buildings, LED street lights, sanitation infrastructure for ODF.
41. Apart from effective natural resource management, the Government is equally
focussed on human resource building. Despite the financial adversities, the State
Government has not compromised on welfare. Upholding the principle of democratic
governance, the Government is steadfast in its resolve to build its social capital by investing
heavily on education, health and social welfare. The Government has embarked on the
path of building a futuristic knowledge economy through introduction of digital class
rooms and providing enhanced support to students by increasing scholarship amounts,
20
dietary allowance for better nutrition and cosmetic amounts for better hygiene; as well as
adopting specific measures for empowering girl child. On the health front, Government
efforts are directed towards reducing out of pocket expenditure on healthcare. The
Government is going ahead with implementing social welfare schemes on saturation
mode. There has been a fivefold increase in social security pensions. Government has
revised wages of anganwadi workers, ASHAs, village assistants. Village economy has also
been strengthened through capital infusion to SHGs groups.
42. Even in times of adversity, with dedication and commitment, the State could
achieve a record double digit economic growth due to a well laid out action plan to realise
the vision of being a happy, inclusive, innovative and globally competitive State and
society. A plan to achieve the SDG milestones by 2022, earlier than the UN stipulated
timeframe of 2030, saturating the rural infrastructure, a vision of a green economy, 100%
Fibre net connectivity, building the confidence of investors for creating employment,
ecosystem for skill and innovation, globally competitive cities and infrastructure,
leveraging technology for real time governance are included in the strategy of being among
the three best States in country by 2022 and the best State in country by 2029.