government of research designs and standards organization
TRANSCRIPT

GOVERNMENT OF INDIA MINISTRY OF RAILWAYS
Research Designs and Standards Organization LUCKNOW
LAB VALIDATION REPORT OF
TRACK RECORDING SYSTEFJ (TRC-7967)
TEChTNICAL REPORT NO. TM - 133
TRACK MACHINES & MONITORING DIRECTORATE 0 r-
JUNE 2009 0- rf a

This report is based on study made by the Track Machines
and Monitoring Directorate of RDSO. Every care has been taken in
recording the data accurately and in analjlsing it objectively. The
views expressed in this report are subject to modifications from
time to time in the light of fresh data. Further, they do not
necessarily represent the views of the Ministry of Railways
(Railway Board), Government of India.
This report is the property of the RDSO and is meant
essentially for official use. It may not be loaned, reproduced in
part or in full, or quoted as an authority without the permission of
Director General, RDSO.
Vijay Sharma Exec. DirectorITM 4
I'- 0- d 0
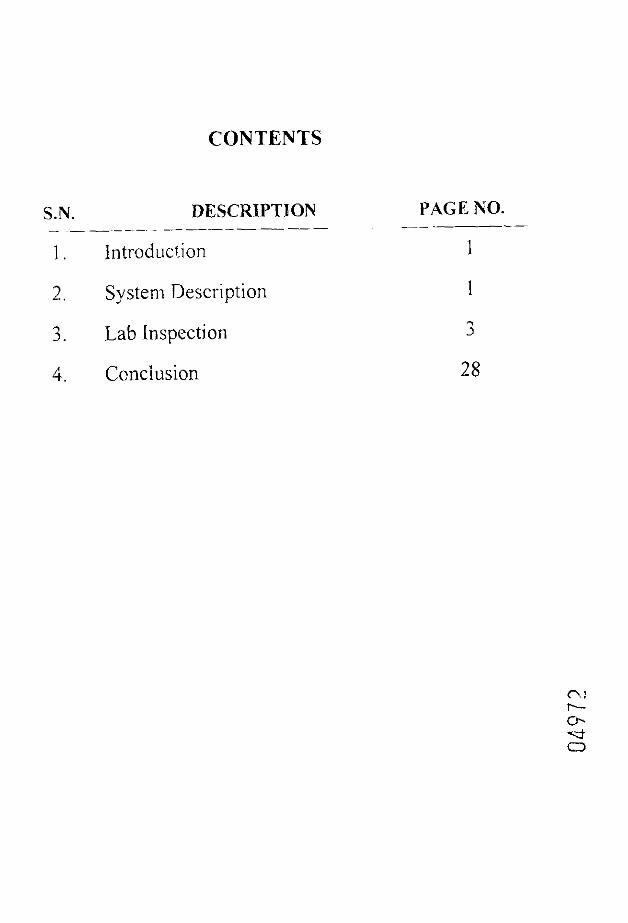
CONTENTS
S.N. DESCRlPTlON PAGE NO. - -_ - - - _ - -
1 . Introduc!ion 1
2. System Description 1
3. Lab [nspection
4. Ccnciusion

LIST OF ABBREVIATIONS
S.N. -- .-
I .
Abbreviation Stands for - - -
CPU Central Processing Unit
LASER Light Ampliiication by Stiniulated Emission of Radiation
LVD'I' Linear Variable Differentials 'Transformer
.4DC Analog to Digital Converter
ALD Autonlatic Location Detector
DAC Digital to Analog Converter
GF Ground Feature
SD Standard Deviation
DiO Digital input output
IKPVJM Indian Railways Permanent Way Manual

The work of supply, installation and commissioning of one track recording system was awarded to M/s System Aids, Bangalore vide purchase order No 036x0385-N-08035166 dated 04.04.2008. The firm offered the system for inspection and lab validation in November 2008. 'l'he lab validation and inspection of the system was done by a team of RDSO officials from 12.' 1.2008 to 17.1 1.2008 and 08.12.2008 to 10.12.2008. The \.arious tests were performed during inspection and lab validation of the system. The brief system description and the various tests carried cut during the lab validation and inspection of the system to assess the performance of the system in lab have been discussed in this report. The scope of the report is li~nitcd ibr assessment and verification of the performance of the track recording system ~ ~ n d c r control laborator:,: conditions i n 1crnis of contract p:.ovisions.
2.0 SYSTEM DESCiUP'TIOX
The picture of complete track recording systcm is belo\$ in jig.-]
Track recording system is a real time data acquisition and on-line processing system. Data acquisition, proressing and rcpun pri l~t ,~~: [asks are distributed among three h~dustrial computers. In addition to these three industrial computers a micro controller based simulated signal generator spslen: is also provided to simulate the transducer signals and speed in static condition of vehicle for testing of'track geometry measurenncnt system. Transducer signais for measurement of'track geometry and -~.ehicle parameters are captured in real time at a sampling interval of 0.30 meter, processed, stored, and displayed on TFT monitors. The crception report is printed on heavy duty DOT matrix printer and analog report is printed on LASI'I? printer. I t has also had the facilit) to print exception report also on LASER pri;l:cr.

Pre-prepared route data tape is played back slung with the recording so as to give location of ground features. Facility for periodic s!;ncluonisation of this route data tape using ground transponders is also provided for reporting of accurate location of ground features.
As shown in Fig.-] the entire system has been installed in three 19'' racks. The rack-l is named as Data acquisition and Simulator rack. the various subsystems and equipmcnts mounted in this rack are listed bclow in bottom to top sequence-
System power supply Gyro Power supply Industrial PC based data ;~cquisi~ion systcrn Spare Cards Patch Pancls filr inie:ting simulated sisn;~lx =id iiionilnring output ol' cards. Signal condi~iotlcrs Micro-con~roller based si~iiula~ctl sign;~l g c ~ i ~ ~ i . ~ i o r Digital multi rnetcr C~scilloscope Function generator
The rack-2 is named as Opcrator Console. This r ~ c k acconimodates Industrial computer based processing system: keyboanl, T I T monitor (11' processing system and data acquisition system. The rack-? named as Printing and (;rapliic rack accommodates !ndustrial PC based graphic and Print Manager system CPIJ. keyboard. monitor and two LASER Printers. The dot matrix printer has been install-d on a table kept on right side of the racks. The detail description of ail tlicse sub systems 1iariln:arc modules and equipments has been given in para-3.0 under lab validation of hardware.
?lie system has the capabilit? for measurement, storage. processing and generating desired reports for the following track and vehicle paranieters-
Vertical profile on two user selectable filters and calculation of unevenness on two user selectable chords in the range o f 2 to 20 m. Lateral profile on t\&:o user selectable filtcrs and calculation of alignment .. - on two user se!eciahle chords in the range (11 10 111.
. Twist on two user selectable bases in the range of 2 to 20 rn. Gauge ~n Cross level t-
Curvature u- -if
Vertical and lareral acceleration of thc cciacl? 0
One impcrtant feature of llie s);steni is il.'s capahiiity at' providing roll and );a\\. correction signal to lateral proiilc accclcr~merer signal fix ,l<curatc !recording of laterai profile/ali_enment using inclinometer. yaw I-arc g!:ro and roll rate gyro. The facility for \\.heel wear compensation has a1s11 been i~ico~-l?~raicd in l!ic systcni with the use of 1000 pulse tacho generator. Further to make the recording reli;~!~lc in the entire speed band of 20-160 kmph instcad of fixed 8 Hz cut-ofl'lo\\ pass liltcrs3 ;)rosramn~ablc low pass filter of 1.5 m fixed wave length cut-off has been incorporated in the system design. A user friendly menu driven soft\vare has been designed l i~r dala aciluisition. processing, storage arid reporting of various track geomc.tT p:lr:lmcter.;. I ~ h e \ : ! I -~<I! IS sofi~iare modules ol'thc - - .;>.stem h3>,c been discussc,: in par., ,I,). 2.: I I ' :;spccii t~l'soi'~\vare n~odules.

. -. - -.. . p- ..
CLZR , Cl,%i. , C . I . . ~ ~ C LA'l' XL
From the above table-3 and table-4, it can be seen that the difference in calculated and reported cross-level in all the cases for left and right side is less than 0.2nlm. These values are considered satisfactory in view of desired accuracy.
5.1 6.7 1.6
1.62
- CLZR
Initial Value Final Value Difference
Difference
(c) LVDT:- Geotran make LVDTs of +I- 80 mm and +I-40 mrn ranges have been used for measurement of vertical and lateral relative displacement respectively. The photb of LVDT is shown in fig.-5. The detailed specification of these LVDTs are given below-
14.8 1 -20.8 24.7 1 -34.3 9.9 1 -13.5
lnitial Value
CLZL -19.8 -25.7 -5.9
CLZR 1 CAY 24.7 1 -34.3 3 4 7 / -47.7
10 1 -13.4
-8.1 / 11.9 / -21.7 / -1.1
Table -5 I Sr. No. I Parameter / Values
Calculated cross level= (CAY-CLZL+CLZR)*DG/L
-1;.8
XL 6.7 8.3 1.6
Calculated cross level= (CAY-CLZL+CLZR)*DG/L
Calci~lated crms level= (CAY-CT .TI .+Pl .%R)*nG/T I - 1 1 5
I I
1. / ~ta$dard Out~ut . Fsd / 350mv --I
Final Value I -19.8 Difference I -6
1.69
2. ( Excitation Voltage: ( I-5Vms 1 3. I N U ~ I Voitaee at zero I~essthan10/3 1 4. \ Temperature range 1 0 - 5 5 deg C I
15. 1 Non-Linearity: 1 +I-0.7% fsd 6. I Cable k c o r e shielded cable 7. I Polarity Compression +\re

Output: Both vertical and laterai LVDl's have an amplified output of 20 mvlmm.
Inspection Procedure: The LVDTs were tested by performing calibration under static condition as per procedure described under para 3.3.2 (calibration and diagnostics). Further, for checking the linearity of the LVDTs, it was mounted on calibration zig and displacement was given in the steps of 10 mm for the entire range and output voltage was measured on the oscilloscope. The graph between displacement and corresponding output was plotted for verification of linearity and it was observed that the output of LVDTs is linear in the entire range. The process was repeated for all the LVDTs.
(d) Gyroscope:-
I'wo single axis rate gyros have been used for measurement of roll and yaw movement of the vehicle. These are ECIL make gyros having an output of 70mv/degree/sccond. The calibration ~f gyro can only be performed on a rotating turntable, which is available with the manufacturer only, thus calibration report furnished by ECIL was considered correct. The photo of Gy.oscope is shown in fig.-6. Specifications of the rate gyroscopes used are given below-
Rate range :+/- 40 dcglsec Excitation: Motor : 26V 400Hz single phase Rotary TR : 26V 400 Hz single phase Output (scale :8ctor) : 63 +I-lOmV/deg/sec With 5K ohms load Null voltage : SOmV(max)
Fig -6 ch However, the functioning of gyros were tested with zig simulation a n d 0
described in para 3.3. l (c).
(e ) Tacho:.
The Tachometer used in the system has been manufactured by M/s Transducers and Allied Products ('I AI'S): Bangalore. The tacho generates 1000 pulse per revolution and these pulses are used for calculation of speed and for generating sampling interval intenupt. The tachometer is shown in fig.-7.

Inspection Procedure: The Tachometer was rotated in both directions and pulses were monitored on oscilloscope for verifying the level of signal. The number of pulses generated by the tacho in one revolution was checked by executing calibration module. Further, it was also rotated at varying speeds using a DC motor in both forward and reverse directions and the signal was fed in the system. It was observed that variation in rotation of DC motor causes variation in speed. All these tests conclude that the tacho is working satisfactorily.
( f ) Automatic Location Detector (ALD)
The ALDs used in the system for detection of ground targets are photoelectric sensor with adjustable setting distance and mounted in rugged metal housing The sensing distance of ALD varies from 5 to 500 mm. The light source used in ,t?le sensor is an infrared LED of 860-nanometer wavelzngth. The operating voltage for the sensor is specified as 10-30 volt DC. The Automatic Location Detector is shown in fig.-8 lnspection Procedure: The automatic location detector sensors were tested for a detectinglsensing range of 150 mm to 200 mm. Each sensor was tested for its Y-I
actuation individually. The ALD sensors were found working in the desired 2 range. u

(g) Draw Wire Displacement Transducer (DT):-
The DT's are used for long displacement measurements. In this system, three numbers of DT's have been used for measuring curvature of Track. The Specifications of the Draw Wire Displacement Transducer are given below:
Make: Geotran Model series: DWT 250
Mehsuring range: 250 mm
Non-linearity: 01 %
Excitation: 5 to 25 V DC
Out put: 90 to 95 % of input supply (*I 0 ?/o)
Dimension (mm) For 250 mm range
The Draw Wire Displacement Transducer is shown in fig.-9.
Inspection Procedure: The Draw Wire Displacement Transducer sensors were tested for a detectinglsensing range of 250 mrn. Ezch sensor was tested for its actuation individually. The Draw Wire Displacement Transducer sensors were found working in the desired range.
3.1.2 Signal Conditioners and Filters
Instrumentation amplifiers have been used in signal conditioners. Each accelerometer consists of a pre amplifier to boost the signal before sending it to the corresponding amplifier card. The pre-amplifier card is placed close to the transducer bridge to avoid spurious noise. The signal conditioner can be broadly categorised as follows-
a) Accelerometer ~ m ~ l i b e r s : - These are used along with Geolran type Accelerometers. These are provided with zeroing and gain adjustrnent facility. which has been checked by connectins the

accelerometer and adjusting the offset control manually. The gain of each amplifier is to be adjusted manually. The zero and gain stability was checked and found satisfactory.
b) LVDT Amplifiers:- These are provided with gain adjustment facility only. The zeroing is done by moving the ?ore of LVDT manually. The zeroing can also be done by connecting an extender card and adjustihg the potentiometer provided on the card manually. The zero and gain stability were checked and found satisfactory.
c) Gyro amplifiers:- Facility for zeroing and gain adjustment is provided on the front panel of the amplifier card and is to be adjusted manually. Individual Gyro amplifiers are used for Roll and Yaw Gyros.
3.1.3 Data acquisition system
The data acquisition system is the most important ,ub system connecting the real world sensor signals at one end and processing system at the other end. The hardware of data acquisition system consists of an Industrial Intel@ Core 2 Duo CPU 2.2 GHz with 512 ME3 RAM, key board, mouse, 160 GB hard disk and 15 inch TFT colour monitor. It also contains two ADC cards, crne DAC card and one DIO card. The analog electrical signsls fiorn appropriate transducer/sensor are acquired in real time and converted to digital signal using two 16 bit AKl cards and sent to the processing system collnected at other end through parallel port for processing. It also receives pulses from tacho generator through DIO card can generates speed and distance information. For manual marking of ground features, the GF key pad is also interfaced with this systen and for accurate synchronization of route data, t h e - A ~ ~ data is also acquired by this system. The performance of this system has been tested with simulated signal and Zig testing, interfacing of G.F. key pad and ALD sensor was also tested.
3.1.4 Processing System
The hzrdware of this system consists of an Intel@ Core 2 Duo CPU 2.2 GHz with 2.2 GB RAM, key board, mouse, 160 x 2 GB hard disk, and 17" TFT colour monitor. All 2 -., the initial parameter setting and header information are entered t!!ough this system only. rn The raw data i.e., transdu~er signals acquired by data acquisition system are sent to 2. processing system through parallel communicatiori. The transducer signals are combined and passed through high pass digital filters to derive various track parameters. All the processing of desired track parameters and vehicle parameter is performed in this system only. The processing of track and vehicle parameters includes calculation of mid-chord offsets, SD for track parameters and Ride indci; for vehcle parameter for every block of 200m length, ~ e a k and SD based indices, peak distribution and peak exceedences. Mid- chord offset, profile output and processed data are sent to print manager and graphic system through standard TCP/TP communication. This system is also used for storage of raw data, ProfileIChord data and processed data. The route data tape is also played back in this system only for printing and synchronisation of ground features. This system also displays the analog output of any eight selected parameters for every block of 200 m distance in real time.

3.1.5 Print Manager and graphic System
The hardware of this system consists o f a Intel@ Core 2 Duo CPU 2.2 GHz with 2.2 GB RAM, key board, mouse, 160 GB (2 nos.) hard disk, CD writer and 14" VGA colour monitor ,HP Printer Model no. P-3005 LASER printer and one Dot Matrix printer. One Laser printer spare is available for unforeseen circumstances connected tb the system for printing of on-line and off-line reports.
After completion of a kilometre, mid-chord offset values of various parameters or profile output along with gauge, cross level and twist (any 8 parameters) are displayed in the video display unit by this system. In addition to this, it manages the printing of analog and exception report on connected DOT Matrix printers, based on the various chord, profile and processed data received fiom processing system. The TCPLP communication interface is used between the processing system and print manager and graphic system.
3.1.6 Simulator
The main function of the simu!ator is to generate the various signals required to test the hardware aid software of system. The generated signals are injected in the respective amplifier channel inputs. The various options available to generate different signals are menu driven. It also generates tacho pulses for generation of simulated speed.
The various input signals of a known amplitude and frequency were generated using simulator module. The amplitude and frequency of the signal were measured at the output of the corresponding channels through oscilloscope. The frequency and amplitude values were fed in Simulator module for generation of signal by simulator. The generated signals were monitored, on oscilloscope. Input values of frequency and amplitude along with generated values of frequency and amplitude are tabulated below in tabled.
.- . .
The tabulated results clearly indicate that the simulator is working satisfactorily.
3.1.7 GF key board
The GF keyboard is having 24 keys including two users' keys. The GF key board was tested during the run mode. The GF keyboard's keys were pressed during the run mode and all the keys were checked for its correctness. The pressed ground features were printed during the run both in digital and analog printouts. The analog and digital printouts

with ihc GF keyboard features are shown in Amexure-I The GF keyboard is fo<l!ld to be working satisfactorily. The GF keyboard was also tested by using the software module piovided by firm for this purposc under sub menu diagnostics.
Fig -10
3.1.8 Power Supplies
The system consists of a 24 V, 10A (max) regulated power supply for signal conditioner units. This 24V Ci is connected to each amplifier cards except Gyro amplifier cards. Each card has its own DC-DC converters, which convert the 24V to +-12V DC and +5V DC. The meawed values of the power supply are given below in table-7.
Tablc-?
A 26V, 400Hz independent power supply has been used for gyros. The outputs of power supplies were monitored with the help of a multimeter and were found to be correct within the specified accuracy.
S.No. 1 2 3 4
3.1.9 Measuring equipments
Two measuring equipments have been provided with the system for monitoring the signals and also to measure the voltage, current and resistance. For monitoring the signals, a 20MHz oscilloscope with dual trace is provided. For measuring the voltage, current and resistance, a digital multimeter is provided. Both these equipments were used during lab validation and f o y d to be working satisfactorily.
Actual value +24 Volts DC +12 Volts DC -12 Volts DC + 5 Volts DC
3.2 Verification of filter response
In the system design, low pass filters in different channels to cut-off the irregularities having wavelength upto 1.5 m has been implemented in hardware (amplifier
1 1
Measured vrhe -
+ 23.95 V + 11.83V - 12.2 V + 4.95 V

card) and to cut-off the high wavelength irregularities of selected wavelength between 20- lOOm has been implemented in software. Combined response of low and high pass filters have been verified in the lab validation. The filter response has been verified for LVDT and accelerometer channels on 40m and 70m cut-off at the selected speeds of 30, 50, 100 and 140 kmph. The test procedure is discussed below-
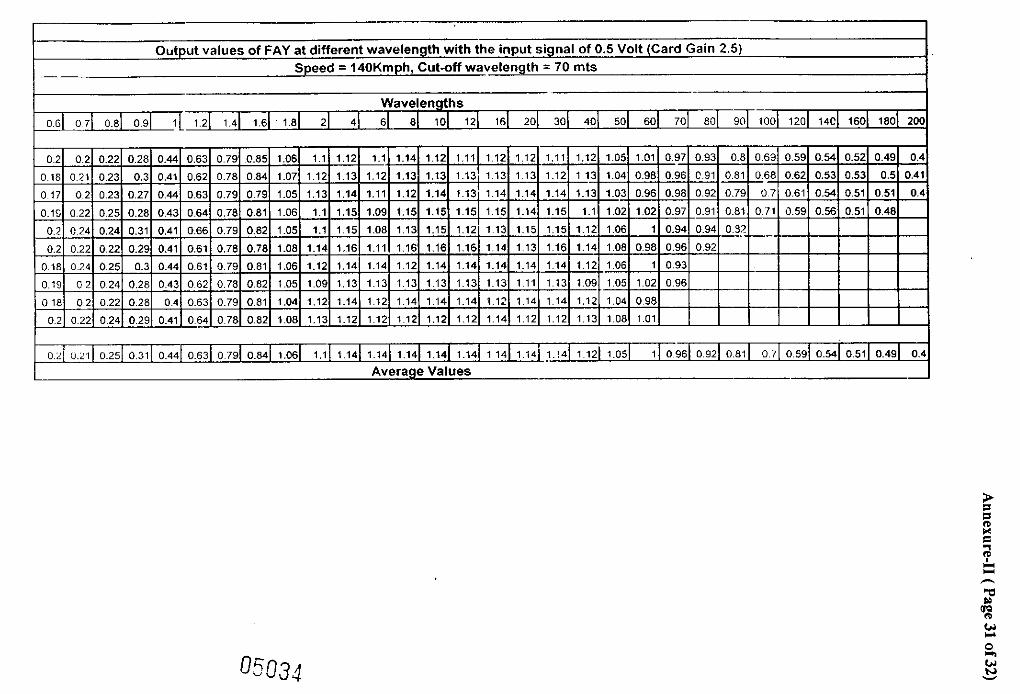
Test Procedure: Tu test the filter response, sine wave signals of known amplitude and varying
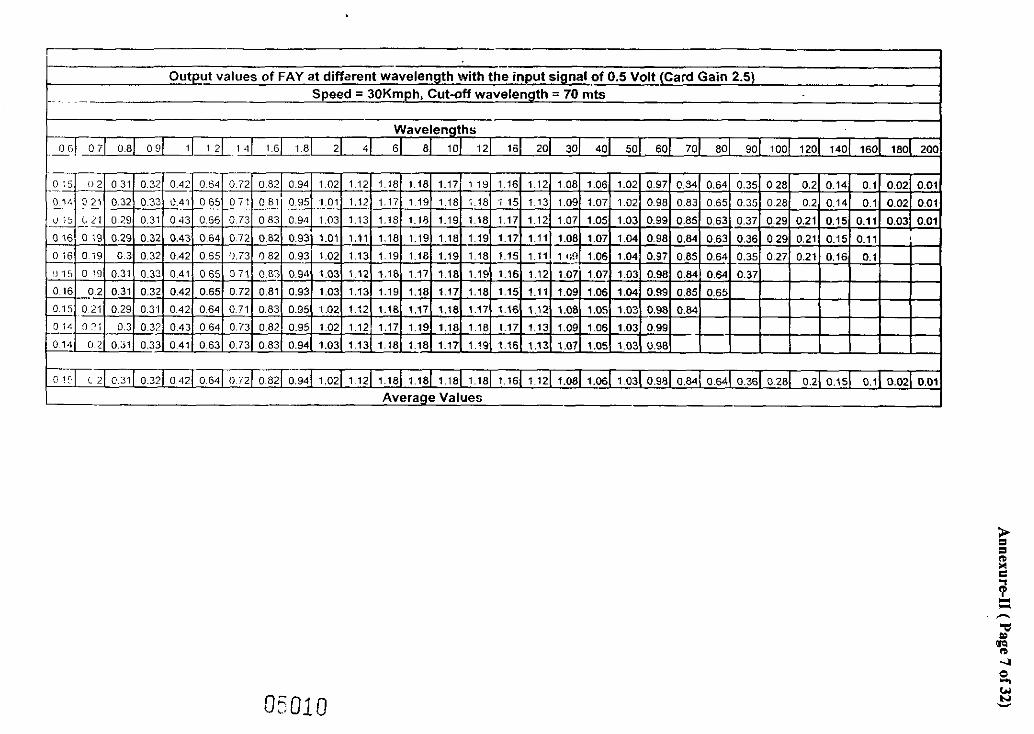
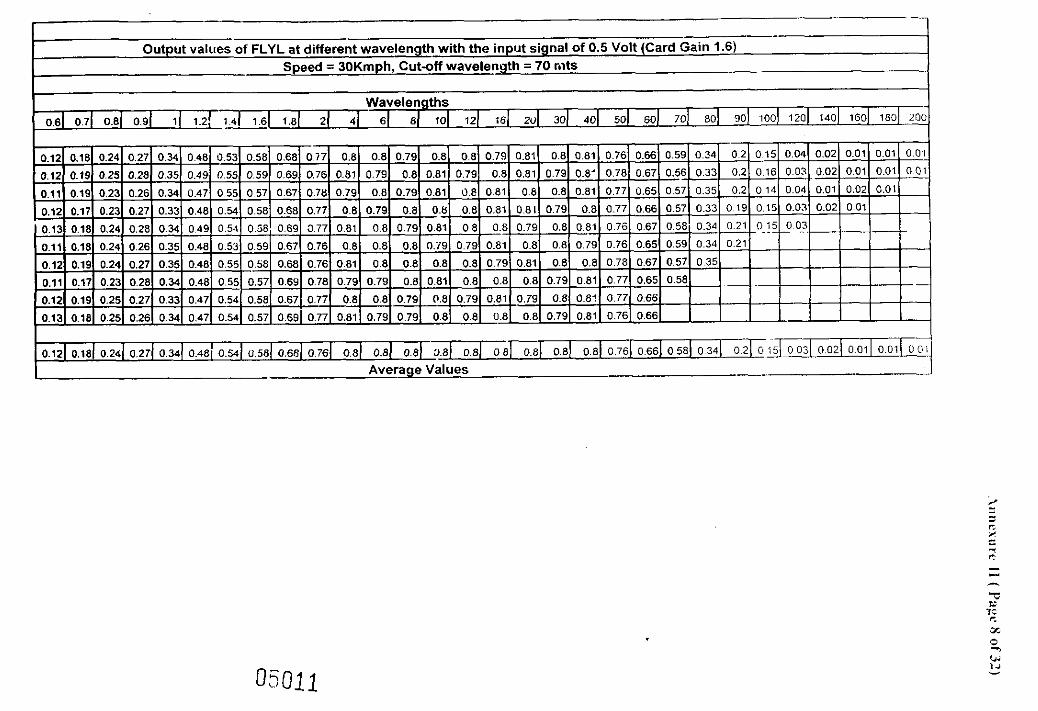
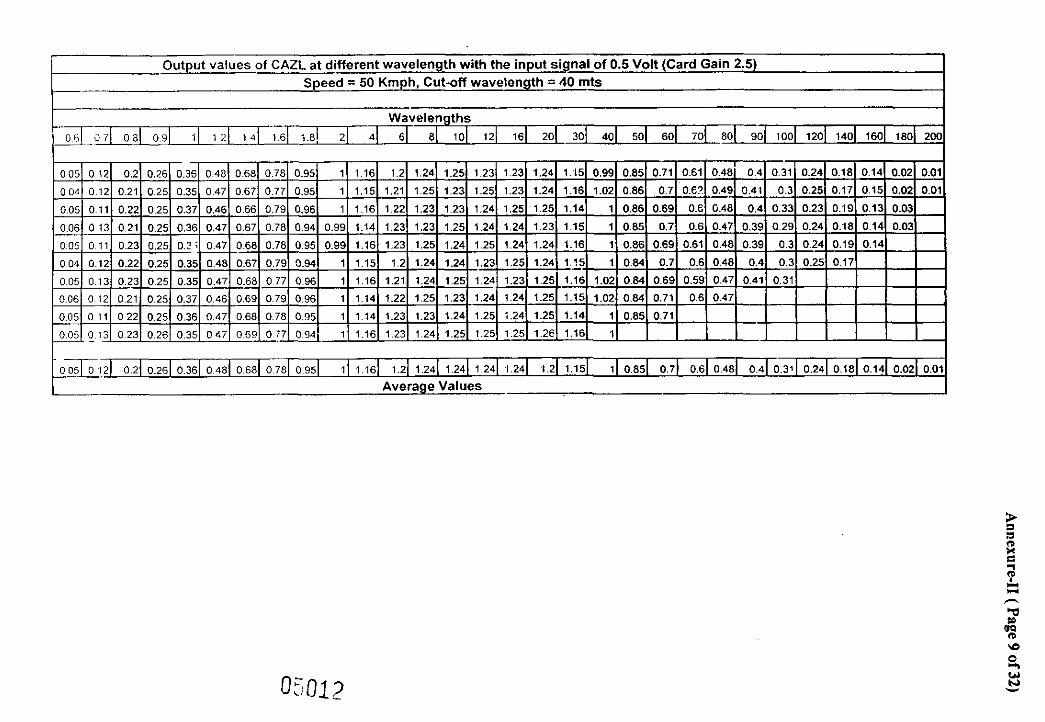
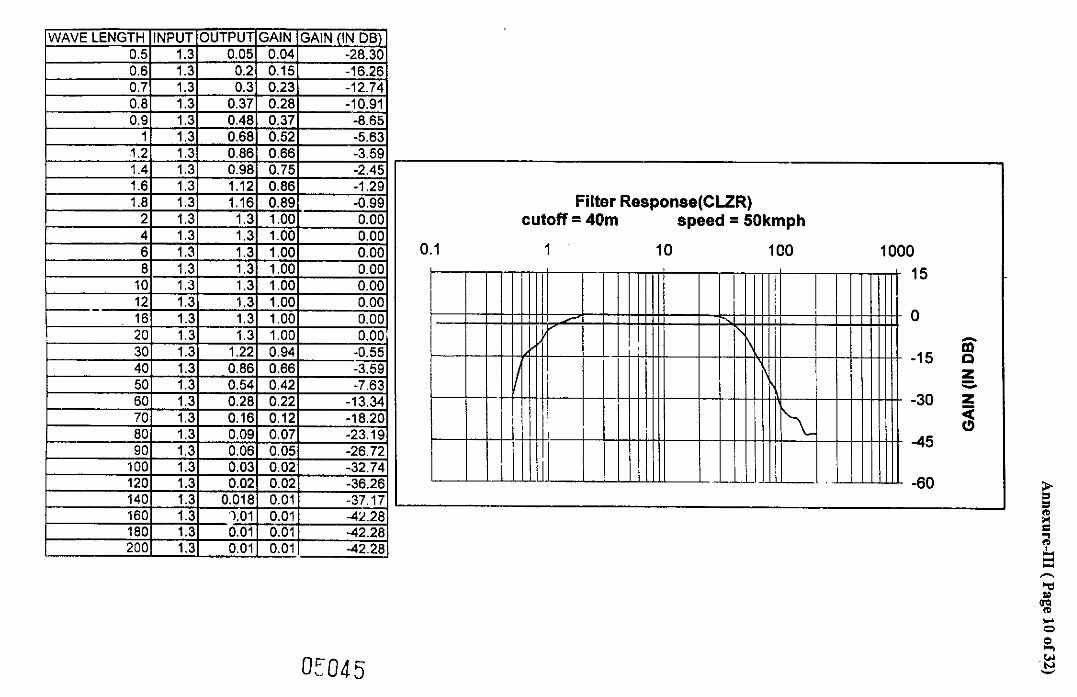
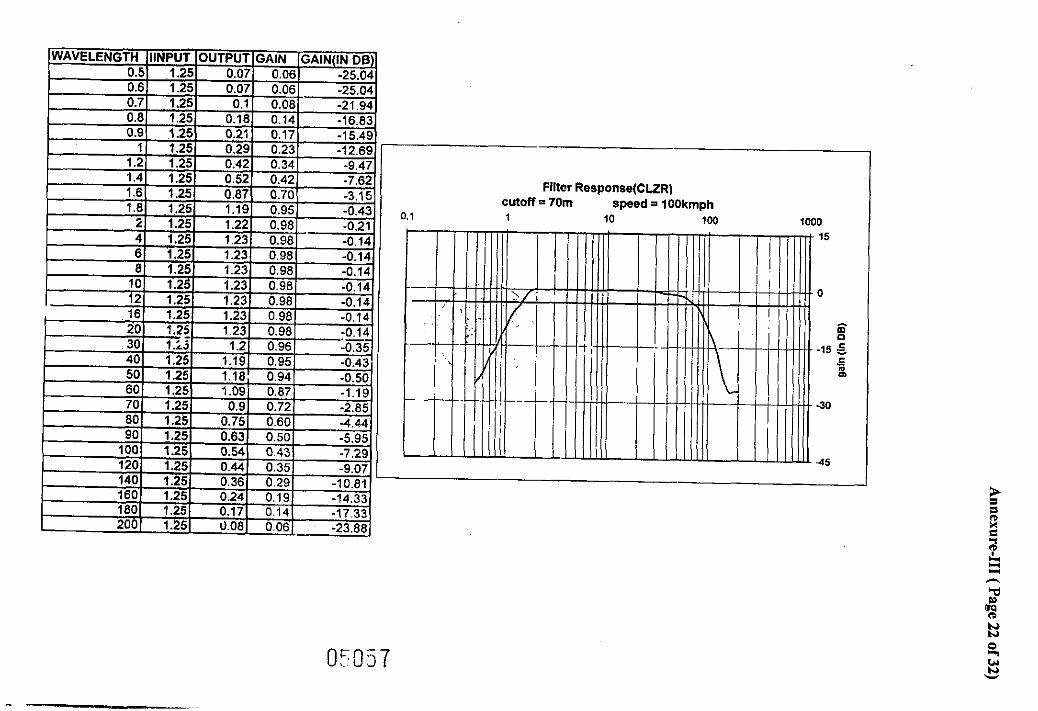
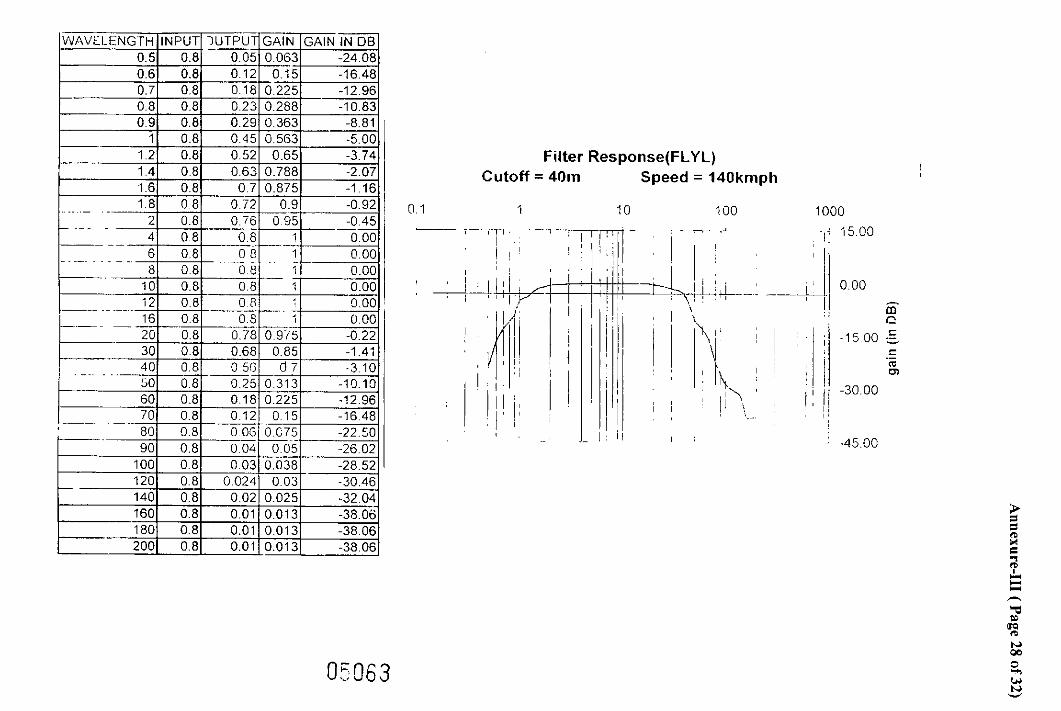
wavelength were injected in filter module (filter module is a part of amplifier card) of LVDT and accelerometer channels. The wavelengths of the injected signal were varied from 0.5 m to 200m. The filtered output was stored in a file using a software module. These values were exported in an excel sheet and a graph was plotted between magnitude of output and distance. For each wavelen,$h, the average of stored peak values was taken to calculate the gain wLth respect to input signa! amplitude. The semi-logarithmic graph between various wavelengths and corresponding gain (ab) with wavelength on logarithmic scale were plotted. The stored output peak vdues and their averages for selected cut-off wavelength at various speeds have been tabulated in Annexure-11. The tabulated value of input signal value, output peak value, gain in ratio and db for wavelength ranging from 0.5m to 200m along with filter response plots for LVDT and accelerometer channel for selected cut off wavelength and speeds are given in Annexwe-
. nI. From the fi!ter response plots it is observed that the horizontal l i e drawn at 3db
gain.point in the lot is exactly cutting at the selected cut off of 40m or 70m. Thus it is concluded that both hardware and software filters are working as per the requirement of technical specification.
3.3 Software Modules
Following software modules were checked during the lab inspection of the system.
Runmode Route tape preparation Calibration & Diagnostics Simulated signal Off line utilities
3.3.1 Run Mode
To test the system in Run mode; two main tests one with simulated signal and other with zig were performed. Both these test procedure are described below in detail-
(a) Simulated signal testing
Simulated signal testing was performed in Profile and Chord mode at five selected speeds of 30,60,100,130 and 160 kmph.
(i) Profile Mode
In profile mode, two filter cut-off of 40m and 70m were selected and sine wave signal of different wavelengths and known amplitude were injected in Filter module of amplifier card of different channels. The expected output in different

parameters due to input in various combination of transducer channel was calculated by the following relationship.
Expected output = Input * filter gain for input wavelength
Filter gain for input Signal wavelength was calculated from the filter response table and plots. The actual outputs were noted from exception report and analog printouts. Total six tests were conducted at different speeds in the range of 30 to 160 krnph. Different input signal amplitudes y ~ d different wavelength in the range of 20m to 70m were injected in different tests. The details of tests conducted with expected and observed output have been tabulated in table No. 8 to 13. The exception and analog report of one test is placed at Annexure-IV as sample.
Table-8
Input injected-CLZL, CL
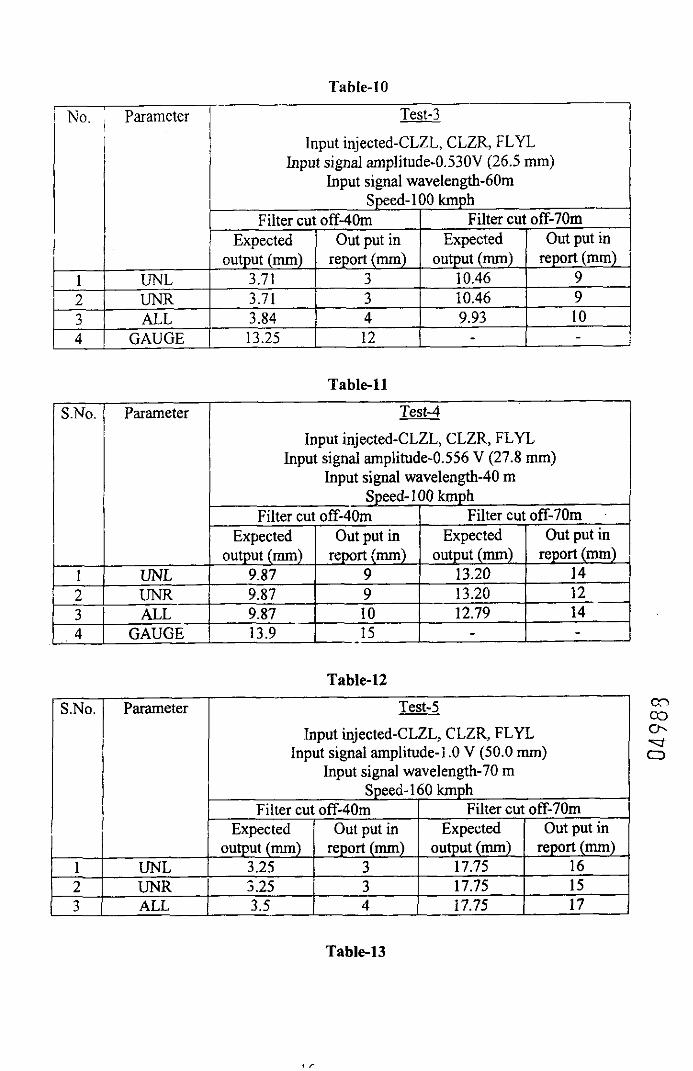
Table-10
lnput injected-CLZL, CLZR, FLYL Input signal amplitude-0.530V (26.5 mm)
Input signal wavelength-60m
Table-12 rn 03
Input injected-CLZL, CLZR, FLYL 0. * Input signal amplitude-1.0 V (50.0 mm) 0
Input injected-CLZL, CLZR, FLYL Input signal amplitude-1.203 V (60.0 I&)
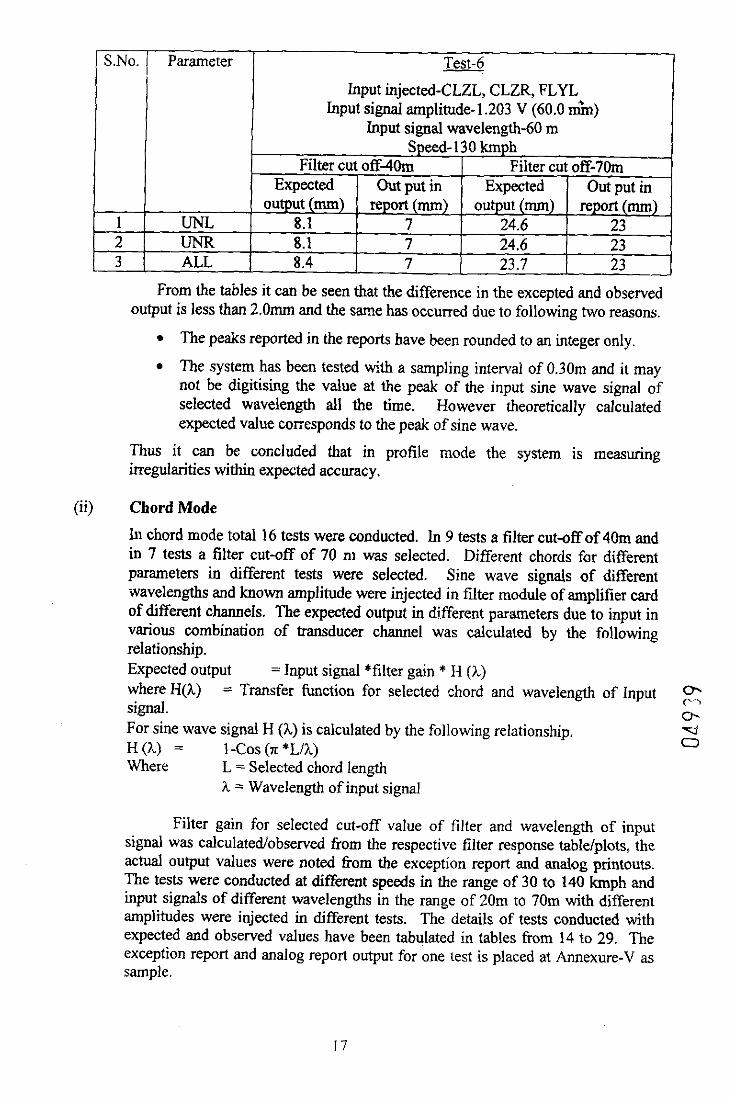
From the tables it can be seen that the difference in the excepted and observed output is less than 2.0rm and the same has occurred due to following two reasons.
The peaks reported in the reports have been rounded to an integer only
The system has been tested with a sampling interval of 0.30m and it may not be digitising the value at the peak of the input sine wave signal of selected wavelength all the time. However theoretically calculated expected value wzesponds to the peak of sine wave.
Thus it can be co~cluded that in profile mode the system is measuring irregularities within expected accuracy.
(ii) Chord Mode
In chord mode total 16 tests were conducted. In 9 tests a filter cut-off of 40m and in 7 tests a filter cut-off of 70 n~ was selected. Different chords for different parameters in different tests were selected. Sine wave signals of different wavelengths and known amplitude were injected in filter module of amplifier card of different channels. The expected output in different parameters due to input in various combination of transducer channel was calculated by the following relationship. Expected output =Input signal *filter gain * H (?,) where H(A) = Transfer function for selected chord and wavelength of Input signal. 0- For sine wave signal H (h) is calculated by the following relationship. w H 0,) = 1 -Cos (n *LA) o Where L = Selected chord length
X = Wavelength of input signal
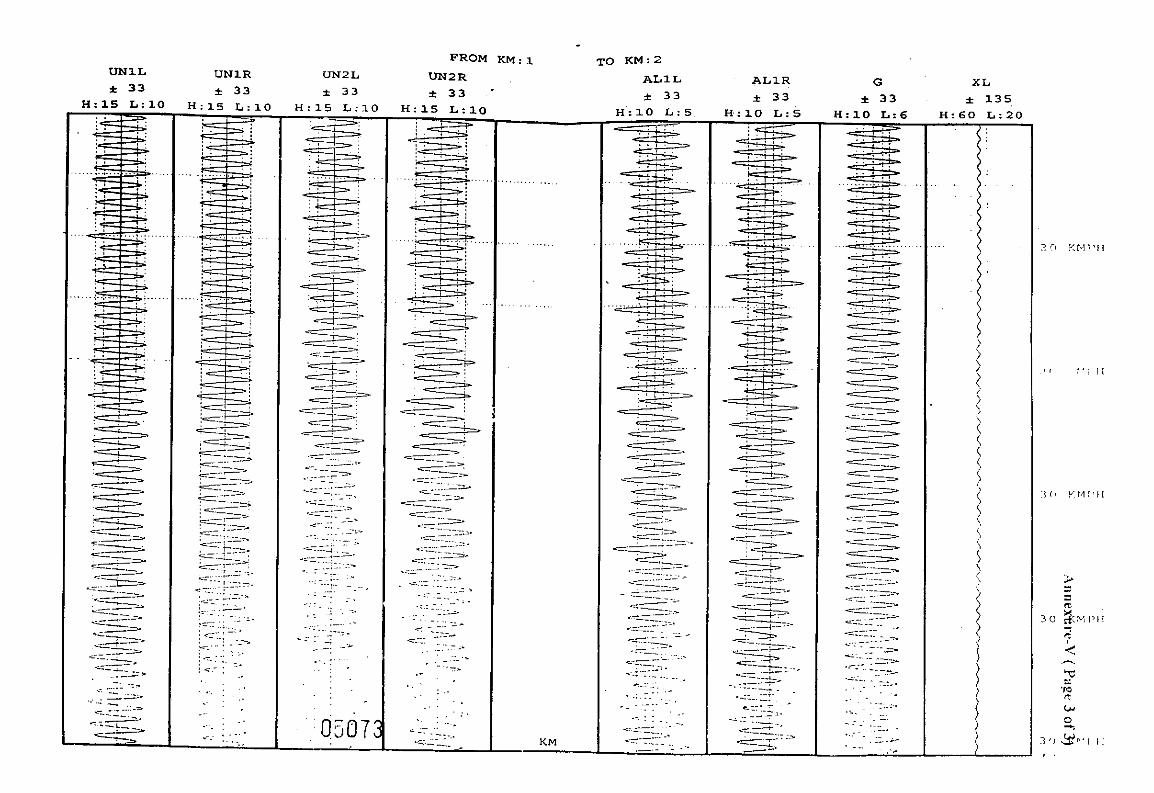
Filter gain for selected cut-off value of filter and wavelength of input signal was calculated/observed from the respective filter response tablelplots, the actual output values were noted fiom the exception report and analog printouts. The tests were conducted at different speeds in the range of 30 to 140 krnph and input signals of different wavelengths in the range of 20m to 70m with different amplitudes were injected in different tests. The details of tests conducted with expected and observed values have been tabulated in tables from 14 to 29. The exception report and analog report output for one Lest is placed at Annexure-V as sample.

Table - 14
Input injected-CLZL, CLZR, FLYL Input signal amplitude-0.425 V (21.25 mrn)
Input signal wavelength - 30 m Filter cut off - 40 m
S.No.
Table - 15
Parameter
I Input injected-CLZL, CLZR, FLYL Input signal amplitude-0.280 V (1 4 mm)
Input signal wavelen,nth - 30 ,,I I
I Filter cut OK- 40 m I
TeSt-l
~ --
~ . N O .
Table - 16
1 2. 3. 4 5 6
Parameter Test-2
ULlL (3.6m) Uh'lR (3.6m) ALlL (7.2m) UN2L (9.6m) UN2R (9.6m) AL2L (9.6m)
0 Test-3 .-
Input injected-CLZL, CLZR, FLYL Input signal amplitude- 0.598 V (29.68m)
Input signal wavelength - 40 m Filter cut off - 40 m
1 2. 3. 4 -
Speed - 50 kmph
rn 3- -=i
Expected output (mrn)
.92
.92 3.23 6.1 1
ULlL (3.6m) UNlR (3.6m) ALl L (7.2m) UN2L (9.6m)
Out put in report (mrn)
2 2 5 6
5 1 UN2R (9.6m) 6 1 AL2L (9.6m)
Speed - 50 kmph
6.1 1 I 6
Expected output (mm)
0.78 0.78 3.24 5.31 5.31 7.08 -
6.1 1
Out put in report (mm)
2 2 5 6 6 7
7

Table - 17
Input injected-CLZL, CLZR, FLYL Input signal amplitude0.797 V (39.85 mm)
Input signal wavelength - 40 m Filter cut off - 40 m
Table - 19
Table - 18
-. w ch 0.
Input injected-CLZL, CLZR. FLYL v Input signal amplitude-0.45 V (24.5mm)
0
Input signal wavelength - 40 m
S.No.
I I
1 2. 3. 4 5 6
Parameter
ULlL (3.6m) UNlR (3.6m) ALlL (7.2m) UN2L (9.6m) UN2R (9.6m) AL2L (9.6m)
Test-5 Input injected-CLZL, CLZR, FLYL
Input signal amplitude-0.399 V (19.9 mm) Input signal -uavelengh - 30 m
Filter cut off - 40 m Speed - 140 kmph
~ x ~ e c t e d output (mm)
1.12 1.12 4.59 7.40 7.40 7.40
Gut put in repor! (mm)
2 2 5 8 7 8

Table - 20
Input injected-CLZL, CLZR, FLYL Input signal amplitude-1.367V (68.35mm)
input signal wavelength - 70 m Filter cut off - 40 m
Tabie - 21
lnput injected-CLZL, CLZR, FLYL Inpu: signal amplitude-0.2.6 V (! 0.30mm)
Input signal wavelength - 30 m Filter cut off - 40 m
Table - 22
Test-9 lnput injected-CLZL, CLZR, FLYL
Input signal amplitude-0.414 V (20.70-m) Input signal wavelength - 40 m
Filter cut off- 40 m
1 2. 3. 4 5 6
Speed - 100 h p h Expected output (mrr) I Out put in report
ULlL (9.6m) UNI R(9.6m) ALlL (7.2m)
UN2L (20.3m) m2R (20.3m) AL2L (9.6m)
1.94 1.94 1.11
(mm) 3 3 2
7.31 - -. I 7 -

the rcport. Sample printouts at i\vo dit't2rcnt spccds one iron1 pl~,iile anti onc from chord mode is placed at Anncxure-VI.
In the second test along with the two \eflical I.\'DTs. i\Vo acccicrometer one on each end of the sea-saw plank jusr abo\c the each LVDT were also mounted. The mounting position of LVD'rs and accelerometer is shown in fig.-1 1.
Fig. I I
The mounted hvo LVDTs and two accelerometers were connected to data acquisition system through amplifier and filter card. The zig was given a sea-saw movement manually. Under ideal condition, the vertical movement of the LVDTs is neutralized by the double integrated signal of accelerometer and vertical profile unevenness in profilelchord mode should report 0 (zero) peak value at all speeds. However the movement of the accelerometer mounted on the zig is not truly vertical and there may be inaccuracy in fabrication 3f zig and mounting of tiansducers GVDTs and Accelerometer), which may result as 1 to 2 mrn peaks in vertical profile/unevenness in exception report and analog report. Measurement accuracy of transducers used may also contribute towards inaccuracy in the reported values to some extent. Further if the option to calculate twist from absolute profile is selected the twist shall also be reported as zero in ideal conditions but a value of 1 to 2 mrn in vertical profile will result in 2 to 3 mm value in twist. From the printouts it was +
h observed that vertical profile unevenness peak values are being reported in the range c, of 1 to 2 mm and the twist peak vallies are being reported in the range of 2 to 3 mm, W which are within the expected rangs. A sample printout at two different speeds one 0
for prcfile mode and one for chord mode is placed at Annexure-VII.
With the above two tests. i t is concluded that the LVDTs and accelerometers are functioning properly in dynamic conditions and the double integration module designed to get the displacement from double integration of accelerometer signal and module to generate vertical profile/unevenness in profilelchord mode are performing in the expected manner.
Cross level simulation testing
In the first test of vertical profile simulator testing in which only two vertical LVDTs were mounted and connected it was observed that the difference in two vertical LVDTs was reported in cross-level and based on this cross-level the twist was calculated and reported although the base of the zig was horizontal and there was no cross-level. To get the correct value of cross-level this sea-saw
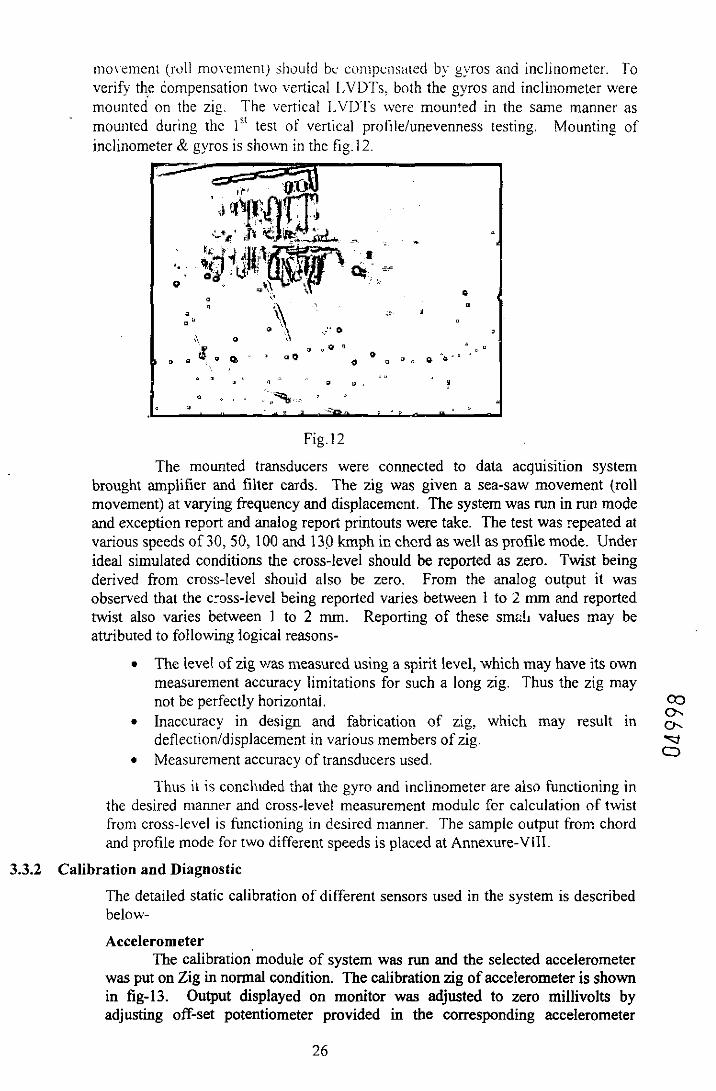
mo\.ement (roll niovernrni) should bc ci)i~~pcils;i~ed by gyros and inclinometer. To verify the compensation two vertical I,VD?'s: both the gyros and inclinometer were mounted on the zig. The vertical 1,VI)Ts were moun!ed in the same manner as mounted during the lS' test of vertical profilelunevenness testing. Mounting of inclinometer & gyros is shown in the fig.12.
Fig. I2
The mounted transducers were connected to data acquisition system brought amplifier and filter cards. The zig was given a sea-saw movement (roll movement) at varying Erequency and displacement. The system was run in run mode and exception report and analog report printouts were take. The test was repeated at various speeds of 30,50, 100 and 130 kmph in chcrd as well as profile mode. Under ideal simulated conditions the cross-level should be reported as zero. Twist being derived from cross-level shouid also be zero. From the analog output it was observed that the cross-level being reported varies between 1 to L mm and reported twist also varies between 1 to 2 mm. Reporting of these smc!~ values may be attributed to following iogical reasons-
The level of zig was measured using a spirit level, which may have its own measilrement accuracy limitations for such a long zig. Thus the zig may not be perfectly horizontai. a3
0. Inaccuracy in design and fabrication of zig, which may result in o, deflectionldisplacement in various members of zig. - -a Measurement accuracy of transducers used. U
Thus i t is conchided :hat the gyro and inclinometer are also functioning in the desired manner and cross-level measurement module fcr calculation of twist from cross-level is functioning in desired manner. The sample output from chord and profile mode for two different speeds is placed at Annexure-VIII.
3.3.2 Calibration and Diagnostic
The detailed static calibration of different sensors used in the system is described below-
Accelerometer The calibration'module of system was IUII and the selected accelerometer
was put on Zig in normal condition. The calibration zig of accelerometer is shown in fig-13. Output displayed on monitor was adjusted to zero millivolts by adjusting off-set potentiometer provided in the corresponding accelerometer
ampiiiier card fberl ig sign^: was appiicd; 'i! turning tile acccicrumetcr by 90'. The output of the accelerometer displayed or: calibration scrcen was mrrnitoreu and adjusted to 1.960 F 0.002 volts.The process was repeated 2-3 times. Finally i t was observed that the difference in voltage between normal and 90\position is 1.960 0.002 volts.
Fig. 13
For calibrating the LVDT first of all ii w3.s mounted on a LVD'r calibration zig. The LVDT mounted on the ziig is shown in fig.-ll. The calibration module of the system was executed. The zero position of the LVDT was adjusted by moving the LVDT rod in thc zig. A block of 20mm was inserted in the zig and the again of 400mv was adjusted by gain potentiometer. The LVDT rod was again moved ro zero position. After moving to zero position thz LVDT rod was given the displacement of 10, 20, 30, 40: 50, 60, 70 and 80 mm by inserting the blocks in the zig and the gain verificd on the calibration screen. The process was repeated two to three times. Aft:-; calibration when the known displacement was giverl to LVDT rod, the calibration screen displays the rane displacement with variation of less than or equal to +/- 02mm. The same pracess was repeated for all the LITDTs.
Inclinometer ch
o\ The calibration of inclinometer is very complex and expensive and only o, manufactxrer of inclinometer have this facility. Thus ~diibration could not be tl performed during lab validation and inspection. However calibration was checked 0
using the zig shown in fig.-i 1 . To verify the calibration the calibration module of system was executed. The inclinometer was mounted on the zig and was given angular movements in the steps of 1 ". The output of inclinometer was obsel.ved on the calibration screen and verified with the given angular movement.
In addition to detailed static calibration a quick daily calibration facility is also provided in the system. In quick calibration the output of LVDTs are observed and verified on calibration screen by inserting the b!ocks of lOmm and 20mm. The output cf accelerometers is observed in normal and 90" turned p~sition and difference in two is compared with the full-scale output. After verifying the calibration of LVDTs and accelerometers, measured value cvf gauge and cross-level are entered in the calibration screen and re-calibrate button is clicked. The svstem adjusts the offset values for all transducers automatically. Quick calibration is required to be run before the start of the day run to store off- set and gain to be used by the system.

Diti'ercnt diagnostics sofiware rnutiules are used to check the functionality of individual amplifier cards. Communication link between amplifier card, data acquisition system and the processins system are tested through diagnostic software modules. The facility for testing of speed indicator and the tacho card is also provided in diagnostic module. All these modules were checked for their functionality.
3.3.3 Simulated signal
The user interface for generation LI simulated signals has becn provided in processing system. The required inputs for generation of desired signal arc entered through operator console system. which are transferred to simulator system The simulator generates and outputs the signals according to user entered inputs parameters.The inspection of simulator is dezlt in para 3.1.6 under hardware.
3.3.4. Route Tape Preparation
The route tape preparation module can 5e used for creation of route data tapelfile. For testing the module a speed of 20 kmph was fed in the system using tachometer coupled with DC motor. The module was executed and all the keys of G.F, keypad connected to system were processed one by one at different instance of time which are stored in a file along with location. The route tape created was printed using print route tape facility provided under off-line utilities. It was observed that all track featvres have been printed correctly.
3.3.5 Off-line reports
The various off-line software modules for generation of various summary reports, printing of results from rm)rocess data, comparison of two recordings, reversion of;oute tape, extracting track feature report and generation of analog and exception report from the stored raw, chord/profile data has also been developed by the firm. The format of these reports were created using the 10 Km random signal data stored for verification of disk space and found cornpaable with the formars provided to firm. However the reported values wili be verified with the use of actual track recoiding data during field validation of the system.
3.3.6 Verification of data storage space
Verification of data storage space in lab validation of the system was checked by 0 0 injecting random sig::als in all the A/D channel inputs through simulator and running the a
system in profile/chord mode for 10 kilometres on a simulated speed of 100 kmph with 1 - 0
the option to store RAW, Pr~filelChord and process data and it was found that the total 0
disk space required for recording 25000 kilometres of process data, 2500 kilometre of raw data and 2500 kilometre of prof lelchord data is equal to :3.75 GB.
S~nce a similar 40 GB hard disk is provided in data processing sub system of the second system also for storage of data and software, more than required disk space would be available for storage of desired quantum of data in second system also.
4.0 Conclusion
From the various tests conducted during lab validation, calibration of transducers and observation of test/calibration results, it is ccncluded that the system meets the requirement of technical specification under controlled laboratory conditions. The testing of system performance for the conditions, which could not be simulated in the laboratow willbe done during field trials.

TRACK RECORDING RESULTS (PROFILE BASED)
TRC NO : 796? Directorale : TU&M Soilware Vcnion : 2.00
Railway : South Westem Railway Division : SBC Section : SIMTEST
DatcofRcc : 17-11-2008 Section S p e d : -100KMPH Sampling Distance Actual : 0.299 M Sampling D i c e Enlered : 0.299 M
PARAMETER SFITINGS
UNI UN2 AL I AL2 TWI TW2 GAUGE VACC LACC CANT
Chord/Basc(m) SD ~Liiadr ~ h d s ( ~ n )
RoutespDed- 165hph Routcspo;d> losl0nph SD MaiDtmaaa L i i u (mm) Plavcd Roulcspcfd I05kmph Route s p d > lO5kmph Roulc quxd > l05kmph SD Maimrnancc Limits (mm) Urgcnt Rsute spced * lO5kmph RouW spad > IOSkmph SD Mainmamx Limits (mm) Max Routespeed c- lO5kmph Route rpmd > lO5kmph Pcak LUniisow (for Analog) Peak Limits High (for Analog) Pcak Infwmation Limits Selected Graphic channel
PEAK LIMITS (In mm)
PROFILE-I
BAND UN TW G A L
40.0 70.0 40.0 70.0 3.6 4.8 ABS ABS ABS
6 00 6.10 5.20 5.30 4.80 5.00 2.90 5.80 5.90 5.00 5.10 4.20 5.00 2.90 I000 10.00 5.00 5.00 7.00 7.00 6.M) 0.15 0.15 ?000 15.00 15.00 10.00 10.00 12.00 12.00 10.00 0.20 0.20 60.00 I I I I 5 7 6 02C 0.20 0 I 2 3 4 5 6 7 lJNlL W I R UN2L UNZR ALII, ALIP. G XL

TRACK RECORDING RESULTS(PR0FILE - 2 HODEI . ROUTE CODE : 31350' DATE : 17/11/2008 RUN NO . k K U 2 T o 3 PROFILE 1 RIDE INDEX TRACX INDICES PROFILE 2 PRRMETER WISE INDICES
LM: UNlL UNLR TYL G ALlL ALlR AVO-G RIV RIL GF/TGI SPD MI UNZL UN2R hL2L ALZR TY2 UNI TWT GI ALI
TP / OHE
USER 1
USER 2
CUT-IN
cm-OIJT
SR-IN
SR-OUT
191 TUNL-IN
B l k l 0.5 0.8 0.4 0.6 1.0 1 . 0 0.2 1.38 1.46 1 1 8 59 .' 1.4 2.0 3.5 3 . 5 0.5 91 174 1 1 7 116 210 TUNL-OUT
226 LOOP-IN
301 LOOP -OUT
256 CURVE-IN
2 8 1 CURVE-OUT
309 BUFF-RAIL
3 4 2 SeT
375 BR-IN
397 BR-OUT
B l l 2 0.6 0 . 1 0.1 0 . 6 1 . 2 1.2 0.2 1.32 1.33 116 59 1.1 1.3 2.6 2.6 e . 4 102 174 I ? 1 P 423 ROB f l - - - 440
- PT h XING C 'T
4 5 8 .. GBR-IN - ,.
476 GBR-OUT .- .-
506 -
L-XING .. - - 5.:
B l k 3 0.5 0.6 0.4 0.6 I . ? 1 . 2 0.2 1.32 1.31 111 59 1 . 1 1.5 2.1 5 . 1 4 100 ! i 4 i17 .QT 7 5 2 8 KH - - PFAK DISTRIBUTION -.
PROFILE 1 PROFILE 2 w - BAND UNlL UNlR TW1 G BAND UNZL U N 2 R AL2L AL2R TW2 --..---------...--- ...--.--.---.-.-.- . ...- ..

Output values of CAZL at different wavelength with the input signal of 0.5 Volt (Card Gain 2.5) Speed = 30 Kmph, Cut-ff wavelenythz40 mts -- A - -I
0.111 0.161 0.191 0.291 0.351 0.641 0.741 0891 0.92) 0.981 1.21 1.211 1.231 1.231 1.231 1.231 1.231 1.171 1.081 0.871 0.751 0.571 0.41 0 221 0.111 0.081 0.061 0.031 0.03
- Average Values
-- - Wavelengths -
0.61 0.71 0.81 0.91 11 1.2 1.41 1.61 1.81 21 41 61 81 10 121 161 201 30) 40 50) 60) 701 80) 90 100 120) 140) 160) 180 200


1 Output values of FAY at different wavelength with the input signal of 0.5 Volt (Card Gain 2.5) 1 r Speed = 30 Kmph, cut-off wavelength = 40 n ~ t s
Wavelengths
0331 0 17) 0211 0291 0361 0 6 4 0741 0871 0951 1 1 14 1 141 1 141 1 141 1 141 1 141 1 0 7
Averaga Values - - -


0.12
0.13
0.11
0.12
0.11
0.12
0.13,
0.121 0.181 0.241 0.271 0.34) 0.48; 0.54) 0.58) 0.681 0.761 0.81 0.8) 0.8) 3.8) 0.81 0 8 ) 0.81 0.8) 0.8) 0761 0.661 0.581 0.34
Average Values
0.17
0.18
0.18
0.19
0.17
0.19
0.18.
0.23
0.24
0.24
0.24
0.23
0.25
0.25,
0.27
0.28
0.26
0.27
0.28
0.27
0.26,
0.33
034
0.35
0.35
0.34
0.33
0.34,
0.48
0.49
0.48
0.48
0.48
0.47
0.47,
0.54
0.54
0.5'3
0.55
0.55
0.54
0.54,
0.58
0.58
0.59
0.58
0.57
0.58
0.57,
0.68
0.69
0.67
0.68
0.69
0.67
0.69
0.77
3.77
0.76
0.76
0.78
0.77
0.77,
0.8
0.81
0.8
0.81
0.79
0.8
0.81,
0.79
0.8
0.8
0.8
0.79
0.8
0.79.
0.8
0.79
0.8
0.8
0.8
0.79
0.79.
0.8
0.81
0.79
0.8
0.81
0.8
0.8,
0.8
0.8
0.79
0.8
0.8
0.79
0.8.
0.81
0.8
0.81
0.79
0.8
0.81
0.8,
0.81
0.79
0.8
0.81
0.8
0.79
0.8.
0.79
0.8
0.8
0.8
0.79
0.8
0.79,
0.8
0.81
0.79
0.8
0.81
0.81
0.81.
0.77
0.76
0.76
0.78
0.77
0.77
0.76.
0.66
0.67
0.65
0.67
0.65
0.66
0.66
0.57
0.58
0.59
0.57
0.58
0.33
0.34
0.34
0.35
0.19
0.21
0.21
0.15 0.03
0-15303.
0.02 0.01
-
0 0 5 1 . 1 3 1 0231 0.26) 0.351 0471 0691 0771 0941 11 1.161 1.231 1.241 1.251 1.251 1.251 1.261 1.161 11 I I I 1 I I I 1 I I
0051 o 12) 0.21 0.261 0.36
Average Values 0.481 0.681 0.78 0.95 11 1.161 1.21 1.241 1.241 1.241 1.241 1.21 1.151 11 0.851 0.7) 0.61 0.481 0.41 0.3r1 0.241 0.181 0.141 0.021 0.01

0.21 0.31 0.41 0.51 0.71 0.91 11 1.11 1.21 1.31 1.31 1.31 1.31 1.31 1.31 1.21 1.11 11 0.91 0.41 0.31 0.21 0.11 01 01 01 Average Values I I

0 ! 7 / 0.251 0.32) 0.411 0.621 0731 0841 0961 11 1.081 1.121 1.151 1.161 1.151 1:41 1.121 1 . M ) 0.991 0.9'21 0.711 0.651 I I I I I I 1 I .
- 0.31 0.4 0 52 o 751 O 64 1.151 1.12) 1 M( 1) 0.92) 0.7) 0.66) 0.56) 0.45) 0.361 0.281 0.2) 0.15) 0.11 0.021 0.01
Average Values

Speed = 50 Kmph, Cut-off wavelength = 10 mts
0 131 0.181 0.241 0.331 0.371 0 521 0.661 0.831 0.931 0.991 1.191 1.221 1.221 1.221 1.241 1.221 1.241 1.231 1.241 I 1 I I I I 1 1 I I .- -
9 121 0.171 0.251 0.321 0 381 0 531 0.651 0.831 0.921 0.98) 1.21 1.231 1.231 1.231 1.231 1.231 1.231 1.231 1.221 1.151 1.061 0.971 0.841 0.781 0.641 0.541 0.451 0.321 0.281 0.19
Average Values

0 21 0 261 0.331 0.411 0531 0681 0.831 1.031 1.11 112( 1.221 1.271 1.281 1.281 1.29) 1.281 1.271 1:23\ 1.29) 1.211 1.09) 0.89) 1 1 I 1 I 1 1
0.21 0.31 0.31 0.41 0.51 0.71 0.81 1 1 1.11 1 . 1 1 1.21 1.31 1.31 1.31 1.31 1.31 1.31 1.31 1-31 1.21 11 0.91 0.81 0.51 0.3) 0.21 0.11 0.11 0.11 0 Average Values

017
0.18
017
017
016
017
018 -
0.2
0.2
0.21
0.22
0.22
021
0.22
0.25
0.26
0.27
0.26
0.25
0.26
027
0 ;71 021( 026) 0.31 0431 061
Average Values 0.741 0.861 0.941 11 1.051 1.131 1.131 1.13
0.31
0.29
0.29
0.3
0.3
0.31
0.29
1.13 1.13 1.131 1.131 1.13
0.43
0.42
0.43
0.42
0.43
0.44
043
1.131 1.041 0.941 0.831 0.681 0.591 0.481 0.411 0.381 0.311 0.29
0.61
0.6
0.6
0.61
0.6
0.62
0.61
75
0.73
0.74
0.75
0.73
75
073
0.86
0.87 --------------- 0.86
0.85
0.86
0.87
086
0.95
0.95
0.94
0.95
0.93
0.94
0.94
0.99
0.99
1
1.01
1.01
101
1
1.05
1.05
1.05
1.04
1.05
1.05
- 1.06
1.12
1.13
1.14
1.12
1.14
1.13
1.13
1.13
1.14
1.12
1.14
1.13
1.13
1.12
1.14
1.12
1.14
1.13
1.13
1.12
1.13
1.14 1.14 1.12
1.12 1.13 1.14
1.13 1.13
1.14
1.12
114 i .13
1.13
1.12
1.13
1.14
1.12
1.14
1.13
1.13
1.14
1.12
1.14
1.13
1.13
1.12
1.12
1.13
112
1.14
1.13
1.12
1.13
1.14
1.12
1.14
1.13
1.13
1.12
1.13
1.12
1.05
1.05
1.05
1.04
1.05
1.05
1 0 3
0.95
0.95
0.93
0.95
0.93
0.94
0.94
0.83
0.84
0.82
0.83
0.83
-
6.68
0.68
0.69
0.67
0.53
0.59
0.59
0.6
0.47
0.48
0.49
0.42
0.41
0.39
0.38
0.31

0.12 0.16 02(0.25 0.331 0421 0.531 0.62 0.651 0.71 0'r7 0.81 0.81 0.81 0.8 0.81 0.81 -0.81 0.81 0.711 0.681 0.571 0.531 0.481 0.311 0.21 0.111 0.071 0.041 0.02
Average Values -

0 11 0.161 0.221 0.281 0 361 0 451 0.531 0.71 0.881 1.121 1.211 1.211 1.221 1.211 1.231 1.231 1.21 1.081 0.881 0.741 0.631 I I I I I I I I .. -
0.7 016 0.21 0.28 036 0 4 5 0.56 0.70 0.85 1.13 119 1.21 1.22 1.22 1.22 1.22 1.21 1.08 0.87 0.75 0.63 0.58 0.54 0.48 0.36 0.24 0.1 0.07 0.04 0.02
. .~ Average Values

~- - ~ ~~ ~ -~
0.11 0.1) 0.21 0.31 0.41 0.81 0.81 11 1.11 1.11 1.31 1.31 1.31 1.31 1.31 1.31 t y i.aT 0.51 0.61 0.51 I I I 7 0 . i 1 0.21 0.210.31 0.41 0.6) 0.8) 1 1 1.11 1.11 1.31 1.3: 1.31 1.31 1.31 1.31.1.31 1.91 11 0.71 0.51
0.1 0.2 0.2 0.3 0.4 W W MY ### ### MY ### 1.3 1.3 1.3 1.3 1.3 1.1 0.9 0.7 0.5 0.3 0.2 0.1 0 0 0 0 0 0 Average Values

0 11 0.171 0.2) 0.331 0411 0.471 0.641 0.731 0.@41 0.91 111( 1.121 1.12( 1.121 1.121 1.121 1.1110991 0.861 0.761 0.691 I I I I I I I -
0.1 0.16 0.21 0.33 0.4 0.49 0.64 0.75 0.84 0.90 1.11 1.12 1.12 1.12 1.12 1.12 1.31 0.98 0.86 0.75 0.69 0.58 0.5 0.47 0.36 0.27 0.17 0.13 0.07 0.07
Average Values

0 031 0031 0.081 0 151 0 211 0.24) 0.381 0.451 0.531 0.57) 0 761 0.761 0.76! 0.76) 0.761 0.761 0.761 0691 0.561 0.421 0.261 1 1 1 I I I 1 I - - 0 02
Average Values
I 0.381 0.481 0.55 0.61 0.771 0.781 0.781 0.781 0.78 0.781 0.781 0.691 0.571 0.431 0.281 0.?0( 0.11 0.061 0.041 0.021 0.011 0.011 0.011 0.01 2 041 01 0.161 ' 22 0.26

0081 0.111 0.19) 0.211 0.31 0431 0.53) 0.881 121 1.221 1.231 1.231 1.241 1.231 1.221 1.241 1.241 1.21 1.191 1.171 I I I I I I I I I
3071 0 11 0.181 0.211 0.29) 0.121 0.521 0.871 1.191 1.221 1.231 1.231 1.231 1.231 1.231 1.231 1.231 1.21 1.191 1.181 1.091 0.91 0.751 0.631 0.541 0.441 0.361 0.241 0.171 0.08 -- Average Values

0.11 0.11 0.21 021 0 .3~0.42~0.52~0.87~1.19~1.22)1 .23~1.23~1.23~1.23~.23~1.23~1.23~ 1.21 1.21 1.21 1.11 0.91 0.81 0.61 0.51 0.41 0.41 0.21 0.2) 0.1 Average Values

0 1 1 1 0.141 0.211 0.331 041 0.481 0.641 0.891 1.141 1.121 114 i 1.131 1.091 1.081 1.031 0.991 0.941 0.851 1 I 1 I I I I 0.331 0.37) 0.5 0.64 0.881 1.131 1.131 1.13 1.14 1.11 1.091 1.05 -
01 ) 0.161 0.21) 0.33) 0.4) 0.49 0.651 0.881 1.081 1.13 1.131 1.131 1.131 1.131 1.131 1.131 1.111 1.081 1.041 11 0.951 0841 0.651 0.51 0.341 0.221 0.141 0.091 0.061 0.02
- Average Values

0031 0.111 0.151 0.211 0.271 0.39) 0.5) 0.661 0.72) 0.781 0.8) 0.78) 0.78
Average Values
0.8
0.78
0.79
0.04 0.11 0.161 0.231 0.261 0.381 0.491 0.651 071( 0.81 0.791 0.791 0.79
0.781 0.78) 0.761 0.751 0.721 0.71 0.631 I 1 I I 1 1 I 1 0.791 0.791 0:81 0.741 0.731 0.691 0.641
0.791 0.731 c.181 0.751 0.72) 0.69 0.631 0.551 0.33 0.181 0.071 0.041 0.021 0.021 0.021 0.02 C' 04 0.11 0.16) 0.22 0.26 0.38 0.491 0.661 0.711 0.79 0.791 0.791 0.79

0.061 0.131 0.211 0.261 0.351 0.471 0.691 0.771 0.941 0.991 1.161 1.21 1.231 1.251 1.251 1.251 1.2) 1.161 0.991 I I I I I I I 1 I I
0.051 0.121 0.21 0.261 0.36) 0.481 0.681 0.781 0.95) 11 1.161 1.21 1.241 1.241 1.24) 1.241 1.21 1.151 11 0.851 0.71 0.61 0.48) 0.41 0.311 0.241 0.18[0.14) 0.021 001
Averago Values

I ncrtput values of C U R at different wavelength with me Input slgnal of 0.5 VoIi (Card Gain 2.6) . ~. Speed r 140 Kmph, C u t 4 wavelength 140 mta
I I
1 3.98) 1.121 1.181 1.3) 131 8.3) 1.3) 1.31 1.31 1.22) 1.121 0.981 0.91 0.41 0.281 0 t61 0.091 O.M( 0.031 0.021 0.021 001( 0.011 0.01 Average Values


0 131 0 181 0.231 0.291 0.451 0.511 0.631 0.71 0.721 0.751 0.791 0.791 0.79) 0.81 0.81 0.811 0.72) 0.631 0.491 0.251 0.181 I I I 1 I I 1
0.121 0.181 0.231 6.291 0.451 0.521 0.631 0.71 0.721 0.761 0.8) 0.8) 0.81 0.8) 0.81 0.81 0.721 0.621 0.481 0.251 0 181 0.121 0 06) 003) 0 03) 0.021 0.02) 0.011 0.011 0.01 - - Average Values

0081 0.11 0.141 0.181 0.251 0311 0.471 0.631 0.721 0.851 0.971 1.081 1.221 1.221 1.22
Av,?rage Values 1.221 1.22 1 15 1.1 1 0 881 0 78 0 64) 0.631 0.541 3.441 0.371 0.29

0.1s
0.2
0.2
0.18
0.19
018
0.2
0.22
0.24
0.22
0.24
C.2
02
0.22
0.25
0.24
0.22
0.25
0.24
0.22
0.24
Average Values 0.92
0.28
0.31
0.29
0.3
0.28
0.28
0.29
1.!4 0.81 1.14 0.21
0.43
0.41
0.41
0.44
0.43
0.4
0.41
1.121 1.05 0.63 0.7 1.14 0.25
0.64
0.66
0.61
0.61
062
0.63
0.64
1 079 0.96 0.59 1.14 1.14 0.31
0.78
0.79
0.78
0.79
0.78
0.79
0.78
0.84 0.44 0.54 114
0.81
0.82
0.78
0.81
0.82
0.81
0.82
1.14 1.m 0.51
1.06
1.05
1.08
1.06
1.05
1.04
1.08
0.49 1.1 1.14
1.1
1.1
1.14
1.12
1.09
1.12
1.13
1.15
1.15
1.16
1.14
1.13
1.14
1.12
1.09
1.08
1.11
1.14
1.13
1.12
1.12
1.15
1.13
1.16
1.12
1.13
1.14
1.12
1.15
1.15
1.16
1.14
1.13
1.14
1.12
1.15
1.12
1.16
1.14
1.13
1.14
1.12
1.15
1.13
1.14
1.14
1.13
1.12
1.14
1.14
1.15
1.13
1.14
1.11
114
1.12
1.15
1.15
1.16
1.14
1.13
1.14
1.12
1.1
1.12
1.14
1.12
1.09
1.12
1.13
1.02
1.06
108
1.06
1.05
1.04
1.08
1.02
1
0.98
1
1.02
0.98
101
0.97
0.94
0.96
0.93
0.96
0.91
0.94
0.92
0.81
032
0.71 9.59 0.56 0.51 0.48


CAZL cutoff = 40m speed = 30kmph 1 10 100 1000
15.00

CLZR cutoff = 40m speed = 30kmph
0.1 1 10 100 1000 - 15.00

F-AY cutoff = 40m speed = 30krnph
0.1 1 10 100 1000

WAVE LENGTH ~INPUT~OUTPUT~GAIN GAIN IN DB n6l 081 nnnl n i l 1 - 1 ~ 98
-
FLYL cutoff = 40m speed = 30kmph
0.1 1 10 100 1000
15.00
0.00
z -15.00 0
c .- - -30.00 .:
m
-45.00
-60.00

Filter Response(CAZL) Cutoff 70m Speed 30Krnph
0.1 1 10 100 1000

Filter Response(CLZR) cutoff = 70m speed = 30kmph
0.1 1 10 100 1000

Filter Response(FAY) Cutoff = 70m Speed = 30kmph
0.1 1 10 100 1000

Filter Response(FLYL) Cutoff = 70m Speed = 30kmph

Filter Response(CAZL) Cutoff 40m Speed SOKmph
Filter Response(CL2R) cutoff = 40m speed = 50kmph
WAVE LENGTH 0.5 0.6 n 7
OUTPUT 0.05 0.2 0 3
INPUT 1.3 1.3 1 3
GAIN 0.04 0.15 0 3 3
GAIN (IN DB) -28.30 -16.26 -17 74

Filter Response(FAY) cutoff 40m speed 50KMPH

Filter Response(FLYL) Cutoff = 40m Speed = 50kmph

- - - . - - .~~~ ..
CAZL Cutoff 70m Speed 50 Kmph
0.1 1 10 100 1000

Filter ResponseiCLZR) cutoff = 70m speed = SOkmph
0.1 1 10 100 1000

Filter Response(FAY ) Cutoff 70m Speed 50 Kmph

Filter Response(FLYL) Cutoff 70m Speed 50 Kmph

Filter Response (CAZL) cutoff = 40m speed = 100kmph
0.1 I 10 100 1000
15.000


Filter Response (FAY) cutoff = 40m speed = 100kmph

Filter Response (FLYL) cutoff = 40m speed = 100kmph
0.1 1 10 100 1000

Filter Response (CAZL) cutoff = 70m speed = 100krnph
Filter Response(CUR) cutoff = 70rn speed = 100krnph
0.1 1 10 100 1000

Filter F: . ,: . 5c(FAY) ~ l l to f f = 70n\ >,~e€?d 3: 100knlph

Filter Response (FLYL) cutoff = 70m speed = 100krnph

Filter ResponsejCAZL) Cutoff 40m Speed 140Kmph

Filter Response(CL2Rj cutoff = 40m speed = 140kmph

Filter Response(FAY) Cutoff = 4nm Speed = 140kmpl1
Filter Response(FLYL) Cutoff = 40m Speed = 140kmph

Filter Response(CAZL) cutoff = 70m speed = 140krnph

Filter Response(CL2R) Cutoff 70m Speed 140 Kmph
0.1 1 10 100 1000

Filter Response(FkY) Cutoff 70m Speed 140 Krnph
0.1 1 10 100 1 PO0


TRA,CKRECORDING RESULTS (PROF'ILE BASED)
fl:C NO : 7967 Direc?orate : TM& SoRware Version : 2.00 Kailtray : South WeslemRailway Division : SBC Scnion : SU1lEYT DetcofRec. 17-11-2008 Scction Speed : I O O W H Sampling Distariee A m 1 : 0.259 M
SamplingDistance Entered : 0.299 M F/\RAMETER SETTEGS
UN I UNZ AL1 AL2 TWI TW2 GAUGE VACC LACC C A N t
C h w a s t (m) SU Now Track Limits (mrn) Kouie sp&d rr lO5kmph Routes@ > IOSkmph SD Maintenance Limils (mm) Planncd I<UUIC s p d <= IOSkmph Routc s@> 105kmph Roulc speed> IOSkmph $ 1 ) \l:iinlcnmcc limiLs (mm) Urpcnt lioucc speed <= 105kmph ltoutc spccd > lO5kmph <!1 M.!inlcnance Limils (mm) Mnx :<uu~c speed<= 105kmph I<culc spesd > IOSkmph I'L'.!~. !.imi;s_l.aiu (Tor Analog) I'c:hK Lirnils tligh (lix Analog)
Peak Infomarion 1.irnil.s
S c k c t c d Graphic chmncl
ABS ABS ABS
I7l.!'lK LlMllS (In rntl,)
. -~ .- - - .. - - - --- - -- - - - - Y
IIAND US TW C AL BAND UFj TtV G A:- -- - - ~- Route Sped VACCN L f C C N - -. . -. - - e 2
7TWIST CALCULATED FROM CROSS LEVEL

TRACK RECORDING RESULTS(PR0IILE - 2 MODE) ROUTE CODE : 31350 DATE : 11/11/2008 RUN NO : e KH : 1 To 2 PROFILE 1 RIDE INDEX TRACK INDICES PROFILE 2 PRAHETER WISE INDICES
-------------------------..--------------------------------------------------------------------.--- -------..-----------------.---
LOC (MIL UNlR TWI G ALlL ALlR AVO-G RIV RIL GF/lUI SPD MI UN2L UN2R AL2L AL2R TW2 UNI TWI GI ALI
~ l k 1 3.5 3.4 0.5 1.3 3.9 3.7 0.6 1.23 1.26 52 60 ." 6.5 6.4 6.6 7.6 0.6 29 167 9 48 Elk 2 3.6 , 3.7 0.5 1.3 4.2 3.4 0.6 1.25 1.30 52 60 ' * ' 6.8 6.9 6.7 7.7 0.5 27 161 9 48 Blk 3 3.8 3.6 0.5 1.3 3.6 4.1 0.4 1.26 1.30 51 60 '" 7.0 6.3 7.8 6.1 0.5 28 161 9 47 Elk 4 3:9 3.6 0.5 7.4 3.7 4.0 0.4 1.23 1.30 51 60 " ^ 7.1 6.7 1.0 6.8 0.5 26 161 9 41 Blk 5 3.5 3.3 0.5 7.4 3.7 3.9 0.4 1.21 1.28 53 60 "' 6.2 5.9 7.2 6.7 0.5 32 167 9 48 1014 KM
PEAK DISTRIBUTION PROFILE 1 PROFILE 2
BAND UNlL U N ~ R TWl G ALlL A L ~ R BAND UN2L UN2R AL2L A182R TW2
PI 3 2 0 - 43 42 42 P 2 16 12 42 42 0 Q1 0 0 0 41 32 31 Q2 0 0 4 2 42 0 R1 0 0 0 4 1 0 0 R2 0 0 42 42 0 SI 0 0 0 3 1 0 0 - s2 0 0 42 42 a CATEGORY INFORMATION
A0 A0 A0 C41 C32 C31 TGI : 52 AVG SPEED : 60 KMPH
PEAK INFORMATION UNlL : -7/677 -7/629 -7/384 6/946 6/899 6/800 -6/723 6/555 -6/533 -6/478 UNIR : 7/995 7/362 6/948 6/897 5j751 -6/726 -6/678 6/649 6/557 -6/532 TWI : . . . ALlL : -8/916 8/889 -8/721 8/303 -8/275 -8/83 -7/472 -7/523 -7/226 -7/181 AL;R : 8/84' 8/596 7/990 7/941 -7/766 7/749 -7/525 7/499 7/443 7/350 G : 12/728 12/579 12/531 12/481 12/385 12/334 12/:45 12/140 12/39 12/L2 UN2L: 12/117 -11/694 -11/643 -ll/544 11/470 -11/446 -11/3$6 -11/349 -11/202 11/103 UN2R : -12/349 11/987 -11/742 11/668 -11/644 ll/471 11/370 -11/250 11/180 11/80 TW2 : AL2L : -17/586 -15/1 -14/490 -141338 13/810 12/956 -12/931 -12/780 :2/659 12/368 AL2R : -16/293 14/904 14/711 -14/539 -1P/48 -13/883 12/413 -12/391 -12/197 12/74 VACC : LACC :

60 K M P H
60 K M F H
6 0 K M P H
K M P H K M P H
.w

TRACK RECORDING RESULTS (CHORD BASED)
TRC NO ; 7967 Dirrctomle : TM&M Soflwarc Version : 2.0 Kailway : South Wcstcrn Railwny Division : SBC Section : SIMTEST Datc of Rec. : 1711 ti2008 Scaion S p e d : 100KMPH Sampling Distance A d : 0.299 M
\. Sampling Distance Entercd : 0.299 M /.
PARAMETER SETTINOS
- -- UNI UN2 AL I AL2 TWI 7W; GAUGE VACC IACC CANT --
Chord (ni) 9.6 35.2 7.2 9.6 3.6 4.8 ABS ABS ABS SD New Track Limirs (rnm) lloutc spccd C= lO5kmph 1.19 2.50 1.50 1.50 1.75 1.75 1 .OO iloulc speed > lOS!unph 1.20 2.50 1.50 1.5C 1.75 1.75 1 .OO SD Maintcnancc Limits (mm) Planned Roulc speed c lO5kmph 3.00 6.50 2.80 4.00 3.80 3.70 2.90 lloutc spccd > lO5kmph 3.00 5.50 2.80 4.M) 3.40 3.70 2.90 SD Maintenance Limits (mm) Urgent Routc spccd o lO5kmph 3.60 7.43 3.00 5.00 4.20 4.50 3.60 lioutc s p e d > lO5kmph 3.60 6.20 3.00 5.00 3.80 4.50 3.60 SD Maintenancc Limic; (mm) Mar Route spccd c= I 0 5 h p h 4.00 7.90 2.80 6.M) 4.50 5.00 4.00 Route rpecd > lO5kmph 4.00 7.90 2.80 6.W 4.50 5.00 4.00 I'cak I.imi& Low (lor Analog) 10.00 10.00 5.00 7.00 7.00 10.00 6.00 0.15 0.15 7.10 I 'd Lirniu High (lor Analog) 15.00 15.00 10.00 14.00 12.00 15.00 10.00 0.20 0.20 14.10 I'cak Information LimiU 4 5 5 7 5 7 7 0.20 0.20
Sclcctcd Graphic channel 0 I 2 3 . 4 5 6 7 UNIL UNlR UN2L UN2R ALIL AL2L VACC G
I'EAK LIMITS (mm)
SI 10111. CI IORD LONG CIHORD As per para 607 ollRPWM ACCELEMTION (g) B - - D
IIANI: UN r G AL BAND U N TW AI. UAND UN TW c AI. R O U ~ C Specd - - . - - - - - - - - - - - -- - - -. - 'JACCN LACCN -
B c
:\ 6.0 5.0 3.0 3.0 W 10.0 7.0 10.0 LL. 10.0 7.0 3.0 5.0 <=I l 0 . W h p h 0.20 0.20 7 1 % 10.0 7.5 6.0 5.0 X I50 12.0 14.0 111. 15.0 12.0 6.0 10.0 > I 10.00kmpl1 I110 0.10 - I: 15.0 10.0 9.0 7.0 Y 20.0 15.0 2O.G 11 20:O 15.0 15.0 12.0 Z 25.0 20.0 25.0
U m ~ CALCULATED FROM CROSS LEVEL

TRACK RECORDING RESULTS (CHORD MODE) SHORT CHORD
ROUTE CODE : 31350 DATE : 17/11/2008 RdN 140 : 1 KM : 1 T o 2 RIDE INDEX TRACK INDICES LONG CHSRD PRAMETER WISE INDICES
..~~..~-.-~-----------------
LOC UNlL UNlR TWt G ALlL ALlR AVG-G PIV RIL GF/TGI SPD MI UN2L UN2R ALZL A1.2R TW2 UNI TWI G I ALI _^____..__.~__..._.~~~~~~.-.~..~-~~.~~..-~...~.~~~..~-..~....~~~~.~.---..-...-------------------------------..~.~--~~~--~~~~-~~-~~
Blk 1 0.8 0.7 0.6 7.4 2 1 2.7 0.4 1.55 1.69 61 3 0 "' 3.5 3.0 3.1 4.3 0.7 86 160 9 55 B l k 2 0.7 3.7 0.6 7.5 2.8 2.1 8.1 1.57 1.68 68 3 0 "' 3.8 2.5 4.5 3.2 0.7 95 160 8 53 B l k 3 0.7 0.7 0.6 7.5 2.0 2.5 0.9 1.60 1.63 72 3 0 "' 2.9 2.9 3.0 4.0 0.7 92 160 8 61 B l k 4 0.7 0.7 0.6 7.5 2.6 2.4 -0.1 1.51 1.67 67 3 0 "' 2.7 2.7 4.1 3.7 0.7 96 160 8 51 B l k S 0.7 0.1 0.6 7.4 2.3 2.6 0.7 1.55 1.67 68 3 0 "' 3.1 2.3 3.4 4 . 0 0.7 96. 160 53 1004 KM
PEAK DISTRIBUTION SHORT CHORD LONG CHORD
BAND UNlL UNlR TW1 G AL1L ALlR BAND UN2L UN2R AL2L AL2R TW2 BAND UNlL UNlR TWl G ALlL PLlR -___._... .._..-.. - . ...........................
A 0 0 0 65 59 65 W 0 0 0 1 0 >LL<=HL 0 0 0 C 12 17 B 0 0 0 65 12 17 X 0 0 0 0 0 >HL 0 0 0 6 5 0 0 ~ 0 0 0 6 5 0 0 Y 0 0 0 0 8 Concrd f 8 :: D 0 0 0 0 0 0 Z 0 0 0 0 0 -
C A T E W R Y INFORMATION A0 A0 A0 C65 C12 C17 TGI : 68 AVG SPEEi, : 3U IYPH
PEAK INFORMATION UNlL : -2/762 2/995 -2/945 2/896 -2/849 2174a 2!682 21646 -2/571 2/547 UNlR : 2/990 1/928 -2/884 2/837 -2/786 2/741 2/682 21649 21587 2,'531 TW1 : ALlL : -6/720 -6/968 -6/85i -6/698 6/524 -6/348 6/2:2 6/52 -5/944 5 / 8 1 0 ALlR : 6/835 -6/755 61427 -6/941 -6/59T -6/538 -6/225 6/175 6/144 6/99 G : 12/873 12/844 12/716 12/626 12/562 12/499 12/436 12/34? -12/297 12/249 UN2L : -8/74 7/839 -7/513 -7/197 -7/109 .6/995 6Y934 6/871 6/776 -6/576 UN2R : 71589 6/685 -6/606 -6/448 -6/355 .6/308 'r,PV169 6/91 -5/852 -5/795
VACC : LACC :

L, . i k - b n n e L w ~
TRACK RECORDTNG RESULTS (PROFILE BASED)
l'l(<: NO . 1967 Direclontc ; TMkM Sonware Vcrsion : 2.00
i tc, ,~,v,t! : Sfwth Western llailway Division : SBC Section : LIGTEST ,. . ,. , . . ., . . Ihcr : 17 - 11 - 20118 Scction Spced : 1 0 0 W H Sampling Distarse Actual : 0.299 M
Sampling Distance Enlercd : 0.299 M
PAR W E E R SETTINGS
~
--
UEI l UN2 A L I AL2 ' fW I TW2 - GAuc;r; VACC ! .Arc CAN'T . -- -- -.
i ';,LJ:LI!~~LX (rn) 40.0 70.0 40.0 70.0 3.6 4.8 ABS ABS AUS Sl) Ncw'rnck Limits (mm)
I<ou~c spced <= 105kmph I .20 1.30 1.50 1 60 1.75 2.00 1.00 !<a~.itr qccd > 105kmph I .20 1.30 1.50 1.60 1.75 2.M) 1.00
h l j \fain(cnance Limiu (mm) Planned
Itouic speed <= IOSkmph 3.90 4.00 3.40 ~ 3.50 3.80 3.70 2.90 i t u ~ ~ i e speed 105kmph 3.80 3.90 3.30 3.40 3.40 3.70 2.90 :.:,~.IIc spced ; 105kmph 3.80 3 .?0 3.30 3.40 3.40 3.70 2.90 51) >l:\<nIcnancc L imiu (mm) Urgent
I<G,UIC cpccd <= lO5kinph 5.40 5.50 4.60 4.70 4.20 4.50 5.M) 5 40 4.50 4.60 3.80 4.50 3.60 !<c :,w .<(iccil > IOjkrl~ph i 30
\;) \l,!,:,lcnancc l.inliL7 (nrtll) M a y ib,l,ir bpccd <= 105kmph 000 6.10 5.20 5.30 4.80 5.00 2.90 ::,>wt. y ~ d : 105krnpIi 5.80 5.90 5.00 5.10 4.2C 5.00 2.90
,,$ , ~ t~\ i t>- l .o~v (fix ,\IIII~O~) lO.O i l 10.00 5.00 5.00 7.00 7.00 6.00 0 15 0 15 20.00
1, <,v. .. ' l.,u~~ils l l igli (I't>r J\IICI~C>&) l i 00 15.00 10.00 1000 ~ l2.(iO 12.00 10.00 0.20 0 ?I1 h(l 00
l'c:~h inlbnil3lion i.imits I I I I I I 7 O?!I 0 . 2 0
3 J ,:,, \IL,,I <;r~~>l, ic CIY,~!\IXI 11 I 2 5 ' u i
I:XI I . l iXlI I I .T\\'l C; t i N 1 . llN2R T\V2 XI.
i ' l : ~ h I.IklITSlln mol)
TWKST CALCULATED FROM ABSOLUTE VERTICAL PROFILE

TRACK RECORDING RESLII.TS I l'!?OFILi: - 2 I W . E 1 PROFILE 1
............................................... I.OC UNlL GNlR TWl C, A ! 1 >1.8c-?
.............................................. B l k ? 0 . 5 0 . 6 a . 8 n.6 0 . 6 0 . 6 0 . : B l k 2 0 . 5 0 . 7 G . 9 0 . 6 0 . 5 Q . 5 & . 2 9 1 k 3 0 . 5 0 . 7 0 . 9 0 . 7 C . 6 0 . 6 .? .... > E l k 0 0 . 5 0 . 7 C . 9 0 . 7 0 . 6 0 . 6 0 . 2 R l k 5 0 . 5 0 . 7 8 . 9 0 . 7 0 . 1 8 . 7 o ., . - 1 0 1 6
PFAK DISTP.IBUTION PROFILE 1
.............................................. BAND i l Y i i llNlR TWI t .?.l.lL .Al.lF ail iu ............................................. P I 0 0 1 1 i ! F2 Q 1 0 0 1 1 1 " 8 i '
P2 R l i ! i E 2 51 C 0 i < . .
CA'TEG<!Y? i 6?O!?MATIO!~ - . i Q . A,! h : -; ;>:
--..- nu%. l E C O X : 6 5 5 DATE : 1 7 1 i i i Z e FS3N W 3 : i ZH : 1 To 2
PIDE INDXY TS.dCK 1NF,iCE5 FROTILE 2 FRAUETER MIS€ INDICES - . . . . . . . . . ....................................................................
..... r . . El l . Gi!TSI SPD ."I UN2L UNZR Al2L R l 2 R TW2 UNI T % I G I ALI
.................................................................................... 1 1 2 l i t 1 3 0 i00 8 . 7 0.8 i . 3 1.3 0 . 9 ! 1 3 1 4 ? 1 1 7 1 3 3 : : E : IG i 3 2 i 0 0 0 . 6 0 . S 1 . 0 I.3 1 . 0 1 1 5 14! 1 1 7 128
. . . . I : i i 5 . . : i s 1 0 8 e.6 0 . 8 1 . 5 1 . 5 3 . 0 1 ? 5 i i l 3 1 2 1 3 1 i I5 i . 1 7 I:? 1 0 0 0 .8 0 . 7 1 . 2 1 . 2 1.C i i i 1 4 1 :I2 1 3 4 . . - . . .i i i i ! 2 6 1 0 0 0 . 6 0 . 8 1 . 3 1 . 3 1 . 1 1 1 5 1 4 i i l 2 1 2 9
x?*
? % O F t i X 2 .......................
ON?; U>:?R Y L ? i A 1 2 9 TWZ .......................
0 a 3; c: i e 0 4 0 :? i e 6 4 0 r2
. - . . ?. -.. 2
I'EAK 1>1?7?Y~b,T!G?I . . . UNiL : :;LC Z i i ? i ?: 7 3 l - , 5 : < , , .. . , , 7 7 . J . ? , 2 3 5 , , -,:- . . . . . . . UbilK : :!:G - 2 1 9 5 1 . , , .> . a :, ? ! & ? 2 :.: . -, - / . - > - , . , - . . >.
~ii! : - ? / ; c 2 i 9 S E - , 0 5 0 z/e.5 ...... - , , ? / i < ' :> / 7 p .' - . . , . . ~ * .
ili.11. : -, :u 2 / 9 ? 5 2 /P2E 2 / 3 8 5 - , ~ . : ? : ..; I)" i i 2 4 Rl.lii : ?/ i s 2 1 9 6 0 - : / 9 2 ? - z / s s j . . . . ... -.: , ' / 16C I. 4 1
UN2I. : - > , ' - I 2 1 9 4 5 - 2 i a b 8 > / a 6 2 - ? / : 5 5 2 / 7 2 ? 2 i , . i ? UN2R : : ' C - 7 . . . . ., ... Z i P C C l ?/.?US > / ~ G S . - : > ; .. 2/7C.e . ,, : :. TW2 : . 3/:5 - 3 / 5 @ 1 2 / 3 4 : 2 / 5 ? 9 - 2;':;5 - ? / S ? S > , 8 6 5 ALZL : 4 / i G 4 / 8 6 3 - < I 5 3 7 -3,,96E - 3 . 7 i . 3 2 / 6 9 ? . i ~. -:- ' . . - ~
ALZR : 4 / 1 0 4 / 9 0 1 - < J 0 - . - , I - 4 / j ? ? : ! y 3 3;7ZC j . :7 ...-- Y"%b.. :.: . . .- LFicC-7-
r

KMPH
KMPH

TRACK RECORDING RESULTS (CHORD BASED)
TRC NO : 7 9 6 7 D i r e c t o r a t e : TMLM R a i l w a y : S o u t h W e s t e r n R a i l w a y D i v i s i o n : 5 8 C D a t e of Rec : 1 0 / 1 2 / 2 0 0 B S e c t i o n S p e e d : 100 KMPH
PARAMETER SETTINGS
S o f t w 3 r e v e r s i o n : 2 . 0 S e c t i o n : ZIGTEST S a m p l i n g D i s t a n c a A c t u a l : 0 . 2 9 9 M S a m p l i n g D i s t a n c e E n t e r e d : 0.299 M
U N 1 UNZ AL 1 AL 2 TW1 TW2 W A G E VACC LACC CANT
C h o r d ( "1 ) . . 3.6@'* 9 .60 ' 7 .2 - 9.60 3 . 6 0 4 . 8 0 1\85 ABS A 8 5 5D N e w T r a c k L i m i t s (mm) R o u t e s p e e d < - l l 0 k m p h 1 - 1 9 2 . 5 0 1 . 5 0 1.50 1 . 7 5 1..75 , 1.00 - 1
R o u t e s p e e d , l l 0 k r n p h 1 . 2 0 Z . 5 0 1 . 5 0 1.50 1 . 7 5 1 . 7 5 1.00 50 M a i n t e n a n c e L i m i t s (mm) P l a n n e d INoufo % p e e d < - l l 0 k m p h 3 . 0 0 6.50 2 . 8 0 4 . 0 0 3.80 3 . 7 0 Q.90 u o u r e s p e e d , l l o k r n p h 3 . 0 0 5.50 z . a w 4 . 0 0 3 . 0 0 3 . 7 0 2 . ~ 0 so m a i n t e n a n c e L i m i t s ( r n m ) U r g e n t U o u t a s p e e d < = l l 0 k m p h 3 . 6 0 7 . 4 0 3.00 5 . 0 0 4 .20 4 . 5 9 3.60 R o u t e s p e e d , 1 1 0 k m p h 3 . 6 0 6 3 . 0 0 5 . 0 0 3.80 4 . 5 0 3 . 6 0
-. , R o u t e s p e e d 1 1 0 k m p h w e 4 . 0 0 7 . 1 6 " 2 . 8 0 6 . 0 0 4 . ~ 0 5 - 0 0 4 . 0 0 p e a k L i m i t s L O W ( f o r A n a l o g ) 6.00 10.00' 6.00 7 . 0 0 7 . 0 0 10.00 8.730 rs. 1 5 0.15 4 0 . 0 0 i2,?.7h L i . m i t 5 H i g h ( f o r A l la l .og ) 1 0 . 0 0 15.00 10.00 1 4 . 0 0 1 2 - 0 0 1 5 . 0 0 10.00 0 . 2 0 0 . L o 80.00 S r l e c f e d G r a p h i c c h a n n e l s 0 1 2 3 4 5 6 7
LlNlL* U N l R A L l L G UN2L UNZR AL2L LACC PEAK L I M I T S (mm)
SHORT CHORD LUNG CHORD A S p e r p a r a 6 0 7 o t I R P W ~ ACCELERATION(g) ~ - - - ----------- ~ ------ . ~ - -- ~. -------------------
BAND UN TW G AL BAND UN TW AL BAN0 UN TW G 41 R o u l i,:.pi'ed VACCN LACCN ~ . ..--- -.-..----.---.-------
TWIST CALCULATED FROM CROSS LEVEl

TRACK RECORDING RESULTS(CHOR0 MODE) ROUTE CODE : 3100 DATE : 1 0 / 1 2 / 2 0 0 8 HUI< NO : h KM : 1 T o 2 SHORT CHORD R I D E INDEX TRACK I N D I C E S LONG CHORD PRAMETER WISE I N D I C E S
LOC U N l L U N l R TWI G ALLL A L l R AVG-G R I V R I L G F / T G I 5PD M I UN2L UN2R A1.%L AL2R TW2 U N I TWI G I A L I
Ulk B l k E l k
PEAK D I S T R I B U T I O N SHORT CHORD LONG CHORD IRPWPI - 6 0 7
BAND UN1L U N l R TW1 G R L l L A L l R BAND UN2L U M R ALZL AL2R TW2 BAND U N l L U N l R TW1 G A L l L A L l R
0 0 0 0 0 CATEGORY INFORMAT1 ON
81 R L A A 0
I'E AK INFORtlATIOlU U N l L : - 1 0 / 2 9 - 1 0 / 5 7 2 U N l R : 1 0 / 2 9 - 1 0 / 8 7 5 T h l : - 4 / E 6 8 - 4 / 7 6 5 AL I I . : Hi I R :
A L 2 L : ALZR :
V A C C : LACC :
T G I : 1 9 6 CTR : - 6 6 .

'rzcNo : 7 9 6 7 RTCODE : 3 10 o RLY : s r t t h western Railway D I V : S B E
cLIUKU MODE FROK KM: 1 TO K:l: 2.
U N I L UNlR AL1L. G UN2 L UN2R ALZL LACC
* 3 3 f 3 3 f 3 3 f 3 3 * 3 3 t 3 3 f 3 3 * 0 . 3 5
KMPH
KMPH
m 2, Q1 I KMPK

TRACK RECOROINCi R E S U L T S - ' ( P R O F R E B i S E D Y ' + "
TRC NO : 7 9 6 7 D i r e c t o r a t e : TM6M R a i l w a y : S o u t h W e s t e r n R a i l w a y D i v i q i o n : SbC D a t e of R e c : l 0 / 1 % / 2 0 0 8 S e c t i o n S p e n d : 100 KnPH
PhRAMETER SETTINGS
S o f t w a r e V e r s l o n : 2.0 '-rn ,< S e c t i o n : Z I O T E S T S d m p l l n g D i s t a n c e A c t u a l : 0.299 M S a m p l i n q D i s t a n c e E n t e r e d : 0 . 2 9 9 n
U N 1 UN2 AL 1 A L 2 TW1 TWZ GUAGE VACC LACC CANT '
C h o r d f m l - 4 0 . 0 0 7 0 . 0 0 4 0 . 0 0 7 0 . 0 0 3.53 4 .78 A 8 5 A 8 5 A 8 5 so ~ e w . T ; a c k L i m i t s (mm) R o u r e s p e e d < - l l 0 k m p h R o u t e s p e e d , l l 0 k m p h 5 0 M a i n t e n a n c e ~ i m i t s (mm) P l a n n e d R o u f e s p e e d < - l l 0 k m p h 3.90 4 . 0 0 3 . 4 0 3.50 3 . 8 0 '3 .70 '8.30 7
Rol l re s p e e d l l 0 k m p h ' 3 . 8 0 3 . 9 0 2.30 3 . 4 0 3 . 4 0 3 . 7 0 7 . 9 8
~ . - - 7
l i , i# ir~? s p e e d l L 0 h m { 1 I 1 ' . n m a i n t e n a n c e L i m i . 5 ( m m l mar Route s p e e d c r L L 0 k m p h Rourc s p e e d ) L l0k rnp l8 i 'eak L l m l r s L o w ( f o r A n c r l o < j ) P n a k L i m i t s H i g h ( f o r A n . ~ l o q ) ' . .e lected G r a p h i c c h a n n e l s
6 . 6 0 6.10 5 . 2 0 5 . 3 U 0.80 5 . 0 0 2.9e 5 . R B 5 . 9 0 5 . 0 0 5 . L 0 0.2C 5.00 7 - 9 ' 9 1 0 . 0 0 ~ 0 . 0 0 5 . 0 0 5 . e 0 7 . 0 0 7 . 0 0 6 . 0 0 '0.15, 0 . 1 5 4 0 . ~ 0 1 5 . 0 0 15-00 1 0 . 0 0 1 0 . 0 0 1 2 . 0 0 1 2 . 0 0 1rn.100 0 . ~ 0 0 . 7 0 a a . 0 ~ 0 1 . 2 3 4 5 6 I U N l L U N l R A L 1 L R UNZL UNZR ALZL P L ? R
P R O F I L L - 1 P R O F I L E - 2 ACCLLERATION(g)
RAND UN TW G Al. RAND UN TW G AL R o u t e s p e e d VACCN LPCCN ~~ . . . ~ .. ~. . . - -. .. .- -------.------.....
b ~ . . . . . e3

C L A L , r . L - 0 . , c 1 . r - ,- -- ~ .-
~ s n n c c ~ r d ~ ~ ~ ~ arc p u n d d ,
TRACK RECORDI~~Q RESULTS(PROFILE - 2 MODE) ROUTE CODE : 3100 D A T E F 7 1 0 / 1 2 i 2 0 0 B RUN NO : k K r l : 1 T o 2 PROFILE 1 R I D E I N D E X TRACK I N D I C E S PROF1I.E 2 P M M E T E R WISE I N D I C E S
LOC U N l L U N l R TW1 D ' A L l L A L l R AVG-Q R I V R I L G F / T G I SPD Ilf UNZL UNZR ALZL AL2R TW2 U N I TWI G I A L I
E l k 1 0.4 0 . 4 0.5 0.1 0.6 0.5 0.0 0.89 0 . 9 7 1 3 7 60 0 2 6 0.7 0.9 0.9 0.5 1 1 7 1 6 7 1 4 1 138 B l k 2 0 . 5 0 . 4 0.6 0.1 0.5 0 . 5 0.0 0.89 0 . 9 4 1 3 7 *'50 %.. 0.7 E.6 1.0 1.0 0.5 117 1 6 7 1 4 1 138 E l k 3 0.5 0 . 4 0.6 0.1 0.4 0 . 4 -0.0 0.90 0 . 9 7 139 50 0.8 0.5 0 . 7 0 .7 0.6 1 1 7 160 1 4 1 1 4 3 B l k 4 0.5 0.4 0.6 0.1 0.3 0.3 -0.0 0.92 0 . 9 4 1 4 2 ! ' Rb 0 . 7 0.6 0 . 6 0 . 6 0.6 117 160 1 4 1 1 4 7 B l k 6 !,, 0.6 0 . 4 0.6 0.1 0.3 0.3 -0.0 0.90 0.96 1 4 2 50 0.6 0.6 1.0 L . 0 0.6 118 160 1 4 1 1 4 7 999 KM
PEAK D I S T R I B U T I O N PROFTLE 1 P R O F I L E 2
- - -- - ~ ....-..-..-..-.-..-..-----u-----
BAND U N I L U N l R T W I G AL1.L AL1R RAND UNZL UNZR ALZL AL2R TW2 -.-.--.---.------ - P I @ U ) 0 0 0 0 P L 0 0 0 0 0 4 1 0 0 5 0 0 0 0 2 0 0 0 Y 1 0 h 1 6 0 0 0 0 0 R 2 0 0 0 0 0 S i Q O 0 0 0 0 32 0 0 0 0 0
: :RreGOKY ZNFORflnTION A 0 A0 AD A !I0 AC? T O 1 : 1 6 T t I : 139 CTR : 1 0 0 AVG SPEEn : 5 0 KMPH
i ' t R K 1Nf~'ORMAT I O N l l N I L : - 1 / 9 4 R 1 l f < 9 8 - l /F349 - 1 / i 9 7 - L / 7 4 2 - 1 1 6 9 6 - 1 / 6 4 5 1 1 5 9 9 1 / 5 4 6 L / 4 9 9 l r i l ~ : 1 1 9 4 ~ 1 1121Zilj . L /848 - . l / 7 9 9 - 1 / 7 4 t i - 1 / 6 9 9 1 / 6 4 9 L / 5 9 E 1 / 5 4 6 L / 4 9 7 r w l : 1 / 9 4 ~ - 1 / ~ 9 t 7 1 / 8 4 9 - 1 / 7 9 9 1 / 7 4 9 -1/696 1 / 6 4 9 - 1 / 5 9 8 -11'546 -1 / .299 ,,.I I L : AI.lR : G :
LlNZL : - 1 1 9 1 7 -1 . /885 -1/77V) - 1 / 6 L 8 - 1 / 5 9 6 - L / 5 2 t i - 1 1 9 6 6 1 / 4 3 1 - 1 / 3 9 8 - 1 / 3 4 5 ( I N Z R : - - ~ / 7 9 9 1,'71u - 1 / 6 5 7 - i / z z 3 1/189 . ~ / l n n 1 / 9 4 8 - 1 / 8 9 9 l / B ? R - 1 / 6 4 l rw2 : 11948 - 1 / 8 9 8 1./849 - 1 / 7 9 9 1./749 -1/698 L / 6 4 9 - 1 / 5 9 8 -1./346 i / 4 9 9 ALZL :
AL2R :
YACC : LACC :

.I'RCNO. '1 9 6 7 R'TCODE : .1 100 R I . Y : S o . . t k l westf rn Railway D1V:SBC ScC: Z 1 G T E S . C Date:10/12/2008 RUN NO:^
FROM KM: 1 TCI KM: 2

TRACK RECORDING RCSULTS (CHORD BnSEO)
7nc NO : 7967 D i r e c t o r a t e : T f i 6 t l R a i l w a y S o u t h W e s t e r n r ail way D i v i . s l a n S8C Odte of R e c : 1 0 / 1 2 / 2 0 0 8 Section Speed : 100 KmPH
S o f t w a r e Version : 2.B Sec tio.7 : Z l B T E S T S a m p l i n g D i s t a n c e n c t u a l : 0 . 2 9 9 N Sampling D i s t a n c e E n t e r e d : 0 . 2 9 9 M
PhRAtlETER SETTINGS
n UN1- U N H A!.1 AL 2 T W 1 TW2 GrJRliE V A C C LACC CANT .____-_____-___-_-_-__-------------__c-_-__---------------------------------------~-..-----------_______.__-__--_____-____-______
C h a r d ( m ) SO New T r a c k L i m i t s (mm) R o u t e s p e e d (- 110kmph R o u r e speed > ll0kmph 50 n a i n t e o a n c e L i m i t s [vm) P l a n n e d H o u f e speed < - 1lekn.h P o a t q s p e e d , L l e i m p h '-0 n a . i n r e n a n c e ~ i m i t s (mm) U r g e n r EDUt '? S p e e d <n l iB*rn*h l ' . b t ~ Speed , 1lO)knph 5n n a i n t e n a n c e L i m i t ; (mm! Max R e u t e speed < - I l b k n p h r e e l lakmpi? ?oak L i m i t s L o w ( T o r Analog1 Peak L i m i t s H i g h ( for A n a l o ~ ) Selected R r a p h i c c h a n n e l %
RBS ABS 1185
?WORT CWDRD L . O N CHORD f i i per p a r a 6 0 7 of I R P H n A C C E L E R 6 T I O N ( g ) ------ _-. ---- - ------ ̂ _---_----- - _ .. ._ "AND UN TH G 1L RRNO UN T W RL RAND UP, :h G qL ~ o u t e 5 y c e d
. . - ~ . . - - - .. _ . . . . . . .. \'ACCN _ _ _ _ ...._. LACCN _ _ er
CI ,-.B 5 . u 3.2 3.0 w 10.0 1.0 1a.o L L 1 n . o 7 . a 3 . , i ~ m . o r : s r a t i . 0 . 2 ~ E R 1 a . a 7 . 5 G . @ h.0 x ~ s . 8 1z.o I A . ~ HL 15.0 I % . * 6 .0 1 w . 0 LIO.II~LI~?~'~ 8 . 1 . ~ m . ~ m -I C 1 5 . 0 1 0 . 0 9 . 0 7.0 Y 20.C 1 5 . 0 Zd.0 ? L) 0 15.0 0 12.0 2 75.8 ZQ.* 25.0 < -
13
1.4151 CO.LCUC&TFD FQOPI c lOSOIUiE ' /ERTICR! PROF I L F h
2 05083 %
.p

arc cbnnccCid ra1- arc $@c(&td
TRACK RECORDING RESULTS(CHORD ~ O O E ) ROUTF CODE : '3100 ^TF. D A t r i C 10/17/+008 '-- RUN N U Z h -. Km : 1 To 2 -. SHORT CHORD R I D E INDEX TRACK I N D I C E S LONG CHORD PRAMET I R WISE INDICES
LOC UNlI. U N l R TW1 G A L l L A L l R AVG-G R I V R I L GF/TGI SP3 M I UNZL UN2R HL2L AL2R TWZ U N I TWI Q I A L I
E l k 1 0 . 6 0 . 5 0 . 8 0 . 1 0.2 0.- - 0 . 0 0.92 0 . 9 5 203 5@ 0 . 2 0.3 0 . 3 0 . 3 0.8 ' 1 5 8 1 4 7 1 4 1 2 3 8 B L ~ 2 0 . 6 0.5 0 . 8 0 . 1 0.2 a . 2 -0.0 0 . 9 0 0 . 9 5 2 0 4 "60 6r 0 . 2 0.2 0 . 2 0 . 2 0.8 160 1 4 7 1 4 1 238 8 L k 3 0 . 6 0 . 5 0 . 7 0 . 1 0.2 0 . 2 -0.0 0 . 9 2 0.95 2 0 4 50 0 . 2 0 . 2 0 . 3 0 .3 0 . 7 1 6 0 1 5 4 1 4 1 Z 3 B E l k 4 0 . 6 0 . 5 0 . 6 0 . 1 0 . 2 0 . 2 - 0 . 0 0 . 8 9 0.96 2 0 5 -m S.nS 0 . 2 0 . 3 0 . 3 0 . 3 0.6 158 160 141 238 O l k S 6 . 6 0 . 5 0 . 5 0 . 1 0 . 3 0 . 3 - 0 . 0 e.09 0 . 9 6 1 9 6 5 0 0 . 2 0.:3 C1.4 0 . 4 O.G 1 5 8 150 1 4 1 223 1001 KW
PEAK D i S T 9 l C l J I I O N SHOHI CbIORD LONG CHORD IRPHW - 6 0 7
- - - - - - - - - - - -. . - - - .. - . - - - - - - . - - -. - .- - - - - - - - - - - - . . . - - - - - - - - - - - . - - - - -. - - - - - - - - - - -. - - - - - -. - - - . . - .. - - - - . - - - - - - -. -. - - - - - - - - - -. - - - - . - - - - - - - - - - - BAND UNLL V N ~ R ' ~ 1 G ~ L J L A L ~ R BAND UN2L UNZR ALZL A L 2 r TW2 BAN0 U N l L U N l R TW1 G ALLL A L l R
~ ~. ...-..-----.----.----.-------------~-.---.----.---.---------~~~------..-..-~~~~~-~~~~~.~.~~~~~~~~.~~~~~-~~~-~ A 0 0 l 1 1 1. W 0 0 1 1 1 ) L L < - H L 0 0 1 0 0 0 8 0 0 1 1 1 1 X 0 0 1 1 0 > HL 0 0 0 1 . 1 1. c 0 0 e l 1. 1 Y 0 0 1 1 0 C o o c r d R u n O C V' i: I 1 i 7 0 0 1 1 0
i:ATt l i(lKY 1NFORnll i ION A@ n m a) n: n1 n l , TUI : 1 6 TGI : 2 0 > C T W : 96 AVG SPEED : 50 KMPH
PEAk INl70RRF~\~1Oli l l N l L : 1.1769 I /rrr'c+ . 1 / 9 4 R J / b 9 9 - 1 / 8 4 9 l / i 9 9 - 1 / 7 4 9 1 / 6 9 8 -1)-46 - 1 / 6 0 e U N l l i : -l/.l~>'> . l / ? < l : j 1 / 9 4 8 -1/i3ss 1 / @ 4 9 1 / 7 9 q 1/7.29 - I / G 9 8 l / G 5 < 7 I 6 0 0 T W 1 : - 2 / l D # - , -. , <, , (6 Z/HR4 -;!/b13 2 / 7 7 3 - 2 / 5 8 5 2 / 1 6 9 - 2 / 4 5 0 I / . 3 b l i / 3 2 1 A L l L : R L l R :
G : UNZL : 1/90: - 1 - 1 / 8 4 4 1 / 7 6 9 - 1 / 7 4 1 1:675 - 1 / 6 4 9 - i f 5 9 7 1 / 5 1 ? - L / 4 8 4 UN2R : - 1 / 9 4 8 .L/892 - L / 8 4 7 1 / 7 9 1 L / 7 5 0 - 1 / 6 8 0 - - 1 / 6 4 0 - 1 / 5 7 7 1/93.3 1 / 0 9 0 TW2 : - 2 j l S R 2 / 9 1 0 2 /8R4 - 2 / 8 1 3 2 / 7 7 3 2 / 5 8 5 2 / 4 6 9 - 2 / 4 3 0 - 2 / 3 6 2 / 3 2 1 R1.21. :
RL2R : vncc :
LACC :

TRCNO : 196 7 RTCODE : 3 100 RLY:South Western Railway DIV:SBC SEC 'IGTEST J.late:10/12/2008 RUM NO:h

TRACK RECORDING RESULTS :PROFILE BASED]
r R c NO R a i l w a y oat^ of Rec
: 7 9 6 7 : S o u f h W e s r e r n R a i l w a y : L Q / l Z / 2 0 0 5
D i r e c t o r a t e D i v i s i o n S e c t i o n S o e e d
S o f t w a r e Ver5ion : 2 . 0 Section : ZIQTEST S a n p J t n y O ~ s t a n c e A c t u a l : 0 . 2 9 9 PI S a m p l i n g D i s t a n c e E n t e r e d : 0 . 2 9 9 n
PARAMETER S E T T I N 0 5 -------------.-----------.-----------------------------.----------------------..----------...----.----.------------------------.--
UNlWh UNZ A L 1 AL2 TW1 T W ~ GUAUE VACC L A C ~ CANT
C h a r d ( m ) SO New T r a c k L i m i t s (mm) R o u t e s p e e d < - 1 1 0 k m p h l l ~ ~ i t e s p e e d ) l l 0 h m p l l 50 n ; ~ l n t e n a n c e L i m i t s ( m n l ) P l a r l n e d Koufe ~ p c o d ( = l l 0 k m p h 3 . 9 0 4 . 0 0 3 . 4 0 3.50 3 . 8 0 3 . 7 0 2 . 9 0 R o u t e s p e e d , l l 0 k r n p h 3 . 5 0 3 . 9 0 3 . 3 0 3.40 3 . 4 0 3 . 7 0 2 . 9 0 I:,? ~ l . l i n c e n a n c e ~ i m i f s insm,) u r a e n f
P R O F I L I - I PROF I L E - Z ACCELERATIUN! j ~ . ~ . . . . - ... .-- .- ~~~ ~~ ..... . . . .. . - . .. . . . . . .
~ ~
':>I11 l l N I W G !>( HnNO LtN T ' d G A( C o , , t c 5 , p ~ - l l VRI'.T:PI , P$r :11 3-
. . . . 0
.. . . . . . er . tn i . 1 6 . 0 5 .0 i." <.<I P 2 G . 0 5." '3 .19 1 . 0 : l i ‘>.oohni2:~< 0.. I L I . . ' C !
X c
, ; I,.,,, 1 . , , ' ., i, ( > " I rr 0 7 . I . .;. ,' ,..0 I I ,.: ','!#,, IPb, 2 , ..I I :. : 1 5 . 0 LC..@ !2.:3 ! O . S i' \ '. ' : , . O 7 . : . 9.ii 10 .w
.,0.0 5 . i i 3 . m , ' , . a -.7 /0.0 I ? . . % l C . > . L < 15.a
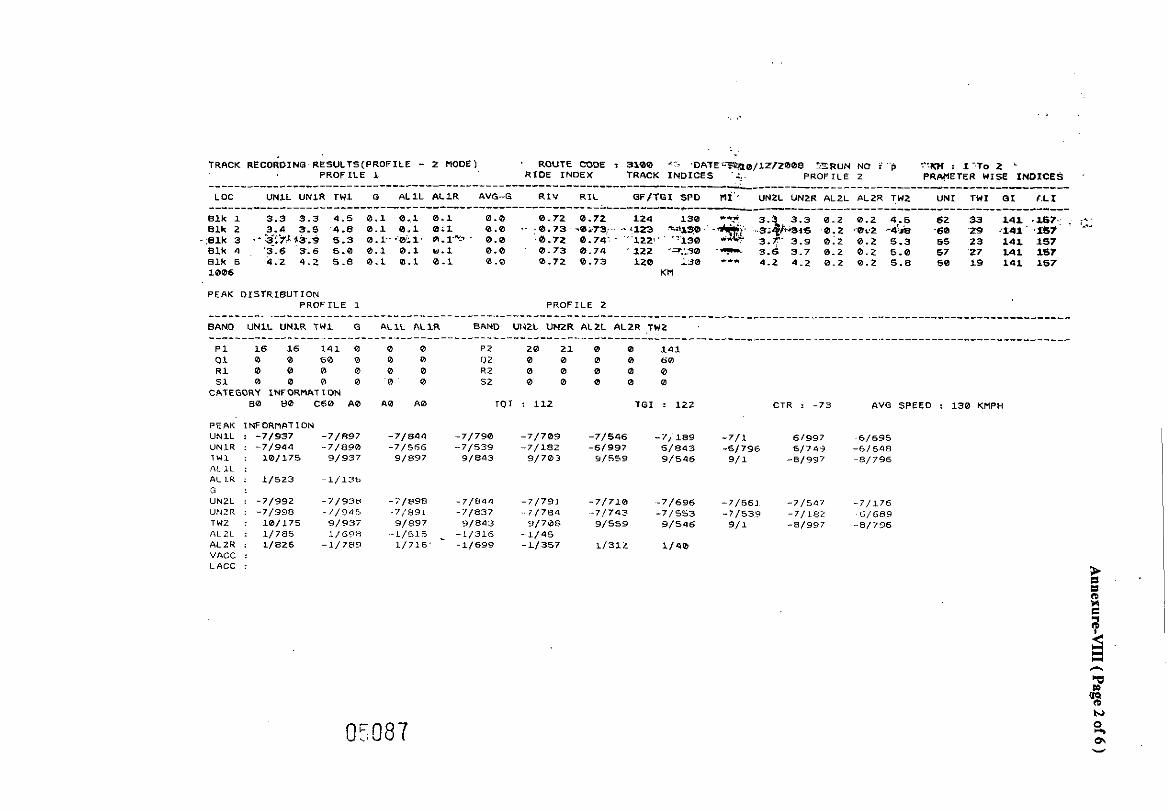
TRRCK RECOROINO RESULTS(PROF1LE - 2 nODE! ' ROUTE CODE r 9100 ~ D A ~ E ~ ~ ~ / l Z I R B 0 8 '"RUN NO ; ' p *:M : I ' T o 2 ' PROFILE 1 R I D E INDEX PROFILE 2 PRIVIETER WISE I N D I C E S TRACK I N D I C E S .::.
LOC UNLL UNLR TW1 G A L l L R L l R AVG-G R I V R I L G F / T G I SPD ~ i " UN2L UN2R AL2L PL2R TW2 U N I TWI G I <,LX
B l k 1 3.3 3.3 4.5 0.1 0,l 0.1 0 .0 Elk 2 3.4 3.5 '4.8 0.1 0.1 0:1 e l k 3 .-$:'I.$$3.= 5.3 0.1--.'051. m.1."' Blk 4 '3.6 3.6 5.0 0.1 0.1 W.1 0.0 - 0 . 7 3 0 . 7 4 .I22 ,=.:00 ..?rr 3.6 3.7 0 . 2 0 . 2 5.0 67 27 141 167
1006 K f l
PEAK DISTRIBUTION PROFILE 1 PROFILE 2
BAN0 UNLL UNLR T W l G RL1L A L l R BAND UI42L U M R ALZL AL2R TWZ .
5 1 0 0 0 0 CATEGORY INFORMATION
8 0 H 0 C 6 0 A 0
PERK INFORPIRTION U N l L : - 7 / 9 3 7 - 7 / R 9 7 UNLR : - 7 / 9 4 4 - 7 / 8 9 0 1 W l : 1 0 / 1 7 5 9 / 9 3 7 AL SL : AL 1.62 ; 1 / 5 2 3 - 1 / 1 3 0
a 0 A 0 TO1 : 1 1 2 T G I : 1 2 2 CTR : - 7 3 AVG SPEED : 1 3 0 KMPH
5 UNZL : - 7 / 9 9 2 -7 /93W - i / R 9 R - 7 / 8 4 4 - 7 / 7 9 1 - 7 / 7 1 0 - 7 / 6 9 6 - 7 / 5 6 1 - 7 / 5 4 7 - 7 / L 7 6 UNZR : - 7 / 9 8 0 - / / 9 0 5 - 7 / R 9 I - - 7 / 8 3 7 - 7 / 7 8 4 -7!743 - 7 / 5 5 3 - 7 / 5 3 9 - 7 / 1 8 2 G/G?39 TW2 : 1 0 / 1 7 5 9 / P 3 7 9 / 8 9 7 9 / 8 4 3 9 / 7 d 6 9 / 5 5 9 9 / 5 4 6 9 / 1 - 8 / 9 8 7 - R / 7 9 6 ~ L Z L : 1 / 7 8 5 .~/61n - - L / ~ s s - -1,f316 - 1 / 4 5 AL2R : 1 / 8 2 6 - 1 1 7 8 9 1 / 7 1 6 ' - 1 / 6 9 9 - 1 / 3 5 7 1 / 3 1 2 1 / 4 0 VACC : LACC :

7 .* A : n: 2 2 a a
E Z $ E 3C 5 X : %
0 0 0 Annexuw-\'III( Page 3 of m m m F1
rl rl d r r l
U) a m '.. c, ,., d a rZ * o ,+
X
U)
a "l '. N m J J 4 4 2
x
. , , . . . . . ~ ~ . ' . . .
....
.. . , . . . . . . - . ! . " '
1.. ~. , .".. .~

TRC NO : 7 9 6 7 Directorate : TM6M R a l lway : SOUI~ w e s t e r n R a l l w a y D I ~ l e l O n : SBC :
D a t e o f Rec : 10/12/2008 S e c l l o n Speed : 100 KMPH
S o l l w a r e V e r a l o n : 2 . 0 s a c t l o n : ZlQTEST S a m p l l n g D l s t a n c a A c t u a l : 0 . 2 0 9 M SamPI Ing D t s l a n c a E n t e r e d : 0.2Bs 'M
PARAMETER SETTINGS
UN I UN2 AL 1 AL? TW1 TW2 WAGE VACC LACC CANT
C h o r d ( m ) S o ~ s w T r a c k L l r n l l o (mn) R o u t e speed <- l 1 0 k n p h R o u t e sDaed > 110kmoh
4.80 ABS ABS ABS
SD ~ a l n i s n a n c s ~ l r n l i r (mnl PlanneC R O U I ~ speed <s 110kmpn R o u t e speed > t l akmph So M a l n t s n a n c s L l m l l s (rm) U t g e n t R o u t e speed C- 110kmph R o u t e speed s l l 0 k m p h SD M a l n l e n a n c e L i m i t s (mn) Max R o u t e speed C= 110kmph Roule speed s l l 0 k m p h Peak L i m l t s Low ( t o r A n a l o g ) Peak L lm113 H l g h ( f o r A n a l o g ) S e l e c l e d G r a e h l c c h a n n e l $
UNlL UN1R TWl XL UN2L UNPR T'N2 G PEAK L IMITS (nm)
SHORT CHORD LCMO CHORD A s p e r p a r a 607 o t IRPWM ACCELERATION(g)
BAND UN T W G AL BAND UN TW AL BAND UN TW G AL Rou tespeed VACCN LACCN ..~......~---~....~~~~-----......-.----~~~~~....------........--------.......----.---......-........-.-..--....-.----~-~~...~--~~-
TIYIST CALCULATED FROM CROSS LEVEL

.TRACK-REOORDIWG RESUKTS(&D-MM)E) -*:" R W T E ' m ~ ? - S 1 0 8 ~ ~ O * T E ~ ~ i 0 / 1 2 / Z B B 6 - RUN'NC'.V. V :'* - ICM 't - 1 T 0 " R - r SHORT CHORD " ' R I V E INDEX TRACK I m I C E S . .". ., LONO C W R D , , . P R M T E R WISE IND~CES
: LOC U N l L UN1R TW1 O . A L t L A L I R A V G - G R I V R I L QF/TGI SPD . M I 1 1 1 ~ 2 ~ UNPR ALLL ALZR TW2 U N I TWI 0 1 ALI
B I K I' 3 . 2 3 . 4 S.O 0 . 1 0 . 2 0 . 2 - 0 . 0 0 . 6 7 8 .72 I 8 1 1 3 8 ' ... 1619 17.5 0 . 2 8.2 6 . 8 5 2 7 1 4 1 t ~ d B I K Z 3 . 1 3 . 3 4.3 0.1 8 . 2 0.2 - 0 . 0 8 . 8 8 a . 7 0 16% 1ae 16.0 16.7 8.2 0 . 2 4 . 8 6 PQ 1.1 PSI B l k 3 3 . 2 3 . 4 5 . 8 0 . 7 0.1 0.2 -8.b 0 . 8 7 0.71 ( B S I S 8 ... 1 6 . 6 17.4 8 . 1 0 . 2 5 . 0 5 27 111 PaB B I Y 4 3 . 3 3.5 5 . 1 0 . 1 0.7. 0 . 1 - 0 . 0 0 i e S 0 . 7 1 1 6 4 198.- ... ' 1 7 . 0 17.9 O.e 0 . 2 6 . 1 5 16 1 1 4 8 B l k 5 3 . 2 5 . 4 4 . 9 0.1 0 . 1 0 . 2 - 0 . 0 0 . 6 9 0 . 7 0 366 1 5 0 '.+ 1 6 . 5 1 7 . 7 8 . 2 0 . 2 4 . 9 6 2 8 1 4 1 P 4 8 1 0 7 0 KM
PEAK D I S T R I B U T I O N SHORT GHMlD LOND CHaRD IRPWM - 6 8 7
B A W UNIL UNIR TW1 G h L I L A L I R BAND UN2L UN23 A L 2 L & L P V ; f : BANI U N l L U N l R TPl1 G A L I L C L I R .-.--.----.-------.----.---.----.-----.-----
A 0 1 ' ( 4 3 1 1 1 W 1 4 7 1 4 7 1 1 8 2 >LL<-dL 0 0 6 2 0 0 W B 0 0 6 2 i 1 I K 1 4 7 1 4 7 I 1 0 >HL 0 0 0 ' 1 I C O 0 B l I 1 Y 1 4 4 1 4 6 1 1 0 C o n c r d * X I * 0 0 0 0 1 1 1 Z 6 3 1 1 1 @
CATEOORY INFORMAT IW M A 0 C 6 2 A1 A I A 1 TO1 : 2 1 7 TGI : 1 8 4 CTR : - 4 7 AVG SPEED : 138 UMPH
PEAK I N F W T I O N UNIL : - 6 / s s 8 - 6 / 6 6 7 - s / 2 2 4 - 6 / 8 6 - 6 / 2 6 - 5 / 9 4 3 , s/ass - ? / a 4 7 - s / 7 s 2 - 5 / 7 4 9 UN1R : 8 / 2 6 - 6 1 9 9 2 - 6 / B $ 6 -6/S74 - 6 / 8 4 6 6 / 2 4 -6/J96 - 6 / 2 5 8 -8:231 - 6 / 1 0 6 T w ~ : 9 / 2 2 4 8 / 9 9 8 0/9A3 8 / 8 8 8 8 / 8 3 2 6 / 7 9 ? 8 / 7 4 9 8 1 6 3 4 B / 6 3 9 8 / 5 9 7 A L I L : 1 /26 l / 6 2 9 - 1 / 9 6 AL1R : 1 / 2 6 - 1 / 2 6 3 G : 1 / 2 6 U N P L : - 2 8 / 9 8 7 - 2 6 / 6 5 6 - 2 6 / 2 2 7 -25/9W5 2 6 / 7 6 0 , 25/752 2 S / 5 4 9 - 2 5 / 4 2 8 - 2 5 / 2 0 0 - 2 5 1 8 9 U N P R : -28 /220 - 2 1 / 9 9 4 - 2 7 1 6 7 7 - 2 7 1 6 4 9 - 2 7 / 4 1 3 - 2 6 / 7 5 9 - 2 6 / 7 1 8 - 2 6 / 3 9 9 - 2 5 / 1 9 5 - 2 6 / 1 0 9 TW2 : 9 / 2 2 1 e / s s 8 e l 3 4 3 81888 8 / 6 3 2 8 / 7 9 1 8 / 7 4 S E l 6 9 4 e l 6 3 9 8 / 5 9 7 a L n L : 1 /26 ALPR : 1 /26 VACC : LACC :

TRCNO:7967 RTCODE:3100 RLY:SOI.-.~ western Railway D1V:SBC S-C:ZlGTEST D a t e : l O / 1 2 / 2 ' J O B RUN NO:f

This report has been prepared under the guidance of Shri S.K.Maurya, DTM-I1 by the team of following officers and staff
1 , Shri R.P.Te:vali, 2. Shri N.hmughan?,
Lab Validation & Data Recording work
3. Shri S.Kohli, 4, Shri Bheem Sen, 5. Shri Virender Singh, 6. Shri Rakesh Tiwxi, 7. Shri h i 1 Kumar,
DDTM-UG DDTM-Instt.
Secretarial Work:
8. Shri S.P. Verma, Steno

GOVERNMENT OF INDIA MINISTRY OF RAILWAYS
MAINTENANCE SCHEDULE MANUAL FOR
WORKSITE TAMPING MACHINE (METEX MAKE)
REPORT NO. TM-137
(PROVISIONAL)
RESEARCH DESIGNS & STANDARDS ORGANISATION LUCKNOW- 226 01 1

PREFACE
Matiirenanc:. ~f Oil- i rack Machines is a challenging task. Maintenance of these machines is beirig dolie by zonal railways, with the assistance of l ~ c a l trade available, zor~al track machine wcrkshops, CPOH I Allahabad and RDSO 1 Lucknow. With experience over the years, the railway engineers have developed adequate expertise in the maintenance of these machines. However, i n absence of approved maintenance instructions, different maintenance practices have come into vogue. Therefore, it has become imperative to have a uniform maintenance standard throughout the Indian Railways. Final maintenance schedule manuals of CSM (09-32), BCM (RM-80), FRM-80, Unimat, Duomatic machine (DUO), Unomatic machine (UNO). Ballast Regulating Machine (BRM 66-4). Tamping Express (09-3X), Dynamic Track Stabilizer (DGS 62N), Multi purpose track tamping riachine (Unimat Compact--M), Plasser's Quick Relaying System (PQRS). T--28 Track Relaying Train (TRT), Phooltas make UTV, FRM-85F and Worksite Tamping Machine (Plasser make) have been issued by RDSO.
Provisional maintenance schedule manual of Works~e Tamping Machine (Metex make) have been prepared on the basis of experience and suggestions received from railways.
It is hoped that this manual will be quite useful for the staff maintaining the machines in field.
While every care has been take;i to make the maintenance schedules quite exhaustive, there is always scope for further improvement. Suggestions from the railways in this regard will be welcome and may be sent to the undersigned.
APRIL -2010
(A.K.Pandey) e Executive Directorrrrack ~ a c h i n c
RDSOILucknow-226011. -i 0

EXPLANATORY NOTES
While preparing text of provisionalt Maintenance Schedules Manual for Work
SiteTamping machine (metex make), the terms usedand their meanings are
explained below:
CHECK Ensure a specific condition does (or does not) exist
7
! INSPECT - Look for damage and defects including breakage, distortion
cracks, corrosion and wear, check for leaks, security and that all
items are completed.
CHANGE - Remove old parts by substituting a new or overhauled
reconditroned part. Fit new or overhauled 1 reconditioned part in
place of missing part.
OVERHAUL - Dismantle, examine, recondition or renew parts as necessary
against given specifications, reassemble, inspect and test.
(ii)

Schedule I
Schedule I1
Schedule Ill
5,chedule IV
Schedule V
Schedule VI
Schedule VII
Annexure-l
Annexure-ll
Acknowledgement
PAGE NO.
(iii)

iii) iv)
vi) vii) viii ) ix) x)
xi) xii) xiii) xiv)
1) i i) iii)
iv) v)
vi) vii) viii) ix) x) xi) xii) xiii)
SCHEDULE - I (TO BE DONE DAILY)
DURATION - ONE HOUR ENGINE:
Check the engine oil level and top up if required. Check fuel level and top up if required. Check water level in radiator and top up if required. Check and prevent water and fuel leakage, if any. Check the air cleaner element ir~dicator. If indicator is red, the outer filter is to be cleaned. Check the tension and condition of V-belts and do needful. Drain the air tanks after the day's work. Drain the water separator before starting the engine. Record the maximum engine temperature of the day's work. Check the engine oil pressure:
a) at Idle b) On load after two hrs. working
Clean the engine and premises. Check iite system of disengaging the main clutch. Check the level of compressor oil. Check the battery charging system.
MACHINE GENERAL:
Lubricate the arm bearing with grease. Check and top up the oil reservoir for lubrication of vibration shaft bearing. Check the oil level of tank for lubrication of guide columns and top up if required. - Check the locking arrangement of tamping units. 1
Check the worn out tamping tools (limit 20% on area basis), and change if required. Check the tightness of tamping tools and infringement with one another. Check locking arrangement of liftingllining units. Apply lube oil on bush bearings of feeler rods of shadow board trolley. Check the hydraulic hoses and seals for leakage and attend as required. Top up the air oiler with hydraulic oil. w Check and top up the hydraulic oil tank. If required. -3
r- Check the brake application. d Check the func:ioning of pneumatic system. o
Page 1 of 12

xiv) xv xvi) xvii)
xviii) xix) x-4 xxi) xxii)
xxiii)
Observe the leakage from all gear boxes Check the t~ghlness of cordon shaft bolls and do the needful. Check the engagingldisengaging of clutch in travellir ~g and working npde. Check the oil level of intermediate support of cordon shaft. Top'up if required. Check the functioning of intercom system. Check the functioning of computer. Check the locking pin of cansolidator. Record the maximum hydraulic temperature of the day's work. Greasing of connecting rod bearing, vibration shaft, eye and fork end of squeezing cylinders is to be done after two hours of working. Check the unusual sound from machine.
Page 2 of 12

SCHEDULE - II
(TO BE DONE AFTER 50 HOUFS OF ENGINE RUNNING) DURATION- TWO HOURS
1. ENGINE:
i) Check battery terminals and connection. ii) Check specific gravity of battery electrolyte
2. MACHINE GENERAL:
i) ii) iii) iv) v) vi) vii) viii) ix) x)
xi) xii) xiii) xiv) xv) xvi) xvii) xviii) xix) xx) xxi) xxii) xxiii) xxiv)
Check the oil level of power shift gear box and top up, if required. Check the condition of brake shoe. Check the functioning of hand brake. Lubricate axle gear box flange cover with grease. Lubricate the cordon shaft with grease. Check tightness of 35mm and 55 mm pin. Check nuts and bolts of suspension block of Tamping units. Clean the air breather of tamping units and gear boxes. Check the oil level of distribution gear box and top up if required Check the oil level of hydraulic working drive reduction gear box and top up if required. Check the oil level of axle gear boxes and top up if required. Check the oil level of drive intermediate shaft and top up if required Lubricate the tamping unit frame guide bushes with grease. Lubricate the liftingllining units with grease. Clean and lubricate the front.and rear feeler rod with grease. Grease supporting area of slider. Lubricate the guide bushing of front, middle and rear feeler with engine oil. Lubricate the pivot of middle feeler with grease. lubricate all other moving parts except above with oil or grease. Lubricate all ball and socket joints. Check air leakage from pneumatic system. Check all lights for proper functioning. ID
Check the bolts of cover plate of squeezing cylinders for tightness. rf r-
Check the tightness of tamping cylinders holding bracket bolts. rf - 0 !
Page 5 of 12

SCHEDULE - 111
1) ii) iii) iv) v
i) ii ) iii) iv)
(TO BE DONE AFTER I00 HOURS OF ENGINE RUNNING) DURATION- ONE DAY
ENGINE:
Check ti~gh water temperature safety device. Check low lube oil pressure safety device. Check the functioning of throttle control linkage. Examine the mounting bolts of the engine. Check and lubricate hand brake.
MACHINE GENERAL:
Inspect the water separator for proper functioning. Inspect the bolts of cardan shafts for tightness. Lubricate the tamping unit lateral adjusting cylinder with grease. Examine the expiry date of fire extinguisher. Lubricate the bogie turning king pin pivot with grease. Check the oil level of all gear boxes and top up if required.

SCHEDULE-IV
(TO BE DONE AFTER 200,400,600 and 800 HOURS OF ENGINE RUNNING) DURATION-TWO DAYS
1. ENGINE:
i) ii) iii) iv) v) vi) vii) viii) ix)
Change the engine oil. Change the conlpressor oil. Change lube oil filter elenlent. Change pre fuel filter element. Change secondary fuel filter. Changa the air cleaner elements. Lubricate all the engine pulleys with grease. Check engine cylinder head bolts. Change clutch shaft flange locking bolts.
Note : 1. ltem no. i) to v) will be done after 250 engine hrs. 2. ltem no. vi) will be done after 500 engine hrs.
2. MACHINE GENERAL:
1) ii) iii) iv)
' v) vi) vii)
viii) ix) x) xi) xii) xiii)
Change the suction filter. Chang? oil of axle gear boxes. Change oil of funk gear box. Change oil of transmission gear box. Change the oil of axle gear boxes. Change the oil of intermediate shaft. Change the hydraulic oil of reservoir for lubrication of vibration shaft main bearing. Change oil of reservoir for lubrication of vertical guide rod of tamping units Replace silica gel of Pneumatic system. Lubricate the torque arm pivot of powered bogie with grease. Lubricate the brake linkages of powered bogie with grease. C D
d- Change the servo filter element. r-- Change the return line filter element. -a
a
Note: ltem no. i),ii),iii),iv) and ix) will be done after 500 engine hrs

(\OH) (TO BE DONE AFTER 1000, 3000, 5000 HOURS OF ENGINE RUNNING)
DURATION- 7 DAYS
1. ENGINE:
i) ii) iii) iv) v) vi ) vii) viii) ix) x) xi)
2.
Change worn out water hoses. Check coolant for PH value, Overhaul the self starter. Overhaul the alternator. Overhaul the injectors. Overhaul the fuel injection pump. Overhaul the air compressor. Clean the engine radiator externally. Change the batteries on condition basis Clean the diesel tank. Clean t l ~ e cooling coil.
MACHINE GENERAL:
i) Overhaul/ Replace the tamping units, if required. ii) OverhaullReplace the lifting units, if required iii) Send the hydraulic oil for chemical testing. iv) Clean the hydraulic oil tank. V) Clean the hydraulic oil through lop, if found OK in chemical testing
otherwise fill the new oil. vi) Check the bearings of all the axles and lubricate with grease. vii) Check the condition of meggi,springs and replace them if required. viii) Recondition the worn out wheels of all trolleys, if required. ix) Check bearing of trolley wheels and lubricate them with grease. x) Change the hydraulic hoses, which are damaged. xi) Change the seals of leaking hydraulic cylinders, If any. xii) Overhaul all the transducers. xiii) Change the defective transducer fork. xiv) Thoroughly clean all the panel boxes with pressurized air. xv) Change defective or missing lights. xvi) Calibrate the sensing trolleys for level.
. xvii) Strengthen the machine frame where cracks have been developed. ; xviii) Change the brake shoes.
xix) Change lubricant of hand brake gear. XX) Calibrate the machine on track for all functions.
Page 6 of 12

SCHEDULE-VI (IOH)
(TO BE DONE AFTER 2000 AND 4000 HOURS OF ENGINE RUNNING) DURATION - 45 DAYS
1. ENGINE:
i ) ii) iii) iv) v) vi) vii) viii)
Overhaul the engine. ~f required. Overhaul the air compressor. Change all the water hoses. Overhaul the water separator and air oiler. Overhaul the air unlozder. Check crank shaft end clearance. Check the vibration damper for dynamic balance. Change fuel pump screen filter.
2. MACHINE GENERAL:
i) Change the seal of brake cylinders. ii) !nspect functioning of limit switches. iii) Clear1 and repair the hydraulic oil cooler, if it is blocked more than 20% or
badly leaking. iv) Change the damaged pneumatic pipes.
, v) Overhaul the pneumatic valves, if required and change unserviceable ones.
vi) Change the seals of all pneumatic cylinders. vii) Check the machine wheels for tyre defects. Reprofile or replace if
required. viii) Change the defective switches and potentiometer. ix) Change the cartridge of air dryer.
Page 7 of 12

SCHEDULE-VII (POHI
(TO BE DONE AFTER 6000 HOURS OF ENGINE RUNNING) DURATION-90 DAYS
1. ENGINE:
1 Overhaul or replace the engine. i i ) Overhaul the radiator fan drive assembly. iil) Change the englne mounting pads. IV) Check the engine damper for dynamic balance v) Change ihe water separator and air oiler. vi) Change the alr unloader.
2. MACHINE GENERAL:
1 )
111 iii) iv j
v) vi)
vii) viii)
ix) x xi) xii) xiii) xiv) xv) xvi)
xvii)
xviii) xix) XX)
Change all hydraulic pumps. Change all hydraulic motors. Check and recharge the hydraulic accumulators. Change the hydraul~c cylinders on ~ondition basis otherwise replace all the seals. Change all the D.C. and pilot operated valves. Get calibrated the proportional valve, if possible; otherwise replace it with new one. Change all pressure control valves. Check the functioning of all stopcock and flow control valves, if anyone found defective then replaceit with new ones. C h a ~ g e all hydraulic hoses along with crimped fittings. Clean the hydraulic tank. Inside to be painted with approved quality paint. Flush the complete hydraulic system. Change all pneumattc hoses. Check and clean the cooling coil. Test the air tanks for rated air pressure. Change all pneumatic valves. Change the pneumatic cylinders on condition basis, which were creating the frequent trouble during work. Otherwise replace seals only. Renew the complete wiring of the machine if existing wiring found more than 40% damaged otherwise replace only the damaged circuits. Overhaul the brake cylinders and replace the seals if cylinder is 0.k. Overhaul the sensing trolleys. Re-profile all the trolley wheels.
Page 8 of 12

xxi) Change t!?e axle bearings. XXII) Overhaul 311 the gear boxes. x x i ~ ~ ) Overhaul the cardan shaft,s. x x ~ v ) Check the lilnlt switches and ireplace 011 condition basis. xxv) Overhaul the pendulums. xxvi) Overhaul !he panei boxes and provide thimbles as required. xxvii) Change the defective svtitches and indicator lights. xxviii) Check and replace the defective LED'S of solenoids if required. xxix) Calibrate all the potentiometers for; zero correction. xxx) Check the machine frame for crack and strengthen as necessary. xxxi) Paint the complete machine with approved quality paint. xxxii) Calibrate the machine in all respects.
Page 9 of 12

Annexure- I
IMPORTANT DATA AND INSTRUCTIONS FOR MAINTENANCE OF MACHINE
1. Working pressure 130-1 40bar 2. Tamping unit vibration pressure 150 bar 3. Squeezing pressure 90-1 35 bar 4. Minimum thickness of brake block 13 mm 5. Minimum clearance between brake block
and wheel 3-5mm 6. For examination of fire extinguisher check the instruction of
manufacturer (seal shoula be intact and nozzle should be free from obstructions).
7. Oil used as damping oil it-? pendulums silicon oil (M200/12500) 8. Never operate the engine with oil level below lc'w mark or abovethe
high mark. I 9. Keep the engine oil level as near high mark as possible. 10. Check the oil level of power shift gear box at 1200 RPM
For lower level at 40"c For i,pper level at 80°c
11. When greasing and lubricating, remove excessive grease or oil beiore re-greasing and re-lubrication the machine parts.

GENERAL SAFETY NOTES.
The machine has to be operated according to existing Indian Railways Rules & Regulations.
The safety of yourself and other people is most important consideration in the operation and maintenance of the machine.
Remember, the machine is a working unit, carrying delicate instruments. Therefore, the machine should not be driven at excessive speed over bad track or crossing.
Always keep your eyes open for other men working close to the machine.
Do not forget to look out for signals, switches and track obstructions
Make sure that all protection equipment and safety devices are in place on the machine and in working order especially when it is being driven from site to site.
Always keep the machine clean. Excessive oil or grease on the machine can cause you to slip and fall and is also to potential fire hazard.
Always lock the machine before you leave. Make sure that the machine is protected in accordance with railway regulations.
Whenever you have the opportunity while waiting to get out on a job, do some of the smaller maintenance job, such as tightening loose nuts and bolts and cleaning the machine.
Do not permit unauthorized persons to operate the machine
It is prohibited to use fire on or near the machine. Cn -:T
When ever going for working on or near the tamping bank area, operate I, the emergency push button and ensure latching position. d
C3
Do not tow the machine if the final drive is engaged
Page 1 1 of 12

ACKNOWLEDGEMENT
Following officers and staff have made their valuable contributions in finalization of Provisional Maintenance Schedule manual for Worksite Tamping Machine (Metex make).
RAILWAYS
1. Shri I.K.Gupta
RDSO
1. Shri H.C.Pandey
2. " " Mahavir Prasad
3. " " M.N.Siddiqui
4. 'I I, Prem kumar
SEITMCINCRIJHS
Dy. Dir./TM
ARErrM
SEIEngg.
SRErrM
Page 12 of 12