government pension fund global - bi.no · set exposure to currencies and duration, remove credit....
TRANSCRIPT

GOVERNMENT
PENSION FUND
GLOBALOLE CHRISTIAN BECH-MOEN
CIO ALLOCATION STRATEGIES
CME/CAPR
OSLO, 6. FEBRUARY 2018
20/02/2018

Disclaimer
2
This presentation is intended for general informational purposes only. The
views set out in this presentation are solely those of the author(s) and do not
necessarily reflect the views, position or official policy of the Government of
Norway, Norges Bank or Norges Bank Investment Management. Responsibility
for the information, views and other content set out in the presentation lies
entirely with the author(s). None of the Government of Norway, Norges Bank,
Norges Bank Investment Management or any person acting on their behalf may
be held responsible for the information, views or other content in this
presentation or for the use thereof. Reproduction of this presentation, or any
part thereof, is prohibited.

Return on portfolioUS Dollars
3
-10%
0%
10%
20%
30%
40%
12/2012 12/2013 12/2014 12/2015 12/2016 12/2017

Return on portfolio and reference indexUS Dollars
4
-10%
0%
10%
20%
30%
40%
12/2012 12/2013 12/2014 12/2015 12/2016 12/2017

Sgt
Governance model
Government Pension Act
Management mandate
and ethical guidelines
Reports.
Advice on
investment strategies
Annual white paper.
National budget and accounts
5
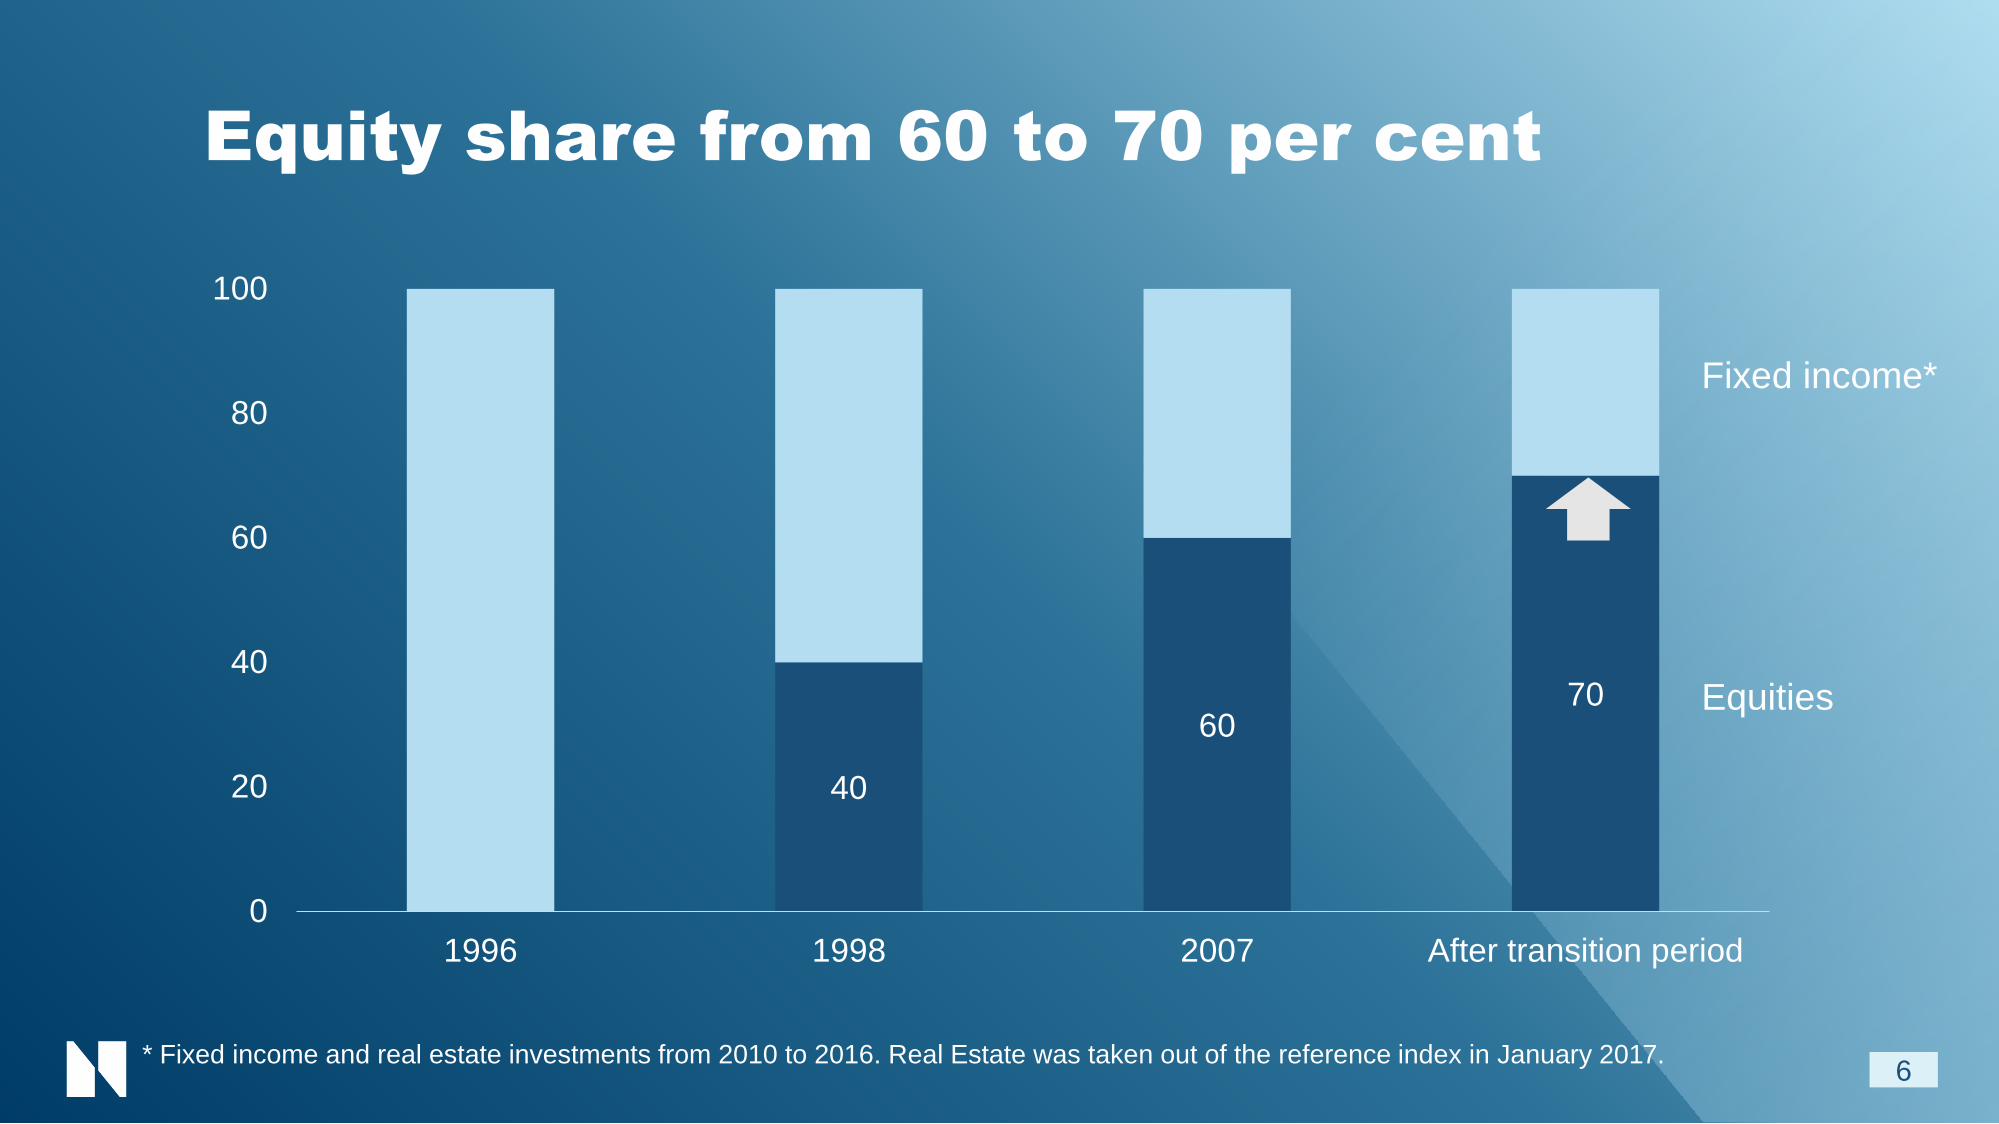
Equity share from 60 to 70 per cent
6
40
6070
0
20
40
60
80
100
1996 1998 2007 After transition period
* Fixed income and real estate investments from 2010 to 2016. Real Estate was taken out of the reference index in January 2017.
Fixed income*
Equities
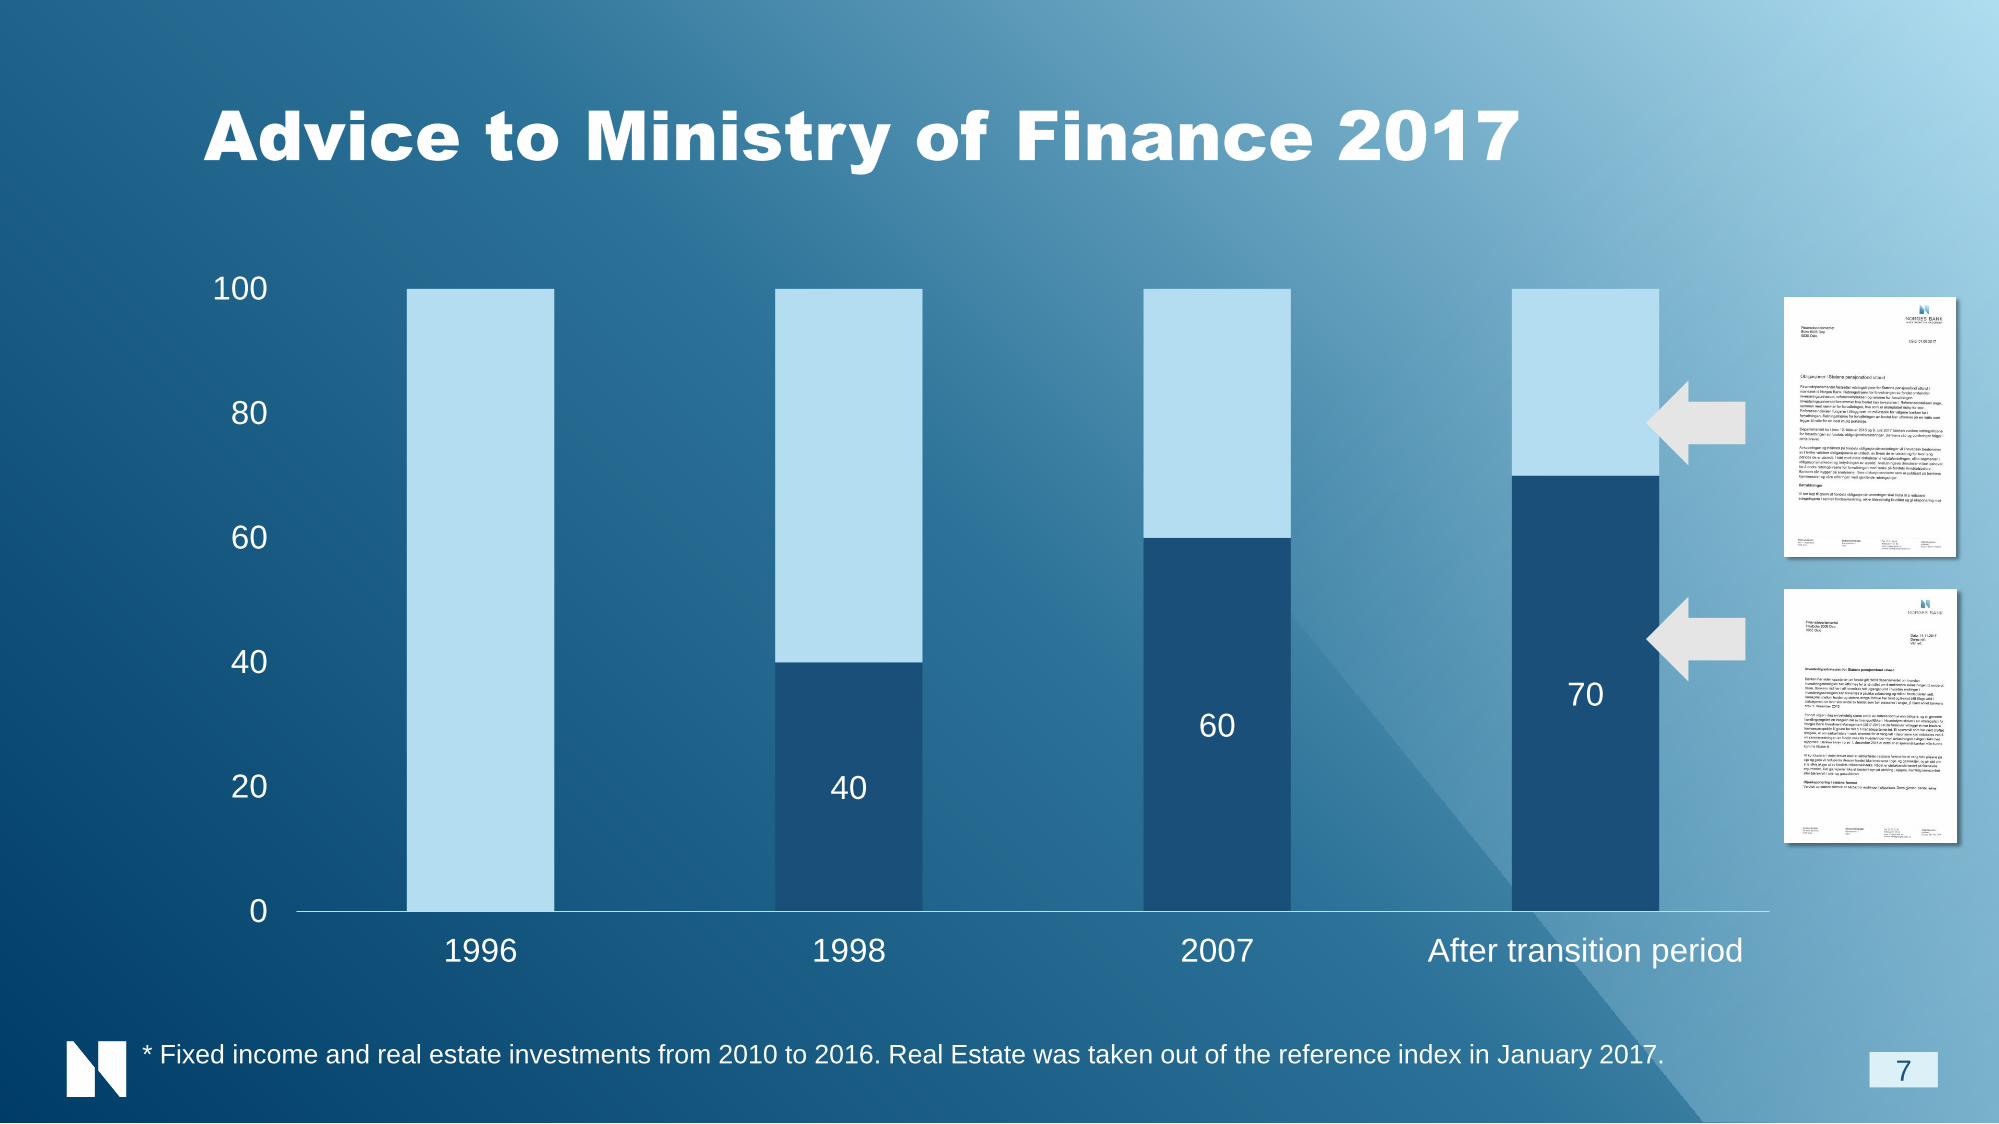
Advice to Ministry of Finance 2017
7
40
6070
0
20
40
60
80
100
1996 1998 2007 After transition period
* Fixed income and real estate investments from 2010 to 2016. Real Estate was taken out of the reference index in January 2017.
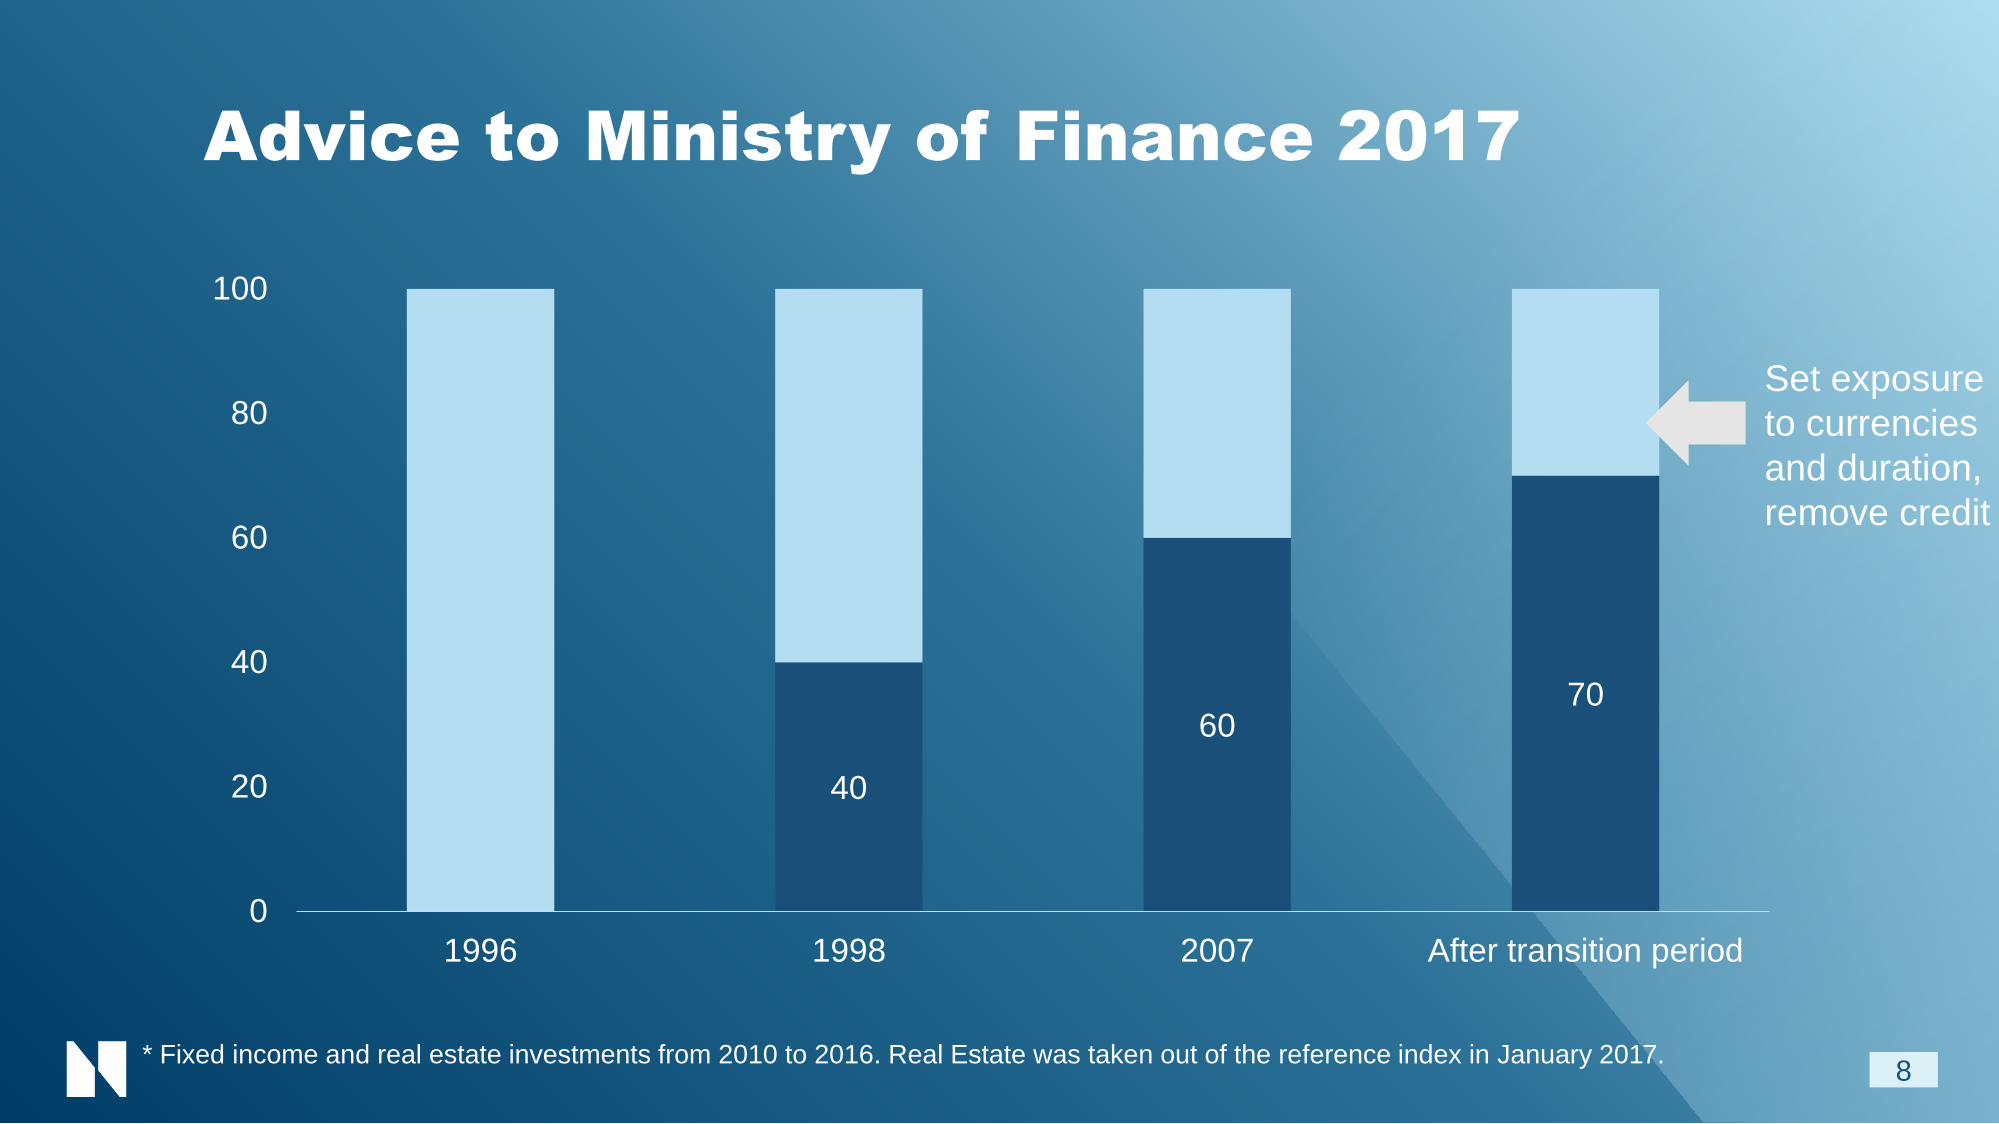
Advice to Ministry of Finance 2017
8
40
6070
0
20
40
60
80
100
1996 1998 2007 After transition period
* Fixed income and real estate investments from 2010 to 2016. Real Estate was taken out of the reference index in January 2017.
Set exposure
to currencies
and duration,
remove credit
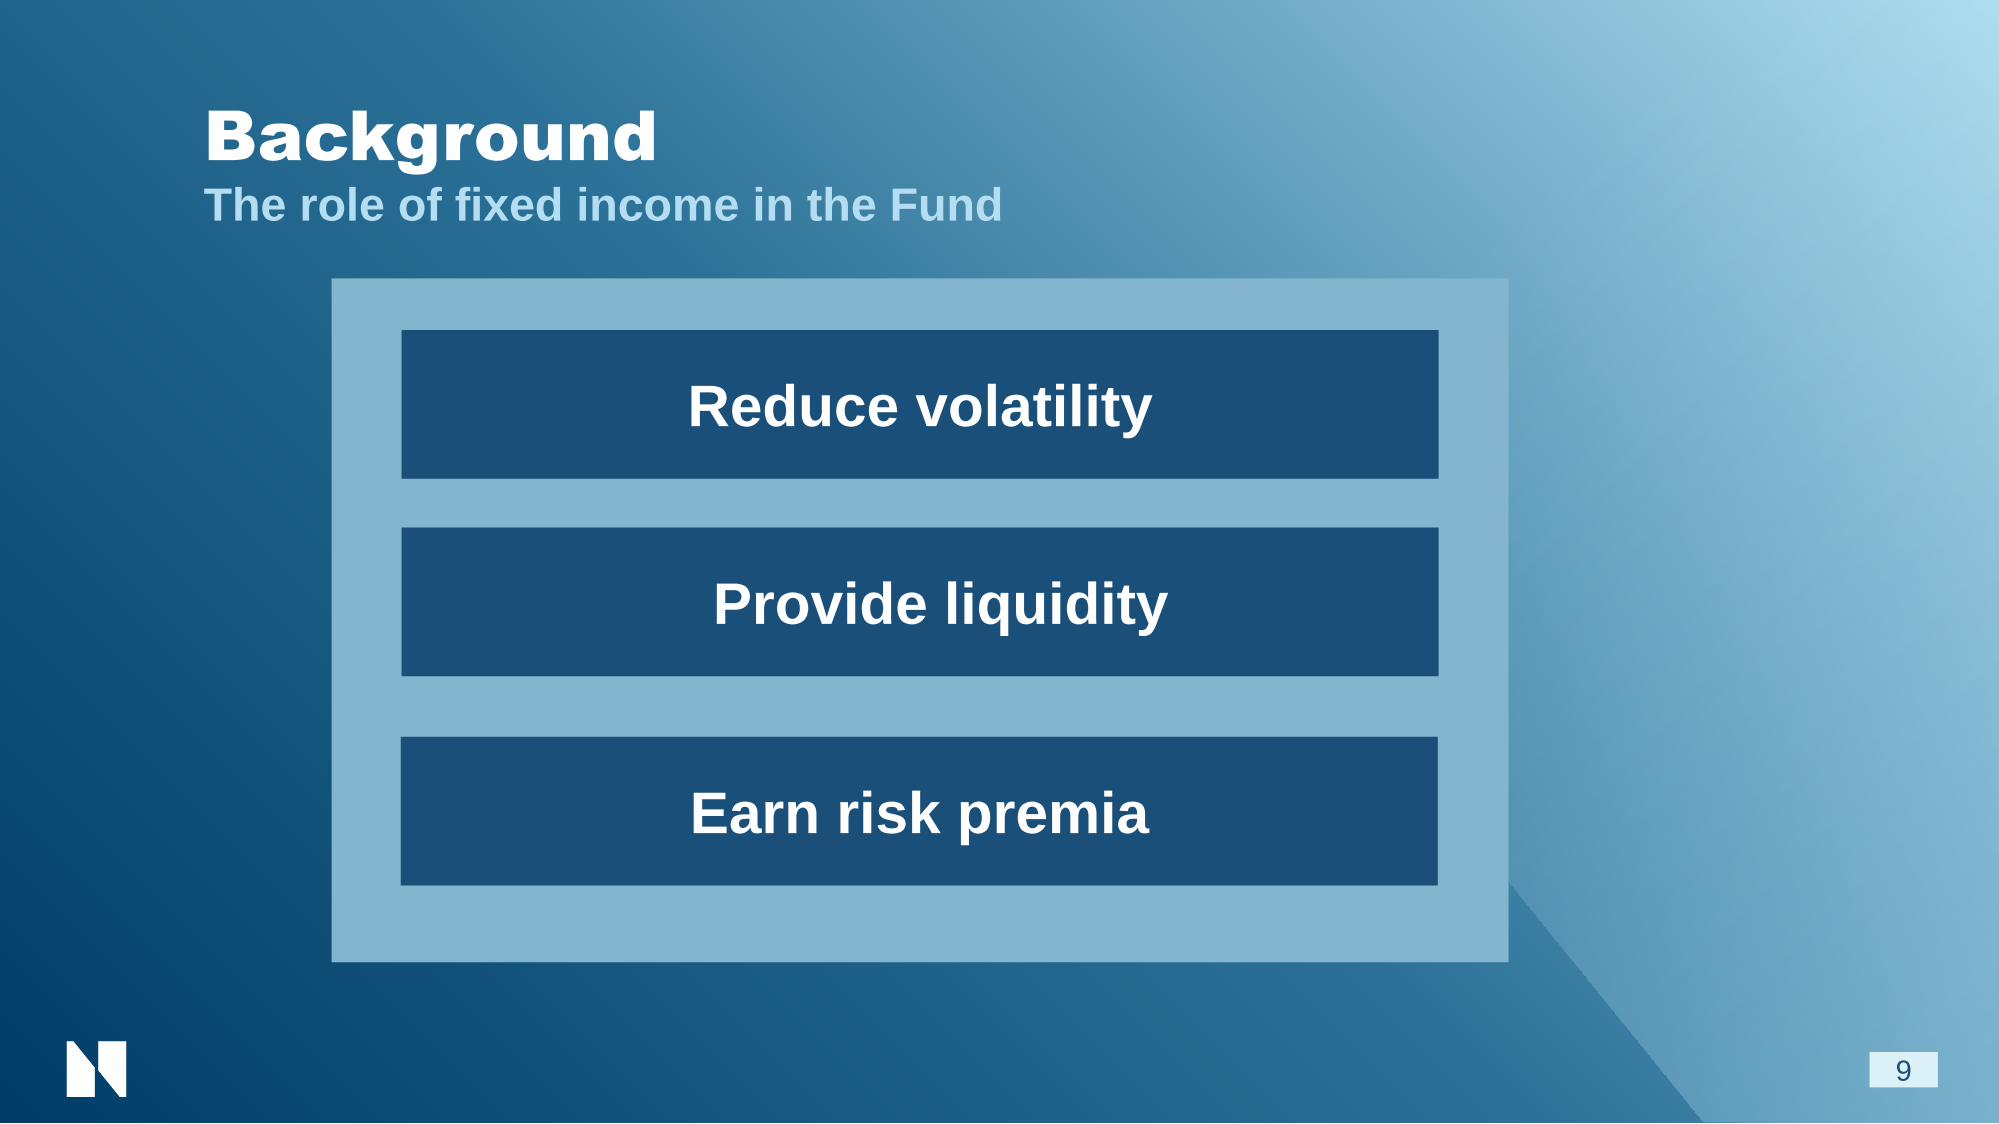
BackgroundThe role of fixed income in the Fund
9
Reduce volatility
Earn risk premia
Provide liquidity
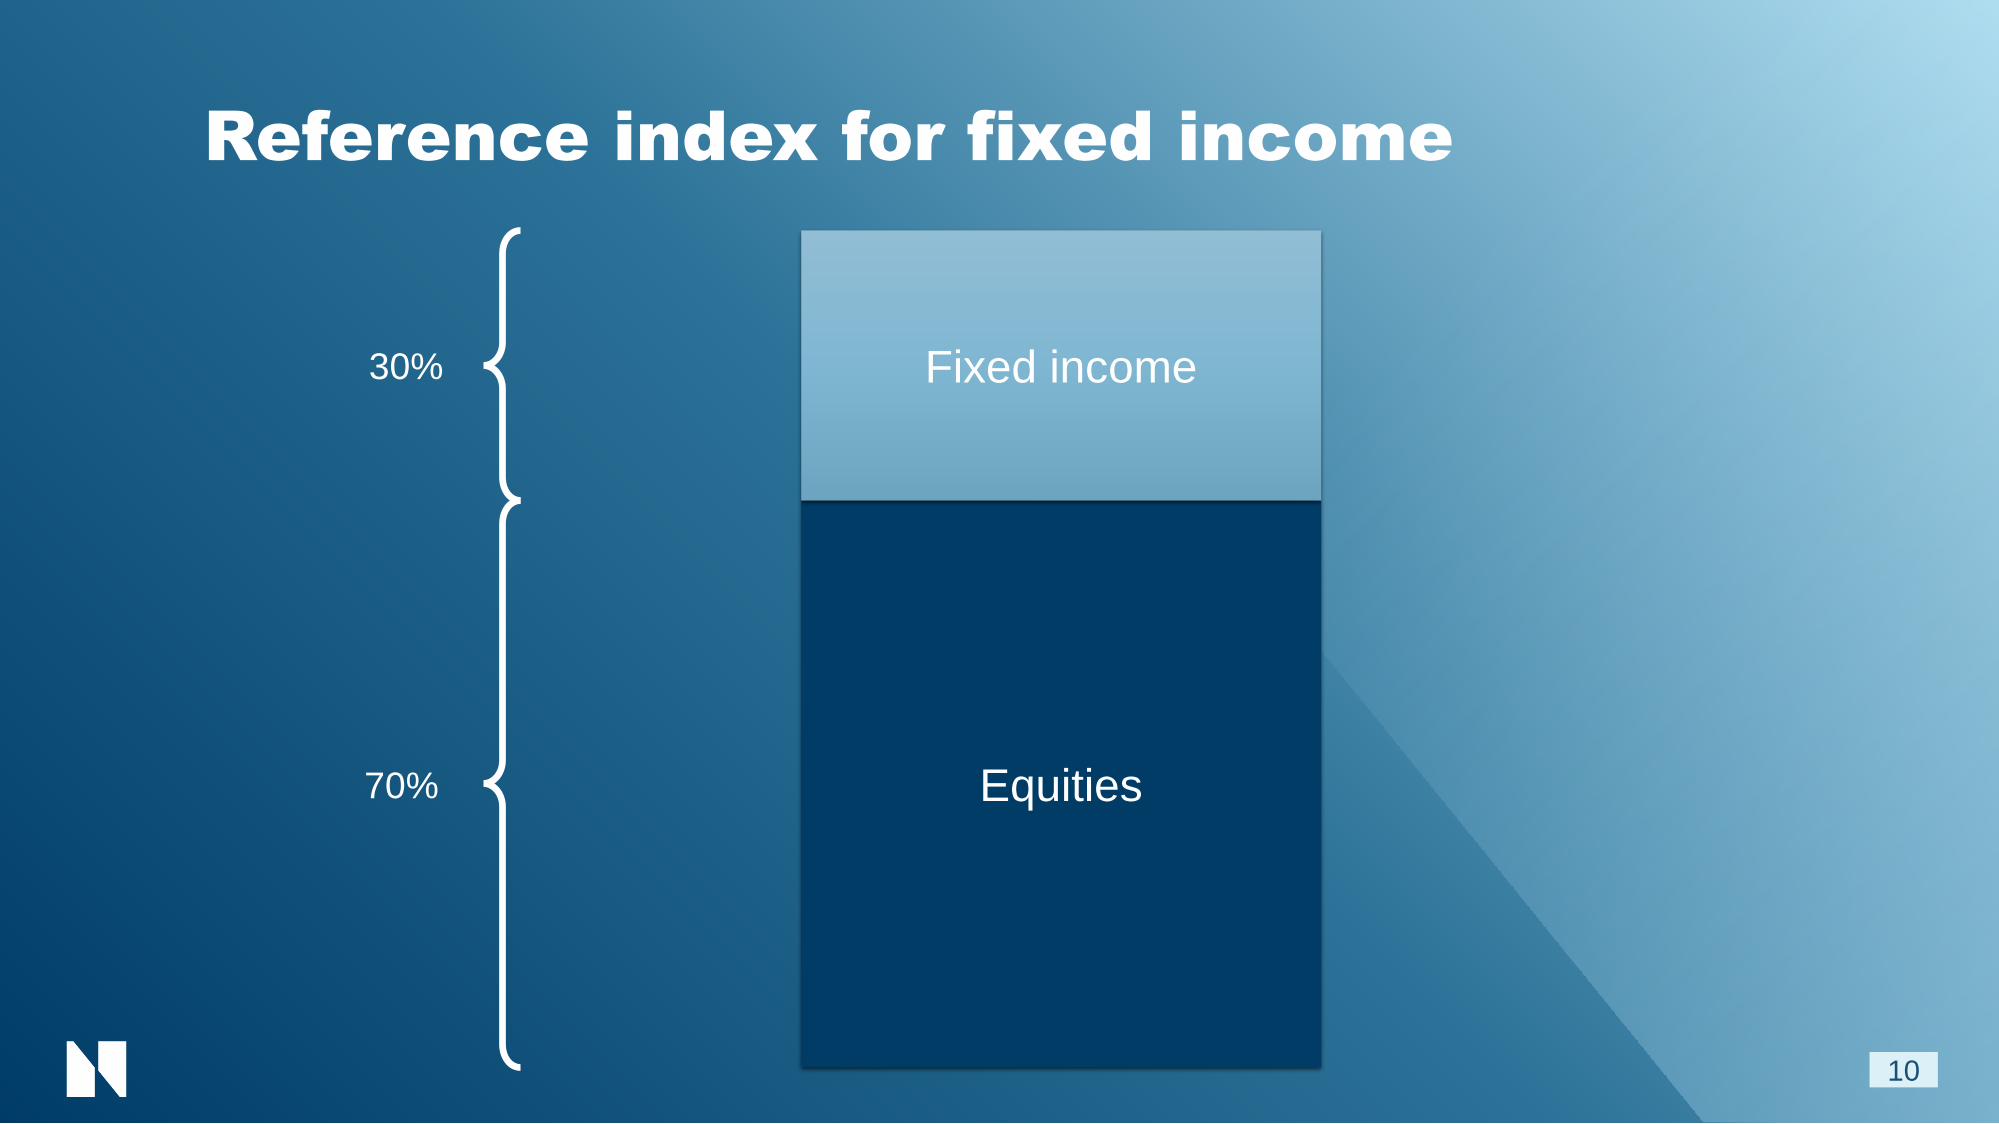
Reference index for fixed income
10
Equities
Fixed income30%
70%

Reference index for fixed income
11
Equities
Government30%
70%
Corporate30%
70%

Reference index for fixed income
12
Equities
Bloomberg GDP Govt
30%
70%
Bloomberg Index-linked
Bloomberg Credit
• Investability factors
• Selected currencies30%
70%

Currency distribution
13
0%
25%
50%
75%
100%
2006 2008 2010 2012 2014 2016
USD EUR GBP JPY Other
Government bonds in the reference index
Source: Barclays, NBIM.
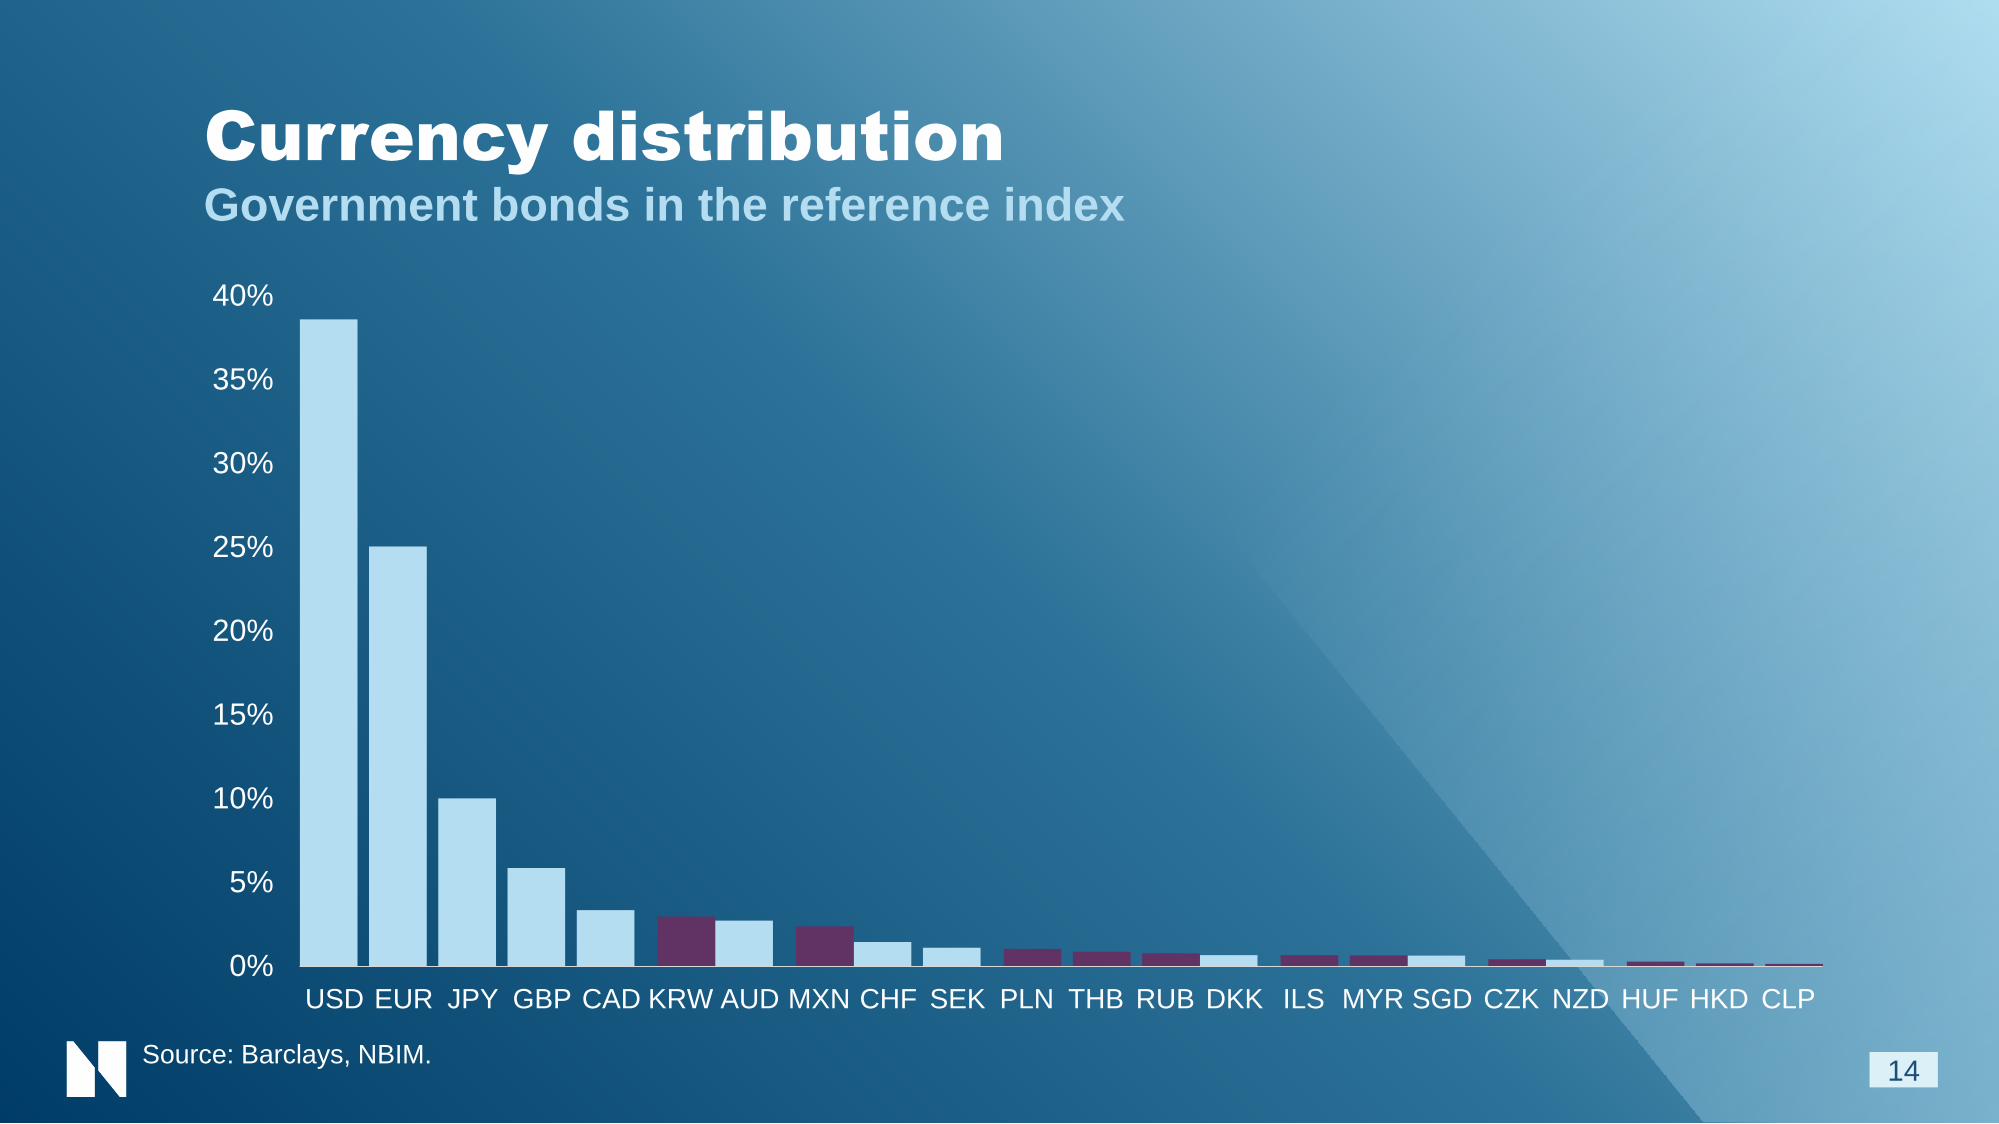
Currency distributionGovernment bonds in the reference index
14
0%
5%
10%
15%
20%
25%
30%
35%
40%
USD EUR JPY GBP CAD KRW AUD MXN CHF SEK PLN THB RUB DKK ILS MYR SGD CZK NZD HUF HKD CLP
Source: Barclays, NBIM.
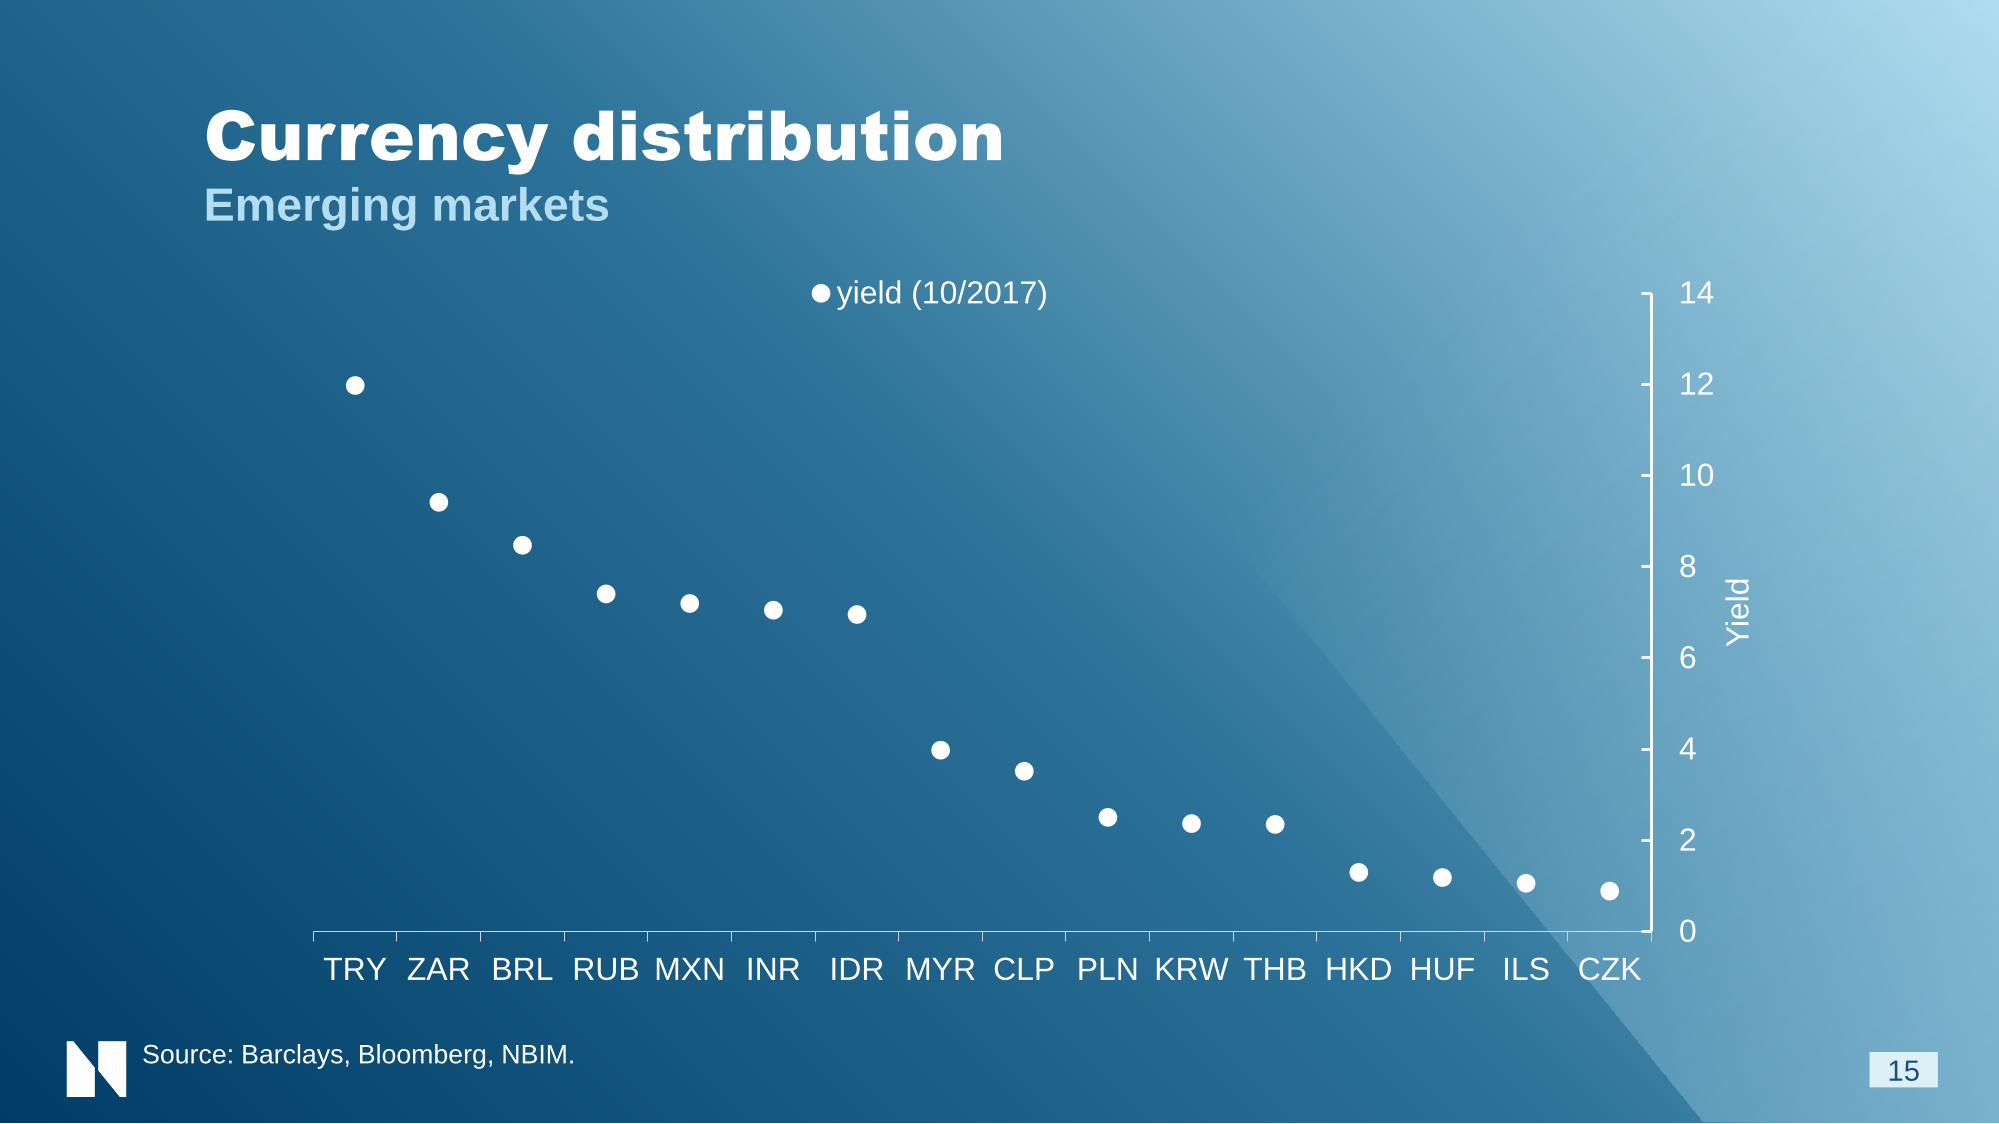
Currency distribution
TRY ZAR BRL RUB MXN INR IDR MYR CLP PLN KRW THB HKD HUF ILS CZK
0
2
4
6
8
10
12
14
Yie
ld
yield (10/2017)
Emerging markets
15Source: Barclays, Bloomberg, NBIM.

Currency distribution
0
2
4
6
8
10
12
14
0
10
20
30
40
50
60
TRY ZAR BRL RUB MXN INR IDR MYR CLP PLN KRW THB HKD HUF ILS CZK
Yie
ld
Bn
NO
K
Current Index yield (10/2017)
Emerging markets
16Source: Barclays, Bloomberg, NBIM.

DurationBarclays Global Aggregate – Treasuries
17
4
5
6
7
8
9
1990 1993 1996 1999 2002 2005 2008 2011 2014 2017
Dura
tion
Source: Barclays, Bloomberg.

4
6
8
10
12
14
16
18
1 2 3 4 5 6 7 8 9 10 11 12 13 14 15 16
Port
folio
vola
tilit
y, p
er
cent
EQ-FI correlation 0.7
Duration
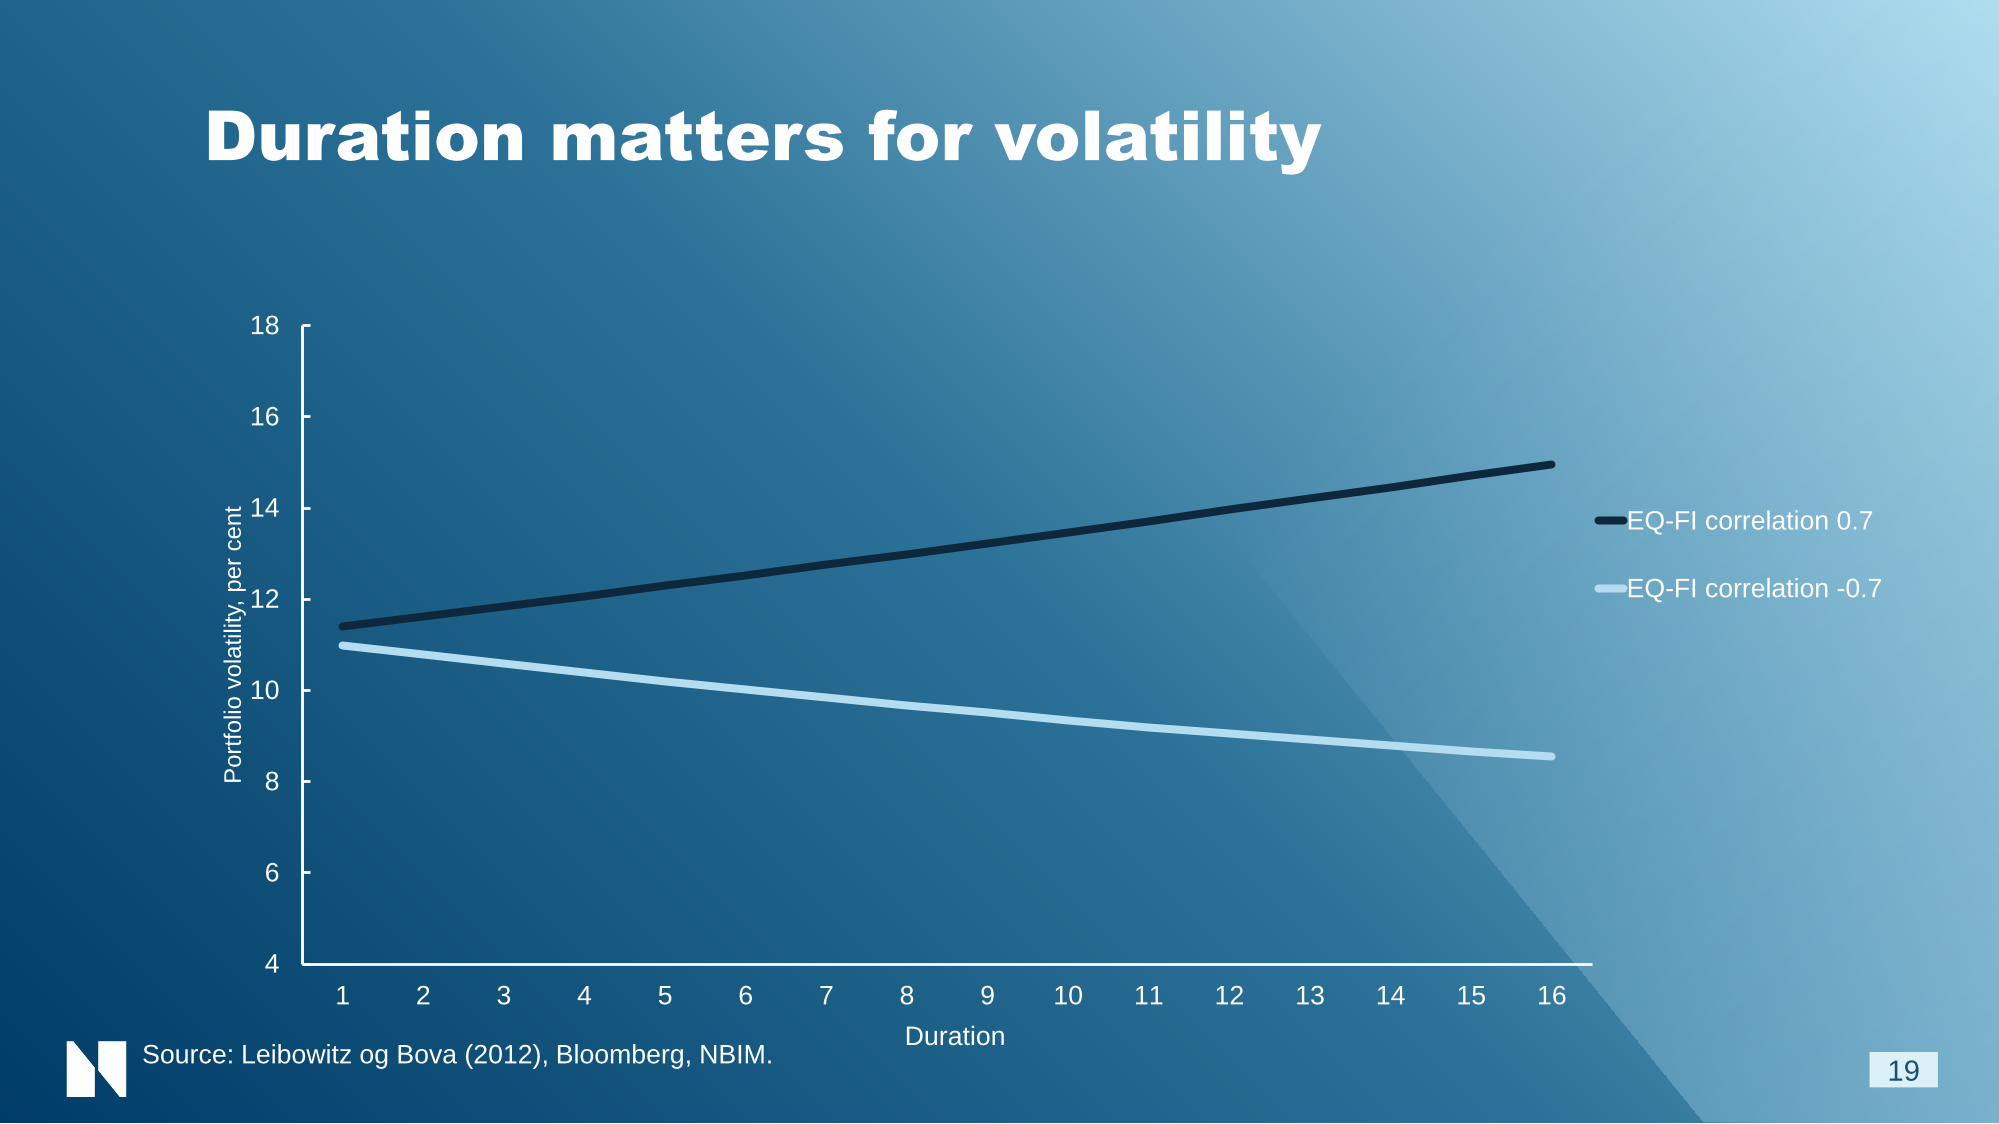
Duration matters for volatility
18Source: Leibowitz og Bova (2012), Bloomberg, NBIM.
4
6
8
10
12
14
16
18
1 2 3 4 5 6 7 8 9 10 11 12 13 14 15 16
Port
folio
vola
tilit
y, p
er
cent
EQ-FI correlation 0.7
EQ-FI correlation -0.7
Duration
Duration matters for volatility
19Source: Leibowitz og Bova (2012), Bloomberg, NBIM.
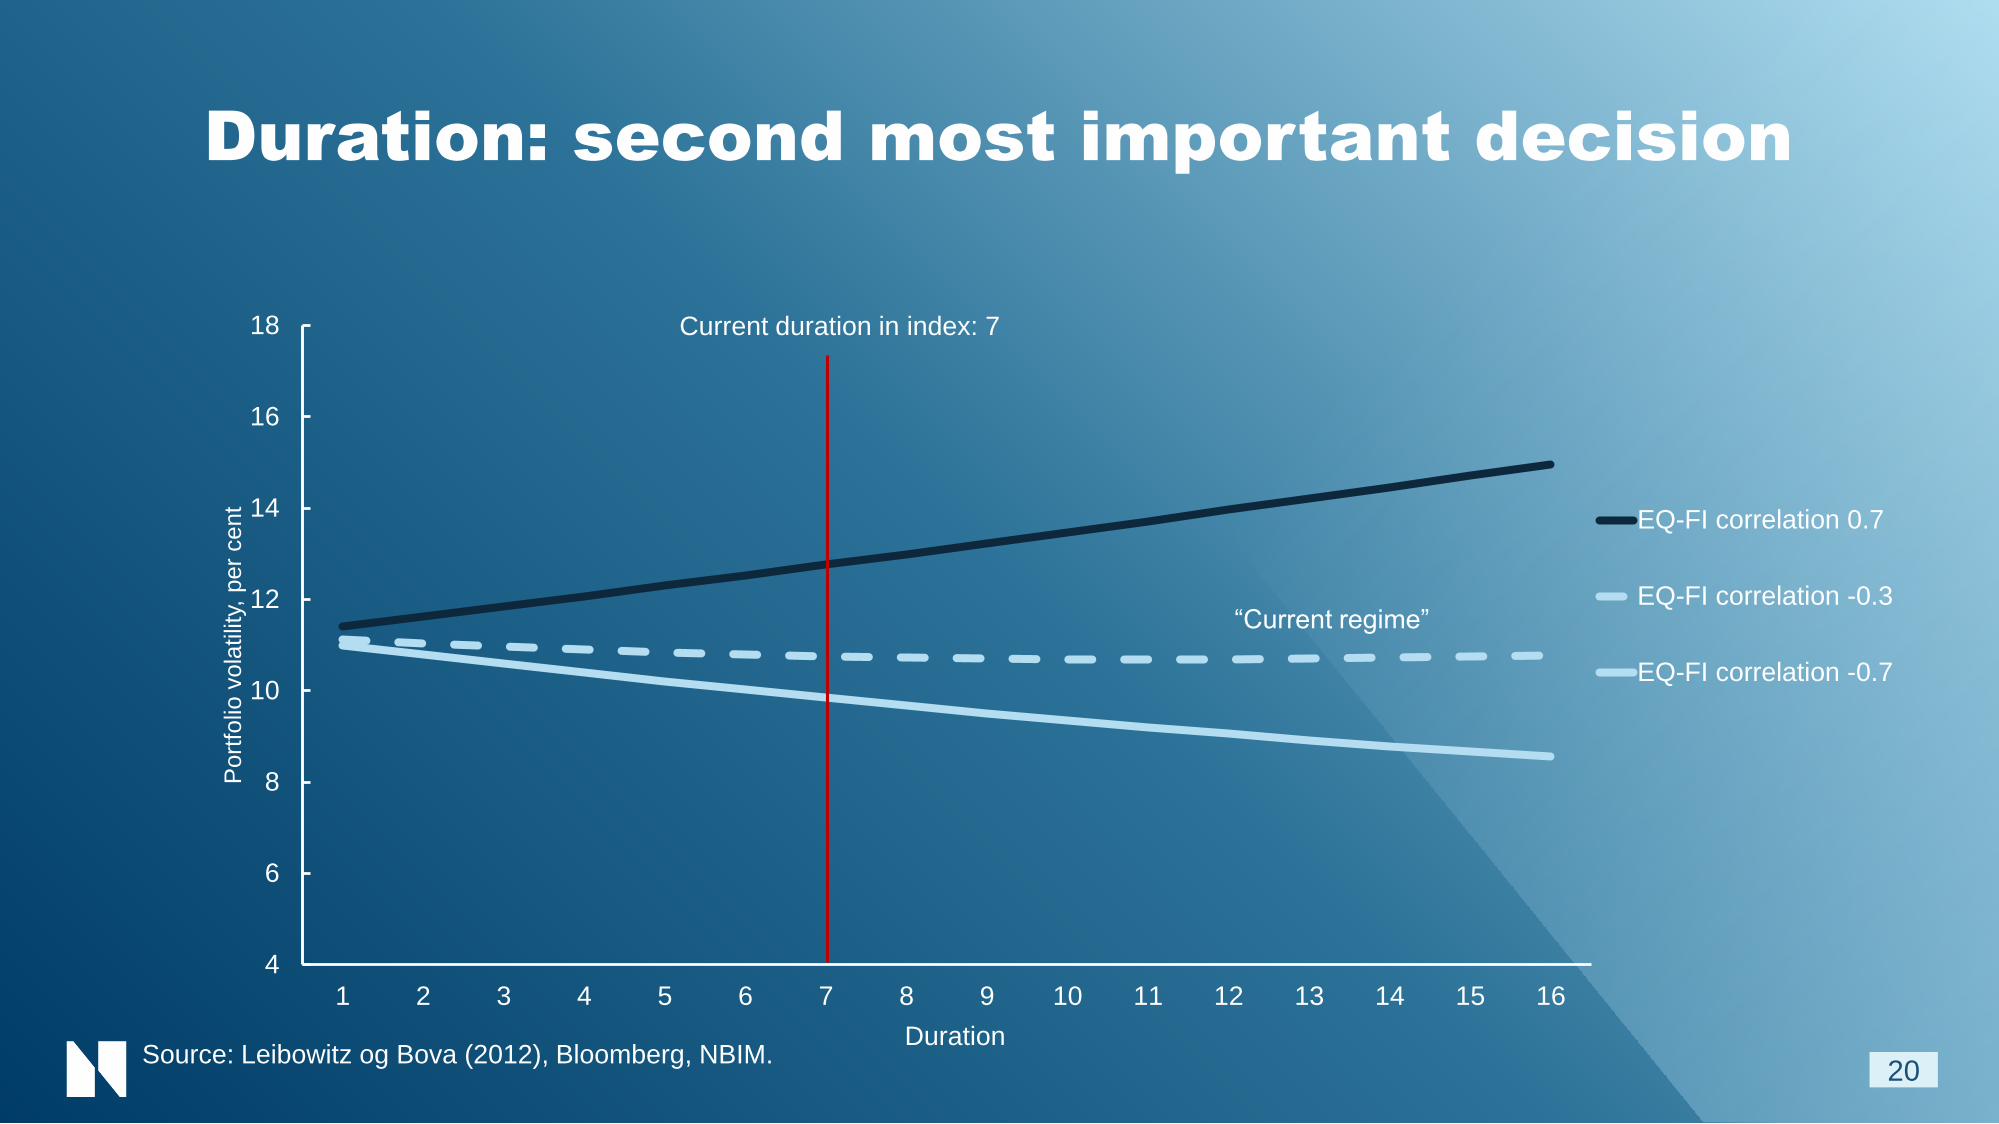
4
6
8
10
12
14
16
18
1 2 3 4 5 6 7 8 9 10 11 12 13 14 15 16
Port
folio
vola
tilit
y, p
er
cent
EQ-FI correlation 0.7
EQ-FI correlation -0.3
EQ-FI correlation -0.7
Duration
Duration: second most important decision
20
Current duration in index: 7
“Current regime”
Source: Leibowitz og Bova (2012), Bloomberg, NBIM.

Credit qualityBarclays Global Aggregate – Corporates
21
8% 7%1%
28%24%
9%
42%44%
41%
22% 25%
49%
0%
20%
40%
60%
80%
100%
12/31/1999 12/31/2005 12/31/2017
Baa
A
Aa
Aaa
Source: Barclays, Bloomberg.
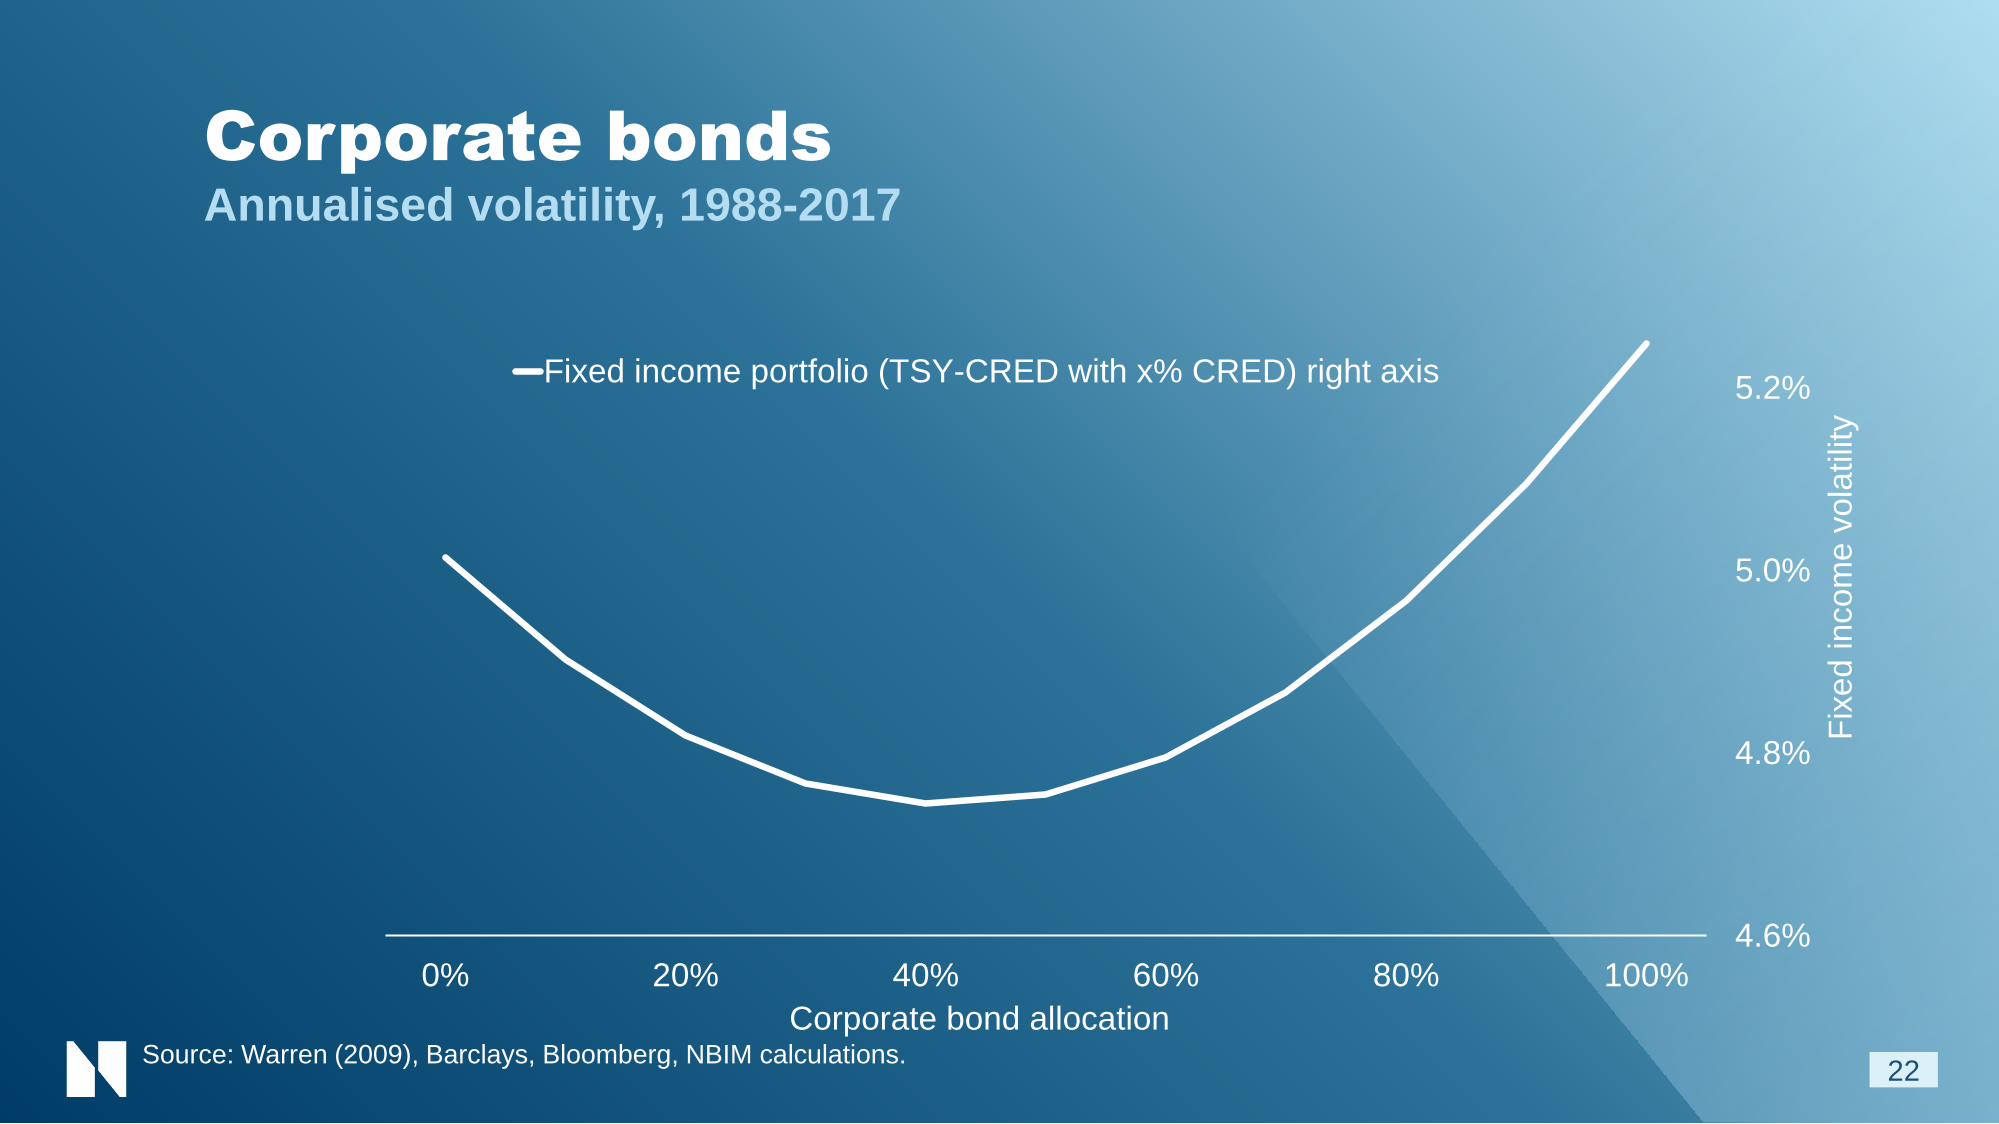
Corporate bondsAnnualised volatility, 1988-2017
22
4.6%
4.8%
5.0%
5.2%
0% 20% 40% 60% 80% 100%
Fix
ed
incom
e v
ola
tilit
y
Corporate bond allocation
Fixed income portfolio (TSY-CRED with x% CRED) right axis
Source: Warren (2009), Barclays, Bloomberg, NBIM calculations.

Corporate bondsAnnualised volatility, 1988-2017
23
4.6%
4.8%
5.0%
5.2%
10.0%
10.2%
10.4%
10.6%
0% 20% 40% 60% 80% 100%
Fix
ed
incom
e v
ola
tilit
y
Multi-asse
t vola
tilit
y
Corporate bond allocation
Multi-asset portfolio (70/30 EQ-FI with x% CRED in FI) left axis
Fixed income portfolio (TSY-CRED with x% CRED) right axis
Source: Warren (2009), Barclays, Bloomberg, NBIM calculations.

Advice to Ministry of Finance 2017
24
40
6070
0
20
40
60
80
100
1996 1998 2007 After transition period
* Fixed income and real estate investments from 2010 to 2016. Real Estate was taken out of the reference index in January 2017.
Set exposure
to currencies
and duration,
remove credit

Advice to Ministry of Finance 2017
25
40
6070
0
20
40
60
80
100
1996 1998 2007 After transition period
* Fixed income and real estate investments from 2010 to 2016. Real Estate was taken out of the reference index in January 2017.
Remove oil &
gas stocks

BackgroundNBIM’s strategy plan 2017 – 2019
26

Reference index for equities
27
FTSE Global All-Cap
Fixed income30%
70%• Regional factors
• Exclusions

0
2,000
4,000
6,000
8,000
10,000
2006 2017
Value of oil and gas in the ground Fund`s value
The fund makes up 2/3 of petroleum wealth
28All numbers NOK bn.
Source: Ministry of Finance, NBIM
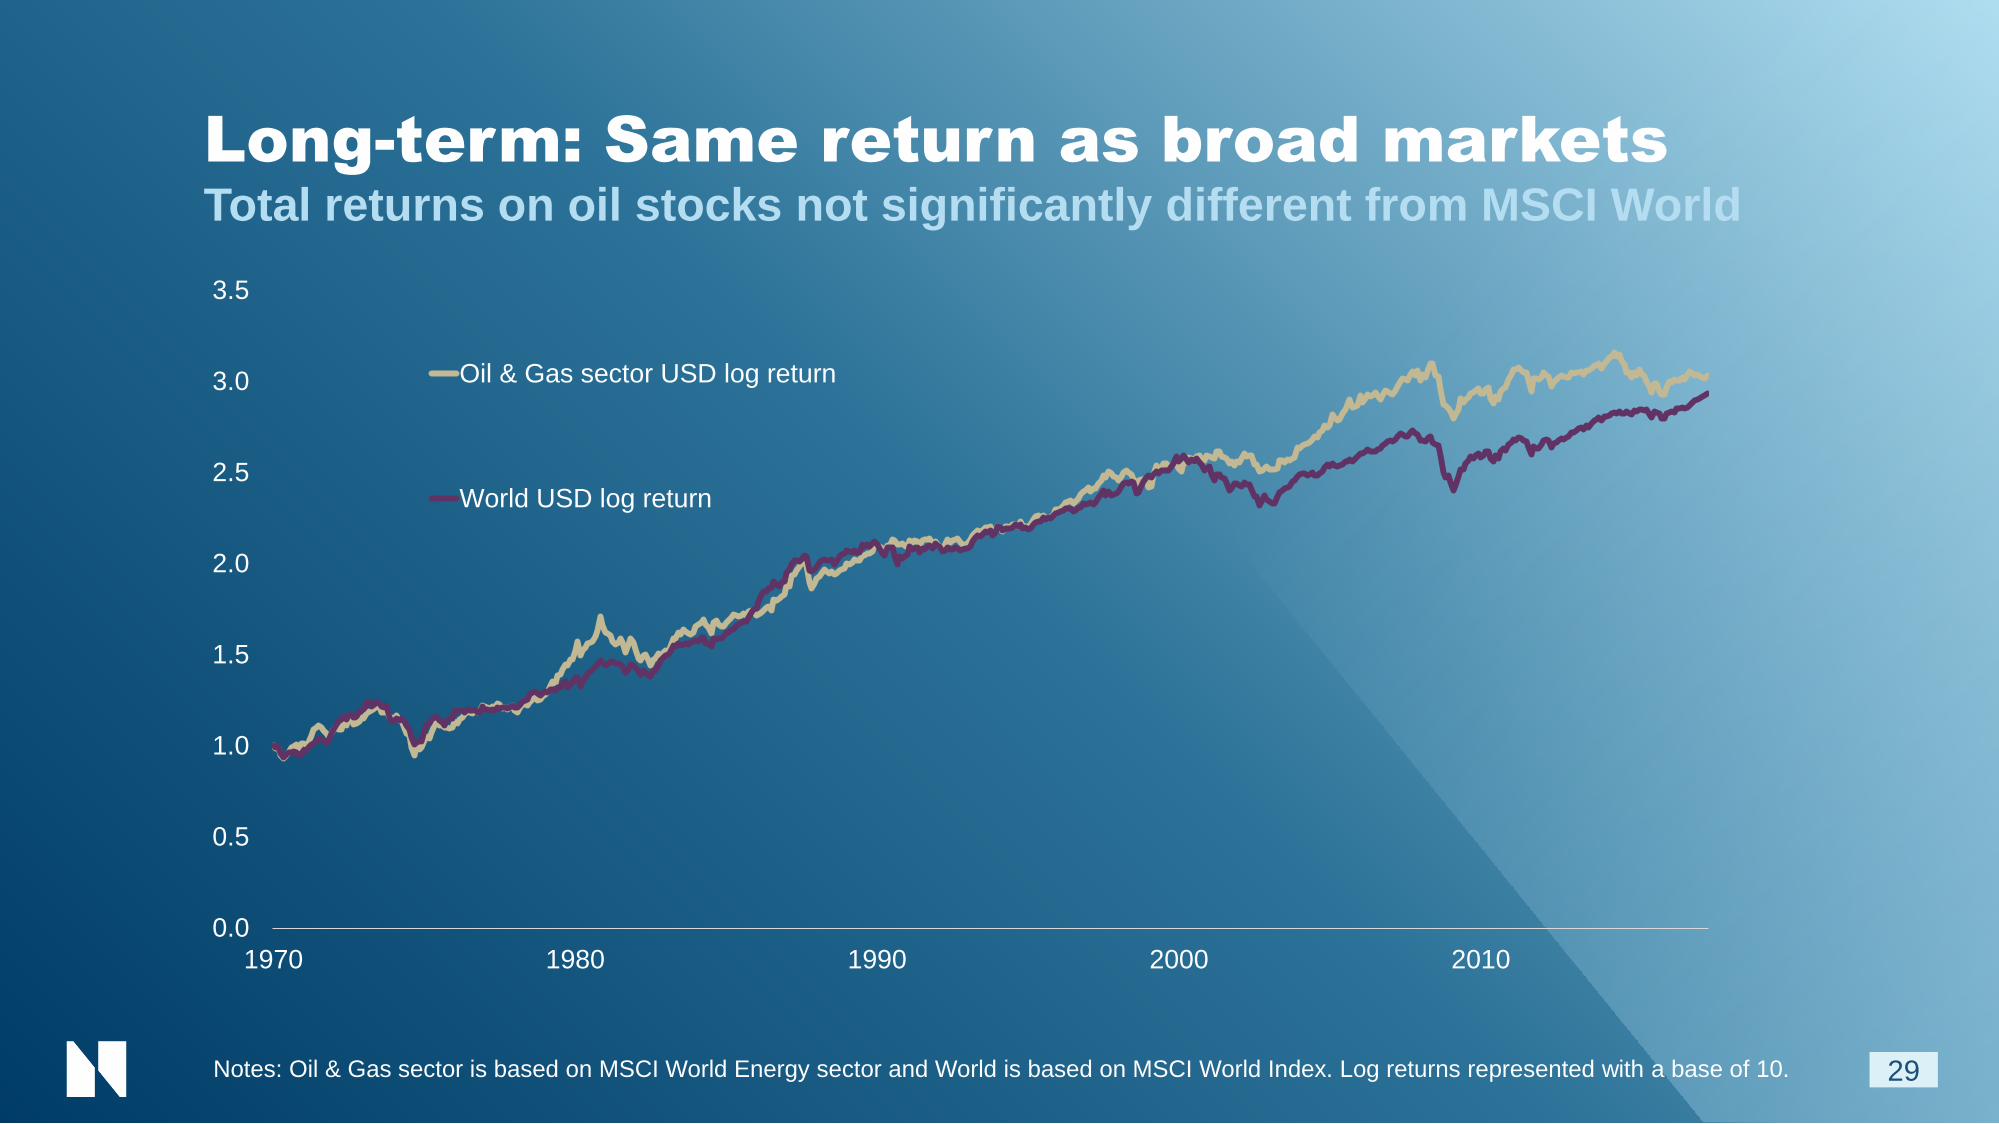
Long-term: Same return as broad marketsTotal returns on oil stocks not significantly different from MSCI World
29Notes: Oil & Gas sector is based on MSCI World Energy sector and World is based on MSCI World Index. Log returns represented with a base of 10.
0.0
0.5
1.0
1.5
2.0
2.5
3.0
3.5
1970 1980 1990 2000 2010
Oil & Gas sector USD log return
World USD log return
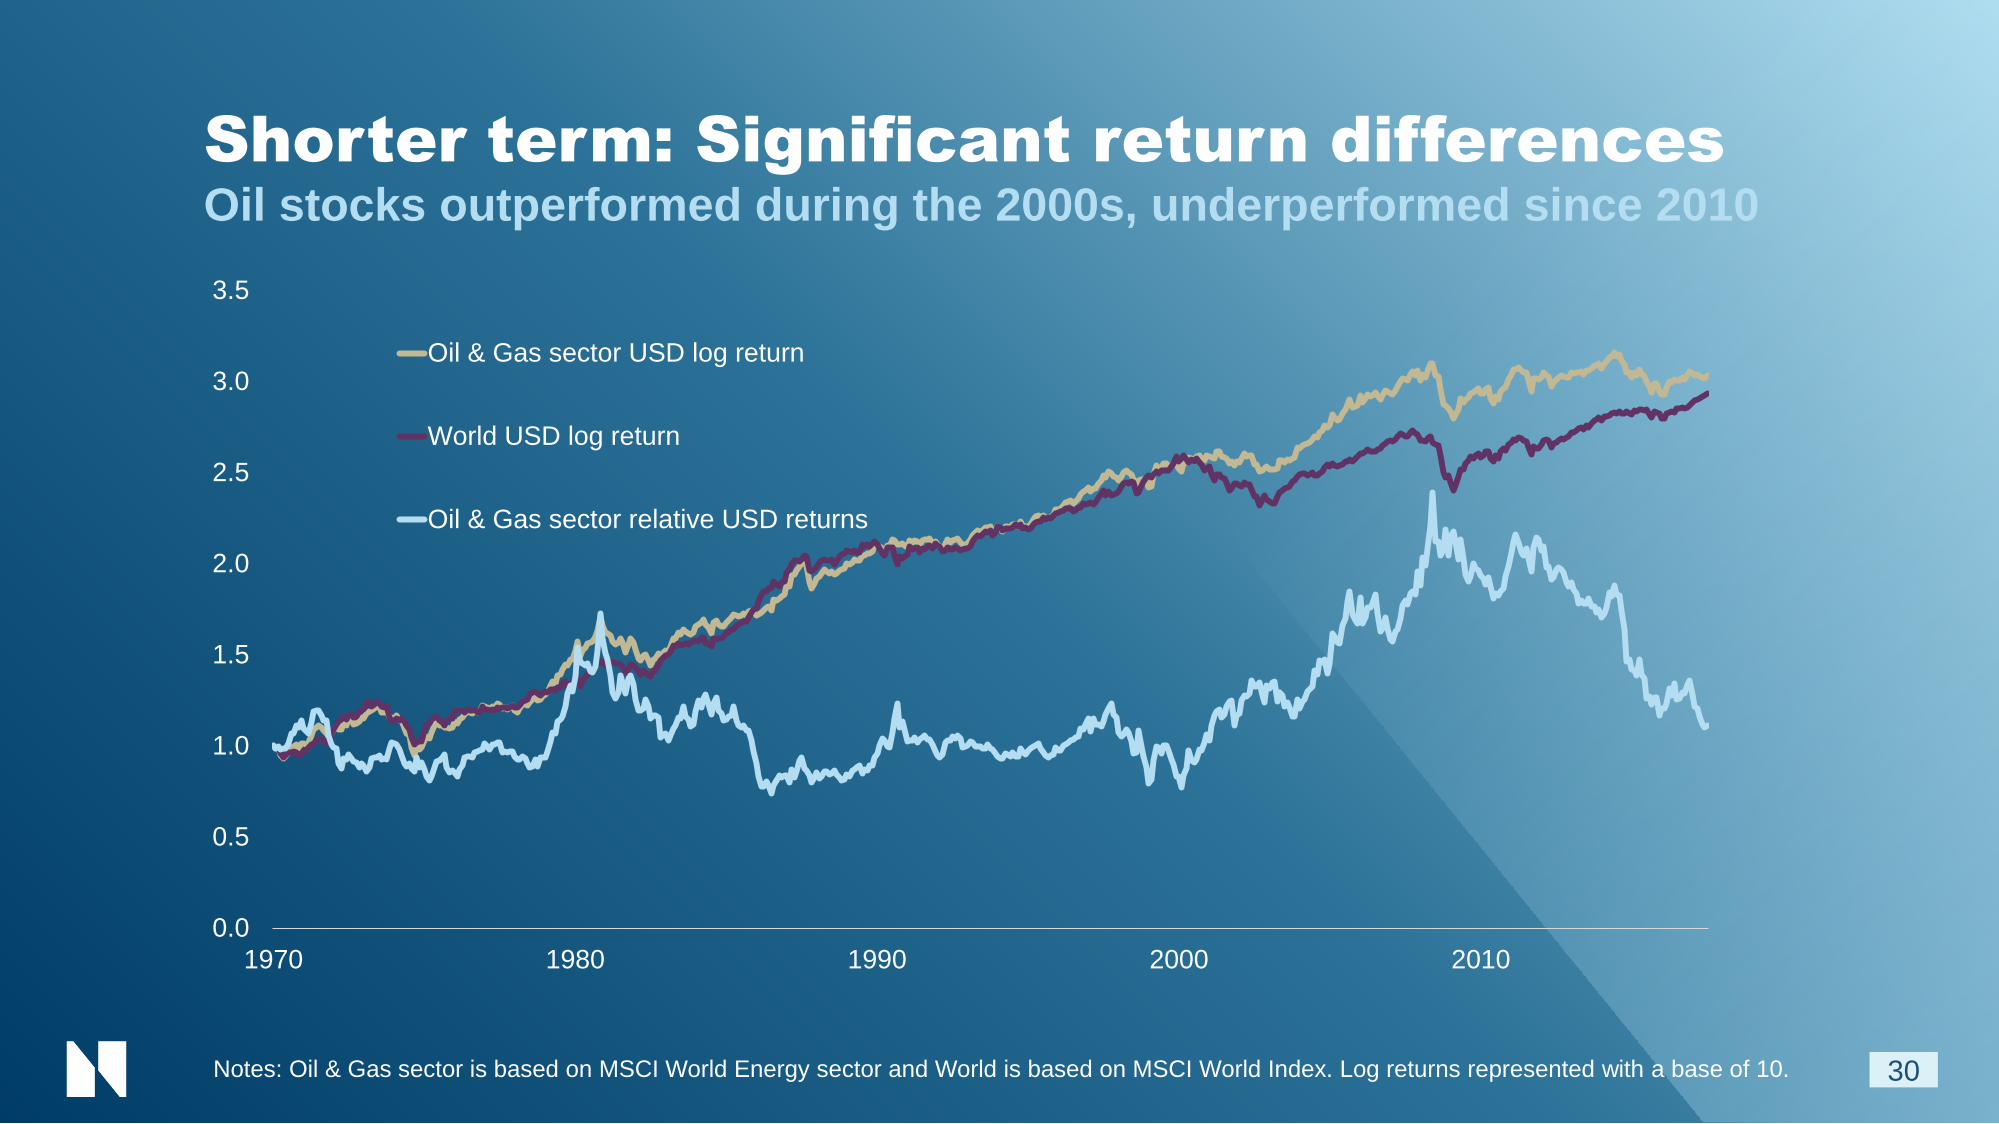
0.0
0.5
1.0
1.5
2.0
2.5
3.0
3.5
1970 1980 1990 2000 2010
Oil & Gas sector USD log return
World USD log return
Oil & Gas sector relative USD returns
Shorter term: Significant return differencesOil stocks outperformed during the 2000s, underperformed since 2010
30Notes: Oil & Gas sector is based on MSCI World Energy sector and World is based on MSCI World Index. Log returns represented with a base of 10.

Return differentials driven by oil price… Investing in oil stocks add oil price risk
31
-40
0
40
80
120
160
0.0
0.5
1.0
1.5
2.0
2.5
3.0
3.5
1970 1980 1990 2000 2010
Oil & Gas sector USD log return
World USD log return
Oil & Gas sector relative USD returns
Oil price (WTI, RHS)
Notes: Oil & Gas sector is based on MSCI World Energy sector and World is based on MSCI World Index. Log returns represented with a base of 10.

…also longer term10-year returns relative to equity market vs. 10-year change in real oil price
32
-10%
0%
10%
20%
-5%
0%
5%
10%
15%
1979 1984 1989 1994 1999 2004 2009 2014
Oil & gas sector - Equity market Oil price (rhs)
Equity market refers to MSCI World, Oil & Gas to MSCI World Energy sector, Oil price refers to spot WTI price deflated using the U.S. CPI for all urban
consumers, all series are measured in USD
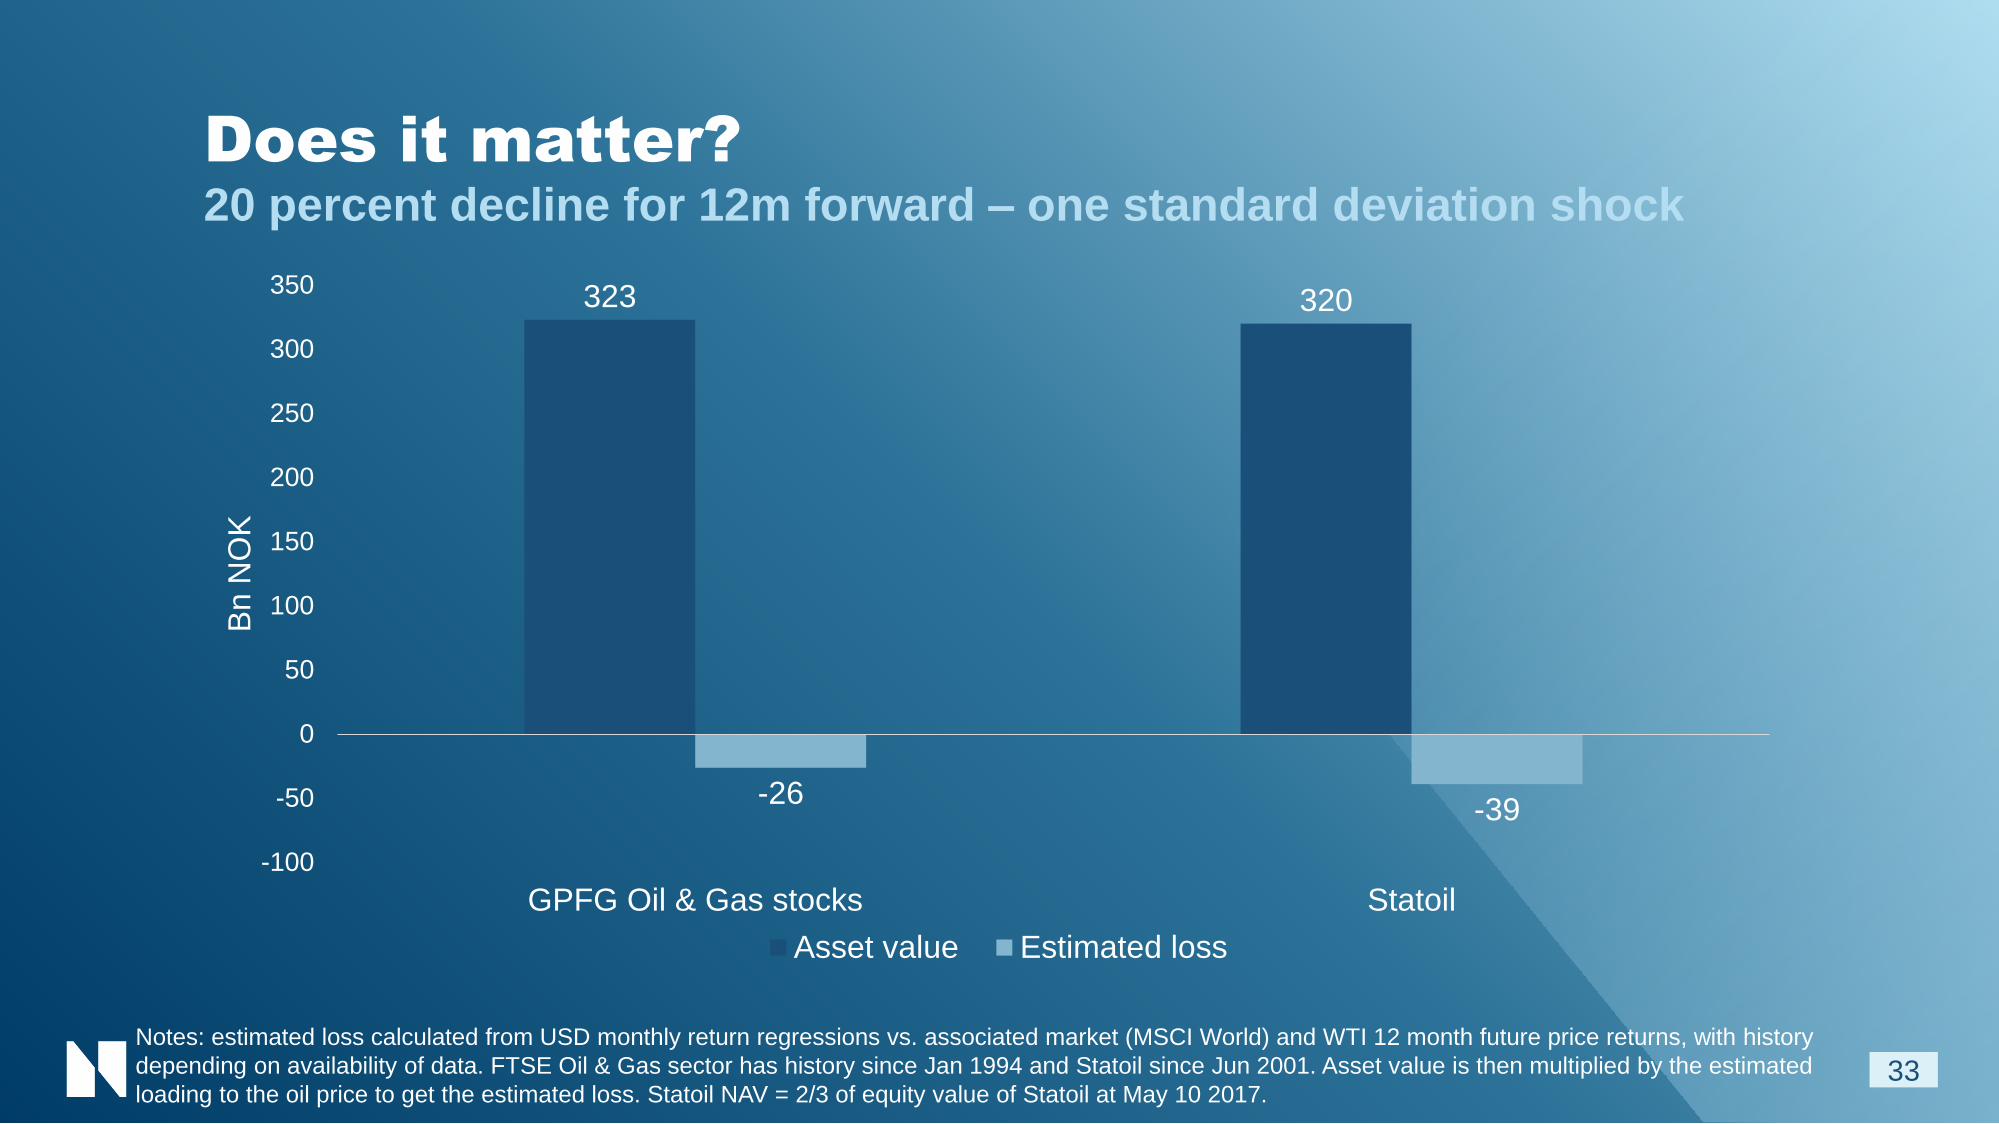
Does it matter?20 percent decline for 12m forward – one standard deviation shock
33
323 320
-26-39
-100
-50
0
50
100
150
200
250
300
350
GPFG Oil & Gas stocks Statoil
Bn N
OK
Asset value Estimated loss
Notes: estimated loss calculated from USD monthly return regressions vs. associated market (MSCI World) and WTI 12 month future price returns, with history
depending on availability of data. FTSE Oil & Gas sector has history since Jan 1994 and Statoil since Jun 2001. Asset value is then multiplied by the estimated
loading to the oil price to get the estimated loss. Statoil NAV = 2/3 of equity value of Statoil at May 10 2017.

Advice to Ministry of Finance 2017
34
40
6070
0
20
40
60
80
100
1996 1998 2007 After transition period
Remove oil &
gas stocks
* Fixed income and real estate investments from 2010 to 2016. Real Estate was taken out of the reference index in January 2017.

Forthcoming advice to Ministry of Finance
40
6070
0
20
40
60
80
100
1996 1998 2007 After transition period
Rebalancing
35* Fixed income and real estate investments from 2010 to 2016. Real Estate was taken out of the reference index in January 2017.
Rebalancing
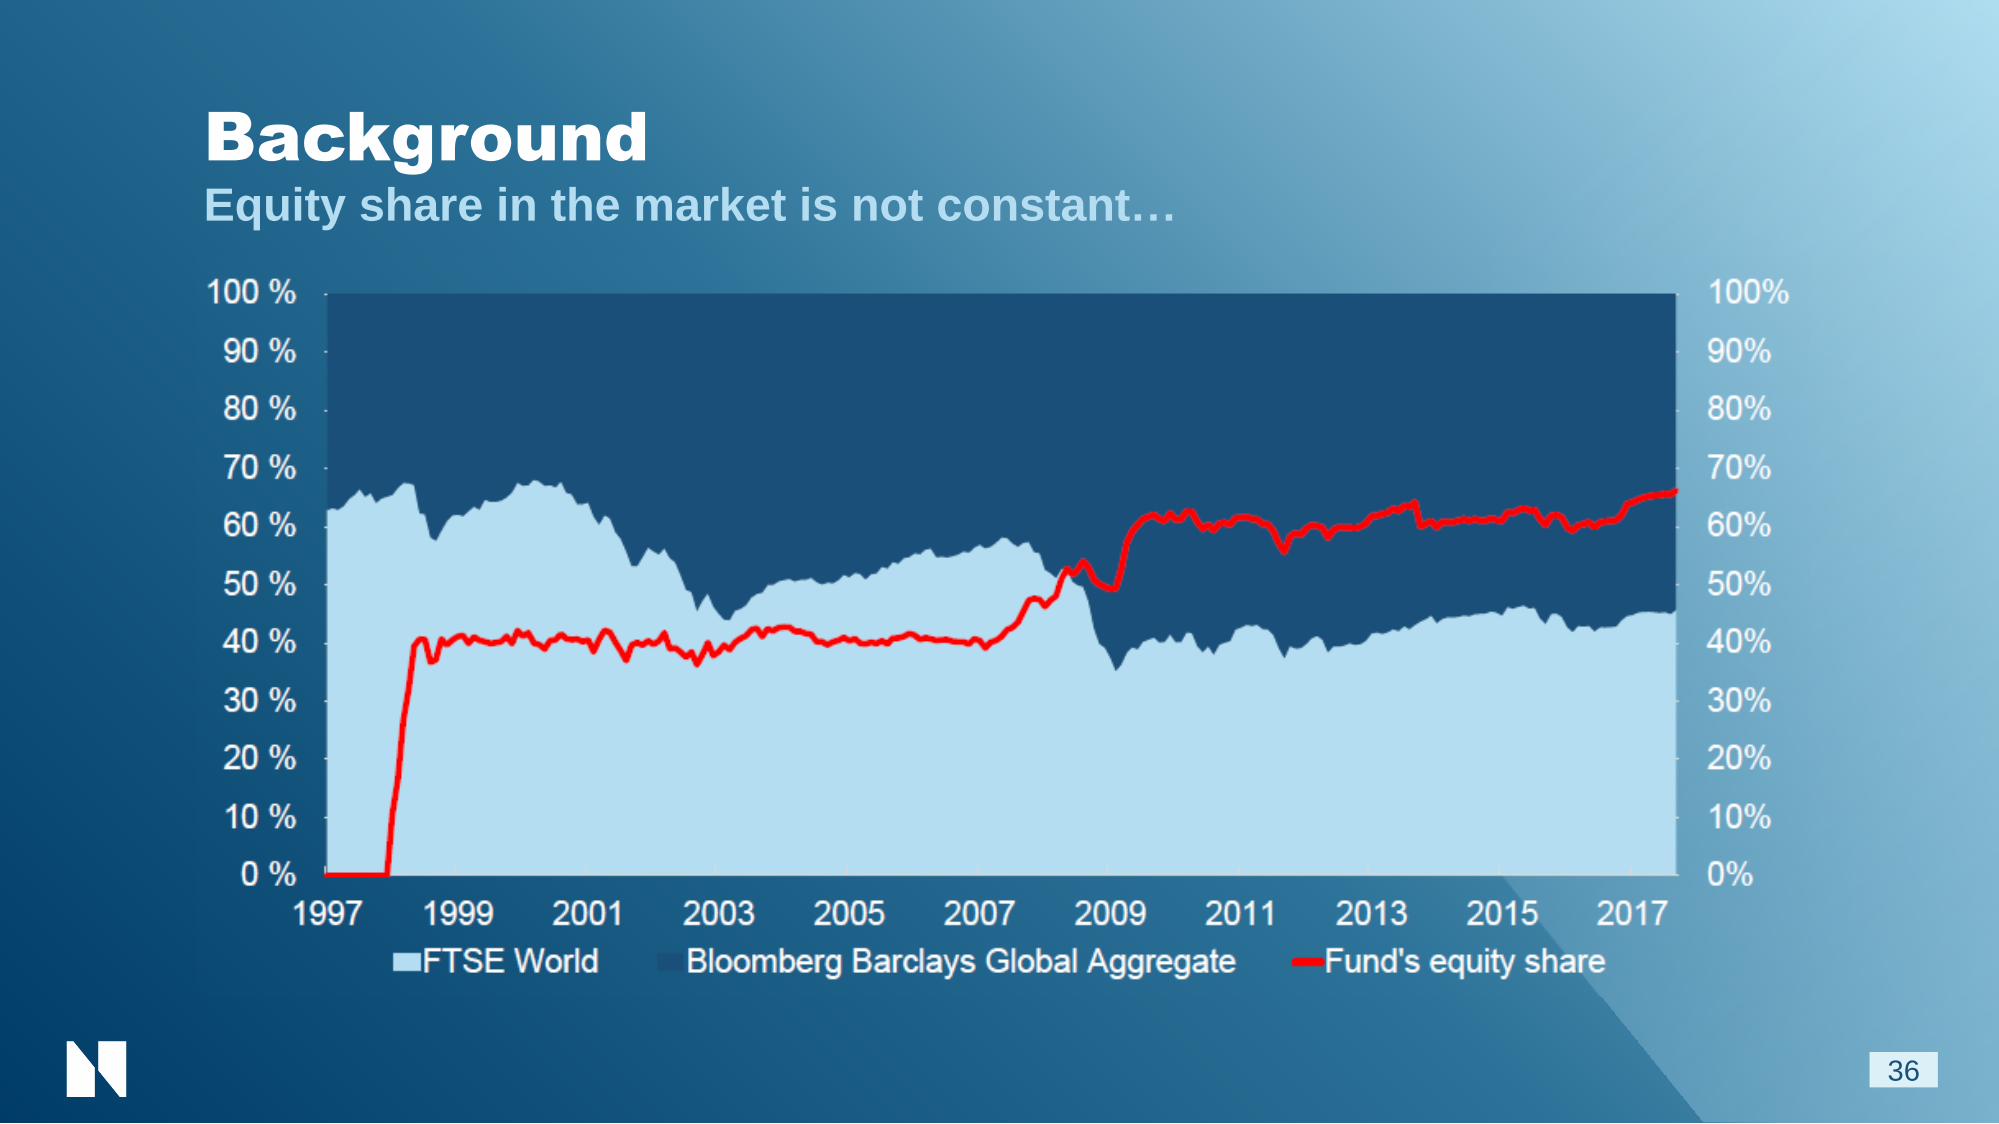
BackgroundEquity share in the market is not constant…
36
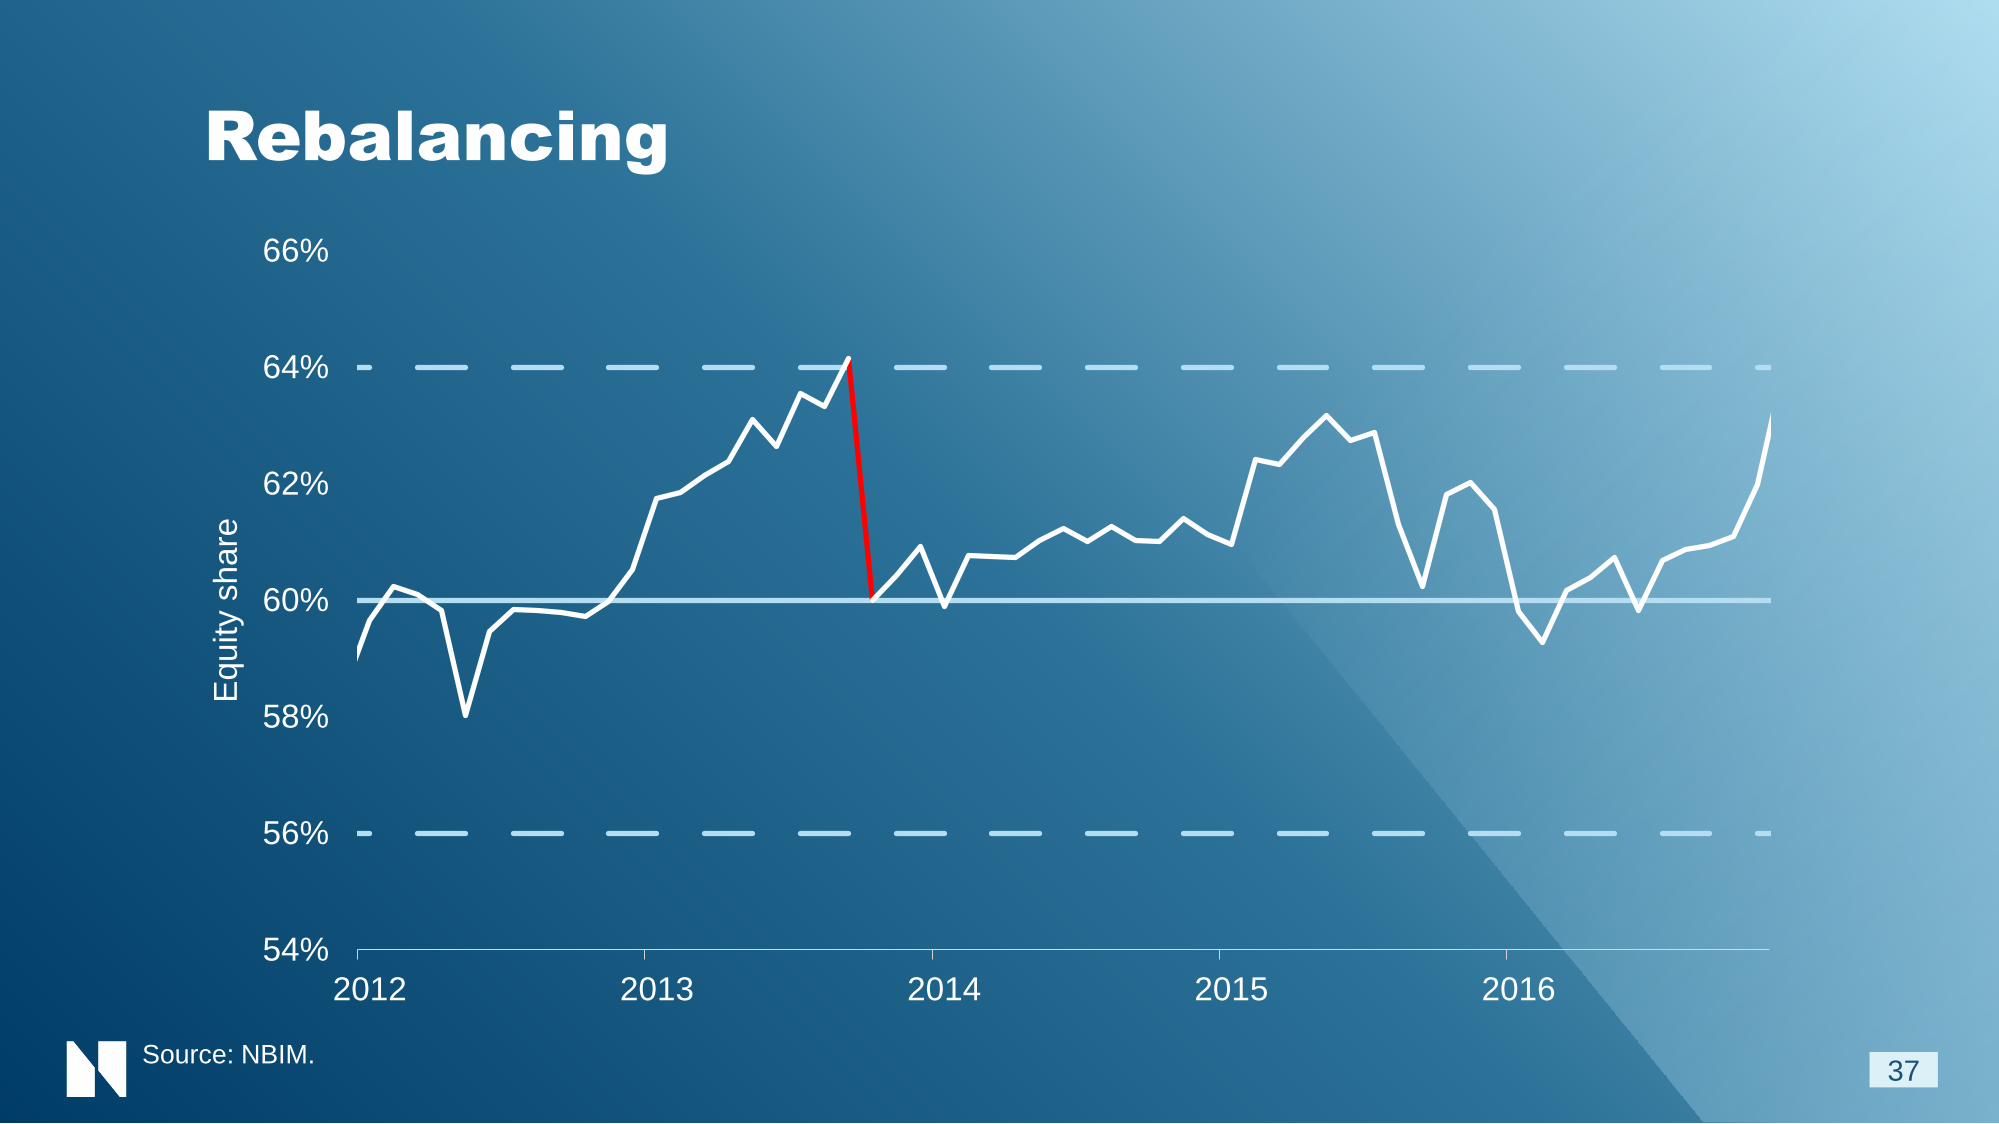
Rebalancing
37
54%
56%
58%
60%
62%
64%
66%
2012 2013 2014 2015 2016
Equ
ity s
ha
re
Source: NBIM.

Summary
38
40
6070
0
20
40
60
80
100
1996 1998 2007 After transition period
* Fixed income and real estate investments from 2010 to 2016. Real Estate was taken out of the reference index in January 2017.
Remove oil &
gas stocks
Set exposure
to currencies
and duration,
remove creditRebalancing

Reference indexAs just described
39
Equities
Fixed income
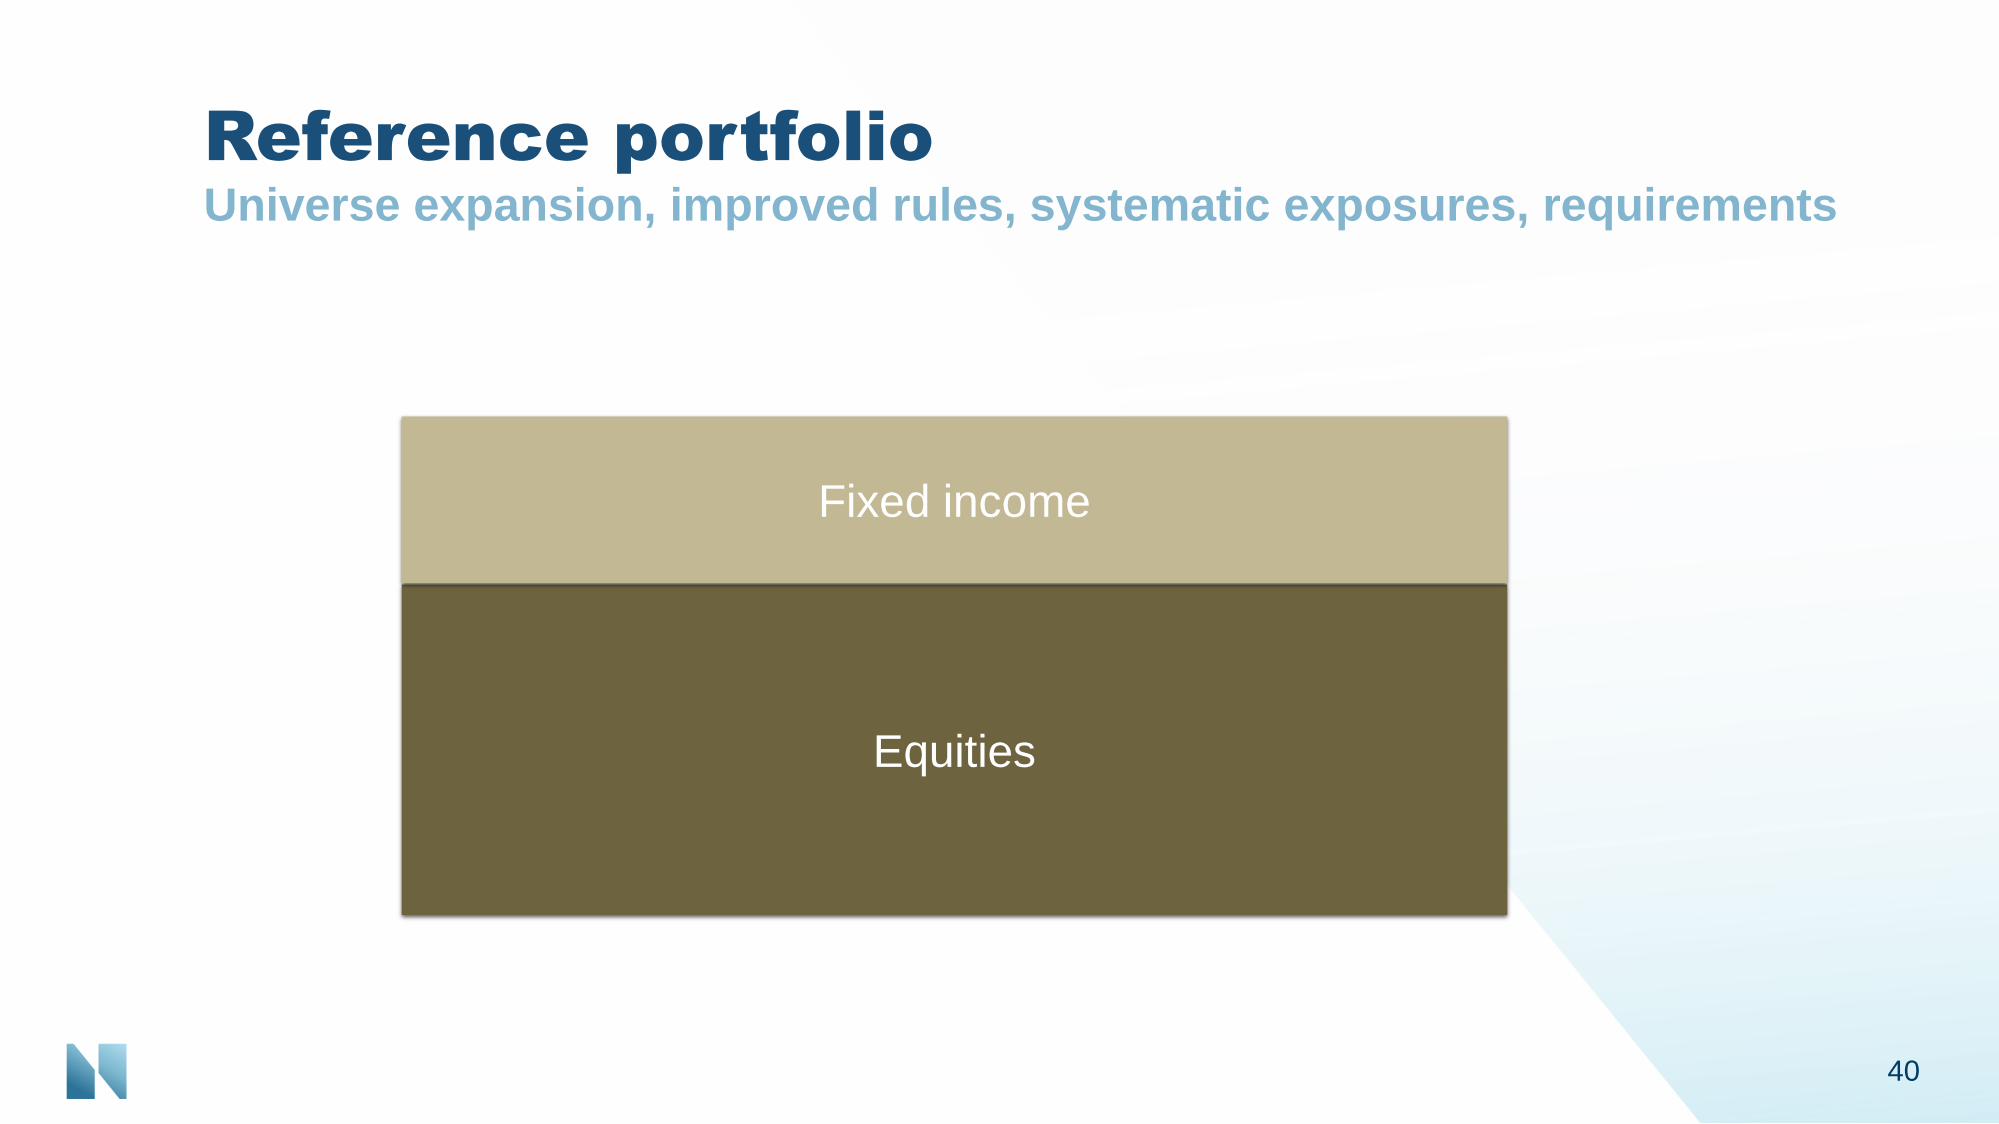
Reference portfolioUniverse expansion, improved rules, systematic exposures, requirements
40
Equities
Fixed income
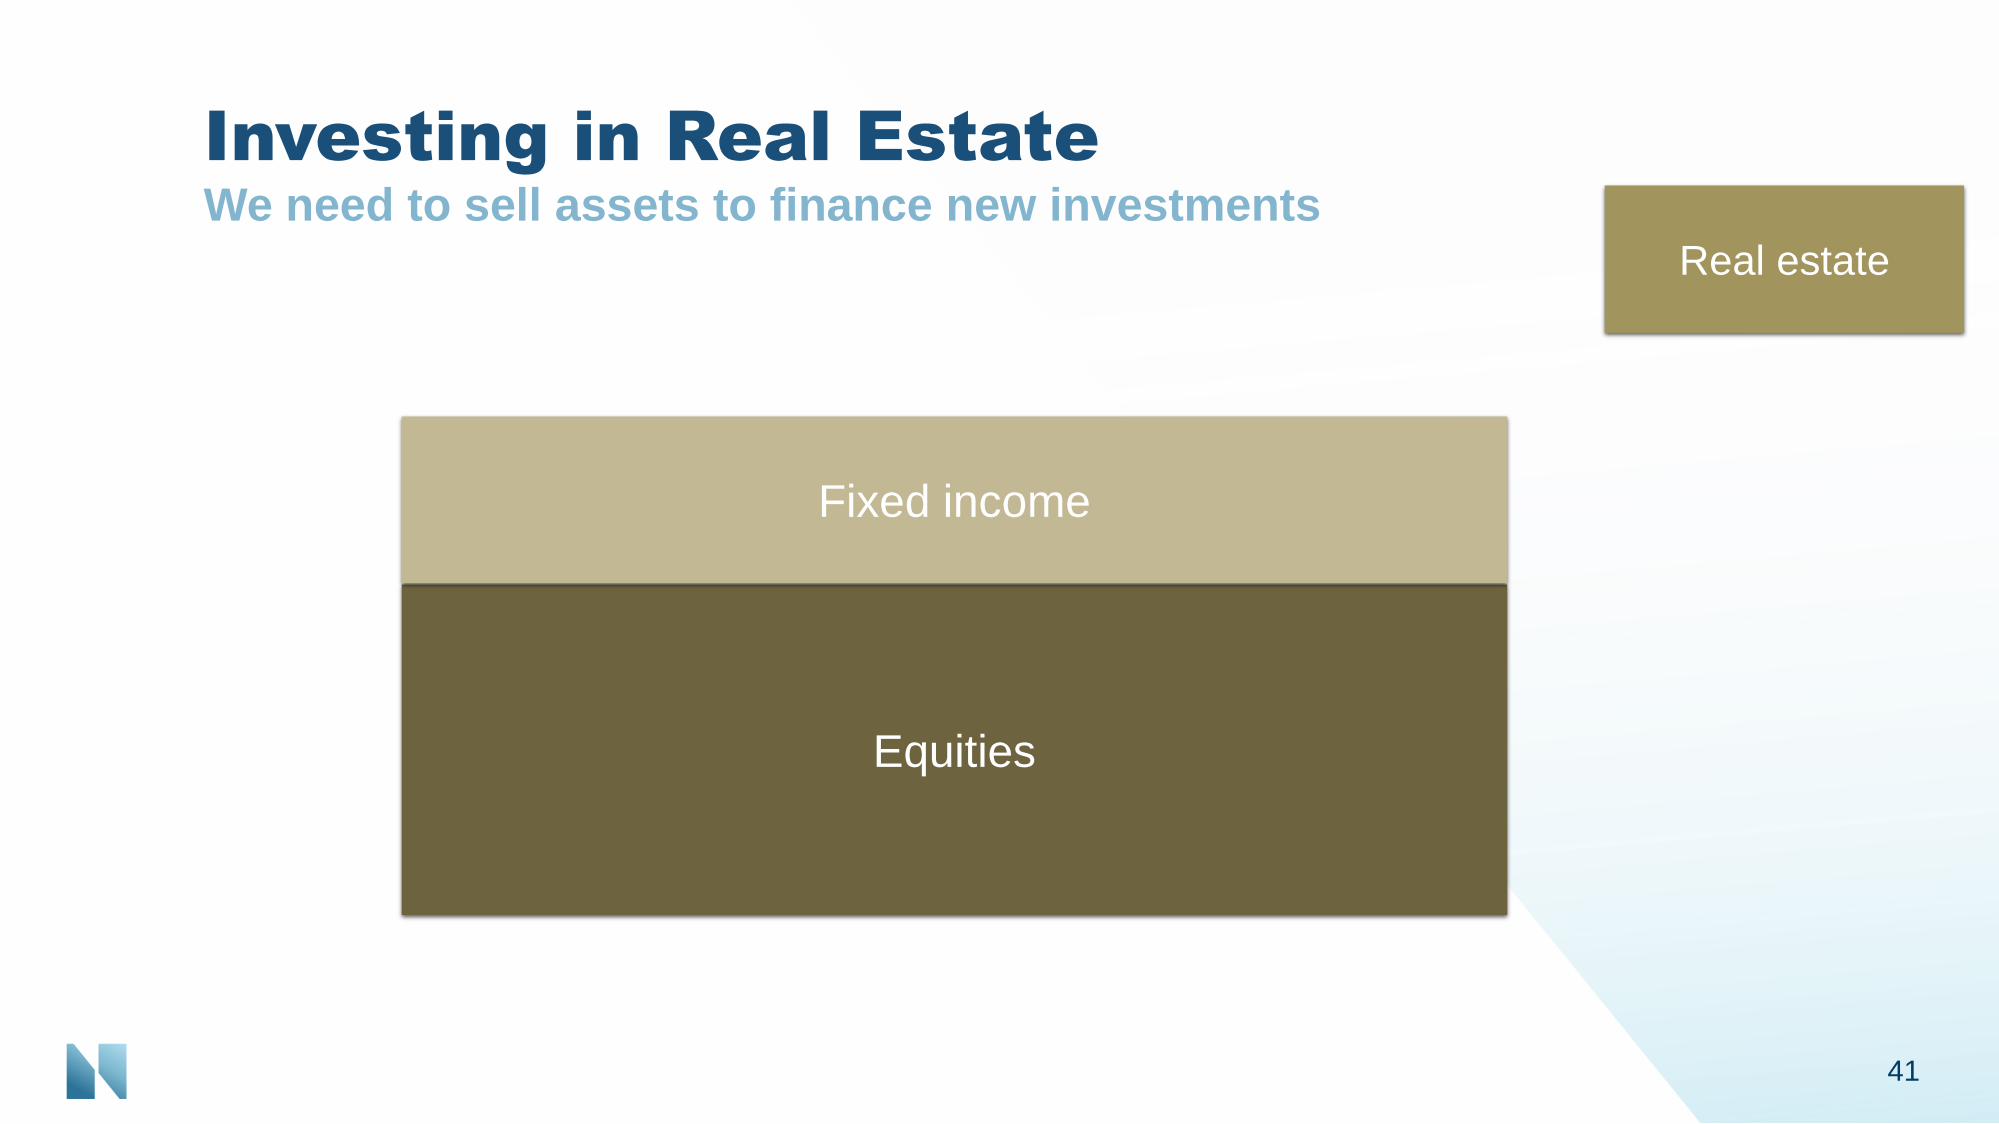
Investing in Real EstateWe need to sell assets to finance new investments
41
Equities
Real estate
Fixed income
Equities
Fixed income
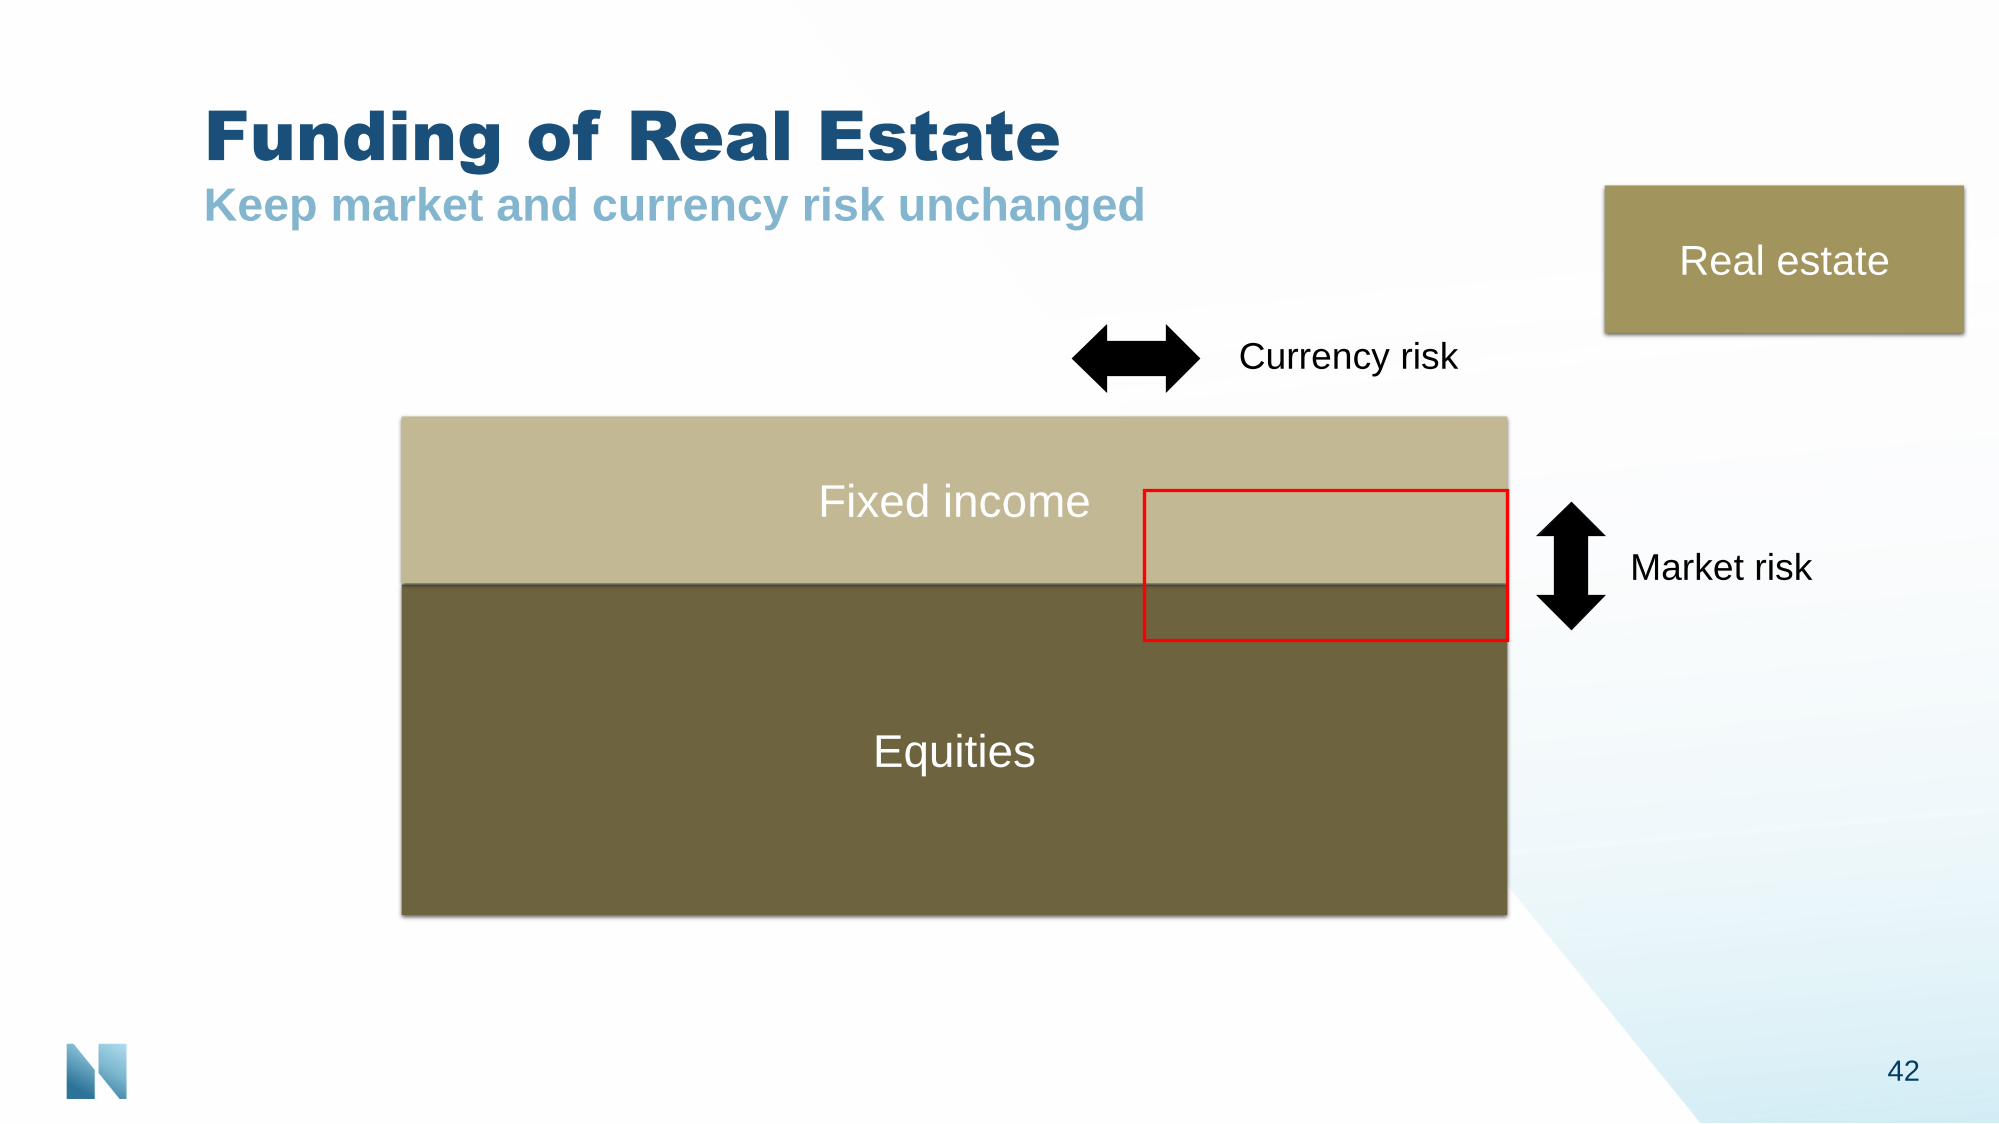
Funding of Real EstateKeep market and currency risk unchanged
42
Market risk
Currency risk
Real estate

Example: funding of Regent’s Street
43
Equities
Fixed income
Real estate

Equities
Fixed income
Real Estate returnWe report the return on the investments versus the funding
44
Equities
Fixed income
Real estate

Return on portfolio and reference indexUS Dollars
45
-10%
0%
10%
20%
30%
40%
12/2012 12/2013 12/2014 12/2015 12/2016 12/2017

Discussion Notes 2017Background for reference index advice
46
Summary
47
Advice
• Equity share
• Currency composition, duration, credit and petroleum wealth
• Rebalancing
Implementation
• Reference portfolio
• Real Estate funding