government performance summit 2015 presentation slides
TRANSCRIPT


Welcome
Diane Denholm, Executive Director, The Performance Institute
Ann M. Ebberts, Chief Executive Officer, AGA

Help Drive the Next Administration’s Agenda
Visit The Performance Institute’s exhibit table for information
and to attend the May 6th Town Hall Dialogue
www.transitions2016.org
@transitions2016

Gold Sponsors

Silver Sponsors

Lanyard, Countdown, Media and
Contributing Sponsors

Expert Viewpoint
Mark Graham Brown, Author and Performance Expert
Moderator: Jon Desenberg, Policy Director, The Performance Institute

Questions?

Update From OMB
Lisa Danzig, Associate Director for Performance and Personnel, U.S.
Office of Management and Budget
Moderator: Ann M. Ebberts, Chief Executive Officer, AGA

Questions?

Thank You to our Gold Sponsors

Join the Conversation on Twitter!
@AGACGFM
@PerformanceInst
#GPSDC2015

Performance in Action – Federal
Gerald Ray, Deputy Executive Director, Office of Appellate Operations,
Social Security Administration
Tim Soltis, Deputy Chief Financial Officer, U.S. Department of
Education
Moderator: Ann M. Ebberts, Chief Executive Officer, AGA

Improving the Performance of
Financial Management
Activities

Financial Management Cycle

What performance outcomes are desired?
• Accomplishment of a given task
• Effective program results/increased value
• Efficient service delivery
• Manner or quality of output
• Standards of performance
Current state – Document the “As-Is”
Desired future state – Define the “To-Be”
Transition plan
Transition
Performance Management Context

ED has six strategic goals focused on:
• Postsecondary, career, technical, and adult education
• Elementary and secondary education
• Early learning
• Equity
• Continuous improvement of U.S. education system
• Improved internal capacities in ED
- Effective workforce
- Risk management
- Productivity and performance improvement
Align to Department Strategic Plan

Align to Relevant Priority Goals
Department Priority Goals
• Enable evidence-based decision making
Cross Agency Priority Goals
• Customer service
• Shared services
• Benchmarking and mission support operations
• Open data
• People and culture

Set Strategic Direction for Office
Values Integrity
Collaboration
& Teamwork
Respect
Fairness
Innovation
Adaptability
Stewardship
Personal
Development
Mission Provide objective financial and performance information to support data-driven decision-making
Vision Expertly manage business processes so they are transparent and efficient, and routinely produce timely, accurate, and high-quality products and services that exceed customer expectations

Case Studies
Annual Financial Report
• Metrics – Benchmarks
• Current state
• Desired future state
- Improved quality – Continuous improvement
- Timely and compliant
- Unmodified audit opinion
• Transition plan

Technology
Policies & Procedures
Data
People
Process/ Internal
Controls
• Evidence-based decision making
• Transparency/Data Act
Standard applications
Automated interfaces
Analytic tools
Knowledge
management
Employee engagement -
culture
Identify needed
competencies/training
Hiring/retentions strategies
Benchmarking/metrics
Shared Services
Continuous improvement

Building Staff Capacity
STRATEGY
Employee Engagement
Motivation Commitment Communication
Personal Development
Goals ● Training Opportunities ● Job Enrichment Achievement ● High
Standards
Core Competencies
Technical ● Behavioral Work Management ● Communication
Core Values
Collaboration ● Teamwork ● Integrity ● Respect Fairness ● Innovation ● Adaptability Stewardship ● Personal Development

Process View
Placement into Service
Disposition of Asset
Manage Asset
Acquire to Retire (A2R)
Receipt, & Acceptance Sourcing Requisition
Procurement Management
Invoice Processing
Procure to Pay (P2P)
Order to Cash (O2C)
Accept Orders
Fulfill Customer
Orders
Perform Distribution
Manage Receivables
Manage Cash
Collections
Hire to Retire (H2R)
Compensation Management Benefits Management B
ud
get
Form
ula
tio
n
Bu
dge
t A
lloca
tio
n a
nd
Co
ntr
ol
Disbursements
Bu
dge
t to
Allo
cate
(B
2A
) R
ep
orts M
anage
me
nt
Supporting Technical Infrastructure Layer
Mission Services

Critical Success Factors
Leadership support – Tone at the top
Appropriate metrics
Reliable data
Change readiness
Project management
Communication

How Data Analysis is
Transforming Disability
Adjudication at the Social
Security Administration

The agency receives about 2.5 million disability claims
per year
About 1/3 of those claimants appeal for a hearing before
an ALJ
About 170,000 people appeal the decisions of the ALJs
to the Appeals Council
About 18,000 continue their appeals in federal court
Performance Management Context

Social Security
Disability
Adjudication
The agency receives about 2.5 million disability claims
per year
About 1/3 of those claimants appeal for a hearing before
an ALJ
About 170,000 people appeal the decisions of the ALJs
to the Appeals Council
About 18,000 continue their appeals in federal court
Social Security Disability Adjudication

Improving Service
Delivery
We continuously look for ways to improve the quality and
consistency of our case adjudication, while reducing
processing times and the cost of the services we provide
In essence, we strive to provide fair and accurate
decisions, as fast and as cheaply as possible
Improving Service Delivery

Mapping the
Business Process
To obtain data about our business processes, we built a
case management tracking system that:
• Identified all important tasks and who performs them
• Charted how work moves from one step in the
process to the next
• Included status codes for each step in the process
Mapping the Business Process

Improving
Productivity
We used this information to determine:
• Choke points and bottlenecks in the process
• Redundancies in the process
• Appropriate staffing allocations for various tasks
• Numeric based performance standards
Improving Productivity

Numeric Based
Performance
Standards
A time value was calculated for each type of case,
representing the average time needed to process a case
of that type: – Request for voluntary remand 3.65
– Dismissal 3.10
– Request for Review Remand 4.60
– Court Remand 3.00
– Fin. Dec. Remand 6.70
– Unfavorable Decision 6.35
– Protest declination 3.50
– Request for Review Denial 3.50
– Grant Review/Interim Action 7.05
– Favorable Decision 6.35
– Fin. Dec. Declination 6.70
– Denial of Reopening
Numeric Based Performance Standards

Numeric Based
Performance
Standards
0102030405060708090
100110120130140150160170180190200210220230240250260270280290300
0 500 1000 1500 2000 2500
Production Value
Hours Worked
Individual Productivity for Cases Closed Prior to Introduction of Numeric Based Performance Standards
Numeric Based Performance Standards

Growth in RRs, Dispositions vs. Staff Growth
FY 2009-FY 2013
600
800
1000
1200
1400
1600
1800
60000
80000
100000
120000
140000
160000
180000
FY 09 FY 10 FY 11 FY 12 FY 13
Requests for Review Staff Size
Staff
Size
Dispositions
Receipt
s
Growth in RRs, Dispositions vs Staff
Growth FY 2009-FY2013

Results – Increased
Dispositions Results – Increased Dispositions

We built a decision-tree mapping the regulatory
requirements regarding the issues that need to be
addressed in each case
We determined the policy compliant paths to each of the
approximately 2000 possible outcomes in disability
cases
We developed analytical tools to guide adjudicators
through appropriate pathing to policy compliant
outcomes
Mapping the Adjudication Process

Improving
Quality
Improving Quality


Using Data to
Drive Change in
Behavior and
Performance
We have amassed and analyzed large data sets related
to the quality of our decisions
Typically we first identify data pointing to outlier
behaviors and we seek to address those behaviors first
We often conduct focused reviews of outliers to learn
what may account for their differences in service delivery
Using Data to Drive Change in Behavior
and Performance

Using Data to
Improve Training
The data enabled us to determine which individuals
make which errors and develop specific targeted training
for each individual
We researched adult learning techniques and developed
interactive training that both explains what our business
rules are and how to apply them
We also push this targeted training directly to individuals
when errors are identified
Using Data to Improve Training

Change in High/Low Allowance Rate ALJs

2009 2010 2011 2012 2013 2014 Favorable ALJ, SAA
Decisions as % of All
Dispositions 61.13% 60.70% 56.25% 50.06% 46.99% 44.03%
Appeals to AC as % of
Appealable Cases 36.67% 39.49% 45.17% 38.85% 37.59% 40.76%
AC Remands as % of
All Dispositions 22.12% 21.77% 21.19% 18.62% 17.11% 14.34%
Appeals to Court as %
of AC Dispositions 14.05% 12.89% 12.14% 10.14% 10.68% 11.33%
Federal Court Remands
as % of Court
Dispositions 47.5% 46.9% 46.12% 44.8% 42.35% 42.57%
Changing Disposition and Appeal Rates

Differential Case
Management
We used k-means clustering techniques to sort cases for
assignment, running quadrillions of calculations using
hundreds of case characteristics and dozens of pivotal
issues to sort cases by similarities
Sorting and assigning similar cases improves the speed
of processing, as adjudicators apply the same policy
compliant pathing to similar cases
Differential Case Management

100
150
200
250
300
350
400
450
500
550
0
20,000
40,000
60,000
80,000
100,000
120,000
140,000
160,000
180,000
FY97 FY98 FY99 FY00 FY01 FY02 FY03 FY04 FY05 FY06 FY07 FY08 FY09 FY10 FY11 FY12 FY13 FY14*DEC
AP
T (D
AY
S)
CA
SES
PEN
DIN
G
ODAR AC Requests for Review Pending AC APT
Results – Despite a Rising Workload,
Processing Times Did Not Rise as Rapidly

Clustering Analysis Helped Visualize the
Interconnectivity of Pivotal Policy Issues

0.0%
10.0%
20.0%
30.0%
40.0%
50.0%
60.0%
70.0%
80.0%
90.0%
Clusters Percent of Cases That are Remanded
Clustering Analysis Also Has Some
Predictive Power

Fraud Detection
We also have developed some sophisticated efforts in
fraud detection
We use pattern recognition software, employ regression
analysis, and have developed various algorithms to
identify unusual relationships between our staff and both
medical and legal practitioners
Fraud Detection

Natural
Language
Processing
We are beginning to use natural language processing to
flag errors in adjudication and identify patterns in some
of the evidence
We also use natural language processing to identify
cases that are likely to be error prone so corrective
action can be taken before benefits are erroneously paid
Natural Language Processing
Any Questions?

Thank You to our Gold Sponsors

Join the Conversation on Twitter!
@AGACGFM
@PerformanceInst
#GPSDC2015

Managing for Results
Jonathan Foley, Director, Planning and Policy Analysis, U.S. Office of
Personnel Management
David Orso, Deputy Executive Director, Enterprise Program
Management Office, Office of Policy and Planning, Department of
Veterans Affairs
Sarah Veale, Assistant Director, U.S. Government Accountability Office
Moderator: Alan Carpenter, Executive Director, Civilian and Emerging
Markets, Robbins Gioia LLC

Agencies’ Trends in the Use of
Performance Information
Sarah Veale Assistant Director| Strategic Issues U.S. Government Accountability Office

Natural
Language
Processing
GAO is mandated to periodically assess the
implementation of the GPRA Modernization Act of 2010
(GPRAMA).
Under this mandate, GAO compared the agency-level
results from its 2013 survey of federal managers at 24
federal agencies, with its 2007 managers survey. (See
GAO-14-747)
GAO’s survey results are generalized to the population of
federal managers Government-wide, and at each of these
24 agencies.

Natural
Language
Processing
GAO defined the terms performance information and
performance measures in the broadest sense, such as
focusing on quality, timeliness, customer satisfaction, or
efficiency.
GAO identified a core set of questions from the 2007 and
2013 managers surveys related to use, and developed
the agency indices based on the managers responses to
those questions, and grouped them by agency.

Natural
Language
Processing
Questions from GAO’s 2013 Managers Survey Used to Develop the Agency Use of Performance Information Index
Performance Information Index

Performance Information Index
Federal Agencies Average Scores on GAO’s Agency Use of Performance Information Index - 2007 and 2013
Legend
▼ Statistically significant decrease
▲ Statistically significant increase
Note: The other 18 federal agencies did not experience either a statistically significant increase or decrease between 2007 and
2013 (based on agencies’ scores on the 2013 use index).
Source: GAO-08-1036SP and GAO-13-519SP | GAO-14-747

Using Data to
Improve Training
GAO’s Leading Practices That Can
Enhance or Facilitate Use of Performance
Information
GAO then reviewed its prior work GAO then reviewed its
prior work identifying leading practices that can help
agencies improve their use of performance information for
decision making.
GAO looked at the remaining managers survey questions
and identified those that were associated with these leading
practices.
GAO used statistical testing to determine if the relationship
between these additional questions and the use index was
statistically significant.

GAO’s Leading Practices That Can
Enhance or Facilitate Use of Performance
Information for Management Decision
Making

Questions from the 2013 Mangers Survey
Associated with Leading Practices to
Enhance and Facilitate the Use of
Performance Information

2013 Manager Survey Questions
Addressing Key Practices Significantly
Related to the Use of Performance
Information

GAO on the Web Web site: http://www.gao.gov/
Congressional Relations
Katherine Siggerud, Managing Director, [email protected]
(202) 512-4400, U.S. Government Accountability Office
441 G Street, NW, Room 7125, Washington, DC 20548
Public Affairs Chuck Young, Managing Director, [email protected] (202) 512-4800, U.S. Government Accountability Office 441 G Street, NW, Room 7149, Washington, DC 20548
Copyright This is a work of the U.S. government and is not subject to copyright protection in the United States. The published product may be reproduced and distributed in its entirety without further permission from GAO. However, because this work may contain copyrighted images or other material, permission from the copyright holder may be necessary if you wish to reproduce this material separately.

Performance Improvement at
the Office of Personnel
Management
Jonathan Foley Director, Planning and Policy Analysis U.S. Office of Personnel Management

Differential Case
Management
Leadership and Culture
Structural factors
Crises present opportunities
Process improvement for the longer term
Overview

Leadership and Culture
Senior
leader
commitment
Data
driven
reviews
Growth
opportunities

Differential Case
Management
PIO reports to agency Director
Involve CFO, COO through matrix process
Component-level performance liaisons
Establish unit whose main focus is data analytics
Strategic goal on evidence-based policy
Structural Factors

Crises Present Opportunities

Differential Case
Management
Space for innovation
Methodological tools:
• Human centered design
• Lean Six Sigma
Resources
Process Improvement for the Long Term

Requirements: The “Managing
for Results” Backbone
David Orso Acting Executive Director Enterprise Program Management Office Department of Veterans Affairs

Differential Case
Management
VA success is dependent upon coherent enterprise
business processes…
VA recognizes the need to integrate and synchronize
enterprise priorities, requirements, and solutions that
meet the needs of Veterans, now and in the future
The Department’s enterprise-level systems were
designed to manage operations, not performance
Multiple VA governance frameworks with significant
interdependencies are being developed
The Department has challenged itself to develop an
enduring MFR capability that enables and sustains the
MyVA objectives
Improving the Veteran Experience
Effective requirements management to drive culture change and reduce program risk

Why Did VA Focus on Requirements?
Our Premise: Veteran’s needs and expectations must
be directly connected to VA capabilities and program
requirements
What we discovered:
• Preconceived solutions routinely form the basis of
‘requirements’ versus a holistic review of possibilities
and current efforts.
• Program scope becomes a moving target in the
absence of well defined requirements
• Performance management and accountability
challenges result from ill-defined programs
VA concluded and testified that “Big A” acquisition started with effectively managed requirements

MFR Will…
Enable a holistic approach to enterprise planning and mission execution
Establish an enduring governance framework which will enable long-term
sustainment of a coherent strategy for meeting the needs of Veterans
Synchronize existing multiple, independent planning, programming,
budgeting, performance management, and execution processes.
Provide a mechanism for ensuring enterprise needs for the Veteran’s overall
experience are included in the decision making process.
Optimize resource allocations to effect the MyVA priorities
Result in an enterprise governance system that aligns the Department’s
strategic requirements and investments to customer needs and
expectations.
Enable
• Effective and transparent decision-making
• A unified end-to-end view of requirement's, Investments and
performance
• Clearly defined accountability for outcomes and results

Scope of MFR
MFR will integrate and synchronize the functional processes that drive
enterprise behavior and enable VA to effectively and efficiently satisfy
current and future strategic requirements – “MFR will not create; but link
processes”
Foundational elements of MFR include, but are not limited to enterprise-
level:
Strategic and Operational Planning
Requirements Development & Management
Acquisition Planning
Resource Allocation
Program Execution
Performance Management and Evaluation

Critical Thinking and Analysis Rigor are
the centerpieces of the VA MFR Framework
Solution Scope Modeling Impact Analysis Modeling Stakeholder Modeling
Critical Thinking and Analysis Rigor ensures – “Doing Things Right” while “Doing the
Right Things”
Utilizing standardized techniques across the MFR lifecycle to
ensure analysts apply critical thinking and analysis rigor as they
identify and refine requirements

Requirements Success and the VCA
Shredding the Law at the Beginning of the Effort
• Ensured Accurate and Executable Requirements
Determining the Scope for each VCA Work Stream
• Ensured all understood scope prior to execution
LPORKFAT Analysis using standardized techniques and
templates
• Ensured all factors related to scope were considered
Requirements Traceability using an enterprise software
tool
• Ensured requirements were managed consistently
The Team Applied Lessons Learned from VCA to its CMM/MFR Initiative

Differential Case
Management
Building a “light” framework that addresses:
When and at what level requirements are best identified
Governance and process/framework Integration
Requirements alignment to and support of PPBE

Questions?

Which of these practices and drivers do you believe would have the
greatest impact on improving the use of performance information (both
generally and within your agency).
Select the MOST IMPORTANT
A.) Aligning agency wide goals, objectives, and measures
B.) Improving the usefulness of performance information
C.) Developing the agency capacity to use performance information
D.) Demonstrating management commitment
E.) Communicating performance information frequently and effectively
Polling Question
www.PollEv.com/GPS2015
or
Text GPS2015 to 22333 to join, then text your answer

Which of these practices and drivers do you believe would have the
greatest impact on improving the use of performance information (both
generally and within your agency).
Select the SECOND most important
A.) Aligning agency wide goals, objectives, and measures
B.) Improving the usefulness of performance information
C.) Developing the agency capacity to use performance information
D.) Demonstrating management commitment
E.) Communicating performance information frequently and effectively
Polling Question
www.PollEv.com/GPS2015
or
Text GPS2015 to 22333 to join, then text your answer

Which of these practices and drivers do you believe would have the
greatest impact on improving the use of performance information (both
generally and within your agency).
Select the THIRD most important
A.) Aligning agency wide goals, objectives, and measures
B.) Improving the usefulness of performance information
C.) Developing the agency capacity to use performance information
D.) Demonstrating management commitment
E.) Communicating performance information frequently and effectively
Polling Question
www.PollEv.com/GPS2015
or
Text GPS2015 to 22333 to join, then text your answer

Which of these practices and drivers do you believe would have the
greatest impact on improving the use of performance information (both
generally and within your agency).
Select the LEAST IMPORTANT
A.) Aligning agency wide goals, objectives, and measures
B.) Improving the usefulness of performance information
C.) Developing the agency capacity to use performance information
D.) Demonstrating management commitment
E.) Communicating performance information frequently and effectively
Polling Question
www.PollEv.com/GPS2015
or
Text GPS2015 to 22333 to join, then text your answer

Strategy Gaming for Risk Management
General (Ret.) Ronald R. Fogleman, 15th Chief of Staff, U.S. Air Force
Kathleen Robertson, Recent Director of Research for the National
Commission on the Structure of the Air Force, Office of the Secretary of
Defense
Moderator: Andy Pavord, Founding Partner, Federal Consulting Alliance
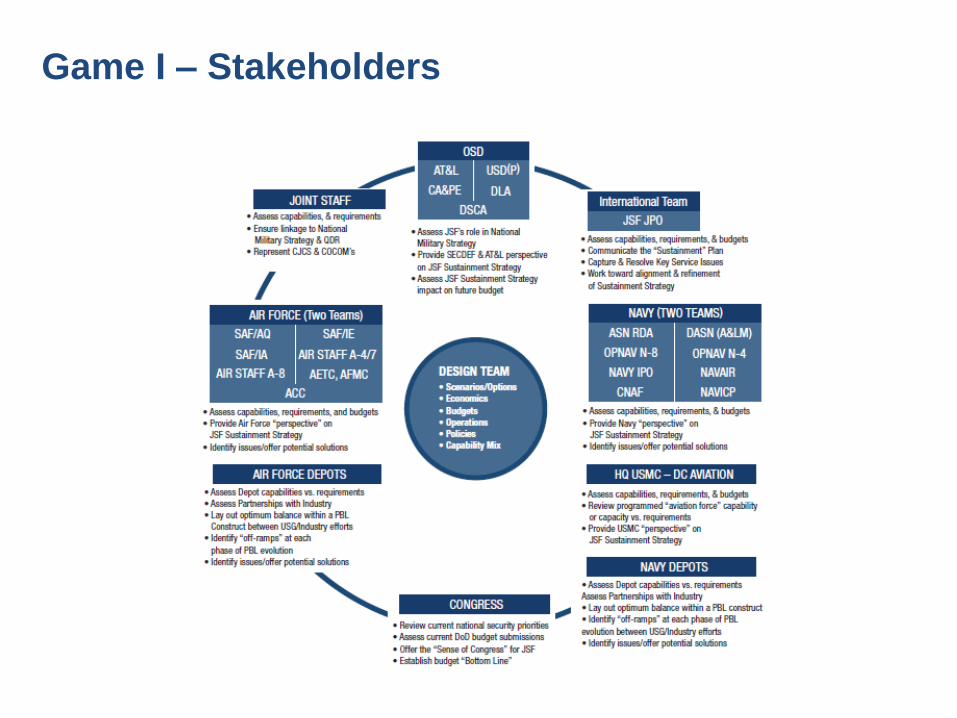
Game I – Stakeholders

Kick-Off
Design Simulation
Prepare Briefing Books
Game
Document Insights
•Objectives and Scope
•Participants
•Work Steps
•Key Dynamics
•Teams
•Dynamic Framework
•Team Agendas
•Rules of Play
•Communications
•Financial Models
•Team Decision Aides
•Test
•Refine
•Document
•Interviews
•Data Collection
•Draft
•Review
•Final
•Distribute to Participants
•Invite Participants •Confirm Participants, Reservations
•Travel to brief industry participants
•Introduction
•Brief
•Team “Meetings”
•Meeting Rooms Reserved
•Hotel Rooms Blocked
•Arrange Catering •Oversee Simulation
•Facilitate Teams
•Provide Feedback
Prepare Participants
Game Schedule

Questions?

Performance in Action – State & Local
David Gottesman, CountyStat Manager, Office of the Montgomery
County Executive
Lou O’Boyle, Director of Engagement, Zelos
Greg Useem, Chief Performance Officer, Office of Performance and
Accountability, City of Alexandria
Moderator: Jon Desenberg, Policy Director, The Performance Institute

Questions?

Join the Conversation on Twitter!
@AGACGFM
@PerformanceInst
#GPSDC2015

Thank You to Our Sponsors!

Using Metrics to Engage Employees
Stew Liff, Author and Fellow, The Performance Institute
Moderator: Diane Denholm, Executive Director, Civilian and Emerging
Markets, Robbins Gioia LLC

• Author of Managing
Government Employees, 98
Opportunities, Improving the
Performance of Government
Employees, and A Team of
Leaders
• 32 years with the government,
about
• Half in Human Resource
Management
• Half as a Senior Executive
• Now a Consultant, Speaker,
Writer and Teacher
About Stewart Liff

I’m also a classically trained fine artist!
About Stewart Liff

Left Brain Right Brain
Processes
information in a
linear manner
Charts
Graphs
Tables
Goals
Processes
holistically
Photos
Artifacts
Displays
Memorabilia
Statues
Sound
Whole-Brain Approach: Unite People
Around the Mission and the Metrics

Choices
External Influencing
Factors Goals and Objectives
Mission
Guiding Principles
Strategies to Influence the External Environment
Goals and Objectives Knowledge and
Culture Outcomes
Reward
Renewal Structural
People
Technical
Decision-Making
and Information
Systems
Principle - “Organizations are perfectly designed to
get the results that they get”
Framework: OSD Model – refined by Paul
Gustavson

• Your process must have
a clear line of sight
• It needs to be
transparent
• Everyone should be
treated the same
Track and post
data
Reliable
consequence
Assess and
appraise
Renewal
Goals &
Objectives
Performance Management is an Ongoing
Process

They want to be part of something special
They want to be involved
They want some freedom/chance to innovate
They want to know what’s going on
They want to work for leaders who are fair, upfront and
willing to deal with difficult issues
They want the opportunity to grow
It all comes down to your culture
What Motivates Government Employees?

Involve the employees in the development of the
metrics/performance standards
Involve them in the analysis
Involve them in the development of the solution(s)
Provide them with frequent feedback
Involve the Employees as Much as
Possible

Make the Metrics as Visual as Possible

Me
asu
re
Typ
e A
Wo
rk (
Co
mp
lete
d)
Typ
e A
Wo
rk (
Pe
nd
ing
)
Typ
e B
Wo
rk
(Com
ple
ted
)
Typ
e B
Wo
rk (
Pe
nd
ing
)
Typ
e C
Wo
rk (
Pe
ndin
g)
Typ
e C
Wo
rk (
Co
mp
lete
d)
Natio
nal A
ccu
racy R
ate
Type
A
Natio
nal A
ccu
racy R
ate
Type
B
Natio
nal A
ccu
racy R
ate
Type
C
Cost
pe
r T
yp
e A
Cla
ims
Cost
pe
r T
yp
e B
Cla
ims
Cost
pe
r T
yp
e C
Cla
ims
Cost
pe
r T
yp
e A
Cases o
n t
he R
olls
Ove
rall
Sa
tisfa
ctio
n
Custo
me
r O
rien
tatio
n
Ap
pe
als
Ra
tio
Te
leph
one
Activitie
s -
Aba
nd
on
ed
Ca
ll R
ate
Te
leph
one
Activitie
s -
Blo
cke
d C
all
Ra
te
Em
plo
ye
e D
eve
lopm
en
t M
atr
ix
Em
plo
ye
e S
urv
ey (
me
an
sco
re)
Goal 175 187 45 75 715 255 90 92 94 $249 $96 $121 $161 85 75 2% 4% 4% 90 4%
Actual 190 174 44 91 697 312 72 84 82 $569 $255 $123 $266 69 69 13% 9% 6% 92 3%
Met? N Y Y N Y N N N N N N N N N N N N N Y Y
Performance Dashboard
Easy to develop and understand
Color makes it easy to spot what’s going well or not
Displaying Data

Category SPEED ACCURACY UNIT COST CUSTOMER SATISFACTION
EMPL. DEV. &
SAT.
Weight 21% 28% 16% 20% 15%
Measure
Rat
ing
Rel
ated
Act
ion
s
(Co
mp
lete
d)
(2)
Rat
ing
Rel
ated
Act
ion
s
(Pen
din
g)
(7)
No
n-R
atin
g R
elat
ed A
ctio
ns
(Co
mp
lete
d)
(2)
No
n-R
atin
g R
elat
ed A
ctio
ns
(Pen
din
g)
(7)
Ap
pea
ls R
eso
luti
on
- A
ver
age
Day
s/C
ase
(2
)
Fid
uci
ary
Act
ivit
ies
- In
itia
l
Ap
pt
& F
id-B
en E
xam
s (2
)
Nat
ion
al A
ccu
racy
Rat
e (c
ore
rati
ng
wo
rk)
(4)
Nat
ion
al A
ccu
racy
Rat
e
(au
tho
riza
tio
n w
ork
) (4
)
Nat
ion
al A
ccu
racy
Rat
e
(fid
uci
ary
wo
rk)
(4)
Co
st p
er C
om
pen
sati
on
Cla
im
Co
mp
lete
d (
5)
Co
st p
er P
ensi
on
Cla
im
Co
mp
lete
d (
5)
Co
st p
er A
ctiv
e C
om
pen
sati
on
Cas
e o
n t
he
Ro
lls
(5)
Co
st p
er A
ctiv
e P
ensi
on
Cas
e
on
th
e R
oll
s (5
)
Ov
eral
l S
atis
fact
ion
(6
)
Cu
sto
mer
Ori
enta
tio
n (
6)
Ap
pea
ls R
atio
(2
)
Tel
eph
on
e A
ctiv
itie
s -
Ab
and
on
ed C
all
Rat
e (2
)
Tel
eph
on
e A
ctiv
itie
s -
Blo
cked
Cal
l R
ate
(2)
Em
plo
yee
Dev
elo
pm
ent
Sk
ill
Mat
rix
On
e V
A S
urv
ey (
mea
n s
core
)
(6)
Strategic Objective 74.0 78.0 17.0 44.0 365.0 1.0% 96.0% 96.0% 96.0% $249 $96 $121 $161 90.0% 90.0% 2.0% 4.0% 4.0% TBD 4.0
FY 2001 Target 186.4 187.2 45.0 75.0 715.0 5.0% 74.0% 68.0% 65.0% TBD TBD TBD TBD 59.0% 68.0% 8.0% 7.0% 4.0% TBD 3.7
Zero Value 200.0 150.0 125.0 100.0 1,000.0 43.0% 35.0% 35.0% 35.0% $550 $250 $215 $500 35.0% 35.0% 13.0% 35.0% 50.0% TBD 1.0
Actual 190.4 174.2 44.2 91.3 697.4 23.6% 65.0% 51.9% 58.6% $569 $255 $183 $266 53.4% 62.2% 12.7% 9.0% 5.7% TBD 3.4
Earned Points 0.4 0.0 2.2 0.3 2.9 0.9 7.9 2.2 1.6 0.0 0.0 1.4 2.8 2.0 3.0 0.1 2.5 2.9 TBD 4.0
Maximum Points 5.0 3.0 3.0 2.0 6.0 2.0 16.0 8.0 4.0 4.0 4.0 4.0 4.0 6.0 6.0 2.0 3.0 3.0 10.0 5.0
Target Score - EOFY 42.0 x1.35 56.8
Total Score 36.9 x1.11 41.0 NOTES:
Maximum Score 90 x1.11 100 (1) Reflects monthly data
(2) Reflects FYTD data (thru current month)
(3) Reflects FYTD data (thru prior month)
(4) Reflects 12-month cumulative data
(5) Updated quarterly
(6) Updated annually
(7) End of month snapshot
Gives one overall measure of service.
Looks at measures in relation to each other.
Harder to develop and understand.
BALANCED SCORECARD
Displaying Data

Principle – they should always see an action coming Month Output Accuracy Timeliness Leave
Oct 3.8 (84) 88% 91% 0
Nov 4.0 (84) 90% 100% 8
Dec 4.2 (87) 85% 88% 11
Jan 3.9 (74) 100% 90% 24
Feb 4.4 (97) 90% 100% 0
March 3.9 (85) 92% 90% 8
Standard 3.5 90% 90% N/A
Your Average 4.0 (85) 93% 94% 8.3
Team Average 3.8 (83) 91% 91% 6.1
Sample Employee Report Card

Monetary
3 group goals per quarter
3 individual goals per quarter
Earn a certificate for each goal achieved
Not eligible in quarter if: discipline/poor attendance/poor performance
Non-monetary
• Say “thank you” when appropriate
• Employee thank you cards
• Walls of fame
• Other informal recognition
• Videos
• Visitors
Principle – reliable consequences
Employee Rewards

VA’s LA Regional Office
A VA Regional Office
adjudicates claims for veterans’
Benefits
461 employees
$18,000,000 budget
Historically weak performance, low customer satisfaction and poor morale
EEO/LMR problems
Physical plant contributed to this
Whole-Brained Case Study

The Approach
Set a positive tone
Relentless communication
Did the tough stuff
Replaced half the supervisors
Terminated poor employees
Established integrated management systems using OSD
Model
Data posted everywhere in a strategic fashion, at every
level
Approach

Whole-Brained Case Study (continued)

In the Beginning…

The New Look

Connecting People to the History and
Mission

Displays Everywhere

Galleries Galore

Report Card - VSR
Team-Name:
Detail No. of Standard Minimun Number PercentOvertime Leave Time EP’s Man Hours Productivity N’ed N’ed
Cumulative 107.00 58.00 565 1.45 0.93 5 1%
October 35.00 75 1.00 0.86
November 17.00 3.00 97 1.15 0.90 2 3%
December 16.00 40.00 105 1.63 0.92 1 1%
January 11.00 10.00 148 1.73 0.97 1 1%
February 28.00 5.00 140 1.78 0.96 1 1%
March
April
May
June
July
August
September
Celebrating the
Employees/Accountability
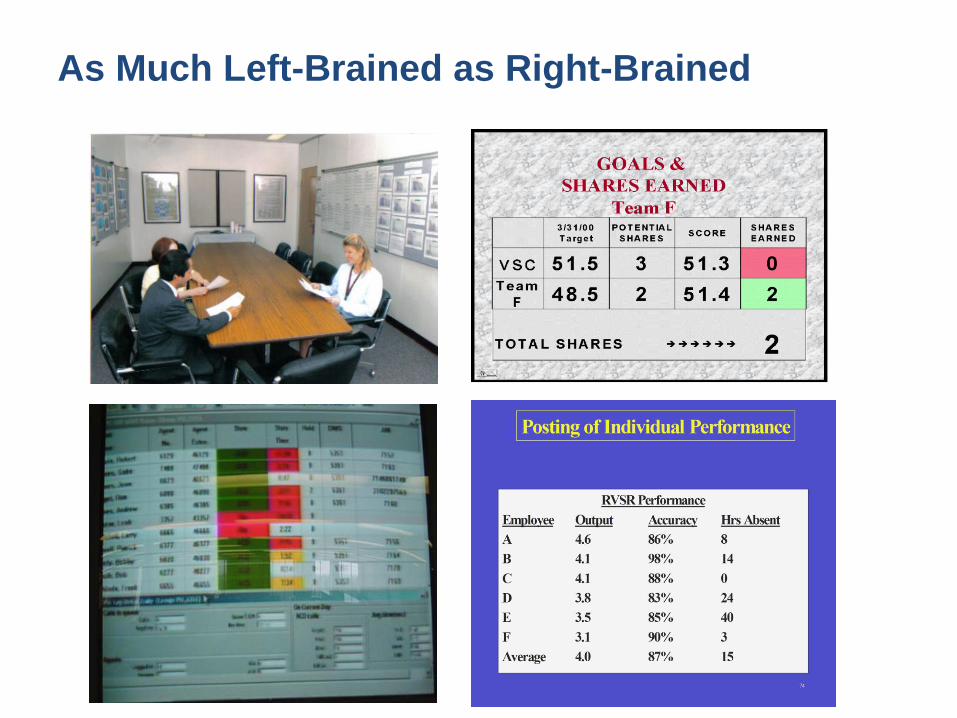
As Much Left-Brained as Right-Brained

1996 20010.0
10.0
20.0
30.0
40.0
50.0
60.0
1996 2001
Customer SurveyOverall Impressions
Percent Who Were Very Or Somewhat
Satisfied With The Handling Of Their Claim
Nation Los Angeles
Results

Results

92
Shaping the Outside World’s View
89
Shaping the Outside World’s View
National Attention

The VA Secretary’s View

The Employee’s View

Questions?
Contact info:
The Performance Institute
877-992-9521
www.performanceinstitute.org
Stewart Liff
661-714-858

Evidence Based Policy Making
Torey Silloway, Manager, PEW Charitable Trusts
Gary VanLandingham, Director, Pew-MacArthur Results First Initiative
Moderator: Robert Shea, Principal, Grant Thornton LLP

Tools for Fiscal and Program
Leaders
Gary VanLandingham, Director Torey Silloway, Manager Pew-MacArthur Results First Initiative

There is a critical need to strengthen accountability and
focus on “what works”
Evidence-based policymaking (EBP) has implications
throughout the governmental process
Auditors and other fiscal leaders, performance
managers, and program managers can all play a key
role in this transition
Today’s Discussion

What word best describes what you do in your
organization?
A.) Audit
B.) Evaluation
C.) Program Management
D.) Performance Management
E.) Financial Management
F.) Other
Polling Question
www.PollEv.com/GPS2015
or
Text GPS2015 to 22333 to join, then text your answer

Governments Face Ongoing Fiscal
Pressures

Rigorous audits/evaluations have shown that many programs fail to achieve desired outcomes
This information isn’t making its way into the budget process
Instead of focusing on results, the budget process relies on inertia and anecdotes
The Policy Challenge

Inventory currently funded programs
Assess available evidence on effectiveness of each program
Calculate whether benefits justify costs
The Solution: Support Moneyball in
Government
Help policymakers better target funds and achieve dramatic
improvements without increased spending

Does your organization have adequate cost information to
judge a program's cost effectiveness?
A.) Yes
B.) No
Polling Question
www.PollEv.com/GPS2015
or
Text GPS2015 to 22333 to join, then text your answer

Identifies key steps that
governments should take
to incorporate evidence
into their policy and
management processes
Program and fiscal
leaders can play a key
role in each of these
areas
2014 Pew Report on Evidence-Based
Policymaking

It is part of the job - the accounting / audit / fiscal staff
function is intended to provide critical information that
informs policy and management decisions
New tools are available to do this
GASB has been gently nudging the profession to do this
for years
Why is This an Issue for Government
Accountants/Auditors and Other Fiscal
Leaders?

Probity: spending funds in compliance with approved
budget and applicable laws
Process: following prescribed processes in carrying out
activities
Performance: managing activities in an efficient and
economical manner
Program: attaining desired program outcomes
Policy: attaining overall policy goals
GASB Acknowledges this Role – Levels
of Accountability

Rigorous evidence on “what works” is a complimentary
and critical part of performance management /
measurement
Program managers can use new tools to inform grants
and contracts
Why is This an Issue for Program and
Performance Managers?


Program Assessment
Systematically review available evidence on the
effectiveness of public programs
Develop an inventory of funded programs


Systematically review available evidence on the
effectiveness of public programs
Develop an inventory of funded programs
Categorize programs by their evidence of effectiveness
Program Assessment

Do you believe your organization has a robust body of
evidence about whether programs are working in your
organization?
A.) Yes
B.) No
Polling Question
www.PollEv.com/GPS2015
or
Text GPS2015 to 22333 to join, then text your answer


Systematically review available evidence on the
effectiveness of public programs
Develop an inventory of funded programs
Categorize programs by their evidence of effectiveness
Identify programs’ potential return on investment (benefit-
cost analysis)
Program Assessment


Incorporate evidence of program effectiveness into
budget and policy decisions
Provide systematic program performance information to
policymakers
Report relevant studies in budget hearings and
committee meetings
Present information to policymakers in user-friendly
formats that facilitate decision-making
Target funding to evidence-based programs (including
grants and contracts)
Budget Development

Does your budget use performance information to justify
funding requests?
A.) Yes
B.) No
Polling Question
www.PollEv.com/GPS2015
or
Text GPS2015 to 22333 to join, then text your answer

Compute Return on Investment of
Programs

Implementation Oversight
Ensure that programs are effectively delivered and are
faithful to their intended design
Review data systems to ensure agencies are accurately
collecting and reporting data on program implementation
Incorporate appraisals of program fidelity monitoring into
assessments of management controls

Routinely measure and report outcome data to
determine whether interventions are achieving
desired results
Assess outcome measures for programs, agencies, and
the community
Conduct regular audits of systems for collecting and
reporting performance data
Regularly report performance data to policymakers
Outcome Monitoring

Conduct rigorous evaluations of new and untested
programs to ensure that they warrant continued
funding
Leverage available resources to conduct rigorous
performance audits
Conduct audits to test new initiatives
Report outcome studies to centralized repository
Targeted Evaluation

pewtrusts.org/resultsfirst
For More Information

Questions?

Stat Reviews – Best Practices and
Lessons Learned
Jackie Chappell, Operations Research Analyst, U.S. Food and Drug
Administration
Ashley Zohn, Director-FEMAStat, Office of Policy and Analysis,
Federal Emergency Management Agency
Tony Saudek, Chief Performance Officer and CapStat Director,
Government of the District of Columbia
Moderator: Shelley Rappaport, Principal Consulting Manager, The
Performance Institute

FDA-TRACK Objectives
FDA-TRACK is FDA’s agency-wide performance management
system tracked at the program (operational) office level. When
we created FDA-TRACK, we set four basic objectives:
1. Tell a more compelling story, better representing the breadth
of FDA’s core responsibilities, and demonstrate the value of
FDA’s contributions and accomplishments to public health.
2. Enable better decision-making with more timely performance
information and support continuous data-driven decisions.
3. Provide a better mechanism for linking core program
activities with leadership priorities.
4. Streamline agency performance measurement data
collection and reporting.

Commissioner of
Food & Drugs
Human
Drugs Biologics
Medical
Devices
Animal
Drugs &
Feed
Tobacco Toxicological
Research
Office of Regulatory Affairs
Staff Support & Program
Coordination Chief
Scientist
Food &
Cosmetics
Office of the
Commissioner
Centers
Field
Operations
Directorates (new) Medical Products
and Tobacco
International
Programs
Office of
Foods
Office of
Operations
Global Regulatory
Operations & Policy
Special
Medical
Programs
Office of the
Chief Counsel
[Unofficial version]
(supports all programs)
FDA-TRACK Quarterly Briefing Structure

http://www.fda.gov/fdatrack
FDA-TRACK Public Website

• The Meetings: Our team produces
an ongoing series of data-driven
reviews, where FEMA’s senior
leadership evaluates performance
against objectives, identifies
barriers to success, agrees on
actions to eliminate those barriers,
and holds individuals accountable
for implementation.
• The Process: Preparing for each
meeting requires intense
collaboration and rapid in-depth
analysis on issues that cut across
the entire agency - a process that
takes about six weeks of
preparation for each session.
15
0
Step
1
Step
2
Step
3
Step
4
Step
5
Step
6
Preliminary
Background
Meeting
Develop
Briefing
Review
Findings
Hold
FEMASTAT
Session
Memo
Detailing
Action-Items
Distributed
Follow-Up on
Action Items
The FEMASTAT Process
What is a FEMAStat?

Questions?

Engaging Elected Officials in
Performance Dustin Brown, Deputy Associate Director, Performance and Personnel
Management, U.S. Office of Management and Budget
Carl DeMaio, Senior Fellow, The Performance Institute
Jon Stehle, Board Member, American Association for Budget and
Moderator: Jon Desenberg, Policy Director, The Performance Institute

Questions?

Day One Wrap Up
Diane Denholm, Executive Director, The Performance Institute
Ann M. Ebberts, Chief Executive Officer, AGA

Thank You to Our Sponsors!

Welcome
Ann M. Ebberts, Chief Executive Officer, AGA

Help Drive the Next Administration’s Agenda
Visit The Performance Institute’s exhibit table for information
and to attend the May 6th Town Hall Dialogue
www.transitions2016.org
@transitions2016

Thank You to Our Sponsors!

Wifi
Network: Marriott Conference
Access Code: GPS2015

Performance Countdown
Mark Graham Brown, Author and Performance Expert
Kate Josephs, Executive Director, Performance Improvement Council
Chris Mihm, Managing Director, Strategic Issues, U.S. Government
Accountability Office
Robert Shea, Principal, Grant Thornton LLP
Moderator: Jon Desenberg, Policy Director, The Performance Institute

Questions?

Innovation Labs – Executing
Strategies Through New Ideas Alex Cohen, Program Manager, Center for Applied Technology, U.S.
Census Bureau
Dan Correa, Senior Advisor for Innovation Policy, White House Office
of Science and Technology Policy
Bryan Sivak, Chief Technology Officer, Health and Human Services
Moderator: Jon Desenberg, Policy Director, The Performance Institute

Center for Applied Technology (CAT)
Overview US Census Bureau

Outline
• Overview – Purpose
– Organization
– Facility
• Capabilities and Services – Innovation Program
– Pilots and Proofs of Concepts
– Technology Partnerships & Demonstrations
164
Outline

Overview: Purpose
• Technology Innovation – To promote, accelerate, and enable business driven technology
innovation to achieve operational efficiencies and process improvements
• Safe Zone and Rapid Technology Evaluation – To foster innovation by providing a “safe zone” environment,
physically separated from the Census Bureau’s production network to accelerate future IT investment decisions
• Knowledge Sharing and Collaboration – To encourage collaboration and facilitate information sharing
among staff from across Census directorates through events and programs focused on the Census Centers of Excellence and new technologies and solutions developed by vendors, other government agencies and academia
165
Ideation Innovation Collaboration Overview: Purpose

Innovation Project
Team:
• Project Manager
• Cross-Bureau
Business SMEs
• Technical
Architects
Innovation Project
Team:
• Project Manager
• Cross-Bureau
Business SMEs
• Technical
Architects
Overview: Organization
166
Avi Bender,
CTO
Program
Executive
Alex Cohen
Program
Manager
CAT
Operations
Manager
CAT Technology
Support Team &
COEs
Innovation Project
Team:
• Project Manager
• Cross-Bureau
Business SMEs
• Technical
Architects
Overview: Organization

Overview: Facility
• The CAT physical space is a unique environment which provides: – An IT infrastructure consisting of 16 IBM HS22v blade servers with
more than 2.5 Tb of memory and 550 GHz of CPU resources supporting VMware vSphere virtual machines. Storage is provided by 46Tb of IBM SAN. There is also IBM HS22vs and HX5s servers available to accommodate the occasional bare-metal build.
– Hands-on access to new technologies and devices on a limited scale to test and explore ideas of Census Bureau staff without impacting the production operations. Mobile devices such as tablets and smartphones are available.
– A dedicated meeting space (Room 1J250) specifically designed for large groups to interactively discuss ideas and demonstrate solutions via large wall monitors, a conference room equipped with a projector and audio/video conferencing, and other interactive devices.
167
Overview: Facility

Overview: Facility
(cont’d)
168
Main
Entrance
Mobile Devices
Exhibit Area
Conference
Area
Small Group Demos(60” monitors on the wall)
COE Work
Groups
Overview: Facility (cont’d)

Outline
• Overview – Purpose
– Organization
– Facility
• Capabilities and Services – Innovation Program
– Pilots and Proofs of Concepts
– Technology Partnerships & Demonstrations
169
Outline

An open door policy encourages participation of all
Census staff in CAT related innovation activities
• The CAT connects participants and related ideas to collaboratively review, research and explore using the Agile approach.
• By facilitating connections between similar ideas and existing/ongoing Census Bureau initiatives the CAT aims to streamline solution development and eliminate duplication of efforts.
170
A STRUCTURED PROCESS TO SUPPORT INNOVATION THROUGH COLLABORATION
Receive innovative
ideas, concepts and
IOE initiatives that
require innovative
solutions
Review & Consolidate
Ideate Incubate Collaborate & Conceptualize
Adopt
Formulate a team to
identify enterprise
business needs and
analyze industry
trends to develop a
conceptual solution
Review and
consolidate with other
CAT activities and
Bureau-wide initiatives
Prototype/evaluate
solutions, develop
architecture and
design patterns and
establish standards
Support adoption
through the Standards
Working Group and
the Architecture
Review Board
An open door policy encourages participation of all Census
staff in CAT related innovation activities

171
Collection Processing Dissemination
• Grand Challenge Events
• Codeathons
• Cat in the Cloud
• Knowledge Sharing “CensusPedia”
• Product Evaluations
• Topical Networking Events
• Mobile Data Collection
• Support for Field Sites
• Process Automation
• Big Data Tools & Analytics
• API Promotion
• GEO Visualizations and
Tools
• Open Data PoCs
CEDCAP PoCs (Mobile Apps, Cloud, Performance Test Tools)
2020 Scale Up (Acquisitions, Mobile, Extranet Assessment, Testing, and Field Site Support)
Mission Enabling Services: Crosscutting
CAT Pilots and Proof of Concepts (POCs) align to the Census
Bureau’s lifecycle and crosscutting mission enabling services

172
• Codeathons • Open for Business
beta • Exploring Public
API Mashups
• 2020, GEO & CSM (Usability) Collaboration to Explore Non-ID Address Capture
• Place Comparison GIS Visualization Tool
• TIGERweb for mobile PoC
• Community TIGER PoC
Highlights
• Over 300 formal
requests
• 28 current requests
• 1721 visits last year
• SME level expertise in
mobile, visualization and
more
• Data Management System (DMS)
• Enterprise Platform PoCs
• A Bureau-wide strategy for mobile
• Mobile Device UX / Survey tool PoCs
• Intranet / Wiki Knowledge Sharing
• CensusPedia
• Editorial Calendar Tool
• Budget Request Response Tool
• SharePoint Sandboxes
CAT History of Success – Portfolios and CAT POCs/Projects/Activities

173
Technology Partnerships & Demonstrations
The CAT hosts and coordinates outreach efforts with industry, non-profit, other government agency, and academic organizations to bring new technology and partnerships to the Bureau
– Organizations below just a few examples

174

Benchmarking
Steve Brockelman, Director of the Office of Executive Councils,
Executive Office of the President
Doug Glenn, Deputy CFO and Director, Office of Financial
Management, Department of the Interior
Melinda Morgan, Director, Finance Staff, U.S. Department of Justice
Moderator: Stephanie Mango, Vice President, CGI Financial

Questions?

Thank You to our Gold Sponsors

Join the Conversation on Twitter!
@AGACGFM
@PerformanceInst
#GPSDC2015

Communicating Results to the
Public/Citizen Centric Reporting
Jason Bossie, Director of Performance Management, U.S. Small
Business Administration
Sherry Hunt, Intergovernmental Affairs and Special Projects Manager,
City of Suffolk
Moderator: Evie Berry, Director of Performance Reporting, AGA

Questions?

So What Does it Cost?
Janice Lambert, Deputy Chief Financial Officer, Federal Bureau of
Investigation
Mark Reger, Deputy Controller, U.S. Office of Management and Budget
Ron Crupi, Chief Financial Officer, National Labor Relations Board
Tim Gribben, Deputy Chief Financial Officer, U.S. Small Business
Administration
Moderator: Diane Denholm, Executive Director, The Performance Institute

Questions?

Join the Conversation on Twitter!
@AGACGFM
@PerformanceInst
#GPSDC2015

Thank You to Our Sponsors!

Measuring the Hard to Measure
Tim Bowling, Chief Quality Officer, U.S. Government Accountability
Office
Michael Darling, Director of Enterprise and Performance Management,
U.S. Department of Homeland Security
Francine F. Goldberg, Senior Level Advisor for Performance
Management, Office of the Executive Director of Operations, U.S.
Nuclear Regulatory Agency
Moderator: Denise Wu, Principal-in-Charge, Federal Government Services,
CliftonLarsonAllen

Questions?

Strategic Reviews – Best Practices
and Lessons Learned Rich Beck, Director, Office of Planning and Performance, U.S.
Department of the Interior
Kevin Bumatay, Director, Budget Policy, Execution and Reviews, U.S.
Department of Health and Human Services
Moderator: Betsy Newcomer, Performance Manager, U.S. Office of
Management and Budget

Federal Strategic Planning
and Performance
Betsy Newcomer Office of Management and Budget Executive Office of the President

The Strategic Reviews are:
An annual assessment which synthesizes available performance information
and evidence to inform budget, legislative, and management decisions
Conducted by agencies for each “Strategic Objective” in an agency Strategic
Plan, with OMB review
The Strategic Reviews will:
Help meet the needs of leadership in identifying opportunities for reform
proposals, executive actions, communications opportunities, etc.
Synthesize a broad evidence and information base (indicators, evaluations, risk
management, partner contributions, external factors, research, etc.) and prioritize
findings for decision-making
Make meaningful distinctions in performance, such as identifying areas
of noteworthy progress and significant challenges
Incentivize organizations to develop a culture focused on learning and
improving performance
Strategic Objectives and Reviews

Established Performance Improvement Roles and Responsibilities
Established roles for OMB Director, COO (usually Deputy), Performance Improvement
Officer (PIO), Goal Leaders, Performance Improvement Council (PIC)
Established Goal Framework and Performance Reviews
Modernized Performance Reporting
Established Performance.gov as the central source for performance reporting
Required government-wide list of programs, updated annually
Overview of the GPRA Modernization Act
(GPRAMA)
Goals
1. Federal Cross-Agency Priority (CAP) Goals
2. Agency Priority Goals (APGs)
3. Strategic Goals and Objectives
Timing
Every 4 years (next in Feb 2018)
Every 2 years (next in Feb 2016)
Every 4 years (next in Feb 2018)
Performance Reviews
Quarterly reviews by OMB Director/PIC
Quarterly reviews by agency COO/PIO
Annual strategic reviews by agencies and OMB

Government-Wide Performance

Agency Programs, Activities,
Management Etc…
Strategic Objective
Strategy 2
Inputs • Budget, human capital, etc.
Strategy 1
Federal Partners
Outputs
Does the program design fill a need?
Is our strategy effective?
Are we executing effectively?
Did we achieve our expected outputs?
Are we having the intended impact?
Do we have adequate capabilities, resources, and support? Are other Federal programs
contributing as expected?
Are there anticipated changes in the external environment, identified risks, or other factors likely to impact progress?
What does the evidence say about the following questions?
What evidence is lacking? What conclusions can we draw about
progress?
Impact, Outcomes, Customers
External Delivery Partners
Are non-Federal programs contributing as expected?
Anticipated changes in the environment, external factors, and potential risks 5
Example Goal Illustration

Analytical Perspectives: Delivering a High-Performance Government
https://www.whitehouse.gov/sites/default/files/omb/budget/fy2016/assets/ap_6_performance.pdf
Agency Progress www.performance.gov
Agency Guidance (OMB Circular A-11 Part 6 Sections 200-290 and Section 51)
http://www.whitehouse.gov/omb/circulars_a11_current_year_a11_toc
Questions?
Helpful Links

Questions?

Thank You to our Gold Sponsors

Join the Conversation on Twitter!
@AGACGFM
@PerformanceInst
#GPSDC2015

How Can the Data Act Help Improve
Performance? Michelle Earhart, Deputy Chief of Accounts, Tennessee Department of
Finance and Administration
Hudson Hollister, Executive Director, Data Transparency Coalition
Moderator: Evie Berry, Director of Performance Reporting, AGA

Questions?

Putting Performance to Work
Don Bice, Associate Director, Office of Budget and Program Analysis,
U.S. Department of Agriculture
David Frederickson, Director, Performance Management Center, U.S.
Department of Labor
Harriet Rubinson, CMS Chief Performance Officer, Centers for
Medicare and Medicaid Services
Moderator: Diane Denholm, Executive Director, The Performance Institute

Questions?

Thank You to Our Sponsors!

How Can the Data Act Help Improve
Performance? Michelle Earhart, Deputy Chief of Accounts, Tennessee Department of
Finance and Administration
Hudson Hollister, Executive Director, Data Transparency Coalition
Moderator: Evie Berry, Director of Performance Reporting, AGA

Questions?

Closing
Ann M. Ebberts, Chief Executive Officer, AGA

Thank You to Our Sponsors!