governor’s career technical education summit march 13, 2007 california labor & workforce...
TRANSCRIPT

Governor’s Career Technical Education
Summit
March 13, 2007
California Labor & Workforce Development AgencySecretary Victoria Bradshaw
Projected High Demand Jobs through 2014

Career Technical Education
•Demand-driven to reflect the jobs that will be available
•Relevant to reflect skill levels needed by industries
•Flexibility to adapt to changing industry & technology requirements
•Provide individuals opportunities to advance their career and/or upgrade their skills

Sampling Of High-Demand Jobs
•Employment Development Department’s Labor Market Information Division (LMID)•Based on Current &
Historical Employment Trends and Employer Surveys•Selection of Four Industry
Areas

Selected Occupations In:
Manufacturing
Infrastructure/Construction
Health Care
Automotive

Infrastructure/ Construction
• Welders, Cutters, Solderers & Brazers• Cement Masons & Concrete Finishers• Plumbers, Pipefitters, & Steamfitters• Carpenters• Electricians• Operating Engineers & Other Construction Equipment Operators• Environmental Engineering Technicians• Construction Managers• Civil Engineers

Infr
astr
uctu
re/ C
onst
ruct
ion
2004
- 2
014
Construction Managers
12,60012,600
12,10012,100
800800
15,00015,000
25,10025,100
73,10073,100
25,30025,300
12,50012,500
11,70011,700
Total Job
Openings
6,4006,400
6,4006,400
400400
8,2008,200
12,50012,500
31,80031,800
12,60012,600
5,7005,700
8,4008,400
Net Replacement
s
6,2006,200
5,7005,700
400400
6,8006,800
12,6012,6000
41,3041,3000
12,7012,7000
6,8006,800
3,3003,300
Growth
39,90039,900
35,40035,400
1,8001,800
31,80031,800
63,10063,100
195,500195,500
54,80054,800
28,50028,500
29,80029,800
Estimated
$35.3$35.344
$42.0$42.033
$22.0$22.077
$27.7$27.700
$22.7$22.777
$23.2$23.200
$21.6$21.600
$19.2$19.266
$14.9$14.955
Median Hourly Wage
Civil Engineers
Environmental Engineering Technicians
Operating Engineers & Other Construction Equipment Operators
Electricians
Carpenters
Plumbers, Pipefitters, & Steamfitters
Cement Masons & Concrete Finishers
Welders, Cutters, Solderers, Brazers
Occupation
46,10046,100
41,10041,100
2,2002,200
38,60038,600
75,70075,700
236,800236,800
67,50067,500
35,30035,300
33,10033,100
Projected

Manufacturing•Electrical & Electronic
Engineering Technicians•Welders, Cutters, Solderers, &
Brazers•Machinists•Sheet Metal Workers•Sales Representatives, Wholesale
& Manufacturing (except Technical & Scientific Products)
•Truck Drivers, Heavy, & Tractor-Trailer•Mechanical Engineers•Industrial Production Managers

Man
ufac
turin
g 20
04 -
201
4
4,9004,900
9,7009,700
51,80051,800
69,40069,400
9,0009,000
11,10011,100
11,70011,700
10,10010,100
Total Job Openings
3,5003,500
6,4006,400
23,40023,400
38,90038,900
4,8004,800
8,0008,000
8,4008,400
5,4005,400
Net Replacemen
ts
1,4001,400
3,3003,300
28,4028,4000
30,5030,5000
4,2004,200
3,1003,100
3,3003,300
4,7004,700
Growth
19,40019,400
26,50026,500
171,900171,900
178,500178,500
24,20024,200
37,30037,300
33,10033,100
30,40030,400
Projected
18,00018,000
23,20023,200
143,500143,500
148,000148,000
20,00020,000
34,20034,200
29,80029,800
25,70025,700
Estimated
$39.1$39.100
$37.5$37.522
$17.9$17.999
$24.5$24.599
$21.6$21.611
$18.0$18.000
$14.9$14.955
$25.1$25.133
Median
Hourly
Wage
Industrial Production Managers
Mechanical Engineers
Truck Drivers, Heavy & Tractor-Trailer
Sales Representative, Wholesale & Manufacturing, (Except Technical and Scientific Products)
Sheet Metal Workers
Machinists
Welders, Cutters, Solderers, & Brazers
Electrical & Electronic Engineering Technicians
Occupation

Health Care•Registered Nurses•Licensed Vocational Nurses•Medical Assistants•Dental Assistants•Pharmacy Technicians•Medical & Clinical
Laboratory Technicians•Physician Assistants

Hea
lthca
re 2
004
- 20
14
8,1008,1005,9005,900$39.7$39.722
14,40014,40012,00012,000$31.8$31.800
30,20030,20023,90023,900$16.0$16.088
58,20058,20041,30041,300$15.3$15.388
69,20069,20051,00051,000$13.3$13.344
64,80064,80053,60053,600$20.7$20.788
291,200291,200230,300230,300$33.8$33.855
3,1003,100
5,6005,600
9,4009,400
28,50028,500
27,60027,600
22,90022,900
109,100109,100
Total Job Openings
900900
3,2003,200
3,1003,100
11,60011,600
9,4009,400
11,70011,700
48,20048,200
Net Replacemen
ts
2,2002,200
2,4002,400
6,3006,300
16,9016,9000
18,2018,2000
11,2011,2000
60,9060,9000
Growth
Projected
Estimated
Median
Hourly
Wage
Physician Assistants
Medical & Clinical Laboratory Technologists
Pharmacy Technicians
Dental Assistants
Medical Assistants
Licensed Vocational Nurses
Registered Nurses
Occupation

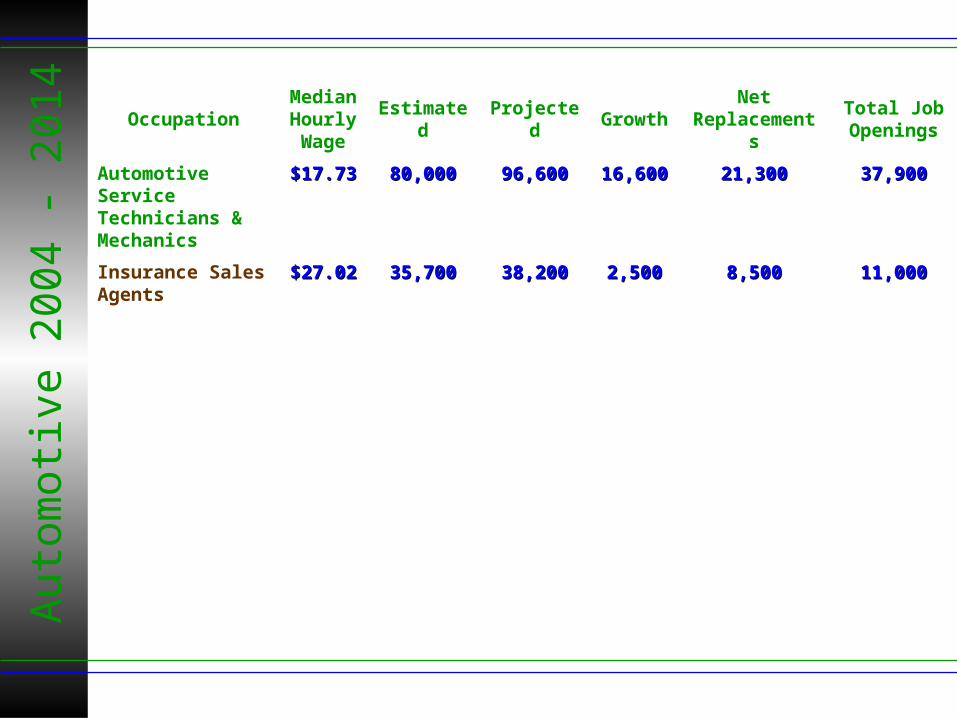
Automotive
•Automotive Service Technicians & Mechanics
•Insurance Sales Agents
Aut
omot
ive
2004
- 2
014
38,20038,20035,70035,700$27.0$27.022
Insurance Sales Agents
96,60096,60080,00080,000$17.7$17.733
Automotive Service Technicians & Mechanics
11,00011,000
37,90037,900
Total Job Openings
8,5008,500
21,30021,300
Net Replacemen
ts
2,5002,500
16,6016,6000
Growth
Projected
Estimated
Median
Hourly
Wage
Occupation

Again…
•Demand-driven to reflect the jobs that will be available
•Relevant to reflect skill levels needed by industries
•Flexibility to adapt to changing industry & technology requirements
•Provide individuals opportunities to advance their career and/or upgrade their skills