govt. of india ministry of human resource development dept
TRANSCRIPT
1
Govt. of India
Ministry of Human Resource Development
Dept. of School Education and Literacy
Mid-Day Meal Division
PAB-MDM meeting
to consider and approve AWP&B 2020-21
(Date of the meeting: 29.05.2020)
APPRAISAL NOTE
STATE: Tamil Nadu
INDEX
Sl. No. CHAPTER Page no.
Overview Pre-requisite steps for submission of AWP&B
Main Issues from Appraisal
Best practices
Part-A General Information
Part-B Review of performance during 2019-20
Part-C Recommendations of Appraisal team and quantification of
variables for central assistance during 2020-21
Part-D Analysis sheet.
2
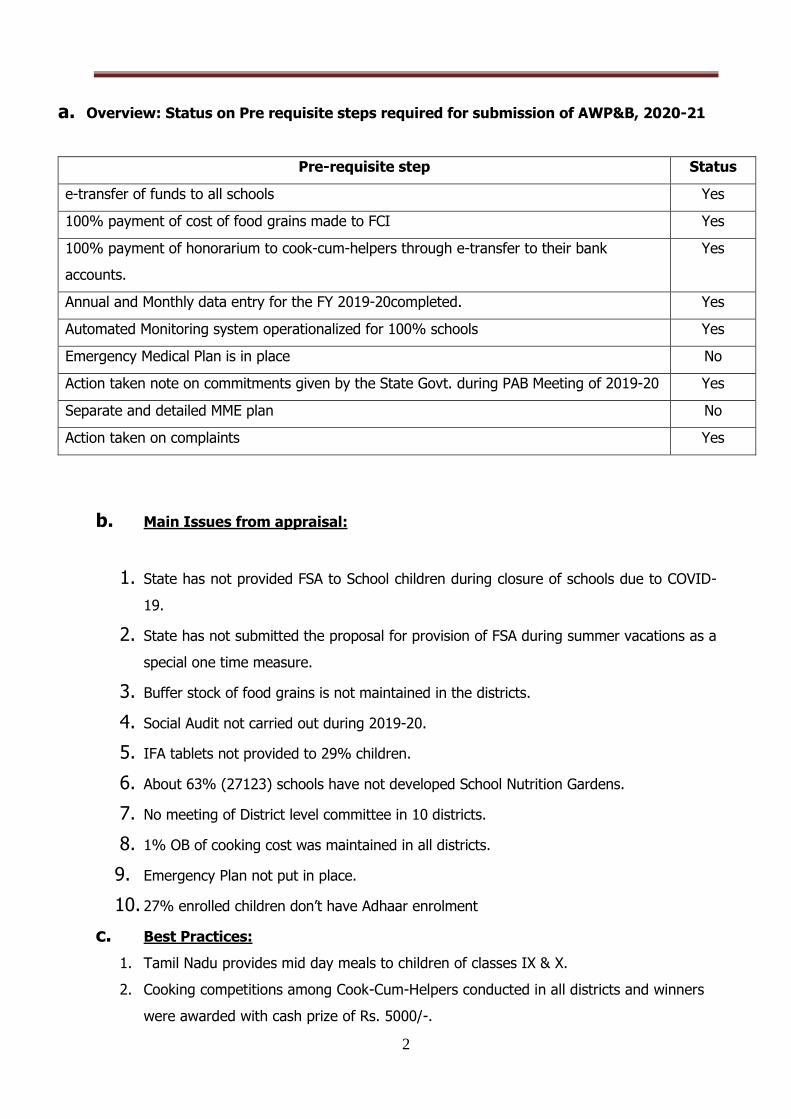
a. Overview: Status on Pre requisite steps required for submission of AWP&B, 2020-21
Pre-requisite step Status
e-transfer of funds to all schools Yes
100% payment of cost of food grains made to FCI Yes
100% payment of honorarium to cook-cum-helpers through e-transfer to their bank
accounts.
Yes
Annual and Monthly data entry for the FY 2019-20completed. Yes
Automated Monitoring system operationalized for 100% schools Yes
Emergency Medical Plan is in place No
Action taken note on commitments given by the State Govt. during PAB Meeting of 2019-20 Yes
Separate and detailed MME plan No
Action taken on complaints Yes
b. Main Issues from appraisal:
1. State has not provided FSA to School children during closure of schools due to COVID-
19.
2. State has not submitted the proposal for provision of FSA during summer vacations as a
special one time measure.
3. Buffer stock of food grains is not maintained in the districts.
4. Social Audit not carried out during 2019-20.
5. IFA tablets not provided to 29% children.
6. About 63% (27123) schools have not developed School Nutrition Gardens.
7. No meeting of District level committee in 10 districts.
8. 1% OB of cooking cost was maintained in all districts.
9. Emergency Plan not put in place.
10. 27% enrolled children don’t have Adhaar enrolment
c. Best Practices:
1. Tamil Nadu provides mid day meals to children of classes IX & X.
2. Cooking competitions among Cook-Cum-Helpers conducted in all districts and winners
were awarded with cash prize of Rs. 5000/-.
3
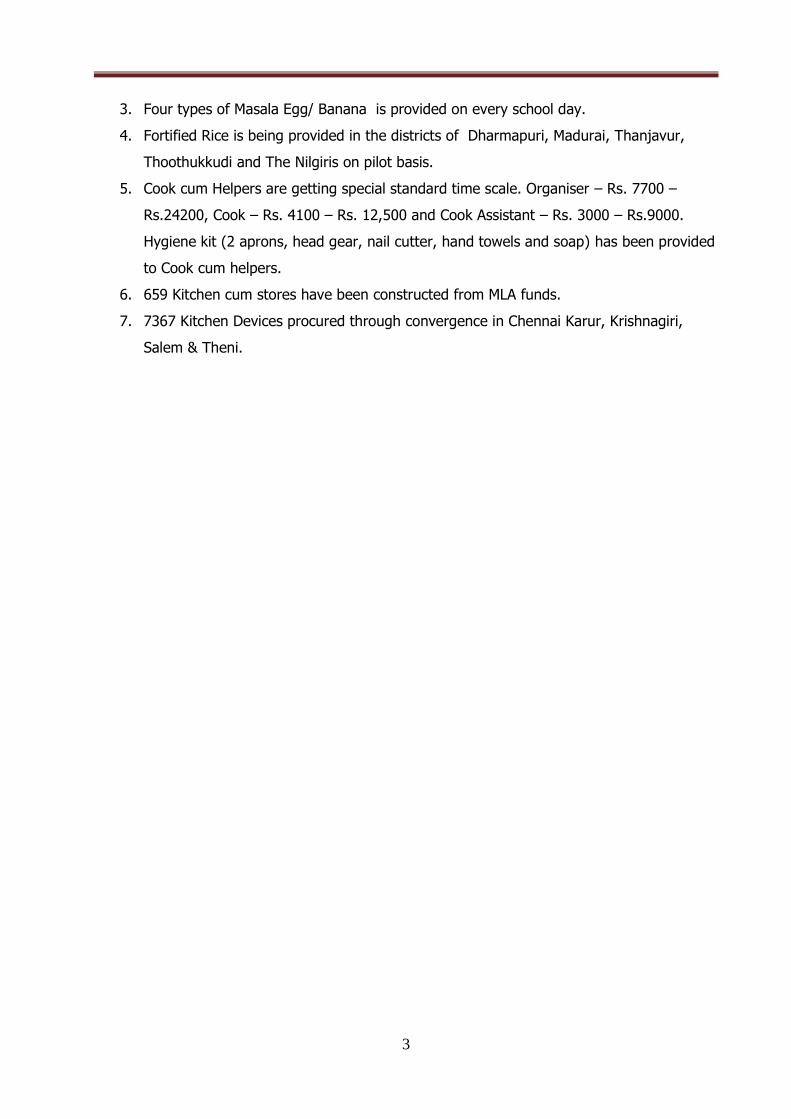
3. Four types of Masala Egg/ Banana is provided on every school day.
4. Fortified Rice is being provided in the districts of Dharmapuri, Madurai, Thanjavur,
Thoothukkudi and The Nilgiris on pilot basis.
5. Cook cum Helpers are getting special standard time scale. Organiser – Rs. 7700 –
Rs.24200, Cook – Rs. 4100 – Rs. 12,500 and Cook Assistant – Rs. 3000 – Rs.9000.
Hygiene kit (2 aprons, head gear, nail cutter, hand towels and soap) has been provided
to Cook cum helpers.
6. 659 Kitchen cum stores have been constructed from MLA funds.
7. 7367 Kitchen Devices procured through convergence in Chennai Karur, Krishnagiri,
Salem & Theni.
8. ………..…………….
4
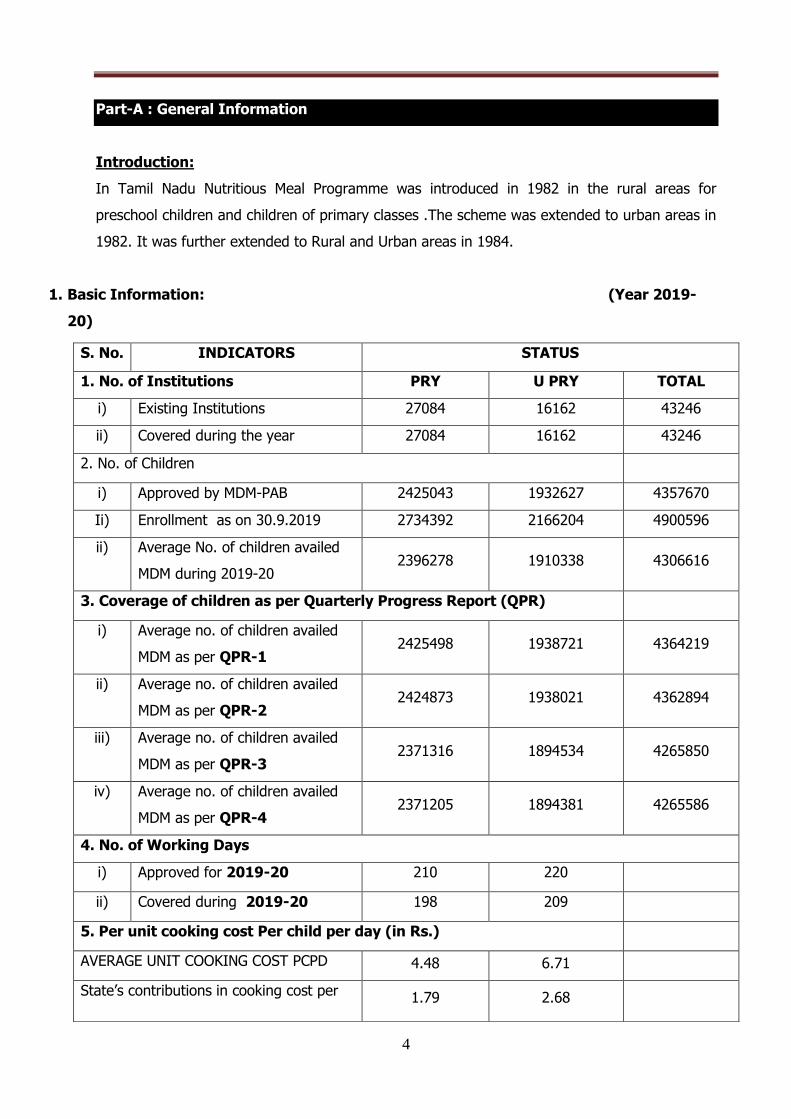
Part-A : General Information
Introduction:
In Tamil Nadu Nutritious Meal Programme was introduced in 1982 in the rural areas for
preschool children and children of primary classes .The scheme was extended to urban areas in
1982. It was further extended to Rural and Urban areas in 1984.
1. Basic Information: (Year 2019-
20)
S. No. INDICATORS STATUS
1. No. of Institutions PRY U PRY TOTAL
i) Existing Institutions 27084 16162 43246
ii) Covered during the year 27084 16162 43246
2. No. of Children
i) Approved by MDM-PAB 2425043 1932627 4357670
Ii) Enrollment as on 30.9.2019 2734392 2166204 4900596
ii) Average No. of children availed
MDM during 2019-20 2396278 1910338 4306616
3. Coverage of children as per Quarterly Progress Report (QPR)
i) Average no. of children availed
MDM as per QPR-1 2425498 1938721 4364219
ii) Average no. of children availed
MDM as per QPR-2 2424873 1938021 4362894
iii) Average no. of children availed
MDM as per QPR-3 2371316 1894534 4265850
iv) Average no. of children availed
MDM as per QPR-4 2371205 1894381 4265586
4. No. of Working Days
i) Approved for 2019-20 210 220
ii) Covered during 2019-20 198 209
5. Per unit cooking cost Per child per day (in Rs.)
AVERAGE UNIT COOKING COST PCPD 4.48 6.71
State’s contributions in cooking cost per 1.79 2.68
5
Part-B :Review of Performance in 2019-20(01.04.19 to 31.03.2020)
2. Based on the information provided by the State administration in its AWP&B 2020-21,
the performance during 2019-20 (01.04.19 to 31.03.2020) was reviewed. The major issues in
implementation during 2019-20 are summarized as under: -
2.0 Coverage of Institutions
Coverage in terms of No. of institutions.
Difference between Existing Vs No. of institutions covered (Achievement) –
i) PRIMARY
The number of existing institutions = 27084
Number of institutions covered during 2019-20 = 27084 (100%)
ii) UPPER PRIMARY & UPPER PRIMARY WITH PRIMARY
The number of existing institutions = 16162
Number of institutions covered during 2019-20 = 16162 (100%)
2.1 Average number of children availed MDM vis-à-vis enrolment
2.1.1 a) Primary - Coverage in terms of No. of children. Difference between
Enrolment vs. Average No. of Children Availed MDM (Achievement) (Refer
Table 2.3 of the Analysis Sheet).
Total Enrolment as on 30.09.2019 = 2734392
Average number of children availed MDM during 2019-20 = 2396278 (88%)
b) Upper Primary: Coverage in terms of No. of children. Difference between
Enrolment vs Average No. of Children Availed MDM (Achievement) – UPPER
PRIMARY (Refer Table 2.4 of the Analysis Sheet).
Total Enrolment as on 30.09.2019 = 2166204
Average number of children availed MDM during 2019-20 =1910338 (88%)
child per day
6
The coverage of children was observed to be 88% in both primary and Upper Primary
classes. The coverage was found to be less than state average in the districts of
Kanyakumari (76%), Coimbatore (73%), Chennai (73%) Tirupur (76%). However the
coverage of children was higher than the state average in the districts of Nilgiris (99%),
Dharmapuri (99%) and Tuticorin (105%). The State Government is requested to strengthen
the monitoring mechanism and keep checks on data being submitted by the districts.
2.1.2 Average number of children availed MDM vis-à-vis PAB-MDM approval :
a) Primary : Coverage in terms of No. of children. Difference between PAB
Approval
(Target) vs. Average No. of Children Availing MDM (Achievement)
(Refer Table 2.5 of the Analysis Sheet).
The number of children approved by MDM PAB for 2019-20 = 2425043
Average number of children availed MDM during 2019-20 = 2396278 (99%)
b) Upper Primary: Coverage in terms of No. of children. Difference between
PAB Approval
(Target) Vs Average No. of Children Availing MDM (Achievement) (Refer
Table 2.6 of the Analysis Sheet).
The number of children approved by MDM PAB for 2019-20 =1932627
Average number of children availed MDM during 2019-20 = 1910338 (99%)
2.1.3 No. of Meals: Difference between No. of meal to be served (Target) Vs. No. of
meals Served (Achievement) - PY+U PY (Refer Table 2.7 of the Analysis
Sheet).
The number of meals to be served during 2019-20 = 936162330
The number of meals served during 2019-2 =875270877 (93%)
2.2 FOODGRAINS
2.2.1 Level of Opening Balance as on 01.04.19: (Refer Table 3.2 of the Analysis
Sheet).
The State has Nil (0%) MTs of food-grains as opening balance against the total allocation of
114961.41 MTs for 2019-20 as on 1.4.19.
As per MDM Guidelines, State should maintain buffer stock of food grains for the smooth
implementation of MDM scheme. State Government of Tamil Nadu had nil opening balance.
7
State Government has to put on place a system of maintaining a buffer stock in every school. A
report may be furnished regarding action taken in this regard.
2.2.2 Level of unspent balance as on 31.03.20: (Refer Table 3.3 of the Analysis
Sheet).
The State level closing balance as on 31.03.20 is (-) 27824.33 MTs (-24%) against the total
allocation of114961.41 MTs.
Negative closing balance at the end of the year reflects that State has not lifted its entire quota
of food-grains from the FCI. State needs to clarify why the whole quota was not lifted and how
it managed to served meals without availability of adequate amounts of foodgrains.
2.2.3 Availability of Food grains: (01.04.19 to 31.03.20) : (Refer Table 3.5 of the
Analysis sheet)
The districts should have availability of at least 100 % of the food grains allocation. State level
availability as on 31.03.20 was 69% of the total allocation.
2.2.4 Utilization of food grains: (Refer Table 3.7 of the Analysis sheet)
An analysis of the utilization of food grains during 2019-20 shows that State has utilized
107567.48 (94%) of the allocated food grains, although the availability of food-grains was only
69%. State needs to clarify how it managed to serve meals without availability of adequate
amounts of food-grains.
2.2.5 Payment of cost of foodgrains to FCI: (Refer Table 3.9 of the Analysis sheet)
The FCI has submitted bills for Rs 2392.29 crore during 2019-20 towards cost of food grains.
The State has made full payment to FCI. However, as per FCI statement the pendency is Rs.
81.54 lakhs on 31.03.2020. State Govt. needs to reconcile the data with FCI.
2.3 COOKING COST (PRIMARY + UPPER PRIMARY)
2.3.1 Level of Opening balance as on 01.04.19: (Refer Table 4.1.1 of the Analysis
Sheet)
The State had reported Rs 703.45 lakh as opening balance at the beginning of the financial
year 2019-20. District wise analysis shows that all the districts had 1% opening balance vis-à-
vis annual allocation. This seems highly unlikely, provided the coverage of children varies from
district to district. The State Government is requested to strengthen the monitoring mechanism
and keep checks on data being submitted by the districts.
2.3.2 Level of closing balance as on 31.03.2020: (Refer Table 4.1.2 of the Analysis
Sheet)
8
The State had closing balance of Rs. 12313.63 (16 % of allocation) towards cooking cost as on
31.03.20.
2.3.3 Utilization of Cooking cost: (Refer Table 4.5 of the Analysis Sheet)
The districts should have utilized 100 % of the allocation of cooking cost. State level utilization
is 84%. At the district level the utilization ranges between 81% to 86 %.
2.4Reconciliation of utilization and performance during 2019-20 (1.4.19 to 31.03.20)
2.4.1Mismatch, if any, in utilization of Food grains vis-à-vis cooking cost: (Refer Table –
5.1 of Analysis Sheet)
During the appraisal a mismatch of 10% was observed in the utilization of food grains (94%)
and cooking cost (84%). State Government is requested to submit a report on the mismatch of
food grains and cooking cost.
2.5 Cook-Cum-Helper (PRIMARY + UPPER PRIMARY):
PAB-MDM has approved 128130 cook-cum-helpers to be engaged during 2019-20 in the State,
the State has engaged all the approved 128130 cook-cum-helpers. The State has utilized 100
% of the allocated funds for payment of honorarium to cook cum helper. The State has
proposed the same number i.e. 128130 Cook-Cum-Helpers cooks to engage during 2020-21.
2.6 Utilization of MME(Refer Table – 7.2 of Analysis Sheet)
Against the allocation of Rs. 1181.64 Lakh as Central Assistance towards MME funds, the State
has informed about 100% utilization of funds for MME.
2.7Utilization of Transportation Assistance(Refer Table – 8.2 of Analysis Sheet)
Against the allocation of Rs. 1724.42 lakh as Central Assistance towards funds for
Transportation Assistance the State has utilized Rs.972.73 lakh (56%).
2.8 Construction of Kitchen-cum-stores (Reference Table -9.1.2 of Analysis Sheet)
Central assistance of Rs. 45007.6 Lakh has been released for construction of 28470 Kitchen-
cum-Stores. As on 31.03. 2020, construction has been completed for 27792 Kitchen-cum-stores
and construction work is in progress for 344. kitchen-cum-stores. The State Government has
not started any construction work for 334 kitchen-cum-stores.
2.9 Procurement of Kitchen devices (Reference Table -9.2.2 of Analysis sheet)
Central assistance of Rs. 2714.8 lakh has been released towards procurement of 54296 units of
kitchen devices during 2006-07 to 2019-20. The State has reported that all units of kitchen
devices have been procured.
2.10 Procurement of Replacement of Kitchen devices (Reference Table -9.2.2 of Analysis
sheet)
9
Central assistance of Rs. 2612.99 lakh has been released towards replacement of 47603 units
of kitchen devices during 2019-20. The State has reported that 41284 units of kitchen devices
have been procured. 6319 units in progress of procurement.
3. Data Entry Status on the MIS Web Portal
In order to smooth function of MDMS, Ministry of HRD, MDM Division has developed web based
monitoring system i.e. Web based MIS in collaboration with NIC. In this web portal
State/District/Block users have to make Annual and Monthly data entry into the web portal
through online. The State should monitor data entry activities to be made timely manner by
District/Block users into the portal. The Annual and monthly data entry status as on December,
2019 of the State is given below:-
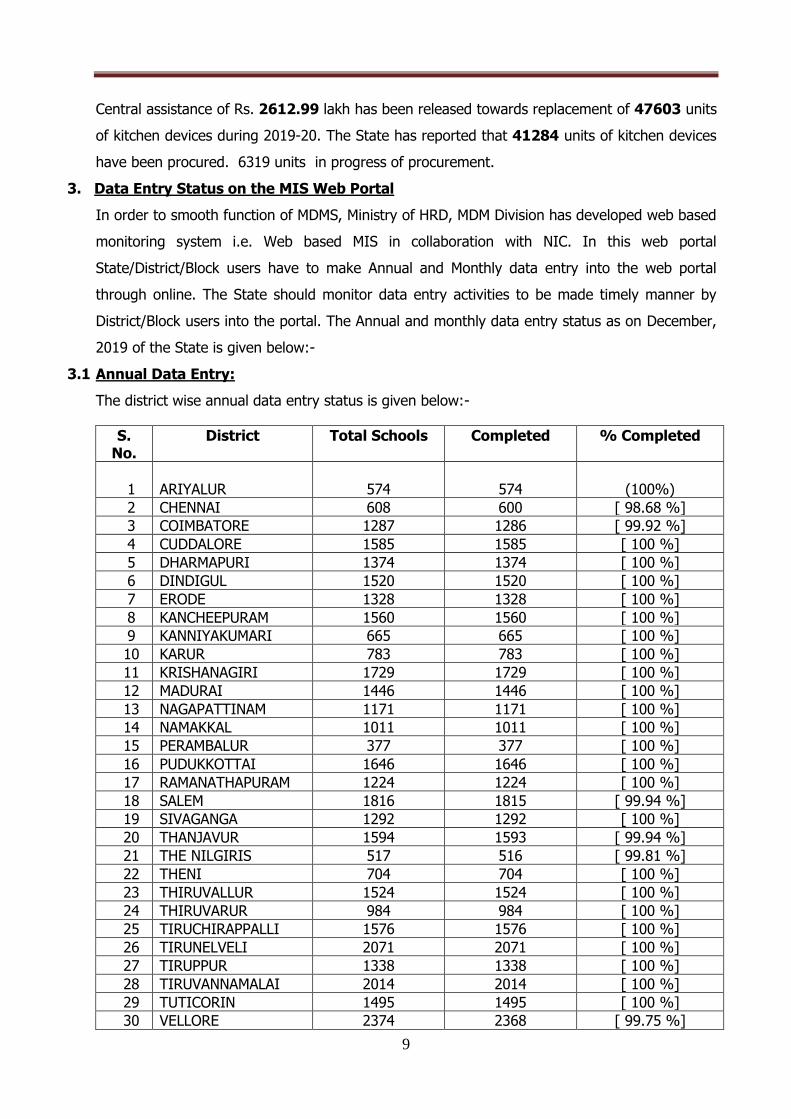
3.1 Annual Data Entry:
The district wise annual data entry status is given below:-
S. No.
District Total Schools Completed % Completed
1 ARIYALUR 574
574
(100%)
2 CHENNAI 608 600 [ 98.68 %]
3 COIMBATORE 1287 1286 [ 99.92 %]
4 CUDDALORE 1585 1585 [ 100 %]
5 DHARMAPURI 1374 1374 [ 100 %]
6 DINDIGUL 1520 1520 [ 100 %]
7 ERODE 1328 1328 [ 100 %]
8 KANCHEEPURAM 1560 1560 [ 100 %]
9 KANNIYAKUMARI 665 665 [ 100 %]
10 KARUR 783 783 [ 100 %]
11 KRISHANAGIRI 1729 1729 [ 100 %]
12 MADURAI 1446 1446 [ 100 %]
13 NAGAPATTINAM 1171 1171 [ 100 %]
14 NAMAKKAL 1011 1011 [ 100 %]
15 PERAMBALUR 377 377 [ 100 %]
16 PUDUKKOTTAI 1646 1646 [ 100 %]
17 RAMANATHAPURAM 1224 1224 [ 100 %]
18 SALEM 1816 1815 [ 99.94 %]
19 SIVAGANGA 1292 1292 [ 100 %]
20 THANJAVUR 1594 1593 [ 99.94 %]
21 THE NILGIRIS 517 516 [ 99.81 %]
22 THENI 704 704 [ 100 %]
23 THIRUVALLUR 1524 1524 [ 100 %]
24 THIRUVARUR 984 984 [ 100 %]
25 TIRUCHIRAPPALLI 1576 1576 [ 100 %]
26 TIRUNELVELI 2071 2071 [ 100 %]
27 TIRUPPUR 1338 1338 [ 100 %]
28 TIRUVANNAMALAI 2014 2014 [ 100 %]
29 TUTICORIN 1495 1495 [ 100 %]
30 VELLORE 2374 2368 [ 99.75 %]
10
31 VILUPPURAM 2409 2409 [ 100 %]
32 VIRUDHUNAGAR 1473 1473 [ 100 %]
Total 43069 43051 [ 99.96 %]
Observations – It was observed that Annual data entry is pending in the districts of Vellore, The
Nilgiris, Salem, Coimbatore and Chennai. State Government may ensure the entries may be
completed in a time bound manner.
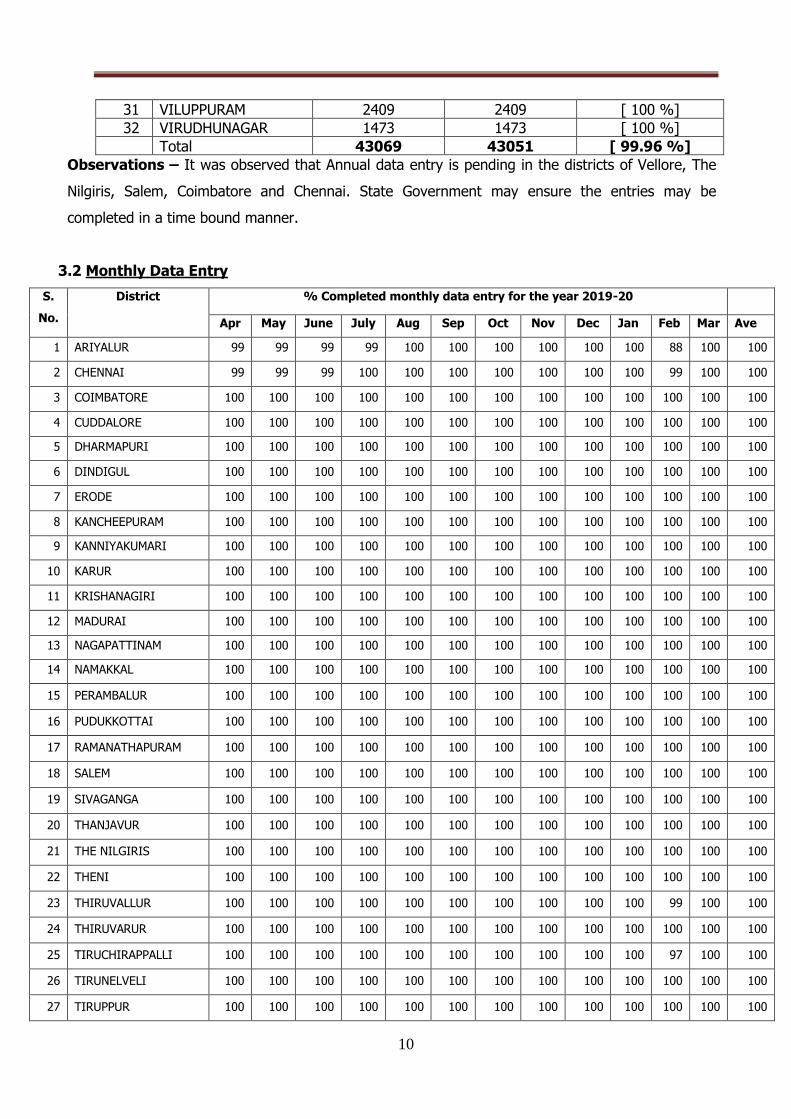
3.2 Monthly Data Entry
S.
No.
District % Completed monthly data entry for the year 2019-20
Apr May June July Aug Sep Oct Nov Dec Jan Feb Mar Ave
1 ARIYALUR 99 99 99 99 100 100 100 100 100 100 88 100 100
2 CHENNAI 99 99 99 100 100 100 100 100 100 100 99 100 100
3 COIMBATORE 100 100 100 100 100 100 100 100 100 100 100 100 100
4 CUDDALORE 100 100 100 100 100 100 100 100 100 100 100 100 100
5 DHARMAPURI 100 100 100 100 100 100 100 100 100 100 100 100 100
6 DINDIGUL 100 100 100 100 100 100 100 100 100 100 100 100 100
7 ERODE 100 100 100 100 100 100 100 100 100 100 100 100 100
8 KANCHEEPURAM 100 100 100 100 100 100 100 100 100 100 100 100 100
9 KANNIYAKUMARI 100 100 100 100 100 100 100 100 100 100 100 100 100
10 KARUR 100 100 100 100 100 100 100 100 100 100 100 100 100
11 KRISHANAGIRI 100 100 100 100 100 100 100 100 100 100 100 100 100
12 MADURAI 100 100 100 100 100 100 100 100 100 100 100 100 100
13 NAGAPATTINAM 100 100 100 100 100 100 100 100 100 100 100 100 100
14 NAMAKKAL 100 100 100 100 100 100 100 100 100 100 100 100 100
15 PERAMBALUR 100 100 100 100 100 100 100 100 100 100 100 100 100
16 PUDUKKOTTAI 100 100 100 100 100 100 100 100 100 100 100 100 100
17 RAMANATHAPURAM 100 100 100 100 100 100 100 100 100 100 100 100 100
18 SALEM 100 100 100 100 100 100 100 100 100 100 100 100 100
19 SIVAGANGA 100 100 100 100 100 100 100 100 100 100 100 100 100
20 THANJAVUR 100 100 100 100 100 100 100 100 100 100 100 100 100
21 THE NILGIRIS 100 100 100 100 100 100 100 100 100 100 100 100 100
22 THENI 100 100 100 100 100 100 100 100 100 100 100 100 100
23 THIRUVALLUR 100 100 100 100 100 100 100 100 100 100 99 100 100
24 THIRUVARUR 100 100 100 100 100 100 100 100 100 100 100 100 100
25 TIRUCHIRAPPALLI 100 100 100 100 100 100 100 100 100 100 97 100 100
26 TIRUNELVELI 100 100 100 100 100 100 100 100 100 100 100 100 100
27 TIRUPPUR 100 100 100 100 100 100 100 100 100 100 100 100 100
11
28 TIRUVANNAMALAI 100 100 100 100 100 100 100 100 100 100 100 100 100
29 TUTICORIN 100 100 100 100 100 100 100 100 100 100 100 100 100
30 VELLORE 100 100 100 100 100 100 100 100 100 100 100 100 100
31 VILUPPURAM 100 100 100 100 100 100 100 100 100 100 100 100 100
32 VIRUDHUNAGAR 100 100 100 100 100 100 100 100 100 100 100 100 100
TOTAL 100 100 100 100 100 100 100 100 100 100 100 100 100
3.4 Automated Monitoring System
State Government of Tamil Nadu has instructed the work of collection of data under AMS by
the Headmaster/Headmistress or authorized person (2 teachers). The Headmasters of
respective school is reporting of the daily data of children coverage of MDM under SMS
reporting system and to Education Department also. State Government has also issued
instruction to the District for rolling out 100% SMS monitoring system. The information
under SMS is validated through BSNL Chennai Telephones. Instructions have also been
issued to District Collectors to conduct special meetings of the block level staff, officials of
Education Department and with Headmasters of schools for emphasizing the need of this
SMS reporting system.
4. Release of funds
The funds are released by State Government of Tamil Nadu districts. The funds are further
released further to Block Development Officer. The BDO releases the funds to Noon Meal
Centres (Organizers bank account through ECS) in advance without waiting for release of
central assistance. The NMP Organizers draws money required for Vegetables and fuel charges
one week in advance to incur the above expenditure.
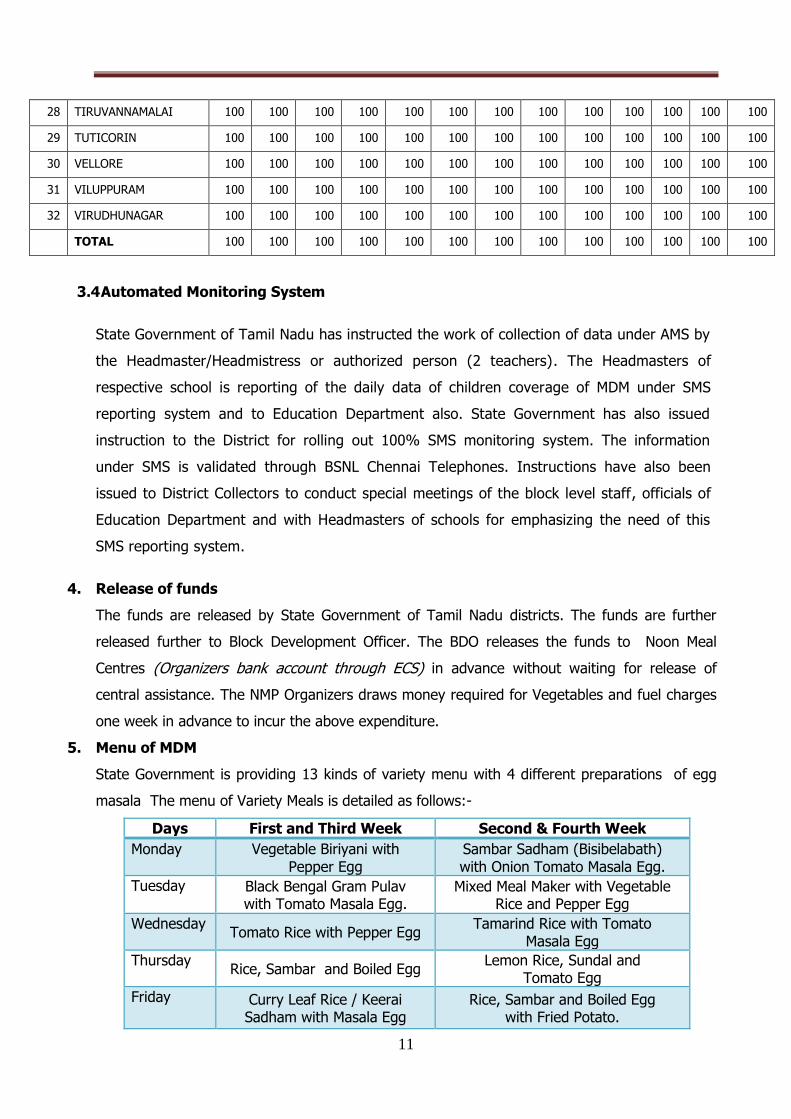
5. Menu of MDM
State Government is providing 13 kinds of variety menu with 4 different preparations of egg
masala The menu of Variety Meals is detailed as follows:-
Days First and Third Week Second & Fourth Week
Monday Vegetable Biriyani with Pepper Egg
Sambar Sadham (Bisibelabath) with Onion Tomato Masala Egg.
Tuesday Black Bengal Gram Pulav with Tomato Masala Egg.
Mixed Meal Maker with Vegetable Rice and Pepper Egg
Wednesday Tomato Rice with Pepper Egg
Tamarind Rice with Tomato Masala Egg
Thursday Rice, Sambar and Boiled Egg
Lemon Rice, Sundal and Tomato Egg
Friday Curry Leaf Rice / Keerai Sadham with Masala Egg
Rice, Sambar and Boiled Egg with Fried Potato.
12
and Chilly Fried Potato.
State Government has mentioned that fried potato is an additional item provided to children on
every Friday.
6. School Nutrition Gardens
State Government has mentioned that School Nutrition Gardens has been setup to all the Noon
Meal Centres in co-ordination with the Horticulture Department except Nilgiris. Lemon Plants
have been provided to Nilgiris district based on the climatic condition. In 10024 schools setting
up of SNGs have been initiated 2019-20. State Government has been proposed to setup kitchen
garden in 27123 schools during 2020-21. NGOs like Ekam Foundation, Adaikalam Trust are also
involved in setting up of SNGs in the state.
7. Supplementary Nutrition
State Government of Tamil Nadu did not proposed to provide supplementary Nutrition during
2019-20. Further the State has also not proposed for 2020-21 also.
8. Community Participation (Tithi Bhojan etc.)
Observations – Tithi Bhojan by the name Nalvirundhu has been initiated in some schools with the
help of community, NGOs, Social Organisations. Additional food items like vada, kesari/payasam,
fry arms, vegetable biriyani, Poori, Bananas are being provided in plantain leafs. Along with
meals some donors are also providing Stainless steel serving vessels, Plastic Bins, Gas Stoves,
Mats, Note books etc .
9. Monitoring Mechanism
State Government of Tamil Nadu has informed that SMCs are monitoring implementation of the
mid day meal scheme and overseeing the quality of meals provided to the children, cleanliness
of the place of cooking and maintenance of hygiene in implementation of mid day meal scheme.
The performances of Districts are being reviewed every month a state level.
10. Social Audit
State Government of Tamil Nadu has not carried out social audit during 2019-20. However the
State has proposed that Social Audit will be taken up during 2020-21. The Director of Social
Audit under National Rural Employment Guarantee scheme has been entrusted with the task of
13
conducting of Social Audit. Social Audit will be conducted in 100 Noon Meal Centers across the
state during the year.
11. Testing of meals
State Government of Tamil Nadu has mentioned that Testing of Meals of Cooked food is being
done through Government food testing laboratories namely King Institute, Chennai,
Government food testing lab, Salem, Coimbatore, Madurai, Thanjavur and Tirunelveli. State
Government has procured Food Safety containers and distributed to the blocks which maintains
the temperature till it reaches the lab. Monthly 2 to 3 samples are drawn randomly from the
block Noon Meal Centres of the Districts. Micro-biological analysis for total plate count, E.Coli,
staphylococcus aureus, salmonella is being done.
12. Tasting of Meal
State Education Department has issued necessary instructions for tasting the food by the
Teachers and to maintain a taste register also. In addition the Commissioner of Social Welfare
has insisted the Noon Meal Cooks and Cook Assistant to taste the food ½ an hour before
serving the food to the Children.
13. Centralized Kitchens and involvement of NGOs
No centralized kitchens is associated in cooking or serving MDM in the state
14. Cooking Competition
District level cooking competitions have been conducted in all Districts and the cooks were
awarded with cash prize of Rs. 5000/- by the District Collector during the Independence day
functions.
15. Capacity Building
The cook and cook assistant have been given training through Hotel Management and
catering technology , Chennai, Every year training is being given to all the Cook and Cook
Assistant with regard to cooking of Mid Day meal, Personal hygiene, maintenance of kitchen
cum store room etc., through Food Safety Officers, Medical Officer, Fire Safety Officers and
Child Development Project Officers.
16. Contingency Plan to avoid any untoward incident
No emergency plan has been put in place to avoid any untoward incident.
14
--oOo--
15
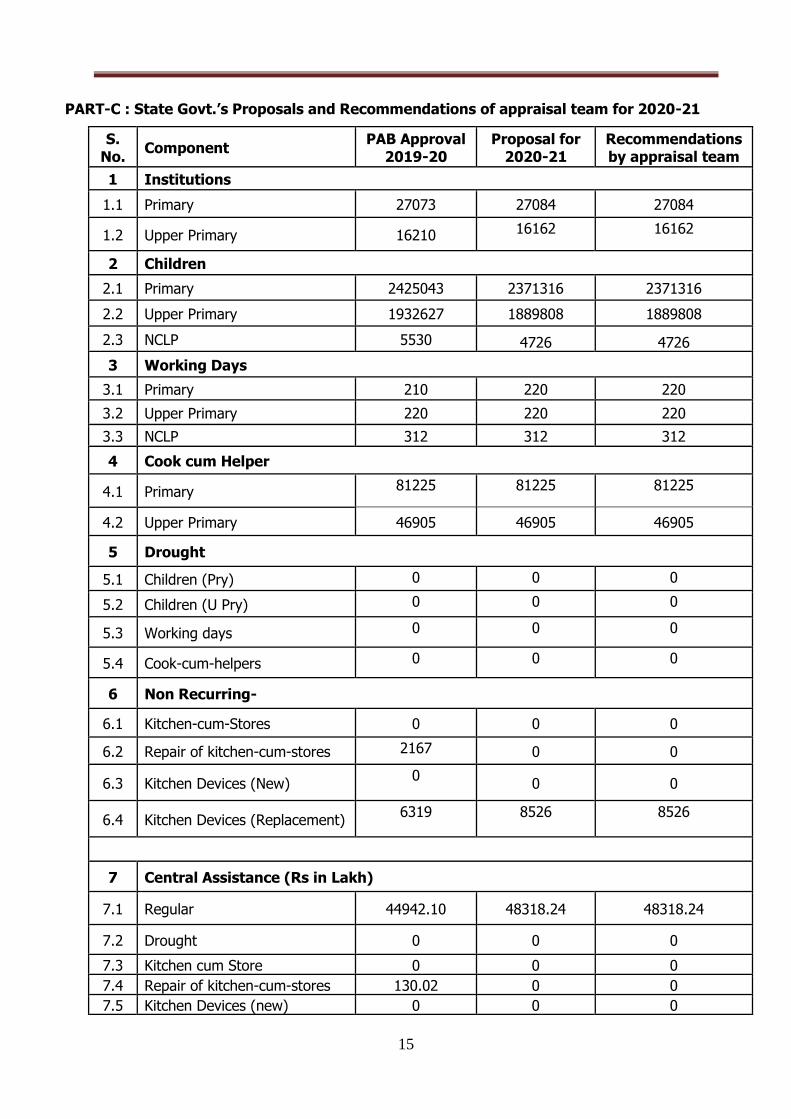
PART-C : State Govt.’s Proposals and Recommendations of appraisal team for 2020-21
S. No.
Component PAB Approval
2019-20 Proposal for
2020-21 Recommendations by appraisal team
1 Institutions
1.1 Primary 27073 27084 27084
1.2 Upper Primary 16210 16162 16162
2 Children
2.1 Primary 2425043 2371316 2371316
2.2 Upper Primary 1932627 1889808 1889808
2.3 NCLP 5530 4726 4726
3 Working Days
3.1 Primary 210 220 220
3.2 Upper Primary 220 220 220
3.3 NCLP 312 312 312
4 Cook cum Helper
4.1 Primary 81225 81225 81225
4.2 Upper Primary 46905 46905 46905
5 Drought
5.1 Children (Pry) 0 0 0
5.2 Children (U Pry) 0 0 0
5.3 Working days 0 0 0
5.4 Cook-cum-helpers 0 0 0
6 Non Recurring-
6.1 Kitchen-cum-Stores 0 0 0
6.2 Repair of kitchen-cum-stores 2167 0 0
6.3 Kitchen Devices (New) 0
0 0
6.4 Kitchen Devices (Replacement) 6319 8526 8526
7 Central Assistance (Rs in Lakh)
7.1 Regular 44942.10 48318.24 48318.24
7.2 Drought 0 0 0
7.3 Kitchen cum Store 0 0 0
7.4 Repair of kitchen-cum-stores 130.02 0 0
7.5 Kitchen Devices (new) 0 0 0
16
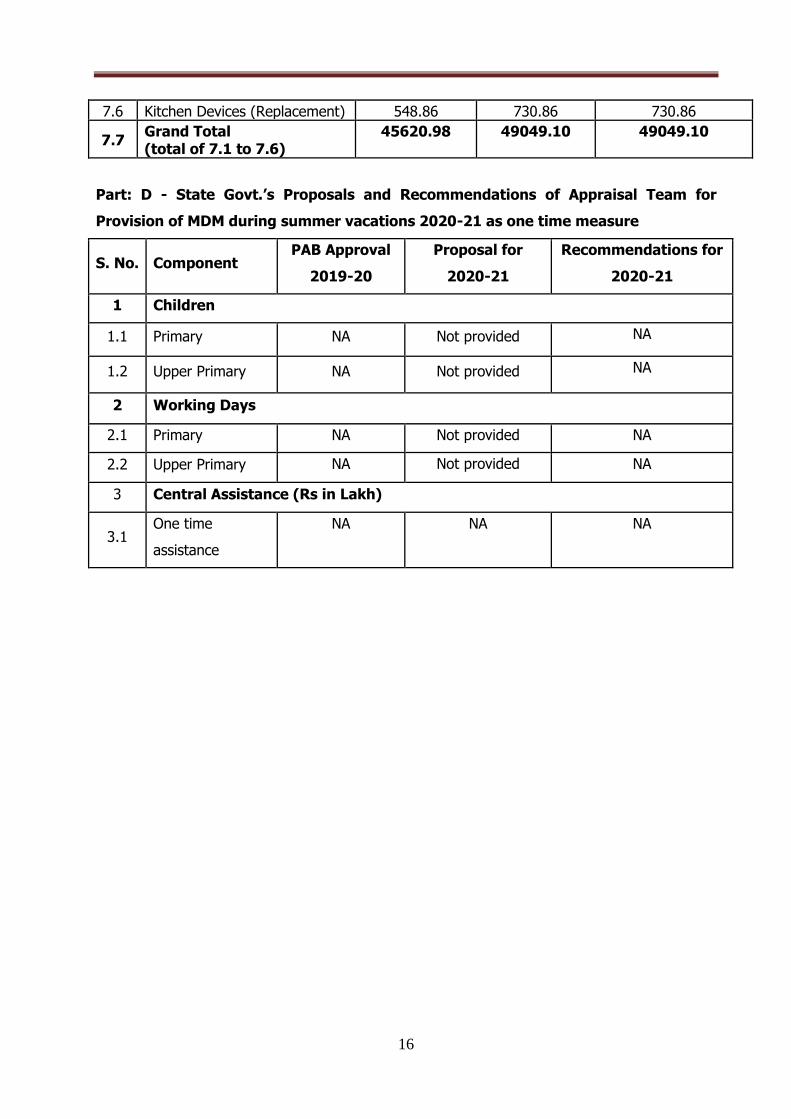
7.6 Kitchen Devices (Replacement) 548.86 730.86 730.86
7.7 Grand Total (total of 7.1 to 7.6)
45620.98 49049.10 49049.10
Part: D - State Govt.’s Proposals and Recommendations of Appraisal Team for
Provision of MDM during summer vacations 2020-21 as one time measure
S. No. Component PAB Approval
2019-20
Proposal for
2020-21
Recommendations for
2020-21
1 Children
1.1 Primary NA Not provided NA
1.2 Upper Primary NA Not provided NA
2 Working Days
2.1 Primary NA Not provided NA
2.2 Upper Primary NA Not provided NA
3 Central Assistance (Rs in Lakh)
3.1 One time
assistance
NA NA NA
17
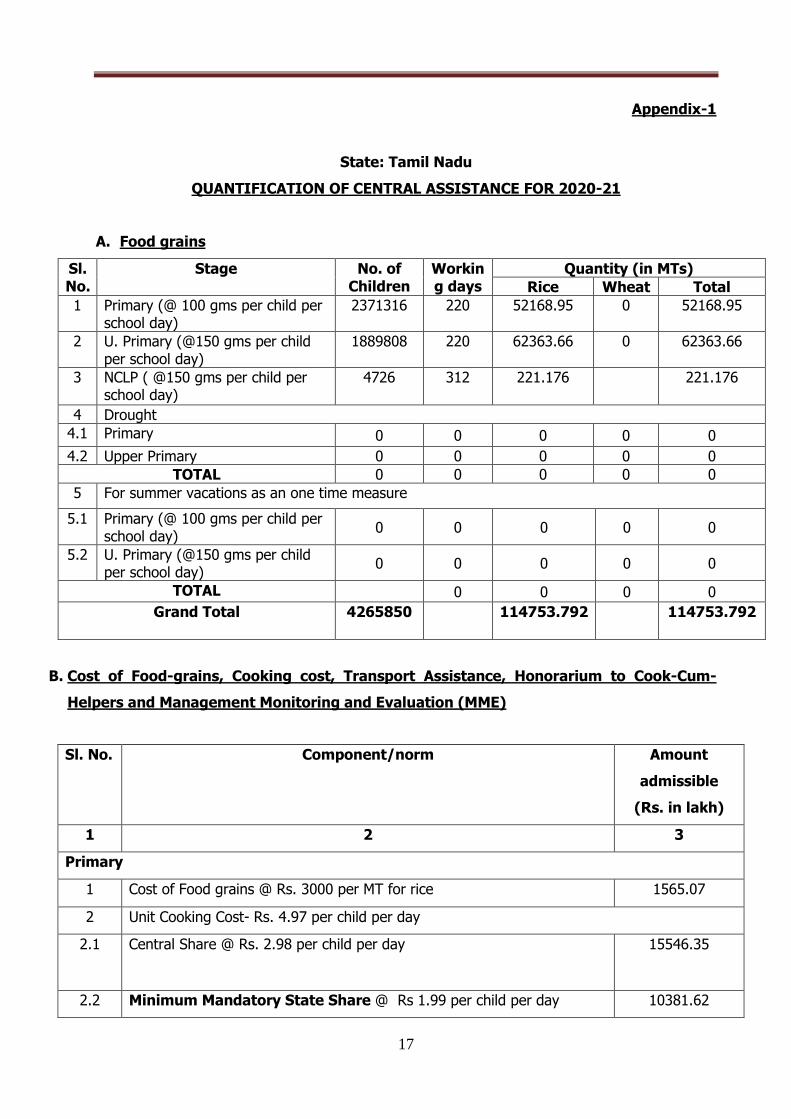
Appendix-1
State: Tamil Nadu
QUANTIFICATION OF CENTRAL ASSISTANCE FOR 2020-21
A. Food grains
Sl. No.
Stage No. of Children
Working days
Quantity (in MTs) Rice Wheat Total
1 Primary (@ 100 gms per child per school day)
2371316 220 52168.95 0 52168.95
2 U. Primary (@150 gms per child per school day)
1889808 220 62363.66 0 62363.66
3 NCLP ( @150 gms per child per school day)
4726 312 221.176
221.176
4 Drought 4.1 Primary 0 0 0 0 0
4.2 Upper Primary 0 0 0 0 0 TOTAL 0 0 0 0 0
5 For summer vacations as an one time measure
5.1 Primary (@ 100 gms per child per school day)
0 0 0 0 0
5.2 U. Primary (@150 gms per child per school day)
0 0 0 0 0
TOTAL 0 0 0 0
Grand Total 4265850
114753.792
114753.792
B. Cost of Food-grains, Cooking cost, Transport Assistance, Honorarium to Cook-Cum-
Helpers and Management Monitoring and Evaluation (MME)
Sl. No. Component/norm Amount
admissible
(Rs. in lakh)
1 2 3
Primary
1 Cost of Food grains @ Rs. 3000 per MT for rice 1565.07
2 Unit Cooking Cost- Rs. 4.97 per child per day
2.1 Central Share @ Rs. 2.98 per child per day 15546.35
2.2 Minimum Mandatory State Share @ Rs 1.99 per child per day 10381.62
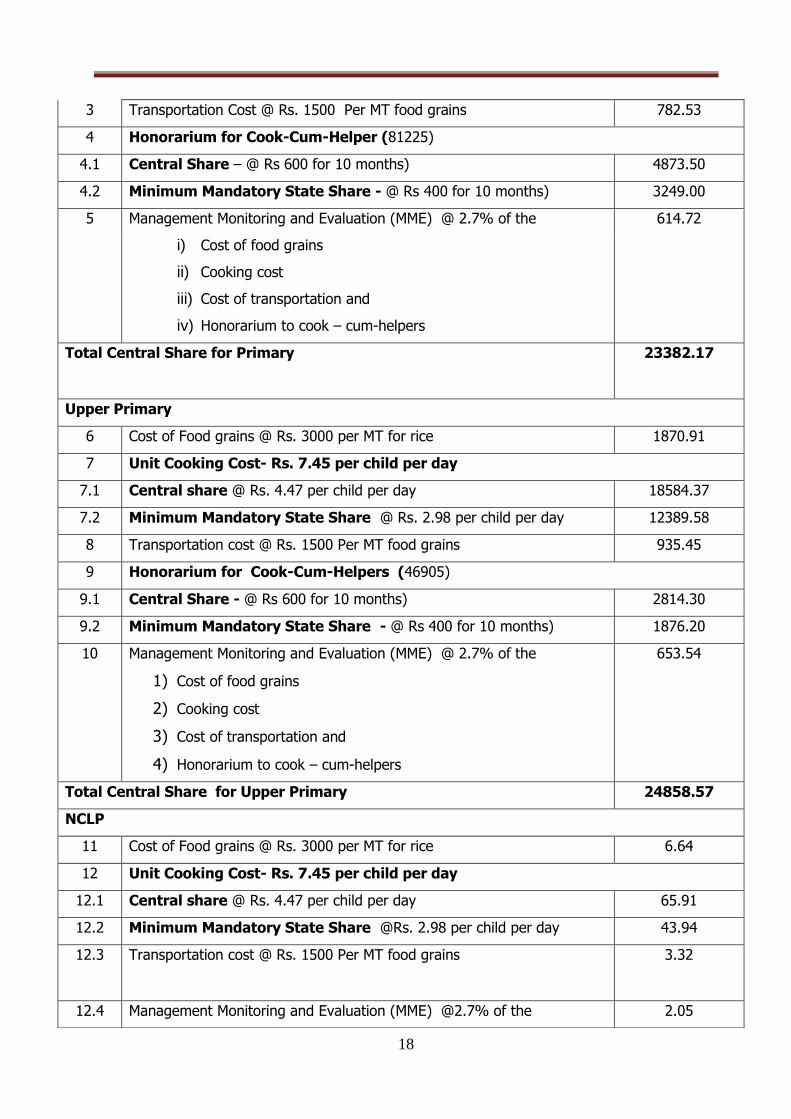
18
3 Transportation Cost @ Rs. 1500 Per MT food grains 782.53
4 Honorarium for Cook-Cum-Helper (81225)
4.1 Central Share – @ Rs 600 for 10 months) 4873.50
4.2 Minimum Mandatory State Share - @ Rs 400 for 10 months) 3249.00
5 Management Monitoring and Evaluation (MME) @ 2.7% of the
i) Cost of food grains
ii) Cooking cost
iii) Cost of transportation and
iv) Honorarium to cook – cum-helpers
614.72
Total Central Share for Primary 23382.17
Upper Primary
6 Cost of Food grains @ Rs. 3000 per MT for rice 1870.91
7 Unit Cooking Cost- Rs. 7.45 per child per day
7.1 Central share @ Rs. 4.47 per child per day 18584.37
7.2 Minimum Mandatory State Share @ Rs. 2.98 per child per day 12389.58
8 Transportation cost @ Rs. 1500 Per MT food grains 935.45
9 Honorarium for Cook-Cum-Helpers (46905)
9.1 Central Share - @ Rs 600 for 10 months) 2814.30
9.2 Minimum Mandatory State Share - @ Rs 400 for 10 months) 1876.20
10 Management Monitoring and Evaluation (MME) @ 2.7% of the
1) Cost of food grains
2) Cooking cost
3) Cost of transportation and
4) Honorarium to cook – cum-helpers
653.54
Total Central Share for Upper Primary 24858.57
NCLP
11 Cost of Food grains @ Rs. 3000 per MT for rice 6.64
12 Unit Cooking Cost- Rs. 7.45 per child per day
12.1 Central share @ Rs. 4.47 per child per day 65.91
12.2 Minimum Mandatory State Share @Rs. 2.98 per child per day 43.94
12.3 Transportation cost @ Rs. 1500 Per MT food grains 3.32
12.4 Management Monitoring and Evaluation (MME) @2.7% of the 2.05
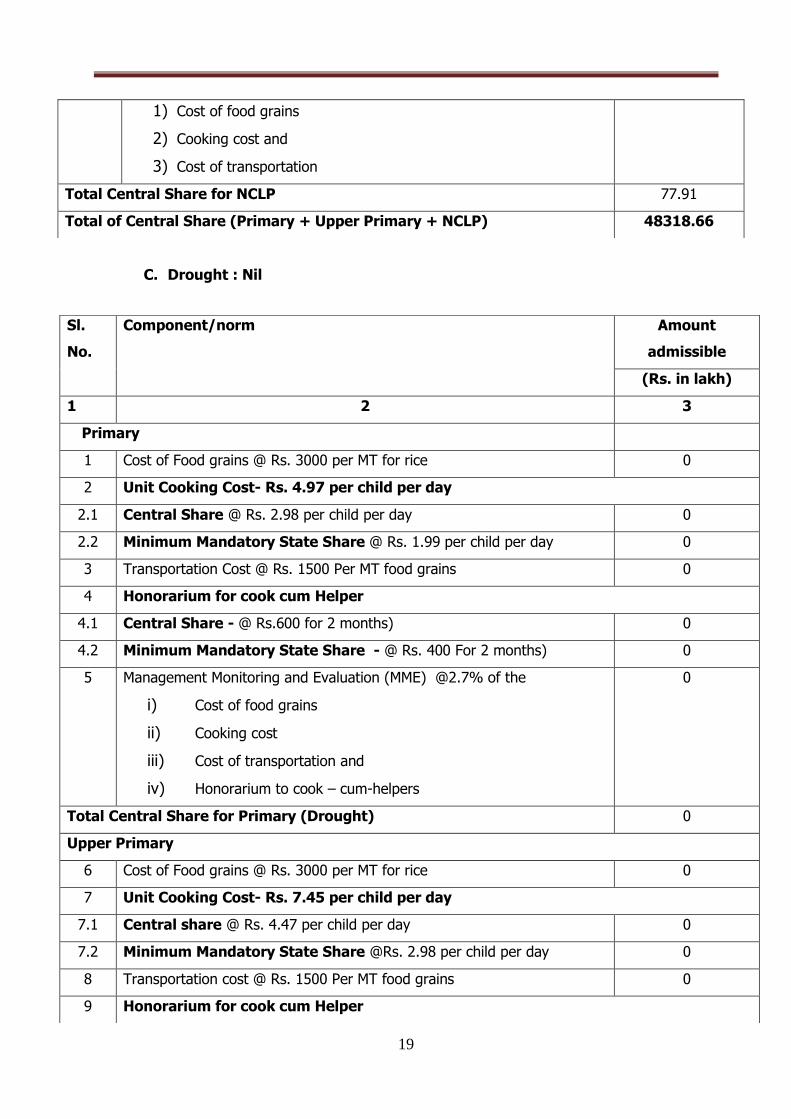
19
C. Drought : Nil
1) Cost of food grains
2) Cooking cost and
3) Cost of transportation
Total Central Share for NCLP 77.91
Total of Central Share (Primary + Upper Primary + NCLP) 48318.66
Sl.
No.
Component/norm Amount
admissible
(Rs. in lakh)
1 2 3
Primary
1 Cost of Food grains @ Rs. 3000 per MT for rice 0
2 Unit Cooking Cost- Rs. 4.97 per child per day
2.1 Central Share @ Rs. 2.98 per child per day 0
2.2 Minimum Mandatory State Share @ Rs. 1.99 per child per day 0
3 Transportation Cost @ Rs. 1500 Per MT food grains 0
4 Honorarium for cook cum Helper
4.1 Central Share - @ Rs.600 for 2 months) 0
4.2 Minimum Mandatory State Share - @ Rs. 400 For 2 months) 0
5 Management Monitoring and Evaluation (MME) @2.7% of the
i) Cost of food grains
ii) Cooking cost
iii) Cost of transportation and
iv) Honorarium to cook – cum-helpers
0
Total Central Share for Primary (Drought) 0
Upper Primary
6 Cost of Food grains @ Rs. 3000 per MT for rice 0
7 Unit Cooking Cost- Rs. 7.45 per child per day
7.1 Central share @ Rs. 4.47 per child per day 0
7.2 Minimum Mandatory State Share @Rs. 2.98 per child per day 0
8 Transportation cost @ Rs. 1500 Per MT food grains 0
9 Honorarium for cook cum Helper
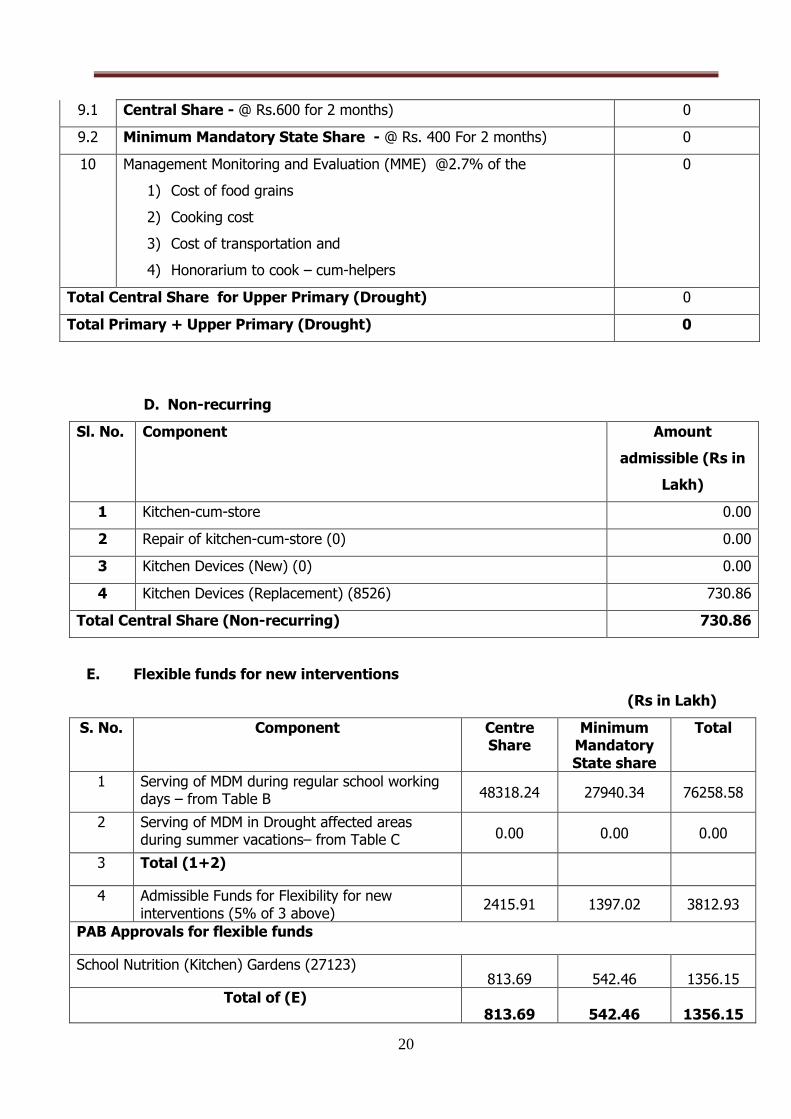
20
D. Non-recurring
Sl. No. Component Amount
admissible (Rs in
Lakh)
1 Kitchen-cum-store 0.00
2 Repair of kitchen-cum-store (0) 0.00
3 Kitchen Devices (New) (0) 0.00
4 Kitchen Devices (Replacement) (8526) 730.86
Total Central Share (Non-recurring) 730.86
E. Flexible funds for new interventions
(Rs in Lakh)
S. No. Component Centre Share
Minimum Mandatory State share
Total
1 Serving of MDM during regular school working days – from Table B 48318.24 27940.34 76258.58
2 Serving of MDM in Drought affected areas during summer vacations– from Table C 0.00 0.00 0.00
3 Total (1+2)
4 Admissible Funds for Flexibility for new interventions (5% of 3 above)
2415.91 1397.02 3812.93
PAB Approvals for flexible funds
School Nutrition (Kitchen) Gardens (27123) 813.69 542.46 1356.15
Total of (E) 813.69 542.46 1356.15
9.1 Central Share - @ Rs.600 for 2 months) 0
9.2 Minimum Mandatory State Share - @ Rs. 400 For 2 months) 0
10 Management Monitoring and Evaluation (MME) @2.7% of the
1) Cost of food grains
2) Cooking cost
3) Cost of transportation and
4) Honorarium to cook – cum-helpers
0
Total Central Share for Upper Primary (Drought) 0
Total Primary + Upper Primary (Drought) 0
21
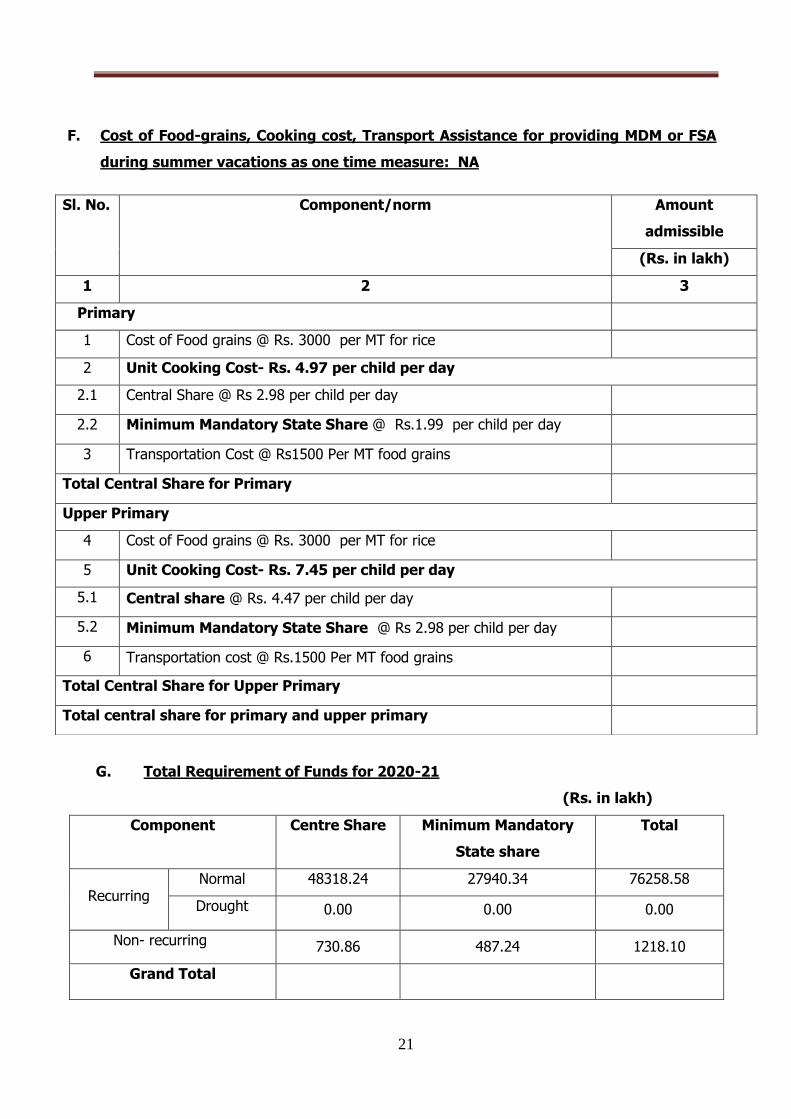
F. Cost of Food-grains, Cooking cost, Transport Assistance for providing MDM or FSA
during summer vacations as one time measure: NA
G. Total Requirement of Funds for 2020-21
(Rs. in lakh)
Component Centre Share Minimum Mandatory
State share
Total
Recurring Normal 48318.24 27940.34 76258.58
Drought 0.00 0.00 0.00
Non- recurring 730.86 487.24 1218.10
Grand Total
Sl. No. Component/norm Amount
admissible
(Rs. in lakh)
1 2 3
Primary
1 Cost of Food grains @ Rs. 3000 per MT for rice
2 Unit Cooking Cost- Rs. 4.97 per child per day
2.1 Central Share @ Rs 2.98 per child per day
2.2 Minimum Mandatory State Share @ Rs.1.99 per child per day
3 Transportation Cost @ Rs1500 Per MT food grains
Total Central Share for Primary
Upper Primary
4 Cost of Food grains @ Rs. 3000 per MT for rice
5 Unit Cooking Cost- Rs. 7.45 per child per day
5.1 Central share @ Rs. 4.47 per child per day
5.2 Minimum Mandatory State Share @ Rs 2.98 per child per day
6 Transportation cost @ Rs.1500 Per MT food grains
Total Central Share for Upper Primary
Total central share for primary and upper primary
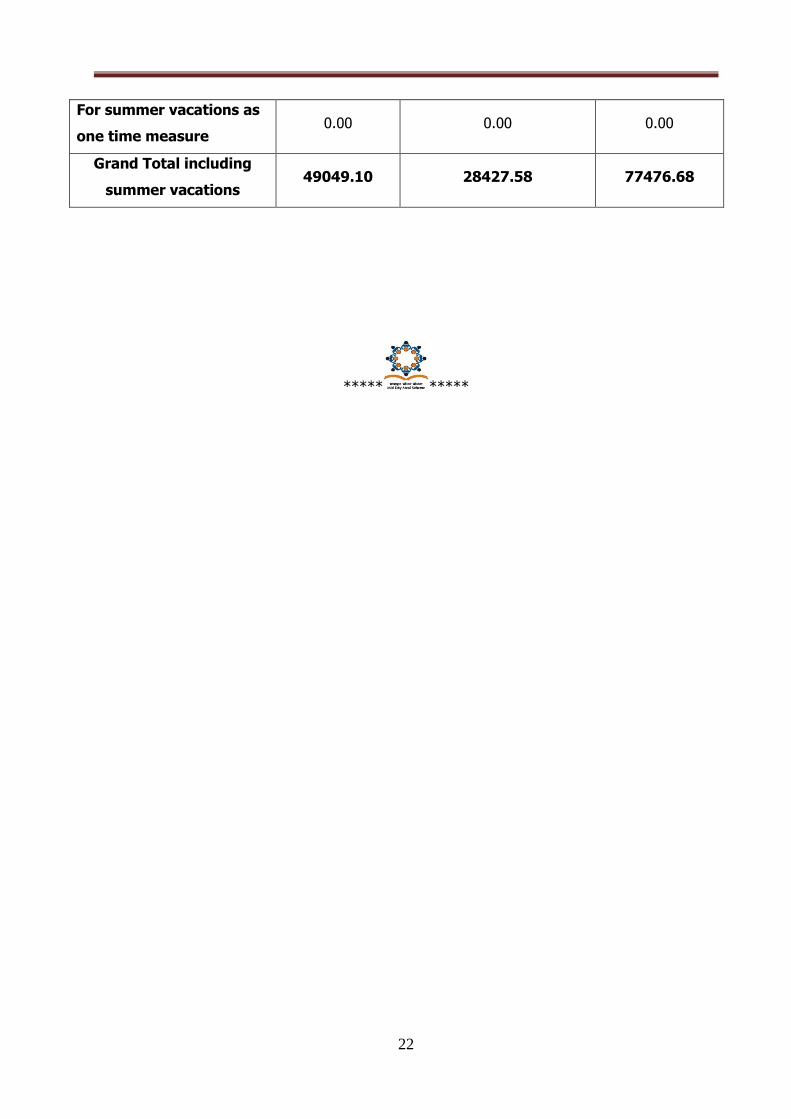
22
For summer vacations as
one time measure 0.00 0.00 0.00
Grand Total including
summer vacations 49049.10 28427.58 77476.68
***** *****