gov’t policy macro unit 5. which is… during a given time period, your spending exceeds your...
TRANSCRIPT

Gov’t Policy Macro Unit 5

Which is…
During a given time period, your spending exceeds your earnings
debt deficit surplus
During a given time period, your earnings exceed your spendingTotal amount owed at a specific moment in time.
A. Debt/Deficit

When the government is spending at a deficit, it must find a way to ______ for its spending.
The U.S. finances its deficit by selling ________ or ___________which are basically promises to re-pay money in the future.
When I buy this bond for my daughter I am basically __________ money to the government.
pay
bonds
loaning
securities

http://www.brillig.com/debt_clock?
http://www.publicdebt.treas.gov/opd/opdpenny.htm

Date Dollar Amount
09/30/2008 10,024,724,896,912.49
09/30/2007 9,007,653,372,262.48
09/30/2006 8,506,973,899,215.23
09/30/2005 7,932,709,661,723.5009/30/2004 7,379,052,696,330.32
09/30/2003 6,783,231,062,743.6209/30/2002 6,228,235,965,597.16
09/30/2001 5,807,463,412,200.06
09/30/2000 5,674,178,209,886.86
http://www.treasurydirect.gov/
USA Debt

When looking at the debt burden of an economy, economists look at the debt as a percentage of ______.
In the early 2000’s the US debt as a percentage of GDP was around _____%.
GDP
59
6 of 20

http://zfacts.com/p/318.html

What do you think happened to the US debt as a percentage of GDP in 2004--2009?

Interest payments each year on the debt
2000 $361,997,734,302.36
1999 $353,511,471,722.87
1998 $363,823,722,920.26
1997 $355,795,834,214.66
1996 $343,955,076,695.15
1995 $332,413,555,030.62
1994 $296,277,764,246.26
1993 $292,502,219,484.25
1992 $292,361,073,070.74
1991 $286,021,921,181.04
1990 $264,852,544,615.90
1989 $240,863,231,535.71 http://www.publicdebt.treas.gov/opd/opdint.htm
What’s the part of debt that hurts the most?
interest payment

To whom is our debt owed? Here is a pie chart showing the makeup, or ownership, of the National Debt as of December 1998.
So in many cases, to whom are we paying interest? ourselves

2009 National Debt $11,009,248,260,083
Top 15 Holders of U.S. Gov't Bonds
Federal Reserve and
US Intragovernmental Holdings $4,806,000,000,000 43.65%
Mutual Funds $769,100,000,000 6.99%
China $739,600,000,000 6.72%
Japan $634,800,000,000 5.77%
State and Local Governments $522,700,000,000 4.75%
Pension Funds $456,400,000,000 4.15%
Other Investors $413,200,000,000 3.75%
Oil Exporters $186,300,000,000 1.69%
Caribbean Banking Centers $176,600,000,000 1.60%
Brazil $133,500,000,000 1.21%

2009 National Debt $11,009,248,260,083
Top 15 Holders of U.S. Gov't Bonds (con’t)
Insurance companies $126,400,000,000 1.15%
United Kingdom $124,200,000,000 1.13%
Russia $119,600,000,000 1.09%
Depository Institutions $107,300,000,000 0.97%
Luxembourg $87,200,000,000 0.79%
85.41%
others 14.59%
100.00%

Vicky works 30 hours this weekand gets paid $6an hour.
She will make $180 this week.This is called “personal income” often abbrev Y
But the governmenthas to take...
Governmenttakes out:Federal TaxState TaxFICAMedicare
What is left over iscalled “DisposableIncome” = DY
B. Income / Savings
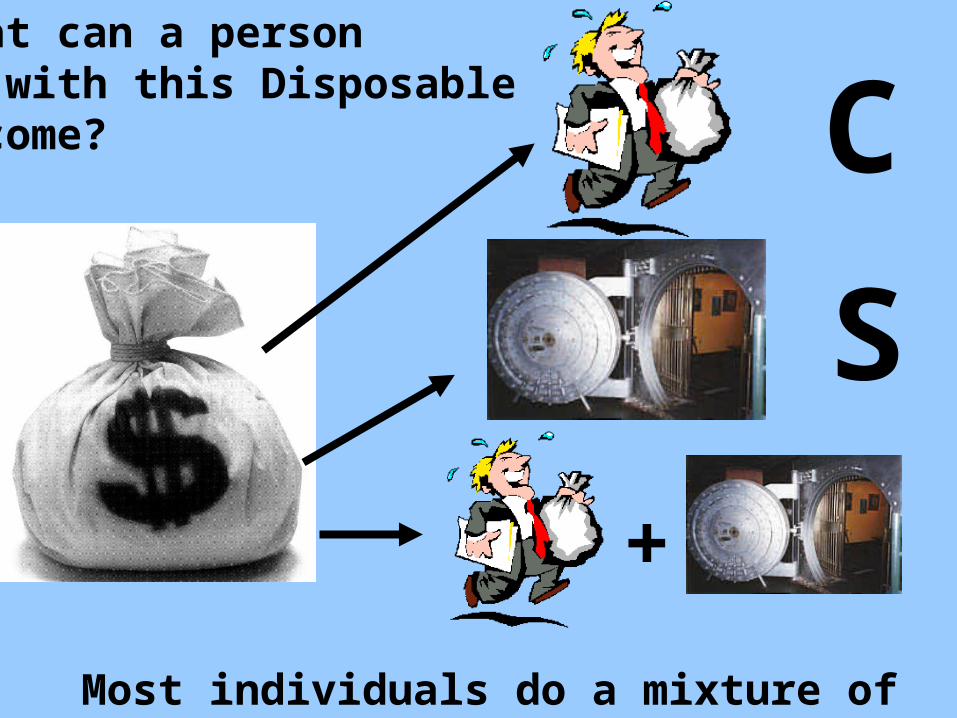
What can a persondo with this DisposableIncome? C
S
+
Most individuals do a mixture of both C and S.

What is the formula for income?
Y = C + S
12 of 20
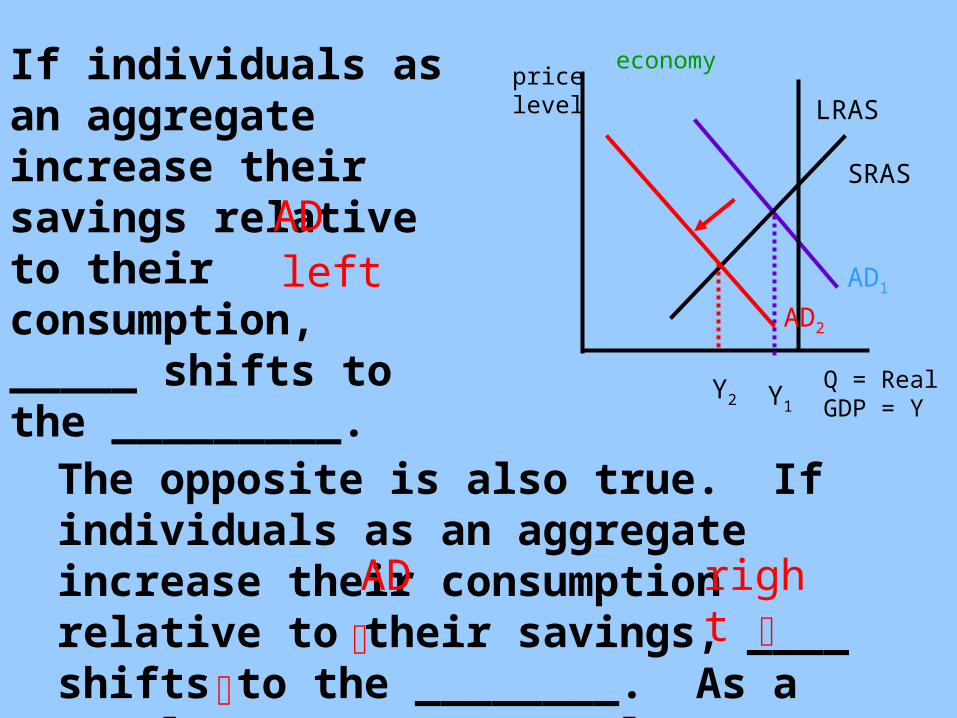
The opposite is also true. If individuals as an aggregate increase their consumption relative to their savings, ____ shifts to the ________. As a result PL _____, unemployment ____, output _____
If individuals as an aggregate increase their savings relative to their consumption, _____ shifts to the _________.
Q = Real GDP = Y
price level
Y1
AD1
LRAS
AD2
Y2
economy
ADleft
right
AD
SRAS

C. Types of Policies
full employment
We’ve learned that .....we want the economy performing at equilibrium at _____ _____________ output & that more is better so we want growth.
2 types of policies:
ADdemand side policies – seek to improve the economy by shifting the _____ curve towards ______________ -- monetary & fiscal policysupply side policies – seek to improve the economy by shifting the _______ curve out – (1) tax subsidies for investment, (2) encourage R&D, (3) encourage trade
equilibrium
LRAS
Potential problems if the gov’t under takes expansionary or contractionary policies:
problem #1 -- expansionary policy may cause inflation
primary theories as to the cause of inflation
Fiscal & Monetary Policy
D. Problems with Policies
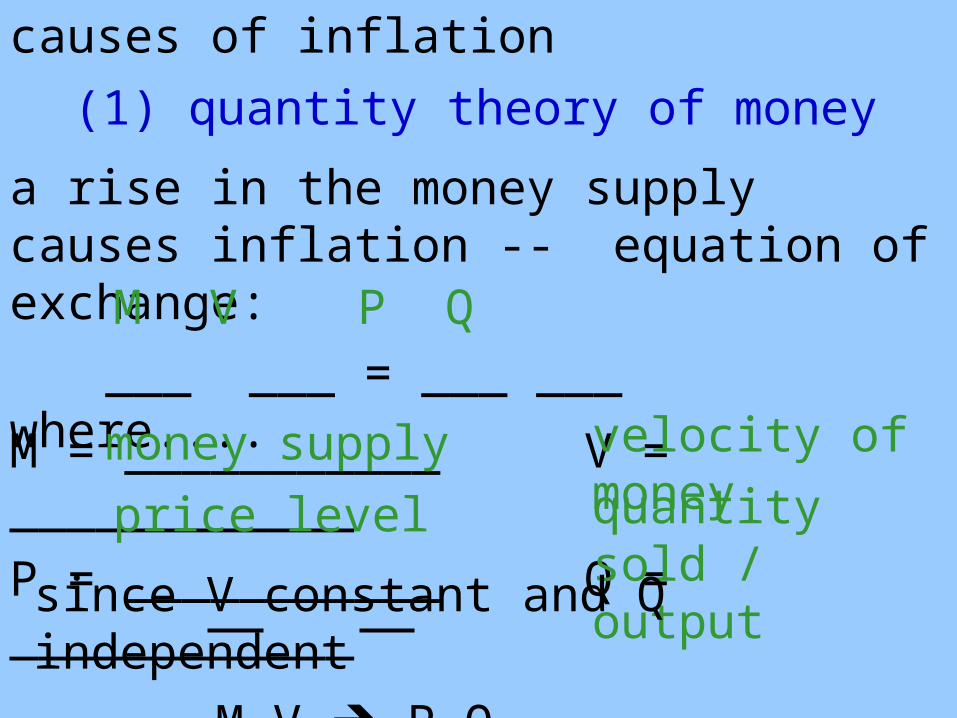
causes of inflation
(1) quantity theory of money
a rise in the money supply causes inflation -- equation of exchange:
___ ___ = ___ ___ where....
M = ___________ V = ____________
P = ___________ Q = ____________
M V P Q
money supply
price level
velocity of moneyquantity sold / output
since V constant and Q independent
M V P Q
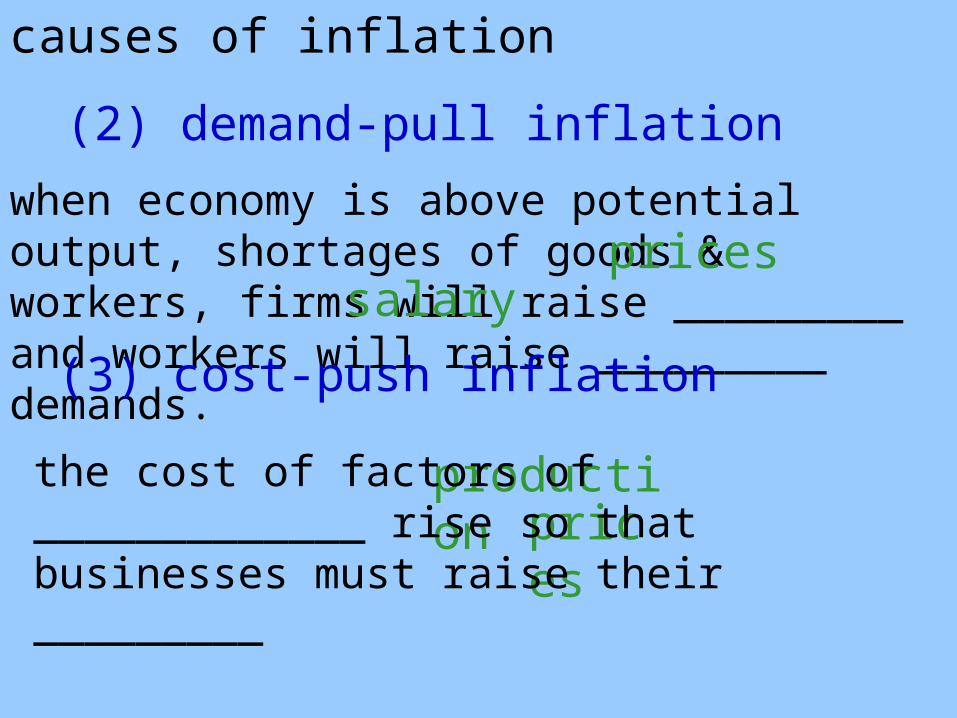
causes of inflation
(2) demand-pull inflation
when economy is above potential output, shortages of goods & workers, firms will raise _________ and workers will raise _________ demands.
prices
prices
production
the cost of factors of _____________ rise so that businesses must raise their _________
salary
(3) cost-push inflation

inside lag time – time it takes gov’t to 1st - collect _______; 2nd - ________ there’s a problem; 3rd - ________ what policy to apply; and 4th - ___________ the policy.
problem #2 -- lag time
Fiscal & Monetary Policy
data realizedecid
eimplement
outside lag time – time it takes the ___________ to respond to new policy
economy
the inside lag time is greater for monetary ....or....fiscal policy?
18 of 20

To get out of the recession the government wants to increase ___ so it can shift ____ to the right. But what’s the problem with increasing G?
Let’s say the economy is in a recession and at the same time is running a deficit – that means for that year it is __________ more than it is _____________
problem #3 -- crowding out
Fiscal & Monetary Policy
spendingbringing
in
G AD

To ________ this spending, gov’t must _____ bonds so that it brings money in the gov’t must make them attractive with a relatively higher ________ _____ which tends to drive up i in the economy.
problem #3 -- crowding out
pay for
sell
interest rate
This is what we call deficit spending – the gov’t is spending more money than it’s bringing in.
Look at some overheads to graphically show crowding out