gpu-based high-quality volume rendering for virtual
TRANSCRIPT

GPU-Based High-Quality Volume RenderingFor Virtual Environments
Andrea Kratz∗ Markus Hadwiger† Anton Fuhrmann‡ Rainer Splechtna§ Katja Bhler¶
VRVis Research Center
Figure 1: We seamlessly integrate perspective high-quality direct volume rendering into a polygonal virtual environment (center) by calculatingpixel accurate intersections in image space. This offers an intuitive interaction using direct manipulation widgets like the clipping cube (left).The right image shows a direct volume rendering of a CT scan of a human hand, projected onto a stereoscopic display. Interaction with such adataset of size 256 x 256 x 128 and an image resolution of 1024 x 768 can be performed at interactive frame rates.
ABSTRACT
In medicine the knowledge of relative placement and size ofanatomical structures is indispensable, especially in surgery andtreatment planning. Therefore, the visualization of medical datasets acquired by Computer Tomography (CT) and MagneticResonance Imaging (MRI) has become more and more importantbecause it offers a three dimensional view on the underlying data -even of inner structures. A virtual environment additionally enablesa stereoscopic, and therefore natural, view. Further, input deviceswith six degrees of freedom provide an intuitive exploration of thedata. Our application is very flexible with respect to different inputand output devices, because having two equally immersive virtualenvironments, the user will always feel more immersed in the onemore suitable to his requirements. The virtual environment usedin this work is Studierstube, an enhanced virtual reality system.For volume rendering, we employ GPU based ray-casting becauseof its superior image quality and efficiency in comparison toslice-based approaches.
∗e-mail: [email protected]†e-mail: [email protected]‡e-mail:[email protected]§e-mail:[email protected]¶e-mail:[email protected]
The main focus of this paper is the seamless integration ofperspective high-quality direct volume rendering into virtualreality. We will present a system that realizes pixel accurateintersections between polygonal geometry and volumetric data.Intuitive interaction methods are provided at interactive frame ratesincluding volume clipping and exploration of the dataset’s interior.As main application areas we propose education and pre-operativeplanning.
Keywords: volume visualization, virtual reality, augmented real-ity
1 INTRODUCTION
The main concern of medical visualization is to aid clinicians intheir daily work, for example for simulating unusual interventionsor training a surgery. Collaborative environments could encouragemultidisciplinary work because it assists the communicationbetween colleagues from different fields.
Interactive frame rates in combination with direct volumerendering and a stereoscopic view is not an easy task, as thewhole scene has to be rendered twice. However, a high levelof interactivity is absolutely essential when talking about virtualreality (VR) applications because the user should have the feelingof being immersed in the system. Furthermore it is of particularimportance that the user is able to manipulate the virtual object ina natural way which is only possible at interactive rates. On the
other hand, the image quality in medical applications is also veryimportant because it is the basis for any kind of diagnosis. As thevisualization should facilitate the evaluation of relative placementand scale of anatomical structures, a perspective projection isrequired.
The project presented in this paper integrates with one ofour previous projects [8] where software-based volume renderingwas integrated into the Studierstube framework. We seamlesslyintegrate high-quality perspective volume rendering into a polyg-onal virtual environment (VE) by considering accurate occlusionsbetween the objects although they are created by completelydifferent rendering frameworks. Furthermore, we overcome all theshortcomings of the previous project, namely:
• Software volume rendering with parallel projection
• Absence of correct occlusions
• Artifacts caused by network delay
The structure of this paper is organized as follows. Initially, relatedwork is presented in section 2. Then the two libraries that werecombined are introduced, focusing on the volume rendering render-ing framework and its features in section 4. Section 5 deals with theintegration of volume rendering into the Studierstube framework.Special attention is paid to intersections between opaque polygonalgeometry and volumetric data. Next, VR interaction methods andmanipulation widgets are presented in section 6. Section 7 dealswith a discussion about different input and output devices. Finally,the last two sections focus on a summary of the results achieved(see section 8) and conclude with an outlook into future work insection 9.
2 RELATED WORK
The advantages of a virtual environment (VE) as user interfacefor visualization applications have been demonstrated previously:Cruz-Neira [4] demonstrated the application of their CAVE virtualenvironment in scientific visualization. The useful combination ofvirtual reality and visualization was demonstrated in [23] and inour own adaptation of a commercial visualization system for vir-tual reality [7]. The impact of VR applications in medicine is dis-cussed in [16]. Especially in the field of volume visualization, theapplication of direct manipulation widgets [12], geometric objectsexhibiting interactive behavior, makes navigation and manipulationintuitive, efficient and informative. The use of 6 degree-of-freedom(6-DoF) input hardware allows effective control of these widgetsand stereoscopic display devices deliver the necessary feedback for3D interaction and ease the interpretation of the volume data. Previ-ous approaches that integrated volume rendering into VR, like [19]and [8] use software approaches for volume rendering and did notyet realized a seamless combination of the different rendering tech-niques. [13] focus on the design of transfer functions within a VE.
3 VIRTUAL REALITY FRAMEWORK
Studierstube [18] is an enhanced virtual reality (VR) system whichwe already applied to problems in the area of scientific visualiza-tion [7], [6]. It implements basic interaction methods like position-ing objects by dragging them with a 6-DoF pen as well as con-ventional 2D interaction elements, like sliders, dials, and buttonsfor parameterizations of visualization methods. These purely vir-tual interface elements are positioned on the Personal InteractionPanel [21], a handheld tablet. Users hold this board in their non-dominant hand while they make adjustments to the interface ele-ments with the same pen they use for 6-DoF interaction. Studier-stube supports a wide range of input and output devices and is thus
configurable for many different hardware setups. Studierstube re-lies on polygonal rendering via OpenGL and is based on the highlevel API Coin3D [11], an object-oriented C++ class library.
4 THE HVR FRAMEWORK: HIGH-QUALITY HARDWAREVOLUME RENDERING
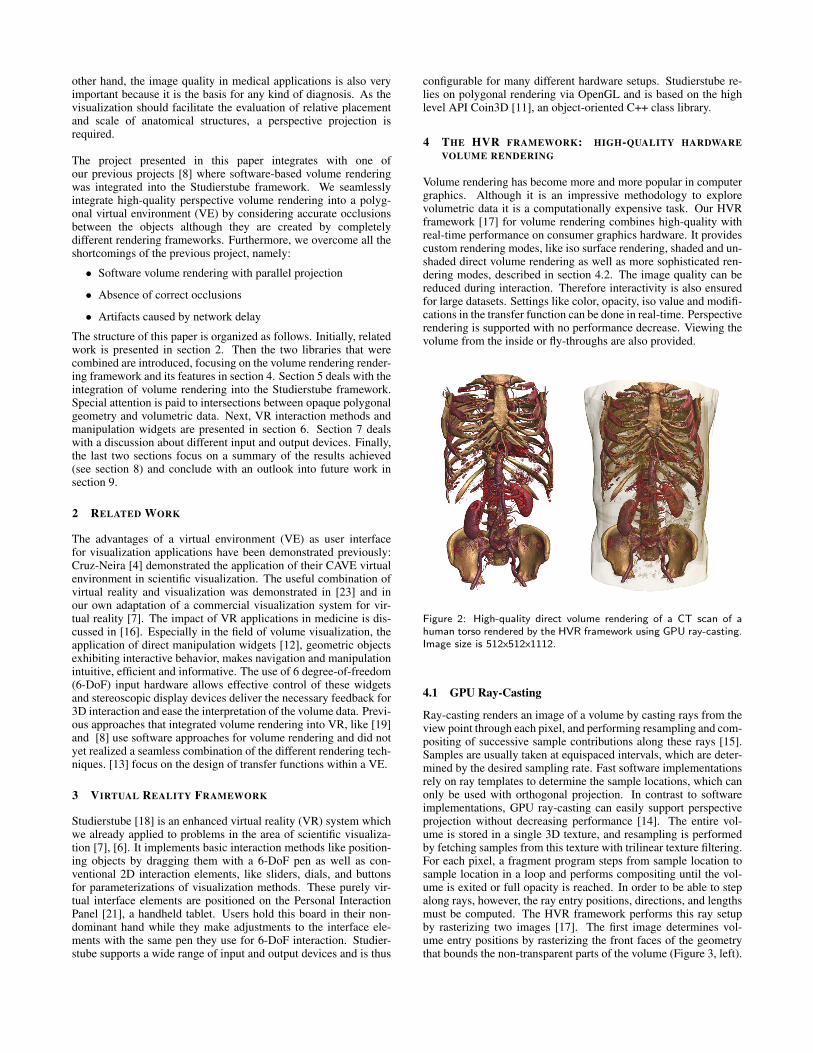
Volume rendering has become more and more popular in computergraphics. Although it is an impressive methodology to explorevolumetric data it is a computationally expensive task. Our HVRframework [17] for volume rendering combines high-quality withreal-time performance on consumer graphics hardware. It providescustom rendering modes, like iso surface rendering, shaded and un-shaded direct volume rendering as well as more sophisticated ren-dering modes, described in section 4.2. The image quality can bereduced during interaction. Therefore interactivity is also ensuredfor large datasets. Settings like color, opacity, iso value and modifi-cations in the transfer function can be done in real-time. Perspectiverendering is supported with no performance decrease. Viewing thevolume from the inside or fly-throughs are also provided.
Figure 2: High-quality direct volume rendering of a CT scan of ahuman torso rendered by the HVR framework using GPU ray-casting.Image size is 512x512x1112.
4.1 GPU Ray-Casting
Ray-casting renders an image of a volume by casting rays from theview point through each pixel, and performing resampling and com-positing of successive sample contributions along these rays [15].Samples are usually taken at equispaced intervals, which are deter-mined by the desired sampling rate. Fast software implementationsrely on ray templates to determine the sample locations, which canonly be used with orthogonal projection. In contrast to softwareimplementations, GPU ray-casting can easily support perspectiveprojection without decreasing performance [14]. The entire vol-ume is stored in a single 3D texture, and resampling is performedby fetching samples from this texture with trilinear texture filtering.For each pixel, a fragment program steps from sample location tosample location in a loop and performs compositing until the vol-ume is exited or full opacity is reached. In order to be able to stepalong rays, however, the ray entry positions, directions, and lengthsmust be computed. The HVR framework performs this ray setupby rasterizing two images [17]. The first image determines vol-ume entry positions by rasterizing the front faces of the geometrythat bounds the non-transparent parts of the volume (Figure 3, left).
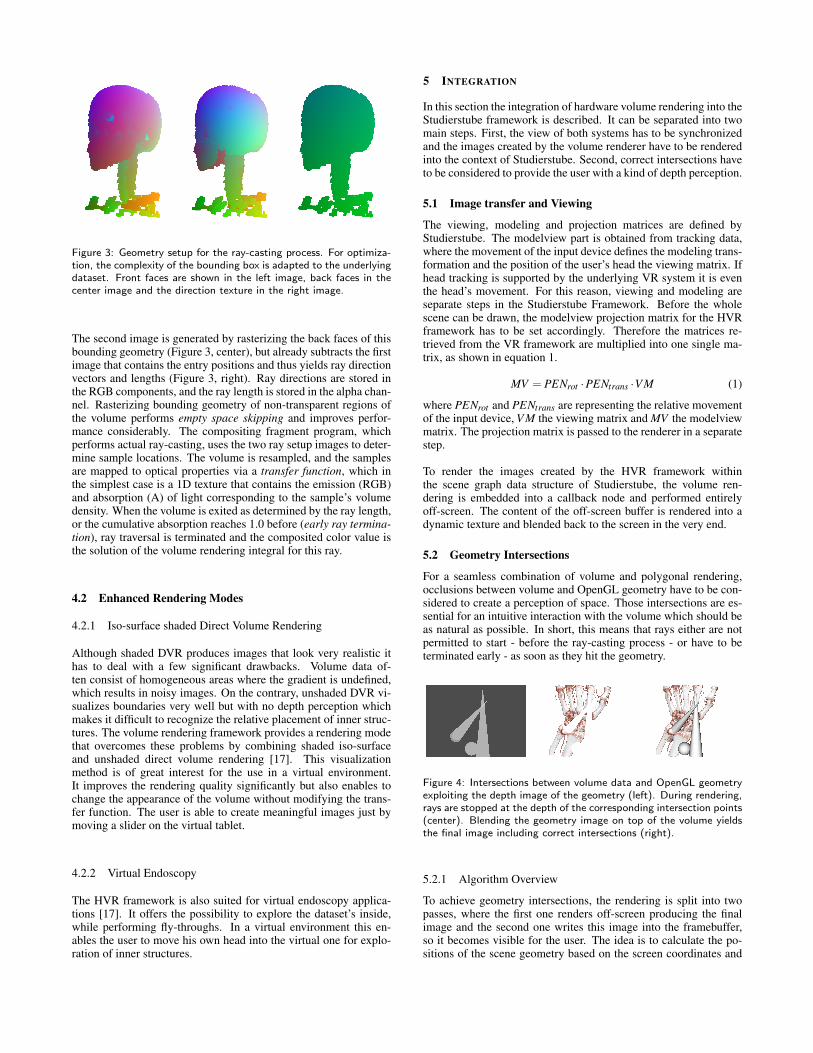
Figure 3: Geometry setup for the ray-casting process. For optimiza-tion, the complexity of the bounding box is adapted to the underlyingdataset. Front faces are shown in the left image, back faces in thecenter image and the direction texture in the right image.
The second image is generated by rasterizing the back faces of thisbounding geometry (Figure 3, center), but already subtracts the firstimage that contains the entry positions and thus yields ray directionvectors and lengths (Figure 3, right). Ray directions are stored inthe RGB components, and the ray length is stored in the alpha chan-nel. Rasterizing bounding geometry of non-transparent regions ofthe volume performs empty space skipping and improves perfor-mance considerably. The compositing fragment program, whichperforms actual ray-casting, uses the two ray setup images to deter-mine sample locations. The volume is resampled, and the samplesare mapped to optical properties via a transfer function, which inthe simplest case is a 1D texture that contains the emission (RGB)and absorption (A) of light corresponding to the sample’s volumedensity. When the volume is exited as determined by the ray length,or the cumulative absorption reaches 1.0 before (early ray termina-tion), ray traversal is terminated and the composited color value isthe solution of the volume rendering integral for this ray.
4.2 Enhanced Rendering Modes
4.2.1 Iso-surface shaded Direct Volume Rendering
Although shaded DVR produces images that look very realistic ithas to deal with a few significant drawbacks. Volume data of-ten consist of homogeneous areas where the gradient is undefined,which results in noisy images. On the contrary, unshaded DVR vi-sualizes boundaries very well but with no depth perception whichmakes it difficult to recognize the relative placement of inner struc-tures. The volume rendering framework provides a rendering modethat overcomes these problems by combining shaded iso-surfaceand unshaded direct volume rendering [17]. This visualizationmethod is of great interest for the use in a virtual environment.It improves the rendering quality significantly but also enables tochange the appearance of the volume without modifying the trans-fer function. The user is able to create meaningful images just bymoving a slider on the virtual tablet.
4.2.2 Virtual Endoscopy
The HVR framework is also suited for virtual endoscopy applica-tions [17]. It offers the possibility to explore the dataset’s inside,while performing fly-throughs. In a virtual environment this en-ables the user to move his own head into the virtual one for explo-ration of inner structures.
5 INTEGRATION
In this section the integration of hardware volume rendering into theStudierstube framework is described. It can be separated into twomain steps. First, the view of both systems has to be synchronizedand the images created by the volume renderer have to be renderedinto the context of Studierstube. Second, correct intersections haveto be considered to provide the user with a kind of depth perception.
5.1 Image transfer and Viewing
The viewing, modeling and projection matrices are defined byStudierstube. The modelview part is obtained from tracking data,where the movement of the input device defines the modeling trans-formation and the position of the user’s head the viewing matrix. Ifhead tracking is supported by the underlying VR system it is eventhe head’s movement. For this reason, viewing and modeling areseparate steps in the Studierstube Framework. Before the wholescene can be drawn, the modelview projection matrix for the HVRframework has to be set accordingly. Therefore the matrices re-trieved from the VR framework are multiplied into one single ma-trix, as shown in equation 1.
MV = PENrot ·PENtrans ·V M (1)
where PENrot and PENtrans are representing the relative movementof the input device, V M the viewing matrix and MV the modelviewmatrix. The projection matrix is passed to the renderer in a separatestep.
To render the images created by the HVR framework withinthe scene graph data structure of Studierstube, the volume ren-dering is embedded into a callback node and performed entirelyoff-screen. The content of the off-screen buffer is rendered into adynamic texture and blended back to the screen in the very end.
5.2 Geometry Intersections
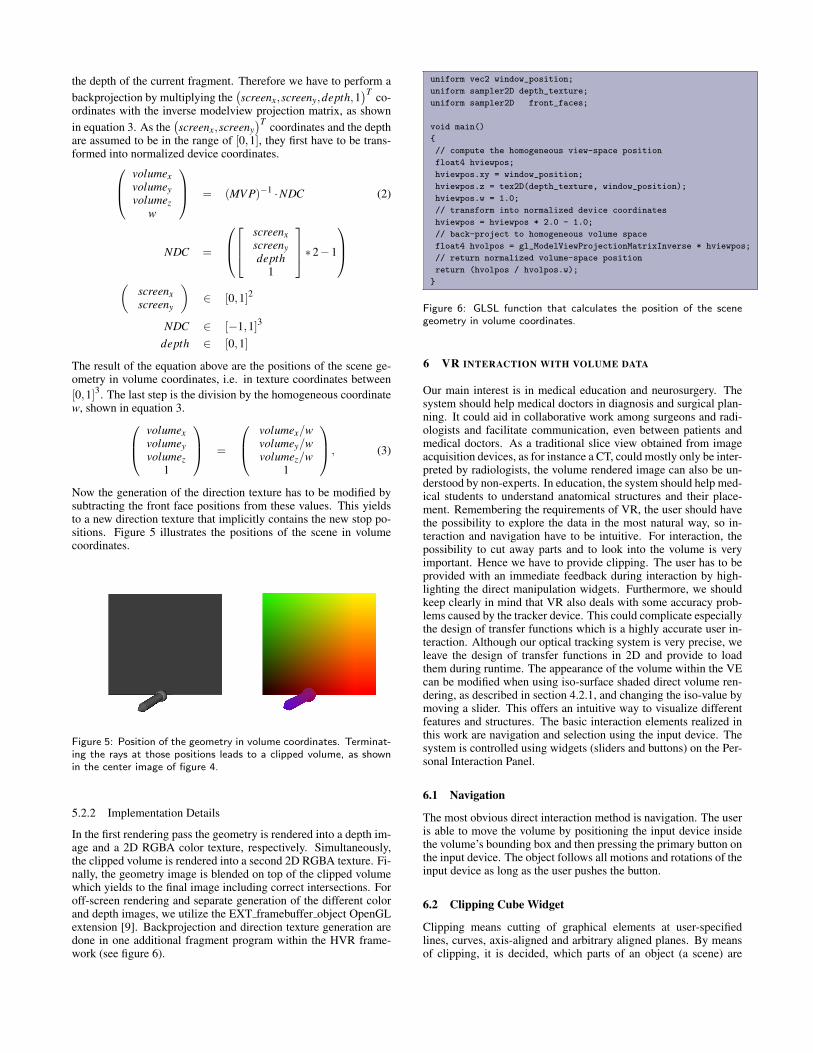
For a seamless combination of volume and polygonal rendering,occlusions between volume and OpenGL geometry have to be con-sidered to create a perception of space. Those intersections are es-sential for an intuitive interaction with the volume which should beas natural as possible. In short, this means that rays either are notpermitted to start - before the ray-casting process - or have to beterminated early - as soon as they hit the geometry.
Figure 4: Intersections between volume data and OpenGL geometryexploiting the depth image of the geometry (left). During rendering,rays are stopped at the depth of the corresponding intersection points(center). Blending the geometry image on top of the volume yieldsthe final image including correct intersections (right).
5.2.1 Algorithm Overview
To achieve geometry intersections, the rendering is split into twopasses, where the first one renders off-screen producing the finalimage and the second one writes this image into the framebuffer,so it becomes visible for the user. The idea is to calculate the po-sitions of the scene geometry based on the screen coordinates and
the depth of the current fragment. Therefore we have to perform abackprojection by multiplying the
(screenx,screeny,depth,1
)T co-ordinates with the inverse modelview projection matrix, as shownin equation 3. As the
(screenx,screeny
)T coordinates and the depthare assumed to be in the range of [0,1], they first have to be trans-formed into normalized device coordinates. volumex
volumeyvolumez
w
= (MV P)−1 ·NDC (2)
NDC =
screenx
screenydepth
1
∗2−1
(
screenxscreeny
)∈ [0,1]2
NDC ∈ [−1,1]3
depth ∈ [0,1]
The result of the equation above are the positions of the scene ge-ometry in volume coordinates, i.e. in texture coordinates between[0,1]3. The last step is the division by the homogeneous coordinatew, shown in equation 3. volumex
volumeyvolumez
1
=
volumex/wvolumey/wvolumez/w
1
, (3)
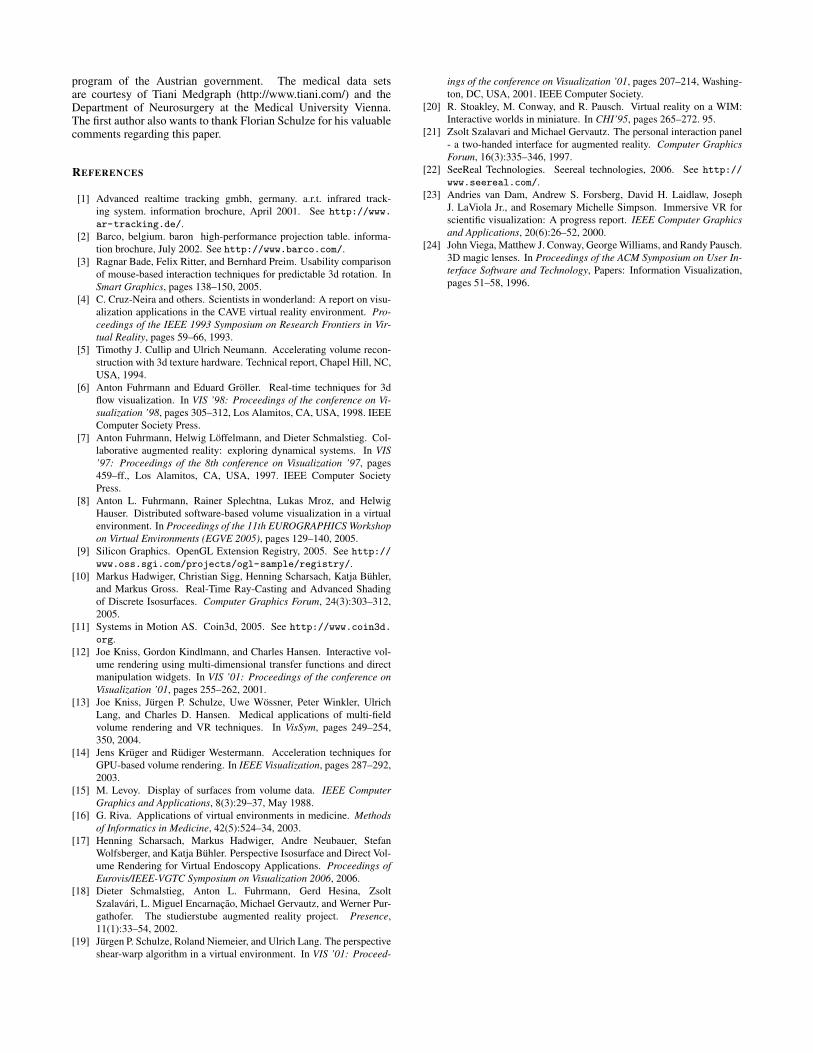
Now the generation of the direction texture has to be modified bysubtracting the front face positions from these values. This yieldsto a new direction texture that implicitly contains the new stop po-sitions. Figure 5 illustrates the positions of the scene in volumecoordinates.
Figure 5: Position of the geometry in volume coordinates. Terminat-ing the rays at those positions leads to a clipped volume, as shownin the center image of figure 4.
5.2.2 Implementation Details
In the first rendering pass the geometry is rendered into a depth im-age and a 2D RGBA color texture, respectively. Simultaneously,the clipped volume is rendered into a second 2D RGBA texture. Fi-nally, the geometry image is blended on top of the clipped volumewhich yields to the final image including correct intersections. Foroff-screen rendering and separate generation of the different colorand depth images, we utilize the EXT framebuffer object OpenGLextension [9]. Backprojection and direction texture generation aredone in one additional fragment program within the HVR frame-work (see figure 6).
uniform vec2 window_position;
uniform sampler2D depth_texture;
uniform sampler2D front_faces;
void main()
{
// compute the homogeneous view-space position
float4 hviewpos;
hviewpos.xy = window_position;
hviewpos.z = tex2D(depth_texture, window_position);
hviewpos.w = 1.0;
// transform into normalized device coordinates
hviewpos = hviewpos * 2.0 - 1.0;
// back-project to homogeneous volume space
float4 hvolpos = gl_ModelViewProjectionMatrixInverse * hviewpos;
// return normalized volume-space position
return (hvolpos / hvolpos.w);
}
Figure 6: GLSL function that calculates the position of the scenegeometry in volume coordinates.
6 VR INTERACTION WITH VOLUME DATA
Our main interest is in medical education and neurosurgery. Thesystem should help medical doctors in diagnosis and surgical plan-ning. It could aid in collaborative work among surgeons and radi-ologists and facilitate communication, even between patients andmedical doctors. As a traditional slice view obtained from imageacquisition devices, as for instance a CT, could mostly only be inter-preted by radiologists, the volume rendered image can also be un-derstood by non-experts. In education, the system should help med-ical students to understand anatomical structures and their place-ment. Remembering the requirements of VR, the user should havethe possibility to explore the data in the most natural way, so in-teraction and navigation have to be intuitive. For interaction, thepossibility to cut away parts and to look into the volume is veryimportant. Hence we have to provide clipping. The user has to beprovided with an immediate feedback during interaction by high-lighting the direct manipulation widgets. Furthermore, we shouldkeep clearly in mind that VR also deals with some accuracy prob-lems caused by the tracker device. This could complicate especiallythe design of transfer functions which is a highly accurate user in-teraction. Although our optical tracking system is very precise, weleave the design of transfer functions in 2D and provide to loadthem during runtime. The appearance of the volume within the VEcan be modified when using iso-surface shaded direct volume ren-dering, as described in section 4.2.1, and changing the iso-value bymoving a slider. This offers an intuitive way to visualize differentfeatures and structures. The basic interaction elements realized inthis work are navigation and selection using the input device. Thesystem is controlled using widgets (sliders and buttons) on the Per-sonal Interaction Panel.
6.1 Navigation
The most obvious direct interaction method is navigation. The useris able to move the volume by positioning the input device insidethe volume’s bounding box and then pressing the primary button onthe input device. The object follows all motions and rotations of theinput device as long as the user pushes the button.
6.2 Clipping Cube Widget
Clipping means cutting of graphical elements at user-specifiedlines, curves, axis-aligned and arbitrary aligned planes. By meansof clipping, it is decided, which parts of an object (a scene) are

within a clipping area and therefore visible - and which are not.We provide axis aligned clipping which is realized in terms of aclipping cube widget. Each face represents one of the six clippingplanes. It is represented by a bounding box, with invisible spheresat the cube’s corners. When moving the input device into one ofthe spheres the user is given an immediate visual feedback by high-lighting the bounding box, so he knows that he is able to move theclipping planes. This causes a resize of the cube, keeping it axis-aligned.
Figure 7: Clipping Cube Widget. Rendering Mode is iso-surfaceshaded direct volume rendering.
6.3 Lighting Widget
The user is able to change the lights direction and its intensity. Asphere indicates the light source. It can be transformed in the sameway as the volume object by moving the input device inside thesphere and pushing the primary button. The distance between thesphere, i.e. light source, and the center of the volumes boundingbox defines the intensity. The spheres position defines the lightdirection.
Figure 8: Lighting Widget. Rendering Mode is iso-surface shadeddirect volume rendering.
6.4 Slice View Widget
The slices are provided in a 3D texture by the volume renderer.To display one slice, the appropriate texture coordinates have tobe calculated. The rendering of the slices is realized on the virtualtablet. By moving a slider on a three dimensional coordinate systemthe user is able to create a cut-away view of the volume by viewingthe corresponding slice (figure 9, right image), simultaneously.
6.5 Fly-throughs
As mentioned in section 4.2.2 the HVR framework is suited forvirtual endoscopy. For our application this means that the user is
Figure 9: Slice View Widget. By moving a slider on a three dimen-sional coordinate system the user is able to see the according slice.Rendering Mode is iso-surface shaded direct volume rendering.
given two different views on the dataset. We provide a traditionalview on the outside of the volume and additionally its explorationfrom the inside.
7 HARDWARE SETUP
Our prototype system 10(a) consists of a swivel mounted BarcoBaron Table [2] with shutter glasses synchronized by an infraredemitter, an ART Optical Tracking System [1] with three camerasand a single PC running our hybrid application. The PC is equippedwith an AMD Athlon 64 3800 CPU and a NVIDIA GeForce QuadroFX 3400/4400 graphics card. The optical tracking system deliversdata with an error well below 1mm, which allows precise interac-tion using our pen and pad combination. Tracking markers - smallreflective spheres - are mounted on the Baron Table, the shutterglasses, and the handheld tablet, and allow wireless tracking of headand interaction devices. Tracking the table allows swiveling it dur-ing operation without losing registration, an operation which allowsto adapt the working volume to different tasks. We apply our full
Figure 10: Hardware Setup
set-up for educational purposes and in pre-operative planning. Forintra-operative applications, we rely on simpler hard- and softwarecombinations: Since most surgeons do not want to wear a pair oftracked shutterglasses or use our pen and pad interaction - even ifit was possible to guarantee sterility of the devices - we have to fallback to what is essentially a desktop virtual environment. We use aSeeReal [22] autostereoscopic monitor (see figure 11) and a mouseinterface, remotely controlled by a nurse or - during intra-operativeconsulting - a radiologist. The monitor guarantees a stereoscopicdisplay with contrast high enough to work in a surgical environmentand displays the volumetric data as visualized in the pre-operativeplanning phase on the full set-up. The surgeon does not have towear any glasses, which would impair his field-of-view and dim

the view of the operation field. The monitor can be used with afixed viewing zone, or with a tracking device, which re-adjusts theviewing according to the surgeon’s position. This works best whenthe surgeon wears a retro-reflective marker on his head, which caneasily be fixed to a sterile cap.
Figure 11: SeeReal auto stereoscopic monitor (left) and reflector spot(right). Image taken from [22].
8 RESULTS
We seamlessly integrated high-quality perspective volume render-ing into a polygonal VE by considering accurate occlusions be-tween the objects although they are created by completely differentrendering frameworks. Furthermore, we overcome all the short-comings of our previous project [8], namely:
• Parallel Projection
• Absence of correct occlusions
• Artifacts caused by network delay
The table below gives a summarized view of the measured framerates using the following system:
• single processor PC, AMD Athlon 64 3800
• equipped with a NVIDIA Quadro FX 3400/4400 graphicscard
• GPU memory size 256 MB
• running Windows XP
• on a virtual table
Dataset Rendering Mode Mono [fps] Stereo [fps]Hand ISO 20 fps 11 fpsHand DVR + ISO 17 fps 10 fps
Table 1: Frame rates comparing different render modes (iso surfaceand combined shaded iso surface and unshaded direct volume ren-dering) and mono and stereo settings. The frame rates are measuredwith an image resolution of 1024x768. The hand dataset is of size256x256x128.
As shown in table 1 we are able to achieve interactive frame rates.Performance in the HVR framework is scalable, so the user is ableto reduce the image resolution during interaction (like clipping us-ing the clipping cube widget) and change it again to high resolutionto view the clipped volume in its best quality again.
9 CONCLUSION AND FUTURE WORK
We have presented the integration of perspective high-qualityhardware based volume rendering into a virtual environment. Wehave achieved a seamless integration of the volumetric data intothe polygonal rendering of the VE by calculating pixel accurateintersections of both in image space. Besides the integration, wediscussed navigation, interaction and direct manipulation widgets.
The integration of volume rendering into the polygonal ren-dering of Studierstube was realized by performing the entirevolume rendering off-screen. Occlusions between volume andopaque OpenGL geometry were achieved by rendering a depthimage of the geometry and terminating the rays in the ray-castingprocess at exactly that depth in volume coordinates. This extensionoffers a native combination of volume and polygonal rendering.
Navigation and Interaction are based on the Studierstube API. Weprovide axis-aligned clipping, intuitive lighting by directly movingthe light-source and a traditional slice view. The interactionmethods are aided by visual feedback. Although a sophisticatedwidget for transfer function design, like the one proposed by [12]could be integrated easily into our VR framework, we propose toleave the accurate design on standard desktop PCs. Pre-definedtransfer functions and arbitrary datasets can be loaded duringruntime, anyway.
Typical VR navigation and interaction methods, like 3D magiclenses [24] or world-in-miniatures [20] turned out not to be usefulfor this kind of application which should be used in the medicaldomain. Therefore upcoming work should concentrate on VRinteraction methods that fit these special requirements. It will alsofocus on a hybrid solution that provides a stereoscopic view on apassive stereo screen and a second 2D display providing a standardQT user interface. As input devices we will provide a space mousethat offers 6-DoFs for 3D navigation and a PC mouse to serve theuser interface.
Another interesting aspect could be to focus on the evalua-tion of different 3D rotation techniques. For instance, the workof [3] focuses on 3D rotation especially in the field of medicalapplications. Their work is based on the question, why medicaldoctors still prefer to read CT or MRI data slice by slice, although3D visualizations offer a great potential for medical applicationsand could ease the clinical work flow. Their assumption is, that onereason for this is due to unintuitive 3D rotation techniques.
We will continue the evaluation of our system in collabora-tion with our medical partners. Further, we plan a cooperationwith the Vienna General Hospital for teaching purposes, becausealthough there is a lot of research in medical visualization alltoo often these techniques are either not known by clinicians ornot accepted. An early introduction to those new technologies ineducation would familiarize students to them already during theirstudies which could lead to more acceptance. Furthermore the usein education could aid in validation. Preliminary demonstrationsfor medical students and neurosurgeons have resulted in positivefeedback.
ACKNOWLEDGMENTS
This work has been carried out as part of the basic re-search on medical visualization and the FemInVis project(http://medvis.vrvis.at/projects/feminvis/) at the VRVis Re-search Center for Virtual Reality and Visualization in Vienna(http://www.vrvis.at), which is funded in part by the KPlus
program of the Austrian government. The medical data setsare courtesy of Tiani Medgraph (http://www.tiani.com/) and theDepartment of Neurosurgery at the Medical University Vienna.The first author also wants to thank Florian Schulze for his valuablecomments regarding this paper.
REFERENCES
[1] Advanced realtime tracking gmbh, germany. a.r.t. infrared track-ing system. information brochure, April 2001. See http://www.
ar-tracking.de/.[2] Barco, belgium. baron high-performance projection table. informa-
tion brochure, July 2002. See http://www.barco.com/.[3] Ragnar Bade, Felix Ritter, and Bernhard Preim. Usability comparison
of mouse-based interaction techniques for predictable 3d rotation. InSmart Graphics, pages 138–150, 2005.
[4] C. Cruz-Neira and others. Scientists in wonderland: A report on visu-alization applications in the CAVE virtual reality environment. Pro-ceedings of the IEEE 1993 Symposium on Research Frontiers in Vir-tual Reality, pages 59–66, 1993.
[5] Timothy J. Cullip and Ulrich Neumann. Accelerating volume recon-struction with 3d texture hardware. Technical report, Chapel Hill, NC,USA, 1994.
[6] Anton Fuhrmann and Eduard Groller. Real-time techniques for 3dflow visualization. In VIS ’98: Proceedings of the conference on Vi-sualization ’98, pages 305–312, Los Alamitos, CA, USA, 1998. IEEEComputer Society Press.
[7] Anton Fuhrmann, Helwig Loffelmann, and Dieter Schmalstieg. Col-laborative augmented reality: exploring dynamical systems. In VIS’97: Proceedings of the 8th conference on Visualization ’97, pages459–ff., Los Alamitos, CA, USA, 1997. IEEE Computer SocietyPress.
[8] Anton L. Fuhrmann, Rainer Splechtna, Lukas Mroz, and HelwigHauser. Distributed software-based volume visualization in a virtualenvironment. In Proceedings of the 11th EUROGRAPHICS Workshopon Virtual Environments (EGVE 2005), pages 129–140, 2005.
[9] Silicon Graphics. OpenGL Extension Registry, 2005. See http://
www.oss.sgi.com/projects/ogl-sample/registry/.[10] Markus Hadwiger, Christian Sigg, Henning Scharsach, Katja Buhler,
and Markus Gross. Real-Time Ray-Casting and Advanced Shadingof Discrete Isosurfaces. Computer Graphics Forum, 24(3):303–312,2005.
[11] Systems in Motion AS. Coin3d, 2005. See http://www.coin3d.
org.[12] Joe Kniss, Gordon Kindlmann, and Charles Hansen. Interactive vol-
ume rendering using multi-dimensional transfer functions and directmanipulation widgets. In VIS ’01: Proceedings of the conference onVisualization ’01, pages 255–262, 2001.
[13] Joe Kniss, Jurgen P. Schulze, Uwe Wossner, Peter Winkler, UlrichLang, and Charles D. Hansen. Medical applications of multi-fieldvolume rendering and VR techniques. In VisSym, pages 249–254,350, 2004.
[14] Jens Kruger and Rudiger Westermann. Acceleration techniques forGPU-based volume rendering. In IEEE Visualization, pages 287–292,2003.
[15] M. Levoy. Display of surfaces from volume data. IEEE ComputerGraphics and Applications, 8(3):29–37, May 1988.
[16] G. Riva. Applications of virtual environments in medicine. Methodsof Informatics in Medicine, 42(5):524–34, 2003.
[17] Henning Scharsach, Markus Hadwiger, Andre Neubauer, StefanWolfsberger, and Katja Buhler. Perspective Isosurface and Direct Vol-ume Rendering for Virtual Endoscopy Applications. Proceedings ofEurovis/IEEE-VGTC Symposium on Visualization 2006, 2006.
[18] Dieter Schmalstieg, Anton L. Fuhrmann, Gerd Hesina, ZsoltSzalavari, L. Miguel Encarnacao, Michael Gervautz, and Werner Pur-gathofer. The studierstube augmented reality project. Presence,11(1):33–54, 2002.
[19] Jurgen P. Schulze, Roland Niemeier, and Ulrich Lang. The perspectiveshear-warp algorithm in a virtual environment. In VIS ’01: Proceed-
ings of the conference on Visualization ’01, pages 207–214, Washing-ton, DC, USA, 2001. IEEE Computer Society.
[20] R. Stoakley, M. Conway, and R. Pausch. Virtual reality on a WIM:Interactive worlds in miniature. In CHI’95, pages 265–272. 95.
[21] Zsolt Szalavari and Michael Gervautz. The personal interaction panel- a two-handed interface for augmented reality. Computer GraphicsForum, 16(3):335–346, 1997.
[22] SeeReal Technologies. Seereal technologies, 2006. See http://
www.seereal.com/.[23] Andries van Dam, Andrew S. Forsberg, David H. Laidlaw, Joseph
J. LaViola Jr., and Rosemary Michelle Simpson. Immersive VR forscientific visualization: A progress report. IEEE Computer Graphicsand Applications, 20(6):26–52, 2000.
[24] John Viega, Matthew J. Conway, George Williams, and Randy Pausch.3D magic lenses. In Proceedings of the ACM Symposium on User In-terface Software and Technology, Papers: Information Visualization,pages 51–58, 1996.