gr l rl - iaglr.org
TRANSCRIPT

GREAT LAKES REVIVALHow Restoring Polluted Waters Leads to
Rebirth of Great Lakes Communities
IAGLR
GREAT LAKES REVIVALHow Restoring Polluted Waters Leads to
Rebirth of Great Lakes Communities
IAGLR
©2019 International Association for Great Lakes Research4840 South State Road
Ann Arbor, Michigan 48108 USAiaglr.org
2019
Co-edited by
John H. Hartig University of Windsor
Gail Krantzberg McMaster University
John C. Austin The Brookings Institution
Paula McIntyre International Association for Great Lakes Research


iii
This report is a collaborative effort among numerous Canadian and U.S. researchers, agencies, institutions, and nongovernmental organizations. Any binational effort covering such a broad scope, by nature, requires considerable collaboration and numerous contributions. Without their significant contributions, this report would not have been possible. We also gratefully acknowledge all the stakeholders in the 43 Areas of Concern over the past 34 years who are the lifeblood of these restoration efforts.
The lessons learned presented in this report were developed from a symposium titled “Restoring Great Lakes Areas of Concern” convened at the 2017 annual conference of the International Association for Great Lakes Research. Symposium co-sponsors included the Aquatic Ecosystem Health and Management Society, the International Association for Great Lakes Research, the Great Lakes Commission, the U.S. Fish and Wildlife Service’s Detroit River International Wildlife Refuge, and the International Joint Commission. We gratefully acknowledge their contributions and input.
This project was made possible by a grant from The Erb Family Foundation to the International Association for Great Lakes Research to review and evaluate what has been achieved and learned over the past more than three decades of the remedial action plan program to clean up Great Lakes Areas of Concern. We are grateful for their support and leadership on Great Lakes issues.
The views expressed in the St. Louis River case study are those of the authors and do not necessarily reflect the views or policies of the U.S. Environmental Protection Agency.
ACKNOWLEDGEMENTS
On the coverBackground photo: Detroit riverfront circa early 2000s (courtesy of Detroit Riverfront Conservancy)Postcard photos, clockwise, from upper left: Detroit RiverWalk (courtesy of Detroit Riverfront Conservancy); Watching the fire boat on the Cuyahoga River (courtesy of Cuyahoga River Restoration); Collingwood Harbour Yacht Club with The Shipyards in the background (courtesy of FRAM Building Group); Activity along the Buffalo River (courtesy of Joe Cascio); and the Simcoe Wavedeck, Toronto (courtesy of Waterfront Toronto)


v
CONTENTSAcknowledgements . . . . . . . . . . . . . . . . . . . . . . . . . . . . . . . . . . . . . . . . . . . . . . . . . . . . . . . . . . . iiiExecutive Summary . . . . . . . . . . . . . . . . . . . . . . . . . . . . . . . . . . . . . . . . . . . . . . . . . . . . . . . . . . .ix
1 Introduction . . . . . . . . . . . . . . . . . . . . . . . . . . . . . . . . . . . . . . . . . . . . . . . . . . . . . . . . . . . . . . . . . . 1
2 Buffalo River Cleanup Improves Buffalo’s Ecological Health, Economy, and Public Spaces . . . . . . . . . . . . . . . . . . . . . . . . . . . . . . . . . . . . . . . . . . . . . . . . . . . . . . . . . . . . . . . . 3J. Jedlicka and J.H. Hartig
3 The Collingwood Harbour Story: From Shipbuilding Center to Great Lakes Pollution Hot Spot to Waterfront Revitalization . . . . . . . . . . . . . . . . . . . . . . . . . . . . . . . . . . . . 11G. Krantzberg and N. Farrer
4 Cleveland Flats’ Revitalization Linked to Recovery of the Cuyahoga River . . . . . . . . . . . .17J. Goodman and M. Gigante
5 From Cleanup of the Detroit River to Revitalization of the Waterfront . . . . . . . . . . . . . . . 27J.H. Hartig
6 Economic Benefits of Remediating Contaminated Sediments at Hamilton Harbour’s Randle Reef . . . . . . . . . . . . . . . . . . . . . . . . . . . . . . . . . . . . . . . . . . . . . . . . . . . . . . . 33K. O’Connor and C. McLaughlin
7 From Lumber to Foundries to Revitalization: The Muskegon Lake Story . . . . . . . . . . . . . 39K. Evans, P. Isely, and A. Steinman
8 From Cleanup of the River Raisin to Revitalization of Monroe, Michigan . . . . . . . . . . . . . 47S.J. Bentley, M. Cochran, and J.H. Hartig
9 Economic Benefits Help Drive Cleanup of Severn Sound . . . . . . . . . . . . . . . . . . . . . . . . . 53K. Sherman
10 From Remediation to Restoration and Revitalization: The St. Louis River Story . . . . . . . 61K. Williams, J. Hoffman, and N.T. French
11 Cleanup of Toronto Harbour Leads to Waterfront Revitalization . . . . . . . . . . . . . . . . . . . . 67V. Francella, with input from M. Wolfe
12 Lessons Learned . . . . . . . . . . . . . . . . . . . . . . . . . . . . . . . . . . . . . . . . . . . . . . . . . . . . . . . . . . . . 79
Literature Cited . . . . . . . . . . . . . . . . . . . . . . . . . . . . . . . . . . . . . . . . . . . . . . . . . . . . . . . . . . . . .95
Appendix 1 . . . . . . . . . . . . . . . . . . . . . . . . . . . . . . . . . . . . . . . . . . . . . . . . . . . . . . . . . . . . . . . . .101
vi
List of Figures
Figure 1. 43 AOCs identified in the Great Lakes Basin Ecosystem . . . . . . . . . . . . . . . . . . . . . . . . . . . . . . . . . . . . . 1
Figure 2. River Raisin Heritage Trail system linking Downtown Monroe with River Raisin National Battlefield Park, the Detroit River International Wildlife Refuge, Sterling State Park, historic districts and sites, waterfront parks, and cultural destinations . . . . . . . . . . . . . . . . . . . . . . . . . . . . . . . . 50
Figure 3. Map of municipalities in the Severn Sound watershed. . . . . . . . . . . . . . . . . . . . . . . . . . . . . . . . . . . . . .54
Figure 4. Map depicting the Toronto and Region AOC, including its six major watersheds: Etobicoke Creek, Mimico Creek, Humber River, Don River, Highland Creek, and Rouge River . . . . . . . . . . . .68
List of Tables
Table 1. Examples of Buffalo River habitat restoration projects completed with GLRI funding since 2012 . . . . . . . . . . . . . . . . . . . . . . . . . . . . . . . . . . . . . . . . . . . . . . . . . . . . . . . . . . . . . . . . . . . . . . . . . . . . . . . . . . . . .6
Table 2. A summary of waterfront development projects along the Buffalo River in Buffalo, New York, 2012-2018 . . . . . . . . . . . . . . . . . . . . . . . . . . . . . . . . . . . . . . . . . . . . . . . . . . . . . . . . . . . . . . . . . . . . . . . . . . . .9
Table 3. A summary of the fiscal impact of the proposed development of the former Canada Steamships property (now called The Shipyards) in Collingwood, Ontario. . . . . . . . . . . . . . . . . . . . . . . . . . . . . 15
Table 4. A timeline of significant activities related to the restoration of impaired beneficial uses in the Cuyahoga River AOC . . . . . . . . . . . . . . . . . . . . . . . . . . . . . . . . . . . . . . . . . . . . . . . . . . . . . . . . . . . . . . . . 21
Table 5. Flats development projects planned as of August 2018 . . . . . . . . . . . . . . . . . . . . . . . . . . . . . . . . . . . . .25
Table 6. Summary of Detroit River environmental improvements . . . . . . . . . . . . . . . . . . . . . . . . . . . . . . . . . . . . .28
Table 7. Summary of Detroit riverfront economic impacts in the first 10 years . . . . . . . . . . . . . . . . . . . . . . . . . . 31
Table 8. Summary of the status of beneficial use impairments in Hamilton Harbour . . . . . . . . . . . . . . . . . . . . .35
Table 9. Total estimated benefits by beneficiary for the Randle Reef project and all other remedial projects for Hamilton Harbour . . . . . . . . . . . . . . . . . . . . . . . . . . . . . . . . . . . . . . . . . . . . . . . . . . . . . . . . . . .38
Table 10. A timeline of significant activities related to the restoration of impaired beneficial uses in the Muskegon Lake AOC . . . . . . . . . . . . . . . . . . . . . . . . . . . . . . . . . . . . . . . . . . . . . . . . . . . . . . . . . . . . . . . . 41
Table 11. Major habitat restoration projects completed with GLRI, Great Lakes Legacy Act, and American Recovery and Reinvestment Act funding in support of delisting Muskegon Lake as an AOC . . . . . . . . . . . . . . . . . . . . . . . . . . . . . . . . . . . . . . . . . . . . . . . . . . . . . . . . . . . . . . . . . . . . . . . . . . . . . . .44
Table 12. List of sites in Monroe appearing on the National Register of Historic Places . . . . . . . . . . . . . . . . . .48
Table 13. Park attendance, 2011-2017 . . . . . . . . . . . . . . . . . . . . . . . . . . . . . . . . . . . . . . . . . . . . . . . . . . . . . . . . . . . .49
vii
Table 14. Estimates of economic benefits of River Raisin National Battlefield Park based on three different models . . . . . . . . . . . . . . . . . . . . . . . . . . . . . . . . . . . . . . . . . . . . . . . . . . . . . . . . . . . . . . . . . 51
Table 15. River Raisin Heritage Corridor East Master Plan cost summary . . . . . . . . . . . . . . . . . . . . . . . . . . . . . . 51
Table 16. Estimated total cost savings and monetary benefits generated by implementation of the Severn Sound Remedial Action Plan (RAP), compared to costs of the rehabilitation projects, 1991–2002 . . . . . . . . . . . . . . . . . . . . . . . . . . . . . . . . . . . . . . . . . . . . . . . . . . . . . . . . . . . . . . . . . . . . . . . . . . .59
Table 17. Highlights of progress in key indicators of the Toronto and Region RAP . . . . . . . . . . . . . . . . . . . . . . .69
Table 18. A summary of economic benefits of construction projects located on public lands controlled by Waterfront Toronto in the East Bayfront and West Don areas, and privately owned lands in adjoining neighborhoods . . . . . . . . . . . . . . . . . . . . . . . . . . . . . . . . . . . . . . . . . . . . . . . . . . . . . . . . . 77
Table 19. RAP institutional structures to help achieve public involvement, implement an ecosystem approach, and build capacity for implementation of remedial and preventive actions . . . . . . . . . 81
Table 20. Contaminated sediment remediation costs in the 10 AOC case studies . . . . . . . . . . . . . . . . . . . . . .84
Table 21. A summary of habitat restoration efforts in the 10 AOC case studies . . . . . . . . . . . . . . . . . . . . . . . . .86
Table 22. A summary of economic benefits resulting from the cleanup and restoration of 10 AOCs in the United States and Canada. . . . . . . . . . . . . . . . . . . . . . . . . . . . . . . . . . . . . . . . . . . . . . . . . . . . . . . . . . .87
List of Tables continued

ix
THE GREAT LAKES are one of the world’s most distinctive, valuable, and emotionally resonant natural features. Their water basin and ecosystem both serve the people and define the character and lifestyle of eight U.S. states and two Canadian provinces.
The ties to these waters and the bounty of the lakes have shaped and sustained native peoples for millennia. The beauty and grandeur of the lakes left European explorers and settlers in awe. These waters also supported the industrial and agricultural revolutions of the 19th and 20th centuries. These revolutions, in turn, powered the growth of Great Lakes’ cities and provided jobs and wealth to millions; yet over time, they also fouled these waters horribly.
As citizens of the United States and Canada awoke to visible damage and invisible dangers of polluted water and toxic residues, crippling local economies and degrading the quality of life around these magnificent waters, they chose to act. The two nations made a commitment to clean water and, beginning in 1985, focused on what came to be termed Great Lakes “Areas of Concern,” the most dangerously fouled waters in the Great Lakes, its bays, harbors, and connecting rivers. People came together to develop remedial action plans to restore this fundamental infrastructure that undergirds thriving communities and provides a rich quality of life and an attractive backdrop for life, work, and play: clean water.
This report is the story of that work: how stakeholders came together to clean up Areas of Concern, reconnect residents to these waters, and revitalize the communities they call home. Detailed case studies share distinct stories of how this work was done and illustrate the benefits of water reclamation in catalyzing community revival. Included are 10 unique stories of revitalization:
• Buffalo River Cleanup Improves Buffalo’s Ecological Health, Economy, and Public Spaces • The Collingwood Harbour Story: From Shipbuilding Center to Great Lakes Pollution Hot Spot to
Waterfront Revitalization • Cleveland Flats’ Revitalization Linked to Recovery of the Cuyahoga River • Cleanup of the Detroit River to Revitalization of the Waterfront • The Economic Benefits of Remediating Contaminated Sediments at Hamilton Harbour’s Randle
Reef • From Lumber to Foundries to Revitalization: The Muskegon Lake Story • From Cleanup of the River Raisin to Revitalization of Monroe, Michigan • Economic Benefits Help Drive Cleanup of Severn Sound • From Remediation to Restoration and Revitalization: The St. Louis River Story • Cleanup of Toronto Harbour Leads to Waterfront Revitalization
From these unique stories, common threads and lessons have emerged. These communities came together, struggled, and ultimately found the paths to effectively reclaim their waters. They also came to learn what these waters meant to the people of their communities.
These communities overcame challenges in defining the scope, size, and nature of the problem; and how to even begin the work of unburdening the waters from years of abuse and neglect. They faced costly
EXECUTIVE SUMMARY

x
and confounding choices in tackling the legacy of toxics buried in sediments: whether and how to proceed, at what cost, and where to find the resources. In different ways and through varied approaches, they came to appreciate the importance of engaging and empowering the community in driving the cleanup. In so doing, they animated impactful processes that empowered local residents as partners.
The communities all came to incorporate in their work the restoration of habitat for fish and wildlife, resulting in a powerful and satisfying restoration of the life in and around the lakes that was such an integral part of their historic beauty and gift to human denizens. By cleaning, reclaiming, and reconnecting local communities to the waters, these communities have also catalyzed local economic development and community rebirth to the tune of hundreds of millions, even billions of dollars of economic benefits and countless new jobs for local residents. Finally, they have rebuilt the emotional connection—the “love of the lakes”—that is such a defining attribute for those lucky enough to live in their vicinity.
The story told in this report, and by these Great Lakes communities, documents and illustrates the very tangible, as well as often intangible benefits of this cleanup to the people of the Great Lakes states and provinces. It provides a powerful case for sustaining the flow of cleanup funding that has quite literally revived communities (the Great Lakes Restoration Initiative and Great Lakes Legacy Act in the United States and the Canada-Ontario Agreement on Great Lakes Water Quality and Ecosystem Health and the Great Lakes Protection Initiative in Canada). And it also reminds us that we all benefit when we come to see—or just even know that they exist intact—these jewels that crown our one shared home, the fragile blue and green sphere that is planet Earth.

1
THE INDUSTRIAL AND AGRICULTURAL REVOLUTIONS and associated human population expansion powered growth of Great Lakes’ cities and provided jobs and wealth to millions. But they also left a legacy of unchecked pollution and dangerously fouled Great Lakes waterways that
became recognized as Areas of Concern (AOCs). These AOCs serve as microcosms of human impacts on the Great Lakes, and lessons learned there can benefit other waterfront communities.
As citizens of the United States and Canada awoke to the reality that this environmental degradation was crippling ecosystem health and weakening their economies, they chose to act. In 1985, the Great Lakes Water Quality Board of the International Joint Commission identified 42 polluted areas of the Great Lakes, called AOCs, and the federal governments of the U.S. and Canada, the eight Great Lakes states, and the Province of Ontario committed to developing and implementing a remedial action plan (RAP) to restore these waters using an ecosystem approach (International Joint Commission, 1985; Hartig and Thomas, 1988). These commitments were then incorporated in the 1987 Protocol to the U.S.-Canada Great Lakes Water Quality Agreement. A 43rd AOC, Presque Isle Bay in Erie, Pennsylvania, was identified in 1991 (Figure 1).
INTRODUCTIONCHAPTER 1
Figure 1. 43 AOCs identified in the Great Lakes Basin Ecosystem.

2
These initial commitments to cleanup were followed with involving stakeholders to ensure local ownership, reaching agreement on problems and possible solutions, forming partnerships to solve problems, collaborating to secure funding, and often taking small steps toward a common goal of cleaning up AOCs. This 1985 commitment to clean up AOCs was indeed a watershed moment because it represented a tangible commitment to rebuild a fundamental infrastructure that undergirds thriving communities and provides a rich quality of life and an attractive backdrop for living, working, and recreating: clean water.
This report is the story of that work: how stakeholders have come together to clean up AOCs and revitalize the communities they call home. This story will be told through 10 case studies of what was done to clean up and restore these waterways, how waterway revival is spurring improving public access to them, and how together cleanup and reconnecting people to waterways are catalyzing waterfront and community revitalization. Following the case studies will be key lessons learned from:
• committing for the long run; • engaging and empowering the community;• cleaning up the legacy of toxic substances in sediments;• giving habitat a home;• revitalizing waterfront communities; and• reconnecting people psychologically to the water.
This report concludes with a call for sustaining cleanup funding as part of a Great Lakes community revitalization strategy.
3
Buffalo River Cleanup Improves Buffalo’s Ecological Health, Economy, and Public Spaces
JILL JEDLICKA, Executive Director & Waterkeeper, Buffalo Niagara Waterkeeper, and JOHN H. HARTIG, Visiting Scholar, Great Lakes Institute
for Environmental Research, University of Windsor
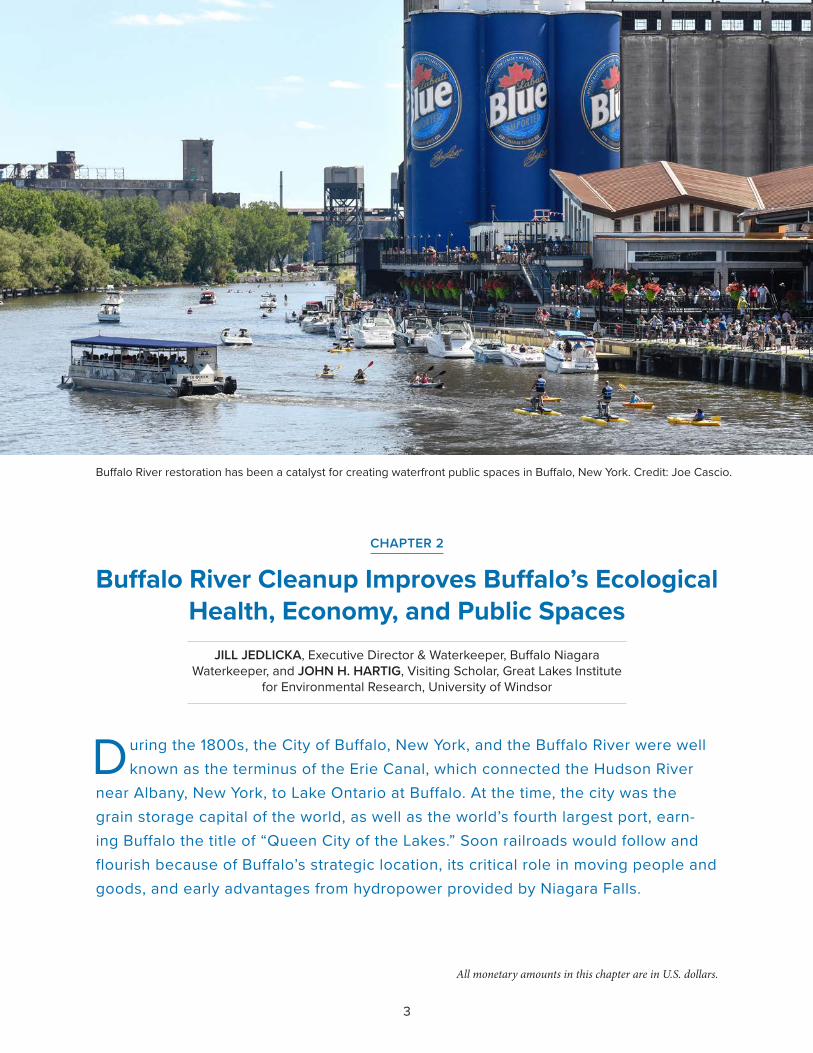
During the 1800s, the City of Buffalo, New York, and the Buffalo River were well known as the terminus of the Erie Canal, which connected the Hudson River
near Albany, New York, to Lake Ontario at Buffalo. At the time, the city was the grain storage capital of the world, as well as the world’s fourth largest port, earn-ing Buffalo the title of “Queen City of the Lakes.” Soon railroads would follow and flourish because of Buffalo’s strategic location, its critical role in moving people and goods, and early advantages from hydropower provided by Niagara Falls.
Buffalo River restoration has been a catalyst for creating waterfront public spaces in Buffalo, New York. Credit: Joe Cascio.
CHAPTER 2
All monetary amounts in this chapter are in U.S. dollars.

4
Buffalo River, before cleanup to reviitalize and draw people to the riverfront. Credit: Buffalo Niagara Waterkeeper.
By the 1900s, Buffalo would attract numerous industries, including automotive, steel, chemical, and oil, and become a thriving hub for retail and wholesale distribution. By the 1940s, both indus-trial and municipal effluents were overwhelming the Buffalo River. The 1960s became a decade of environmental awakening, including in 1968 when the Buffalo River caught fire. During this time a Buffalo conservationist named Stanley Spisiak helped raise public awareness of severe water pol-lution of the Buffalo River and Lake Erie, and even-tually convinced government officials to reduce and control the indiscriminate release of industrial pollutants into these waters. The environmental awakening occurring across the country led to the establishment of Earth Day in 1970, the Clean Wa-ter Act in 1972, the U.S.-Canada Great Lakes Water Quality Agreement in 1972, and the Endangered Species Act in 1973.
Then in the 1980s, Buffalo’s economy was impacted by a recession that resulted in the closure of many industries, lessening the impact on the Buffalo River. The community began to envision a post-industrial future with a cleaner and more natural river.
Buffalo River RAPThe RAP process for Buffalo River was initiated in 1985. The combined Stage 1 and 2 Buffalo River RAP (i.e., problem definition and causes, remedial actions and responsibilities) was completed in 1989 (New York State Department of Environmen-tal Conservation [NYSDEC], 1989). The Stage 2 RAP addendum was completed in 2011 (Buffalo Niagara Riverkeeper, 2011) and updated periodi-cally thereafter. Nine beneficial use impairments (see Appendix 1 for more information on benefi-cial use impairments) were identified: restrictions on fish and wildlife consumption, tainting of fish

5
Contaminated sediment remediation in the Buffalo River (left), and shoreline habitat restoration along the Buffalo River (right). Credit: Buffalo Niagara Waterkeeper.
and wildlife flavor, degradation of fish and wildlife populations, fish tumors or other deformities, bird or animal deformities or reproductive problems, degradation of benthos, restrictions on dredging activities, degradation of aesthetics, and loss of fish and wildlife habitat. From the late 1980s through the early 2000s, the NYSDEC served as the RAP coordinator, with significant public participation and input from a Remedial Advisory Commit-tee. In 2003, the Buffalo Niagara Waterkeeper (previously known as Riverkeeper) was the first nonprofit organization in the Great Lakes selected to re-energize the RAP process, coordinate imple-mentation, and catalyze further progress.
Implementation of RAPs through the U.S. por-tion of the Great Lakes took a major step forward with the passage of the Great Lakes Legacy Act and Great Lakes Restoration Initiative (GLRI) in 2002 and 2010, respectively. These funding authorities provided tools for local communities to secure cost-share agreements and provide a vehicle for public-private-nonprofit collaboration. Through the Great Lakes Legacy Act and GLRI, priority was given to remediating contaminated sediments and restoring habitats in Great Lake AOCs. Further, the rate of sediment remediation and habitat restora-tion, the removal of beneficial use impairments, and the delisting of AOCs has accelerated since the
Great Lakes Legacy Act and GLRI programs were initiated.
For example, the Buffalo River Restoration Partnership was able to remediate 494,562 cubic yards (378,120 cubic meters) of contaminated sediment in 2016 at a cost of $48.5 million under a Great Lakes Legacy Act agreement, and 371,994 cubic yards (284,410 cubic meters) of contaminat-ed sediment was removed by the U.S. Army Corps of Engineers in 2012 at a cost of $8 million through “enhanced navigational dredging.” In addition, substantial habitat restoration has been undertaken in support of removing loss of fish and wildlife habitat as a beneficial use impairment. Since 2012, numerous partners have implemented projects along nearly two miles (3.2 kilometers) of shoreline and 20 acres (8.1 hectares) of habitat have been restored through GLRI at a cost of more than $25 million (Table 1).
It should also be noted that the Buffalo Sewer Authority operates a secondary wastewater treat-ment plant on Bird Island that discharges to the Niagara River and a collection system of approxi-mately 850 miles (1,368 kilometers) of sewer lines. Since 1985, the Buffalo Sewer Authority has in-vested more than $300 million in capital improve-ments and system upgrades.

6
Project/Site Location Description Extent of Restoration
Buffalo Motor & Generator Corporation
Between Michigan Street Lift Bridge and River Fest Park
Riparian slope restoration, invasive species removal and management, and upland and riparian habitat restoration
240 feet of shoreline; 0.27
acres
Toe of Katherine Street
Located near 99 Ensign Street
Invasive species removal and management, re-establishment of native vegetation, and shoreline stabilization
805 feet of shoreline; 2.3 acres
Blue Tower Turning Basin
East and south bank of the Buffalo River, 3.1 miles upstream of the river mouth
Installation of vertical pilings and a log boom chain to prevent debris buildup and allow for re-establishment of native vegetation
1,632 feet of shoreline
Riverbend I and II
RiverBend Commerce Park property near South Park Avenue
Riparian slope restoration, invasive species removal and management, and upland and riparian habitat restoration
4,320 feet of shoreline; 9.8 acres
Buffalo Color Peninsula
4.25 miles upstream of river mouth
Stabilization and restoration of shoreline, including construction of vegetated benches
2,575 feet of shoreline
Old Bailey Woods
Downstream of confluence of Buffalo River and Cazenovia Creek
Restoration of riparian slope habitat, upland forest habitat, and in-water habitat
805 feet of shoreline; 3.1 acres
Ohio Street Boat Launch
1.5 miles upstream of river mouth
Shoreline and upland habitat restoration
300 feet of shoreline; 1.25
acres
Table 1. Examples of Buffalo River habitat restoration projects completed with GLRI funding since 2012.
The City of Buffalo is served by a combined storm and sanitary sewer system that periodically releases untreated and partially treated sewage to the river. The Buffalo Sewer Authority esti-mates that 379.7 million gallons of wastewater and untreated stormwater enter the Buffalo River during the 69 overflow events in a typical year. Buffalo Sewer Authority’s Long-Term Control Plan to control overflows to all of Buffalo’s waterways, including the Buffalo River, was finalized in 2014.
This systemwide plan is being implemented over a 20-year time period at a cost of $380 million. This does not include the more than $50 million invested by Buffalo Sewer Authority in engineer-ing and previously completed Phase I projects for operational improvements.
As part of this plan, Buffalo is championing both traditional gray infrastructure (i.e., under-ground pipes, pumps, and storage tanks) and green infrastructure (i.e., living infrastructure that

7
Preschool children releasing butterflies as part of habitat
restoration along the Buffalo River. Credit: Buffalo Niagara Waterkeeper.
captures stormwater and reintroduces it into the water cycle) solutions. Rain Check 1.0, launched in 2015, was the first generation of green infrastruc-ture in Buffalo. The program tackled the stormwa-ter challenge through four distinct strategies: green streets; green parking lots; demolitions and vacant lot restoration; and rain barrels and downspout disconnections. The next generation of green in-frastructure in Buffalo will expand projects, while continuing to prioritize community engagement and education, and establish new partnerships to tackle collaborative projects across the city.
Buffalo River RevivalConsiderable progress has been made in restor-ing the Buffalo River, and this restoration has been accelerated in the last 10 years with funding from the Great Lakes Legacy Act and GLRI. Indeed, this river revival is dramatic. In 1968 when the Buffalo River caught fire, there were no fish in the lower river. Today, you can find 25–30 species of fish and a substantially improved macrobenthic invertebrate community. Peregrine falcons are re-producing after an absence of more than 30 years. In addition, the recreational use and commer-cial redevelopment of its shorelines has brought hundreds of thousands of people to a riverfront that was once a dead zone of activity. Contingent upon confirmation of use restoration, the Buffalo
Niagara Waterkeeper and NYSDEC project the Buffalo River will be delisted as an AOC in 2022.
Improving Public AccessWith the cleanup of the Buffalo River, the City of Buffalo, the Buffalo Niagara Waterkeeper, and many partners began improving public access to the river to improve quality of life and stimulate the local economy. Buffalo formally adopted a local Complete Streets ordinance in 2008. Complete Streets are best described as streets for everyone. They are designed and operated to enable safe ac-cess for all users, including pedestrians, bicyclists, motorists, and transit riders of all ages and abili-ties. Complete Streets help create livable communi-ties by making it easy to cross the street, walk to shops, and bicycle to work.
In 2014, Buffalo’s Ohio Street was transformed into a complete street with safe access for all users and connections to the river to be a catalyst for revitalization. This Ohio Street transformation was funded with $8.152 million from the Federal High-way Administration, $2.038 million from the New York Power Authority via the Erie Canal Harbor Development Commission, and $1.2 million from the City of Buffalo (Office of Congressman Brian Higgins, 2015).
In 2011, the new 3-acre Buffalo Riverfest Park opened along the Buffalo River as a place to go and

8
RiverWorks sports and entertainment complex along the Buffalo River. Credit: Buffalo Niagara Waterkeeper.
relax with friends year-round. The park cost $5.4 million (Office of Congressman Brian Higgins, 2015), with funding from the Wendt Foundation, Dormitory Authority, Greenway Commission, New York State Canal Commission, New York State Parks Department, Department of State, Empire State Development Corporation, and others.
It should also be noted that New York Governor Andrew Cuomo has committed to a $1 billion investment in the Buffalo area, called Buffalo Billion, to create thousands of jobs and spur billions of dollars in new investment and economic activity over the next several years. As part of this initiative, Governor Cuomo announced in August 2018 that $10 million in state funds were awarded to Buffalo Niagara Waterkeeper to establish the “Buffalo Blueway,” a water trail network of public access points along the Buffalo River and other regional waterways.
In October 2018, the Ralph C. Wilson Jr. Foundation committed $50 million to remake Buffalo’s LaSalle Park into the Ralph C. Wilson, Jr. Centennial Park to improve public access to the lakefront and enhance quality of life. The foundation committed an additional $50 million to support regional greenway trails in western New York. Concurrently, the U.S. Army Corps of Engineers received $3.7 million to repair 1,300 feet
(396 meters) of seawall on the northern section of this park.
Waterfront RevitalizationBoth a cleaner Buffalo River and improved pub-lic access to it have contributed to waterfront economic revitalization. In 2008, the Erie Canal Harbor Development Company reopened the Erie Canal Harbor as a historic business district under the name Canalside. Use of the site has grown steadily, from 150,000 visitors and 115 events in 2010 to more than 1.5 million annual visitors and more than 1,000 annual events in 2016 (Great Lakes Commission and Council of Great Lakes Industries, 2018).
Buffalo Mayor Byron Brown has been cham-pioning economic revitalization that embraces inclusiveness, equity, and opportunity for all. As part of this economic revitalization effort, the City of Buffalo’s Office of Strategic Planning has been tracking waterfront development projects. Between 2012 and 2018, there has been more than $428 mil-lion of waterfront development along the Buffalo River alone (Table 2).
Concluding ThoughtsThe cleanup of the Buffalo River has led to a substantial ecological revival. Public-private partnerships have been essential to this cleanup

9
Table 2. A summary of waterfront development projects along the Buffalo River in Buffalo, NY, 2012-2018.
Project (Developer) Description Cost Year
Mariner Tower (Liberty Affordable Housing)
Development of affordable housing adjacent to Naval Park $41.9 million 2012
Business Expansion (The English Pork Pie Company)
Renovation of a building and installation of an automated pot pie production line $1.2 million 2012
Buffalo Riverworks (Doug Swift, Earl Ketry, and John Williams)
Development of a waterfront, boating, sports, music, and entertainment complex $15 million 2013
Industrial Expansion (PVS Chemicals)
Construction of a 3,725-square-foot addition to their manufacturing plant $11 million 2014
Tifft Nature Preserve (Buffalo Museum of Science)
Construction of a 3,930-square-foot expansion and creation of a Sustainability Center
$775,000 2014
Buffalo HARBORCENTER at Canalside (Pegula Sports and Entertainment)
Mixed-use development, including entertainment and a 12-story Courtyard by Marriott Hotel with 205 rooms
$250 million 2014-2015
Explore and More Children’s Museum (Samuel Savarino)
Construction of a 40,000-square-foot museum at Canalside $36 million 2015
Industrial Expansion (Rigidized Metals)
3,600-square-foot expansion of a metals plant $3 million 2015
Townhouses at Waterfront Place (Ellicott Development)
Construction of 10 three-story townhouses, plus condominiums $20 million 2015
William K’s Restaurant (Molly Ford Koessler)
Development of a new waterfront restaurant $900,000 2015
Industrial Development (John W. Danforth Co.)
Construction of a 50,000-square-foot facility to expand operations $7 million 2015
301 Ohio Street Mixed-Use Development (Ellicott Development)
Mixed use development, including 21 apartments $15 million 2016

10
Project (Developer) Description Cost Year
Buffalo River Landing (Savarino)
Mixed-use redevelopment of former Erie Freight House, including 78 apartments $18 million 2016
Infrastructure Improvements by Energy Company (National Grid)
Construction of caisson shafts and tunneling for National Grid infrastructure under the Buffalo River
$6.8 million 2018
Utility Infrastructure Improvements (National Grid) Construct electric substation $1.8 million 2018
Table 2. Continued
effort. In recent years, federal funding from the Great Lakes Legacy Act and GLRI has accelerated river cleanup, leading to improved public access to the river and waterfront revitalization. Between 2012 and 2018 alone there has been more than $400 million of waterfront development projects along the Buffalo River.
“The Buffalo River has gone from a severely damaged waterway to one of our city’s greatest assets, with more than $400 million in investment since 2012,” noted Mayor Byron W. Brown. “The
healthy, rediscovered Buffalo River is now attract-ing residential, entertainment, and recreational development, and its waters are an increasingly popular destination for kayaking, rowing, and fish-ing, while cyclists, runners, walkers, and birders, are drawn to its shoreline. The Buffalo River is now an economic engine, which hand-in-hand with our reimagined waterfront, is playing a critical role in Buffalo’s rebirth as the Queen City of the Great Lakes.”

11
Collingwood Harbour Yacht Club with The Shipyards in the background. Credit: FRAM Building Group.
The Collingwood Harbour Story
GAIL KRANTZBERG, McMaster University, and NANCY FARRER, Town of Collingwood
Situated on Georgian Bay, Lake Huron, the Town of Collingwood became an important shipbuilding center in the late 1800s, first for wooden skiffs and
schooners and later for steel cargo and passenger steamers. At one point, 1,000 of the town’s less than 5,000 residents were employed at the shipyards. It operated as a shipbuilding center for more than 100 years.
CHAPTER 3
From Shipbuilding Center to Great Lakes Pollution Hot Spot to Waterfront Revitalization
All monetary amounts in this chapter are in Canadian dollars.

12
This postcard shows a view of Collingwood’s
shipyards circa early 1960s with the freighter
Carol Lake, built by Collingwood Shipyards,
Ltd. in 1960. Courtesy of William Forsythe /
Boatnerd.com
In 1985, the International Joint Commission’s Great Lakes Water Quality Board identified Collingwood Harbour as a Great Lakes AOC because of nuisance algal growth stimulated by excessive phosphorus inputs, habitat and wetland loss, shoreline hardening, and contaminated sediment (Krantzberg and Houghton, 1996). That same year, the Ontario Ministry of the Environment committed to developing and implementing a RAP to clean up the harbor and restore all impaired beneficial uses using an ecosystem approach. In 1987, the ministry hired Gail Krantzberg to coordinate this effort and assemble and then work with the Collingwood Harbour RAP Public Advisory Committee (PAC) to foster use of an ecosystem approach to achieve cleanup.
The Town of Collingwood and its stakeholders—including businesses, civic organizations, environmental organizations, and more—quickly adopted the PAC goal to clean up the harbor and leave a sustainable legacy. RAP efforts:
• optimized the local sewage treatment plant with dual alum addition to meet the phosphorus loading targets;
• remediated 257,800 cubic feet (7,300 cubic meters) of contaminated sediment at a cost of $1.2 million;
• stimulated further action to protect the existing 237-acre (96-hectare) Collingwood Wetland Complex;
• controlled invasive purple loosestrife in wetlands; and • rehabilitated fish and wildlife habitat in the harbor and watershed,
including Black Ash Creek where soil bioengineering was used to both prevent erosion and restore habitat (Krantzberg and Houghton, 1996).
The Collingwood Harbour RAP PAC was incorporated in 1993. A storefront called the Environment Network of Collingwood opened for the Collingwood

13
Collingwood Harbour today.Credit: Nancy Farrer.
Harbour RAP to provide a central location for its activities (Krantzberg, 2006; Krantzberg and Rich, 2018). This also provided residents with an envi-ronmental resource library and, most of all, it gave residents and visitors a place to go with environ-mental questions and concerns. Several years later, the name was changed to the Environment Net-work. The network went on to develop a strategic plan called the Greening of Collingwood that championed pollution prevention for residents, businesses, and industries. To this day the network operates as a cooperative, providing people with opportunities for work and a place for people to learn how they can operate their business or home in an ecologically, socially, and economically sus-tainable manner (Krantzberg and Rich, 2018).
Use of democratic dialogue and participatory decision making enabled consensus and local ownership of the RAP and its legacy goal of sustainability (Krantzberg, 2006). The Collingwood Harbour RAP became a model for use of an ecosystem approach and delivering environmental results for the community. After monitoring confirmed restoration of all impaired beneficial uses in 1994, Collingwood Harbour became the first AOC to be delisted, meaning that it was
removed from the list of Great Lakes pollution hotspots.
Transformation of Collingwood’s ShipyardsThe Collingwood shipyards closed in 1986 af-ter a 103-year history as one of Canada’s busi-est shipbuilding centers. For nearly 20 years, the Collingwood shipyards then sat abandoned on the waterfront with an uncertain future. Meanwhile, Collingwood and the vicinity adapted to the loss of the shipyards and became better known as a four-season vacation destination, including skiing in the winter at Blue Mountain and golfing, biking, hiking, and many water sports in summer. This at-tracted vacationers from all over the province and beyond.
Finally, in 2004 the former shipyards site was purchased by a developer that wanted to offer waterfront living in downtown Collingwood, close to restaurants, shops, and services. It took years of environmental assessments and remediation, ap-provals from all levels of government, and building goodwill in Collingwood, but finally The Shipyards development was born as a 40-acre (16.2-hectare) mixed residential-commercial waterfront develop-

14
The Shipyards is a European-inspired,
waterfront development with more than 600 homes in a pedestrian village located
on the site of Collingwood’s historical shipyards. Credit:
FRAM Building Group.
ment. This award-winning waterfront community will ultimately include more than 600 homes in a pedestrian village, with condominium townhouses, bungalows, midrise condominium buildings, a ho-tel, retail shops, and restaurants. The development design also took into consideration the RAP with the creation of underwater reefs to enhance fish habitat. The Shipyards also includes a waterfront promenade accessible to all, a 7-acre (2.8-hectare) waterfront park, a community amphitheater, and hiking trials that will eventually link to the Geor-gian Trail. Sales started in 2010 and the develop-ment is being completed in phases.
It should be noted that the economic down-turn of the 2000s led to extension of the construc-tion timeline for The Shipyards. Similar to many other developments during this time period, progress on The Shipyards stalled until investor confidence in the local market returned. However, this redevelopment project is now back on track.
Municipal Fiscal Impact AnalysisIn the early 2000s, the Town of Collingwood retained C.W. Watson and Associates to undertake a municipal fiscal impact analysis of the proposed
redevelopment of the former Canada Steamship Lines lands in the Town of Collingwood. This fiscal impact analysis was undertaken to help determine the overall financial implications of the rede-velopment of the site, considering the proposed development would ultimately require significant investment by both the developer and the Town of Collingwood. Zegarac et al., (1994) provided esti-mates of costs and benefits of remedial actions in the context of overall municipal spending, showing the value of remedial actions in terms of phospho-rus removed. The analysis also showed the benefits of ongoing maintenance of environmental controls.
The methodology involved an operating and capital cost analysis that established 2002 as a base year (based on the tax rate at that time) and esti-mating annual municipal revenues and expendi-tures for a 10-year period (Watson and Associates, 2004). Based on this fiscal impact analysis, a deficit of $61,000 was estimated for Year 1, followed by a net positive impact in each subsequent year there-after (Table 3). A net municipal surplus of $174,157 was estimated for Year 2, followed by a progressive increase to $914,484 in Years 5–10. It should be noted that the same forecast of a $914,484 surplus

15
Year Property Tax Revenue
Non-Tax Revenue
Total Revenue
Total Expenditures
Surplus (Deficit)
1 $187,974 $28,894 $216,868 $278,199 ($61,331)
2 $522,761 $57,788 $580,549 $406,393 $174,157
3 $857,547 $86,682 $944,229 $534,593 $409,637
4 $1,192,333 $115,576 $1,307,909 $662,790 $645,119
5 $1,580,388 $150,601 $1,730,989 $816,505 $914,484
6 $1,580,388 $150,601 $1,730,989 $816,505 $914,484
7 $1,580,388 $150,601 $1,730,989 $816,505 $914,484
8 $1,580,388 $150,601 $1,730,989 $816,505 $914,484
9 $1,580,388 $150,601 $1,730,989 $816,505 $914,484
10 $1,580,388 $150,601 $1,730,989 $816,505 $914,484
in each of Years 5–10 is indeed accurate based on this operating and capital cost analysis. The overall conclusion of this fiscal impact analysis was that it would provide a net positive contribution to the Town of Collingwood (Watson and Associates, 2004).
It must be recognized that this analysis was limited in scope to impacts on the municipality. Clearly, there are other spin-off economic benefits, including spending by visitors, residents, em-ployees, and other operations that have not been quantified.
Today, The Shipyards development is part of a larger master plan for the Town of Collingwood. This plan calls for developing the waterfront as an urban destination with high-quality public spaces, housing, and mixed-use development, and strengthens connections between downtown and
the waterfront, while increasing local commercial activity (Town of Collingwood, 2016). These efforts are building on Collingwood’s existing strengths of natural beauty, a historically significant harbor, a vibrant commercial downtown, and an active com-munity life.
Concluding ThoughtsThe Collingwood Harbour RAP is a success story in its use of a locally designed ecosystem approach to restore impaired beneficial uses and remove the harbor from the list of Great Lakes AOCs. Fur-ther, the Environmental Network in Collingwood is an excellent example of capacity building for sustainability and of life after delisting as an AOC (Krantzberg and Rich, 2018). Community stake-holders continue to be fiercely protective of the town’s excellence in pursuit of sustainability. This
Table 3. A summary of the fiscal impact of the proposed development of the former Canada Steamships’ property (now called The Shipyards) in Collingwood, Ontario (Watson and Associates 2004). Note: Data are presented in 2002 dollars.
16
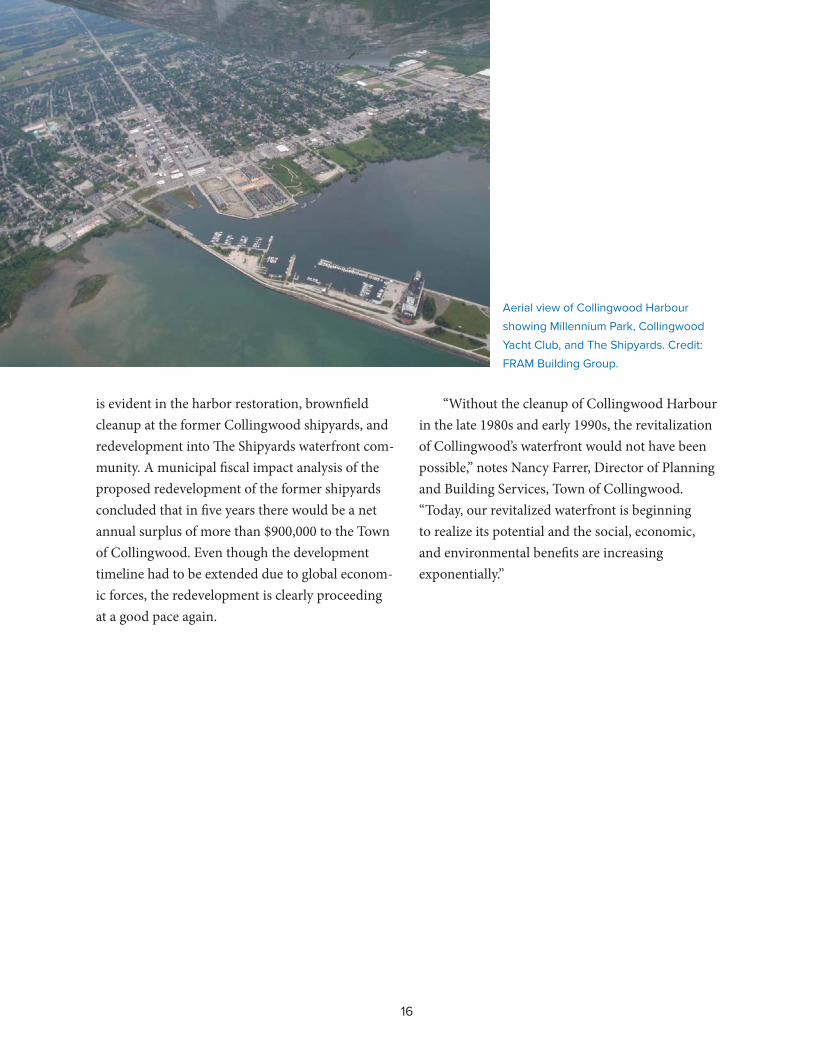
Aerial view of Collingwood Harbour showing Millennium Park, Collingwood Yacht Club, and The Shipyards. Credit: FRAM Building Group.
is evident in the harbor restoration, brownfield cleanup at the former Collingwood shipyards, and redevelopment into The Shipyards waterfront com-munity. A municipal fiscal impact analysis of the proposed redevelopment of the former shipyards concluded that in five years there would be a net annual surplus of more than $900,000 to the Town of Collingwood. Even though the development timeline had to be extended due to global econom-ic forces, the redevelopment is clearly proceeding at a good pace again.
“Without the cleanup of Collingwood Harbour in the late 1980s and early 1990s, the revitalization of Collingwood’s waterfront would not have been possible,” notes Nancy Farrer, Director of Planning and Building Services, Town of Collingwood. “Today, our revitalized waterfront is beginning to realize its potential and the social, economic, and environmental benefits are increasing exponentially.”

17
Cuyahoga River at its mouth in Cleveland, Ohio. Credit: Cuyahoga River Restoration.
JANE GOODMAN, Cuyahoga River Restoration, and MELINDA GIGANTE, Flats Forward
Cleveland Flats’ Revitalization Linked to Recovery of the Cuyahoga River
CHAPTER 4
The Haudenosaunee named this river Cuyahoga, or crooked river, for its meandering ways, as well as for the overall shape of its watershed. The
Cuyahoga is a u-shaped, 100-mile (160-kilometer), low gradient river located in northeast Ohio, draining over 800 square miles of land. The river begins its journey as two branches near the Lake Erie plain 30 miles east of its mouth at Cleveland. The branches join and the main stem heads south, away from Lake Erie, then makes a sharp right turn at Akron, redirected from its southerly course by the high ridge left by glaciers pushing the land into place. The river then flows north through the Cuyahoga Valley National Park and into Cuyahoga County on the way to its mouth at Lake Erie.
All monetary amounts in this chapter are in U.S. dollars.
18
For much of the new country’s earliest years, the Cuyahoga marked the American colonies’ western border. Toward the end of the 18th centu-ry, the Colony of Connecticut’s “Western Reserve,” originally deeded to it by King Charles II, was sold to the Connecticut Land Company. These specula-tors sent Moses Cleaveland to survey and divide the land into townships, laying the groundwork for the region’s settlement and its development as an economic powerhouse.
The City of Cleveland (the original “a” re-moved, it is said, by a printer, to save space) was founded in 1796, followed by the growth of other cities and villages along the river where settlers had homesteads. Akron was founded in 1825 along the Little Cuyahoga tributary where the Cuyahoga would meet the new canal systems and open over-land trade via the Ohio River.
The opening of the Erie Canal in 1825 (con-necting Lake Erie to the Atlantic Ocean via the Mohawk and Hudson rivers) and the opening of the Ohio and Erie Canal in 1832 (connecting Cleveland to the Ohio River at Portsmouth) pro-vided reliable passage for both people and goods. The Cuyahoga River provided the water for the canal between Akron and Cleveland. To handle and facilitate the movement of goods flowing into and out of this new system, a maritime district was created near the mouth of the Cuyahoga River called The Flats, a reference to the original state of the Cuyahoga’s mouth as a shallow, marshy area at the base of the river valley.
The Flats surrounds the Cuyahoga River along its last few miles at Lake Erie, and originally sepa-rated the City of Ohio, an independent municipal-ity on the west bank, from the City of Cleveland on the east bank. The two cities competed fiercely over maritime and mercantile business until Ohio City was annexed to Cleveland in 1854.
During the 1820s, the Flats became the cen-ter of industry and commerce. The original river mouth, which met Lake Erie nearly a mile west of its current location, was too convoluted to provide optimal access for large ships, so in 1827 a new, straight, shipping channel was dug, bypassing what is now known as the Old River Channel. Ship-ping companies, docks, warehouses, and bars for sailors soon followed as the Flats developed into a shipping powerhouse. Soon Cleveland became the most important city between Buffalo, New York, and Detroit, Michigan.
During the mid-1800s, Cleveland became one of the leading wooden-ship building centers on the Great Lakes, rivaling Buffalo and Detroit. While water transportation on both Lake Erie and the Ohio and Erie Canal did much to facilitate the early development of Cleveland, it took the appear-ance of the railroad, and later the synergy be-tween rail and maritime shipping to fully develop Cleveland’s industrial base. For an entire century beginning in the 1860s, railroads served as the principal transporter of goods and people to and from Cleveland. The city, strategically located on Lake Erie, became the inevitable meeting place of coal brought in by the railroads from Pennsylva-nia, Ohio, Virginia, and Kentucky mines, and the ores brought down by ship from the Lake Superior region. People came, settled, worked, prospered, and developed Cleveland into an industrial hub with the Cuyahoga River, where rail and water met, as its center.
The city’s and river’s history during 1860–1930 was dominated by heavy industry, most notably steel, petroleum, chemical products, paint, and automobiles. In 1863, John D. Rockefeller and business partners entered the oil business as refin-ers in Cleveland, and in 1870 he and his partners organized The Standard Oil Company and devel-oped its refinery on the banks of the Cuyahoga. By

19
Cuyahoga River fire, November 3, 1952. Credit: James Thomas, Cleveland Press Collection, Michael Schwartz Library, Cleveland State University.
the early 1880s, Cleveland had become the center of the American petroleum production, with 90 percent of U.S. refineries and pipelines. In 1870, Sherwin-Williams set up its paint production facility on the Cuyahoga’s east bank. The mid-1800s saw the growth of ironworks and steel mills along the industrial end of the Flats, adding to the region’s prosperity. But the wealth it created was facilitated, in large part, by the ability to dispose of waste into the river at no financial cost.
Consequences of IndustrializationAs Cleveland became an industrial powerhouse, the industry-heavy channel of the Cuyahoga River became grossly polluted with industrial waste. Sitting at the bottom of a valley, the river was not readily visible to most of the population. Grow-ing public awareness of water pollution in Lake Erie and the Cuyahoga River during the 1960s led to substantial public outcry. During the mid-1960s, the Federal Water Pollution Control Ad-ministration (the predecessor of the U.S. Envi-ronmental Protection Agency) characterized the Cuyahoga River as one of the most polluted rivers in the United States. Then on June 22, 1969, the
Cuyahoga River caught on fire and ignited national outrage over water pollution.
The 1969 Cuyahoga River fire was a catalyst for change, in some measure, because it was part of a perfect storm of circumstances that drew attention to the fire and the city. Time magazine’s August 1, 1969, issue was one of the most widely read issues at a time when access to news was more limited than it is today. It was the week after Apollo 11 returned from its mission to the moon and the magazine featured the flight. It was also the first is-sue with a new environment section, with the river as its focus. The story featured Carl Stokes, the first African-American mayor of a large city. His brother, Louis, Ohio’s first black congressman, had just been elected to his seat and was at work on the Clean Water Act.
The river fire and its national coverage helped awaken the nation to widespread environmental degradation. But 1969 was not the first time the Cuyahoga River caught on fire. Fires occurred on the Cuyahoga River in 1868, 1883, 1887, 1912, 1922, 1936, 1941, 1948, and 1952. Indeed, the Cuyahoga fire became a national symbol of in-dustrial indifference to the environment, and the
20
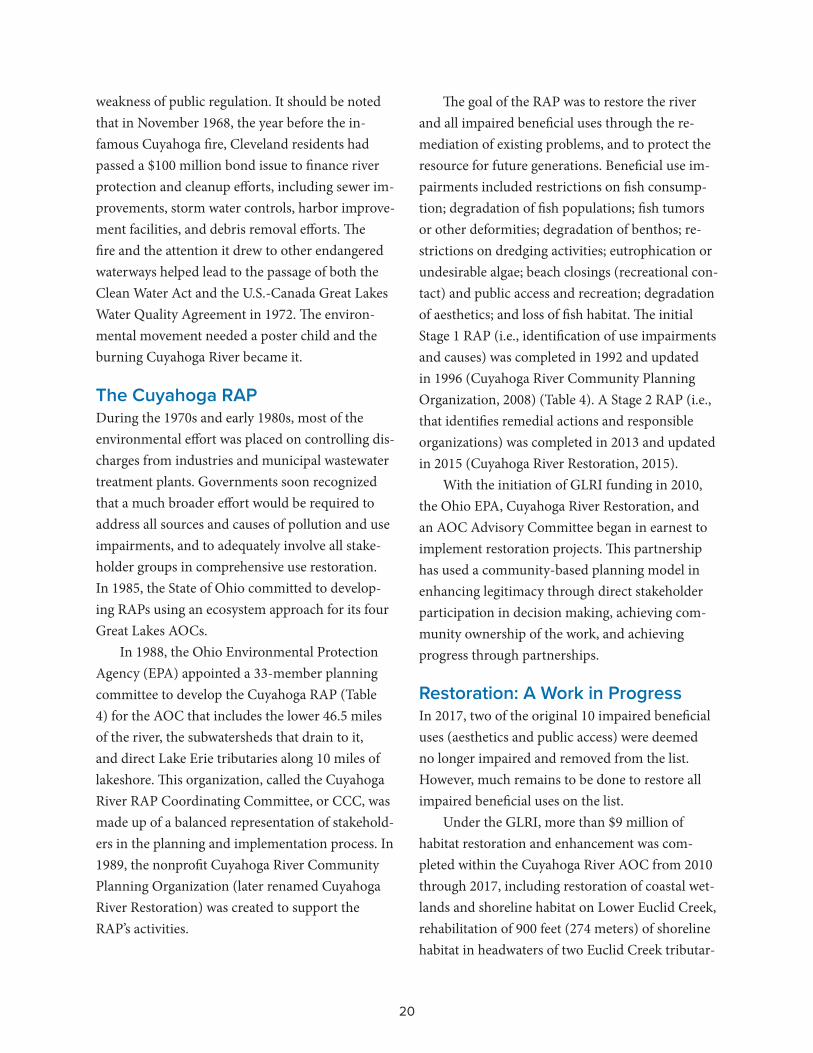
weakness of public regulation. It should be noted that in November 1968, the year before the in-famous Cuyahoga fire, Cleveland residents had passed a $100 million bond issue to finance river protection and cleanup efforts, including sewer im-provements, storm water controls, harbor improve-ment facilities, and debris removal efforts. The fire and the attention it drew to other endangered waterways helped lead to the passage of both the Clean Water Act and the U.S.-Canada Great Lakes Water Quality Agreement in 1972. The environ-mental movement needed a poster child and the burning Cuyahoga River became it.
The Cuyahoga RAPDuring the 1970s and early 1980s, most of the environmental effort was placed on controlling dis-charges from industries and municipal wastewater treatment plants. Governments soon recognized that a much broader effort would be required to address all sources and causes of pollution and use impairments, and to adequately involve all stake-holder groups in comprehensive use restoration. In 1985, the State of Ohio committed to develop-ing RAPs using an ecosystem approach for its four Great Lakes AOCs.
In 1988, the Ohio Environmental Protection Agency (EPA) appointed a 33-member planning committee to develop the Cuyahoga RAP (Table 4) for the AOC that includes the lower 46.5 miles of the river, the subwatersheds that drain to it, and direct Lake Erie tributaries along 10 miles of lakeshore. This organization, called the Cuyahoga River RAP Coordinating Committee, or CCC, was made up of a balanced representation of stakehold-ers in the planning and implementation process. In 1989, the nonprofit Cuyahoga River Community Planning Organization (later renamed Cuyahoga River Restoration) was created to support the RAP’s activities.
The goal of the RAP was to restore the river and all impaired beneficial uses through the re-mediation of existing problems, and to protect the resource for future generations. Beneficial use im-pairments included restrictions on fish consump-tion; degradation of fish populations; fish tumors or other deformities; degradation of benthos; re-strictions on dredging activities; eutrophication or undesirable algae; beach closings (recreational con-tact) and public access and recreation; degradation of aesthetics; and loss of fish habitat. The initial Stage 1 RAP (i.e., identification of use impairments and causes) was completed in 1992 and updated in 1996 (Cuyahoga River Community Planning Organization, 2008) (Table 4). A Stage 2 RAP (i.e., that identifies remedial actions and responsible organizations) was completed in 2013 and updated in 2015 (Cuyahoga River Restoration, 2015).
With the initiation of GLRI funding in 2010, the Ohio EPA, Cuyahoga River Restoration, and an AOC Advisory Committee began in earnest to implement restoration projects. This partnership has used a community-based planning model in enhancing legitimacy through direct stakeholder participation in decision making, achieving com-munity ownership of the work, and achieving progress through partnerships.
Restoration: A Work in ProgressIn 2017, two of the original 10 impaired beneficial uses (aesthetics and public access) were deemed no longer impaired and removed from the list. However, much remains to be done to restore all impaired beneficial uses on the list.
Under the GLRI, more than $9 million of habitat restoration and enhancement was com-pleted within the Cuyahoga River AOC from 2010 through 2017, including restoration of coastal wet-lands and shoreline habitat on Lower Euclid Creek, rehabilitation of 900 feet (274 meters) of shoreline habitat in headwaters of two Euclid Creek tributar-

21
Year Milestone
1985 The International Joint Commission identifies the Cuyahoga River an AOC
1988 Ohio EPA establishes the Cuyahoga River RAP Coordinating Committee to develop the Cuyahoga River RAP
1989 Coordinating Committee establishes Cuyahoga River Community Planning Organization to support RAP activities (later named Cuyahoga River Restoration)
1992 Stage I RAP completed, identifying beneficial use impairments and causes
1996 Stage 1 RAP updated
1998 The Cuyahoga River is recognized as one of 14 American Heritage Rivers
2006Bald eagles establish at least two nesting sites within the AOC, including a new nest along the main stem of the Cuyahoga River between Akron and Cleveland in the Cuyahoga Valley National Park
2008 Ohio EPA releases a revised version of the delisting targets for the Ohio AOCs
2010 U.S. EPA expands the AOC boundary to include the Gorge Dam pool
2013 Stage 2 RAP completed, identifying remedial actions and responsible organizations
2014 Ohio EPA releases a revised version of Delisting Guidance and Restoration Targets for Ohio AOCs
2015 Stage 2 RAP updated, including delisting implementation plan
2017 Two beneficial use impairments removed: degradation of aesthetics and lack of public access
Table 4. A timeline of significant activities related to the restoration of impaired beneficial uses in the Cuyahoga River AOC.
22
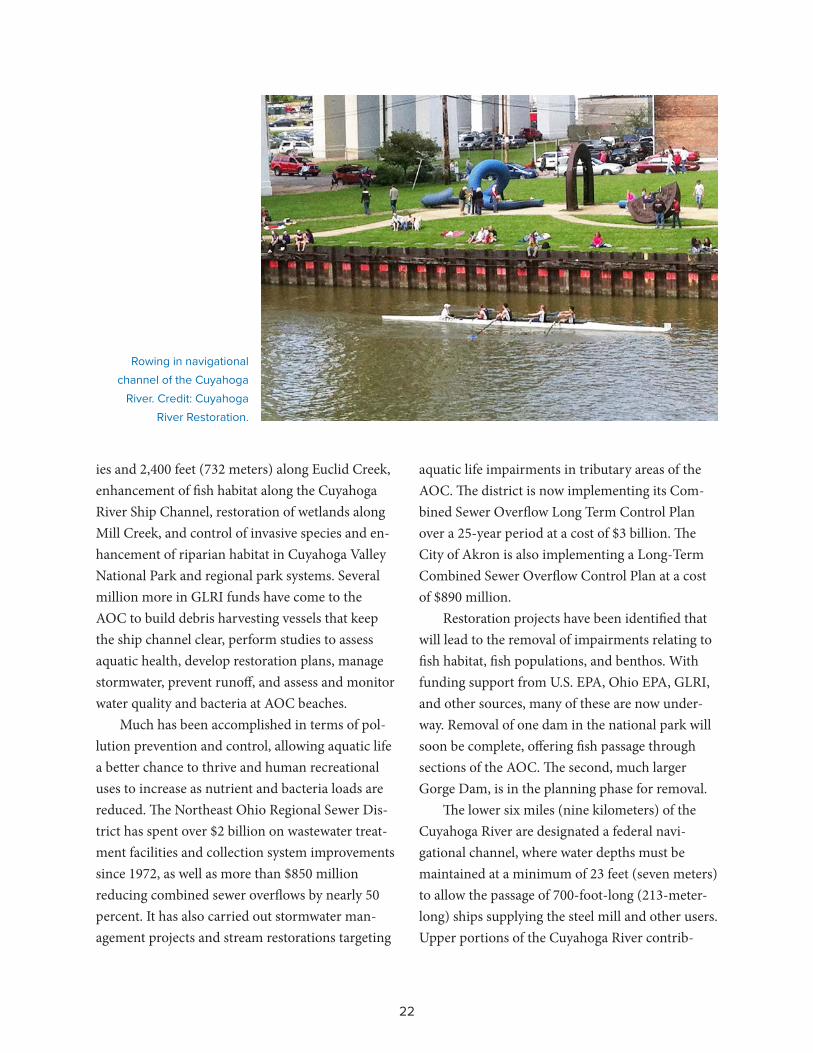
Rowing in navigational channel of the Cuyahoga
River. Credit: Cuyahoga River Restoration.
ies and 2,400 feet (732 meters) along Euclid Creek, enhancement of fish habitat along the Cuyahoga River Ship Channel, restoration of wetlands along Mill Creek, and control of invasive species and en-hancement of riparian habitat in Cuyahoga Valley National Park and regional park systems. Several million more in GLRI funds have come to the AOC to build debris harvesting vessels that keep the ship channel clear, perform studies to assess aquatic health, develop restoration plans, manage stormwater, prevent runoff, and assess and monitor water quality and bacteria at AOC beaches.
Much has been accomplished in terms of pol-lution prevention and control, allowing aquatic life a better chance to thrive and human recreational uses to increase as nutrient and bacteria loads are reduced. The Northeast Ohio Regional Sewer Dis-trict has spent over $2 billion on wastewater treat-ment facilities and collection system improvements since 1972, as well as more than $850 million reducing combined sewer overflows by nearly 50 percent. It has also carried out stormwater man-agement projects and stream restorations targeting
aquatic life impairments in tributary areas of the AOC. The district is now implementing its Com-bined Sewer Overflow Long Term Control Plan over a 25-year period at a cost of $3 billion. The City of Akron is also implementing a Long-Term Combined Sewer Overflow Control Plan at a cost of $890 million.
Restoration projects have been identified that will lead to the removal of impairments relating to fish habitat, fish populations, and benthos. With funding support from U.S. EPA, Ohio EPA, GLRI, and other sources, many of these are now under-way. Removal of one dam in the national park will soon be complete, offering fish passage through sections of the AOC. The second, much larger Gorge Dam, is in the planning phase for removal.
The lower six miles (nine kilometers) of the Cuyahoga River are designated a federal navi-gational channel, where water depths must be maintained at a minimum of 23 feet (seven meters) to allow the passage of 700-foot-long (213-meter-long) ships supplying the steel mill and other users. Upper portions of the Cuyahoga River contrib-

23
Improving fishing access to the Cuyahoga River. Credit: Cuyahoga River Restoration.
ute considerable amounts of sediment into the federal navigational channel, requiring the U.S. Army Corps of Engineers to dredge approximately 225,000 cubic yards (172,025 cubic meters) of this sediment each year. Since 1979 these sediments were deemed contaminated and had to be placed in confined disposal facilities along the Lake Erie shore. In 2009 approximately 300,000 cubic yards (229,366 cubic meters) of dredged sediment was used to remediate a brownfield site to create the Cuyahoga Valley Industrial Center beside the river. In 2011, bedload collectors were installed in the river upstream from the ship channel, captur-ing clean sediment before it reaches the channel and conveying it onshore where it is used in the production of engineered soils. Clean sediment mined from segregated areas of the lakefront disposal facility is also being repurposed on land. New uses and markets for dredged sediment will allow the AOC to remove the impairment related to restrictions on navigational dredging and create new economic opportunities based on the use of the material.
Evidence of the Revival of the Cuyahoga River Fish are one of the best indicators of the Cuyahoga’s recovery. In 1969, when the Cuyahoga River last caught fire, there were few, if any, fish in the lower river. Systematic fish monitoring in the Cuyahoga River by Ohio EPA, both in the natural river and the ship channel, has docu-mented dramatic improvements both in numbers and in species. Today you can find 70 species of fish, including many pollution-sensitive species like smallmouth bass. Pollution-sensitive benthic macroinvertebrates are present in most reaches, and peregrine falcons, bald eagles, and osprey have returned to the banks. Even the industrial Flats now has resident blue and green heron, cormo-rants, and seasonal visits from migrating birds and waterfowl, evidence of increased fish populations. Benthic macroinvertebrate communities now meet Ohio EPA criteria in many stream segments.
Fish have become so abundant, toward the southern, upriver end of the AOC, that park per-sonnel enforce fishing limits on net fishing in order
24
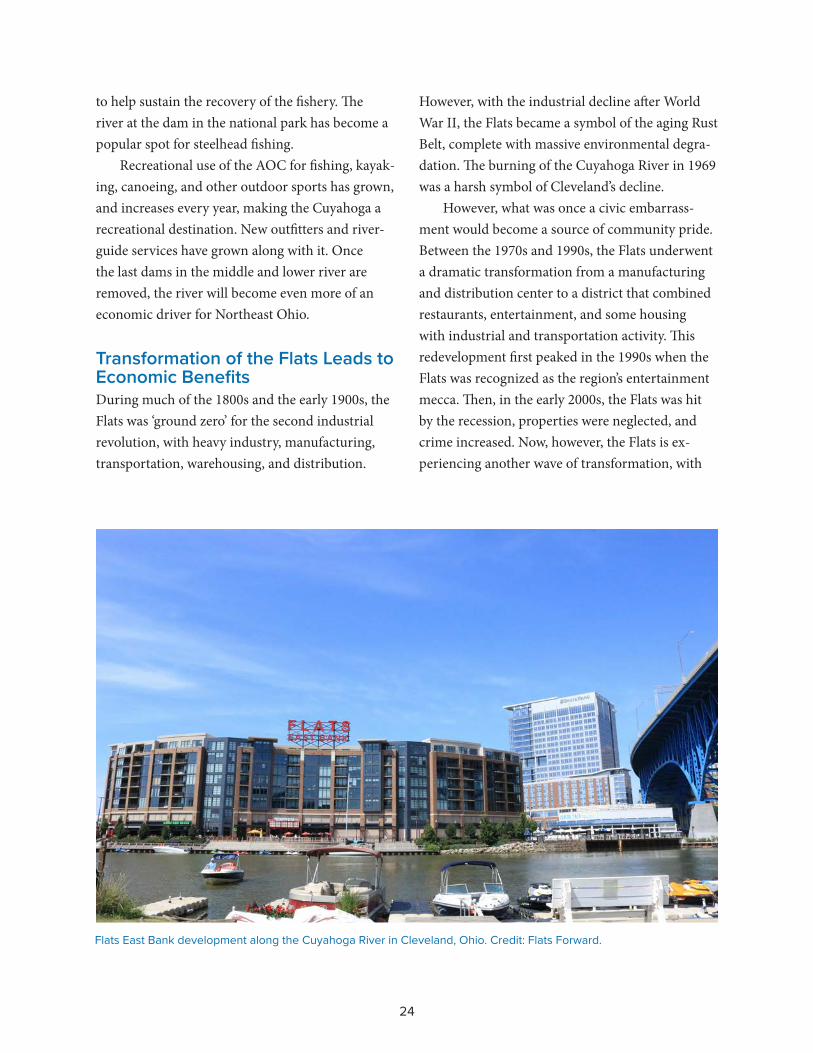
Flats East Bank development along the Cuyahoga River in Cleveland, Ohio. Credit: Flats Forward.
to help sustain the recovery of the fishery. The river at the dam in the national park has become a popular spot for steelhead fishing.
Recreational use of the AOC for fishing, kayak-ing, canoeing, and other outdoor sports has grown, and increases every year, making the Cuyahoga a recreational destination. New outfitters and river-guide services have grown along with it. Once the last dams in the middle and lower river are removed, the river will become even more of an economic driver for Northeast Ohio.
Transformation of the Flats Leads to Economic BenefitsDuring much of the 1800s and the early 1900s, the Flats was ‘ground zero’ for the second industrial revolution, with heavy industry, manufacturing, transportation, warehousing, and distribution.
However, with the industrial decline after World War II, the Flats became a symbol of the aging Rust Belt, complete with massive environmental degra-dation. The burning of the Cuyahoga River in 1969 was a harsh symbol of Cleveland’s decline.
However, what was once a civic embarrass-ment would become a source of community pride. Between the 1970s and 1990s, the Flats underwent a dramatic transformation from a manufacturing and distribution center to a district that combined restaurants, entertainment, and some housing with industrial and transportation activity. This redevelopment first peaked in the 1990s when the Flats was recognized as the region’s entertainment mecca. Then, in the early 2000s, the Flats was hit by the recession, properties were neglected, and crime increased. Now, however, the Flats is ex-periencing another wave of transformation, with

25
Project Name Description Estimated Cost
Canal Basin Park Greenspace $34.65 million
Flat East Bank – Phase 3 Retail/residential $150 million
Irishtown Bend Greenspace $49 million
Metroparks Projects Trails $16.45 million
Northeast Ohio Regional Sewer District Pump Station Infrastructure development $19.8 million
Table 5. Flats development projects planned as of August 2018.
former warehouses turned into housing to meet the high demand for high-quality downtown resi-dences, and massive investments in new eateries and entertainment venues.
Today, the Flats is a unique urban neighbor-hood that is inherently Cleveland, where nature, commerce, and industry live together. Leading the current transformation is Flats Forward, a neigh-borhood organization dedicated to enhancing the quality of life and economic well-being of all Flats stakeholders. Established in 2012, Flats Forward builds upon earlier community and economic development efforts, advocates for residents and businesses, and fosters strong neighborhood con-nections. The organization has documented that Cleveland’s Flats has experienced $750 million in economic development since 2012, including Flats East Bank, The Foundry, Settler’s Point, Scranton Flats Towpath Trail, and Cleveland Foundation Centennial Trail. In addition, $270 million of new Flats development projects are in the planning phase (Table 5).
The economic benefits of a revitalized neigh-borhood along the banks of a restored river can be seen in the people who want to live, work, and play
in the Flats. Flats visitation in 2016 was approxi-mately 577,000. In addition to the music venues and entertainment options, both banks of the Flats now host unique festivals year-round. Take-a-Hike walking tours afford visitors the opportunity to learn about the area’s history. Other unique attrac-tions include a 5,000-seat amphitheater called Ja-cobs Pavilion at Nautica, a repurposed power plant that houses the Greater Cleveland Aquarium and a party and conference center, the Nautica Queen cruise ship, the landing for Cleveland Metroparks’ new Water Taxi, and a watersports rental facility (Flats Forward, 2018). Across the river, the Flats East Bank Boardwalk offers pedestrians sweeping views of the Cuyahoga River and Cleveland’s iconic bridges and provides dock space for transient boats.
Farther up the channel, Columbus Peninsula has become the outdoor recreational hub of the Flats, home to the Cleveland Rowing Foundation and The Foundry, which offers competitive rowing. This is also where the foundation’s annual Head of the Cuyahoga Regatta attracts rowing teams from across the country to compete each fall. The Columbus Bridge area on the peninsula features

26
Having dinner at Flats East Bank while watching the fire boat. Credit: Cuyahoga River Restoration.
Cleveland Metroparks’ Rivergate Park and Merwin’s Wharf restaurant, Hart Crane Park, Crooked River Skate Park, and the Ohio City Bicycle Coop.
Around the bend on the next peninsula, new mixed-use development is planned. A network of trails connects it all, taking people to and through pocket parks and greenspaces. Eventually, trails will connect to the lakefront at Wendy Park.
“Without the cleanup of the Cuyahoga River, the revitalization of the Flats would not have been conceivable,” notes Melinda Gigante, Director of
Flats Forward. “The revival of the Cuyahoga River has been a major catalyst for this revitalization.”
This is seen from the headwaters, down the Class V whitewater to the AOC at the Gorge in Ak-ron and Cuyahoga Falls, through the Summit Metro Parks, Cuyahoga Valley National Park, and Cleve-land Metroparks reservations, and along the Ohio and Erie Canal Towpath Trail and the Cuyahoga Valley Scenic Railroad: all waters that lead to Cleve-land and Lake Erie.

27
Detroit RiverWalk. Credit: Detroit Riverfront Conservancy.
JOHN HARTIG, Visiting Scholar, Great Lakes Institute for Environmental Research, University of Windsor
From Cleanup of the Detroit River to Revitalization of the Waterfront
CHAPTER 5
In the midst of Detroit’s growing population and industrial expansion during the early to mid-1900s, people clearly viewed the Detroit River as a working river that
supported commerce and technological progress. As a result, the Detroit River became one of the most polluted rivers in the United States.
All monetary amounts in this chapter are in U.S. dollars.

28
Water pollution of the Detroit River in 1966. Credit: Michigan Department of Natural Resources.
This pollution peaked in the 1960s: oil pol-lution caused winter waterfowl kills; phosphorus pollution caused accelerated eutrophication; municipalities and industries caused violations of water quality standards; toxic substances’ contami-nation caused both fish consumption advisories and reproductive impairment in wildlife; and land use practices destroyed wetlands.
Like many other large North American cities, the Motor City made the Detroit River its back door, with businesses facing inland and away from the river. Indifference compounded the problem, as Detroit perceived water pollution as just part of the cost of doing business. As a result, Detroit residents lost connection to their river.
Detroit River Cleanup and RevivalThe Detroit River flows approximately 32 miles (51.5 kilometers) from Lake St. Clair to Lake Erie, forming the international border between Canada and the United States. As far back as the 1970s, the International Joint Commission identified the river as a “problem area” and later designated it as one of 43 Great Lakes AOCs. Decades of pollution prevention and control, as well as cleanup, have re-sulted in substantial environmental improvements (Table 6).
Environmental Improvements
More than 97% reduction in oil releases
More than 98% decrease in phosphorus discharges
4,600 tons/day decrease in chloride discharges
Substantial improvement in municipal wastewater treatment by upgrading all plants from primary treatment to secondary treatment with phosphorus removal
95% reduction in untreated waste from combined sewer overflow discharges (i.e., in sewerage systems that carry both sanitary sewage and storm water runoff, the portion of the flow that goes untreated into rivers or lakes because of wastewater treatment plant overloading during storms)
85% reduction in mercury in fish
91% decline in PCBs, a 92% decline in DDE, and a 94% decline in TCDD in herring gull eggs from Fighting Island
Remediation of 1 million cubic yards of contaminated sediment at a cost of more than $154 million
Table 6. Summary of Detroit River environmental improvements. (Khan et al., 2017; Coffey et al., 2017; Hartig et al., 2009).
The Detroit River RAP, started in 1985, has played an important role in sustaining and furthering the restoration of impaired beneficial uses (Michigan Department of Natural Resources and Ontario Ministry of the Environment, 1991). Supporting this cleanup effort, the Great Lakes Legacy Act helped fund remediation of contaminated sediment in the Black Lagoon ($9.3 million). In addition, the GLRI helped construct three fish spawning reefs ($3.75 million), restore

29
Material storage piles, dilapidated and abandoned buildings,
cement silos, and underused surface
parking lots dominated the Detroit riverfront
east of the Renaissance Center as recently
as the early 2000s. Credit: Detroit Riverfront
Conservancy.
bottomland habitat off Belle Isle’s South Fishing Pier ($500,000), restore riparian habitat at U.S. Steel ($670,000), restore Blue Heron Lagoon on Belle Isle ($1.43 million), achieve brownfield cleanup and habitat restoration at the Refuge Gateway in Trenton ($500,000), and restore habitat around Celeron ($8.61 million) and Stony ($7.65 million) islands.
This cleanup of the Detroit River has resulted in one of the most remarkable ecological recovery stories in North America. In the late 1960s, when the Detroit River was one of the most polluted rivers in North America, no bald eagles, peregrine falcons, or osprey were reproducing in the Detroit River watershed, nor lake sturgeon or lake whitefish in the river. Beavers had disappeared, as had the common terns from the 980-acre island park called Belle Isle. The Great Lakes Fishery Commission considered walleye to be in a state of crisis. Today, bald eagles, peregrine falcons, osprey, lake sturgeon, and lake whitefish are reproducing again, beavers have returned, common terns are back on Belle Isle, and the Detroit River is now considered part of the “Walleye Capital of the World” (Hartig, 2014).
This ecological recovery is remarkable, but restoration is not complete. Monitoring has documented the following environmental and natural resource challenges: population growth, transportation expansion, and land use changes; nonpoint source pollution; toxic substances contamination; habitat loss and degradation; introduction of exotic species; and climate change (Hartig et al., 2009).
Waterfront RevitalizationAs recently as the early 2000s, abandoned buildings, underused street parking lots, material storage piles, and cement silos dominated a considerable portion of Detroit’s waterfront between the MacArthur Bridge to Belle Isle and the Ambassador Bridge to Canada, prohibiting access to the Detroit River (Hartig and Wallace, 2015). For more than 100 years, city planners identified the highest and best use of this land to be “industrial” because of obvious revenue returns. Detroit was an industrial town with a working riverfront that supported industry and commerce. Over time, however, Detroit lost people and industries, and had much underused and undervalued riverfront land. Detroiters had long lost their connection to the Detroit River. They wanted to improve public access to it and redevelop it in a fashion that would improve quality of life, catalyze economic development, and help change the perception of Detroit from that of a Rust Belt city to one that is actively engaged in sustainable redevelopment (Hartig and Wallace, 2015).
Out of this growing public interest to reconnect to the Detroit River, the ecological recovery, and strong public and private support to revitalize Detroit, the Detroit Riverfront Conservancy was created in 2003 to transform Detroit’s

30
The Detroit RiverWalk has become a destination of choice for nearly 3 million annual visitors (left). Credit: Detroit Riverfront Conservancy. Cycling on the Detroit RiverWalk (right). Credit: Detroit Greenways Coalition.
international riverfront—the face of the city—into a beautiful, exciting, safe, accessible world-class gathering place for all (Hartig and Wallace, 2015). In 2016, the Detroit Riverfront Conservancy celebrated the completion of the first phase of its capital campaign, raising $163 million to build 3.5 miles (5.6 kilometers) of the Detroit RiverWalk. Nearly 3 million annual visitors are already using it. The next phase will be to complete the former Uniroyal portion of the Detroit RiverWalk, the nearly 2-mile (3 kilometers) west riverfront, and other strategic connections to neighborhoods, and to ensure long-term operation, maintenance, and stewardship.
Economic BenefitsIn 2013, the Detroit Riverfront Conservancy de-cided to assess the impact of extensive riverfront improvements made since 2003. The organization hired CSL International to undertake an economic impact study, which noted not only significant economic impact associated with riverfront invest-ment, but also the “transformation of a blighted area into a vibrant community asset.”
The study reported that as of 2012 the east portion of the Detroit RiverWalk, which stretches more than 3.5 miles (5.6 kilometers), was 80 per-cent complete. CSL International (2013) docu-mented that nearly 3 million annual visitors enjoy the Detroit RiverWalk and its associated green infrastructure. In 2012, the riverfront hosted more than 100 events, ranging from small weekly gather-ings to large annual events like the River Days Festival.
This stretch of the Detroit RiverWalk cost $80 million to construct, and the conservancy created a $60 million endowment for long-term operation and maintenance (CSL International, 2013). This investment catalyzed an additional $1.55 billion in total public and private sector investment (includ-ing the value of contributed land), of which ap-proximately $639 million can be directly linked to riverfront improvements (Table 7). In addition, the study estimated potential future investment valued at $700-950 million (CSL International, 2013).
CSL International (2013) concluded its eco-nomic impact study stating that this segment of the Detroit RiverWalk had spurred approximately

31
Impacts
CONSTRUCTION IMPACTS
Riverfront construction and land value $1.548 billion
Portion attributable to riverfront $639 million
Construction-period jobs 16,700
ANNUAL IMPACTS
Total annual spending $43.7 million
Combined annual spending: 2003-2013 $360.6 million
Annual value of positive media exposure $600,000
Annual jobs 1,300
Total annual tax revenue generation $4.5 million
Table 7. Summary of Detroit riverfront economic impacts in the first 10 years. CSL International, 2013.
$1 billion in total public and private sector invest-ment, with more than $1 billion expected over the next decade. The study estimated total spending by visitors, residents, employees, and other operations along the Detroit RiverWalk at $43.7 million an-nually. Detroit riverfront improvements supported 16,700 construction jobs and provided 1,300 on-going, annual jobs. Of the 3 million annual visitors, 90 percent of their visits would not have taken place without the significant riverfront improve-ments. Clearly, these data show a substantial return on investment in building the Detroit RiverWalk, with more economic benefits yet to come.
“Without this early focus on cleaning up the river and improving water quality, this transfor-
mation of the river’s edge would not have been possible,“ notes Mark Wallace, president and chief executive officer of the Detroit Riverfront Conser-vancy.
The revitalized riverfront is now a community asset that draws people to connect with their river once again. People consider the vibrant riverfront a “game changer” in improving the perception of Detroit, according to the CSL study. “The river-front has evolved beyond a physical asset, and is now both a community in itself, and an asset to the entire downtown area.”


33
Marina, parks, greenway trails, and other amenities created on Hamilton’s Western Waterfront. Credit: City of Hamilton.
Economic Benefits of Remediating Contaminated Sediments at Hamilton Harbour’s Randle Reef
KRISTIN O’CONNOR, Coordinator, Hamilton Harbour Remedial Action Plan, and CHRIS MCLAUGHLIN, Executive
Director, Bay Area Restoration Council
CHAPTER 6
Hamilton Harbour is a 5,313-acre (2,150-hectare) embayment located at the western end of Lake Ontario, connected to the lake by a single ship canal
across the barrier sandbar that forms the bay. Hamilton, Ontario, has over a 100-year history of heavy industrial and urban development. In the middle of the 19th century, the Great Western Railway was founded in the city, making Hamilton the center of Canadian industry. This long industrial history resulted in substantial environmental degradation of surrounding ecosystems.
All monetary amounts in this chapter are in Canadian dollars.
34
Prior to modern environmental laws, indus-tries dumped waste into the harbor. This waste continues to threaten public health, contaminate fish and wildlife, and restrict the use of the water-front. Over the past century, contaminants such as metals, polycylic aromatic hydrocarbons (PAHs), polychlorinated biphenyls (PCBs), and other hazardous chemicals have been released into the harbor, leading to extensive sediment contamina-tion.
Damage done to Hamilton Harbour through industrial development and population growth has resulted in it being designated a Great Lakes AOC with impaired beneficial uses. These impaired ben-eficial uses include restrictions on fish consump-tion; degradation of fish populations; degradation of wildlife populations; degradation of benthos; eutrophication or undesirable algae; beach closings and water contact sports; degradation of aesthetics; and loss of fish and wildlife habitat (Table 8).
Hamilton Harbour RAPIn 1985, local stakeholders working with the federal and provincial governments committed to developing a RAP to restore all beneficial use impairments using an ecosystem approach. A Stage 1 RAP, completed in 1989, described conditions and impaired beneficial uses. A Stage 2 RAP, com-pleted in 1992, identified actions needed to restore impaired beneficial uses (HHRAP, 1989; 1992). In the Stage 2 RAP, the stakeholder group made 50 recommendations to encourage partnerships and guide cleanup efforts. The stakeholder group was formalized as the Hamilton Harbour Stakeholder Forum in 1998. A revised Stage 2 RAP was released in 2003 and included 57 recommendations and 159 tasks (HHRAP, 2003).
Considerable progress has been made in implementing the RAP and restoring impaired beneficial uses (Table 8). For example, prior to 1990, industry and government spent $600 mil-
lion on RAP actions (HHRAP, 2014). Between 1990 and 2010, a total of $610 million was spent on remedial actions, including a 77 percent invest-ment by local government and private sources, an 11 percent investment by provincial government, and an 11 percent investment by federal govern-ment (HHRAP, 2014). In addition, between 2006 and 2017 another $622 million was committed and work has begun on three major projects: Randle Reef sediment remediation ($139 million); Skyway Wastewater Treatment Plant ($153 million); and Woodward Wastewater Treatment Plant ($330 mil-lion).
Those involved predict that by the time Hamilton Harbour is ready for delisting, nearly $2 billion will have been invested in controlling contaminants at their source; upgrading wastewa-ter treatment plants; controlling combined sewer overflows; managing urban stormwater; assessing and remediating contaminated sediment; restoring fish and wildlife habitat; restoring and protecting wetlands; and more.
Randle Reef Contaminated Sediment RemediationFor more than 100 years, Hamilton has been the “steel capital” of Canada. This industrial legacy has resulted in considerable contaminated sediment, the most significant being near Randle Reef. The Randle Reef contamination site is approximately 148 acres (60 hectares) in size and contains ap-proximately 2.45 million cubic feet (695,000 cubic meters) of contaminated sediment at the bottom of the harbor, a volume that would fill a major hockey arena three times over (www.randlereef.ca).
Randle Reef is the largest contaminated sedi-ment remediation project in the Canadian Great Lakes. It is projected to cost $139 million and will be completed in 2022. The Government of Canada and the Province of Ontario have each committed $46.3 million, with the final third coming from

35
Impaired Beneficial Use Status (2018)
Fish consumption advisories
Still impaired; health advisories still in effect, mainly due to PCBs; priority is being placed on control of contaminants at source
Degradation of fish populations
Still impaired; Index of biotic integrity (IBI) values have increased from 24 in 1990 to 36 in 2016; delisting target: 55-60; ongoing efforts to reintroduce walleye as a native, top predator
Degradation of wildlife populations - colonial waterbirds
Targets generally being met for black-crowned night herons, Caspian terns, common terns, and herring gulls; continued management needed to maintain reductions in double-crested cormorants and ring-billed gulls; redesignation to be pursued
Degradation of benthos
Still impaired; priority is being placed on control of contaminants at source; Randle Reef Contaminated Sediment Remediation Project underway
Eutrophication or undesirable algae
Still impaired; 50% reduction in phosphorus loading since 1980s; two large wastewater treatment plants upgrading to tertiary treatment by 2022
Beach closings and water contact sports
Still impaired; significant challenges with the two man-made beaches due to E. coli and toxins from cyanobacteria may necessitate changes to delisting targets
Degradation of aesthetics
Status under evaluation in 2018
Loss of fish and wildlife habitat
Still impaired; improvements have been made in aquatic vegetation, littoral edge, and wildlife habitat; more is needed in our coastal wetland, Cootes Paradise
Table 8. Summary of the status of beneficial use impairments in Hamilton Harbour.
the City of Hamilton, City of Burlington, Regional Municipality of Halton, Hamilton Port Authority, and Stelco (formerly U.S. Steel Canada).
This project is located along the south shore of Hamilton Harbour in the vicinity of Piers 14, 15, and 16. It involves constructing an engineered con-tainment facility. This specially designed, double, steel-walled and sealed “box” is approximately 15.3 acres (6.2 hectares) in size and is being constructed to contain the most heavily contaminated sediment.
The project, led by Environment and Climate Change Canada, has three stages. The first stage
involves reconstructing an adjacent harbor pier wall and constructing the facility. This stage began in 2015 with the pier wall reconstruction, which will allow for sediment to be dredged from this area in the second stage of the project. The in-water construction of the facility began in 2016 and was effectively completed in 2017.
The second stage involves dredging contami-nated sediment from the surrounding areas and placing it in the facility via an underwater pipeline. This stage began in 2018 and is expected to be com-pleted by the end of 2019.

36
Construction of an engineered containment facility for contaminated sediment in Randle Reef, Hamilton Harbour. Credit: Hyperactive Productions.
The third stage involves removing the water from the engineered containment facility, com-pacting the contained sediment, and then con-structing an impermeable cap on the facility. This stage is expected to begin in 2020 and be com-pleted in 2022.
Real-time environmental monitoring systems are being used to measure air and water quality in the construction area throughout these stages. Air and water quality criteria have been established to ensure that human health and the environment are protected.
The Randle Reef Contaminated Sediment Re-mediation Project will improve water quality and reduce contamination in Hamilton Harbour, which will benefit fish, wildlife, and people.
Economic Benefits The Randle Reef Contaminated Sediment Remedi-ation Project is considered a pivotal effort that will
spur other projects necessary to restore impaired beneficial uses and eventually delist Hamilton Har-bour as an AOC. As contamination is reduced and the stigma of a contaminated harbor is removed, business development may be accelerated with more companies willing to set up in the Hamil-ton area. The project is also expected to generate economic returns through the creation of valuable port lands for the Hamilton Port Authority, allow-ing them to expand port operations. New public spaces and amenities along with new residential and commercial waterfront development in the Piers 5–8 area shown in the photo above are also expected to encourage more tourism in the area.
To help make the case for this project and other remedial actions, Environment and Climate Change Canada retained the Institute for Research and Innovation in Sustainability and Schulich School of Business at York University (York, 2006) to assess potential benefits. Benefits and beneficia-

37
Conceptual rendering of Hamilton’s Western Waterfront redevelopment. Credit: City of Hamilton.
ries were identified and systematically organized in a comprehensive framework to identify who will benefit from remediation and in what ways, with a particular emphasis on the Randle Reef Contami-nated Sediment Remediation Project.
The accumulated gross benefits realized by dif-ferent beneficiaries are substantial. Completion of the Randle Reef Contaminated Sediment Reme-diation Project is projected to realize estimated economic benefits (by 2032) of $96 million to local property owners, $38 million to local businesses, and $29 million to municipal governments (York, 2006; Table 9). Completion of all sediment reme-diation, wastewater treatment, and habitat projects for Hamilton Harbour is projected to generate esti-mated economic benefits (by 2032) of $592 million to local businesses, $496 million to recreational users, and $338 million to the federal government (York, 2006; Table 9).
However, the authors (York, 2006) note that the gross benefits presented in Table 9 are not addi-tive and their study was not designed to produce benefit estimates for a conventional social cost-benefit analysis. If one assumes that the scope or
jurisdiction of interest for such a cost-benefit anal-ysis is the local area and a number of key assump-tions are made concerning the benefits flowing to each beneficiary, an approximate benefit total suit-able for cost-benefit analysis can be derived. The result is a cumulative total benefit for the local area of $126 million (by 2032) with the implementation of the Randle Reef project alone and $914 million with full implementation of all remedial projects (York, 2006).
In summary, the Randle Reef Contaminated Sediment Remediation Project is removing and containing the most significant legacy contamina-tion in Hamilton Harbour. This will reduce eco-logical and human exposure to the contaminants and provide improvements for the fish and aquatic habitat in the harbor as a result of this cleanup. A collaborative approach to funding among the Gov-ernment of Canada, Province of Ontario, City of Hamilton, City of Burlington, Regional Municipal-ity of Halton, Hamilton Port Authority, and Stelco was essential to the success of the $139 million project. The final uses of the facility are projected to provide $245 million in economic benefits and

38
Beneficiary Randle Reef Project
All Sediment Remediation, Wastewater Treatment, and Habitat Projects
Federal Government $21 million $338 million
Provincial Government $19 million $297 million
Municipal Governments $29 million $60 million
Hamilton Port Authority $11 million $11 million
Stelco $15 million $15 million
Dofasco $0 $0.1 million
Local Businesses $38 million $592 million
Under-employed people $13 million $206 million
Recreational users $3 million $496 million
Local property owners $96 million $124 million
Table 9. Total estimated benefits by beneficiary for the Randle Reef project and all other remedial projects for Hamilton Harbour (York, 2006).
many social benefits to stakeholders. The project will also provide for short-term employment op-portunities in the local area during the construc-tion and long-term operation of the facility. The cleanup of Hamilton Harbour is an integral and
essential part of the region’s revitalization strategy. The vision is for Hamilton Harbour to be a vibrant centerpiece in the community by improving the potential for recreational uses, while maintaining its essential economic function.

39
Muskegon Lake. Credit: GEI Consultants of Michigan.
From Lumber to Foundries to Revitalization The Muskegon Lake Story
KATHY EVANS, West Michigan Shoreline Regional Development Commission, and PAUL ISELY and AL STEINMAN, Grand Valley State University
CHAPTER 7
The name Muskegon derives from the Ottawa Indian word masguigon, meaning marshy river or swamp. This Michigan city is located along the eastern shore-
line of Lake Michigan in Muskegon County. At its northern edge lies Muskegon Lake, a 4,150-acre (1,679-hectare) inland coastal lake. The Muskegon River, the state’s second longest, originates at Houghton Lake, and flows southwest 227 miles (365 kilometers) into Muskegon Lake before flowing into Lake Michigan.
All monetary amounts in this chapter are in U.S. dollars.
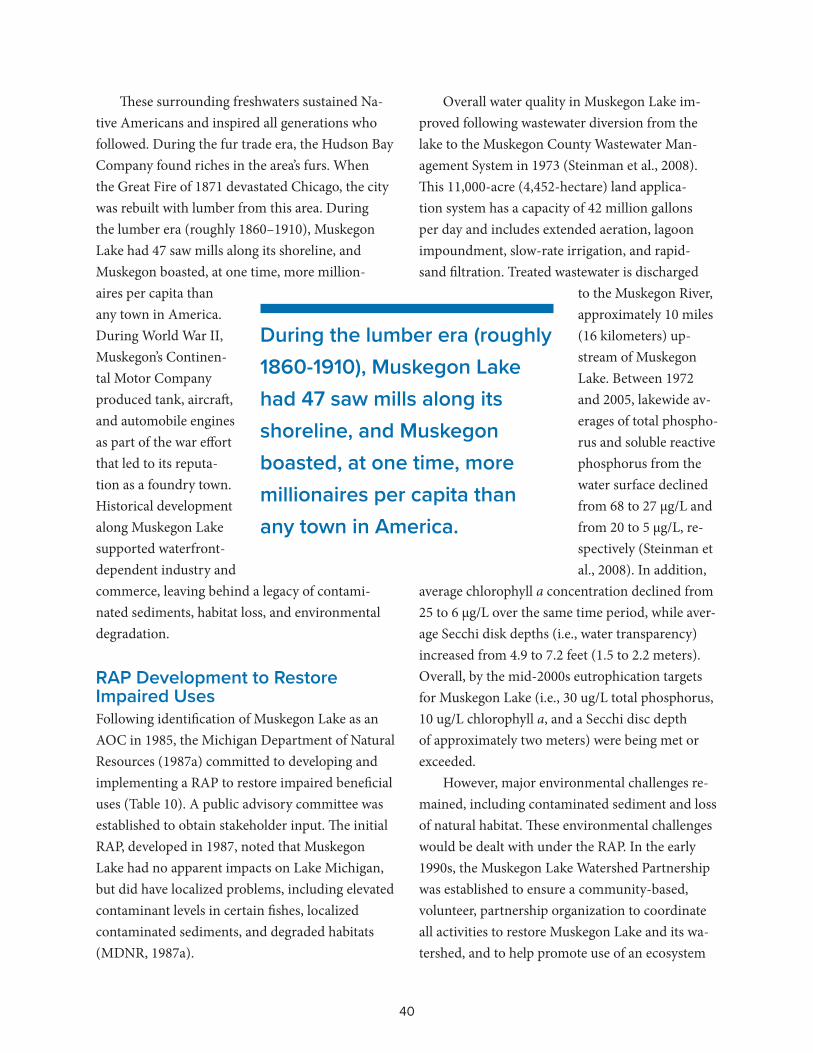
40
These surrounding freshwaters sustained Na-tive Americans and inspired all generations who followed. During the fur trade era, the Hudson Bay Company found riches in the area’s furs. When the Great Fire of 1871 devastated Chicago, the city was rebuilt with lumber from this area. During the lumber era (roughly 1860–1910), Muskegon Lake had 47 saw mills along its shoreline, and Muskegon boasted, at one time, more million-aires per capita than any town in America. During World War II, Muskegon’s Continen-tal Motor Company produced tank, aircraft, and automobile engines as part of the war effort that led to its reputa-tion as a foundry town. Historical development along Muskegon Lake supported waterfront-dependent industry and commerce, leaving behind a legacy of contami-nated sediments, habitat loss, and environmental degradation.
RAP Development to Restore Impaired UsesFollowing identification of Muskegon Lake as an AOC in 1985, the Michigan Department of Natural Resources (1987a) committed to developing and implementing a RAP to restore impaired beneficial uses (Table 10). A public advisory committee was established to obtain stakeholder input. The initial RAP, developed in 1987, noted that Muskegon Lake had no apparent impacts on Lake Michigan, but did have localized problems, including elevated contaminant levels in certain fishes, localized contaminated sediments, and degraded habitats (MDNR, 1987a).
Overall water quality in Muskegon Lake im-proved following wastewater diversion from the lake to the Muskegon County Wastewater Man-agement System in 1973 (Steinman et al., 2008). This 11,000-acre (4,452-hectare) land applica-tion system has a capacity of 42 million gallons per day and includes extended aeration, lagoon impoundment, slow-rate irrigation, and rapid-sand filtration. Treated wastewater is discharged
to the Muskegon River, approximately 10 miles (16 kilometers) up-stream of Muskegon Lake. Between 1972 and 2005, lakewide av-erages of total phospho-rus and soluble reactive phosphorus from the water surface declined from 68 to 27 µg/L and from 20 to 5 µg/L, re-spectively (Steinman et al., 2008). In addition,
average chlorophyll a concentration declined from 25 to 6 µg/L over the same time period, while aver-age Secchi disk depths (i.e., water transparency) increased from 4.9 to 7.2 feet (1.5 to 2.2 meters). Overall, by the mid-2000s eutrophication targets for Muskegon Lake (i.e., 30 ug/L total phosphorus, 10 ug/L chlorophyll a, and a Secchi disc depth of approximately two meters) were being met or exceeded.
However, major environmental challenges re-mained, including contaminated sediment and loss of natural habitat. These environmental challenges would be dealt with under the RAP. In the early 1990s, the Muskegon Lake Watershed Partnership was established to ensure a community-based, volunteer, partnership organization to coordinate all activities to restore Muskegon Lake and its wa-tershed, and to help promote use of an ecosystem
During the lumber era (roughly 1860-1910), Muskegon Lake had 47 saw mills along its shoreline, and Muskegon boasted, at one time, more millionaires per capita than any town in America.

41
Date Accomplishment
1985 Muskegon Lake designated an AOC and Michigan Department of Natural Resources commits to developing and implementing a RAP; Muskegon Lake Public Advisory Committee established to obtain stakeholder input
1987 Stage 1 RAP completed
Early 1990s
Muskegon Lake Watershed Partnership established
1994 RAP update published
2002 RAP update published
2004 Sediment survey of Muskegon Lake tributaries completed; Muskegon Lake Watershed Partnership engages stakeholders in identifying potential restoration projects
2006 Ruddiman Creek sediment remediation completed under Great Lakes Legacy Act
2008 Michigan Department of Environmental Quality issues guidance for delisting Michigan AOCs; Habitat Committee of Muskegon Lake Watershed Partnership issues plan to accelerate removal of beneficial use impairments and restore habitat
2010 Michigan Department of Environmental Quality issues revised guidance for delisting Michigan AOCs
2011 Michigan Department of Environmental Quality completes Stage 2 RAP; U.S. Army Corps of Engineers dredges navigational channel of Muskegon Lake; “restrictions on dredging” removed as a beneficial use impairment
2012 Division Street Outfall sediment remediation completed under Great Lakes Legacy Act
2013 “Restrictions on fish and wildlife consumption” and “restrictions on drinking water consumption” removed as beneficial use impairments
2015 “Beach closings” removed as a beneficial use impairment
2019* Zephyr Refinery sediment remediation completed; all management actions identified in the RAP for use restoration completed
2020* Completion of all identified management actions required for restoring impaired beneficial uses
Table 10. A timeline of significant activities related to the restoration of impaired beneficial uses in the Muskegon Lake AOC.
* Anticipated
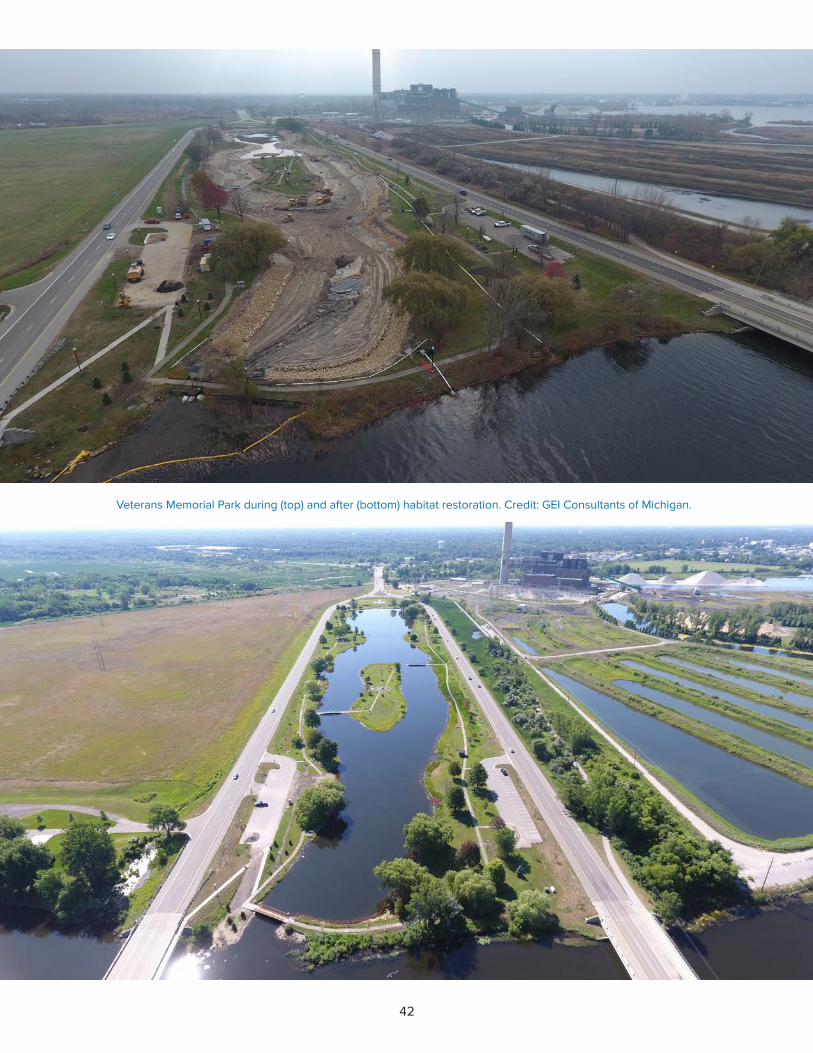
42
Veterans Memorial Park during (top) and after (bottom) habitat restoration. Credit: GEI Consultants of Michigan.

43
North Muskegon High School students assisting with fish relocation for the
Bear Creek wetland restoration. Credit: GEI Consultants of Michigan.
approach and build capacity (Table 10). The RAP was updated in 1994 and 2002, and a Stage 2 RAP, identifying necessary remedial and preventive actions, was completed in 2011 (Michigan Depart-ment of Environmental Quality, 2011).
The first beneficial use impairment (i.e., “re-strictions on dredging activities”) was removed in 2011. “Restrictions on fish and wildlife consump-tion” and “restrictions on drinking water consump-tion” were removed as beneficial use impairments in 2013 and “beach closings” was removed as a beneficial use impairment in 2015. All manage-ment actions identified to restore impaired ben-eficial uses in the RAP are projected to be imple-mented by 2020, with a goal of delisting as an AOC when monitoring data confirm use restoration.
Contaminated Sediment RemediationContaminated sediment was a long-standing issue in the Muskegon Lake AOC because of historical industrial activities. Through the RAP, and with critical financial support from the Great Lakes Legacy Act (started in 2002) and the GLRI (started in 2010), substantial contaminated sediment reme-
diation has been completed or is underway in the AOC, including remediation of 89,869 cubic yards (68,710 cubic meters) of contaminated sediment in Ruddiman Creek in 2006 ($14.2 million), remedia-tion of 43,463 cubic yards (33,230 cubic meters) of contaminated sediment at the Division Street Outfall in 2012 ($10.8 million), and remediation of 44,000 cubic yards (33,640 cubic meters) of contaminated sediment and soil in the vicinity of the Zephyr Oil Refinery that is underway now and projected to be completed in 2019 ($17 million). In addition, all investigative work has been completed for contaminated sediment remediation in Ryer-son Creek and a Great Lakes Legacy Act project application is being developed to secure necessary funding for cleanup.
Habitat Restoration and ConservationThrough the RAP, and with critical financial sup-port from the GLRI and the Great Lakes Legacy Act, substantial habitat restoration and conserva-tion work has been completed or is underway in the AOC. Table 11 highlights four major projects, totaling $22 million.

44
Project Name Description Cost Date Completed
Bosma and Willbrandt land acquisitions
Acquisition of 95 acres (38.4 hectares) of two former celery farms for restoring wetlands and connectivity to Bear Creek, Muskegon Lake, and Muskegon River
Bosma - $198,000;
Willbrandt - $303,000
2018 Willbrandt/Bear Creek; 2019
Bosma/Lower Muskegon River
Lumber mill debris removal and aquatic habitat restoration
Removal of 122,673 tons of historical lumber mill debris and restoration of 11.4 acres (4.6 hectares) of open water and emergent wetland habitats
$2.8 million 2017
Veterans Memorial Park fish and wildlife habitat restoration
Reestablish hydrological connection to Muskegon River and restore open water (5.3 acres or 2.1 hectares), shoreline (2,257 feet or 78 meters), riparian (6.8 acres or 2.8 hectares), and wetland (3.3 acres or 1.5 hectares) habitats
$2.6 million 2017
Bear Creek fish and wildlife habitat restoration
Restore 36 acres (14.6 hectares) of wetlands, remove approximately 182,735 tons of phosphorus-rich sediment from wetlands, restore 2,015 feet (614 meters) of stream bank, improve water quality, and restore connectivity with Bear Lake
$7.9 million 2018
Lower Muskegon River fish and wildlife habitat restoration
Restore 53 acres (21.4 hectares) of wetlands, remove unnatural fill, soften 2,739 feet (835 meters) of shoreline, and restore connectivity with Muskegon River
$7.9 million 2019
Table 11. Major habitat restoration projects completed with GLRI, Great Lakes Legacy Act, and American Recovery and Reinvestment Act funding in support of delisting Muskegon Lake as an AOC.
Economic Benefits In 2009, the Great Lakes Commission and the West Michigan Shoreline Regional Development Commission were awarded $10 million from the American Recovery and Reinvestment Act to re-move 24.7 acres (10 hectares) of historical, unnatu-ral fill, restore 27 acres (11 hectares) of wetlands, and soften 1.9 miles (3 kilometers) of shoreline along the south shore of Muskegon Lake. As part of this restoration effort, economic benefits were
measured via hedonic property values and a travel cost survey for lake-based recreation (Isely et al., 2018).
This socioeconomic study measured the eco-nomic value before, during, and after restoration. The hypothesis was that habitat restoration would increase the economic value of ecosystem services associated with restored wetlands (Steinman et al., 2017), which local governmental and economic development authorities could then use to pro-

45
Berm removal to restore hydrological connection to Bear Lake. Credit: GEI Consultants of Michigan.
mote local tourism and commerce. This required a survey of lake users, a survey of possible users of the lake, and housing sales information. These data were then used to quantify the value of recreation, the number of new visitors, and the increase in housing value from the ecosystem improvements.
This study found that the $10 million Mus-kegon Lake restoration project will generate nearly $60 million of economic benefits for the Muskegon area over a 20-year period, or a 6-to-1 return on investment (Isely et al., 2018). These economic benefits included a $12 million increase in prop-erty values; up to $600,000 in new tax revenue
annually; over $1 million in new recreational spending annually in Muskegon; and nearly 65,000 additional visitors annually.
This compelling economic benefits’ study underscores the substantial return on federal investment in Great Lakes cleanup. Further, such economic benefits assessments are important tools to help sustain long-term momentum in urban environmental restoration work and attract cham-pions and advocates for sustaining funding from governments, foundations, and businesses to help finish the job of cleaning up AOCs.

46
Concluding RemarksConsiderable progress has been made in restor-ing Muskegon Lake over the past three decades. Progress in remediating contaminated sediment and restoring fish and wildlife habitat has acceler-ated with funding from the Great Lakes Legacy Act and GLRI. Approximately $40 million from these funding mechanisms was invested in restoration of Muskegon Lake between 2002 and 2014. From 2015–2020, an additional $33 million from the GLRI and Great Lakes Legacy Act will implement the remaining projects for restoring the remain-ing impaired beneficial uses in Muskegon Lake. Of particular interest is that these restoration projects were based on sound science and followed by rig-orous monitoring programs to assess their success.
All management actions identified in the RAP will be implemented by 2020 with a goal of delisting as an AOC when monitoring confirms use restoration. The Muskegon Lake Watershed Partnership has developed a Muskegon Lake Ecosystem Action Plan to facilitate the continua-tion of coordinated, natural resources stewardship of Muskegon Lake and Lower Muskegon River Watershed from 2018 through 2025. It builds upon the restoration progress made under the Muskegon Lake RAP and through other voluntary and regula-tory cleanup programs. In essence, the Ecosystem Action Plan will seamlessly replace the RAP as
the watershed community’s guiding document for ecosystem-based management of the Muskegon Lake watershed and for the protection of its natural resources, with a goal of continuous improvement and long-term sustainability (Muskegon Lake Wa-tershed Partnership, 2018).
Together, the Ecosystem Action Plan and the Muskegon Lake Watershed Partnership will ensure that there is life after delisting as an AOC. The partnership and plan will ensure a concerted and coordinated effort to achieve the goal of Muskegon Lake serving as an economic engine, while improv-ing public access, increasing housing value, and maintaining the integrity of natural resources as articulated in Muskegon Lake Vision 2020 (West Michigan Shoreline Regional Development Com-mission 2016). Indeed, all citizens, community leaders, elected officials, and the private sector must work together to achieve sustainability.
The socioeconomic study of Isely et al., (2018) has raised awareness of the substantial economic benefits of Muskegon Lake restoration. Further, the documentation of a 6-to-1 return on restoration investment is providing compelling rationale for continued investment in restoring and protecting Muskegon Lake, consistent with the vision of a healthy and sustainable environment and natural resources, outdoor recreation, commerce and port activities, and residential development.

47
River Raisin in Monroe, Michigan. Credit: City of Monroe.
The River Raisin is located in southeast Michigan with its watershed overlapping five Michigan counties and dipping into a small portion of northern Ohio. Like
in many areas of the Great Lakes, industrial development, including paper mills and automotive manufacturing, left behind a legacy of pollution. The River Raisin RAP was completed in 1987 and updated periodically in the spirit of adaptive management. Major problems identified in the RAP included heavy metals and polychlorinated biphenyl (PCB) contamination of the sediments and water column, sediment input from nonpoint sources outside of the AOC, and PCB contamination of fish (MDNR, 1987b).
From Cleanup of the River Raisin to Revitalization of Monroe, Michigan
SCOTT J. BENTLEY, River Raisin National Battlefield Park, MARK COCHRAN, City of Monroe, and JOHN H. HARTIG, Visiting Scholar, Great Lakes Institute
for Environmental Research, University of Windsor
CHAPTER 8
All monetary amounts in this chapter are in U.S. dollars.
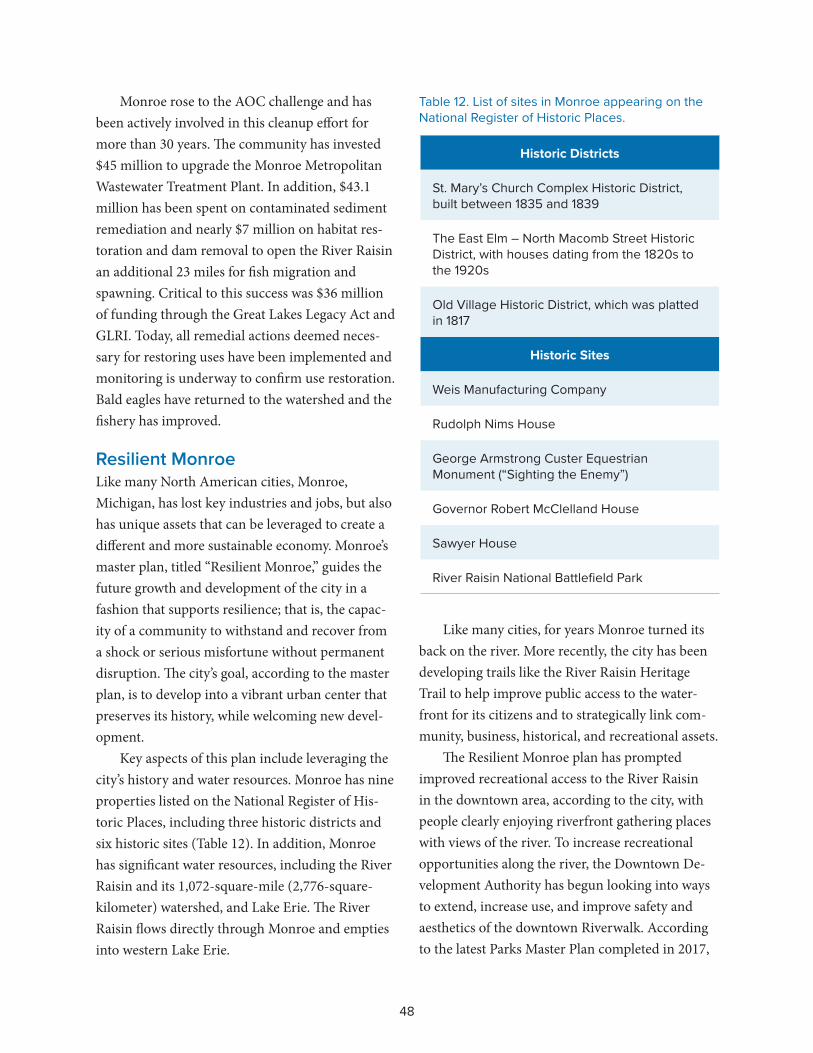
48
Table 12. List of sites in Monroe appearing on the National Register of Historic Places.
Historic Districts
St. Mary’s Church Complex Historic District, built between 1835 and 1839
The East Elm – North Macomb Street Historic District, with houses dating from the 1820s to the 1920s
Old Village Historic District, which was platted in 1817
Historic Sites
Weis Manufacturing Company
Rudolph Nims House
George Armstrong Custer Equestrian Monument (“Sighting the Enemy”)
Governor Robert McClelland House
Sawyer House
River Raisin National Battlefield Park
Monroe rose to the AOC challenge and has been actively involved in this cleanup effort for more than 30 years. The community has invested $45 million to upgrade the Monroe Metropolitan Wastewater Treatment Plant. In addition, $43.1 million has been spent on contaminated sediment remediation and nearly $7 million on habitat res-toration and dam removal to open the River Raisin an additional 23 miles for fish migration and spawning. Critical to this success was $36 million of funding through the Great Lakes Legacy Act and GLRI. Today, all remedial actions deemed neces-sary for restoring uses have been implemented and monitoring is underway to confirm use restoration. Bald eagles have returned to the watershed and the fishery has improved.
Resilient MonroeLike many North American cities, Monroe, Michigan, has lost key industries and jobs, but also has unique assets that can be leveraged to create a different and more sustainable economy. Monroe’s master plan, titled “Resilient Monroe,” guides the future growth and development of the city in a fashion that supports resilience; that is, the capac-ity of a community to withstand and recover from a shock or serious misfortune without permanent disruption. The city’s goal, according to the master plan, is to develop into a vibrant urban center that preserves its history, while welcoming new devel-opment.
Key aspects of this plan include leveraging the city’s history and water resources. Monroe has nine properties listed on the National Register of His-toric Places, including three historic districts and six historic sites (Table 12). In addition, Monroe has significant water resources, including the River Raisin and its 1,072-square-mile (2,776-square-kilometer) watershed, and Lake Erie. The River Raisin flows directly through Monroe and empties into western Lake Erie.
Like many cities, for years Monroe turned its back on the river. More recently, the city has been developing trails like the River Raisin Heritage Trail to help improve public access to the water-front for its citizens and to strategically link com-munity, business, historical, and recreational assets.
The Resilient Monroe plan has prompted improved recreational access to the River Raisin in the downtown area, according to the city, with people clearly enjoying riverfront gathering places with views of the river. To increase recreational opportunities along the river, the Downtown De-velopment Authority has begun looking into ways to extend, increase use, and improve safety and aesthetics of the downtown Riverwalk. According to the latest Parks Master Plan completed in 2017,

49
the city is also planning to invest more than $3.5 million in two of its riverside parks within the next 10 years: St. Mary’s Park in downtown Monroe and Mill Race Park on the city’s west side. Plans include the installation of nature paths, boardwalks, and a kayak and canoe launch.
The city also reports an increase in small-business owners and developers inquiring about property for residential, dining, and retail develop-ment opportunities along the riverfront. In 2018, a new restaurant opened with an outdoor din-ing patio overlooking the river. Another dining establishment is relocating one block north to be closer to the river, again with a new outdoor patio overlooking the river. Further, existing building owners have improved the outside and rear of their buildings that face the river to help strengthen con-nections to the river and create a riverfront sense of place.
River Raisin National Battlefield ParkAs part of its revitalization efforts, Monroe also championed the establishment of the River Raisin National Battlefield Park (RRNBP) in 2009. The city and Monroe County Historical Society de-veloped the River Raisin Heritage Corridor—East Master Plan (Heritage Master Plan) in partnership with the National Park Service (NPS) for RRNBP to generate a different and sustainable economy for Monroe. This Heritage Master Plan, which comple-ments the city’s master plan, embraces an econom-ic strategy that celebrates the past while leveraging the future. Designed to be transformative, it aims to reinvent Monroe as a national destination on par with Jamestown, Williamsburg, Charleston, Harpers Ferry, and Gettysburg.
Both the Resilient Monroe plan and the Heri-tage Master Plan view the cleanup and restoration of the River Raisin as an integral part of a vibrant community with a sustainable economy. These
two plans work synergistically to better connect Monroe residents and visitors with historical sites like RRNBP; ecological sites like the Detroit River International Wildlife Refuge, Sterling State Park, and other waterfront parks; and business and cul-tural destinations.
Figure 2 presents a map of the River Raisin Heritage Trail showing these key linkages.
Economic BenefitsRRNBP is truly unique in that it is the only na-tional park that is adjacent to an international wildlife refuge (i.e., Detroit River International Wildlife Refuge) and a state park (i.e., Sterling State Park). Annual attendance at the battlefield park has steadily increased from 36,206 people in 2011 to 238,813 in 2017 (Table 13). In total, 75.5 percent of the 2016 visitors were from outside of Monroe County, including 49 states (all but North Dakota) and 20 foreign nations.
Economic benefits of RRNBP have been estimated using three different economic models, including an early National Park Service money generation model developed by Michigan State
Year Attendance
2011 36,206
2012 50,667
2013 57,464
2014 55,281
2015 109,118
2016 202,375
2017 238,813
Table 13. Park attendance, 2011-2017 (National Park Service, 2018).

50
BATTLEFIELD & WETLANDSThis section of the trail, which is largely contained within Sterling State Park, is adjacent to the Ford Marsh unit of the Detroit River International Wildlife Refuge, and is near to the River Raisin National Battlefi eld Park, site of a signifi cant battle in the War of 1812. The trail provides visitors with an outstanding opportunity to step back in time and experience the marshes and wetlands that the early French settlers fi rst explored, hunted, and called home. Views of Lake Erie and of the natural habitats of indigenous wildlife and waterfowl are accessible from the main path and side trails. Bicyclists can experience nature on an extended ride and bird watchers can add unique species to their sighting list.
This section of the trail is an 8-10-foot wide asphalt path with several side trails and viewing decks. The trail can be accessed from Sterling State Park, the River Raisin National Battlefi eld Park, or the City of Monroe’s Multi-Sports Complex (on N. Dixie Highway west of the battlefi eld).
From the parking area at the start of the Sterling State Park Loop, shortest route to the Wetlands Trail Head is 1.5 miles.
HISTORY & CULTURE This section of the trail runs through an area containing some of Monroe’s oldest and most elegant homes. From early territorial governors to industrial leaders, Elm Avenue and its adjoining neighborhoods refl ect architectural styles and periods ranging from the early 19th century through today. The Custer Equestrian Monument and St. Mary Catholic Church are two of the community’s most notable landmarks. Visitors can also fi nd shops, restaurants and cultural attractions, such as a Custer Exhibit at the Monroe County Historical Museum and the War of 1812 Memorial Place. Downtown is easily accessible from Elm Avenue via Monroe and Macomb Streets.
City sidewalks make up a majority of this section of the trail and range in width from 4 – 6 feet. The Riverwalk, a 10-foot wide pathway running along the river, is accessible from St. Mary’s Park (near the Custer monument) and at the Macomb Street Bridge.
RECREATION & FITNESS This section of the trail is the preeminent venue for local fi tness enthusiasts. It is not unusual to fi nd young mothers with strollers, pet owners, couples, friends, joggers, and bikers sharing the trail year-round. The local YMCA is the eastern anchor providing a point of departure to cultural and recreational amenities located on the west side of the city. At the mid-point, Veterans Park salutes our military men and women who have served from WWI through the present. Veterans Park also offers the opportunity to fi sh along the River Raisin, enjoy a leisurely lunch outside, or take a few moments to relax during a workout on the trail. Proceeding west from Veterans Park, the trail provides scenic views of the river and terminates in Monroe’s premier recreational facility, Munson Park. The park offers skateboarding, soccer and ball fi elds, walking and nature trails, a sledding hill and much more. On-street bike lanes continue to the 18th century Navarre-Anderson Trading Post.
This section of the trail is constructed of asphalt and averages 6 feet in width. The path goes under Telegraph Road and crosses to the north side of North Custer (W. Elm Avenue) as it nears Munson Park. A 5-foot-wide shoulder bike path now connects Munson Park to the Navarre-Anderson Trading Post.
R I V E R R A I S I N H E R I T A G E T R A I L S Y S T E M
4.4 MILES1.7 MILES1.4 MILES
Sidewalk(to E. Elm Ave)
0.7 miles4’ - 5’ Wide
Riverwalk0.5 miles10’ Wide
Sidewalk1.7 miles
CUSTERAIRPORT
MERCY MEMORIAL HEALTH SYSTEM
S. Custer Rd.
W. Front St.
N. Custer Rd.
W. Elm Ave.
E. Elm Ave.S
. Tel
egra
ph R
d.
S. D
ixie
Hw
y.
S. M
onro
e St
.
N. M
onro
e S
t.
N. D
ixie
Hw
y.
N. Dixie Hwy.
YMCATRAIL HEAD
MUNSON PARK
TRAIL HEAD
S. R
aisi
nvill
e R
d. MULTI-
SPORTS COMPLEX
TRAIL HEAD
RIVER RAISINNATIONAL
BATTLEFIELDPARK
TRAIL HEAD
STERLING STATE PARKTRAIL HEAD(AUTO PERMIT
REQUIRED)
Sterling State Park Loop Total
2.7 miles
LAKE ERIE
8
7
RIVER RAISIN
5
6
7
8
9
Sisters, Servants of the Immaculate Heart of Mary
Memorial Place/Kentucky Monument(War of 1812)
Monroe County Historical Museum
St. Mary Catholic Church
Custer Equestrian Monument
Loranger Courthouse Square
RIVER RAISIN HERITAGE TRAIL WELCOME SIGN
SAILING ON LAKE ERIE
PAVEDON-STREET, 5 FT. WIDE SHOULDER BIKE PATH
10
6
1
2
3
E. Front St.
River Raisin National Battlefi eld Park
Accessible Fishing Pier
Ford Marsh/Detroit River International Wildlife Refuge
Wm. C. Sterling State Park
Navarre-Anderson Trading Post Munson ParkSt. Antoine Memorial Monument Veterans ParkMonroe Family YMCA
1
Connection to parking lot at
State park.2 miles
3
NAVARRE-ANDERSON TRADING POST
The trading post is listed on the National Register of Historic Places as the oldest standing residential wood structure and is one of the very few remaining examples of French colonial log construction in Michigan today.
ST. MARY’SPARK
TRAIL HEAD
MEMORIAL PLACE KENTUCKY MONUMENT
(WAR OF 1812)
VETERANS PARK
TRAIL HEAD
FORD MARSH
2
4
MARTIN LUTHER KING JR. FOOT BRIDGE
SISTERS, SERVANTS OF THE IMMACULATE
HEART OF MARY
SURFACE KEY & LEGEND
SIDEWALK (ONE SIDE)
SIDEWALK (BOTH SIDES)
ASPHALT PATHRAILROAD
WetlandsTrail
1.1 miles
5
4.7 mile
1 mile
DETROIT EDISON GENERATION PLANT
N. Custer Pathway1.4 miles
OPENAPR.-NOV.
OPENALL YEAR
RESTROOMS
DOWNTOWNMONROE
.23
mile
WATER FILTRATION
PLANT
WINCHESTER STREET BRIDGE
10
15
9
14131211
11
12
13
1415
Battlefi eldSection0.6 miles
Figure 2. River Raisin Heritage Trail system linking Downtown Monroe with RRNBP, the Detroit River International Wildlife Refuge, Sterling State Park, historic districts and sites, waterfront parks, and cultural destinations.
University (MSU), an improved model developed by MSU and a local economist, and a new Eco-nomic Impact Study model developed by National Park Service (Table 14). The range of estimated economic benefits in 2016, based on the three different models, was $4.78–$16.4 million. The Na-tional Park Service (2017) Economic Impact Study estimate of $16.4 million in 2016 is considered the most accurate estimate of economic benefits based on the best available model.
MSU, in partnership with RRNBP, projected that annual attendance will eventually reach ap-proximately 635,000 (Table 15). In total, $90.4 million will be spent on building and site improve-ments, and property acquisition. In addition,
at this visitation rate the annual state and local economic impact is projected at $31.6 million and $21.9 million, respectively (Table 15).
In summary, an integrated approach to pro-tecting the environment, celebrating history, enhancing the community, and furthering the economy is helping redefine Monroe from a Rust Belt city with a polluted river to a desirable urban community with outstanding natural resources, significant historical assets, a national park, an international wildlife refuge, a state park, and a growing, diverse Monroe economy. The cleanup of the River Raisin was an integral and essential part of this revitalization strategy.

51
Table 15. River Raisin Heritage Corridor East Master Plan cost summary.
Category Amount
Projected annual visitors 635,000
COST
Building and site improvements $80,924,000
Property acquisition $9,493,000
Total $90,417,000
IMPACT
Annual state economic impact $31,616,000
Annual local economic impact $21,939,977
Jobs (full time equivalents) 303
BREAK-EVEN POINT
Years to recoup cost based on state economic return 2.85
Years to recoup cost based on local economic return 4.12
Table 14. Estimates of economic benefits of RRNBP based on three different models.
Model 2011 2012 2013 2014 2015 2016
Griswold Consulting Group, LLC and MSU (2014)
$1,917,216 $2,662,729 $3,029,502 $2,914,414 $3,742,224 $6,005,493
NPS Money Generation Model (MSU, 2017; Stynes et al., 2009; Stynes, 2000)
$1,527,372 $2,121,294 $2,413,488 $2,321,802 $2,981,286 $4,784,346
NPS (2017) Economic Impact Study
No data $3,600,000 $4,100,000 $4,300,000 $8,600,000 $16,400,000


53
Natural shoreline of Severn Sound. Credit: Severn Sound Environmental Association.
Economic Benefits Help Drive Cleanup of Severn Sound
KEITH SHERMAN, Severn Sound Environmental Association
CHAPTER 9
On the southeastern edge of Lake Huron’s Georgian Bay lies Severn Sound, a complex of bays and inlets covering approximately 50 square miles (130
square kilometers). Small- to medium-sized urban centers dot the Severn Sound area, with approximately one-third of its watershed devoted to agriculture.
All monetary amounts in this chapter are in Canadian dollars.

54
Figure 3. Map of municipalities in the Severn Sound watershed. Cedit: Severn Sound Environmental Association.
Severn Sound was identified an AOC in 1985 primarily due to eutrophication and habitat loss. This designation triggered nearly 20 years of cleanup that was justified, in part, by the economic benefits projected to be realized from a healthy environment. As a result of these efforts, in 2003 Severn Sound became the second AOC to be del-isted, and one of only seven of the 43 AOCs yet to achieve this status.
One key element in this success was an inno-vative partnership agreement between the federal and provincial governments and the 10 munici-palities in the Severn Sound area (Figure 3). The partnership became the Severn Sound Environ-mental Association (SSEA), which is now a Joint Municipal Services Board (as defined by Ontario Municipal Act, Section 202) representing the local municipalities (Sherman et al., 2018). It continues
to guide management decisions related to Severn Sound.
Severn Sound CleanupThe Stage 1 RAP, describing environmental condi-tions and use impairments, was completed in 1989 (SSRAP, 1989). The Stage 2 RAP outlining water use goals, objectives, and remedial actions necessary to restore impaired beneficial uses was completed in 1993 (SSRAP, 1993).
The RAP addressed environmental issues through actions in six areas: phosphorus control, habitat restoration and enhancement, pollution prevention, planning, environmental monitoring, and public education on environmental issues. Phosphorus was controlled by improving processes at sewage treatment plants, upgrading private sewage systems, eliminating sewage bypasses and

55
Tree planting as part of habitat restoration, 2016. Credit: Severn Sound Environmental Association.
combined sewer overflows, and reducing inputs from agricultural sources. Not only did the sewage treatment plant improvements reduce phosphorus loads to meet RAP targets, but these improvements resulted in considerable cost savings to the munici-palities.
Through a Sewage Treatment Optimization Project, the federal and provincial governments provided technical support and training for municipal operators in all eight treatment plants in the AOC watershed. In addition, the Ontario Ministry of the Environment and Climate Change contributed $23 million to upgrade four of the eight sewage treatment plants.
The Severn Sound Urban Stormwater Strategy was developed by municipalities who passed en-abling bylaws to govern new construction, storm-water retrofits, and sewer separation projects. To help reduce algal growth in Severn Sound, 3,000 private shoreline sewage systems were inspected and improvements were made to 600. Tributary
phosphorus loadings from agricultural sources were reduced through farm-level projects to man-age manure runoff, treat direct milk house wastes, restrict livestock access to rivers, and improve crop practices.
Between 1990 and 2002, the Canadian federal Great Lakes Sustainability Fund provided $3.4 mil-lion for restoring environmental quality in support of 22 projects in the Severn Sound AOC. This part-nership arrangement realized more than $4 million in direct partner funding and nearly $2 million from in-kind contributions (Sherman, 2002).
Conservation agreements and wetland re-habilitation projects protected 1,015 acres (411 hectares) of wetlands and associated uplands. In tributary streams, 132 projects were completed, creating vegetative buffers and linking habitat nodes. In addition, townships and municipalities adopted natural heritage strategies.
Beginning in 1991, Trumpeter Swans were reintroduced to Wye Marsh, contributing to

56
Trumpeter swans on Hogg Bay of Severn Sound, Ontario. Credit: Severn Sound Environmental Association.
re-establishment of this species. Lead shot in the swan’s habitat had limited their population. A lead shot ban in 1993 and use of an innovative technol-ogy to sink the pellets deep into sediment out of reach of the swans helped contribute to the goal of a sustainable population.
In addition, upgraded infrastructure, local job creation, and cost-effective decisions, assisted by RAP studies, improved the area’s economic vital-ity. Volunteer participation and positive media support helped gain community acceptance of the RAP principles of maintaining a healthy environ-ment and ensuring economic and environmental sustainability, including their inclusion in munici-pal plans.
The Government of Canada and its partners completed all remedial actions by 2002. The Stage 3 RAP was completed in 2003, where environmen-tal monitoring confirmed achievement of delisting criteria established for Severn Sound (Sherman,
2002). Official delisting of Severn Sound as an AOC occurred in 2003.
The SSEA facilitated the delisting of Severn Sound. The association played a key role in the sewage treatment plant upgrades, farm pollution control projects, stormwater treatment studies, tree planting, shoreline restoration and ecosystem monitoring, and public outreach on environmental issues. Of particular note was how SSEA helped provide community-based, cost-effective, environ-mental management for the Severn Sound area, which helped sustain momentum and achieve delisting. Delisting would not have been possible without the concerted effort of the Severn Sound RAP Implementation Office, SSEA, and the Severn Sound community, especially the municipali-ties and the farming community (Sherman et al., 2018). Following delisting, creative local partner-ship agreements and financing were arranged to continue long-term implementation and to meet

57
Penetang Bay, Severn Sound, Ontario. Credit: Severn Sound
Environmental Association.
emerging environmental and sustainability chal-lenges.
Economic BenefitsEconomic benefits’ assessments played an impor-tant role in making the case for implementing re-medial actions and documenting return on invest-ment. Economic assessments of the Severn Sound RAP (Keir Consultants, 1991; Zegarac et al., 1994; Tejani and Muir, 2004) outlined the estimated costs and the benefits of completing the remedial actions using phosphorus and sediment control as a basis for comparison. Keir Consultants (1991) provided a community profile and cost-benefit analysis of remedial actions early on in the Severn Sound RAP process and concluded that “the Severn Sound area will need to employ a variety of coordinated reme-dial actions to achieve and maintain the desired water quality and at the same time they will need to employ a mixture of funding mechanisms that will generate the necessary monies for capital improve-ments and operational expenses. An attractive, safe, useable water body is one of the main assets that communities surrounding Severn Sound will
require in order to continue to attract recreational growth and strengthened economic base.”
Zegarac et al., (1994) provided estimates of costs and benefits of remedial actions in the context of overall municipal spending, showing the value of remedial actions in terms of phosphorus removed. Their analysis also showed the benefits of ongoing maintenance of environmental controls.
Tejani and Muir (2004) evaluated the cost and benefit of restoration projects over the RAP period of 1991–2002. They sorted, quantified, and mon-etized achievements of restoration activities based on a cost-saving approach. Other environmental benefits were evaluated based on a benefit transfer technique, namely for the value of wetlands and carbon stored per metric ton. Due to restrictions of time and data availability, the Tejani and Muir (2004) study covered only those aspects that could be readily evaluated. Therefore, these authors cau-tioned that their estimated values are by no means exhaustive nor definitive. Moreover, monetary benefits of environmental amenities are not realized only once the project is implemented, but they con-tinue to produce benefits (i.e., goods and services)

58
every year. The monetary benefits presented in the Tejani and Muir (2004) study cover a 12-year period of 1991–2002.
Table 16 presents a summary of the results from the Tejani and Muir (2004) study. The total monetary value of the Severn Sound RAP restora-tion projects implemented between 1991 and 2002 was estimated at $35.3 million. The total imple-mentation costs of restoration projects during the same time period was estimated at $2.16 million. Every dollar spent by the end of 2002 would gener-ate $16.34 in benefits, reflecting cost effectiveness of these RAP restoration projects (Tejani and Muir, 2004). It should be noted that these benefits’ assess-ments were based on a 10-year life span, meaning that the economic benefits were only estimated for 10 years (SSRAP, 1993).
It has now been 25 years since the Stage 2 RAP (SSRAP, 1993) phosphorus control targets were beginning to be addressed. Some of the remedial actions taken in the 1990s have outlived their origi-nal life-span. The targets for phosphorus control are still being met as new expansion and upgrades of sewage plants have been brought on line. For example, upgrading the Victoria Harbour Sewage Treatment Plant was completed in 2017, resulting in improved effluent quality and plant reliability, increased capacity, and non-toxic effluent in terms of reduced effluent ammonia and elimination of chlorine. This upgrade was funded by wastewater rates and development charges. The municipal-ity upgraded its plant and will eventually increase its wastewater capacity by 50 percent, resulting in continued achievement of the Severn Sound RAP phosphorus loading target, while funding this upgrade locally. This allowed them to continue to use an existing outfall into Sturgeon Bay and avoided the cost of building a new outfall. In the case of the agricultural sector, the original cost-
benefit analyses (Zegarac et al., 1994; Tijani and Muir, 2004) are still valid, showing minimal costs to farmers that result in optimized yields and costs, while reducing erosion and runoff and improving stream quality. An analysis of sediment loss from two Severn Sound watersheds showed that the significant riparian habitat restoration projects of the early 1990s are still providing benefits in terms of significant reductions in sediment loss from the streams (and phosphorus) entering Severn Sound (Stang, 2011).
Concluding ThoughtsSevern Sound is one of only seven AOCs to be delisted since 1985. Effective collaboration and cooperation among all stakeholders were essential to achieve delisting (Sherman et al., 2018). Eco-nomic benefits’ assessments were an important part of making the case for implementing remedial actions, documenting return on investment, and securing commitments from responsible organiza-tions for implementation.
SSEA has proven to be an effective partner-ship among federal, provincial, and municipal governments, and other organizations to ensure local ownership and acceptance; sustain long-term restoration efforts; and facilitate transition to sus-tainability.
“Our overall effort and success is excellent, and the RAP team should be commended,” stated Bob Whittam of the Wye Marsh Wildlife Center, at the acceptance of the Stage 3 RAP. Whitman, who was selected as public involvement facilitator and was well respected in the community, went on to note, “However, there is still life after delisting and we should proceed as if we were approved and passed, but forever on probation, lest we become complacent.”

59
Restoration Activity Minimum Benefits
Maximum Benefits
Average Benefits (2002)
Total Costs*
Wastewater treatment cost savings
$9,246,059 $47,477,968 $32,985,043 $2,086,807
Septic tank upgrades $307,898 $1,581,036 $1,098,416 $400,721
Riparian buffer strip phosphorus savings
$2,071,191 $10,635,444 $7,388,913 $493,296
Cattle restricted access fencing
$155,224 $797,068 $553,758
Milkhouse wastewater management
$972,380 $4,993,116 $3,468,939 $39,339
Eavestrough stormwater diversion
$324,767 $1,667,659 $1,158,596 $31,141
Manure storage tank construction
$5,022,709 $25,791,313 $17,918,365 $356,505
Soil conservation (tillage) $391,890 $2,012,333 $1,398,057 $765,804
Other cost savings of riparian buffer strips
$16,067 $66,891 $41,479
Riparian buffer strip sediment savings
$8,871 $40,688 $24,780
Streambank maintenance $2,194 $3,354 $2,774
Flood control $5,001 $22,848 $13,925
On-site cost savings of conservation tillage
$151,498 $852,225 $501,862
Carbon storage $432,173 $467,806 $449,989
Wetlands $1,320,394 $1,320,394 $1,320,394 $71,883
Total $11,166,190 $50,185,284 $35,298,767 $2,158,690
Table 16. Estimated total cost savings and monetary benefits generated by implementation of the Severn Sound RAP, compared to costs of the rehabilitation projects, 1991–2002 (Tejani and Muir, 2004).

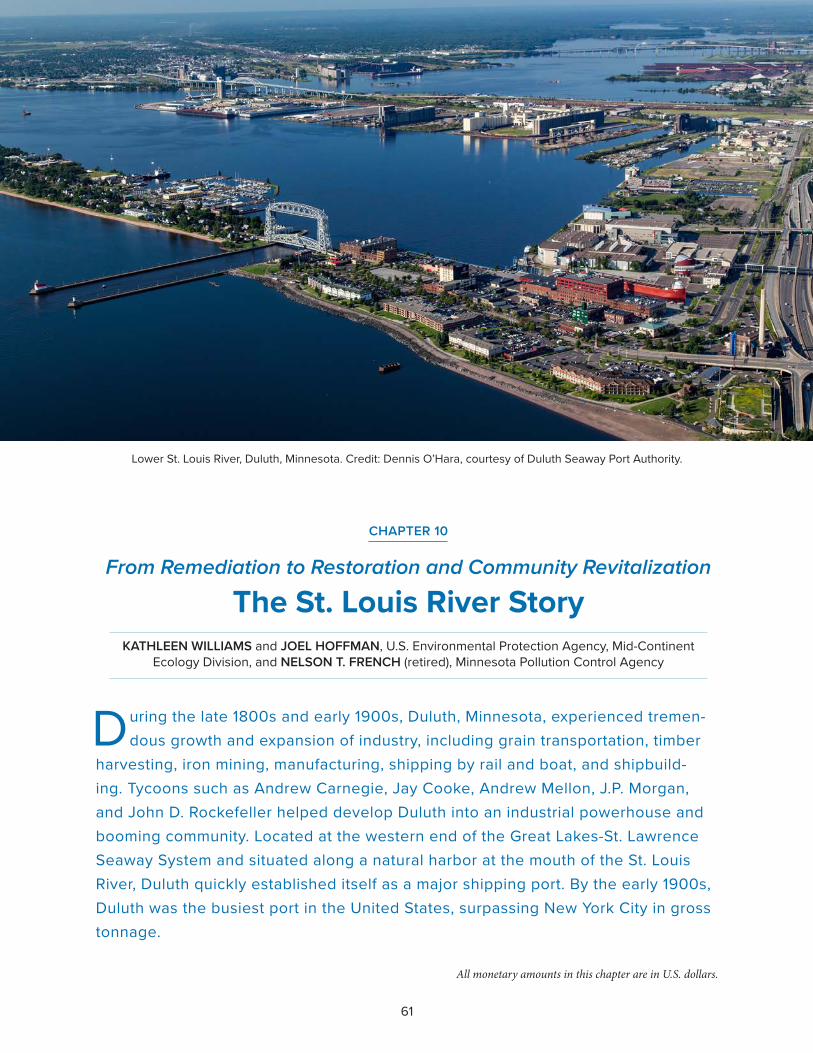
61
During the late 1800s and early 1900s, Duluth, Minnesota, experienced tremen-dous growth and expansion of industry, including grain transportation, timber
harvesting, iron mining, manufacturing, shipping by rail and boat, and shipbuild-ing. Tycoons such as Andrew Carnegie, Jay Cooke, Andrew Mellon, J.P. Morgan, and John D. Rockefeller helped develop Duluth into an industrial powerhouse and booming community. Located at the western end of the Great Lakes-St. Lawrence Seaway System and situated along a natural harbor at the mouth of the St. Louis River, Duluth quickly established itself as a major shipping port. By the early 1900s, Duluth was the busiest port in the United States, surpassing New York City in gross tonnage.
From Remediation to Restoration and Community Revitalization
The St. Louis River StoryKATHLEEN WILLIAMS and JOEL HOFFMAN, U.S. Environmental Protection Agency, Mid-Continent
Ecology Division, and NELSON T. FRENCH (retired), Minnesota Pollution Control Agency
CHAPTER 10
Lower St. Louis River, Duluth, Minnesota. Credit: Dennis O’Hara, courtesy of Duluth Seaway Port Authority.
All monetary amounts in this chapter are in U.S. dollars.
62
Along its banks, the St. Louis River had steel foundries, mills and blast furnaces, grain elevators, and shipbuilding operations. Facilities were located in Duluth, and across the river in Superior, Wis-consin, which collectively became known as the Twin Ports. Later, facilities that made everything from chemicals and refrigerators to shoes lined the river. Heavy industry that operated during the late 1890s through the mid-1900s built much of the cit-ies’ wealth and the river communities’ identities.
Through this period, the St. Louis River estu-ary was changed substantially to accommodate de-velopment along the water. At the river mouth, Su-perior Bay and St. Louis Bay together form a large natural harbor at the western end of Lake Superior. These bays were an expansive, shallow marsh prior to European settlement. In the early 1900s, Supe-rior Bay and St. Louis Bay became the industrial centers of the cities of Duluth and Superior. Over time, an estimated 7,000 acres (2,800 hectares) of aquatic habitat was dredged or filled (Minnesota Pollution Control Agency [MPCA] and Wisconsin Department of Natural Resources [WDNR], 1992). Today, the area is home to the largest dry bulk port in the United States and the largest port on the Great Lakes (U.S. Army Corps of Engineers, 2015). The navigation channel is regularly dredged to 27 feet (8.2 meters) to accommodate the bulk cargo ships that carry grain, taconite, limestone, timber, coal, and sometimes passengers to U.S. and inter-national ports (MPCA and WDNR, 1992; Duluth Seaway Port Authority, 2018).
This industrial expansion took a toll on the health of the river through the discharge of un-treated or partially treated industrial and mu-nicipal effluents, resulting in the contamination of estuarine sediments. The legacy of industrial development is still apparent today in Superfund sites, contaminated sediment hotspots, and sawmill waste sites that compromise aquatic habitat.
Unregulated discharges and other forms of leg-acy pollution were widespread prior to adoption of current environmental protection laws and rules. With the advent of the Clean Water Act in 1972, U.S.-Canada Great Lakes Water Quality Agree-ment in 1972, Endangered Species Act in 1973, and Comprehensive Environmental Response, Compensation and Liability Act in 1980, a basic structure of pollution control and environmental regulation was established, effectively limiting pollutant discharge and the likelihood of creating additional contaminated sites.
In the 1980s, the era of heavy industry ended. The loss devastated the regional economy and inspired a Duluth billboard, “Will the last one leav-ing Duluth please turn out the light?” In addition to the environmental degradation left behind, the Twin Ports faced the loss of their economic base and identity.
Remedial Action Plan EraAt the same time industry was leaving the Twin Ports, efforts to clean up the river started in earnest under the auspices of the binational Great Lakes Water Quality Agreement. In 1985, under the Agreement, the St. Louis River was declared an AOC owing to the extent of legacy pollution and the associated beneficial use impairments. Through the AOC program, the initial Stage I RAP, which determined the extent of impairments caused by legacy pollution, was completed in 1992 (MPCA and WDNR, 1992) by Minnesota and Wisconsin, working with a Citizen Advisory Committee com-posed of stakeholders, scientists, and community members. The Stage II RAP, which was an action plan to restore beneficial use impairments, was completed in 1995 (MPCA and WDNR, 1995). To ensure continued progress on the newly approved RAP, the original Citizen Advisory Committee, which was formed in 1987 to support the creation of the RAP, was subsequently incorporated into a

63
Contaminated sediment remediation in the St.
Louis River, Duluth, Minnesota. Credit:
Minnesota Pollution Control Agency.
nonprofit organization in 1996 called the St. Louis River Citizen’s Action Committee (Williams, 2015). The organization has since been renamed the St. Louis River Alliance.
By the mid-2000s, the RAP process had built on the success of ongoing regulatory actions, including the Great Lakes Legacy Act and Su-perfund, which improved water quality. Support included approximately $85 million to remediate contaminated sediment at Wisconsin’s Hog Island-Newton Creek and Minnesota’s St. Louis River Interlake Duluth Tar sites, as well as $320 million to improve wastewater treatment infrastructure and $15 million to conserve and restore more than 16,000 acres (6,500 hectares) of habitat in Wiscon-sin (French et al., 2018). Nevertheless, financial resources to directly address beneficial use impair-ments were scarce.
Although the Stage I and II RAPs had neither budgets nor action timelines necessary to secure the financial commitments to begin remedial ef-forts, the alliance gathered partners to produce the Lower St. Louis River Habitat Plan in 2002 (Wil-liams, 2015). Establishment of the GLRI in 2010 catalyzed implementation of the habitat plan, as well as a more focused set of management actions delineated in the 2013 St. Louis River Area of Concern Implementation Framework: A Roadmap to Delisting (LimnoTech, Inc., 2013), including
specific timelines and budget estimates to address the beneficial use impairments identified in the initial Stage II RAP.
The AOC Implementation Framework was a plan for collaboration and funding that helped identify and leverage the financial resources re-quired to remediate and restore the AOC through a partnership approach (LimnoTech, Inc., 2013). Between 2011 and 2017, approximately $57 million was raised and applied strategically toward resto-
ration of impaired beneficial uses. Between 2018 and 2021, an additional $155–170 million will be needed to implement all necessary remedial ac-tions identified in the RAP that will lead to future delisting (French et al., 2018). Reaching this level of commitment was possible because a collective vision and associated goals have been translated into action by aligning goals and budgets to better connect with funding sources. It was also made possible by GLRI funding. The target date to com-plete all management actions, remove beneficial use impairments, and delist the AOC is 2025.
The actions currently underway through the St. Louis River RAP result from a long history of land development and natural resource use and exploitation. Today’s focus on sediment remedia-tion and habitat restoration aims to eliminate the ecological damage left as a legacy of these past practices. This new era of remediation and
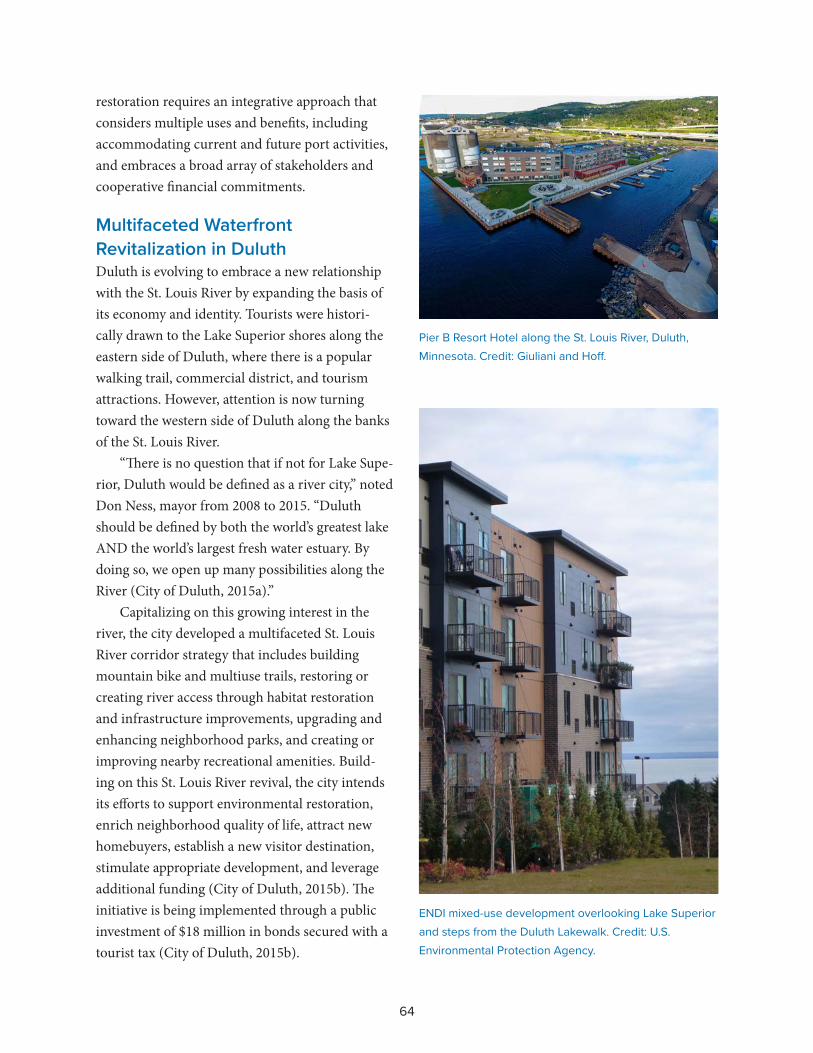
64
Pier B Resort Hotel along the St. Louis River, Duluth, Minnesota. Credit: Giuliani and Hoff.
ENDI mixed-use development overlooking Lake Superior and steps from the Duluth Lakewalk. Credit: U.S. Environmental Protection Agency.
restoration requires an integrative approach that considers multiple uses and benefits, including accommodating current and future port activities, and embraces a broad array of stakeholders and cooperative financial commitments.
Multifaceted Waterfront Revitalization in DuluthDuluth is evolving to embrace a new relationship with the St. Louis River by expanding the basis of its economy and identity. Tourists were histori-cally drawn to the Lake Superior shores along the eastern side of Duluth, where there is a popular walking trail, commercial district, and tourism attractions. However, attention is now turning toward the western side of Duluth along the banks of the St. Louis River.
“There is no question that if not for Lake Supe-rior, Duluth would be defined as a river city,” noted Don Ness, mayor from 2008 to 2015. “Duluth should be defined by both the world’s greatest lake AND the world’s largest fresh water estuary. By doing so, we open up many possibilities along the River (City of Duluth, 2015a).”
Capitalizing on this growing interest in the river, the city developed a multifaceted St. Louis River corridor strategy that includes building mountain bike and multiuse trails, restoring or creating river access through habitat restoration and infrastructure improvements, upgrading and enhancing neighborhood parks, and creating or improving nearby recreational amenities. Build-ing on this St. Louis River revival, the city intends its efforts to support environmental restoration, enrich neighborhood quality of life, attract new homebuyers, establish a new visitor destination, stimulate appropriate development, and leverage additional funding (City of Duluth, 2015b). The initiative is being implemented through a public investment of $18 million in bonds secured with a tourist tax (City of Duluth, 2015b).

65
Western Waterfront Trail and Munger Landing along the St. Louis River. Credit: U.S. Environmental Protection Agency.
The St. Louis River corridor continues to serve as the industrial heart of the city, but also is home to a rich outdoor tradition and abundant high-val-ue natural areas (Williams et al., 2018). By turning toward the river, the City of Duluth is capitaliz-ing on the natural assets and ecosystem services made more accessible and attractive through AOC cleanup actions (Williams et al., 2018).
According to former Mayor Ness, “Most cit-ies put a premium on making life easy; cities like Duluth put a premium on making life interesting” (Ross, 2014). By promoting world-class mountain biking, skiing, kayaking, and sailing in the city, Du-luth is reclaiming its waterfront and inviting people back to the water through investments in access.
An important feature that will connect the community to the river is the extension of the Western Waterfront Trail, a walking, hiking, and biking trail that will continue to follow the riparian corridor for an additional 10 miles (16 kilometers) through much of the formerly industrialized and contaminated lands. To complete this trail, large-scale remediation and restoration projects are nec-essary along its entire course. The first project to be completed is located at the trail’s end, in Chambers
Grove Park, where a park improvement project was paired with a fish habitat restoration project to greatly enhance the quality of the park and the way park users experience the river. The next major project, the Grassy Point-Kingsbury Bay project, will begin in 2019. The project will improve habitat at two large coastal wetlands along the trail. In the near future, four major remediation or restoration projects are planned (i.e., Erie Pier Ponds, Munger Landing, Spirit Lake, and Mud Lake). Collec-tively, these projects will provide a new generation of citizens the opportunity to connect to the St. Louis River by learning about and experiencing its cultural heritage and natural resources. And this connection can help to foster the sense of steward-ship that is necessary for long-term sustainable management.
The new vision for the City of Duluth is one where industry and nature coexist and contribute to community well-being. This unique relation-ship has allowed the port to continue to serve its important economic role for the community, while enhancing the environmental quality of the St. Louis River along Duluth’s waterfront. The city is not relying solely on outdoor recreation to advance revitalization. The Port of Duluth-Superior con-tributed $1.4 billion in economic activity in 2017 (Martin Associates, 2018). The port operations have benefited from a synergistic relationship with the AOC. The U.S. Army Corps of Engineers must dredge sediment from the navigational channel of the St. Louis River to maintain the required depth for commercial maritime traffic, but then must somehow dispose of the dredged material. This maintenance dredging has proved useful to the AOC, which needs sediment for remediation projects and habitat restoration. The dredged sedi-ment is sufficiently clean to be used for the large-scale habitat restoration projects occurring within the AOC and can be provided directly to those projects for beneficial use. Since, 2013, nearly 1.1

66
St. Louis River, Duluth, Minnesota. Credit: Kathleen Williams.
million cubic yards (841,000 cubic meters) of sedi-ment has been used in wetland restoration proj-ects in the AOC, with about 700,000 cubic yards (535,000 cubic meters) placed at the 21st Ave. W project site and the remainder at the 40th Ave. W project site.
Furthermore, the city has developed a Brown-fields Areawide Plan for the Irving and Fairmount neighborhoods adjacent to the St. Louis River and near the port (Williams et al., 2018). Neighbor-hood planning includes finding ways to enhance infrastructure for legacy and newer industrial uses, improve access to the St. Louis River, cre-ate new housing opportunities, attract new retail businesses, and enhance the quality of life (City of Duluth, 2017; U.S. EPA, 2012). Several of the plan recommendations focus on enhancing ecosystem services through green infrastructure and commu-nity gardens.
Environmental restoration and intentional planning create better access to the waterfront and draw attention to the renewed resources through new developments and national recognition. New waterfront developments include a $34 million resort that converted a cement terminal into a luxury resort (Renalls, 2016) and a $38 million
mixed-use housing development (Council of Great Lakes Industries and Great Lakes Commission, 2018; Johnson, 2017). Moreover, Duluth has been recognized by Outside Magazine for its abundance of recreational opportunities, many close to the river (Helal, 2014; Rayno, 2017). Finally, the in-creased vitality is attracting younger people to the city, where around 27 percent of the population is between 20 and 34 years old (U.S. Census Bureau,
2017).
Concluding ThoughtsAdaptation to environmental change is an ongo-ing process. In the St. Louis River estuary, envi-ronmental change started with industrialization, evolved through contaminated sediment reme-diation and aquatic habitat restoration, and now is entering community revitalization. The public investments through GLRI and the St. Louis River Corridor Initiative have prompted private invest-ment to improve access to the water and enhance community quality of life by connecting people to natural beauty and resources of the St. Louis River. In time, this connection may foster a renewed sense of stewardship for the river and its rich cul-tural heritage.

67
Cleanup of Toronto Harbour Leads to Waterfront Revitalization
VALERIE FRANCELLA, Toronto and Region Conservation Authority, with input from MICHAEL WOLFE, Waterfront Toronto
CHAPTER 11
Situated on the northern shore of Lake Ontario, Toronto has grown into Canada’s largest city and a key hub of the nation’s commercial, financial,
industrial, and cultural life. The AOC extends from Etobicoke Creek in the west to the Rouge River in the east and includes six major watersheds that drain into Lake Ontario. These include Etobicoke Creek, Mimico Creek, the Humber River, the Don River, Highland Creek, and the Rouge River (Figure 4). These watersheds drain an area of 1,243 square miles (2,000 square kilometers) and include 26 miles (42 kilometers) of waterfront, 11 municipal jurisdictions, and more than 4 million people.
Toronto’s waterfront with Toronto Islands in the foreground. Credit: Waterfront Toronto.
All monetary amounts in this chapter are in Canadian dollars.

68
Figure 4. Map depicting the Toronto and Region AOC, including its six major watersheds: Etobicoke Creek, Mimico Creek, Humber River, Don River, Highland Creek, and Rouge River. Credit: Toronto and Region Conservation Authority.
Toronto and Region Remedial Action PlanA Stage 1 RAP (i.e., environmental conditions and problem definition) was completed in 1989 (OMOE, 1989), followed by a Stage 2 RAP (i.e., actions to address problems) completed in 1994 (OMOE, 1994). In 1989, eight beneficial use impairments were identified (i.e., restrictions on fish consumption, degradation of benthos, restric-tions on dredging activities, eutrophication or undesirable algae, beach closings, degradation of aesthetics, degradation of fish and wildlife popu-lations, and loss of fish and wildlife habitat) and three required further assessment (i.e., fish tumors
or other deformities, bird or animal deformities or reproductive problems, and degradation of phytoplankton and zooplankton populations). The Toronto and Region RAP is managed by represen-tatives from Environment and Climate Change Canada (ECCC), the Ontario Ministry of the Environment, Conservation, and Parks (MECP), the Ontario Ministry of Natural Resources and Forestry (MNRF), Toronto Water, and the Toronto and Region Conservation Authority (TRCA). Since 2002, TRCA has led the administration of the RAP under an agreement with ECCC and the MECP.
The Toronto RAP team works with partners to address beneficial use impairments to ultimately

69
Indicator Status
Beneficial use impairments
Since 2007, assessments on four of the 11 original beneficial uses deemed impaired or requiring further assessment have been redesignated as “not impaired,” including bird or animal deformities or reproductive problems, degradation of benthos, fish tumors or other deformities, and restrictions on dredging activities.
Phosphorus Spring total phosphorus concentrations in the Inner and Outer Harbour now reflect mesotrophic conditions (moderate phosphorus enrichment). Watershed levels continue to improve.
Bacteria Overall steady improvement in bacterial pollution of beaches. Eight of 11 beaches now meet Blue Flag criteria (high water quality). Levels at three waterfront beaches adjacent to watercourses do not meet the RAP target.
Heavy metals In the watersheds, levels of metals are not an issue at most sites. Some improvements have been observed in copper and lead concentrations in tributaries since 1999.
Persistent organic compounds
In the watersheds, levels of compounds such as PCBs and PAHs are typical of streams in urban areas, are strongly related to the amount of urbanization, and tend to be higher in wet weather conditions.
Chlorides Levels continue to increase in the watersheds. In some places, elevated concentrations are becoming a year-round issue. Increase in levels in Lake Ontario.
Aesthetics No longer an issue in the watersheds and waterfront of the Toronto RAP area, and is in the process of being re-designated to “not impaired.”
Table 17. Highlights of progress in key indicators of the Toronto and Region RAP. Credit: Kidd, 2015.
restore Toronto’s waters and fish and wildlife habi-tats and populations. Implementation of remedial and restoration actions has led to significant and demonstrable improvements in the quality of water and sediment, the amount and condition of terres-trial and aquatic habitats, and the health of aquatic biota and aquatic communities (Kidd, 2015). Table 17 presents highlights of progress on key indica-tors. Although much has been accomplished, there is still work to be done to meet the Toronto and Region RAP goal of completing restoration actions by 2025 to then delist as an AOC. Additional high-lights of achievements are presented below.
Pollution ControlControl of contaminants at their source has been a major priority through legislation, regulations, and voluntary, beyond-compliance initiatives. In addition, the City of Toronto has made significant progress in implementing the city’s Wet Weather Flow Master Plan (WWFMP). Since adoption of the master plan in 2003, the city has invested ap-proximately $485 million in wet weather flow man-agement projects. These projects improve water quality in Toronto’s watercourses and the shoreline along Lake Ontario, build resilience to reduce basement flooding risks associated with extreme
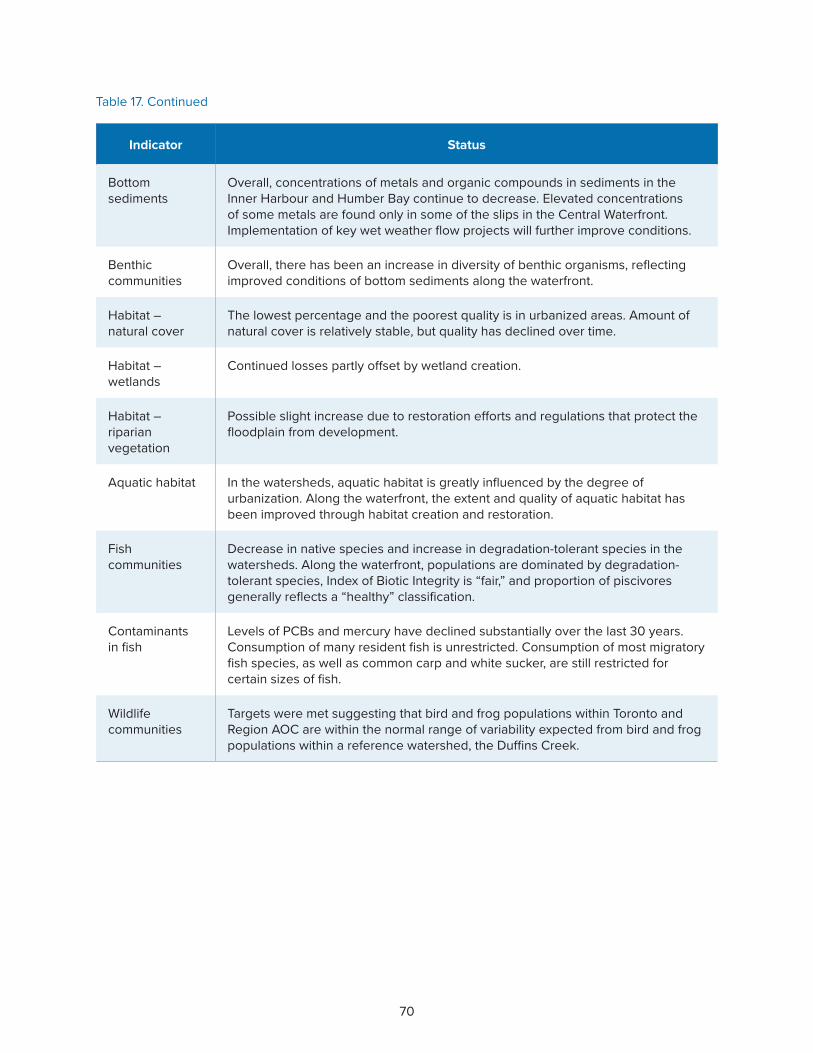
70
Indicator Status
Bottom sediments
Overall, concentrations of metals and organic compounds in sediments in the Inner Harbour and Humber Bay continue to decrease. Elevated concentrations of some metals are found only in some of the slips in the Central Waterfront. Implementation of key wet weather flow projects will further improve conditions.
Benthic communities
Overall, there has been an increase in diversity of benthic organisms, reflecting improved conditions of bottom sediments along the waterfront.
Habitat – natural cover
The lowest percentage and the poorest quality is in urbanized areas. Amount of natural cover is relatively stable, but quality has declined over time.
Habitat – wetlands
Continued losses partly offset by wetland creation.
Habitat – riparian vegetation
Possible slight increase due to restoration efforts and regulations that protect the floodplain from development.
Aquatic habitat In the watersheds, aquatic habitat is greatly influenced by the degree of urbanization. Along the waterfront, the extent and quality of aquatic habitat has been improved through habitat creation and restoration.
Fish communities
Decrease in native species and increase in degradation-tolerant species in the watersheds. Along the waterfront, populations are dominated by degradation-tolerant species, Index of Biotic Integrity is “fair,” and proportion of piscivores generally reflects a “healthy” classification.
Contaminants in fish
Levels of PCBs and mercury have declined substantially over the last 30 years. Consumption of many resident fish is unrestricted. Consumption of most migratory fish species, as well as common carp and white sucker, are still restricted for certain sizes of fish.
Wildlife communities
Targets were met suggesting that bird and frog populations within Toronto and Region AOC are within the normal range of variability expected from bird and frog populations within a reference watershed, the Duffins Creek.
Table 17. Continued

71
Construction of wetland at Embayment D, Tommy Thompson Park (left), and view of downtown Toronto through constructed habitat at Tommy Thompson Park (right). Credit: Toronto and Region Conservation Authority.
storms, and restore and protect watercourses from future erosion, which supports ecosystem health. Toronto Water’s 10-Year Capital Plan (2016–2025) identifies almost $2.8 billion for the implementa-tion of WWFMP projects over the next 10 years.
The city completed an environmental assess-ment study for the Don River and Central Water-front Project in 2012 to address recommendations from the WWFMP related to management of combined sewer overflows (CSOs). The project in-tegrates wet weather flow management systems to capture and treat stormwater discharges and CSOs from all the combined sewer outfalls to the Lower Don River, Taylor-Massey Creek (a tributary to the Don River), and Toronto’s Inner Harbour (Snod-grass et al., 2018). The project consists of three integrated tunnels (14 miles [22 kilometers] in total) connected to 12 underground vertical stor-age shafts, 27 connections to outfalls, seven off-line storage tanks, an integrated pumping station at the Ashbridges Bay Wastewater Treatment Plant, and a new wet weather flow, high-rate treatment facility to be built on a future landform project south of Ashbridges Bay. The project will also help service
future growth and provide redundancy for the Coxwell Sanitary Trunk Sewer.
This $2 billion project is being implemented in stages over 25 years. Once it has been fully imple-mented, it will virtually eliminate the release of CSO discharges into the Don River, Taylor Massey Creek, and Toronto’s Inner Harbour, as well as reduce polluted stormwater discharges. It will also reduce the associated loadings of nutrients, suspended solids, and associated heavy metals. The ultimate impact of this project on improved water quality in these waterbodies will be signifi-cant and will also contribute to improved aquatic recreational uses and fish habitat. Progress on this project includes completion of preliminary design for the system of tunnels, shafts, and off-line stor-age tanks in 2015. Construction of the first phase, the Coxwell Bypass, started in 2018 and will take seven years to complete.
Habitat RestorationHabitat rehabilitation and enhancement has been a long-standing priority of the Toronto and Region RAP with more than $80 million invested since
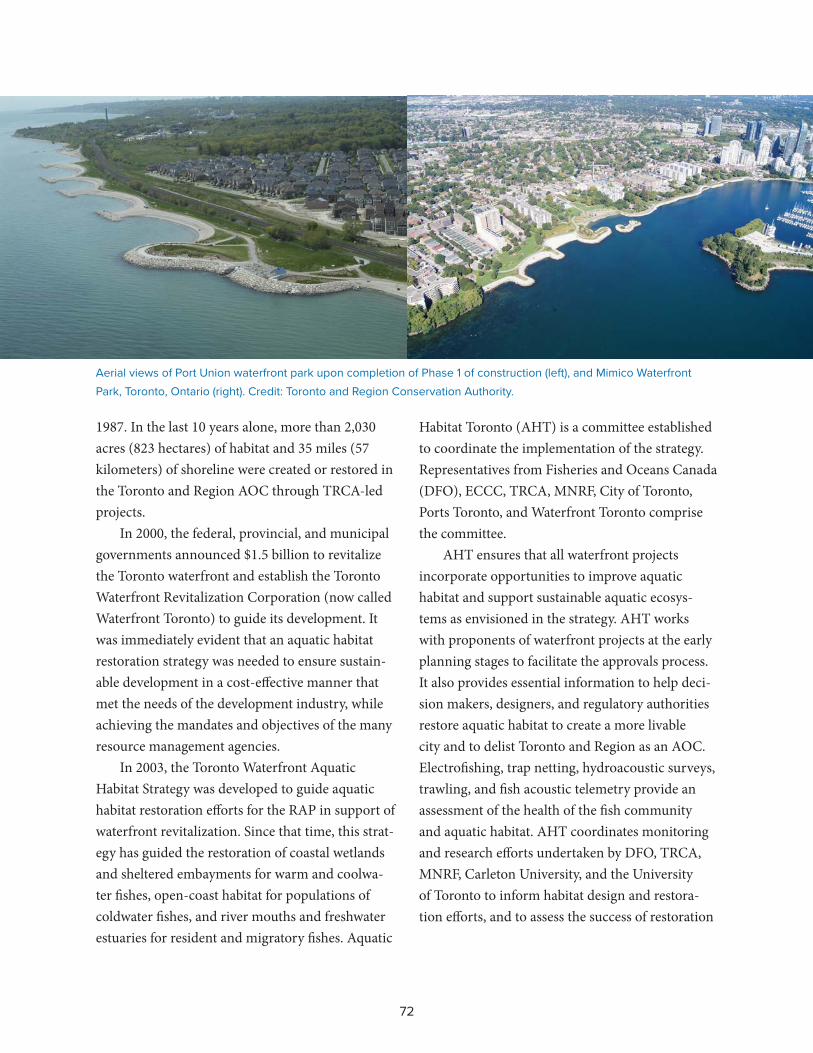
72
Aerial views of Port Union waterfront park upon completion of Phase 1 of construction (left), and Mimico Waterfront Park, Toronto, Ontario (right). Credit: Toronto and Region Conservation Authority.
1987. In the last 10 years alone, more than 2,030 acres (823 hectares) of habitat and 35 miles (57 kilometers) of shoreline were created or restored in the Toronto and Region AOC through TRCA-led projects.
In 2000, the federal, provincial, and municipal governments announced $1.5 billion to revitalize the Toronto waterfront and establish the Toronto Waterfront Revitalization Corporation (now called Waterfront Toronto) to guide its development. It was immediately evident that an aquatic habitat restoration strategy was needed to ensure sustain-able development in a cost-effective manner that met the needs of the development industry, while achieving the mandates and objectives of the many resource management agencies.
In 2003, the Toronto Waterfront Aquatic Habitat Strategy was developed to guide aquatic habitat restoration efforts for the RAP in support of waterfront revitalization. Since that time, this strat-egy has guided the restoration of coastal wetlands and sheltered embayments for warm and coolwa-ter fishes, open-coast habitat for populations of coldwater fishes, and river mouths and freshwater estuaries for resident and migratory fishes. Aquatic
Habitat Toronto (AHT) is a committee established to coordinate the implementation of the strategy. Representatives from Fisheries and Oceans Canada (DFO), ECCC, TRCA, MNRF, City of Toronto, Ports Toronto, and Waterfront Toronto comprise the committee.
AHT ensures that all waterfront projects incorporate opportunities to improve aquatic habitat and support sustainable aquatic ecosys-tems as envisioned in the strategy. AHT works with proponents of waterfront projects at the early planning stages to facilitate the approvals process. It also provides essential information to help deci-sion makers, designers, and regulatory authorities restore aquatic habitat to create a more livable city and to delist Toronto and Region as an AOC. Electrofishing, trap netting, hydroacoustic surveys, trawling, and fish acoustic telemetry provide an assessment of the health of the fish community and aquatic habitat. AHT coordinates monitoring and research efforts undertaken by DFO, TRCA, MNRF, Carleton University, and the University of Toronto to inform habitat design and restora-tion efforts, and to assess the success of restoration

73
The Simcoe Wavedeck next to the Martin Goodman Trail and Queens Quay Boulevard. Credit: Waterfront Toronto.
projects in improving fish and wildlife habitat and populations.
Major habitat projects completed under this strategy restored 56 acres (23.8 hectares) of coastal wetlands; 2.8 miles (4.5 kilometers) of open-coast shoreline; 6 acres (2.5 hectares) of sheltered em-bayments; and 1.2 miles (1.9 kilometers) of river shoreline. These efforts were carried out at Tommy Thompson Park, Toronto Island Wetlands, Port Union shoreline, Mimico Linear Waterfront Park, Humber Marshes, Long Pond shoreline, Outer Harbour shoreline, West Shore, and numerous cen-tral waterfront fish habitat creation projects.
In 2011, the federal government announced that Rouge Park was to become Canada’s first national urban park. The Rouge Park is rich in natural, cultural, and agricultural features, includ-ing 1,700 species of plants and animals, more than 10,000 years of human history, and some of the rarest and best remaining wetlands, forests, and agricultural lands in the Greater Toronto Area. It contains working farms, Carolinian forests, one of the region’s largest wetlands, unspoiled beaches, ki-lometers of hiking trails, and the city’s only camp-ground. Once fully established, Rouge National Urban Park will be more than 30 square miles (79 square kilometers) in size – some 22 times the size
of Central Park in New York – making it one of the largest and best-protected urban parks of its kind in the world. In 2015, the federal government announced it was committed to expanding the park by more than 36 percent with the addition of eight square miles (21 square kilometers) of lands. Federal investment in Rouge National Park is pro-jected to be $100 million.
In 2017, federal, provincial, and municipal governments announced $1.25 billion for the Port Lands Flood Protection and Don River Mouth Naturalization Project to revitalize Toronto’s east-ern waterfront. This effort adds to the flood protec-tion landform completed in 2012. In the early 20th century, Toronto’s Ashbridges Bay Marsh was filled to create the Port Lands, and the mouth of the Don River was straightened to form the Keating Channel. The loss of this 1,058-acre (428-hect-are) coastal marsh negatively impacted flooding, aquatic habitat, and fish and wildlife diversity and abundance, contributing to Toronto being listed as an AOC.
This project will construct a new naturalized river mouth through the Port Lands, creating a new urban island neighborhood called Villiers Island. The river valley will add 40 acres (16 hect-ares) of new parkland, promenades, and riverfront

74
Revitalized Queens Quay Boulevard along Toronto’s waterfront. Credit: Waterfront Toronto.
open space. In addition, the river valley will have 39.5 acres (14 hectares) of new aquatic habitat and wetlands to improve biodiversity and water quality and to naturally moderate the effects of flooding and erosion. In addition to the social and environmental benefits derived from the project, an economic impact study (urbanMetrics, 2013) estimated that spending on construction would generate approximately $1.1 billion in value to the Canadian economy, 10,829 person-years of em-ployment, and $373 million in tax revenues to all levels of government.
In addition to the projects above, many of the improvements in the Toronto and Region AOC are attributable to the implementation of larger programs that support RAP objectives. Many of these programs are long-term, multiagency, and strategic, working on a prioritized implementa-tion basis. A few examples are TRCA’s waterfront
development program and erosion control and risk management program and long-term water quality monitoring programs of the ECCC, MECP, TRCA and city, as well as the city’s ravine, parklands, and biodiversity strategies that aim to showcase and improve public literacy around urban biodiversity.
Economic Benefits of Toronto Waterfront Revitalization Historically, Toronto’s waterfront was underused and unappreciated; however, it is rapidly becom-ing a priceless public asset accessible to everyone. Through an inclusive process, Waterfront Toronto is rethinking, reimagining, and redefining what its waterfront should be. It believes that revitalizing Toronto’s waterfront represents an unparalleled opportunity to reestablish positive, meaningful relationships with Lake Ontario and to transform underused lands into vibrant public and cultural

75
Water park – Corktown Common in the West Don Lands. Credit: Waterfront Toronto.
spaces for all Torontonians. Waterfront Toronto’s mandate is to deliver a revitalized waterfront that brings together the most innovative approaches to sustainable urban development, excellence in urban design, real estate development, and leading technology infrastructure.
Working with the community and with public- and private-sector partners, Waterfront Toronto creates complete neighborhoods anchored by parks and public spaces, and diverse, sustainable, mixed-use communities that offer a high quality of life for residents, employees, and visitors alike. This waterfront transformation is being under-taken for the use and enjoyment of the people of Toronto and across Canada, to foster economic growth, and to redefine how the city, province, and country are perceived by the world. Water-front Toronto has worked synergistically with the Toronto and Region RAP to restore and sustain a vibrant ecosystem that provides environmental,
social, and economic benefits to local communities and visitors.
As part of an effort to measure economic ef-fectiveness, Waterfront Toronto commissioned ur-banMetrics (2013) to undertake extensive analyses of the economic and fiscal benefits stimulated by the organization’s investment in Toronto’s water-front and an update for its 2018 Corporate Social Responsibility & Sustainability Report. As part of these analyses, urbanMetrics quantified that Wa-terfront Toronto invested $1.6 billion on waterfront planning and implementation since the organiza-tion’s inception in 2001 through March 2017. A review of Waterfront Toronto’s historic expenditure patterns was undertaken, based on the 2007 North American Industrial Classification System. Once classified, the $1.6 billion of investments were ana-lyzed using an urbanMetrics Input-Output model, which simulates the flow of Waterfront Toronto’s initial expenditures through the economy. This
76
model has been specifically designed to provide a reliable measure of the impact of the organization’s expenditures on job creation, incomes, value added to the economy, and taxes and other government revenues.
When adjusted for inflation, Waterfront To-ronto’s $1.6 billion investment equals approximate-ly $1.9 billion in 2016 dollars. This investment will
• Generate approximately 14,100 full-time years of employment, of which approxi-mately 88.5 percent are in the City of To-ronto (the majority of the jobs created are in the construction sector, the finance, insurance, real estate, and renting and leas-ing sector, and the professional, scientific, and technical services sector);
• Stimulate $4.1 billion in total economic output to the Canadian economy (the ma-jority of this economic growth will accrue in the City of Toronto); and
• Generate total government revenues of approximately $848 million, with $394 million to the federal government, $243 million to the provincial government, and $162 million to the City of Toronto.
Although Toronto Waterfront’s expenditures are significant, they are relatively small compared
to the recurring benefits that result. These include permanent jobs, property taxes, income taxes, and tourism spending that will be experienced with the continued development of new office, residential, retail/service commercial, cultural, and entertain-ment uses along the city’s waterfront, which would not occur without the initial investments by Water-front Toronto.
Clearly, Waterfront Toronto has played a significant role in creating economic value in the Toronto waterfront. Interviews with Toronto’s development community confirmed that if it were not for the planning, land assembly, remediation, and infrastructure improvements by Waterfront Toronto, many parts of the waterfront would continue to languish as vacant and underutilized brownfield sites (urbanMetrics, 2013). Whereas the above impacts related to Waterfront Toronto’s direct spending on planning and infrastructure, urbanMetrics also quantified benefits accruing to private- and public-sector real estate projects both on lands controlled by Waterfront Toronto and other privately owned land on the waterfront. For example, the combined development on East Bayfront and West Don lands, and the adjoining neighborhoods, will generate nearly 207,900 years of employment, add $13.8 billion to the Canadian economy, and provide $7.5 billion in tax revenues to the three levels of government (Table 18).
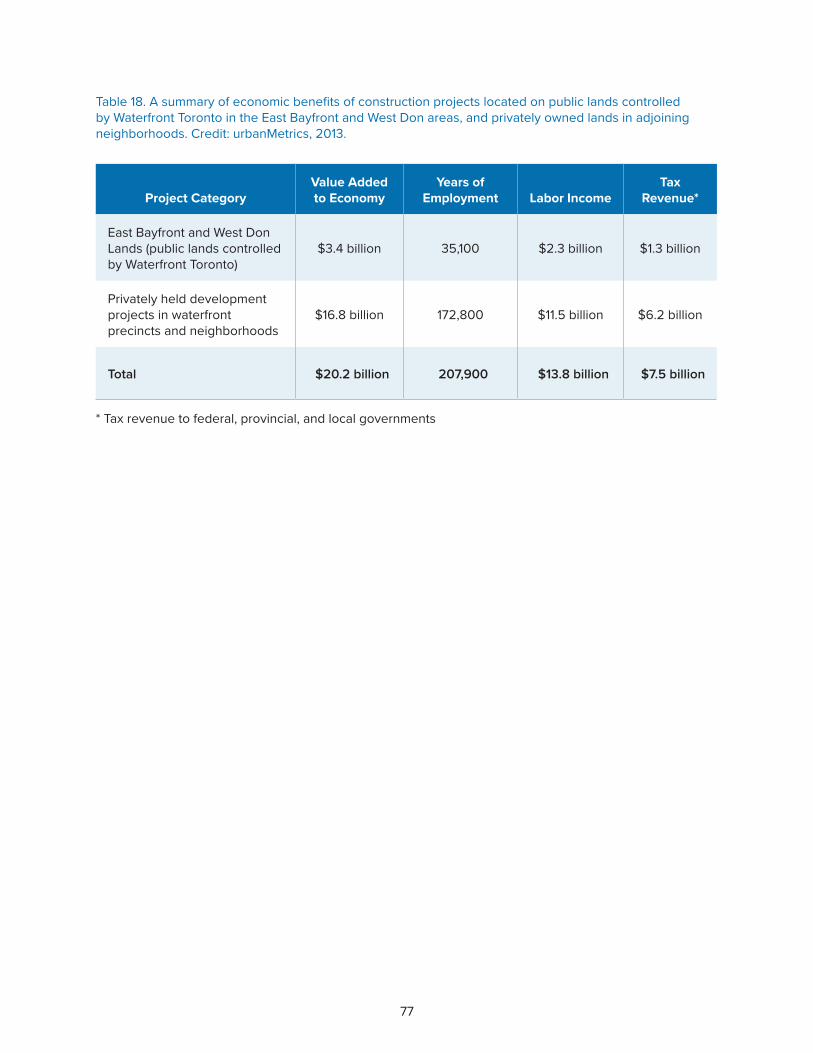
77
Project CategoryValue Added to Economy
Years of Employment Labor Income
Tax Revenue*
East Bayfront and West Don Lands (public lands controlled by Waterfront Toronto)
$3.4 billion 35,100 $2.3 billion $1.3 billion
Privately held development projects in waterfront precincts and neighborhoods
$16.8 billion 172,800 $11.5 billion $6.2 billion
Total $20.2 billion 207,900 $13.8 billion $7.5 billion
Table 18. A summary of economic benefits of construction projects located on public lands controlled by Waterfront Toronto in the East Bayfront and West Don areas, and privately owned lands in adjoining neighborhoods. Credit: urbanMetrics, 2013.
* Tax revenue to federal, provincial, and local governments


79
WORKING IN THE TRENCHES of ecosystem-based watershed manage-ment is a challenging puzzle requir-
ing a marathoner’s discipline and perseverance. Yet the people in the 43 Great Lakes AOCs had a strong incentive to come together to clean up their communities over the past few decades. By study-ing their efforts, we can learn about the approaches that worked and didn’t work. We also can see how these efforts have paid off in the form of prevent-ing pollution, restoring habitat for fish and wildlife, cleaning up contaminated sediment, and creating vibrant waterfronts that connect people to the water. Just as important for long-term success, a spirit and practice of col-laboration has emerged in these communities. This approach required networks of multiple groups and interests that coordinated their efforts to best support the com-mon good. The successes illustrated in the 10 case studies not only make a case for continued sup-port to finish cleaning up the AOCs, they also demonstrate approaches that other waterfront communities can consider in shaping their own collaborative efforts.
Committing for the Long RunIt took nearly two centuries to reach the state of pollution found in the AOCs in 1985. Restoring
these spots is no quick task either, considering the time it takes to build trust among stakeholders, reach agreement on problems, identify and select remedial and preventive actions, and secure fund-ing for implementation, especially given all the competing interests for funding.
Initially, progress was slow because of the need to reach agreement on the severity and geographic extent of the problems identified in 1985; employ an ecosystem approach and involve stakeholders; align management programs; and secure commit-ments for implementation. Other factors included
limited federal, state, and provincial funding for RAPs (Krantzberg, 2003; Botts and Muldoon, 2005), decline in the ef-fectiveness of Internation-al Joint Commission over-sight (Botts and Muldoon, 2005), and a governmen-tal “reluctance” to accept responsibility for fulfilling obligations under the Great Lakes Water Qual-ity Agreement (GAO, 2003; GAO, 2009). In the United States, the rate of sediment remediation and
habitat restoration, beneficial use restoration, and the removal of AOC designations has accelerated since the Great Lakes Legacy Act and GLRI pro-grams were initiated in 2002 and 2010, respectively (U.S. Great Lakes Interagency Task Force, 2017), demonstrating that funding commitments are an important component of the RAP program suc-
LESSONS LEARNEDCHAPTER 12
The successes illustrated ... not only make a case for continued support to finish cleaning up the AOCs, they also demonstrate approaches that other waterfront communities can consider in shaping their own collaborative efforts.
80
cesses. Funding uncertainties in both the United States and Canada jeopardize continued progress in these important programs.
As of 2018, seven AOCs have been delisted, two have been designated as Areas of Concern in Recovery (i.e., an area where, based on community and government consensus, all scientifically feasi-ble and economically reasonable actions have been implemented and additional time is required for the environment to recover), and six have imple-mented all remedial actions deemed necessary for use restoration. In addition, 75 of 146 known use impairments identified in Canadian AOCs and 73 of 255 in the United States have been eliminated (see Appendix 1 for more information on benefi-cial use impairments). Despite this progress, much remains to be done to restore all impaired uses in these communities and remove them from the list of AOCs. Successful RAPs have been cleanup- and prevention-driven; made existing programs and statutes work; established priorities on a local basis and worked to elevate those priorities within state, provincial, and federal governments; ensured strong community-based planning processes; streamlined decision making for use restoration; and been affirming processes (Hartig, 1997).
Engaging and Empowering the CommunityRAPs called for involving the public through use of an ecosystem approach that accounts for the inter-relationships among water, air, land, and all living things, including humans, and involves all user groups in managing their communities’ waterways (Vallentyne and Beeton, 1988; Hartig and Vallen-tyne, 1989). This helped bring together stakehold-ers representing environmental, economic, and social interests to form cleanup coalitions. RAPs challenged governments and other stakeholders to transform management (McLaughlin and Krantz-berg, 2018).
This commitment to an ecosystem approach and stakeholder involvement led to the estab-lishment of a variety of institutional structures, including public advisory councils or committees (PACs), stakeholder groups, basin committees, and others. No single best structure emerged to foster an ecosystem approach in RAP development and implementation. It is fair to say that there were 43 locally designed ecosystem approaches that helped involve stakeholders in a meaningful way, foster cooperative learning, share decision making, and ensure local ownership. Indeed, Beeker et al., (1991) identified that structuring the process to create a sense of ownership of the RAP by partici-pants, who were the very businesses, state and local agencies, and citizens who would have to carry out the recommendations, was a critical factor in RAP acceptance by all involved. Essential elements that characterize successful initiatives include true participatory decision making, a clearly articulated and shared vision, and focused and deliberate leadership (Krantzberg, 2003). Finally, use of an ecosystem approach, by nature, is adaptive, where assessments are made, priorities established, and actions taken in an iterative fashion for continuous improvement.
A key concept in RAP processes has been accountability for action. This accountability is established through open sharing of information, clear definition of problems and causes, agree-ment on remedial and preventive actions needed, and identification of who is responsible for taking actions. From this foundation, the responsible in-stitutions and individuals can be held accountable for progress. Indeed, increasing accountability was one RAP tenet identified in the 1987 Protocol to the Great Lakes Water Quality Agreement (Canada and the U.S., 1987).
RAPs have also required cooperative learn-ing that involves stakeholders working in teams to accomplish a common goal under conditions that

81
AOC RAP Institutional Structures
Buffalo River (New York)
From 1985 through the early 2000s, public involvement was achieved through a Remedial Advisory Committee. In 2003, the Buffalo Niagara Waterkeeper became the first, Great Lakes, nonprofit organization to re-energize the RAP process, coordinate/catalyze implementation, and ensure life after delisting.
Collingwood Harbour (Ontario)
A PAC was established in 1987 to ensure public input in the RAP and foster use of an ecosystem approach. The PAC was incorporated in 1993 as The Environment Network of Collingwood, later named The Environment Network. The Network developed a strategic plan (Greening of Collingwood) that championed pollution prevention and today continues to operate as a cooperative championing sustainability beyond the boundaries of Collingwood Harbour.
Cuyahoga River (Ohio)
In 1988, the Ohio EPA appointed a 33-member committee to develop the RAP. In 1989, the nonprofit Cuyahoga River Community Planning Organization (later renamed Cuyahoga River Restoration) was created to support RAP activities. Today, Cuyahoga River Restoration continues to support efforts to restore, revitalize, and protect the watershed and nearshore area of Lake Erie.
Detroit River (Michigan/Ontario)
A Binational Public Advisory Council (BPAC) was established in 1987 for public involvement in the RAP. It became paralyzed by lack of trust and ineffective governance and split apart into separate U.S. and Canadian public involvement processes. In 1991, the Detroit River Public Advisory Council (PAC) was established in the U.S. to coordinate the RAP, with assistance from Friends of the Detroit River. Today, the PAC continues to facilitate public participation and assist with implementation and periodically participates in Canadian RAP meetings led by the Detroit River Canadian Cleanup. Other nonprofits playing key roles include the Detroit Riverfront Conservancy and the International Wildlife Refuge Alliance.
Hamilton Harbour (Ontario)
In 1985, a Hamilton Harbour Stakeholder Group was established to ensure RAP public participation and use of an ecosystem approach. A scientific Writing Team prepared RAP reports. The Stakeholder Group and the Writing Team worked by consensus. Upon completion of the Stage 2 RAP in 1992, the Stakeholder Group disbanded and established two groups to take its place; the Bay Area Implementation Team (BAIT) and the Bay Area Restoration Council (BARC). BAIT includes all the agencies and organizations who accepted implementation responsibilities. BARC is an independent incorporated citizens group responsible for monitoring remedial progress and charged with education and advocacy. BAIT and BARC are equal partners in restoration of Hamilton Harbour as a thriving, healthy, and accessible Great Lakes ecosystem.
Table 19. RAP institutional structures to help achieve public involvement, implement an ecosystem approach, and build capacity for implementation of remedial and preventive actions.
involve positive interdependence (i.e., all stake-holders cooperate to complete a task) and individ-ual and group accountability (i.e., each stakeholder is accountable for the final outcome) (Hartig et al., 1998).
The 10 AOC case studies presented in this report show the value of using an ecosystem ap-proach (Table 19). Use of locally defined ecosystem approaches helps in the following ways:
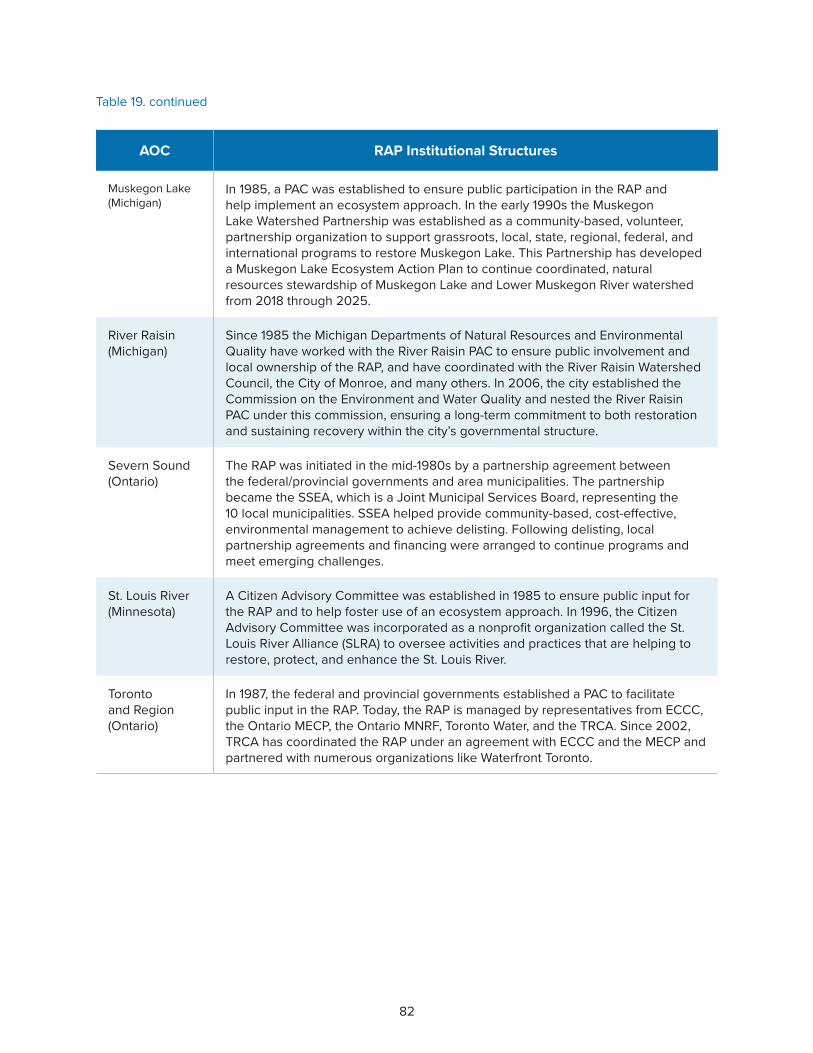
82
AOC RAP Institutional Structures
Muskegon Lake (Michigan)
In 1985, a PAC was established to ensure public participation in the RAP and help implement an ecosystem approach. In the early 1990s the Muskegon Lake Watershed Partnership was established as a community-based, volunteer, partnership organization to support grassroots, local, state, regional, federal, and international programs to restore Muskegon Lake. This Partnership has developed a Muskegon Lake Ecosystem Action Plan to continue coordinated, natural resources stewardship of Muskegon Lake and Lower Muskegon River watershed from 2018 through 2025.
River Raisin (Michigan)
Since 1985 the Michigan Departments of Natural Resources and Environmental Quality have worked with the River Raisin PAC to ensure public involvement and local ownership of the RAP, and have coordinated with the River Raisin Watershed Council, the City of Monroe, and many others. In 2006, the city established the Commission on the Environment and Water Quality and nested the River Raisin PAC under this commission, ensuring a long-term commitment to both restoration and sustaining recovery within the city’s governmental structure.
Severn Sound (Ontario)
The RAP was initiated in the mid-1980s by a partnership agreement between the federal/provincial governments and area municipalities. The partnership became the SSEA, which is a Joint Municipal Services Board, representing the 10 local municipalities. SSEA helped provide community-based, cost-effective, environmental management to achieve delisting. Following delisting, local partnership agreements and financing were arranged to continue programs and meet emerging challenges.
St. Louis River (Minnesota)
A Citizen Advisory Committee was established in 1985 to ensure public input for the RAP and to help foster use of an ecosystem approach. In 1996, the Citizen Advisory Committee was incorporated as a nonprofit organization called the St. Louis River Alliance (SLRA) to oversee activities and practices that are helping to restore, protect, and enhance the St. Louis River.
Toronto and Region (Ontario)
In 1987, the federal and provincial governments established a PAC to facilitate public input in the RAP. Today, the RAP is managed by representatives from ECCC, the Ontario MECP, the Ontario MNRF, Toronto Water, and the TRCA. Since 2002, TRCA has coordinated the RAP under an agreement with ECCC and the MECP and partnered with numerous organizations like Waterfront Toronto.
Table 19. continued
83
• increasing public awareness and under-standing of problems and opportunities;
• fostering cooperative decision making and creative problem solving (e.g., capacity building);
• achieving local ownership; • gaining support for implementation of
necessary remedial and preventive actions;• catalyzing waterfront revitalization; and • ensuring a long-term institutional com-
mitment to a healthy environment, com-munity, and economy.
It should also be noted that use of an ecosys-tem approach in restoring AOCs, as demonstrated in RAP institutional arrangements presented in Table 19, is critically important in developing an ecosystem ethic that sees humans as part of a com-munity of interdependent parts. This is an impor-tant component in building a viable community in support of stewardship and sustainability of the Great Lakes.
Cleaning up the Legacy of Toxic Substances in SedimentOver many decades, toxic substances like heavy metals and organochlorine compounds were released into waterways and eventually accu-mulated in high concentrations in river, harbor, and embayment sediment. This buildup of toxic substances contributed to health advisories on fish, impacts on invertebrate life living in sediment, loss of habitat, restrictions on dredging activities, and more. Clearly, contaminated sediment was a major problem, yet there were no comprehensive federal, state, or provincial programs to address it. Dredging for navigational purposes was the primary means for addressing this problem at that time. Governments and RAP groups quickly discovered that the severity and geographic extent
of the contaminated sediment problem was not well understood, nor was the relative importance of contaminated sediment in causing specific use impairments. In addition, stakeholders lacked a basis for determining how much sediment to clean up and what environmental/ecological improve-ments to expect over time.
Governments, research scientists, and RAP groups had to figure out how to make decisions (e.g., on the severity and geographic extent of sedi-ment contamination, on whether or not to reme-diate, on what techniques to use) and how to get the money to remediate sediment, if necessary. In many respects, both the Canadian and U.S. con-taminated sediment assessment and remediation programs came out of the RAP program.
To effectively address contaminated sediment at Canadian AOCs, the Canada-Ontario Agree-ment on Great Lakes Water Quality and Ecosystem Health’s Sediment Assessment Decision-Making Framework was created in the early 1990s. This was a step-by-step guidance for an ecosystem ap-proach to assess the risk of contaminated sediment. There have been nine Canadian AOCs where ac-tive remediation has been completed and the sites restored; however, additional work is still required at some AOCs where multiple sites require reme-diation. Remediation is currently ongoing or in the planning stages in three AOCs. One of those sites is Randle Reef in Hamilton Harbour, the larg-est Canadian contaminated sediment site in the Great Lakes. Remediation there is expected to cost approximately $139 million (Canadian). When completed, it is expected that water quality will improve, current restrictions on navigation will be removed, and economic returns will be generated through the creation of valuable port lands. Penin-sula Harbour, a mercury- and PCB-contaminated site in Canadian waters of Lake Superior, was

84
AOC Contaminated Sediment Remediation Costs (as of 2018)
Buffalo River (New York) $56.5 million (U.S.)
Collingwood Harbour (Ontario) $1.2 million (Canadian)
Cuyahoga River (Ohio) None has occurred yet, but will in the future
Detroit River (Michigan/Ontario)
$52 million (U.S.) in the United States and $2.65 million (Canadian) in Canada thus far
Hamilton Harbour (Ontario) $279 million (Canadian)
Muskegon Lake (Michigan) $42 million (U.S.)
River Raisin (Michigan) $43.1 million (U.S.)
Severn Sound (Ontario) None reported
St. Louis River (Minnesota) $158.6 million (U.S.) in Duluth, Minnesota and Superior, Wisconsin thus far
Toronto and Region (Ontario) None reported
Table 20. Contaminated sediment remediation costs in the 10 AOC case studies.
remediated in 2012 with the placement of the first thin layer cap. Four additional AOCs will likely continue with controlling contaminants at their source and leaving contaminated sediments in place and allowing clean sediments, over time, to effectively bury contaminated sediments; a process called monitored natural recovery.
In the United States, the U.S. Environmental Protection Agency created the Assessment and Remediation of Contaminated Sediment (ARCS) Program in the early 1990s to measure sediment contamination at chosen sites, recommend ap-proaches both to evaluate the effects of these contaminants on aquatic life and to assess risks to wildlife and human health posed by the contami-nants, and test technologies that could be used to clean up contaminated sediments. Although the ARCS program significantly added to the scien-
tific understanding of sediment assessment and remediation techniques, federal and state enforce-ment programs were primarily responsible for progress in remediating contaminated sediment in AOCs. The sediment remediation funding short-fall was then filled by the Great Lakes Legacy Act and GLRI. In total, between 2004 and 2017, U.S. federal, state, and other partners have completed 46 contaminated sediment remediation projects in U.S. AOCs, resulting in the remediation of more than 6.6 million cubic meters of contaminated sediment at a cost of $1 billion (U.S.) (Tuchman et al., 2018).
Of the 10 case studies, only seven AOCs had contaminated sediments requiring remediation (Table 20). Three AOCs either did not have con-taminated sediment problems or they have yet to be addressed. In total, $355 million (U.S.) has

85
been spent thus far on remediating contaminated sediments in five U.S. AOC case studies, and $280 million (Canadian) has been spent on remediat-ing contaminated sediment in two Canadian AOC case studies. In each of the seven AOC case studies, contaminated sediment remediation was an es-sential part of cleanup and restoration of impaired beneficial uses.
Giving Habitat a Home through RAPsLoss of fish and wildlife habitat is a common prob-lem in most AOCs. Prior to the onset of RAPs, it was often said that “habitat had no home.” Respon-sibility for habitat was fragmented among many stakeholders. RAPs made habitat a priority and challenged management agencies to address it ex-plicitly. Restoration of fish and wildlife habitat had to be addressed in a systematic and comprehensive fashion, which was particularly challenging in urban AOCs. In many cases, RAPs helped make sure that habitat was an integral part of community master plans. Early involvement of habitat experts in project planning and partnerships was essential to habitat project success.
As a result of this focus, considerable habitat rehabilitation has been undertaken in AOCs. For example, early efforts in the late 1980s and 1990s focused on the scientific assessment of “loss of fish and wildlife habitat” and its causes through RAP development. Later efforts focused on restora-tion options and determining how much habitat was enough to remove it as a use impairment. In general, limited habitat restoration occurred in U.S. AOCs until the GLRI provided significant resourc-es. Between 2011 and March 2018, more than $280 million (U.S.) from the GLRI alone was spent on habitat restoration in U.S. AOCs, with many proj-ects still in the design phase (Hartig et al., 2018b). These substantial financial resources clearly accel-erated habitat restoration in U.S. AOCs.
In Canada, restoration of fish and wildlife habitat in AOCs has been a priority since the onset of RAPs. The development and implementation of Natural Heritage strategies to conserve biodiver-sity, as well as fish and wildlife management plans, were pioneered in AOCs. The RAP program also developed, demonstrated, and evaluated habitat restoration techniques. Since 1989, more than $500 million (Canadian) has been spent on habitat res-toration in Canadian AOCs (Hartig et al., 2018a).
Restoring fish and wildlife habitat was an es-sential component of RAPs in each of the 10 case studies, with more than $129 million (Canadian) and more than $176 million (U.S.) spent thus far (Table 21).
One good example is in the Toronto and Region RAP where more than $80 million (Ca-nadian) has been invested since 1987, including restoring more than 2,030 acres (823 hectares) of habitat and 35 miles (57 kilometers) of shoreline by TRCA in the last 10 years alone. In 2017, federal, provincial, and municipal governments announced $1.25 billion (Canadian) for the Port Lands Flood Protection and Don River Mouth Naturalization Project to revitalize Toronto’s eastern waterfront. In the early 20th century, Toronto’s Ashbridges Bay Marsh was filled to create the Port Lands, and the mouth of the Don River was straightened to form the Keating Channel. The loss of this 1,058-acre (428-hectare) coastal marsh negatively impacted flooding, aquatic habitat, and fish and wildlife diversity and abundance, contributing to Toronto being listed as an AOC. This project will construct a new naturalized river mouth through the Port Lands, creating a new urban island neighborhood called Villiers Island. The river valley will add 40 acres (16 hectares) of new parkland, promenades, and riverfront open space. In addition, the river valley will have 39.5 acres (14 hectares) of new aquatic habitat and wetlands to improve biodiver-

86
AOC Habitat Restoration
Buffalo River (New York)
Since 2012, numerous partners have restored nearly two miles (3.2 kilometers) of shoreline and 20 acres (8.1 hectares) of habitat through GLRI at a cost of more than $25 million (U.S.)
Collingwood Harbour (Ontario)
The RAP protected the 237-acre (96-hectare) Collingwood Wetland Complex, controlled invasive purple loosestrife in wetlands, and rehabilitated fish and wildlife habitat in the harbor and watershed, including Black Ash Creek at a cost of $380,000 (Canadian)
Cuyahoga River (Ohio)
Under the GLRI, more than $9 million (U.S.) of habitat restoration and enhancement was completed within the AOC, including restoration of wetlands and shoreline habitat, control of invasive species, and enhancement of riparian habitats
Detroit River (Michigan/Ontario)
Over $48.9 million (U.S.) of habitat restoration has occurred on the U.S. side of the river, with over $9 million (Canadian) of habitat restoration on the Canadian side
Hamilton Harbour (Ontario)
Since 1990, $40.2 million (Canadian) has been spent on fish and wildlife habitat restoration and enhancement
Muskegon Lake (Michigan)
Under the GLRI, more than $22 million (U.S.) was spent on restoration and enhancement of wetland, open water, shoreline, and riparian habitats
River Raisin (Michigan)
Under the GLRI, more than $7 million (U.S.) was spent on habitat restoration and dam removal to open the river an additional 23 miles for fish migration and spawning
Severn Sound (Ontario)
Over $9 million (Canadian) was spent on restoring environmental quality, including conservation agreements and wetland rehabilitation projects that protected 1,015 acres (411 hectares) of wetlands and associated uplands, and projects that created vegetative buffer strips that linked habitat nodes
St. Louis River (Minnesota)
More than $65 million (U.S.) was spent on restoration and conservation of habitats
Toronto and Region (Ontario)
More than $80 million (Canadian) was invested in habitat restoration and enhancement since 1987
Table 21. A summary of habitat restoration efforts in the 10 AOC case studies.

87
Table 22. A summary of economic benefits resulting from the cleanup and restoration of 10 AOCs in the United States and Canada.
AOC Economic Benefits
Buffalo River (New York)
Cleaning up the Buffalo River has spurred improving public access that has contributed to waterfront economic revitalization, including more than $428 million (U.S.) of waterfront development between 2012 and 2018.
Collingwood Harbour (Ontario)
The cleanup of Collingwood Harbour catalyzed the transformation of its over 100-year-old shipyards into a mixed-use waterfront community with more than 600 homes, a waterfront promenade and park, a community amphitheater, and hiking trials that will link to the Georgian Trail. A municipal fiscal impact analysis concluded that in five years there would be a net annual surplus of more than $900,000 (Canadian) to the Town of Collingwood.
Cuyahoga River (Ohio)
The cleanup of the Cuyahoga River has led to the transformation of the Cleveland Flats from the industrial heartland into a community where nature, commerce, and industry live together. Since 2012, the Flats has seen $750 million (U.S.) in economic development, with $270 million (U.S.) of new developments in the planning phase.
Detroit River (Michigan)
Cleanup of the Detroit River has led to transformation of the waterfront, including creating the 5.5-mile Detroit RiverWalk to improve public access. The investment of $80 million (U.S.) in building the Detroit RiverWalk in the first 10 years has returned over $1 billion (U.S.) of public and private sector investments.
Hamilton Harbour (Ontario)
Underway is the largest contaminated sediment remediation project in the Canadian Great Lakes in Hamilton Harbour’s Randle Reef at a cost of $139 million (Canadian). Local businesses are projected to realize by 2032 about $600 million (Canadian) in gross accumulated benefits with recreational users and the federal government realizing $496 million (Canadian) and $338 million (Canadian), respectively.
sity and water quality, and to naturally moderate the effects of flooding and erosion.
Revitalizing Waterfront CommunitiesTogether, pollution prevention, habitat restora-tion, contaminated sediment remediation, and other remedial and preventive actions have been a springboard for local communities to convert areas that were once a detriment to economic growth into valuable waterfront economic assets. Indeed, cleanup of AOCs is an integral and essential part
of waterfront community revitalization. Good ex-amples of where AOC cleanup has led to improved public waterfront access, followed by revitaliza-tion, include Buffalo River, Collingwood Harbour, Cuyahoga River, Detroit River, Hamilton Harbour, Muskegon Lake, River Raisin, Severn Sound, St. Louis River, and Toronto and Region (Table 22). These communities are literally transforming former polluted rivers and harbors in the indus-trial heartland into healthier and more attractive waterfront destinations for businesses, recreation, and tourism.

88
Table 22. Continued
AOC Economic Benefits
Muskegon Lake (Michigan)
In 2009, a $10 million (U.S.) restoration project was implemented along the south shore of Muskegon Lake, removing 24.7 acres of historical, unnatural fill, restoring 27 acres of wetlands, and softening 1.9 miles of shoreline. An economic benefits study found that this $10 million (U.S.) restoration project will generate nearly $60 million (U.S.) of economic benefits for the Muskegon area over a 20-year period, or a 6-to-1 return on investment.
River Raisin (Michigan)
The cleanup of the River Raisin has been an essential building block in the revitalization of Monroe. Monroe is now rebranding itself as a vibrant urban center with an ecologically significant river, significant historical assets, a new national park, a state park, and an international wildlife refuge within its city limits, all connected by greenway trails. The River Raisin National Battlefield Park annual attendance is projected to reach 635,000, improving the local and state economies by over $53 million (U.S.) annually.
Severn Sound (Ontario)
Total monetary value of RAP restoration projects implemented between 1991 and 2002 was estimated at $35.3 million (Canadian). Total implementation costs of restoration projects during the same time period was estimated at $2.16 million (Canadian). Every dollar spent on restoration would generate $16.34 (Canadian) in benefits, reflecting cost effectiveness of RAP restoration projects. These benefits were based on a 10-year life span, meaning they were only estimated for 10 years.
St. Louis River (Minnesota)
Environmental restoration and intentional planning have created better access to the waterfront and have drawn attention to the renewed resources through new developments and national recognition. New waterfront developments include a $34 million (U.S.) resort that converted a cement terminal into a luxury resort and a $38 million (U.S.) mixed-use housing development.
Toronto and Region (Ontario)
Decades of cleanup under the Toronto and Region RAP and collaborative planning have led to revitalization of Toronto’s waterfront with substantial economic and social benefits, including $4.1 billion (Canadian) in output to the Canadian economy, approximately $848 million (Canadian) in tax revenues, and about 14,100 years of employment.
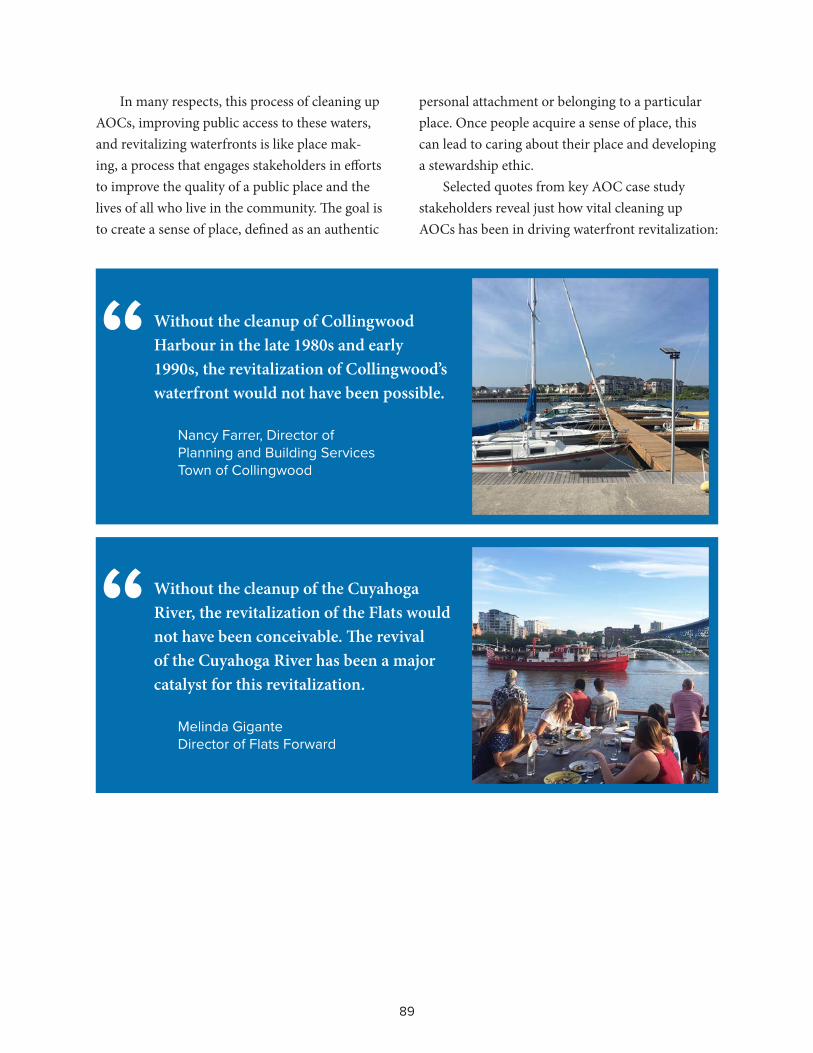
89
Without the cleanup of the Cuyahoga River, the revitalization of the Flats would not have been conceivable. The revival of the Cuyahoga River has been a major catalyst for this revitalization.
Melinda Gigante Director of Flats Forward
“
In many respects, this process of cleaning up AOCs, improving public access to these waters, and revitalizing waterfronts is like place mak-ing, a process that engages stakeholders in efforts to improve the quality of a public place and the lives of all who live in the community. The goal is to create a sense of place, defined as an authentic
personal attachment or belonging to a particular place. Once people acquire a sense of place, this can lead to caring about their place and developing a stewardship ethic.
Selected quotes from key AOC case study stakeholders reveal just how vital cleaning up AOCs has been in driving waterfront revitalization:
Without the cleanup of Collingwood Harbour in the late 1980s and early 1990s, the revitalization of Collingwood’s waterfront would not have been possible.
Nancy Farrer, Director of Planning and Building Services Town of Collingwood
“
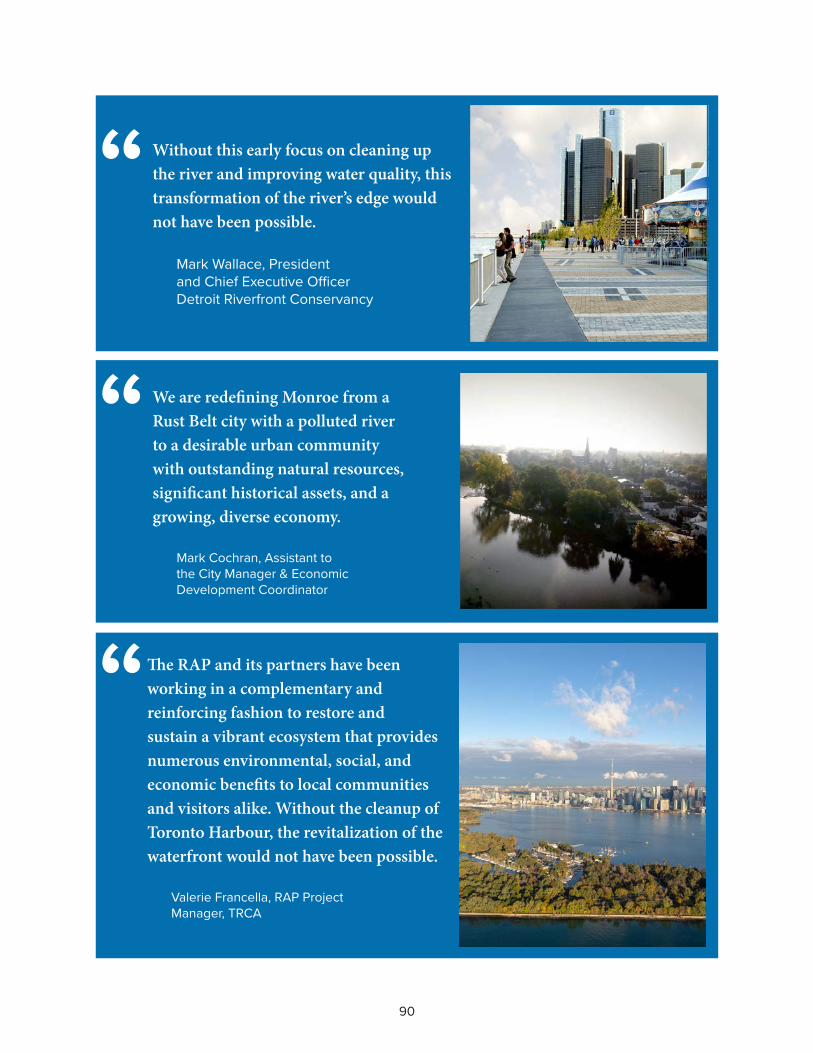
90
We are redefining Monroe from a Rust Belt city with a polluted river to a desirable urban community with outstanding natural resources, significant historical assets, and a growing, diverse economy.
Mark Cochran, Assistant to the City Manager & Economic Development Coordinator
“
The RAP and its partners have been working in a complementary and reinforcing fashion to restore and sustain a vibrant ecosystem that provides numerous environmental, social, and economic benefits to local communities and visitors alike. Without the cleanup of Toronto Harbour, the revitalization of the waterfront would not have been possible.
Valerie Francella, RAP Project Manager, TRCA
“
Without this early focus on cleaning up the river and improving water quality, this transformation of the river’s edge would not have been possible.
Mark Wallace, President and Chief Executive Officer Detroit Riverfront Conservancy
“
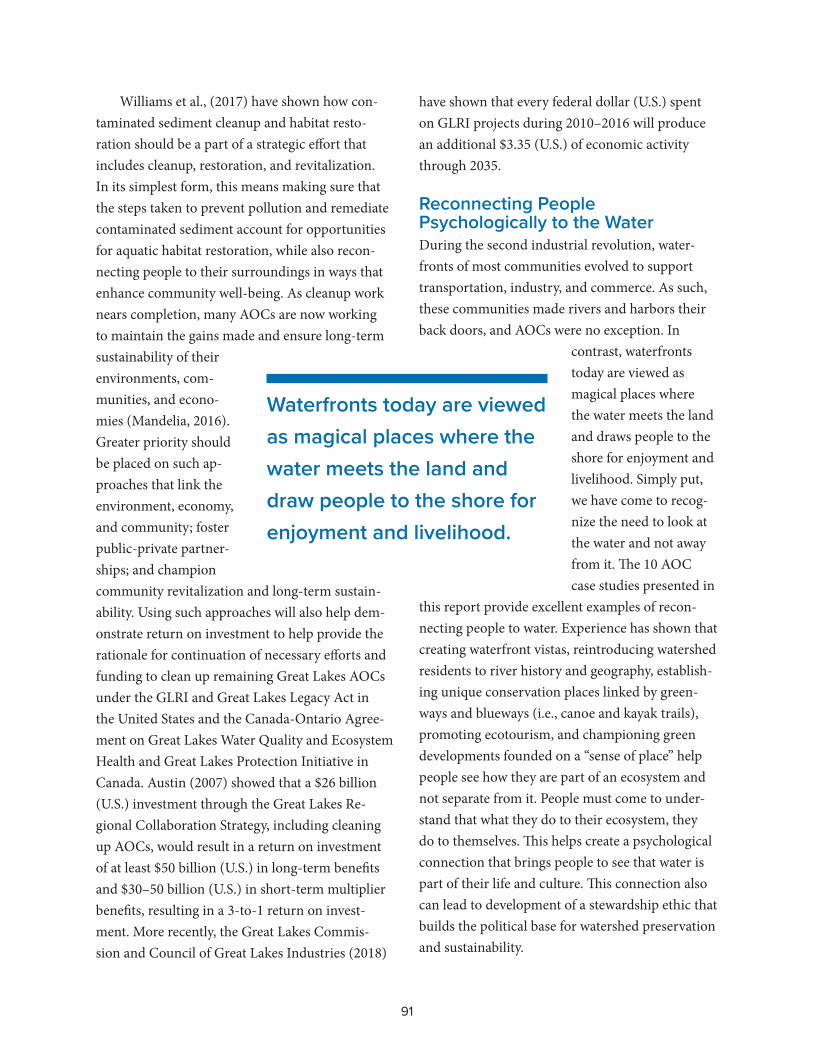
91
Waterfronts today are viewed as magical places where the water meets the land and draw people to the shore for enjoyment and livelihood.
Williams et al., (2017) have shown how con-taminated sediment cleanup and habitat resto-ration should be a part of a strategic effort that includes cleanup, restoration, and revitalization. In its simplest form, this means making sure that the steps taken to prevent pollution and remediate contaminated sediment account for opportunities for aquatic habitat restoration, while also recon-necting people to their surroundings in ways that enhance community well-being. As cleanup work nears completion, many AOCs are now working to maintain the gains made and ensure long-term sustainability of their environments, com-munities, and econo-mies (Mandelia, 2016). Greater priority should be placed on such ap-proaches that link the environment, economy, and community; foster public-private partner-ships; and champion community revitalization and long-term sustain-ability. Using such approaches will also help dem-onstrate return on investment to help provide the rationale for continuation of necessary efforts and funding to clean up remaining Great Lakes AOCs under the GLRI and Great Lakes Legacy Act in the United States and the Canada-Ontario Agree-ment on Great Lakes Water Quality and Ecosystem Health and Great Lakes Protection Initiative in Canada. Austin (2007) showed that a $26 billion (U.S.) investment through the Great Lakes Re-gional Collaboration Strategy, including cleaning up AOCs, would result in a return on investment of at least $50 billion (U.S.) in long-term benefits and $30–50 billion (U.S.) in short-term multiplier benefits, resulting in a 3-to-1 return on invest-ment. More recently, the Great Lakes Commis-sion and Council of Great Lakes Industries (2018)
have shown that every federal dollar (U.S.) spent on GLRI projects during 2010–2016 will produce an additional $3.35 (U.S.) of economic activity through 2035.
Reconnecting People Psychologically to the WaterDuring the second industrial revolution, water-fronts of most communities evolved to support transportation, industry, and commerce. As such, these communities made rivers and harbors their back doors, and AOCs were no exception. In
contrast, waterfronts today are viewed as magical places where the water meets the land and draws people to the shore for enjoyment and livelihood. Simply put, we have come to recog-nize the need to look at the water and not away from it. The 10 AOC case studies presented in
this report provide excellent examples of recon-necting people to water. Experience has shown that creating waterfront vistas, reintroducing watershed residents to river history and geography, establish-ing unique conservation places linked by green-ways and blueways (i.e., canoe and kayak trails), promoting ecotourism, and championing green developments founded on a “sense of place” help people see how they are part of an ecosystem and not separate from it. People must come to under-stand that what they do to their ecosystem, they do to themselves. This helps create a psychological connection that brings people to see that water is part of their life and culture. This connection also can lead to development of a stewardship ethic that builds the political base for watershed preservation and sustainability.

92
Concluding RemarksThe Great Lakes basin ecosystem is home to 107 million people and 51 million jobs, accounts for more than 50 percent of all U.S./Canadian bilateral border trade, and supports shipping of over 200 million tons of cargo annually. If it were its own country, it would have a gross domestic product of $6 trillion (U.S.), making it the third biggest economy in the world (Desjardins, 2017).
AOCs can be considered microcosms of hu-man impacts on the Great Lakes. After human settle-ment along the shores of the Great Lakes and their tributaries, these areas became centers of trade and commerce, followed by development of industry and agriculture that pow-ered economic growth in the region. Use and abuse of these waters to power the region’s mining, lumber, pulp and paper, steel, auto-motive, chemical, energy, ship building, and grain industries reached a zenith in the 1960s when birds like bald eagles and peregrine falcons experienced re-productive failure because of pesticides like DDT, massive algal blooms resulted in Time magazine declaring Lake Erie dead, and indiscriminate discharge of oil and petroleum products resulted in the burning of the Buffalo, Cuyahoga, and Rouge rivers. The resulting public outcry spurred the en-vironmental movement that led to establishment of Earth Day in 1970 and the passage of the Canada Water Act in 1970, the U.S. Clean Water Act in 1972, the Canada-U.S. Great Lakes Water Quality Agreement in 1972, and the U.S. Endangered Spe-cies Act in 1973.
We continue today to clean up legacy pollution in AOCs. The development and implementation of RAPs using an ecosystem approach has opened the door to seeing how cleanup and restoration of AOCs can help catalyze waterfront revitaliza-tion. Linkages must be better established between cleanup and restoration efforts in AOCs and com-munity revitalization efforts. Greater effort must be placed on bringing these two activities (i.e., cleanup/restoration and revitalization) into align-
ment and making sure that they are complementary and reinforcing to achieve a synergy for sustainable redevelopment with its sub-stantial economic and social benefits.
Considerable evidence shows that people are will-ing to pay to locate in areas of high ecosystem quality (Anderson et al., 2009). People place a high value on the Great Lakes and are willing to pay a premium to live in coastal communities. Cleaning up AOCs not only improves ecosystem services
(i.e., the benefits we receive from healthy ecosys-tems and natural resources) and makes these cities more desirable places to live, but helps businesses attract and retain employees.
The AOC designation has contributed to a negative perception of communities living in and near them. For many, the AOC designation was perceived as a “black eye” for their reputation. Cleaning up AOCs not only improves ecosystem services, but can help change how communities are perceived. The 10 case studies presented in this report show how the perception of AOCs can be changed from being recognized as polluted rivers
The development and implementation of RAPs using an ecosystem approach has opened the door to seeing how cleanup and restoration of AOCs can help catalyze waterfront revitalization.
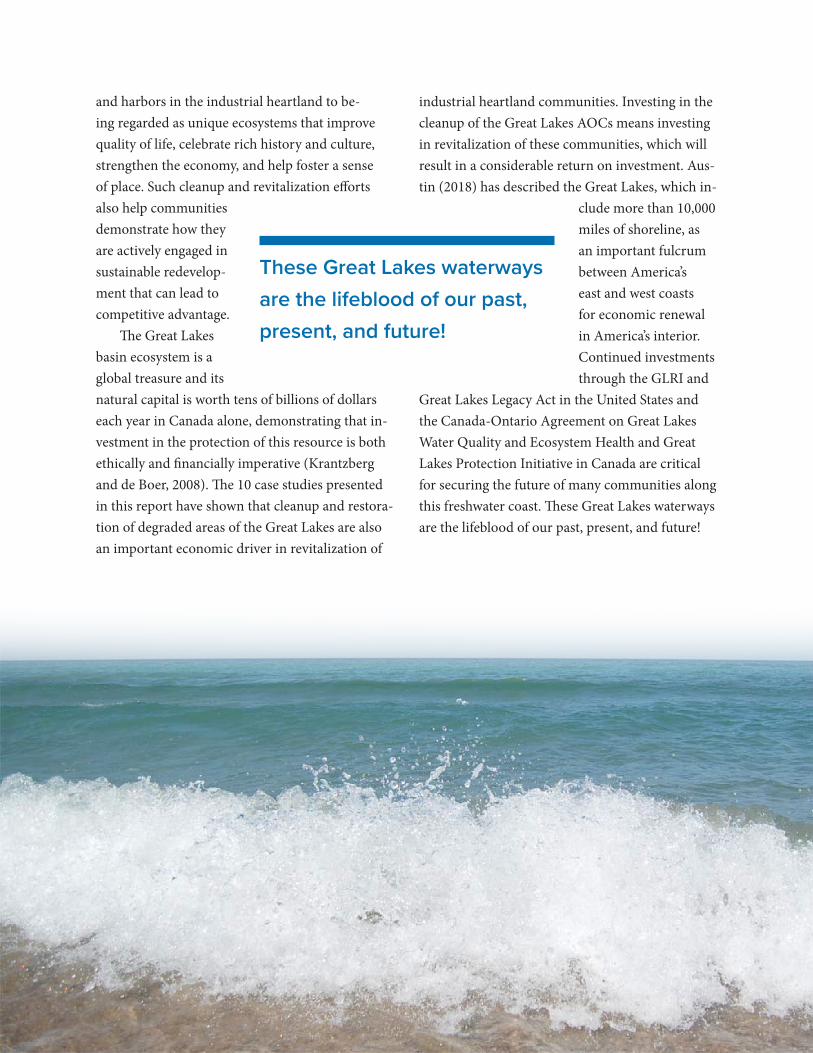
93
and harbors in the industrial heartland to be-ing regarded as unique ecosystems that improve quality of life, celebrate rich history and culture, strengthen the economy, and help foster a sense of place. Such cleanup and revitalization efforts also help communities demonstrate how they are actively engaged in sustainable redevelop-ment that can lead to competitive advantage.
The Great Lakes basin ecosystem is a global treasure and its natural capital is worth tens of billions of dollars each year in Canada alone, demonstrating that in-vestment in the protection of this resource is both ethically and financially imperative (Krantzberg and de Boer, 2008). The 10 case studies presented in this report have shown that cleanup and restora-tion of degraded areas of the Great Lakes are also an important economic driver in revitalization of
industrial heartland communities. Investing in the cleanup of the Great Lakes AOCs means investing in revitalization of these communities, which will result in a considerable return on investment. Aus-tin (2018) has described the Great Lakes, which in-
clude more than 10,000 miles of shoreline, as an important fulcrum between America’s east and west coasts for economic renewal in America’s interior. Continued investments through the GLRI and
Great Lakes Legacy Act in the United States and the Canada-Ontario Agreement on Great Lakes Water Quality and Ecosystem Health and Great Lakes Protection Initiative in Canada are critical for securing the future of many communities along this freshwater coast. These Great Lakes waterways are the lifeblood of our past, present, and future!
These Great Lakes waterways are the lifeblood of our past, present, and future!


95
Anderson, S.T., J. Read, and D. Scavia. 2009. Restoring Great Lakes ecosystems: Worth the cost? University of Michigan, Graham Sustainability Institute, Ann Arbor, Michigan, USA.
Austin, J. 2007. Healthy Waters, Strong Economy: The Benefits of Restoring the Great Lakes Ecosystem. The Brookings Institution, Washington, D.C., USA.
Austin, J. 2018. The nation’s freshwater coast is a key fulcrum for Rust Belt revival. The Brookings Institution, Washington, D.C., USA. Retrieved from: https://www.brookings.edu/blog/the-avenue/2018/05/31/the-nations-freshwater-coast-is-a-key-fulcrum-for-rust-belt-revival/
Beeker, J., G. Studen, and L. Stumpe. 1991. The Cuyahoga River Remedial Action Plan Coordinating Committee: a model for building community ownership of a watershed restoration plan. In, Surface and Ground-Water Quality: Pollution Prevention, Remediation and the Great Lakes. A.A. Jennings and N.E. Spangenberg (Eds.). pp. 29-41. American Water Resources Association, Bethesda, Maryland, USA.
Botts, L. and P. Muldoon. 2005. Evolution of the Great Lakes Water Quality Agreement. Michigan State University Press, East Lansing, Michigan, USA.
Buffalo Niagara Riverkeeper. 2011. Addendum to the Stage 2 Remedial Acton Plan for the Buffalo River Area of Concern. Buffalo, New York, USA.
Canada and the U.S. 1987. Protocol Amending the Great Lakes Water Quality Agreement. Windsor, Ontario, Canada.
City of Duluth. 2015a. Riverside Small Area Plan. Duluth, Minnesota, USA. Retrieved from: http://www.duluthmn.gov/media/445925/Riverside-Small-Area-Plan_Doc_Approved.pdf
City of Duluth. 2015b. The St. Louis River Corridor: From Vision to Action. Duluth, Minnesota, USA. Retrieved from: http://duluthmn.gov/media/308283/final-cow-slr-corridor-presentation-2-23.pdf
City of Duluth. 2017. Irving-Fairmount Brownfields Revitalization Plan. Duluth, Minnesota, USA. Retrieved
from: http://duluthmn.gov/community-planning/western-port-area-neighborhood-plan
Coffey, M., M. Khan, E. Hogan, and I. Salim. 2017. Combined sewer overflow controls in southeast Michigan. Great Lakes Water Authority, Detroit, Michigan, USA.
Council of Great Lakes Industries and Great Lakes Commission. 2018. Assessing the Investment: The Economic Impact of the Great Lakes Restoration Initiative, A Case Study of Duluth, Minnesota/Superior, Wisconsin. Ann Arbor, Michigan, USA. Retrieved from: https://www.glc.org/wp-content/uploads/Duluth-092218.pdf
CSL International. 2013. Economic impact study: Detroit riverfront. Detroit Riverfront Conservancy, Detroit, Michigan, USA.
Cuyahoga River Community Planning Organization. 2008. Cuyahoga River Remedial Action Plan. Cleveland, Ohio, USA.
Cuyahoga River Restoration. 2015. Stage 2 Delisting Implementation Plan Update and Progress Report. Cleveland, Ohio, USA.
Desjardins, J. 2017. The Great Lakes Economy: The Growth Engine of North America. Visual Capitalist. Vancouver, BC, Canada. Retrieved from: https://www.visualcapitalist.com/great-lakes-economy/
Duluth Seaway Port Authority. 2018. We are heavy hitters in bulk cargo. And we can prove it. Duluth, Minnesota, USA. Retrieved from: http://www.duluthport.com/port-stats.php
Flats Forward. 2018. The Flats Neighborhood Guide. Cleveland, Ohio, USA.
French, N.T., T. Dekker, and J.H. Hartig. 2018. Use of Collaborative Funding to Implement the Remedial Action Plan for the St. Louis River Area of Concern, Minnesota, USA. Aquatic Ecosystem Health and Management Society. 21(4): 409-420.
General Accounting Office (GAO). 2003. Great Lakes: an overall strategy and indicators for measuring
LITERATURE CITED

96
progress are needed to better achieve restoration goals. Report GAO-03-515. Washington, D.C., USA.
GAO. 2009. EPA needs a cohesive plan to clean up the Great Lakes Areas of Concern. Report 09-P-0231. Washington, D.C., USA.
Great Lakes Commission and Council of Great Lakes Industries. 2018. Assessing the Investment: The Economic Impact of the Great Lakes Restoration Initiative. Buffalo River case study. Ann Arbor, Michigan, USA.
Griswold Consulting Group, LLC and Michigan State University. 2014. Economic Significance of River Raisin National Battlefield Park: Estimating the Baseline Economic Impact of Visitation. In, City of Monroe, River Raisin Heritage Corridor – East Master Plan. Monroe, Michigan, USA.
Hamilton Harbour Remedial Action Plan (HHRAP)(Hamilton Harbour Stakeholder Group and Remedial Action Plan Technical Team). 1989. Remedial action plan for Hamilton Harbour: Environmental conditions and problem definition. Burlington, Ontario, Canada.
HHRAP (Hamilton Harbour Stakeholder Group and Remedial Action Plan Technical Team). 1992. Remedial action plan for Hamilton Harbour: Goals, options, and recommendations. Burlington, Ontario, Canada.
HHRAP (Hamilton Harbour Stakeholder Forum). 2003. Remedial Action Plan for Hamilton Harbour: Stage 2 Update. Burlington, Ontario, Canada.
HHRAP. 2014. 2006-2010 Stakeholder Investments. Burlington, Ontario, Canada.
Hartig, J.H. 1997. Great Lakes remedial action plans: Fostering adaptive ecosystem-based management processes. The American Review of Canadian Studies. 27 (3):437-458.
Hartig, J.H. 2014. Bringing Conservation to Cities: Lessons from Building the Detroit River International Wildlife Refuge. Ecovision World Monograph Series, Aquatic Ecosystem Health and Management Society, Burlington, Ontario, Canada.
Hartig, J.H., M. Munawar, G. Krantzberg, M. Doss, M. Child, R. Kalinauskas, L. Richman and C. Blair. 2018a. Achievements and lessons learned from the 32-year old Canada-U.S. effort to restore Impaired Beneficial Uses
in Great Lakes Areas of Concern, Aquatic Ecosystem Health & Management. 21(4): 506-520.
Hartig, J.H., C. E. Sanders, R.J.H. Wyma, J.C. Boase, and E.F. Roseman. 2018b. Habitat rehabilitation in the Detroit River Area of Concern. Aquatic Ecosystem Health and Management Society. 21(4): 458-469.
Hartig, J.H. and R.L. Thomas. 1988. Development of plans to restore degraded areas in the Great Lakes. Environmental Management. 12: 327 347.
Hartig, J.H. and J.R. Vallentyne. 1989. Use of an ecosystem approach to restore degraded areas of the Great Lakes. Ambio 18(8): 423–428.
Hartig, J.H. and M.C. Wallace. 2015. Creating World-Class Gathering Places for People and Wildlife along the Detroit Riverfront, Michigan, USA. Sustainability 7:15073-15098.
Hartig, J.H., M.A. Zarull, and N.L. Law. 1998. An ecosystem approach to Great Lakes management: Practical steps. J. Great Lakes Res. 24(3): 739-750.
Hartig, J.H., M.A. Zarull, J.J.H. Ciborowski, J.E. Gannon, E. Wilke, G. Norwood, and A. Vincent. 2009. Long-term ecosystem monitoring and assessment of the Detroit River and Western Lake Erie. Environmental Monitoring and Assessment. 158: 87-104.
Helal, L. 2014. Duluth voted Outside magazine’s best outdoors town. Minnesota Public Radio News. Retrieved from https://blogs.mprnews.org/statewide/2014/06/duluth-voted-outside-magazines-best-outdoors-town/
International Joint Commission. 1985. Report on Great Lakes water quality. Great Lakes Water Quality Board, Windsor, Ontario, Canada.
Isely, P., E.S. Isely, C. Hause, and A.D. Steinman. 2018. A socioeconomic analysis of habitat restoration in the Muskegon Lake area of concern. J. Great Lakes Res. 44: 330-339.
Johnson, B. 2017. Endi development opens its doors on London Road. Duluth, Minnesota, USA. Retrieved from: http://www.duluthnewstribune.com/business/4206607-endi-development-opens-its-doors-london-road

97
Keir Consultants Inc. 1991. Severn Sound Remedial Action Plan socio-economic profile of the community. Report prepared for Inland Waters Directorate, Environment Canada. Burlington, Ontario, Canada.
Khan, M., E. Hogan, and I. Salim. 2017. Phosphorus discharges from Great Lakes Water Authority’s Water Resource Recovery Facility. Great Lakes Water Authority, Detroit, Michigan, USA.
Kidd, J. 2015. Within Reach: Toronto and Region Remedial Action Plan Progress Report. Toronto Region Conservation Authority, Toronto, Ontario, Canada.
Krantzberg, G. 2003. Keeping remedial action plans on target: lessons learned from Collingwood Harbour. Journal of Great Lakes Research. 29(4): 641-651.
Krantzberg, G. 2006. Sustaining The Gains Made In Ecological Restoration: Case Study Collingwood Harbour, Ontario. Environment, Development and Sustainability 8: 413–424.
Krantzberg, G. and C. de Boer. 2008. A valuation of ecosystem services in the Laurentian Great Lakes Basin with an emphasis on Canada. Journal American Water Works Association. 100(6): 100-111.
Krantzberg, G., and E. Houghton. 1996. The Remedial Action Plan that lead to the cleanup and delisting of Collingwood Harbour as an Area of Concern. J. Great Lakes. Res. 22: 469-483.
Krantzberg, G. and M. Rich. 2018. Life after delisting: The Collingwood Harbour story. Aquatic Ecosystem Health and Management Society. 21(4): 378-386.
LimnoTech, Inc. 2013. St. Louis River Area of Concern Implementation Framework: Roadmap to Delisting. Duluth, Minnesota, USA.
Mandelia, A. 2016. Great Lakes Areas of Concern: Life after Delisting. Great Lakes Regional Office, International Joint Commission, Windsor, Ontario, Canada.
Martin Associates. 2018. Economic Impacts of the Port of Duluth-Superior. Duluth, Minnesota, USA. Retrieved from: http://www.duluthport.com/uploads/Duluth_Superior_Port_Econ_Impacts_Full_Report_Aug2018.pdf
McLaughlin, C. and G. Krantzberg. 2018: Remedies for improving Great Lakes Remedial Action Plans: A Policy Delphi study. Aquatic Ecosystem Health & Management. 21(4): 493-505.
Michigan Department of Environmental Quality. 2011. Stage 2 Remedial Action Plan: Muskegon Lake Area of Concern. Lansing, Michigan, USA.
Michigan Department of Natural Resources and Ontario Ministry of the Environment. 1991. Stage 1 Remedial Action Plan for the Detroit River Area of Concern. Lansing, Michigan, USA and Sarnia, Ontario, Canada.
Michigan Department of Natural Resources (MDNR). 1987a. Remedial Action Plan for the Muskegon Lake Area of Concern. Great Lakes and Environmental Assessment Section, Surface Water Quality Division, Lansing, Michigan, USA.
MDNR. 1987b. Remedial Action Plan for the River Raisin Area of Concern. Lansing, Michigan, USA.
Michigan State University. 2017. National Park Service Money Generation Model simulations. River Raisin Battlefield National Park, Department of Park, Recreation, and Tourism Resources; Michigan State University; East Lansing, Michigan, USA.
Minnesota Pollution Control Agency and Wisconsin Department of Natural Resources (MPCA and WDNR). 1992. Stage I St. Louis River System Remedial Action Plan. Duluth, Minnesota and Madison, Wisconsin, USA.
MPCA and WDNR. 1995. Stage II St. Louis River System Remedial Action Plan. Duluth, Minnesota and Madison, Wisconsin, USA.
Muskegon Lake Watershed Partnership. 2018. Muskegon Lake Ecosystem Action Plan. Muskegon, Michigan, USA.
National Park Service. 2017. 2016 National Park Visitor Spending Effects: Economic Contributions to Local Communities, States, and the Nation. Natural Resource Report NPS/NRSS/EQD/NRR—2017/1421. River Raisin National Battlefield Park. Monroe, Michigan, USA.
National Park Service. 2018. National Park Service Visitor Use Statistics. River Raisin National Battlefield Park. Monroe, Michigan, USA.

98
New York State Department of Environmental Conservation. 1989. Buffalo River Remedial Action Plan. Buffalo, New York, USA.
Office of Congressman Brian Higgins. 2015. Developing the DL&W Terminal and the Kelley Island River Trail. Washington, D.C., USA.
Ontario Ministry of the Environment (OMOE). 1989. Metro Toronto Stage 1 Remedial Action Plan: environmental conditions and problem definition. Toronto, Ontario, Canada.
OMOE. 1994. Metro Toronto Stage 2 Remedial Action Plan. Toronto, Ontario, Canada.
Rayno, A. 2017. How Duluth became the outdoor capital of the Midwest. Duluth, Minnesota, USA. Retrieved from: http://www.startribune.com/how-duluth-became-the-outdoor-capital-of-the-midwest/420664303/
Renalls, C. 2016. Pier B Resort in Duluth aims to open by Grandma’s Marathon. Duluth, Minnesota, USA. Retrieved from: http://www.duluthnewstribune.com/business/4033223-pier-b-resort-duluth-aims-open-grandmas-marathon
Ross, T. 2014. The Town that Cycling Saved. Duluth, Minnesota, USA. Retrieved from: https://www. bicycling.com/news/a20038587/don-ness-interview/
Severn Sound Remedial Action Plan (SSRAP). 1989. Stage 1 Report: environmental conditions and problem definition. ISBN: 0-7729-4702-3. Toronto, Ontario, Canada.
SSRAP. 1993. Stage 2 Report: A strategy for restoring the Severn Sound ecosystem and delisting Severn Sound as an Area of Concern. ISBN: 0-7778-1168-5. Toronto, Ontario, Canada.
Sherman, R.K. 2002. Severn Sound Remedial Action Plan Stage 3 Report: The status of restoration and delisting of Severn Sound as an Area of Concern. Report prepared by Severn Sound Environmental Association for Environment Canada and the Ontario Ministry of the Environment. Toronto, Ontario, Canada.
Sherman, R.K., R. Whittam, and J. Cayley. 2018. The Severn Sound Remedial Action Plan: The Friendly Little Monster. Aquatic Ecosystem Health and Management. 21(4): 387-397.
Snodgrass, W.J., R. Dewey, M. D’Andrea, R. Bishop, and J. Lei. 2018. Forecasting receiving water response to alternative control levels for combined sewer overflows discharging to Toronto’s inner harbour. Aquatic Ecosystem Management and Health. 21 (3): 245-254.
Stang, C., 2011. Agricultural best management practices and their effects on sediment transport curves for improved watershed health. Master of Applied Science Thesis, University of Guelph, Guelph, Ontario, Canada.
Steinman, A.D., B.J. Cardinale, W.R. Munns, M.E. Ogdahl, J.D. Allan, T. Angadi, S. Bartlett, K. Brauman, M. Byappanahalli, M. Doss, D. Dupont, A. Johns, D. Kashian, F. Lupi, P. McIntyre, T. Miller, M. Moore, R.L. Muenich, R. Poudel, J. Price, B. Provencher, A. Rea, J. Read, S., S. Renzetti, B. Sohngen, and E. Washburn. 2017. Ecosystem services in the Great Lakes. J. Great Lakes Res. 43: 161-168.
Steinman, A.D., M. Ogdahl, R. Rediske, C.R. Ruetz, B.A. Biddanda, and L. Nemeth. 2008. Current Status and Trends in Muskegon Lake, Michigan. J. Great Lakes Res. 34: 169–188.
Stynes, D. J. 2009. National park visitor spending and payroll impacts 2008. Department of Park, Recreation, and Tourism Resources; Michigan State University; East Lansing, Michigan, USA.
Stynes, D. J., D. B. Propst, W. H. Chang, and Y. Sun. 2000. Estimating regional economic impacts of park visitor spending: Money Generation Model Version 2 (MGM2). Department of Park, Recreation, and Tourism Resources; Michigan State University; East Lansing, Michigan, USA.
Tejani, R. and T. Muir. 2004. Economic benefits of the Severn Sound Remedial Action Plan (1990-2002) cost savings and environmental benefits. Report prepared for Environment Canada Great Lakes Sustainability Fund, Burlington, Ontario, Canada.
Town of Collingwood. 2016. Collingwood Waterfront Master Plan. Collingwood, Ontario, Canada.
Tuchman, M.L., S.E. Cieniawski, and J.H. Hartig. 2018. U.S. progress is remediating contaminated sediments in Great Lakes Areas of Concern. Aquatic Ecosystem Health and Management Society. 21(4): 438-446.

99
U.S. Army Corps of Engineers. 2015. Port stats and facts at a glance. Duluth, Minnesota, USA. Retrieved from: http://www.duluthport.com/port-stats-facts.php
U.S. Census Bureau. 2017. 2012-2016 American Community Survey Five-Year Estimates for Duluth, Minnesota, USA. Retrieved from: https://factfinder.census.gov/faces/tableservices/jsf/pages/productview.xhtml?src=CF
U.S. Environmental Protection Agency (U.S. EPA). 2012. Brownfields Area-Wide Planning Program Fact Sheet. EPA-560-F-12-182. Chicago, Illinois, USA.
U.S. Great Lakes Interagency Task Force. 2017. Great Lakes Restoration Initiative Report to Congress and the President. Washington, D.C., USA.
urbanMetrics. 2013. Economic impact analysis (2001-2013), Toronto, Ontario. Toronto, Ontario, Canada.
Vallentyne, J. and A. Beeton. 1988. The ‘Ecosystem’ Approach to Managing Human Uses and Abuses of Natural Resources in the Great Lakes Basin. Environmental Conservation, 15(1), 58-62.
Waterfront Toronto. 2017. Corporate Social Responsibility and Sustainability Report, Toronto, Ontario, Canada.
Watson and Associates. 2004. Fiscal impact assessment: Proposed redevelopment of Canada Steamship Lines lands, Town of Collingwood. Mississauga, Ontario, Canada.
West Michigan Shoreline Regional Development Commission. 2016. Muskegon Lake 2020. Muskegon, Michigan, USA.
Williams, K.C. 2015. Relationships, knowledge, and resilience: A comparative case study of stakeholder participation in Great Lakes Areas of Concern. Ph.D. Dissertation, University of Wisconsin-Milwaukee, Milwaukee, Wisconsin, USA.
Williams, K.C., D.W. Bolgrien, J.C. Hoffman, T.R. Angradi, J. Carlson, R. Clarke, A. Fulton, M. MacGregor, H. Timm-Bijold, A. Trebitz, and S. Witherspoon. 2018. How the community value of ecosystem goods and services empowers communities to impact the outcomes of remediation, restoration, and revitalization projects. MN EPA/600/R-17/292. U.S. Environmental Protection Agency, Duluth, Minnesota, USA.
York University (Institute for Research and Innovation in Sustainability and Schulich School of Business). 2006. Benefits assessment: Randle Reef Sediment Remediation. Toronto, Ontario, Canada.
Zegarac, M., K. Schaefer, and K. Sherman. 1994. Implementing the Severn Sound Remedial Action Plan: socio-economic considerations. Severn Sound Remedial Action Plan. Environment Canada. Toronto, Ontario, Canada.

101
Impairment of beneficial use is defined in the Canada-U.S. Great Lakes Water Quality Agreement as a change in the chemical, physical, or biological integrity of the Great Lakes ecosystem sufficient to cause any of the following:
• Restrictions of fish and wildlife consumption;• Tainting of fish and wildlife flavor;• Degradation of fish and wildlife populations;• Fish tumors or other deformities;• Bird or animal deformities or reproductive problems;• Degradation of benthos;• Restrictions on dredging activities;• Eutrophication or undesirable algae;• Restrictions on drinking water consumption, or taste and odor problems;• Beach closings;• Degradation of aesthetics;• Added costs to agriculture or industry;• Degradation of phytoplankton or zooplankton populations; or• Loss of fish and wildlife habitat.
APPENDIX 1

102
This report was made possible by a grant from The Erb Family Foundation to the International Association for Great Lakes Research to review and evaluate what has been achieved and learned over the past more than three decades of cleanup of Great Lakes Areas of Concern.
The International Association for Great Lakes Research is a scientific organization made up of researchers studying the Laurentian Great Lakes, other large lakes of the world, and their watersheds, as well as those interested in such research. Members encompass all scientific disciplines with a common interest in the sustainable management of large lake ecosystems.