grade 3 • module 6...grade 3 • module 6 ollecting and displaying data overview this 10-day...
TRANSCRIPT

Grade 3 • Module 6
Collecting and Displaying Data
OVERVIEW
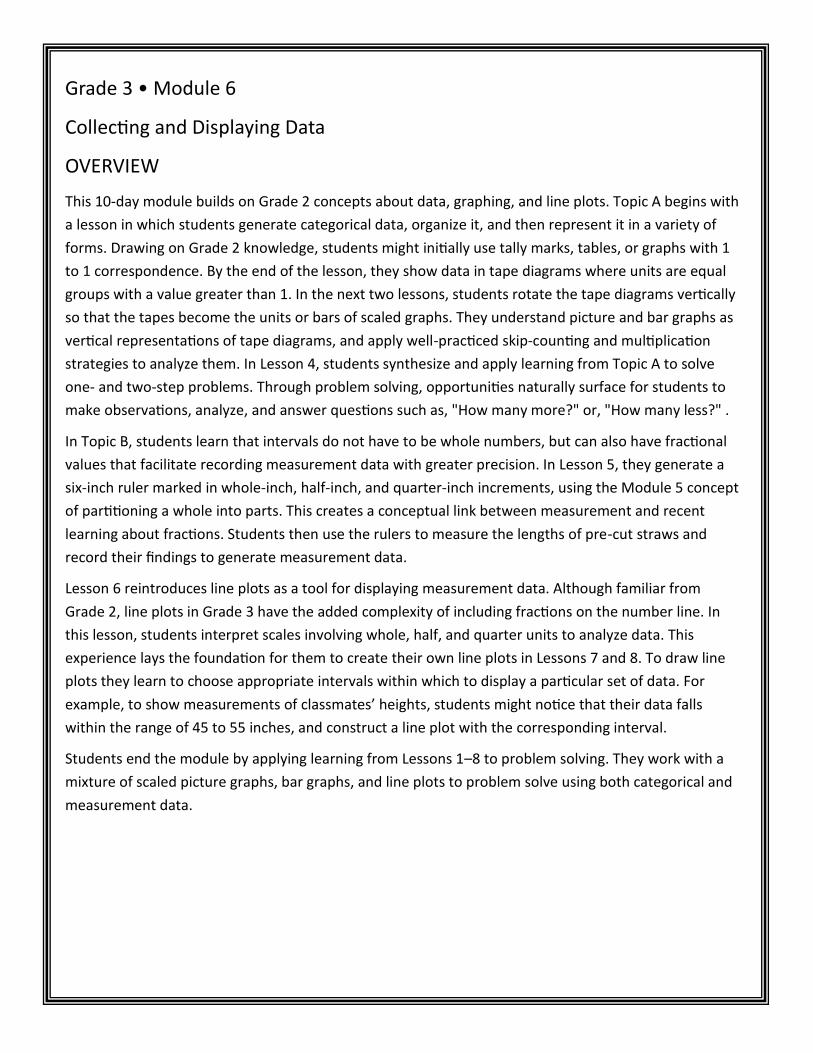
This 10-day module builds on Grade 2 concepts about data, graphing, and line plots. Topic A begins with
a lesson in which students generate categorical data, organize it, and then represent it in a variety of
forms. Drawing on Grade 2 knowledge, students might initially use tally marks, tables, or graphs with 1
to 1 correspondence. By the end of the lesson, they show data in tape diagrams where units are equal
groups with a value greater than 1. In the next two lessons, students rotate the tape diagrams vertically
so that the tapes become the units or bars of scaled graphs. They understand picture and bar graphs as
vertical representations of tape diagrams, and apply well-practiced skip-counting and multiplication
strategies to analyze them. In Lesson 4, students synthesize and apply learning from Topic A to solve
one- and two-step problems. Through problem solving, opportunities naturally surface for students to
make observations, analyze, and answer questions such as, "How many more?" or, "How many less?" .
In Topic B, students learn that intervals do not have to be whole numbers, but can also have fractional
values that facilitate recording measurement data with greater precision. In Lesson 5, they generate a
six-inch ruler marked in whole-inch, half-inch, and quarter-inch increments, using the Module 5 concept
of partitioning a whole into parts. This creates a conceptual link between measurement and recent
learning about fractions. Students then use the rulers to measure the lengths of pre-cut straws and
record their findings to generate measurement data.
Lesson 6 reintroduces line plots as a tool for displaying measurement data. Although familiar from
Grade 2, line plots in Grade 3 have the added complexity of including fractions on the number line. In
this lesson, students interpret scales involving whole, half, and quarter units to analyze data. This
experience lays the foundation for them to create their own line plots in Lessons 7 and 8. To draw line
plots they learn to choose appropriate intervals within which to display a particular set of data. For
example, to show measurements of classmates’ heights, students might notice that their data falls
within the range of 45 to 55 inches, and construct a line plot with the corresponding interval.
Students end the module by applying learning from Lessons 1–8 to problem solving. They work with a
mixture of scaled picture graphs, bar graphs, and line plots to problem solve using both categorical and
measurement data.
Terminology
New or Recently Introduced Terms
Axis (vertical or horizontal scale in a graph)
Frequent (most common measurement on a line plot)
Measurement data (e.g., length measurements of a collection of pencils)
Scaled graphs (bar or picture graph in which the scale uses units with a value greater than 1)
Survey (collecting data by asking a question and recording responses)
Familiar Terms and Symbols
Bar graph (graph generated from categorical data with bars to represent a quantity)
Data (information)
Fraction (numerical quantity that is not a whole number, e.g., )
Line plot (display of measurement data on a horizontal line)
Picture graph (graph generated from categorical data with graphics to represent a quantity)
Suggested Tools and Representations
Bar graph
Grid paper
Line plot
Picture graph
Rulers (measuring in inches, half inches, and quarter inches)
Tape diagram
Sentence strips

Lesson 1
Objective: Generate and organize data.
Lesson 2
Objective: Rotate tape diagrams
vertically.

Lesson 3
Objective: Create scaled bar graphs.
Lesson 4
Objective: Solve one- and two-step
problems involving graphs.
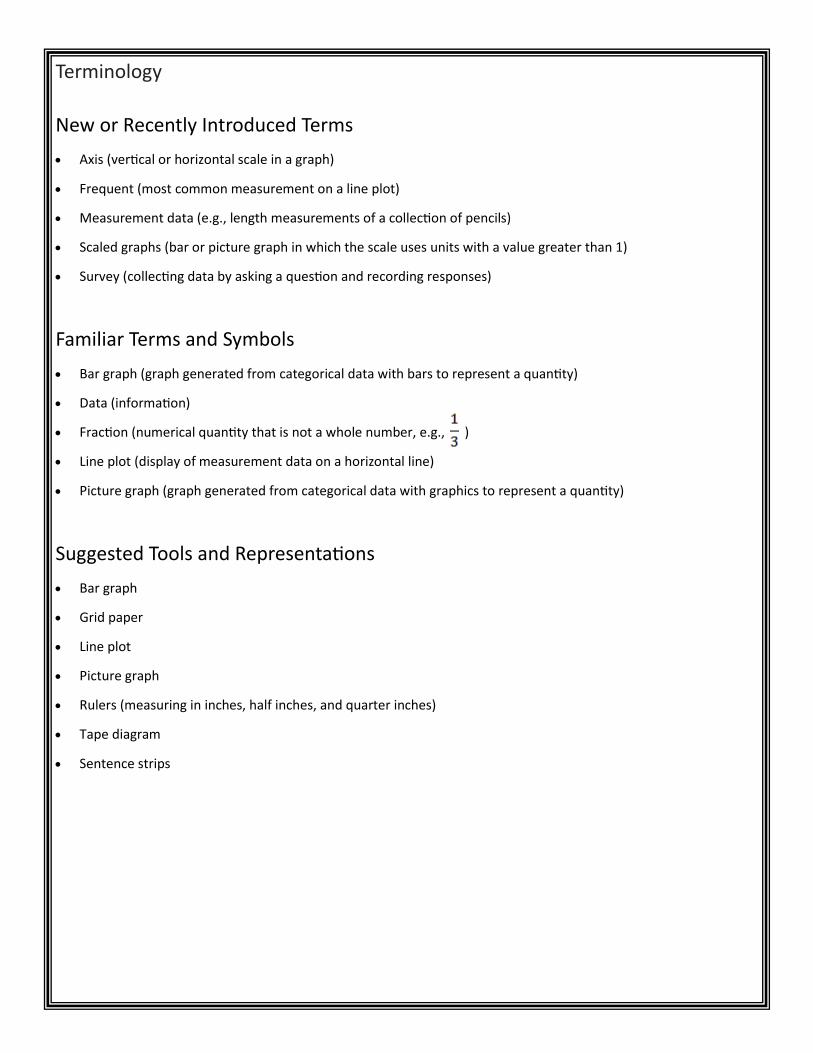
Lesson 5
Objective: Create ruler with 1-inch, 1/2
-inch, and 1/4-inch intervals and
generate measurement data.
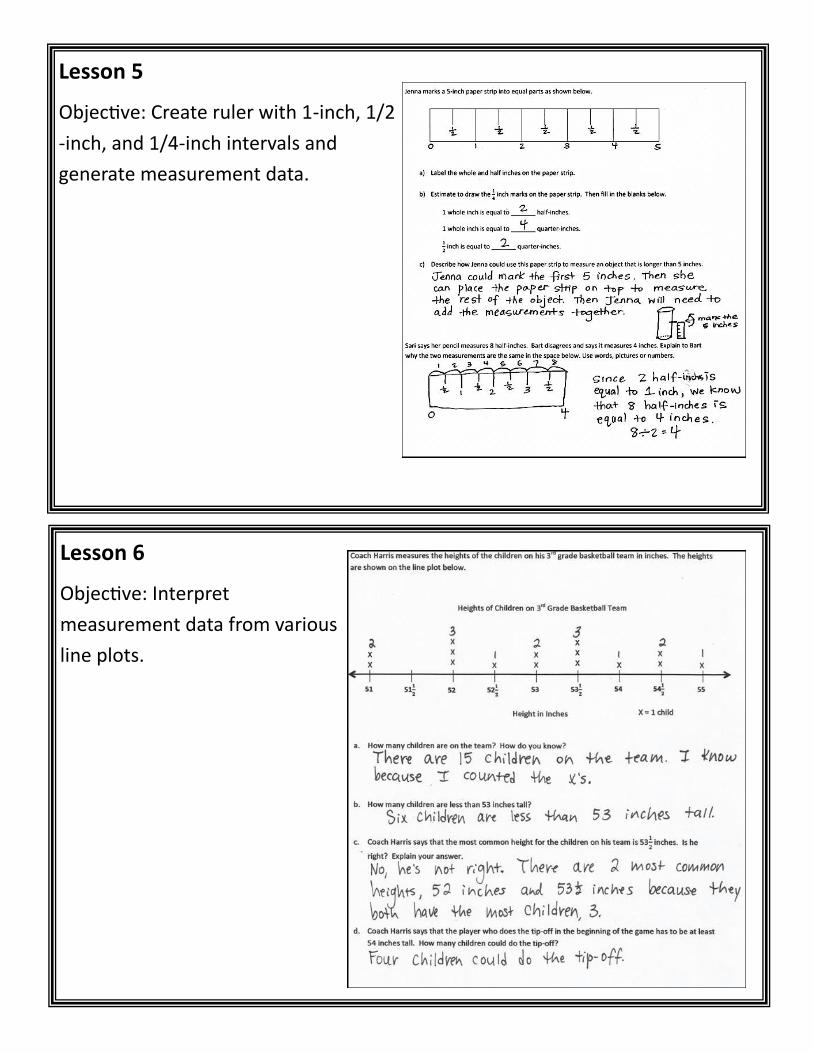
Lesson 6
Objective: Interpret
measurement data from various
line plots.

Lesson 7
Objective: Represent measurement data
Lesson 8
Objective: Represent measurement data with line plots.

Lesson 9
Objective: Analyze data to problem solve.