grade 6: module 4: unit 1: lesson 11 interpreting ...€¦ · grade 6: module 4: unit 1: lesson 11...
TRANSCRIPT
Grade 6: Module 4: Unit 1: Lesson 11 Interpreting, Integrating, and Sharing Information: Using Charts and Graphs about DDT
This work is licensed under a Creative Commons Attribution-NonCommercial-ShareAlike 3.0 Unported License. Exempt third-party content is indicated by the footer: © (name of copyright holder). Used by permission and not subject to Creative Commons license.
GRADE 6: MODULE 4: UNIT 1: LESSON 11
Interpreting, Integrating, and Sharing Information: Using Charts and Graphs about DDT
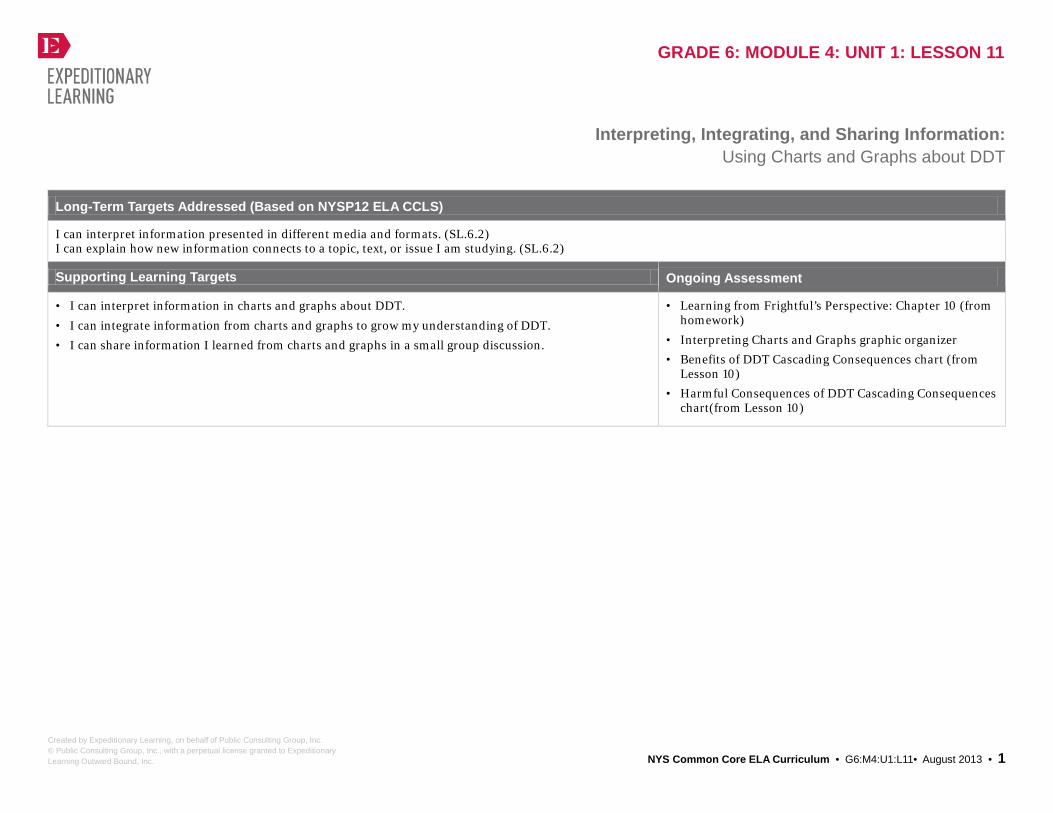
Long-Term Targets Addressed (Based on NYSP12 ELA CCLS)
I can interpret information presented in different media and formats. (SL.6.2) I can explain how new information connects to a topic, text, or issue I am studying. (SL.6.2)
Supporting Learning Targets Ongoing Assessment
• I can interpret information in charts and graphs about DDT.
• I can integrate information from charts and graphs to grow my understanding of DDT. • I can share information I learned from charts and graphs in a small group discussion.
• Learning from Frightful’s Perspective: Chapter 10 (from homework)
• Interpreting Charts and Graphs graphic organizer • Benefits of DDT Cascading Consequences chart (from
Lesson 10) • Harmful Consequences of DDT Cascading Consequences
chart(from Lesson 10)
Created by Expeditionary Learning, on behalf of Public Consulting Group, Inc. © Public Consulting Group, Inc., with a perpetual license granted to Expeditionary Learning Outward Bound, Inc. NYS Common Core ELA Curriculum • G6:M4:U1:L11• August 2013 • 1

GRADE 6: MODULE 4: UNIT 1: LESSON 11
Interpreting, Integrating, and Sharing Information: Using Charts and Graphs about DDT
Agenda Teaching Notes
1. Opening A. Engaging the Reader: Learning From Frightful’s
Perspective (8 minutes)
B. Unpacking Learning Targets (2 minutes) 2. Work Time
A. Interpreting Charts and Graphs to Grow Understanding: Mini Lesson (10 minutes)
B. Jigsaw: Interpreting Charts and Graphs to Grow 3.Closing and Assessment
A. Debrief: How Did the Graphic Organizer Help You Understand and Share the Information on the Charts, Graphs, Tables, and Maps? (3 minutes)
4. Homework A. Read Chapter 11, “The Kids Are Heard.” Complete
Learning from Frightful’s Perspective: Chapter 11
• This lesson builds on Lesson 10. Students integrate information from different media and formats. They will interpret charts, graphs, tables, and diagrams and add to their DDT Cascading Consequences charts.
• In advance: Prepare two Interpreting Charts and Graphs anchor charts. These anchor charts should look identical to the Interpreting Charts and Graphs graphic organizer (see supporting materials.) Be prepared to fill out this anchor chart during the lesson for students to see the thinking behind and the process of completing this organizer.
• Set up six stations for graphs, charts, tables, and diagrams. At each station, place four copies of each text. This allows students the freedom to choose from multiple materials in a limited amount of time. See supporting materials and Work Time B for details.
• Post: Learning targets.
Created by Expeditionary Learning, on behalf of Public Consulting Group, Inc. © Public Consulting Group, Inc., with a perpetual license granted to Expeditionary Learning Outward Bound, Inc. NYS Common Core ELA Curriculum • G6:M4:U1:L11• August 2013 • 2
GRADE 6: MODULE 4: UNIT 1: LESSON 11
Interpreting, Integrating, and Sharing Information: Using Charts and Graphs about DDT
Lesson Vocabulary Materials
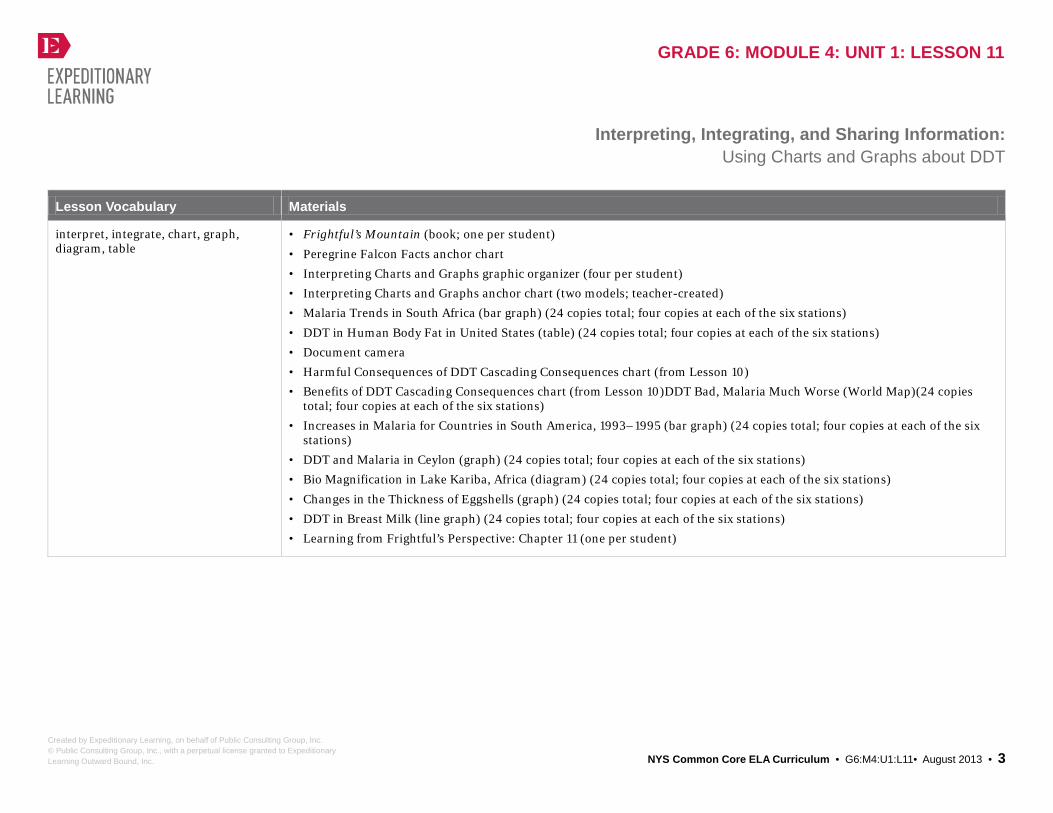
interpret, integrate, chart, graph, diagram, table
• Frightful’s Mountain (book; one per student)
• Peregrine Falcon Facts anchor chart • Interpreting Charts and Graphs graphic organizer (four per student) • Interpreting Charts and Graphs anchor chart (two models; teacher-created) • Malaria Trends in South Africa (bar graph) (24 copies total; four copies at each of the six stations)
• DDT in Human Body Fat in United States (table) (24 copies total; four copies at each of the six stations) • Document camera • Harmful Consequences of DDT Cascading Consequences chart (from Lesson 10) • Benefits of DDT Cascading Consequences chart (from Lesson 10)DDT Bad, Malaria Much Worse (World Map)(24 copies
total; four copies at each of the six stations) • Increases in Malaria for Countries in South America, 1993–1995 (bar graph) (24 copies total; four copies at each of the six
stations) • DDT and Malaria in Ceylon (graph) (24 copies total; four copies at each of the six stations) • Bio Magnification in Lake Kariba, Africa (diagram) (24 copies total; four copies at each of the six stations)
• Changes in the Thickness of Eggshells (graph) (24 copies total; four copies at each of the six stations) • DDT in Breast Milk (line graph) (24 copies total; four copies at each of the six stations) • Learning from Frightful’s Perspective: Chapter 11 (one per student)
Created by Expeditionary Learning, on behalf of Public Consulting Group, Inc. © Public Consulting Group, Inc., with a perpetual license granted to Expeditionary Learning Outward Bound, Inc. NYS Common Core ELA Curriculum • G6:M4:U1:L11• August 2013 • 3

GRADE 6: MODULE 4: UNIT 1: LESSON 11
Interpreting, Integrating, and Sharing Information: Using Charts and Graphs about DDT
Opening Meeting Students’ Needs
A. Engaging the Reader: Learning from Frightful’s Perspective (8 minutes) • Make sure students have their texts, Frightful’s Mountain.Compliment students for quickly getting into their triads as
they come into the room. Invite them to share their responses to the focus question for Chapter 10: “There Are Eggs and Trouble.” Students should cite evidence from the text as they share how Frightful and 426 care for their eggs and how Sam helps Frightful.
• Ask students to share terminology they found and added to “Words I Found Difficult.” Triad members should collaborate to determine the meaning of the words and add definitions to “Words I Found Difficult.”
• Circulate to observe students’ verbal and written responses. Compliment triads who are collaborating with each other sharing evidence-based responses and determining meaning of new words. Interact with students who need support. Model strategies for sharing responses and defining words.
• Invite triads to share their responses to the focus question. Ask students what information about how Frightful and 426 care for their eggs could be added to the Peregrine Falcon Facts anchor chart. Suggest that students look at the glossary on Learning from Frightful’s Perspective if they need ideas.
B. Unpacking Learning Targets (2 minutes) • Invite students to read the learning targets aloud with you:
* “I can interpret information in charts and graphs about DDT.” * “I can integrate information from charts and graph to grow my understanding of DDT.” * “I can share information I learned from charts and graphs in a small group discussion.”
Ask: * “After reading the learning targets, what do you think we will be doing in class today?”
• Listen for: “We will be interpreting charts and graphs and integrating the information.” Share that interpreting means to explain or tell the meaning of something, and in today’s lesson they will explain the meaning
of charts and graphs. Share that integrating means blending into a larger unit. Explain that students will add or blend the new information learned from the charts and graphs to their two Cascading Consequences charts.
Created by Expeditionary Learning, on behalf of Public Consulting Group, Inc. © Public Consulting Group, Inc., with a perpetual license granted to Expeditionary Learning Outward Bound, Inc. NYS Common Core ELA Curriculum • G6:M4:U1:L11• August 2013 • 4

GRADE 6: MODULE 4: UNIT 1: LESSON 11
Interpreting, Integrating, and Sharing Information: Using Charts and Graphs about DDT
Work Time Meeting Students’ Needs
A. Interpreting Charts and Graphs to Grow Understanding: Mini Lesson (10 minutes) • Distribute four Interpreting Charts and Graphs graphic organizers to each student. Post both models of the
Interpreting Charts and Graphs anchor chart for the entire class to see. Also, distribute to each student one bar graph titled Increases in Malaria for Countries in South America, 1993–1995 and one table titled DDT in Human Body Fat in United States.
• Invite students to title one of their graphic organizers “Human Body Fat in United States” (table). Model writing the title on the Interpreting Charts and Graphs anchor chart.
• Ask students to read the information in the rows and columns of the table. Ask them to interpret the information with their triads. Say: * “What is the graph telling the reader?”
• Listen for: “DDT levels in human body fat appear to be increasing from 1942 to 1970. DDT levels increased from 0 to 11.6 PPM, mg/g fat. After this date, the DDT levels decrease from 9.2 PPM, mg/g fat in 1972 to 4.8 PPM, mg/g fat in 1978.”
• Use a document camera or board to model writing this response on the anchor chart. Tell students to write responses on their graphic organizer.
• Ask students to discuss: * “Where does it take place? Who is affected? When did it happen?”
• Circulate and support students. Encourage some students to reread information on the graph. Provide questions to guide their responses.
• Listen for: “It takes place in the United States. Americans are affected. DDT increased from 1942 to 1970. DDT decreased from 1970 to 1978.”
• Use a document camera to model writing these responses on the anchor chart. Students should also write responses on their graphic organizer.
• Ask students to consider the last two questions with their triads: * “Using DDT caused what to happen?” * “Not using DDT caused what to happen?”
• Listen for: “Using DDT caused levels of insecticide to build up in human body fat. DDT levels were 0 in 1942 and steadily increased to 11.6 PPM, mg/g fat in 1972. Not using DDT caused no buildup of the DDT insecticide in human body fat.”
• Explain to students that only one of the next two questions—“What are the benefits?” and “What are the harmful consequences?”—should be completed.
• Consider posting directions where all students can see them to support students who have difficulty tracking multistep directions.
• Consider giving some students a modified version of the Interpreting Charts and Graphs graphic organizer. This allows students more time to interpret the charts, graphs, maps, and diagrams.
Created by Expeditionary Learning, on behalf of Public Consulting Group, Inc. © Public Consulting Group, Inc., with a perpetual license granted to Expeditionary Learning Outward Bound, Inc. NYS Common Core ELA Curriculum • G6:M4:U1:L11• August 2013 • 5

GRADE 6: MODULE 4: UNIT 1: LESSON 11
Interpreting, Integrating, and Sharing Information: Using Charts and Graphs about DDT
” Work Time (continued) Meeting Students’ Needs
• Cold call students:
* “Which question represents information from the graph and should be completed?”
• Listen for: “The harmful consequences question should be completed. DDT levels appeared in human body fat when used in the United States. In 1942, DDT did not appear, however, after DDT was sprayed, it increased to 11.6 PPM, mg/g fat in 1972.”
• Use a document camera to model writing the response on the anchor chart. Ask students to write responses on their graphic organizer.
• Explain to students the responses just written can now be transferred to their Harmful Consequences of DDT Cascading Consequences chart as evidence. Remind them to cite that the evidence was taken from a table. Pause to give students time.
• Next, tell students they will interpret a graph and complete another Interpreting Graphs and Charts graphic organizer in their triads.
• Invite students to write the title “Increases in Malaria for Countries in South America, 1993–1995 (bar graph)” on another graphic organizer.
• Ask triads to interpret the information on the bar graph, and write their responses to the four questions in the rectangles. Remind them to read all titles carefully, to look at the numbering on the y-axis, and to read the titles of the categories on the y-axis. Give students time to work together.
• Circulate and encourage some students to carefully read all of the information on the bar graph. Provide guided questions to help students with their thinking.
• Reconvene the class. Cold call triads for responses to the four questions. • Listen for: “The graph is showing malaria increased from 1993 to 1995 because DDT was not used. In Guyana, it increased
78%; in Bolivia, Paraguay, and Peru, it increased 92%: and in Brazil, Colombia, and Venezuela it increased 35% because of some spraying in homes. In Ecuador, there was a decrease of 0% as a result of increased use of DDT after 1993. This takes place in South America. People living in Guyana, Bolivia, Paraguay, Peru, Brazil, Colombia, Venezuela, and Ecuador were affected. It happened from 1993 to 1995.”
• Use a document camera to model writing the responses to these four questions on the anchor chart. Ask students to complete their graphic organizer as you fill in the anchor chart.
• Cold call students, asking which one of the next two questions “What are the benefits?” and “What are the harmful consequences?” should be completed.
Created by Expeditionary Learning, on behalf of Public Consulting Group, Inc. © Public Consulting Group, Inc., with a perpetual license granted to Expeditionary Learning Outward Bound, Inc. NYS Common Core ELA Curriculum • G6:M4:U1:L11• August 2013 • 6

GRADE 6: MODULE 4: UNIT 1: LESSON 11
Interpreting, Integrating, and Sharing Information:
Using Charts and Graphs about DDT
Work Time (continued) Meeting Students’ Needs
• Listen for: “We should add this information to ‘What are the benefits?’
• Use a document camera to model writing: “Malaria increased in South American countries from 1993 to 1995. It increased from 35% to 78% in some countries.”
• Explain to students the evidence or new information just written can be transferred to their Benefits of DDT Cascading Consequences chart.
• Use a document camera to model drawing an arrow from the center rectangle “Benefits of DDT.” Write “Increases in Malaria occurred in South America from 1993 to 1995 when DDT was not used. Malaria increased from 35% to 78% in some countries.” Draw a rectangle around this added information. Cite evidence as bar graph.
• Congratulate students for their focus and hard work interpreting tables and bar graphs. Explain as information is added to the Cascading Consequences charts, it provides evidence to help make informed decisions about the use of DDT in countries around the world.
Created by Expeditionary Learning, on behalf of Public Consulting Group, Inc. © Public Consulting Group, Inc., with a perpetual license granted to Expeditionary Learning Outward Bound, Inc. NYS Common Core ELA Curriculum • G6:M4:U1:L11• August 2013 • 7

GRADE 6: MODULE 4: UNIT 1: LESSON 11
Interpreting, Integrating, and Sharing Information:
Using Charts and Graphs about DDT
Work Time (continued) Meeting Students’ Needs
B. Jigsaw: Interpreting Charts and Graphs to Grow Understanding about DDT (22 minutes) • Tell student triads they will now be given two opportunities to interpret information from a graph, a world map, or a
diagram. Ask them to first complete an Interpreting Charts and Graphs graphic organizer for each. Second, remind them to integrate, or add, the new information, or evidence to their Cascading Consequences charts. Third, remind them to cite their evidence as a graph, diagram, or world map. Finally, say they will share the new evidence with their triads.
• Explain to students they will have 10 minutes to fill out the organizer and transfer the evidence to the appropriate Cascading Consequence chart
• Number students in the triads 1, 2, and 3. Point out the six stations where the charts and graphs are located. Tell 1’s they will go to Stations A and B. Tell students numbered 2’s they will go to Stations C and D. Tell 3’s they will go to Stations E and F. Give students 10 minutes to work at the stations.
• Circulate to listen in and support students that need help interpreting. Ask some students to read the titles to you. Ask clarifying questions about the topic. Remind students to integrate this information in one of their Cascading Consequences charts and cite evidence.
• Reconvene the triads after 10 minutes. • Invite students to jigsaw the information with their group members. Direct 1’s to begin by reading one of the consequences,
or pieces of evidence, integrated into one of the Cascading Consequences charts and share where the evidence was found. • Tell group members to add the evidence, or new information, to their Cascading Consequences charts. Evidence should be
cited as world map, chart, diagram, or graph. When everyone has shared one, ask students to each share their second consequence. Again, as students share, group members add the evidence or new information to the appropriate Cascading Consequence chart and cite where the evidence was found.
• Ask the students to do a final check that each consequence has an arrow joining it to another consequence or joining it to the center rectangle. Remind them to draw a rectangle around the new evidence. Ask them to check that evidence was cited for each consequence via a bar graph, line graph, diagram, table, or world map.
• Congratulate students for working together cooperatively and for their focus. Eight consequences with new information from charts and graphs should have been added to their Cascading Consequences charts. Each piece of evidence should document where the information was found.
Created by Expeditionary Learning, on behalf of Public Consulting Group, Inc. © Public Consulting Group, Inc., with a perpetual license granted to Expeditionary Learning Outward Bound, Inc. NYS Common Core ELA Curriculum • G6:M4:U1:L11• August 2013 • 8

GRADE 6: MODULE 4: UNIT 1: LESSON 11
Interpreting, Integrating, and Sharing Information: Using Charts and Graphs about DDT
Closing and Assessment Meeting Students’ Needs
A. Understand and Share Information on Charts, Graphs, Tables, and Maps? (3 minutes) • Ask triads to share:
* “How did the graphic organizer help you interpret and integrate information in the Cascading Consequences charts?” * “When sharing new information from charts and graphs, what is important to remember?” * “What was the greatest challenge of interpreting, integrating, and sharing the evidence
Homework Meeting Students’ Needs
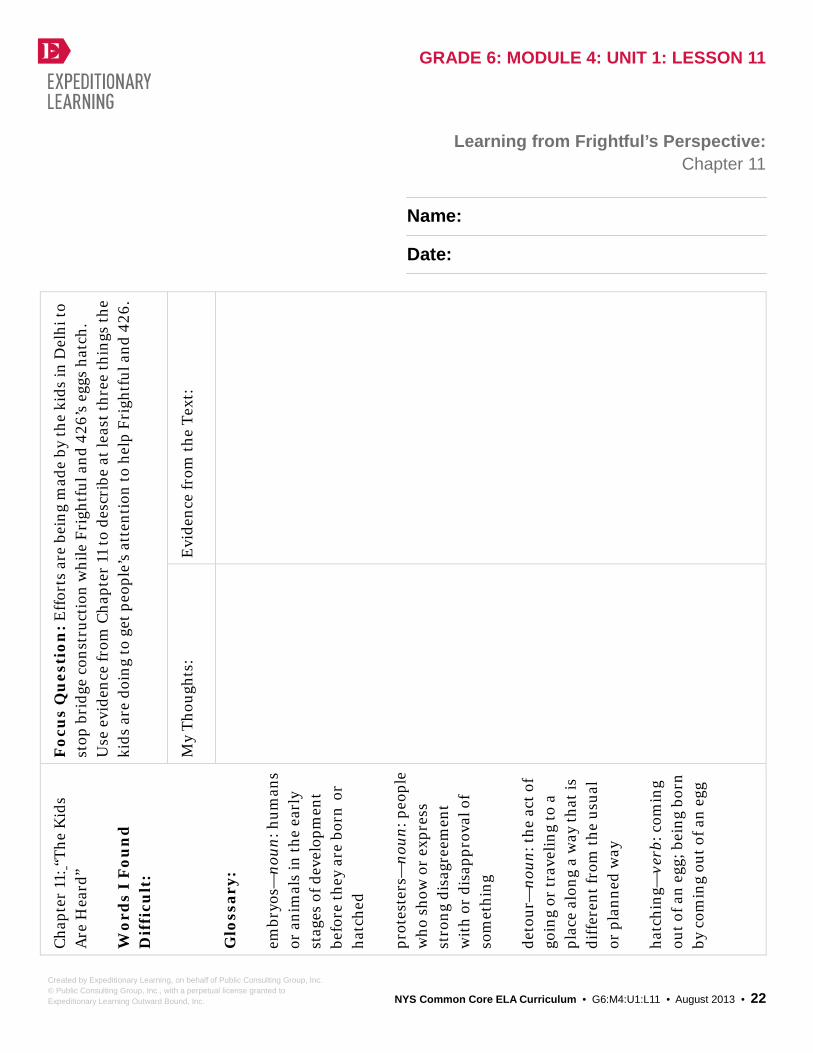
• Read Chapter 11, “The Kids Are Heard.” Complete Learning from Frightful’s Perspective: Chapter 11.
Created by Expeditionary Learning, on behalf of Public Consulting Group, Inc. © Public Consulting Group, Inc., with a perpetual license granted to Expeditionary Learning Outward Bound, Inc. NYS Common Core ELA Curriculum • G6:M4:U1:L11• August 2013 • 9

Grade 6: Module 4: Unit 1: Lesson 11 Supporting Materials
This work is licensed under a Creative Commons Attribution-NonCommercial-ShareAlike 3.0 Unported License. Exempt third-party content is indicated by the footer: © (name of copyright holder). Used by permission and not subject to Creative Commons license.

GRADE 6: MODULE 4: UNIT 1: LESSON 11
Interpreting Charts and Graphs
Name:
Date:
Issue: Do the Benefits of DDT Outweigh the Consequences? Graph/Chart/Map Title: ____________________________________________________________________
What is the graph telling the reader?
Where does it take place?
Who is affected?
When did it happen?
Created by Expeditionary Learning, on behalf of Public Consulting Group, Inc. © Public Consulting Group, Inc., with a perpetual license granted to Expeditionary Learning Outward Bound, Inc. NYS Common Core ELA Curriculum • G6:M4:U1:L11 • August 2013 • 11

GRADE 6: MODULE 4: UNIT 1: LESSON 11
Interpreting Charts and Graphs Using DDT caused _______________________________________________________. Not using DDT caused ____________________________________________________.
What are the benefits? What are the harmful consequences?
Created by Expeditionary Learning, on behalf of Public Consulting Group, Inc. © Public Consulting Group, Inc., with a perpetual license granted to Expeditionary Learning Outward Bound, Inc. NYS Common Core ELA Curriculum • G6:M4:U1:L11 • August 2013 • 12

GRADE 6: MODULE 4: UNIT 1: LESSON 11
DDT in Human Body Fat in United States
Expeditionary Learning is seeking permission for this material. We will post an updated version of the lesson once permission is granted.
Created by Expeditionary Learning, on behalf of Public Consulting Group, Inc. © Public Consulting Group, Inc., with a perpetual license granted to Expeditionary Learning Outward Bound, Inc. NYS Common Core ELA Curriculum • G6:M4:U1:L11 • August 2013 • 13

GRADE 6: MODULE 4: UNIT 1: LESSON 11
Increases in Malaria for Countries in South America, 1993–1995
Expeditionary Learning is seeking permission for this material. We will post an updated version of the lesson once permission is granted.
Created by Expeditionary Learning, on behalf of Public Consulting Group, Inc. © Public Consulting Group, Inc., with a perpetual license granted to Expeditionary Learning Outward Bound, Inc. NYS Common Core ELA Curriculum • G6:M4:U1:L11 • August 2013 • 14

GRADE 6: MODULE 4: UNIT 1: LESSON 11
DDT Bad, Malaria Much Worse Monday, September 24, 2007
Expeditionary Learning is seeking permission for this material. We will post an updated version of the lesson once permission is granted.
Created by Expeditionary Learning, on behalf of Public Consulting Group, Inc. © Public Consulting Group, Inc., with a perpetual license granted to Expeditionary Learning Outward Bound, Inc. NYS Common Core ELA Curriculum • G6:M4:U1:L11 • August 2013 • 15

GRADE 6: MODULE 4: UNIT 1: LESSON 11
Malaria Trends in South Africa
Expeditionary Learning is seeking permission for this material. We will post an updated version of the lesson once permission is granted.
Created by Expeditionary Learning, on behalf of Public Consulting Group, Inc. © Public Consulting Group, Inc., with a perpetual license granted to Expeditionary Learning Outward Bound, Inc. NYS Common Core ELA Curriculum • G6:M4:U1:L11 • August 2013 • 16

GRADE 6: MODULE 4: UNIT 1: LESSON 11
DDT and Malaria in Ceylon
Expeditionary Learning is seeking permission for this material. We will post an updated version of the lesson once permission is granted.
Created by Expeditionary Learning, on behalf of Public Consulting Group, Inc. © Public Consulting Group, Inc., with a perpetual license granted to Expeditionary Learning Outward Bound, Inc. NYS Common Core ELA Curriculum • G6:M4:U1:L11 • August 2013 • 17

GRADE 6: MODULE 4: UNIT 1: LESSON 11
Bio Magnification in Lake Kariba, Africa
Expeditionary Learning is seeking permission for this material. We will post an updated version of the lesson once permission is granted.
Created by Expeditionary Learning, on behalf of Public Consulting Group, Inc. © Public Consulting Group, Inc., with a perpetual license granted to Expeditionary Learning Outward Bound, Inc. NYS Common Core ELA Curriculum • G6:M4:U1:L11 • August 2013 • 18

GRADE 6: MODULE 4: UNIT 1: LESSON 11
Changes in the Thickness of Eggshells
Expeditionary Learning is seeking permission for this material. We will post an updated version of the lesson once permission is granted.
Created by Expeditionary Learning, on behalf of Public Consulting Group, Inc. © Public Consulting Group, Inc., with a perpetual license granted to Expeditionary Learning Outward Bound, Inc. NYS Common Core ELA Curriculum • G6:M4:U1:L11 • August 2013 • 19

GRADE 6: MODULE 4: UNIT 1: LESSON 11
DDT in Breast Milk Time Trend Examples
Expeditionary Learning is seeking permission for this material. We will post an updated version of
the lesson once permission is granted.
Created by Expeditionary Learning, on behalf of Public Consulting Group, Inc. © Public Consulting Group, Inc., with a perpetual license granted to Expeditionary Learning Outward Bound, Inc. NYS Common Core ELA Curriculum • G6:M4:U1:L11 • August 2013 • 20

GRADE 6: MODULE 4: UNIT 1: LESSON 11
DDT in Breast Milk Time Trend Examples
Expeditionary Learning is seeking permission for this material. We will post an updated version of
the lesson once permission is granted.
Created by Expeditionary Learning, on behalf of Public Consulting Group, Inc. © Public Consulting Group, Inc., with a perpetual license granted to Expeditionary Learning Outward Bound, Inc. NYS Common Core ELA Curriculum • G6:M4:U1:L11 • August 2013 • 21
GRADE 6: MODULE 4: UNIT 1: LESSON 11
Learning from Frightful’s Perspective: Chapter 11
Name:
Date:
Foc
us
Qu
esti
on: E
ffor
ts a
re b
eing
mad
e by
the
kids
in D
elhi
to
stop
bri
dge
cons
truc
tion
whi
le F
righ
tful
and
426
’s e
ggs
hatc
h.
Use
evi
denc
e fr
om C
hapt
er 1
1 to
des
crib
e at
leas
t thr
ee th
ings
the
kids
are
doi
ng to
get
peo
ple’
s at
tent
ion
to h
elp
Frig
htfu
l and
426
.
Evi
denc
e fr
om th
e Te
xt:
My
Thou
ghts
:
Cha
pter
11:
“Th
e K
ids
Are
Hea
rd”
Wor
ds
I F
oun
d
Dif
ficu
lt:
Glo
ssar
y:
embr
yos—
noun
: hum
ans
or a
nim
als
in th
e ea
rly
stag
es o
f dev
elop
men
t be
fore
they
are
bor
n or
ha
tche
d pr
otes
ters
—no
un: p
eopl
e w
ho s
how
or
expr
ess
stro
ng d
isag
reem
ent
wit
h or
dis
appr
oval
of
som
ethi
ng
deto
ur—
noun
: the
act
of
goin
g or
trav
elin
g to
a
plac
e al
ong
a w
ay th
at is
di
ffer
ent f
rom
the
usua
l or
pla
nned
way
ha
tchi
ng—
verb
: com
ing
out o
f an
egg;
bei
ng b
orn
by c
omin
g ou
t of a
n eg
g
Created by Expeditionary Learning, on behalf of Public Consulting Group, Inc. © Public Consulting Group, Inc., with a perpetual license granted to Expeditionary Learning Outward Bound, Inc. NYS Common Core ELA Curriculum • G6:M4:U1:L11 • August 2013 • 22