grades 5 and 8 fcat 2.0 science geometry end-of …...grades 5 and 8 fcat 2.0 science biology 1...
TRANSCRIPT

Grades 5 and 8 FCAT 2.0 Science Biology 1 End-of-Course Assessment Geometry End-of-Course Assessment
Standard Setting
Rule Development Workshops
October 15, 16, and 18, 2012 Victoria Ash
Bureau Chief, K-12 Assessment
Florida Department of Education
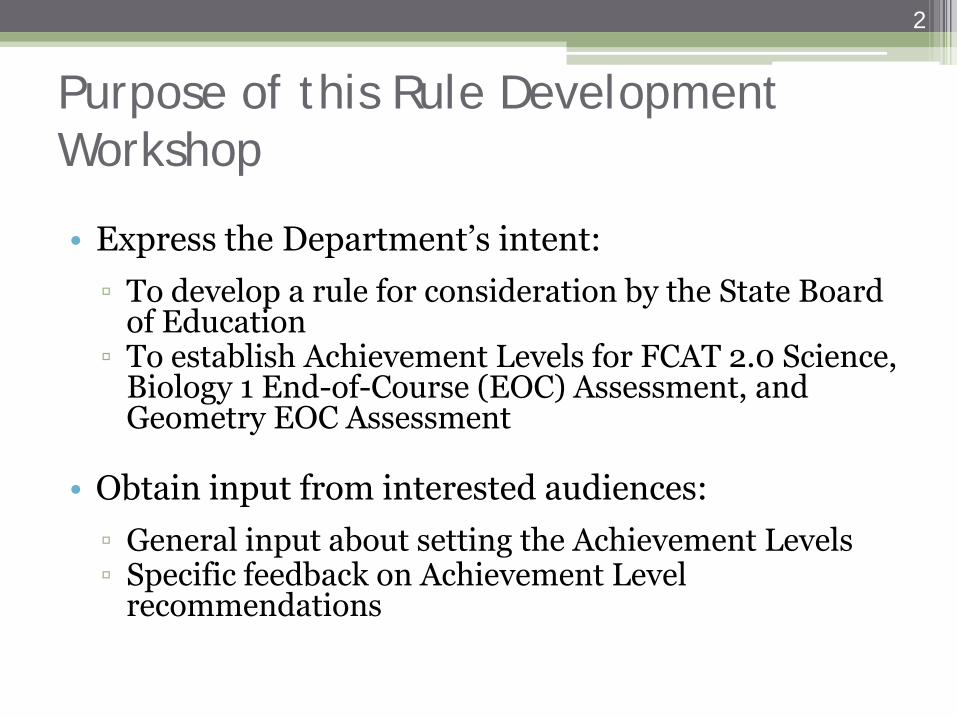
Purpose of this Rule Development Workshop
• Express the Department’s intent:
▫ To develop a rule for consideration by the State Board of Education
▫ To establish Achievement Levels for FCAT 2.0 Science, Biology 1 End-of-Course (EOC) Assessment, and Geometry EOC Assessment
• Obtain input from interested audiences:
▫ General input about setting the Achievement Levels ▫ Specific feedback on Achievement Level
recommendations
2
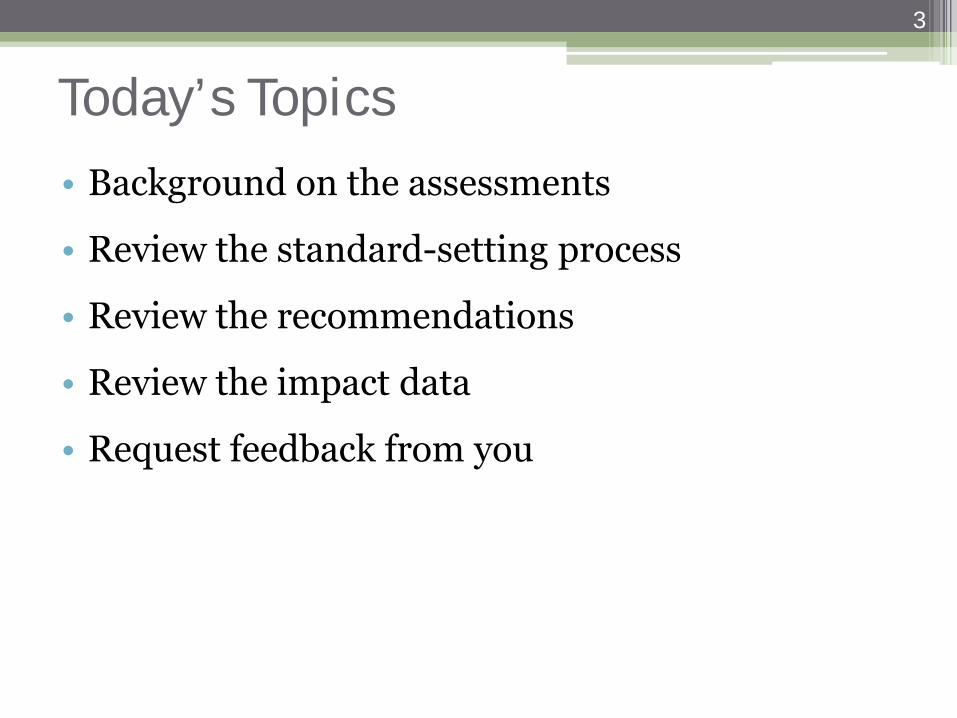
Today’s Topics • Background on the assessments
• Review the standard-setting process
• Review the recommendations
• Review the impact data
• Request feedback from you
3

Transition Schedule Type of Assessment Assessment Area
Year Administered to Students
2011-12 2012-13 2013-14 2014-15
FCAT FCAT Writing Gr 4, 8, 10
FCAT 2.0
FCAT 2.0 Writing Gr 4, 8, 10 Gr 4, 8, 10
FCAT 2.0 Reading Gr 3-10 Gr 3-10 Gr 3-10
FCAT 2.0 Mathematics Gr 3-8 Gr 3-8 Gr 3-8
FCAT 2.0 Science Gr 5, 8 Gr 5, 8 Gr 5, 8 Gr 5, 8
End-of-Course Assessments
Algebra 1 In Course In Course In Course
Geometry In Course In Course In Course
Biology 1 In Course In Course In Course In Course
US History In Course In Course In Course
Civics (Middle School) In Course In Course
Partnership for Assessment of Readiness for College and Careers (PARCC)
English Language Arts Gr 3-11
Mathematics Gr 3-8
High School Math EOCs (Algebra, Geometry, Algebra 2)
In Course
Transition Schedule 4
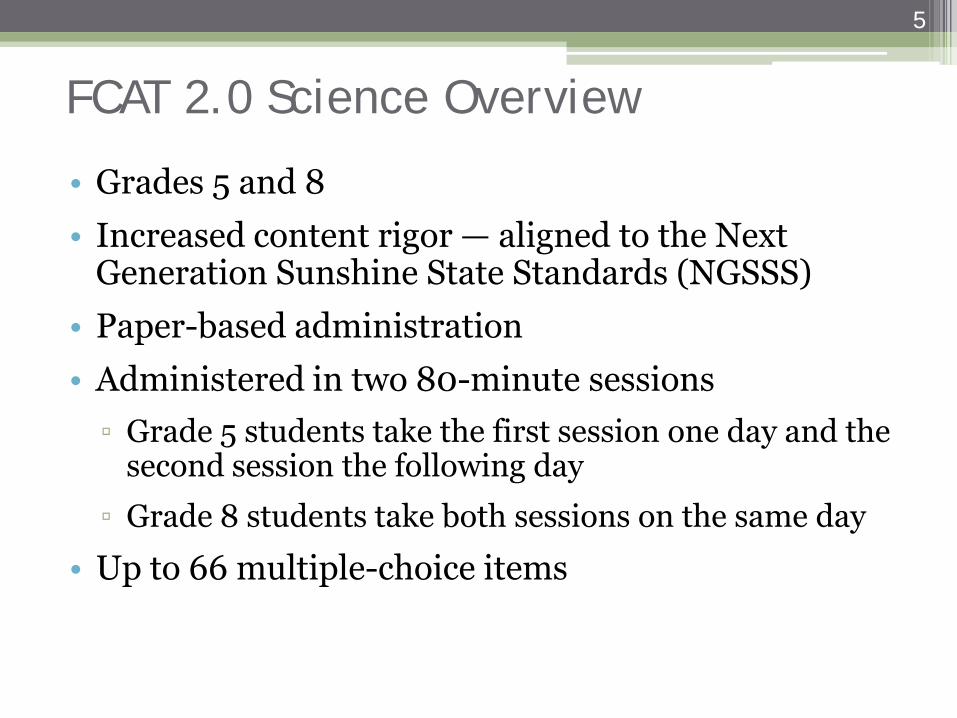
FCAT 2.0 Science Overview
• Grades 5 and 8
• Increased content rigor — aligned to the Next Generation Sunshine State Standards (NGSSS)
• Paper-based administration
• Administered in two 80-minute sessions
▫ Grade 5 students take the first session one day and the second session the following day
▫ Grade 8 students take both sessions on the same day
• Up to 66 multiple-choice items
5

FCAT 2.0 Science: Examples of Increased Rigor • Students are asked more often to:
▫ build on knowledge and vocabulary from previous years.
▫ be able to think critically and extend their understanding to novel situations in science.
▫ completely understand the concepts in the benchmarks and master skills, such as predicting, citing evidence, selecting models, analyzing, and concluding.
6
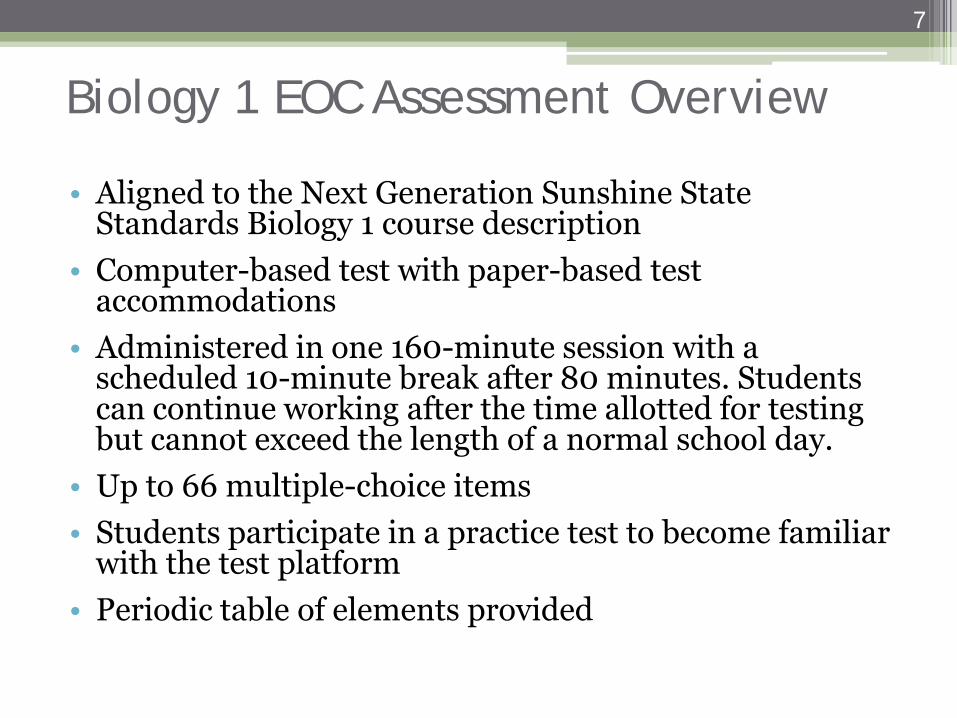
Biology 1 EOC Assessment Overview
• Aligned to the Next Generation Sunshine State Standards Biology 1 course description
• Computer-based test with paper-based test accommodations
• Administered in one 160-minute session with a scheduled 10-minute break after 80 minutes. Students can continue working after the time allotted for testing but cannot exceed the length of a normal school day.
• Up to 66 multiple-choice items
• Students participate in a practice test to become familiar with the test platform
• Periodic table of elements provided
7
Geometry EOC Assessment Overview
• Aligned to the Next Generation Sunshine State Standards Geometry course description
• Computer-based test with paper-based test accommodations
• Administered in one 160-minute session with a scheduled 10-minute break after 80 minutes. Students can continue working after the time allotted for testing but cannot exceed the length of a normal school day.
• Up to 65 items: ▫ Multiple-choice and fill-in response items ▫ No performance tasks
• Students participate in a practice test to become familiar with the test platform
• Reference sheet provided
8
FCAT 2.0/EOC are Standards-Based Tests
• Based on Florida’s content standards (Next Generation Sunshine State Standards)
• Students’ scores are in comparison to achievement standards – the criteria (Criterion-Referenced Test)
• Used to measure how well students have learned the content assessed
• Used to measure the teaching and learning of important content in Florida’s schools
9
When is Standard Setting Necessary?
• Standard setting becomes necessary whenever any of the following occur:
▫ New test ▫ Curriculum updates ▫ Blueprint changes ▫ Achievement Level Description changes
• Next Generation Sunshine State Standards – new content standards
10
Why Have Standards?
• To define what students should know and be able to do
• To clearly communicate to parents and teachers what students should know and be able to do
• To improve teaching and learning
• To develop a society able to compete in a global economy
• Important! ▫ Standards define what we want to achieve. ▫ Standards do not describe our current status.
11

Types of Standards
• Content Standards - Define the “what”
▫ Next Generation Sunshine State Standards
▫ Common Core State Standards
• Performance Standards - Define how much
▫ Achievement-Level Standards
▫ Graduation Requirement
• Accountability Standards
▫ School Grading Criteria
12

Setting Achievement Standards – or “Cut Scores” • A process that helps provide meaning to test scores
▫ Provides a frame of reference for interpreting test scores
▫ Most relevant when applied to tests based on defined content standards (criterion-referenced tests)
• The process includes: Deriving levels of performance on educational … assessments, by which decisions or classifications … will be made. (Cizek, 2007)
▫ Mapping content to student achievement ▫ Making judgments that are both qualitative (content) and
quantitative (test scores) ▫ Relating the NGSSS to FCAT 2.0/EOC scores
13
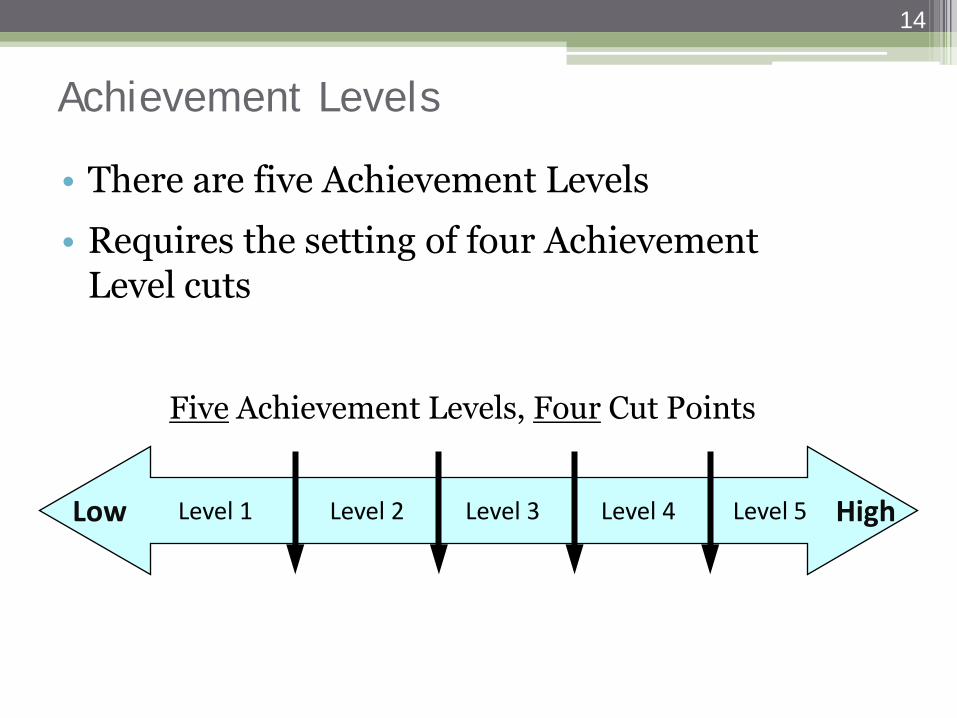
Achievement Levels
• There are five Achievement Levels
• Requires the setting of four Achievement Level cuts
14
Level 1 Level 5 Level 2 Level 3 Level 4 Low High
Five Achievement Levels, Four Cut Points

We’ve Done This Before… 1998: • Reading and Mathematics Achievement Standards approved for
grades 4, 5, 8, and 10 2001: • Reading and Mathematics Achievement Standards approved for
grades 3-10 • Grade 10 passing scores established 2011: • FCAT 2.0 Reading (grades 3-10) and Mathematics (3-8)
Achievement Standards approved • Algebra 1 EOC Achievement Standards approved
15

Past Experience - FCAT Science Standards
28% 29%
33% 35% 42% 43% 46% 49% 51%
38% 37%
29% 29% 25% 23% 21% 19% 19%
0%
10%
20%
30%
40%
50%
60%
70%
80%
90%
100%
2003 2004 2005 2006 2007 2008 2009 2010 2011
FCAT Science by Achievement Level
Grade 5
Achievement Level 3 and Above (On Grade Level and Above) Achievement Level 1
16
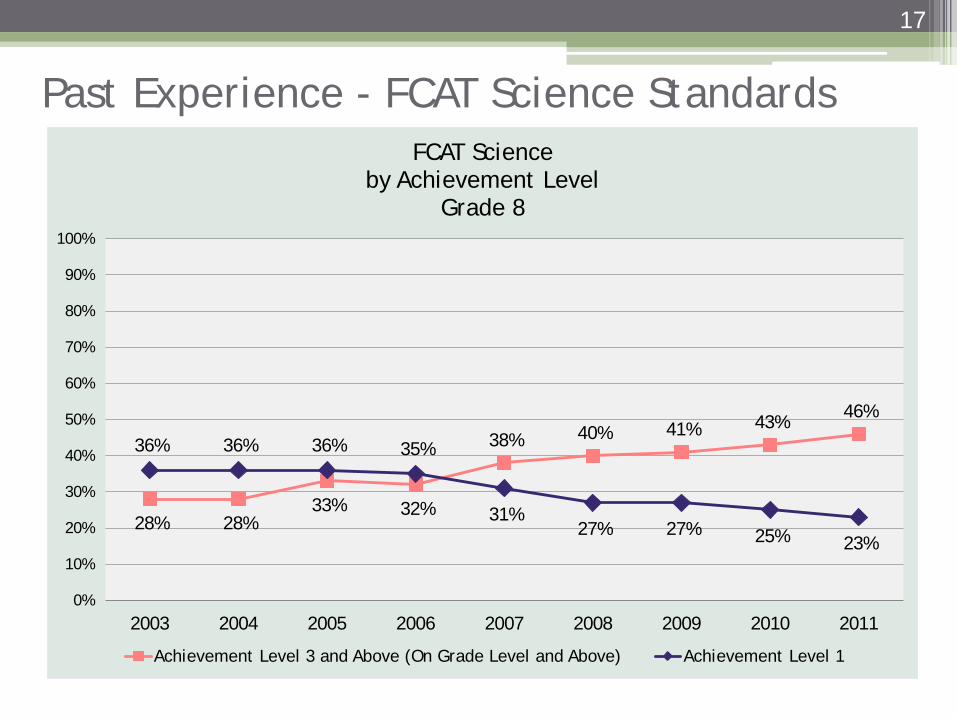
Past Experience - FCAT Science Standards
28% 28% 33% 32%
38% 40% 41% 43% 46%
36% 36% 36% 35%
31% 27% 27% 25% 23%
0%
10%
20%
30%
40%
50%
60%
70%
80%
90%
100%
2003 2004 2005 2006 2007 2008 2009 2010 2011
FCAT Science by Achievement Level
Grade 8
Achievement Level 3 and Above (On Grade Level and Above) Achievement Level 1
17

Standard-Setting Process
1. Develop a policy definition describing the meaning of each Achievement Level
2. Develop Achievement Level Descriptions 3. Convene a standard-setting panel composed of
educators to recommend cut scores 4. Convene a business and policy leader reactor
panel to review the recommended cut scores 5. Conduct rule development workshops and
collect public feedback 6. Obtain State Board of Education approval of
cut scores with public input
18
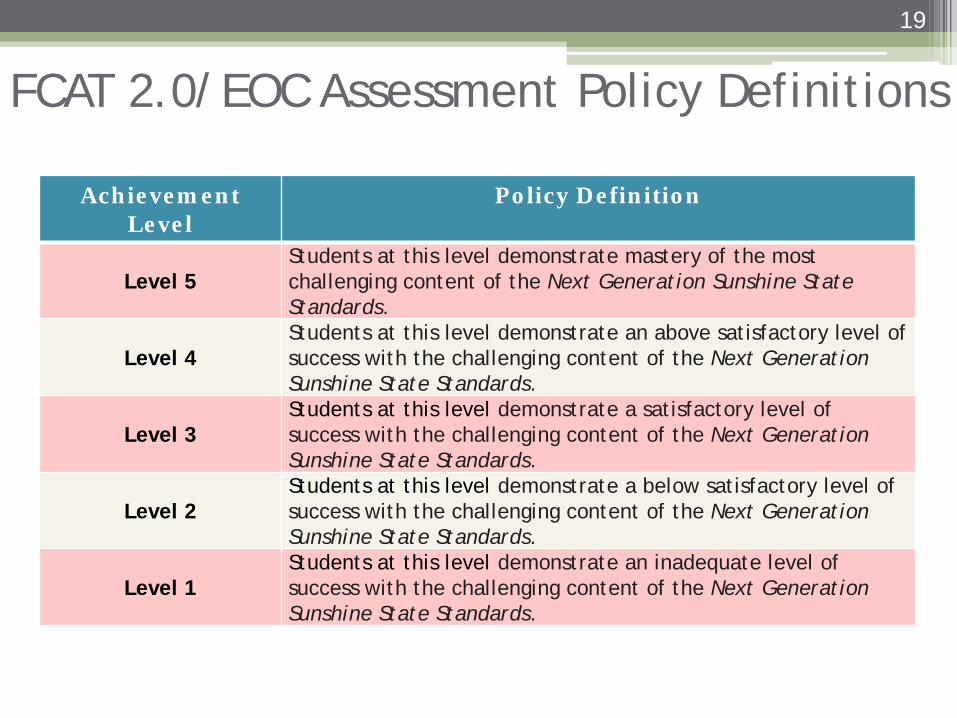
FCAT 2.0/EOC Assessment Policy Definitions
19
Achievement Level
Policy Definition
Level 5 Students at this level demonstrate mastery of the most challenging content of the Next Generation Sunshine State Standards.
Level 4 Students at this level demonstrate an above satisfactory level of success with the challenging content of the Next Generation Sunshine State Standards.
Level 3 Students at this level demonstrate a satisfactory level of success with the challenging content of the Next Generation Sunshine State Standards.
Level 2 Students at this level demonstrate a below satisfactory level of success with the challenging content of the Next Generation Sunshine State Standards.
Level 1 Students at this level demonstrate an inadequate level of success with the challenging content of the Next Generation Sunshine State Standards.
Achievement Level Descriptions (ALDs)
• Explain what a typical student at each Achievement Level should know and be able to do for every grade level and subject
• Developed by committees of educators and then posted for public review and comment
20

Educator Panel: September 18-21
• Approximately 80 teachers and district-level administrators with subject-area expertise and expertise with special populations
• Panel represented Florida’s diversity, including:
▫ Gender ▫ Ethnicity ▫ District Size
21
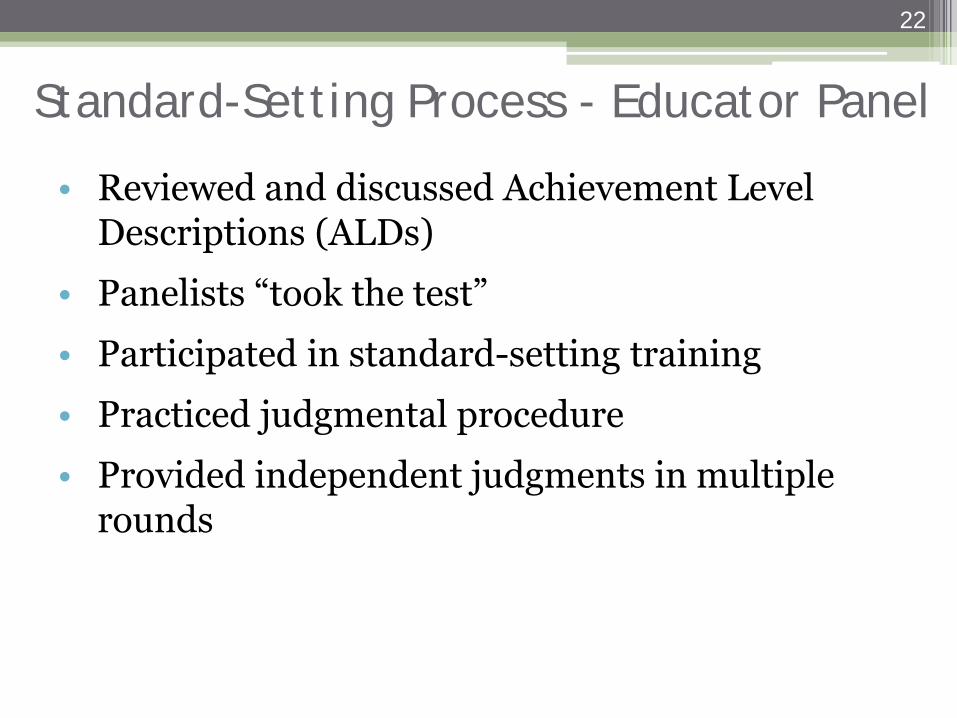
Standard-Setting Process - Educator Panel
• Reviewed and discussed Achievement Level Descriptions (ALDs)
• Panelists “took the test”
• Participated in standard-setting training
• Practiced judgmental procedure
• Provided independent judgments in multiple rounds
22
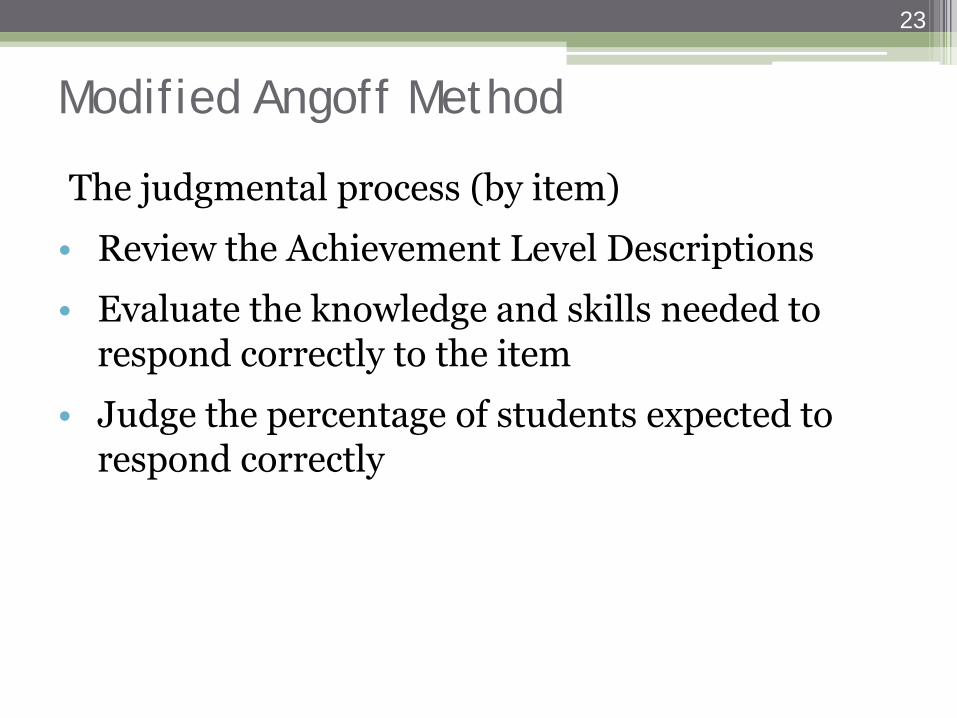
Modified Angoff Method
The judgmental process (by item)
• Review the Achievement Level Descriptions
• Evaluate the knowledge and skills needed to respond correctly to the item
• Judge the percentage of students expected to respond correctly
23
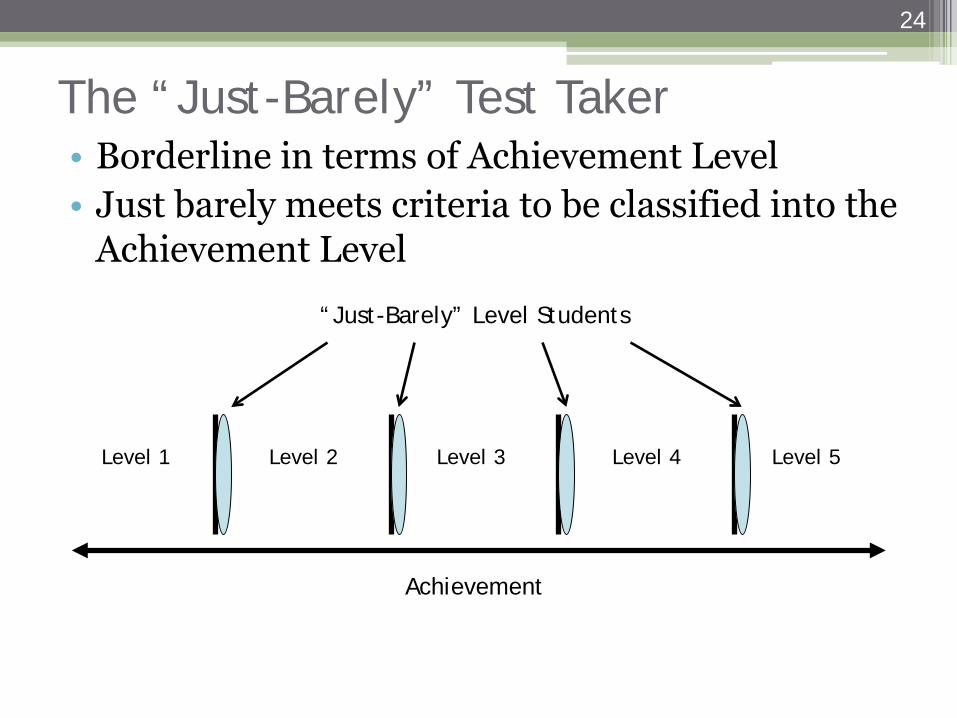
The “Just-Barely” Test Taker • Borderline in terms of Achievement Level • Just barely meets criteria to be classified into the
Achievement Level
24
Level 1 Level 2 Level 3 Level 4 Level 5
Achievement
“Just-Barely” Level Students

Reactor Panel: September 27-28
• Convened a group of diverse stakeholders from across Florida
• Provided feedback to the Department on the outcomes of the Educator Panel
25
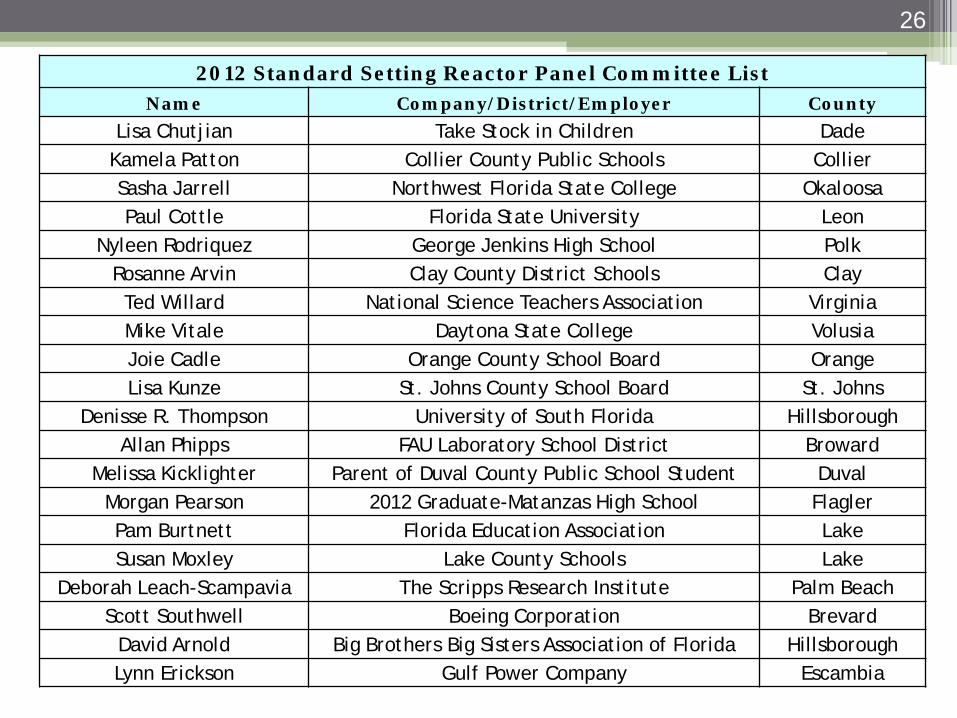
26
2012 Standard Setting Reactor Panel Committee List Name Company/District/Employer County
Lisa Chutjian Take Stock in Children Dade Kamela Patton Collier County Public Schools Collier Sasha Jarrell Northwest Florida State College Okaloosa Paul Cottle Florida State University Leon
Nyleen Rodriquez George Jenkins High School Polk Rosanne Arvin Clay County District Schools Clay Ted Willard National Science Teachers Association Virginia Mike Vitale Daytona State College Volusia Joie Cadle Orange County School Board Orange Lisa Kunze St. Johns County School Board St. Johns
Denisse R. Thompson University of South Florida Hillsborough Allan Phipps FAU Laboratory School District Broward
Melissa Kicklighter Parent of Duval County Public School Student Duval Morgan Pearson 2012 Graduate-Matanzas High School Flagler Pam Burtnett Florida Education Association Lake Susan Moxley Lake County Schools Lake
Deborah Leach-Scampavia The Scripps Research Institute Palm Beach Scott Southwell Boeing Corporation Brevard
David Arnold Big Brothers Big Sisters Association of Florida Hillsborough Lynn Erickson Gulf Power Company Escambia
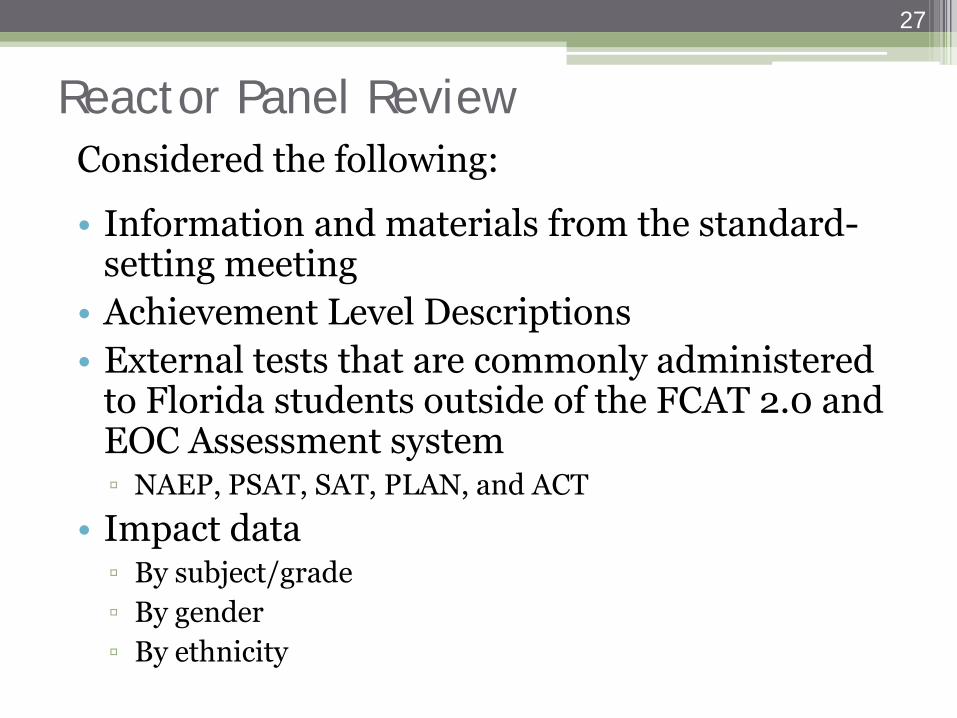
Reactor Panel Review Considered the following:
• Information and materials from the standard-setting meeting
• Achievement Level Descriptions • External tests that are commonly administered
to Florida students outside of the FCAT 2.0 and EOC Assessment system ▫ NAEP, PSAT, SAT, PLAN, and ACT
• Impact data ▫ By subject/grade ▫ By gender ▫ By ethnicity
27
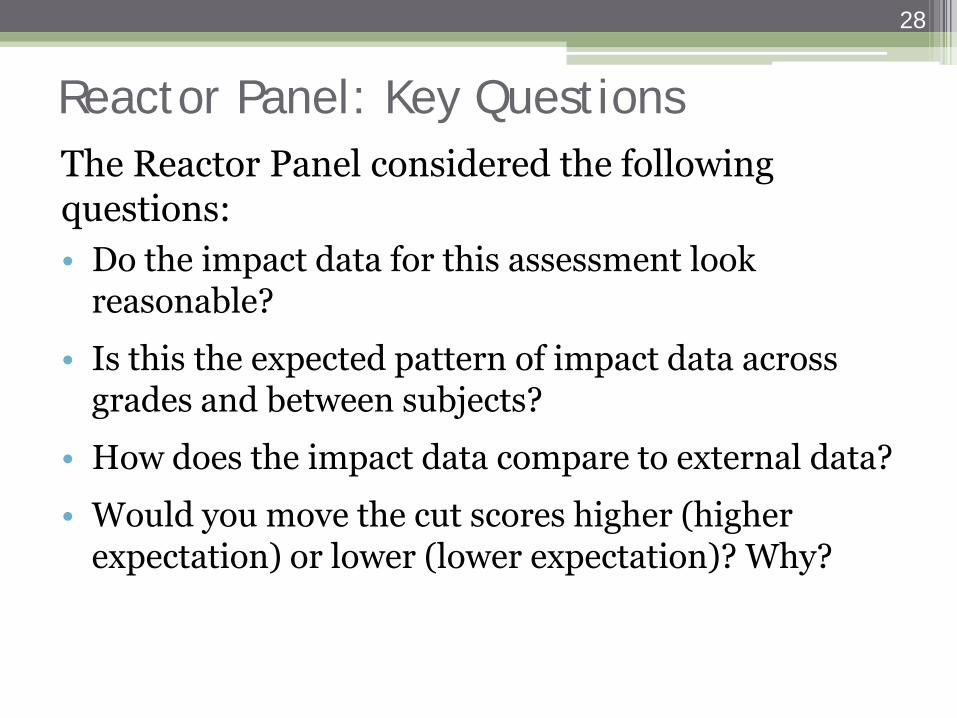
Reactor Panel: Key Questions The Reactor Panel considered the following questions: • Do the impact data for this assessment look
reasonable?
• Is this the expected pattern of impact data across grades and between subjects?
• How does the impact data compare to external data?
• Would you move the cut scores higher (higher expectation) or lower (lower expectation)? Why?
28
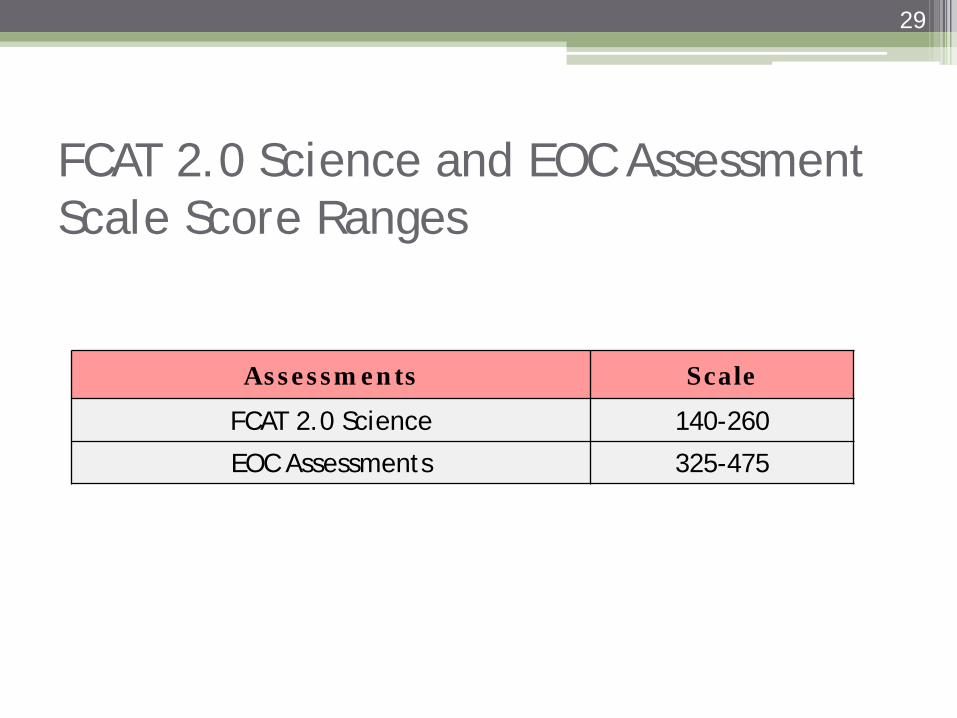
FCAT 2.0 Science and EOC Assessment Scale Score Ranges
29
Assessments Scale
FCAT 2.0 Science 140-260
EOC Assessments 325-475

The following slides represent recommendations from the Educator Panel. This panel was asked to make content-based judgments.
30
Educator Panel Recommendations and Impact Data
31
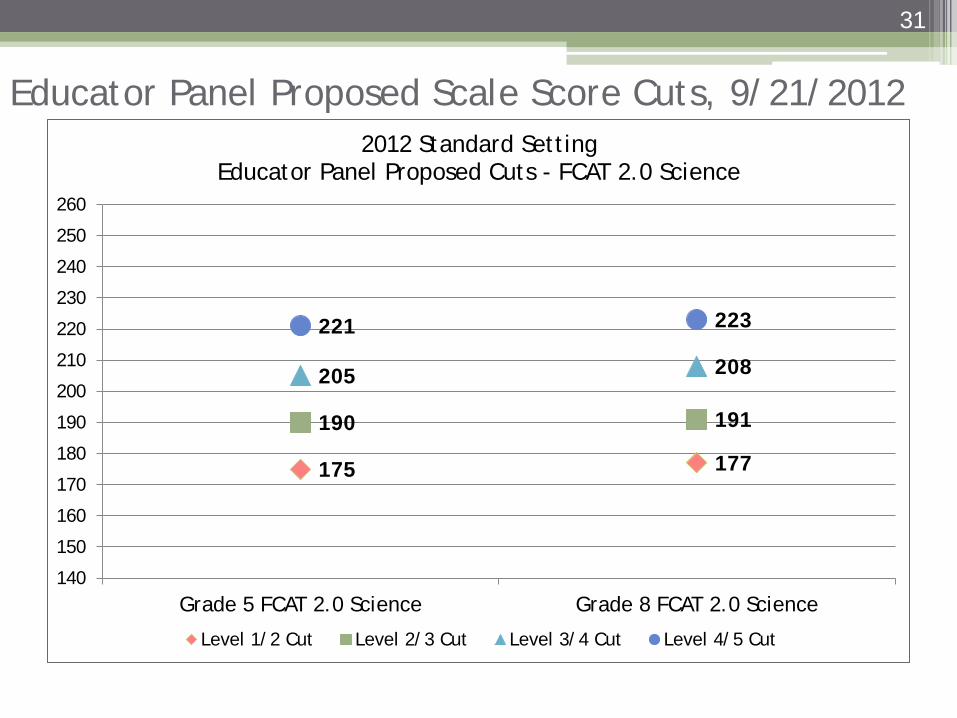
Educator Panel Proposed Scale Score Cuts, 9/21/2012
175 177
190 191
205 208
221 223
140
150
160
170
180
190
200
210
220
230
240
250
260
Grade 5 FCAT 2.0 Science Grade 8 FCAT 2.0 Science
2012 Standard Setting Educator Panel Proposed Cuts - FCAT 2.0 Science
Level 1/2 Cut Level 2/3 Cut Level 3/4 Cut Level 4/5 Cut
32
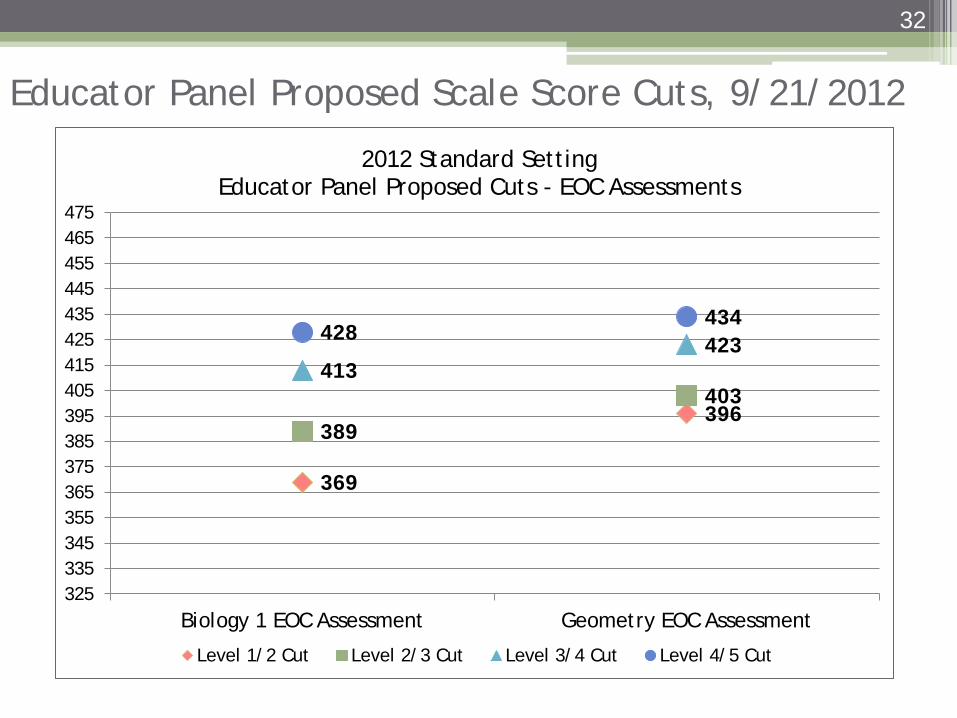
Educator Panel Proposed Scale Score Cuts, 9/21/2012
369
396 389
403 413
423 428 434
325 335 345 355 365 375 385 395 405 415 425 435 445 455 465 475
Biology 1 EOC Assessment Geometry EOC Assessment
2012 Standard Setting Educator Panel Proposed Cuts - EOC Assessments
Level 1/2 Cut Level 2/3 Cut Level 3/4 Cut Level 4/5 Cut
33
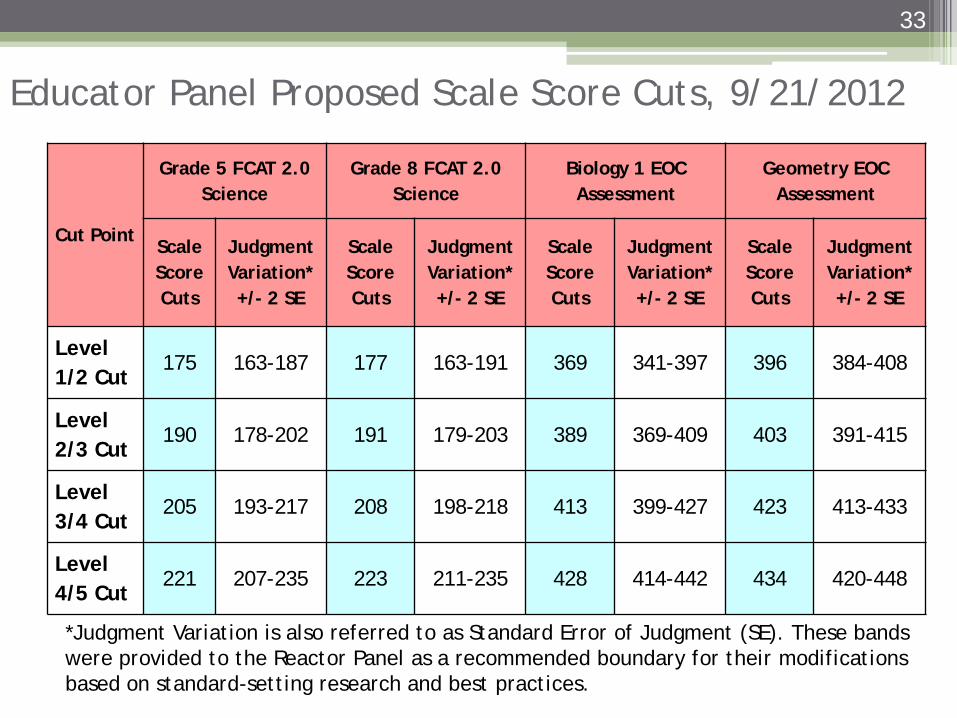
Educator Panel Proposed Scale Score Cuts, 9/21/2012
Cut Point
Grade 5 FCAT 2.0 Science
Grade 8 FCAT 2.0 Science
Biology 1 EOC Assessment
Geometry EOC Assessment
Scale Score Cuts
Judgment Variation* +/- 2 SE
Scale Score Cuts
Judgment Variation* +/- 2 SE
Scale Score Cuts
Judgment Variation* +/- 2 SE
Scale Score Cuts
Judgment Variation* +/- 2 SE
Level 1/2 Cut
175 163-187 177 163-191 369 341-397 396 384-408
Level 2/3 Cut
190 178-202 191 179-203 389 369-409 403 391-415
Level 3/4 Cut
205 193-217 208 198-218 413 399-427 423 413-433
Level 4/5 Cut
221 207-235 223 211-235 428 414-442 434 420-448
*Judgment Variation is also referred to as Standard Error of Judgment (SE). These bands were provided to the Reactor Panel as a recommended boundary for their modifications based on standard-setting research and best practices.
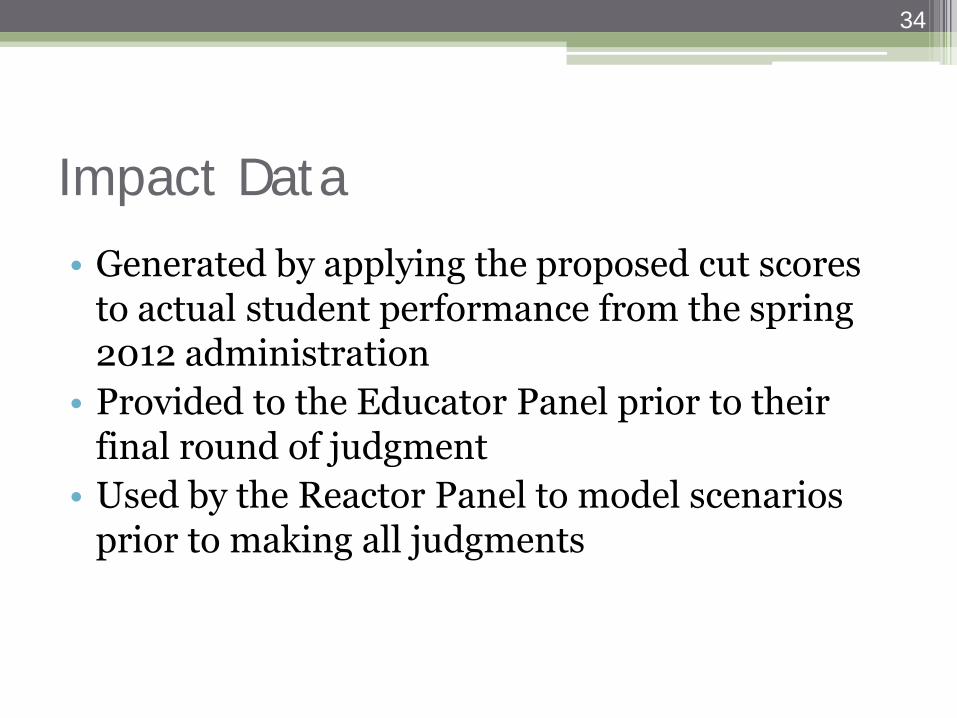
Impact Data
• Generated by applying the proposed cut scores to actual student performance from the spring 2012 administration
• Provided to the Educator Panel prior to their final round of judgment
• Used by the Reactor Panel to model scenarios prior to making all judgments
34
35
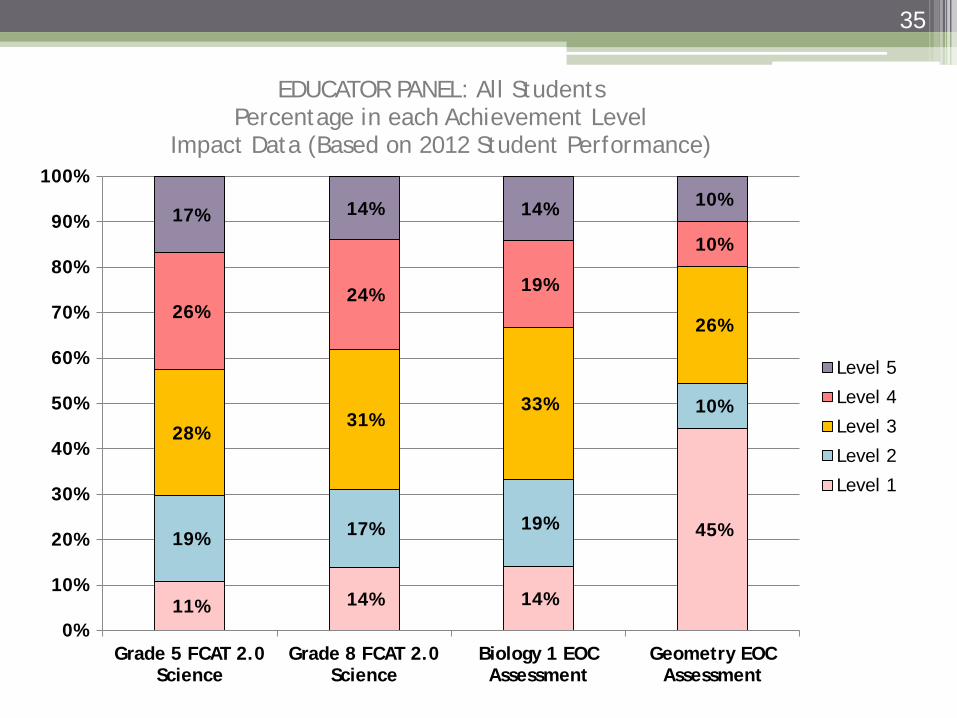
11% 14% 14%
45% 19% 17% 19%
10% 28%
31% 33%
26% 26%
24% 19%
10%
17% 14% 14% 10%
0%
10%
20%
30%
40%
50%
60%
70%
80%
90%
100%
Grade 5 FCAT 2.0 Science
Grade 8 FCAT 2.0 Science
Biology 1 EOC Assessment
Geometry EOC Assessment
EDUCATOR PANEL: All Students Percentage in each Achievement Level
Impact Data (Based on 2012 Student Performance)
Level 5
Level 4
Level 3
Level 2
Level 1
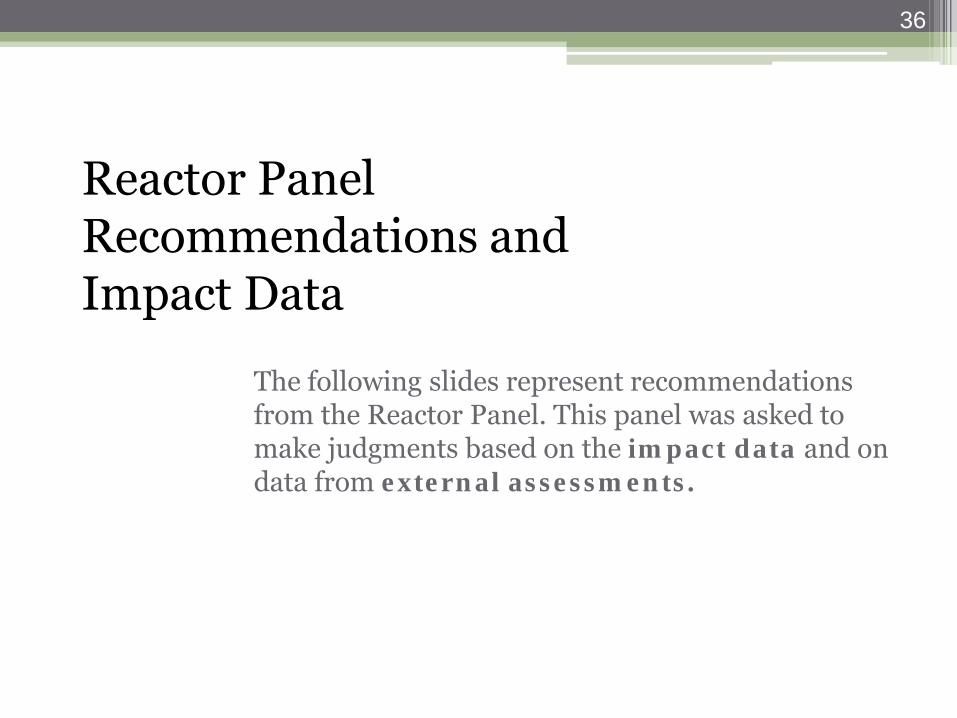
The following slides represent recommendations from the Reactor Panel. This panel was asked to make judgments based on the impact data and on data from external assessments.
36
Reactor Panel Recommendations and Impact Data
37
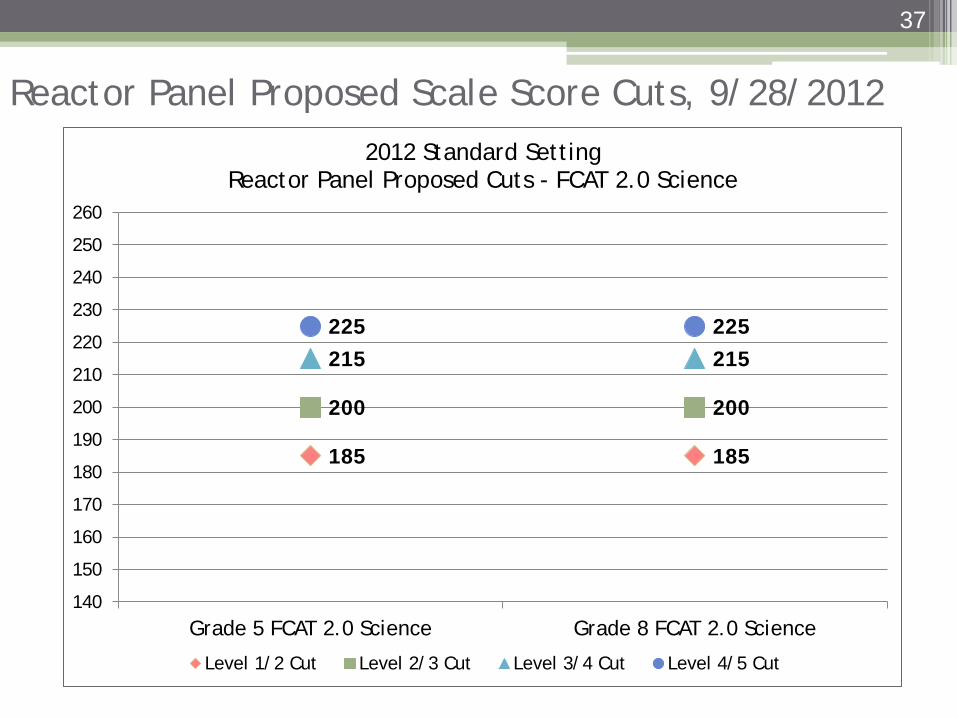
185 185
200 200
215 215 225 225
140
150
160
170
180
190
200
210
220
230
240
250
260
Grade 5 FCAT 2.0 Science Grade 8 FCAT 2.0 Science
2012 Standard Setting Reactor Panel Proposed Cuts - FCAT 2.0 Science
Level 1/2 Cut Level 2/3 Cut Level 3/4 Cut Level 4/5 Cut
Reactor Panel Proposed Scale Score Cuts, 9/28/2012
38
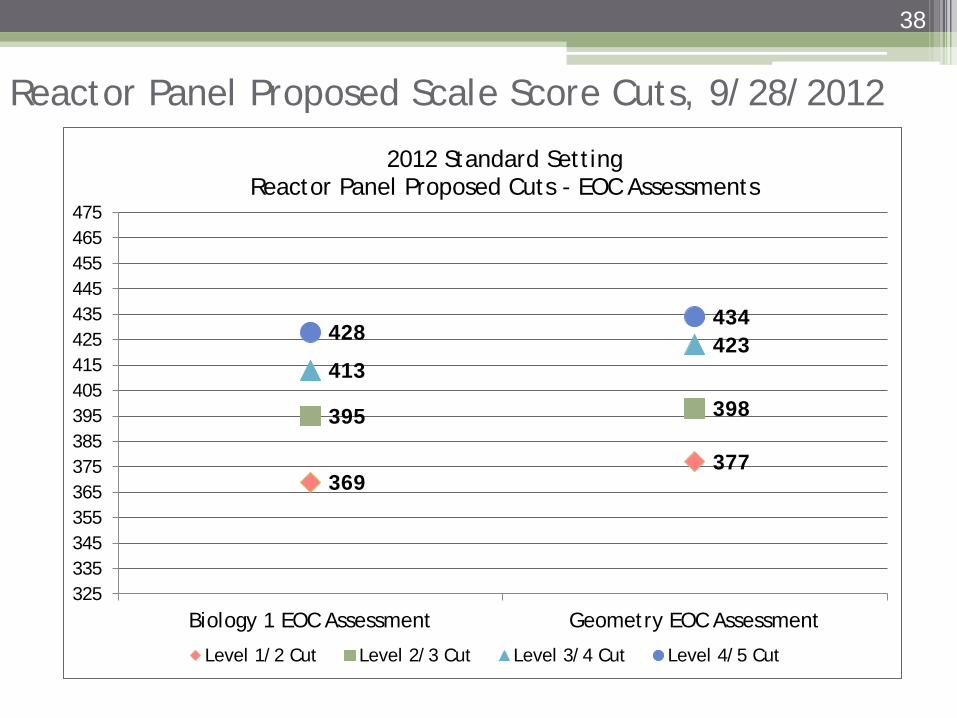
369 377
395 398
413 423 428 434
325 335 345 355 365 375 385 395 405 415 425 435 445 455 465 475
Biology 1 EOC Assessment Geometry EOC Assessment
2012 Standard Setting Reactor Panel Proposed Cuts - EOC Assessments
Level 1/2 Cut Level 2/3 Cut Level 3/4 Cut Level 4/5 Cut
Reactor Panel Proposed Scale Score Cuts, 9/28/2012

39
Reactor Panel Proposed Scale Score Cuts, 9/28/2012
Cut Point Committee
Grade 5 FCAT 2.0 Science
Grade 8 FCAT 2.0 Science
Biology 1 EOC Assessment
Geometry EOC Assessment
Scale Score Cuts
Judgment Variation +/- 2 SE
Scale Score Cuts
Judgment Variation +/- 2 SE
Scale Score Cuts
Judgment Variation +/- 2 SE
Scale Score Cuts
Judgment Variation +/- 2 SE
Level 1/2 Cut
Educator Panel
175 163-187 177 163-191 369 341-397 396 384-408
Reactor Panel
185 N/A 185 N/A 369 N/A 377 N/A
Level 2/3 Cut
Educator Panel
190 178-202 191 179-203 389 369-409 403 391-415
Reactor Panel
200 N/A 200 N/A 395 N/A 398 N/A
Level 3/4 Cut
Educator Panel
205 193-217 208 198-218 413 399-427 423 413-433
Reactor Panel
215 N/A 215 N/A 413 N/A 423 N/A
Level 4/5 Cut
Educator Panel
221 207-235 223 211-235 428 414-442 434 420-448
Reactor Panel
225 N/A 225 N/A 428 N/A 434 N/A

40
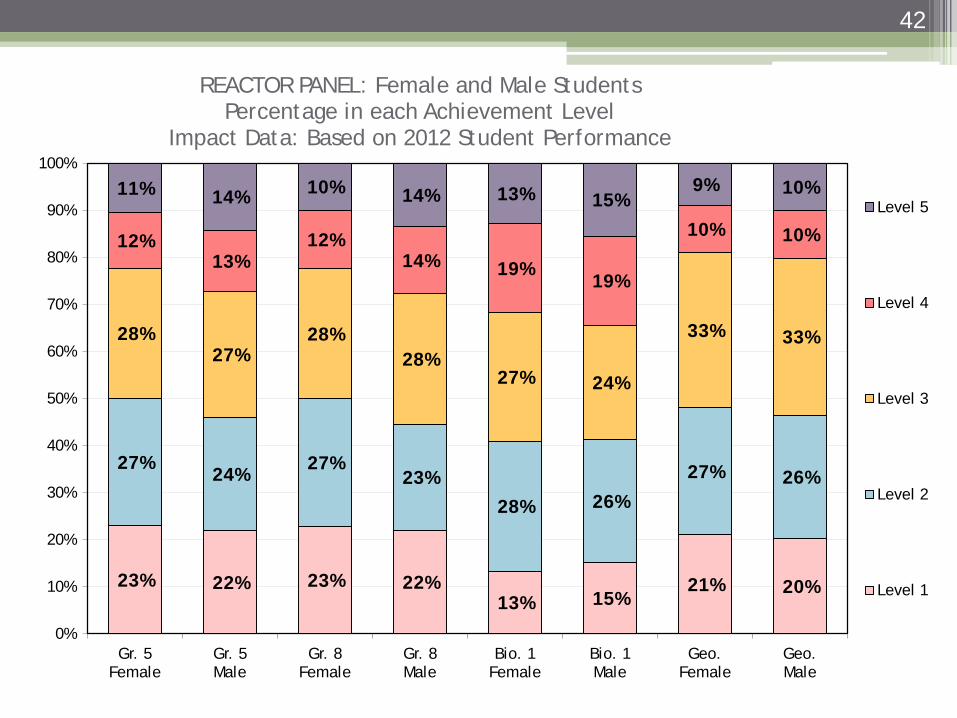
22% 22% 14%
21%
26% 25%
27%
27%
27% 28%
26%
33%
12% 13% 19%
10%
12% 12% 14% 10%
0%
10%
20%
30%
40%
50%
60%
70%
80%
90%
100%
Grade 5 FCAT 2.0 Science
Grade 8 FCAT 2.0 Science
Biology 1 EOC Assessment
Geometry EOC Assessment
REACTOR PANEL: All Students Percentage in each Achievement Level
Impact Data (Based on 2012 Student Performance)
Level 5
Level 4
Level 3
Level 2
Level 1

Educator Panel and Reactor Panel Proposed Cuts Reported/ Impact Data: Percentage of Students in each Achievement Level
41
Assessment Source
Percentage of 2012 Test Takers in Each Achievement Level
1 2 3 4 5 >3
Grade 5 FCAT 2.0 Science
Reported** 20% 29% 33% 12% 6% 51% Educator Panel 11% 19% 28% 26% 17% 70% Reactor Panel 22% 26% 27% 12% 12% 52% Final Rule TBD
Grade 8 FCAT 2.0 Science
Reported** 22% 31% 34% 9% 3% 46% Educator Panel 14% 17% 31% 24% 14% 69% Reactor Panel 22% 25% 28% 13% 12% 53% Final Rule TBD
Biology 1 EOC Assessment
Reported** Educator Panel 14% 19% 33% 19% 14% 67% Reactor Panel 14% 27% 26% 19% 14% 59% Final Rule TBD
Geometry EOC Assessment
Reported** Educator Panel 45% 10% 26% 10% 10% 46% Reactor Panel 21% 27% 33% 10% 10% 53% Final Rule TBD
**Reported in 2012 on the 2011 FCAT Science Scale using equipercentile linking
42
23% 22% 23% 22% 13% 15%
21% 20%
27% 24% 27%
23% 28% 26%
27% 26%
28% 27%
28% 28%
27% 24%
33% 33%
12% 13%
12% 14% 19%
19%
10% 10%
11% 14% 10% 14% 13% 15% 9% 10%
0%
10%
20%
30%
40%
50%
60%
70%
80%
90%
100%
Gr. 5 Female
Gr. 5 Male
Gr. 8 Female
Gr. 8 Male
Bio. 1 Female
Bio. 1 Male
Geo. Female
Geo. Male
REACTOR PANEL: Female and Male Students Percentage in each Achievement Level
Impact Data: Based on 2012 Student Performance
Level 5
Level 4
Level 3
Level 2
Level 1

13%
39%
25%
11% 23% 23% 17%
45% 22%
31%
27%
17%
28% 21%
25%
24%
30%
21%
27%
27%
28% 32%
28%
22%
16%
6%
11%
17%
9% 14% 14%
6% 18%
4% 9%
28%
11% 10% 14% 2%
0%
10%
20%
30%
40%
50%
60%
70%
80%
90%
100%
White African American
Hispanic Asian American Indian
Pacific Islander
Multiracial Unknown
REACTOR PANEL: Grade 5 FCAT 2.0 Science Students by Ethnicity Percentage in each Achievement Level
Impact Data: Based on 2012 Student Performance
Level 5
Level 4
Level 3
Level 2
Level 1
43
44
12%
39% 26%
10% 20% 18% 16%
36% 22%
30%
27%
16%
28% 28% 25%
33% 32%
21%
26%
26%
29% 32% 31%
17% 18%
7%
12%
19%
13% 10% 15%
9% 17%
4% 9%
29%
10% 13% 14% 4%
0%
10%
20%
30%
40%
50%
60%
70%
80%
90%
100%
White African American
Hispanic Asian American Indian
Pacific Islander
Multiracial Unknown
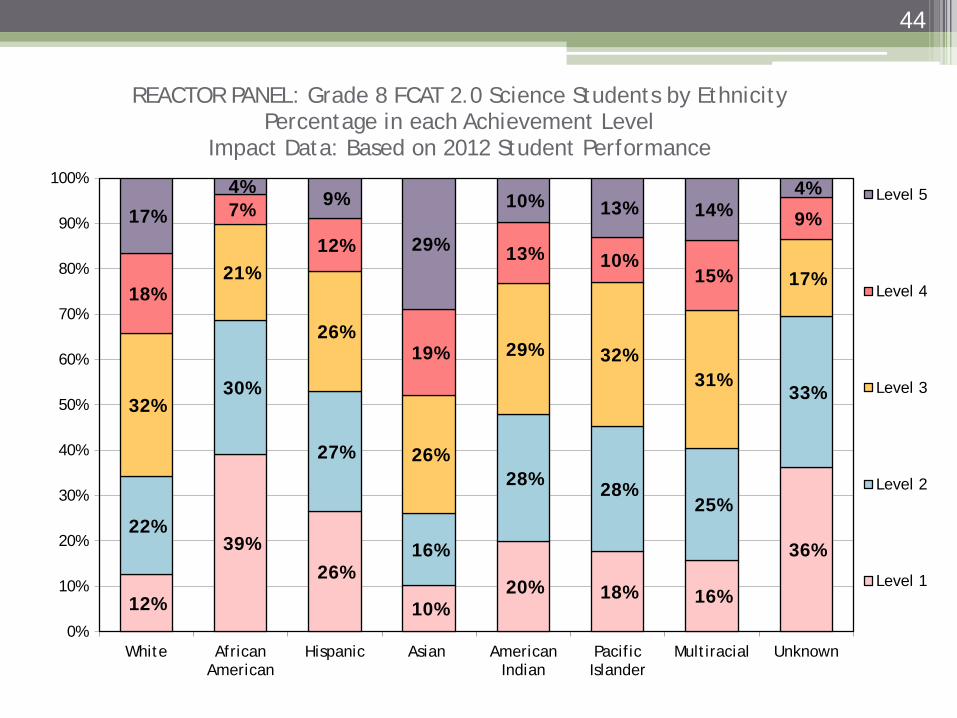
REACTOR PANEL: Grade 8 FCAT 2.0 Science Students by Ethnicity Percentage in each Achievement Level
Impact Data: Based on 2012 Student Performance
Level 5
Level 4
Level 3
Level 2
Level 1

45
8%
26% 17%
7% 12% 16%
10% 14%
22%
36%
29%
15%
26% 27%
24%
57% 27%
23%
26%
22%
32% 21%
27%
14%
23%
11%
17%
24%
19% 17% 22%
14% 20%
5% 10%
32%
11% 18% 17%
0%
0%
10%
20%
30%
40%
50%
60%
70%
80%
90%
100%
White African American
Hispanic Asian American Indian
Pacific Islander
Multiracial Unknown
REACTOR PANEL: Biology 1 EOC Students by Ethnicity Percentage in each Achievement Level
Impact Data: Based on 2012 Student Performance
Level 5
Level 4
Level 3
Level 2
Level 1

46
12%
37% 24%
8% 20% 18% 15%
38% 23%
33%
29%
14%
29% 28%
25%
31% 38%
24%
32%
32%
34% 29% 36%
31% 13%
4% 9%
17%
9% 10% 11%
0% 13%
2% 7%
29%
9% 15% 12%
0%
0%
10%
20%
30%
40%
50%
60%
70%
80%
90%
100%
White African American
Hispanic Asian American Indian
Pacific Islander
Multiracial Unknown
REACTOR PANEL: Geometry EOC Students by Ethnicity Percentage in each Achievement Level
Impact Data: Based on 2012 Student Performance
Level 5
Level 4
Level 3
Level 2
Level 1

Historical Data – Grade 5, Achievement Level 1 FCAT Science (2003-2011) and FCAT 2.0 Science (2012)
47
24% 22% 17% 16% 14% 13% 12% 10% 11% 11%
63% 61%
51% 51%
44% 41%
37% 34% 34% 35%
47% 47%
37% 34% 32%
28% 27% 23% 22% 22%
0%
10%
20%
30%
40%
50%
60%
70%
80%
90%
100%
2003 2004 2005 2006 2007 2008 2009 2010 2011 2012
White African-American Hispanic
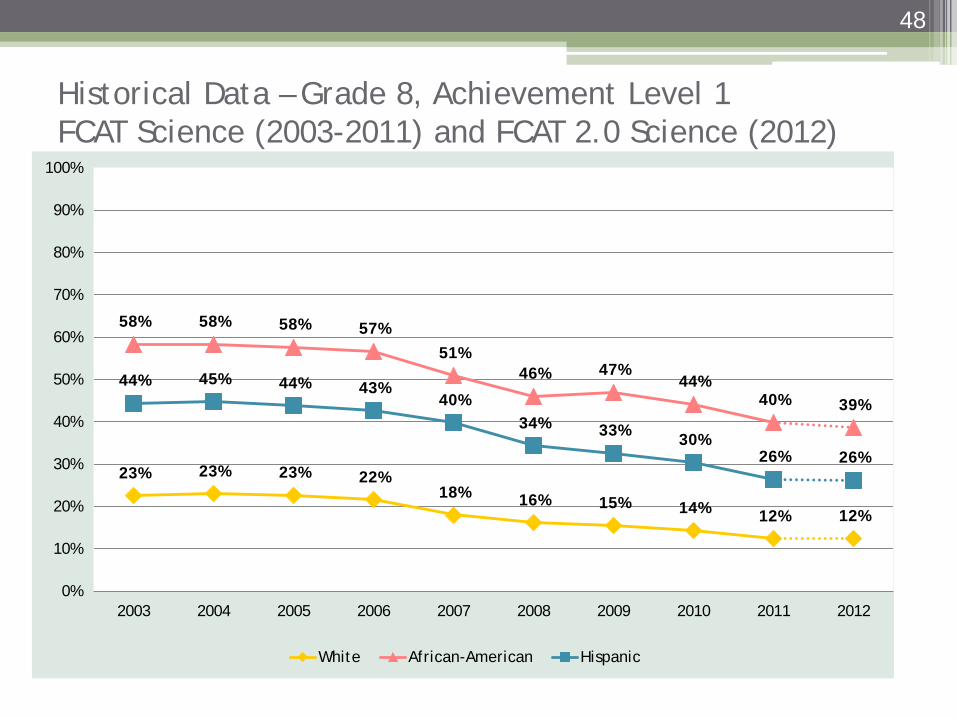
Historical Data – Grade 8, Achievement Level 1 FCAT Science (2003-2011) and FCAT 2.0 Science (2012)
48
23% 23% 23% 22% 18% 16% 15% 14% 12% 12%
58% 58% 58% 57% 51%
46% 47% 44%
40% 39% 44% 45% 44% 43%
40% 34% 33% 30%
26% 26%
0%
10%
20%
30%
40%
50%
60%
70%
80%
90%
100%
2003 2004 2005 2006 2007 2008 2009 2010 2011 2012
White African-American Hispanic
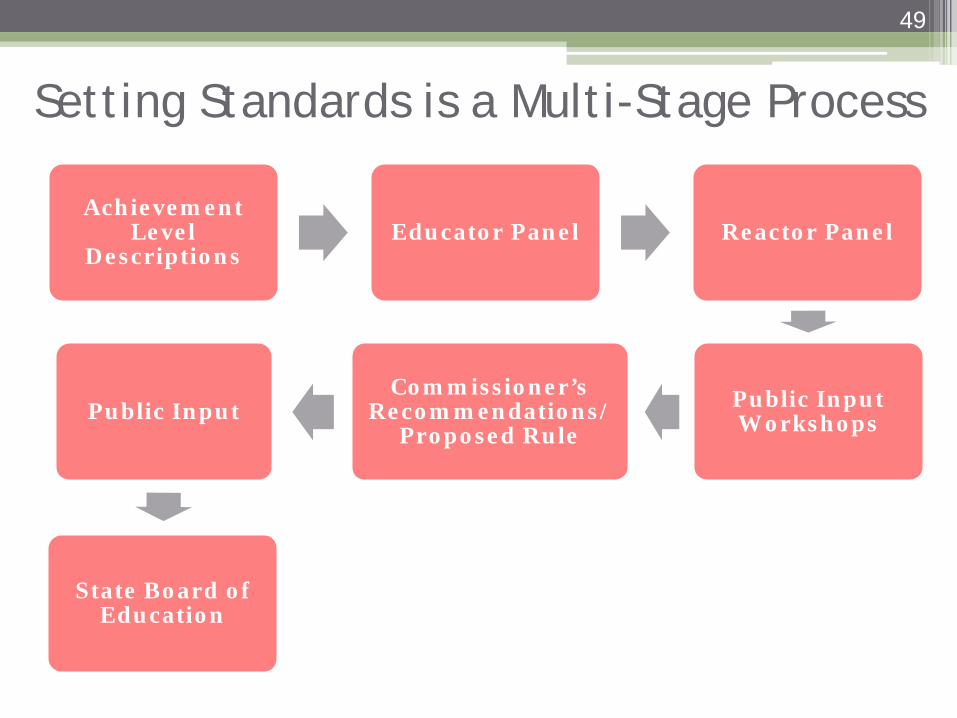
Setting Standards is a Multi-Stage Process
49
Achievement Level
Descriptions Educator Panel Reactor Panel
Public Input Workshops
Commissioner’s Recommendations/
Proposed Rule Public Input
State Board of Education

Standard-Setting Timeline
Month/Year Task
September 2012 Advertise Intent to Revise FCAT Rule
September 18-21, 2012 Conduct Standard-Setting Meetings – Tallahassee, FL 15-20 Educators per Subject/Grade (4 panels)
September 27-28, 2012 Conduct Reactor Panel Meeting – Tallahassee, FL 20-25 Superintendents and Community Leaders (1 panel)
October 15, 16, and 18, 2012
Conduct Rule-Development Workshops and Advertise Proposed State Board of Education FCAT Rule
December 2012 State Board of Education Rule Adoption – New Achievement Levels for FCAT 2.0 Science, and Biology 1 EOC, and Geometry EOC Assessments
50
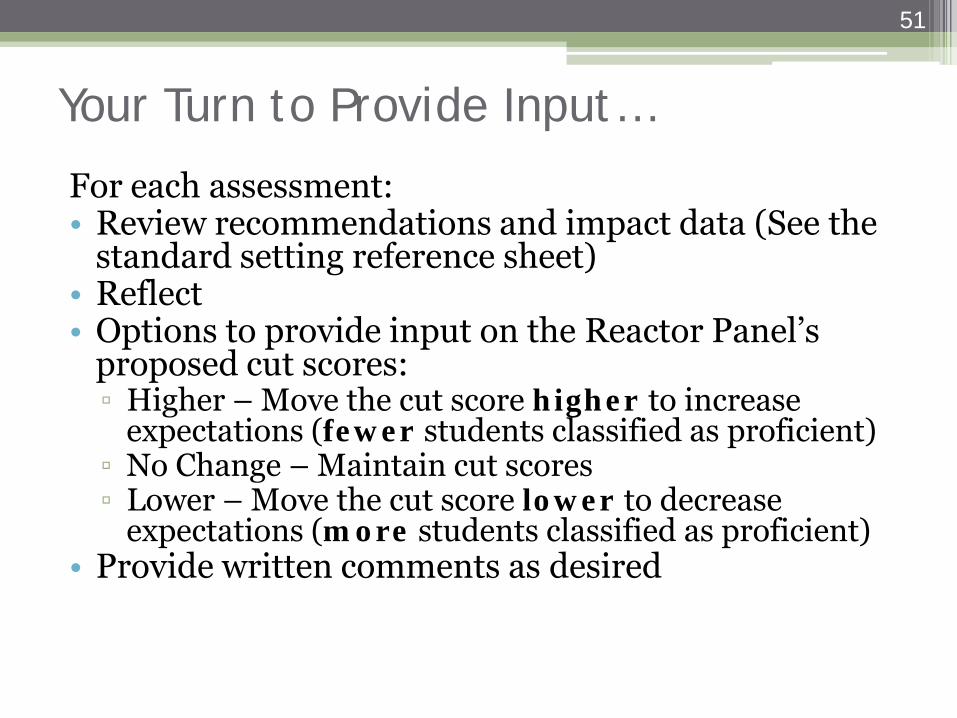
Your Turn to Provide Input…
For each assessment: • Review recommendations and impact data (See the
standard setting reference sheet) • Reflect • Options to provide input on the Reactor Panel’s
proposed cut scores: ▫ Higher – Move the cut score higher to increase
expectations (fewer students classified as proficient) ▫ No Change – Maintain cut scores ▫ Lower – Move the cut score lower to decrease
expectations (more students classified as proficient) • Provide written comments as desired
51
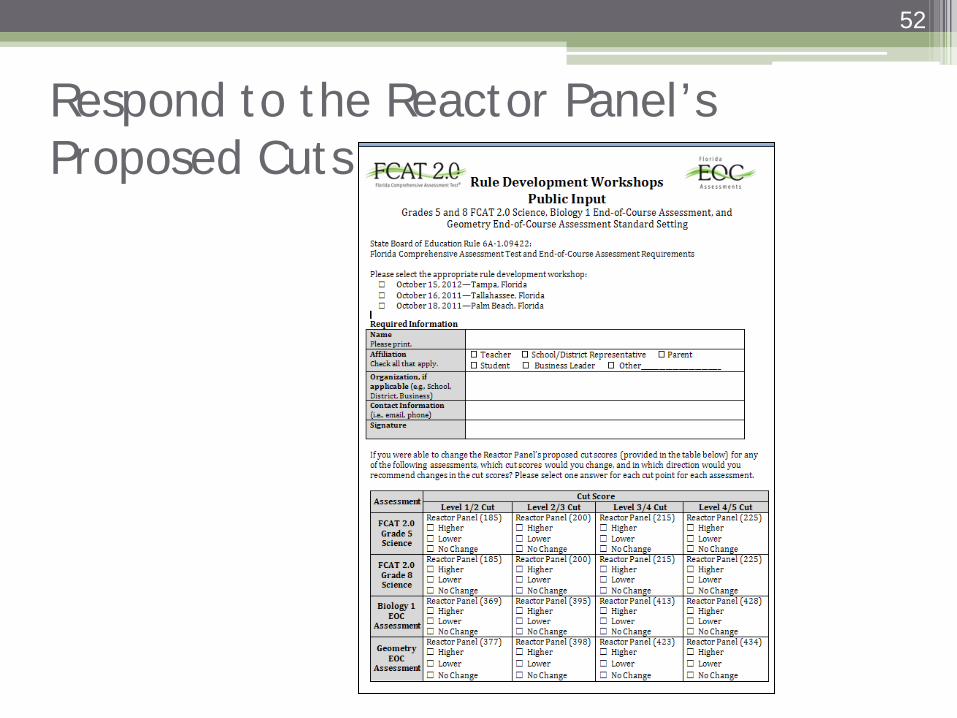
Respond to the Reactor Panel’s Proposed Cuts
52

Thank you for participating in the 2012 standard-setting process.
53
Updated information will be posted to: http://fcat.fldoe.org/standardsetting.asp