grading standards in education departments - eric · grading standards in education departments 1...
TRANSCRIPT

Grading Standards in Education Departments 1
education policy analysis archives A peer-reviewed, independent, open access, multilingual journal
Arizona State University
Volume 19 Number 23 20th of August 2011 ISSN 1068-2341
Grading Standards in Education Departments at Universities
Cory Koedel
University of Missouri Citation: Koedel, C. (2011) Grading Standards in Education Departments at Universities. Education Policy Analysis Archives, 19 (23). Retrieved [date], from http://epaa.asu.edu/ojs/article/view/905
Abstract: Students who take classes in education departments at universities receive significantly higher grades than students who take classes in other academic departments. The higher grades awarded by education departments cannot be explained by differences in student quality or by structural differences across departments (i.e., differences in class sizes). The remaining explanation is that the higher grades are the result of lower grading standards. This paper formally documents the grading-standards problem in education departments using administrative grade data from the 2007-2008 academic year. Because a large fraction of the teachers in K-12 schools receive training in education departments, I briefly discuss several possible consequences of the low grading standards for teacher quality in K-12 schools. Keywords: grade inflation; teacher training; teacher university training; education department grades; education school grades. Estándares de Evaluación en los Departamentos de Educación en las Universidades Resumen: Los estudiantes que estudian en los departamentos de la educación en las universidades reciben valoraciones muy superiores a los estudiantes que estudian en otros departamentos. Las calificaciones más altas dadas por departamentos de educación no se pueden explicar por las diferencias de calidad de los estudiantes o de las diferencias estructurales entre los departamentos (diferencias en el tamaño de clases, por ejemplo). En este artículo se investiga formalmente el problema de los estándares de evaluación en departamentos de la educación mediante el uso de los datos de evaluación académica en el período 2007-2008. Como muchos profesores de educación
epaa aape

Education Policy Analysis Archives Vol. 19 No. 23 2
básica (K-12) son formados en departamentos de formación docente, también se discuten las consecuencias de el bajo nivel de evaluación sobre la calidad de los maestros en educación básica (K-12) Palabras clave: inflación evaluación; la formación profesor; la universidad de formación del profesorado; evaluaciones del departamento de educación; puntuaciones educación universitaria. Padrões de Avaliação nos Departamentos de Educação nas Universidades Resumo: Os alunos que estudam nos departamentos de educação nas universidades recebem avaliações muito mais altas do que os alunos que estudam em outros departamentos. As avaliações maiores dadas pelos departamentos de educação não podem ser explicadas pelas diferenças de qualidade do aluno ou pelas diferenças estruturais entre departamentos (diferenças de tamanho das classes, por exemplo). Este artigo investiga formalmente o problema de padrões de avaliação nos departamentos de educação usando dados de avaliação administrativa no período acadêmico 2007-2008. Como grande parte dos professores nas escolas K-12 recebem treinamento nos departamentos de educação, discuto também várias consequências possíveis dos baixos padrões de avaliação para a qualidade do professor nas escolas K-12. Palavras-chave: inflação de avaliação; treinamento de professor; treinamento de professor universitário; avaliações do departamento de educação; avaliações do colégio de educação.
Introduction
There is a large and growing research literature showing that teacher quality is an important determinant of student success (recent studies include Aaronson et al., 2007; Koedel, 2008; Nye et al., 2004; Rivkin et al., 2005; Rockoff, 2004). But while there is persistent research into a variety of interventions aimed at improving teacher quality, surprisingly little attention has been paid to the primary training ground for K-12 teachers—education departments at universities. This paper provides an evaluation of the grading standards in these education departments. I show that education students receive higher grades than do students in every other academic discipline. The grading discrepancies that I document cannot be explained by differences between education and non-education departments in student quality, or by structural differences across departments. The likely explanation is grade inflation.
The earliest evidence on the grading-standards problem in education departments comes from Weiss and Rasmussen in 1960. They showed that undergraduate students taking classes in education departments were twice as likely to receive an “A” when compared to students taking classes in business or liberal arts departments. The low grading standards in education departments, illustrated by these authors over 50 years ago, are still prevalent today.
I document the disparity in current grading standards between education departments and twelve other academic departments that are common to most universities using administrative data from the 2007-2008 academic year. The comparison departments include (1) math, science and economics departments: biology, chemistry, computer science, economics, mathematics and physics; (2) social-science departments: political science, psychology and sociology; and (3) humanities departments: English, history and philosophy.1 With great consistency, the data show that the grades awarded by education departments are substantially higher than the grades awarded by all other academic departments.
1 Although economics is a social science, the grade distributions in economics are much more similar to the hard sciences, and as such, they are grouped together for the analysis here.

Grading Standards in Education Departments 3
The primary purpose of this paper is to highlight the magnitude of the current grading-standards discrepancy between education and non-education departments. Anecdotally, although most people seem to be aware that grading standards are lower in education departments, the magnitude of the difference does not seem to be well understood. It would also be of interest to evaluate the policy implications of the low grading standards in education departments – for example, they are likely to affect the quality of the K-12 teaching workforce. But a formal analysis along these lines seems virtually impossible given current data conditions. More concretely, there appears to be little in the way of meaningful variation in grading standards across education departments at different universities (see below), or within education departments over time (Weiss and Rasmussen, 1960). Without this variation, researchers cannot evaluate the counterfactual impact of more-stringent grading standards in education departments. The lack of variation in the data, and the corresponding lack of rigorous research on this topic, however, should not be viewed as a verdict on the importance of the grading-standards problem. The low grading standards in education departments may have a large impact on the delivery of K-12 education in the United States despite our difficulty in formally evaluating this issue.
Although data limitations prevent a formal analysis, I draw on evidence from the broader research literature to consider several ways that the low grading standards in education departments may affect teacher quality in K-12 schools. First, Babcock (2010) shows that grade inflation in college reduces student effort, which in turn, reduces human-capital accumulation (Stinebrickner and Stinebrickner, 2008). 2 Under fairly modest conditions, lower human-capital accumulation among prospective teachers in college will negatively affect teacher quality in K-12 schools. Second, there is a striking similarity between the low grading standards in education departments and the low evaluation standards for teachers in the workforce (see, for example, Harris and Sass, 2010; Jacob and Lefgren, 2008; TNTP, 2009). Murphy and Cleveland (1991) indicate that employee evaluations can be affected by contextual norms – if the low grading standards to which prospective K-12 teachers are exposed in college affect their expectations in the workforce, this may affect their evaluations in schools. The low evaluation standards for teachers in K-12 schools have been identified as a likely impediment to student achievement by The New Teacher Project (TNTP, 2009). Finally, the grading standards in education departments are so low that grades cannot be used to meaningfully distinguish students. In other departments, grades signal information about performance to students, allowing them to sort into disciplines for which they are well-matched (Arcidiacono, 2004; Michaels, 1976). There appears to be no such role for grades in education departments—students who are poorly-matched for teaching careers are unlikely to receive any indication that this is the case in their grade reports.3
Data In my primary analysis I evaluate data from three large, public universities that have sizeable
undergraduate programs in education – Indiana University, Bloomington; Miami University, Oxford (Ohio); and the University of Missouri, Columbia. Total enrollments at these universities in the fall of 2007 were approximately 39,000, 16,000 and 28,000, respectively. The dataset includes the
2 Although Babcock provides the only causal estimates of the effects of grading standards in college on student effort of which I am aware, similar results are found elsewhere. For example, Figlio and Lucas (2004) show that students benefit from higher grading standards in elementary schools. 3 Arcidiacono (2004) shows that students sort across college majors using information about grades, which is consistent with grades providing information to individuals about their relative strengths and weaknesses. In a different context, Michaels (1976) provides a general discussion of the role of grades at universities, specifically noting their role in sorting students.

Education Policy Analysis Archives Vol. 19 No. 23 4
universe of undergraduate classroom-level grade reports from administrative data for each university for the 2007-2008 academic year. I use these grade reports to characterize the distributions of classroom-level grades awarded by academic department.4
I compare the grade distributions found in the education departments to those in the 12 academic departments listed above. These departments were chosen to ensure that the major academic departments found at most universities are represented in the data. In results omitted for brevity, I show that adding additional smaller departments to the comparisons, such as anthropology or human studies, does not affect the findings.
All three universities designate a level ranging from one to four for each undergraduate class. The levels roughly correspond to first-year, second-year, third-year, and fourth-year classes. I focus on all classes that are designated as level-2 or higher because education departments offer very few level-1 classes. Because the level assigned to most classes beyond the introductory level will be endogenous to some extent (e. g. , most classes that are designated as level-4 could also be designated as level-3, and vice versa), I do not distinguish by course-level in the analysis. However, note that class-level designations are of no consequence to the results—my findings can be replicated within class-level.
Table 1 reports the average class size, the number of classrooms observed, and the number of student-by-classroom observations for each department-by-university in the primary dataset. Overall, the data include grade reports from 2,902 classrooms across the three universities, 665 of which are education classes. Over 100,000 student-by-classroom observations underlie the classroom-level grade reports.
The three universities that are the focus of the primary analysis are a convenience sample – these universities post classroom-level grades and enrollment information online. Most universities do not make such data available; but at considerable expense, Myedu.com has constructed a database with course-level grade information for all of the major public universities in the United States.5 Below, I use the Myedu.com data to confirm that the grade distributions from the education departments in the convenience sample are not unique.
Grade Distributions Table 2 reports classroom-level average GPAs, unweighted and weighted by classroom
enrollments, and the distribution of classroom-level GPAs by university and department-group. The
simple-average GPAs are calculated as , where n indexes classrooms, j indexes
departments, Nj indicates the number of classroom observations in department j, and J indicates the number of departments in each group. The enrollment-weighted averages weight each classroom-level GPA by enrollment before taking the across-group average. The weighted and unweighted averages are always very similar and to the extent that they differ, the weighted GPA comparisons suggest even larger GPA gaps between education and other departments. Comparisons at the individual-department level are shown in Appendix Table A.1.
4 I use the term “classroom” to mean “lecture” – that is, I do not treat teaching-assistant “sections” of the same lecture as separate classes. 5 Myedu.com collects administrative grade data directly from universities by invoking the Freedom of Information Act (in most cases). Although the information they collect is “free”, they are required to pay the costs associated with processing their data requests at each university, which are often in the thousands of dollars. Myedu.com also expends considerable effort to ensure that they are getting the proper information from each university.

Grading Standards in Education Departments 5
Table 2 shows that there are substantial differences in the grade distributions between education and non-education departments. The classroom-level average GPAs in the education departments are 0.5 to 0. 8 grade points higher than in the other department groups. The GPA gaps are even larger at the bottom of the distribution.
Figure 1 graphically illustrates the grade distributions at each university in the convenience sample. The graphs in the figure are cluttered, but that is largely the point: while all other university departments work in one space, education departments work in another. Notice that it is generally difficult to distinguish which department is which, with the exception that the distributions from the education departments are quite obvious.

6
Table 1. Average Class Sizes, Numbers of Classrooms Observed, and Numbers of Student-by-Classroom Observations that Underlie the Grade Report Data by University and Department.
Math and Science Related Majors Social Science Majors Humanities Majors Educ Bio* Chem* Comp Sci Econ Math Physics Poly Sci Psych Soc Eng Hist Phil Indiana Univ Avg. Class Size 20.0 51.6 88.3 16.9 68.2 31.4 56.5 43.0 46.5 49.4 22.7 40.5 24.9 Number of Classes 451 75 34 50 100 77 31 68 114 53 198 92 28 Student-by-Classroom Obs. 9020 3870 3002 845 6820 2418 1752 2924 5301 2618 4495 3726 697 Miami Univ (OH) Avg. Class Size 21.3 22.2* 55.4* 16.9 43.9 21.4 15.7 34.9 35.0 23.4 24.1 26.5 21.5 Number of Classes 120 21* 36* 39 93 67 11 88 101 35 132 74 19 Student-by-Classroom Obs. 2556 466* 1994* 659 4083 1434 173 3071 3535 819 3181 1961 409 Univ of Missouri Avg. Class Size 29.7 51.6 115.3 27.0 64.6 23.4 80.2 44.7 73.5 70.2 20.0 44.6 30.1 Number of Classes 94 48 16 26 33 66 14 49 79 42 142 57 29 Student-by-Classroom Obs. 2792 2477 1845 702 2132 1544 1123 2190 5807 2948 2840 2542 873
* Miami University (OH) does not have a biology department and combines its chemistry and biochemistry departments. In place of the biology department, I use the microbiology department, and I report data from the “chemistry and biochemistry” department under the “chemistry” label.

7
Table 2. GPA Comparisons Between Education and Other Department Groups.
Education Math, Science, Economics
Social Sciences Humanities
Indiana University Weighted Average GPA 3.65 2.88 3.07 2.98 Simple Average GPA 3.66 3.05 3.17 3.07 GPA Gap (simple average) 0.61 0.49 0.59 90th percentile 3.98 3.63 3.79 3.57 75th percentile 3.91 3.37 3.41 3.33 25th percentile 3.49 2.71 2.89 2.79 10th percentile 3.27 2.52 2.69 2.61 Average Class Size 20.0 52.2 46.3 29.4 Average # of Classes per Dept 451 61.2 78.3 106.0 Miami Univ (OH) Weighted Average GPA 3.71 2.89 3.00 3.17 Simple Average GPA 3.73 2.91 3.05 3.20 GPA Gap (simple average) 0.82 0.68 0.53 90th percentile 4.00 3.39 3.61 3.63 75th percentile 3.95 3.18 3.38 3.39 25th percentile 3.58 2.64 2.69 3.00 10th percentile 3.28 2.43 2.49 2.76 Average Class Size 21.3 29.3 31.1 24.0 Average # of Classes per Dept 120 44.5 74.7 75.0 Univ of Missouri Weighted Average GPA 3.73 2.92 3.03 3.12 Simple Average GPA 3.80 2.99 3.12 3.16 GPA Gap (simple average) 0.81 0.68 0.64 90th percentile 4.00 3.52 3.55 3.65 75th percentile 3.97 3.25 3.37 3.40 25th percentile 3.71 2.69 2.88 2.89 10th percentile 3.50 2.55 2.71 2.66 Average Class Size 29.7 60.4 62.8 31.6 Average # of Classes per Dept 94 33.8 56.7 76.0
Notes: Majors included in the “Math, Science, Economics” group are biology, chemistry, computer science, economics, math and physics. Majors included in the “Social Sciences” group are political science, psychology and sociology. Majors included in the “Humanities” group are English, history and political science. Appendix Table A.1 reports disaggregated departmental data.

8
!"#$%"%&'"$()*+$,- '"$()*+$,-&./&0$%1$&234$.5&
& &&
'"$()*+$,-&./&0$++.6*$&&
&
&
Figure 1. Probability Density Functions of Classroom-Level GPAs by University and Department, Shown from GPA =1 to GPA =4. The Graphs are for Grade Distributions at Indiana University, University of Miami (Ohio), and University of Missouri. Education Departments are denoted by solid lines; Math and Science Departments are denoted by dashed lines; Social Science Departments are denoted by x’s; Humanities Departments are denoted by circles.

9
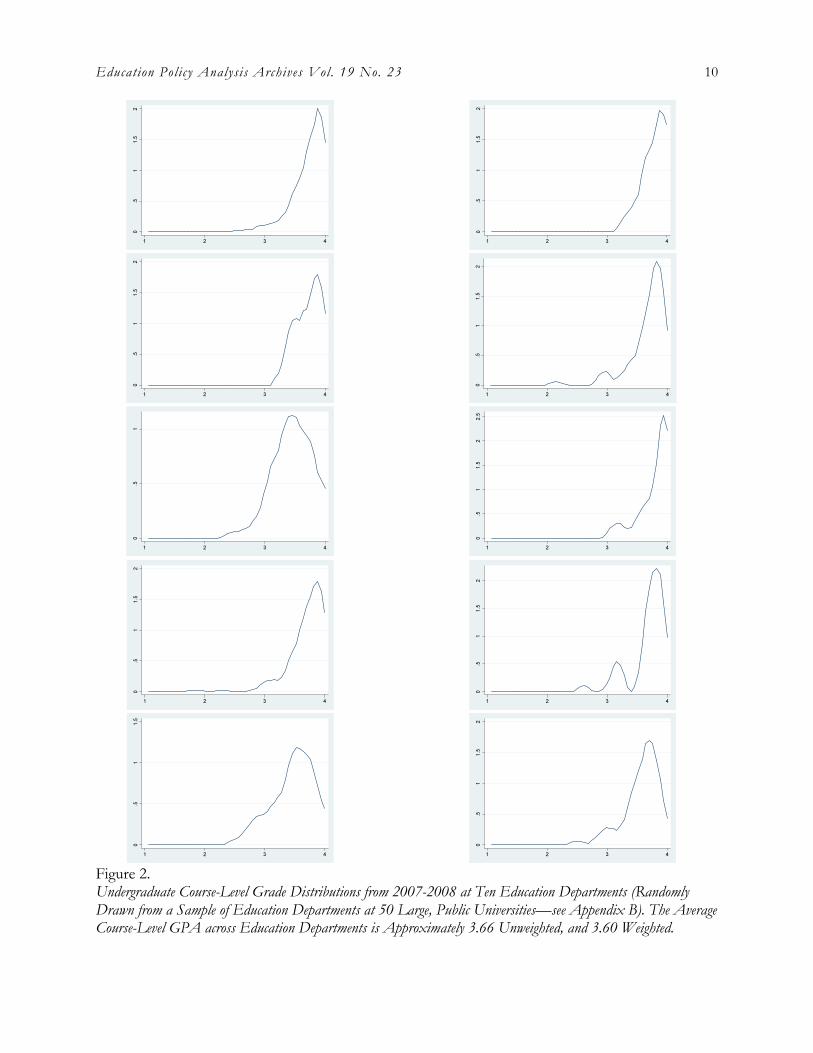
Figure 2 confirms that the grade distributions for the education departments in Figure 1 are not unique. It shows grade distributions from ten other education departments using data from Myedu.com. Myedu.com was willing to share their data for the purposes of this research, but had some reservations about identifying individual universities. Ultimately, they agreed to provide grade distributions from ten unidentified education departments, randomly drawn from a larger sample of 50 education departments at major public universities. These are the distributions that are shown in Figure 2 (the universities in the larger 50-school sample are reported in Appendix B). The course-level average GPA across the ten education departments in Figure 2, weighted by course enrollments within university, is 3.60 (the unweighted average is 3.66). All of the grade distributions in the figure are strongly negatively skewed.6
Several explanations for the observed GPA gaps between education and non-education departments, beyond pure grade inflation, merit discussion. First, the GPA gaps could be justified if education departments draw students who, on average, are of higher quality than students in other academic departments. However, the available evidence suggests that this explanation is unlikely. For example, Arcidiacono (2004) uses a nationally representative dataset to show that education majors enter college with considerably lower SAT scores, on average, than students in other disciplines. Similar evidence is available from The College Board (2010), which compares college-bound high-school seniors by intended major. Although SAT scores surely do not measure every dimension of quality, the documented discrepancies in SAT scores between education and non-education majors are not consistent with education students being of higher-quality than students in other disciplines.7
A second explanation for the GPA gaps is that they are the result of a structural difference between education and non-education departments. An obvious difference that can be seen from Table 1 is that education departments generally offer smaller classes than other departments. If smaller classes correspond to better grades, some of the GPA discrepancies may be attributable to this structural difference. To evaluate this possibility I begin by estimating the correlation between class size and classroom-level GPA using the following regression model, estimated separately for each of the three universities in the primary data sample:
(1)
In (1), the GPA in classroom i, taught in department j at level p during semester t, is regressed on enrollment (that is, class size), , and fixed effects for semester (fall or spring— ) and
department-by-level ( ). This regression identifies systematic differences in grades between courses that differ in size but are taught by the same department and at the same level.
6 Because of the way that the data are stored by myedu.com, it was easiest for them to extract grades at the course-number level, not the classroom level. Therefore, the grade data from myedu.com are aggregated to a higher level than are the data in Figures 1 and 2 (a single course will often correspond to more than one class). Descriptively, this is of little practical importance. Also, because of heterogeneity in the numbering sequences across universities, Myedu.com did not attempt to filter out freshman-level courses. Again, this is of little practical importance because there are very few freshman-level education courses. 7 Arcidiacono (2004) reports average math and verbal SAT scores for science, business, social-science/humanities and education majors upon college entry. For math, the average scores by major are 566, 498, 500, and 458, respectively; the average verbal scores are 499, 444, 481 and 431. The College Board (2010) provides an even more-detailed comparison using more recent data –the SAT-score gaps reported by The College Board (2010) are very similar to those reported by Arcidiacono (2004).
Education Policy Analysis Archives Vol. 19 No. 23 10
Figure 2. Undergraduate Course-Level Grade Distributions from 2007-2008 at Ten Education Departments (Randomly Drawn from a Sample of Education Departments at 50 Large, Public Universities—see Appendix B). The Average Course-Level GPA across Education Departments is Approximately 3.66 Unweighted, and 3.60 Weighted.
Grading Standards in Education Departments 11
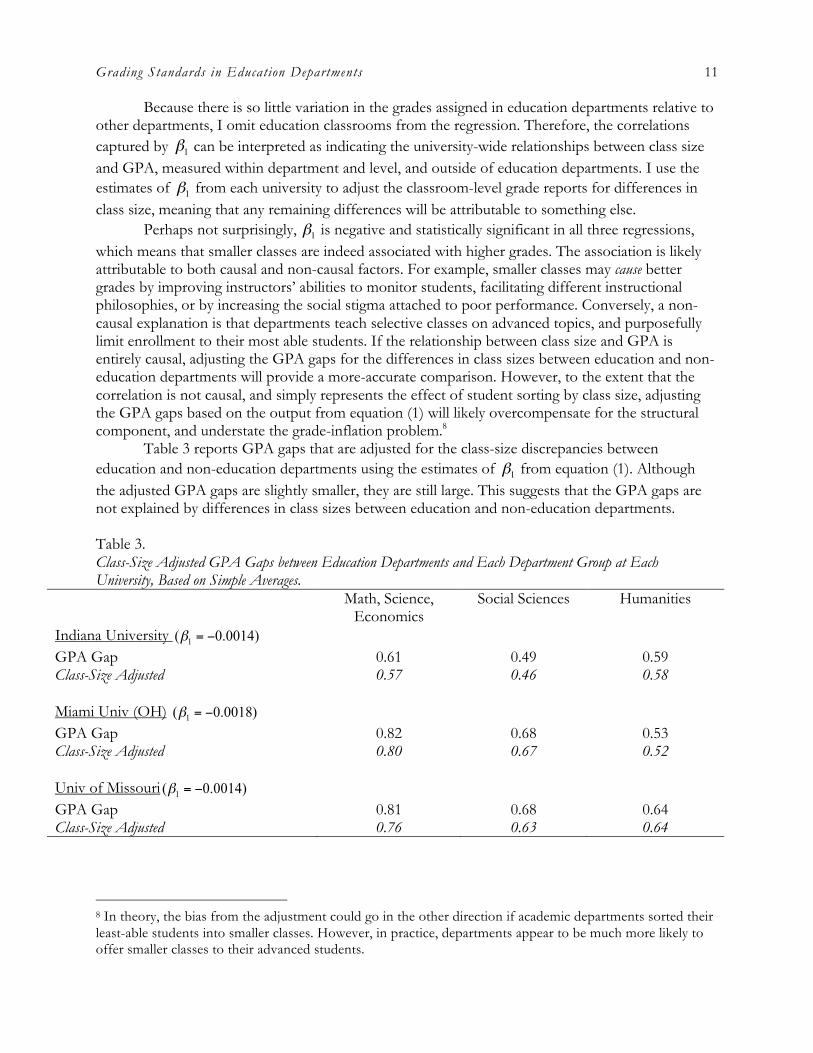
Because there is so little variation in the grades assigned in education departments relative to other departments, I omit education classrooms from the regression. Therefore, the correlations captured by can be interpreted as indicating the university-wide relationships between class size and GPA, measured within department and level, and outside of education departments. I use the estimates of from each university to adjust the classroom-level grade reports for differences in class size, meaning that any remaining differences will be attributable to something else. Perhaps not surprisingly, is negative and statistically significant in all three regressions, which means that smaller classes are indeed associated with higher grades. The association is likely attributable to both causal and non-causal factors. For example, smaller classes may cause better grades by improving instructors’ abilities to monitor students, facilitating different instructional philosophies, or by increasing the social stigma attached to poor performance. Conversely, a non-causal explanation is that departments teach selective classes on advanced topics, and purposefully limit enrollment to their most able students. If the relationship between class size and GPA is entirely causal, adjusting the GPA gaps for the differences in class sizes between education and non-education departments will provide a more-accurate comparison. However, to the extent that the correlation is not causal, and simply represents the effect of student sorting by class size, adjusting the GPA gaps based on the output from equation (1) will likely overcompensate for the structural component, and understate the grade-inflation problem.8
Table 3 reports GPA gaps that are adjusted for the class-size discrepancies between education and non-education departments using the estimates of from equation (1). Although the adjusted GPA gaps are slightly smaller, they are still large. This suggests that the GPA gaps are not explained by differences in class sizes between education and non-education departments.
Table 3. Class-Size Adjusted GPA Gaps between Education Departments and Each Department Group at Each University, Based on Simple Averages.
Math, Science, Economics
Social Sciences Humanities
Indiana University GPA Gap 0.61 0.49 0.59 Class-Size Adjusted 0.57 0.46 0.58 Miami Univ (OH) GPA Gap 0.82 0.68 0.53 Class-Size Adjusted 0.80 0.67 0.52 Univ of Missouri GPA Gap 0.81 0.68 0.64 Class-Size Adjusted 0.76 0.63 0.64
8 In theory, the bias from the adjustment could go in the other direction if academic departments sorted their least-able students into smaller classes. However, in practice, departments appear to be much more likely to offer smaller classes to their advanced students.

Education Policy Analysis Archives Vol. 19 No. 23 12
It may also be that fundamental differences in instructional practice between education and non-education departments influence the grade distributions. One possible difference is in instructional philosophy. As a specific example, the mastery-learning framework is likely to be more common in education departments. Within the mastery-learning framework, class topics are handled discretely and students who have difficulty with a given topic receive additional instruction until they succeed. The underlying philosophy that all students can master the topics of the course suggests that grades in courses that are taught under the mastery-learning framework will be higher. While in principle any professor in any discipline can adopt the mastery-learning approach, or something similar, mastery-learning courses are likely to be more common in education departments because (1) the sizeable research literature on mastery learning is in education and (2) the mastery-learning approach may be a more reasonable fit for education classes based on course content.9 A second issue related to instructional practice involves the prevalence of practice-based and/or internship courses in degree programs in education and non-education departments. Relative to other academic disciplines, the nature of the training in education departments is likely to require more practice-based courses. Grades in such courses can either be assigned as pass/fail, in which case they are not factored into student GPAs, or as letter grades. In the latter case, it seems likely that “A’s” will be commonly awarded to indicate satisfactory completion, meaning that such classes will cause some grade inflation. Unfortunately, I cannot investigate the effects on the grade distributions of differences in instructional philosophies across academic departments because data are not available (for education or other departments). However, this seems like a logical starting point for future work that attempts to identify why the grading discrepancies that I document above exist. Alternatively, using data from the University of Missouri and Miami University, where course descriptions are available, I can evaluate the role of practice-based courses in determining the education-department grade distributions.10 At Miami University, the courses that are clearly labeled as practice-based courses in the administrative data are graded on a pass-fail basis, which means that they are not included in the analysis above. At the University of Missouri, the practice-based courses do appear to be graded—if I omit them from the GPA calculations, the average course-level GPA for the Missouri education department declines by just 0.02 grade points. Clearly, the grading discrepancies are not driven by differences across departments in the prevalence of practice-based courses. Finally, I briefly raise a conceptual issue regarding mechanisms. While it is important to understand the mechanisms that underlie the grade distributions, only in cases where the mechanism is outside of the control of the faculty in academic departments is it reasonable to make an adjustment to the grade distributions. The first two mechanisms considered above – departmental differences in student quality and class size – are plausibly outside of faculty control.11 However, the latter two mechanisms—differences in instructional philosophy and the prevalence and grading of practice-based courses—are determined by faculty. For example, any professor in any discipline can
9 The literature on mastery learning dates back to the 1970s – see, for example, Bloom (1974) or Block and Anderson (1975). There is some argument in the literature as to its merits (see, for example, Kulik et al., 1990; Slavin, 1987). 10 The data from Indiana University do not provide enough of a description of the course to categorize internship or practice-based courses. Also, it may be that some practice-based courses are not clearly labeled in the data from the other two universities, in which case I will not know to treat them as such. 11 Very broadly considered, even these two mechanisms can be affected by faculty, but if we assume that faculty do not affect individual preferences for major choice, and if we assume that class-size differences are related to discipline-specific training needs, then these two mechanisms can be plausibly treated as being outside of faculty control.

Grading Standards in Education Departments 13
adopt a teaching philosophy that leads to higher student grades. Similarly, departments have some discretion over the role and prevalence of practice-based courses in their degree programs, and equally importantly, over how these courses are graded (i.e., by letter grade or pass-fail). The choices that are made by faculty across departments contribute to the across-department grading discrepancies that are highlighted by this study.
Potential Implications of the Low Grading Standards in Education Departments
The previous section documents sizeable differences in the grading standards between education and non-education departments. Unfortunately, an empirical evaluation of the policy implications seems virtually impossible given that the counterfactual of more-stringent grading standards does not appear to exist in a meaningful way. For example, the low grading standards in education departments may adversely affect the quality of the K-12 teaching workforce; however, the data lack sufficient variation to investigate this possibility.
Although I cannot provide direct evidence on the link between the grading standards in education departments and teacher quality in K-12 schools, I draw on the larger research literature to provide indirect evidence. Most notably, in the general university context, Babcock (2010) shows that student effort responds negatively to low grading standards. He shows that when students’ grade expectations rise by one grade point, effort decreases by roughly 20 percent (measured by study time). Extrapolating linearly from Babcock’s result, I predict the effort responses from education students that would accompany more stringent grading standards in education departments. A qualification to this analysis, shown in Table 4, is that there are many reasons to expect Babcock’s analysis to understate students’ effort responses. As such, the predictions in the table should perhaps be viewed as lower bounds.12
First consider the case where each education department from the convenience sample raised its grading standards to be in line with the next-highest grading department at the same university. The corresponding reductions in classroom-level average GPAs in the education departments at Indiana, Miami and Missouri would be 0.42, 0.26 and 0.54, respectively. Applying Babcock’s estimate, these differences would correspond to effort increases of between 5 and 11 percent by undergraduate education students. At the other extreme, if the education departments raised their grading standards to be in line with the lowest-grading departments at their respective universities, effort would increase by 17 to 23 percent. Perhaps a reasonable expectation is that education departments bring their grading standards in line with humanities departments, which appear to most closely resemble education departments in terms of class sizes and grades. In this case, student effort in education departments would increase by 11 to 13 percent.
Under fairly modest assumptions, increases in effort during prospective teachers’ undergraduate training will increase teacher quality in K-12 schools. First, trivially, increased effort must correspond to increased learning, which appears to be the case (general evidence is available from Stinebrickner and Stinebrickner, 2008). Second, it must be that either (1) a better understanding of the content of classes taught in education departments improves teacher quality, or (2) that indirectly, teachers gain other skills as a result of a more-demanding college experience (e.g., skills in time-management or improved work ethics). I am not aware of any direct evidence that
12 The main reason to expect Babcock’s findings to understate the effect of increased grading standards is that he identifies his effect using within instructor-course variation. It is also likely that between-instructor and between-course variation in grading standards will be important – his estimates that use this variation are almost twice as large (but they are also more likely to be biased).

Education Policy Analysis Archives Vol. 19 No. 23 14
confirms either of these latter points, although recent data collection efforts will facilitate studies that can provide insight in the near future.13
Table 4. Predicted Effort Responses to Adjustments to Grading Standards in Education Departments, Based on Simple Averages.
Indiana Univ Miami Univ (OH) Univ of Missouri Education Dept Avg GPA 3.66 3.73 3.80 Next-Highest-Grading Department Avg GPA 3.24
(Psych) 3.47
(English) 3.26
(Psych) GPA Adjustment Required to Close Gap 0.42 0.26 0.54 Predicted Effort Increase (%) 8 5 11 Lowest-Grading Department Avg GPA 2.79
(Econ) 2.58
(Econ) 2.83
(Math) GPA Adjustment Required to Close Gap 0.87 1.15 0.97 Predicted Effort Increase (%) 17 23 19 Math and Science Departments Avg GPA 3.05 2.91 2.99 GPA Adjustment Required to Close Gap 0.61 0.82 0.81 Predicted Effort Increase (%) 12 16 16 Social Science Departments Avg GPA 3.17 3.05 3.12 GPA Adjustment Required to Close Gap 0.49 0.68 0.68 Predicted Effort Increase (%) 10 14 14 Humanities Departments Avg GPA 3.07 3.20 3.16 GPA Adjustment Required to Close Gap 0.59 0.53 0.64 Predicted Effort Increase (%) 12 11 13
There may also be other consequences of the low grading standards in education
departments. For one, grades do not provide meaningful information to students about their relative performance in education classes, meaning that students cannot use their grades to evaluate their fit in the discipline. Among the general college population, Arcidiacono (2004) empirically establishes that grades play a role in helping students sort into college majors. In education, however, students who are not a good fit for the discipline will receive no indication that this is the case from their grade reports.
Another possibility that merits attention from policymakers and higher-education administrators is that the low grading standards in education departments may contribute to the culture of low evaluation standards in education more generally. Although the existence of such a link is merely speculative at this point, there is a striking similarity between the favorable grades awarded to prospective teachers during university training and the favorable evaluations that teachers receive in K-12 schools. To illustrate the low evaluation standards for K-12 teachers I draw 13 In fact, several states can link teachers to their training institutions, undergraduate and otherwise (examples include Florida, Louisiana, Missouri and Tennessee). Some are already attempting to determine what aspects of training improve teacher performance.

Grading Standards in Education Departments 15
on several studies in the literature. First, Jacob and Lefgren (2008) show that school principals consistently award favorable ratings to teachers. In their study, principals from a Midwestern school district were asked to rate each teacher’s overall effectiveness on a 10-point scale. Principals were given the following descriptions to guide them in assigning their ratings:
1-2: Inadequate—The teacher performs substantially below minimal standards. 3-5: Adequate—The teacher meets minimal standards (but could make substantial
improvements). 6-8: Very good—The teacher is highly effective. 9-10: Exceptional—The teacher is among the best I have ever seen (e.g., in the top 1% of
teachers). Figure 3 shows the distribution of principals’ actual ratings of teachers. As can be seen from
the figure, the evaluations are overwhelmingly positive. Even the 30th percentile teacher, who is well below the median, received an eight; and roughly 40 percent of the teachers received an “exceptional” rating, described as indicating that the teacher’s performance is in the top 1 percent.
Figure 3. Distribution of Principal’s Ratings of Teachers on a 10-Point Scale, taken from Jacob and Lefgren (2008).
Findings consistent with those from Jacob and Lefgren (2008) are available elsewhere. For
example, Harris and Sass (2010) survey principals in a different school district and obtain similar results (Harris and Sass (2010) report that the average teacher rating on a nine-point scale exceeds 7.0).14 And in 2009, The New Teacher Project documented teacher evaluations at 12 school districts across four states (TNTP, 2009). The TNTP report notes that “in districts that use binary evaluation ratings (generally “satisfactory” or “unsatisfactory”), more than 99 percent of teachers receive the satisfactory rating. Districts that use a broader range of rating options do little better; in these districts, 94 percent of teachers receive one of the top two ratings and less than 1 percent are rated unsatisfactory” (TNTP, p. 6). 14 Note that neither of these studies was designed with the explicit objective of examining the low standards by which teachers are evaluated in K-12 schools.

Education Policy Analysis Archives Vol. 19 No. 23 16
Murphy and Cleveland (1991) suggest a mechanism by which the low grading standards in education departments may affect teacher evaluations in K-12 schools. Namely, the low grading standards may contribute to a cultural norm within the education sector: Murphy and Cleveland (1991) write “in an organization where the norm is to give high ratings, the rater who defies the norm might experience disapproval from his or her peers…pressures for non-conformity may be a significant factor in rating inflation” (Murphy and Cleveland, p. 197). Murphy and Cleveland (1991) also suggest that strongly held beliefs about how appraisals should be done within an organization “may make it difficult to change the appraisal system …” (Murphy and Cleveland, p. 181). Although no causal link can be established given current data, it is worth considering the possibility that prospective teachers’ lack of exposure to critical evaluations during their university training translates into expectations that they continue to receive non-critical evaluations in the workforce.15
Conclusion This paper uses recent administrative grade data to document large GPA gaps between
education departments and other academic departments at universities. Classroom-level average GPAs in education departments are on the order of 0.5 to 0.8 grade points higher than in other departments. The GPA gaps do not appear to be explained by differences in student quality across departments, nor are they driven by the fact that classes in education departments are typically smaller. The remaining explanation is that the higher GPAs in education classes are the result of low grading standards in education departments.
The contribution of this study is to empirically document the low grading standards in education departments. Much work remains in the areas of identifying mechanisms and understanding policy consequences. In terms of the former, the issue of differences across departments in instructional philosophy seems like an obvious starting point. Additionally, a better understanding of how faculty in different departments perceive the role of grades may provide useful insights.
Understanding of the policy consequences of the favorable grades awarded by education departments is also important. Because the vast majority of education majors go on to work as classroom teachers, a first-order issue is to determine if and how the low grading standards in education departments affect teacher quality in K-12 schools. Based on the larger research literature I suggest some of the most likely possibilities. These include that the low grading standards (1) reduce human-capital accumulation during college for prospective teachers, (2) result in inaccurate performance signals being sent to students in education classes, and (3) affect evaluation standards for teachers in the workforce. There is a considerable research basis for making the connections in (1) and (2), although again, there is no direct evidence. Linking the low grading standards in education departments to the low evaluation standards for teachers in the workforce is more speculative, although there is some support in the literature for this possibility as well.
In conclusion, the rationale for the low grading standards in education departments is unclear. Rather than asking why these grading standards should be changed, perhaps the more reasonable policy question is this: why shouldn’t the grading standards in education departments be changed? Beyond noting that the current system has considerable inertia, what benefits does it confer? Or, put 15 There is a large literature in economics, management and psychology showing that performance evaluations for all workers tend to be inflated and compressed, so this problem is not unique to education (see, for example, Murphy and Cleveland, 1991). Nonetheless, the evaluations for teachers seem particularly lenient and compressed (TNTP, 2009). It is noteworthy that some of the checks and balances that reduce ratings leniency and compression in the private sector are absent in the public sector, including education (for example, see Murphy and Cleveland, 1991; Prendergast, 2002).
Grading Standards in Education Departments 17
differently, if we were to start over with university education, and could choose the grading distributions in each discipline, would we choose the currently-observed discrepancy between education departments and all other academic departments at universities?
References
Aaronson, Daniel, Lisa Barrow and William Sander. (2007). Teachers and Student Achievement in the Chicago Public High Schools. Journal of Labor Economics 25, 95-135.
Arcidiacono, Peter. (2004). Ability Sorting and the Returns to College Major, Journal of Econometrics, 121, 343-375.
Babcock, Philip. (2010). Real Costs of Nominal Grade Inflation? New Evidence from Student Course Evaluations. Economic Inquiry, 48, 983-996.
Block, J. H., & Anderson, L. W. (1975). Mastery Learning in Classroom Instruction. New York: Macmillan.
Bloom, B. S. (1974). An introduction to mastery learning theory. In J. H. Block (Ed.), Schools, Society, and Mastery Learning. New York: Holt, Rinehart & Winston.
Figlio, David N. and Maurice E. Lucas. (2004). Do High Grading Standards Affect Student Performance? Journal of Public Economics, 88, 1815-1834.
Harris, Douglas and Tim R. Sass. (2010). What Makes for a Good Teacher and Who Can Tell? Unpublished manuscript, Department of Economics, Florida State University, Tallahassee.
Kulik, Chen-Lin, James A. Kulik and Robert Bangert-Drowns. (1990). Effectiveness of mastery learning programs: A meta-analysis. Review of Educational Research, 60, 265-299.
Jacob, Brian and Lars Lefgren. (2008). Principals as Agents: Subjective Performance Assessment in Education. Journal of Labor Economics, 26, 101-136.
Koedel, Cory. (2008). Teacher Quality and Dropout Outcomes in a Large, Urban School District. Journal of Urban Economics, 64, 560-572.
Michaels, James W. (1976). A Simple View of the Teaching Issue. Teaching Sociology, 3, 198-203. Murphy, Kevin R. and Jeanette N. Cleveland. (1991). Performance Appraisal: An Organizational
Perspective. Boston: Allyn and Bacon. Nye, Barbara, Konstantopoulos, Spyros, & Hedges, Larry V. (2004). How Large are Teacher
Effects? Educational Evaluation and Policy Analysis, 26, 237-257. Prendergast, Candice. (2002). Uncertainty and Incentives. Journal of Labor Economics, 20, S115-S137. Rivkin, Steven, Eric Hanushek and John Kain. (2005). Teachers, Schools and Academic
Achievement. Econometrica, 73, 417-458. Rockoff, Jonah. (2004). The Impact of Individual Teachers on Student Achievement: Evidence from
Panel Data. American Economic Review, 94, 247-252. Slavin, Robert. (1987). Mastery learning reconsidered. Review of Educational Research, 57, 175-
213. Stinebrickner, Ralph and Todd R. Stinebrickner. (2008). The Causal Effect of Studying on Academic
Performance. The B. E. Journal of Economic Analysis and Policy, 8, 1-53. The College Board. (2010). 2010 College-Bound Seniors: Total Group Profile Report. The New Teacher Project. (2009). The Widget Effect: Our National Failure to Acknowledge and
Act on Differences in Teacher Effectiveness. TNTP Policy Report. Weiss, Robert M. and Glen Rasmussen. (1960). Grading Practices in Undergraduate Education
Courses: Are the Standards Too Low? The Journal of Higher Education, 31, 143-149.

18
Appendix A Supplementary Tables
Appendix Table A. 1. Comparisons Between Education and Non-Education Departments.
Math and Science Related Majors Social Science Majors Humanities Majors
Education Biology* Chemistry* Computer Science
Economics Math Physics Political Science
Psychology Sociology English History Philosophy
Indiana University Simple Average GPA 3.66 3.20 2.94 3.15 2.79 3.02 3.19 3.14 3.24 3.12 3.23 3.06 2.92 90th percentile 3.98 3.87 3.36 3.89 3.47 3.57 3.64 3.67 3.97 3.74 3.70 3.61 3.39 75th percentile 3.91 3.57 3.17 3.59 3.05 3.26 3.56 3.34 3.59 3.31 3.49 3.29 3.21 25th percentile 3.49 2.82 2.75 2.78 2.43 2.72 2.75 2.87 2.93 2.86 2.94 2.81 2.62 10th percentile 3.27 2.55 2.52 2.54 2.27 2.55 2.68 2.75 2.66 2.67 2.78 2.65 2.39 Average Class Size 20.0 51.6 88.3 16.9 68.2 31.4 56.5 43.0 46.5 49.4 22.7 40.5 24.9 Number of Classes 451 75 34 50 100 77 31 68 114 53 198 92 28 Student-by-Classroom Obs 9020 3870 3002 845 6820 2418 1752 2924 5301 2618 4495 3726 697 Miami Univ (OH) Simple Average GPA 3.73 2.82* 3.07* 2.86 2.58 2.92 3.23 3.12 3.00 3.02 3.47 3.12 3.02 90th percentile 4.00 3.14* 3.67* 3.35 2.95 3.57 3.65 3.65 3.51 3.67 3.84 3.51 3.54 75th percentile 3.95 2.94* 3.55* 3.14 2.75 3.24 3.46 3.43 3.34 3.37 3.67 3.32 3.18 25th percentile 3.58 2.60* 2.73* 2.60 2.38 2.61 2.90 2.87 2.66 2.53 3.26 2.90 2.84 10th percentile 3.28 2.48* 2.40* 2.26 2.15 2.41 2.86 2.63 2.46 2.38 3.04 2.75 2.48 Average Class Size 21.3 22.2* 55.4* 16.9 43.9 21.4 15.7 34.9 35.0 23.4 24.1 26.5 21.5 Number of Classes 120 21* 36* 39 93 67 11 88 101 35 132 74 19 Student-by-Classroom Obs 2556 466* 1994* 659 4083 1434 173 3071 3535 819 3181 1961 409 Univ of Missouri Simple Average GPA 3.80 3.18 2.86 2.96 2.94 2.83 3.19 2.95 3.26 3.15 3.19 3.12 3.16 90th percentile 4.00 3.73 3.52 3.37 3.45 3.29 3.74 3.37 3.80 3.48 3.67 3.71 3.57 75th percentile 3.97 3.53 3.20 3.14 3.15 3.03 3.44 3.14 3.60 3.36 3.45 3.32 3.43 25th percentile 3.71 2.84 2.58 2.73 2.63 2.61 2.77 2.75 2.93 2.95 2.96 2.89 2.82 10th percentile 3.50 2.72 2.38 2.62 2.47 2.39 2.72 2.53 2.79 2.81 2.70 2.59 2.68 Average Class Size 29.7 51.6 115.3 27.0 64.6 23.4 80.2 44.7 73.5 70.2 20.0 44.6 30.1 Number of Classes 94 48 16 26 33 66 14 49 79 42 142 57 29 Student-by-Classroom Obs 2792 2477 1845 702 2132 1544 1123 2190 5807 2948 2840 2542 873
* Miami University (OH) does not have a biology department and combines its chemistry and biochemistry departments. In place of the biology department, I use the microbiology department, and I report data from the “chemistry and biochemistry” department under the “chemistry” label.

19
Appendix B The 50-University “Universe” for Figure 2
Distributions from education departments at 10 randomly drawn universities from this sample are shown in Figure 2. The three universities shown in Figure 1 were purposefully omitted from this sample. Arizona State University, Tempe Campus Boise State University Bowling Green State University - Main Campus California State University, Fresno California State University, Fullerton California State University, Northridge Florida Atlantic University Florida International University Florida State University Georgia State University Illinois State University Kennesaw State University Kent State University Louisiana State University Michigan State University North Carolina State University at Raleigh Northern Arizona University Ohio University Oklahoma State University - Stillwater Purdue University - Main Campus Sam Houston State University Texas A&M University Texas State University, San Marcos Texas Tech University The University of Oklahoma, Norman Campus The University of Texas at Arlington The University of Texas at Austin The University of Texas at El Paso The University of Texas at San Antonio University of Arizona University of California, Berkeley University of California, Davis University of California, Los Angeles
University of Central Florida University of Florida University of Houston University of Illinois at Chicago University of Iowa University of Kentucky University of Maryland, College Park University of Minnesota, Twin Cities University of Nebraska - Lincoln University of North Carolina at Chapel Hill University of North Texas University of Washington, Seattle University of Wisconsin - Madison University of Wisconsin - Milwaukee Utah Valley University West Virginia University Western Kentucky University

Education Policy Analysis Archives Vol. 19 No. 23 20
About the Author
Cory Koedel University of Missouri Email: [email protected] Cory Koedel is an assistant professor of economics at the University of Missouri, Columbia. He received his PhD in economics from the University of California, San Diego in 2007. In 2005, he was awarded a dissertation fellowship from the Spencer Foundation, and in 2008 he won the Outstanding Dissertation Award from the American Educational Research Association (Division L). Koedel has published several papers on teacher quality and teacher performance. In addition to teacher quality, his other research interests include teacher labor markets, school choice and curriculum evaluation.
education policy analysis archives Volume 19 Number 23 20th of August, 2011 ISSN 1068-2341
Readers are free to copy, display, and distribute this article, as long as the work is attributed to the author(s) and Education Policy Analysis Archives, it is distributed for non-commercial purposes only, and no alteration or transformation is made in the work. More details of this Creative Commons license are available at http://creativecommons.org/licenses/by-nc-sa/3.0/. All other uses must be approved by the author(s) or EPAA. EPAA is published by the Mary Lou Fulton Institute and Graduate School of Education at Arizona State University Articles are indexed EBSCO Education Research Complete, DIALNET, Directory of Open Access Journals, ERIC, H.W. WILSON & Co, QUALIS – A 2 (CAPES, Brazil), SCOPUS, SOCOLAR-China.
Please contribute commentaries at http://epaa.info/wordpress/ and send errata notes to Gustavo E. Fischman [email protected]

Educational Policy Analysis Archives Vol. 19 No. 23 21
education policy analysis archives editorial board
Editor Gustavo E. Fischman (Arizona State University) Associate Editors: David R. Garcia & Jeanne M. Powers (Arizona State University)
Jessica Allen University of Colorado, Boulder Christopher Lubienski University of Illinois,
Urbana-Champaign Gary Anderson New York University Sarah Lubienski University of Illinois, Urbana-
Champaign Michael W. Apple University of Wisconsin,
Madison Samuel R. Lucas University of California,
Berkeley Angela Arzubiaga Arizona State University Maria Martinez-Coslo University of Texas,
Arlington David C. Berliner Arizona State University William Mathis University of Colorado, Boulder Robert Bickel Marshall University Tristan McCowan Institute of Education, London Henry Braun Boston College Heinrich Mintrop University of California,
Berkeley Eric Camburn University of Wisconsin, Madison Michele S. Moses University of Colorado, Boulder Wendy C. Chi* University of Colorado, Boulder Julianne Moss University of Melbourne Casey Cobb University of Connecticut Sharon Nichols University of Texas, San Antonio Arnold Danzig Arizona State University Noga O'Connor University of Iowa Antonia Darder University of Illinois, Urbana-
Champaign João Paraskveva University of Massachusetts,
Dartmouth Linda Darling-Hammond Stanford University Laurence Parker University of Illinois, Urbana-
Champaign Chad d'Entremont Strategies for Children Susan L. Robertson Bristol University
John Diamond Harvard University John Rogers University of California, Los Angeles Tara Donahue Learning Point Associates A. G. Rud Purdue University Sherman Dorn University of South Florida Felicia C. Sanders The Pennsylvania State
University Christopher Joseph Frey Bowling Green State
University Janelle Scott University of California, Berkeley
Melissa Lynn Freeman* Adams State College Kimberly Scott Arizona State University Amy Garrett Dikkers University of Minnesota Dorothy Shipps Baruch College/CUNY Gene V Glass Arizona State University Maria Teresa Tatto Michigan State University Ronald Glass University of California, Santa Cruz Larisa Warhol University of Connecticut Harvey Goldstein Bristol University Cally Waite Social Science Research Council Jacob P. K. Gross Indiana University John Weathers University of Colorado, Colorado
Springs Eric M. Haas WestEd Kevin Welner University of Colorado, Boulder Kimberly Joy Howard* University of Southern
California Ed Wiley University of Colorado, Boulder
Aimee Howley Ohio University Terrence G. Wiley Arizona State University Craig Howley Ohio University John Willinsky Stanford University Steve Klees University of Maryland Kyo Yamashiro University of California, Los Angeles
Jaekyung Lee SUNY Buffalo * Members of the New Scholars Board

Education Policy Analysis Archives Vol. 19 No. 23 22
archivos analíticos de políticas educativas consejo editorial
Editor: Gustavo E. Fischman (Arizona State University) Editores. Asociados Alejandro Canales (UNAM) y Jesús Romero Morante (Universidad de Cantabria)
Armando Alcántara Santuario Instituto de
Investigaciones sobre la Universidad y la Educación, UNAM México
Fanni Muñoz Pontificia Universidad Católica de Perú
Claudio Almonacid Universidad Metropolitana de Ciencias de la Educación, Chile
Imanol Ordorika Instituto de Investigaciones Economicas – UNAM, México
Pilar Arnaiz Sánchez Universidad de Murcia, España
Maria Cristina Parra Sandoval Universidad de Zulia, Venezuela
Xavier Besalú Costa Universitat de Girona, España Miguel A. Pereyra Universidad de Granada, España Jose Joaquin Brunner Universidad Diego Portales,
Chile Monica Pini Universidad Nacional de San Martín,
Argentina Damián Canales Sánchez Instituto Nacional para
la Evaluación de la Educación, México Paula Razquin UNESCO, Francia
María Caridad García Universidad Católica del Norte, Chile
Ignacio Rivas Flores Universidad de Málaga, España
Raimundo Cuesta Fernández IES Fray Luis de León, España
Daniel Schugurensky Universidad de Toronto-Ontario Institute of Studies in Education, Canadá
Marco Antonio Delgado Fuentes Universidad Iberoamericana, México
Orlando Pulido Chaves Universidad Pedagógica Nacional, Colombia
Inés Dussel FLACSO, Argentina José Gregorio Rodríguez Universidad Nacional de Colombia
Rafael Feito Alonso Universidad Complutense de Madrid, España
Miriam Rodríguez Vargas Universidad Autónoma de Tamaulipas, México
Pedro Flores Crespo Universidad Iberoamericana, México
Mario Rueda Beltrán Instituto de Investigaciones sobre la Universidad y la Educación, UNAM México
Verónica García Martínez Universidad Juárez Autónoma de Tabasco, México
José Luis San Fabián Maroto Universidad de Oviedo, España
Francisco F. García Pérez Universidad de Sevilla, España
Yengny Marisol Silva Laya Universidad Iberoamericana, México
Edna Luna Serrano Universidad Autónoma de Baja California, México
Aida Terrón Bañuelos Universidad de Oviedo, España
Alma Maldonado Departamento de Investigaciones Educativas, Centro de Investigación y de Estudios Avanzados, México
Jurjo Torres Santomé Universidad de la Coruña, España
Alejandro Márquez Jiménez Instituto de Investigaciones sobre la Universidad y la Educación, UNAM México
Antoni Verger Planells University of Amsterdam, Holanda
José Felipe Martínez Fernández University of California Los Angeles, USA
Mario Yapu Universidad Para la Investigación Estratégica, Bolivia

Educational Policy Analysis Archives Vol. 19 No. 23 23
arquivos analíticos de políticas educativas conselho editorial
Editor: Gustavo E. Fischman (Arizona State University) Editores Associados: Rosa Maria Bueno Fisher e Luis A. Gandin
(Universidade Federal do Rio Grande do Sul)
Dalila Andrade de Oliveira Universidade Federal de
Minas Gerais, Brasil Jefferson Mainardes Universidade Estadual de
Ponta Grossa, Brasil Paulo Carrano Universidade Federal Fluminense,
Brasil Luciano Mendes de Faria Filho Universidade
Federal de Minas Gerais, Brasil Alicia Maria Catalano de Bonamino Pontificia
Universidade Católica-Rio, Brasil Lia Raquel Moreira Oliveira Universidade do
Minho, Portugal Fabiana de Amorim Marcello Universidade
Luterana do Brasil, Canoas, Brasil Belmira Oliveira Bueno Universidade de São Paulo,
Brasil Alexandre Fernandez Vaz Universidade Federal de
Santa Catarina, Brasil António Teodoro Universidade Lusófona, Portugal
Gaudêncio Frigotto Universidade do Estado do Rio de Janeiro, Brasil
Pia L. Wong California State University Sacramento, U.S.A
Alfredo M Gomes Universidade Federal de Pernambuco, Brasil
Sandra Regina Sales Universidade Federal Rural do Rio de Janeiro, Brasil
Petronilha Beatriz Gonçalves e Silva Universidade Federal de São Carlos, Brasil
Elba Siqueira Sá Barreto Fundação Carlos Chagas, Brasil
Nadja Herman Pontificia Universidade Católica –Rio Grande do Sul, Brasil
Manuela Terrasêca Universidade do Porto, Portugal
José Machado Pais Instituto de Ciências Sociais da Universidade de Lisboa, Portugal
Robert Verhine Universidade Federal da Bahia, Brasil
Wenceslao Machado de Oliveira Jr. Universidade Estadual de Campinas, Brasil
Antônio A. S. Zuin Universidade Federal de São Carlos, Brasil