graduate enrollment planning update march 2006. graduate enrollment trends 20002005change ms647910...
TRANSCRIPT

Graduate Enrollment Planning Update
March 2006
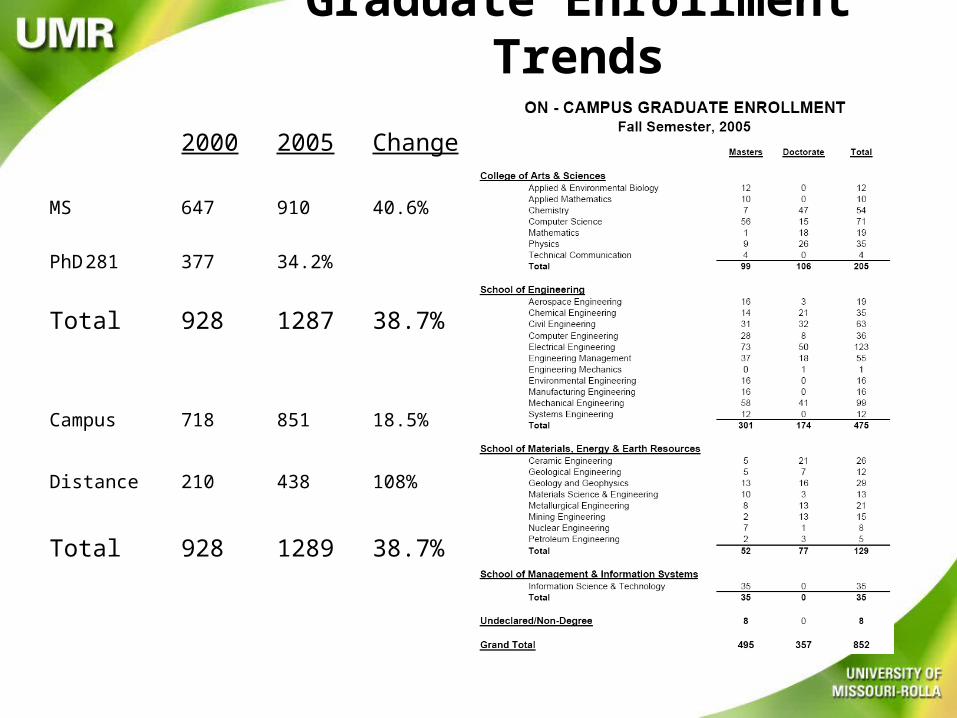
Graduate Enrollment Trends
2000 2005 Change
MS 647 910 40.6%
PhD 281 377 34.2%
Total 928 1287 38.7%
Campus 718 851 18.5%
Distance 210 438 108%
Total 928 1289 38.7%

2005 Graduate Student Composition
Total Graduate Percentage
Domestic Distance 2.5%
Domestic On-campus 35.1%
International On-campus 62.4%
MastersDomestic Distance 3.3%
Domestic On-campus 37.7%
International On-campus 59%
DoctoralDomestic Distance 0.9%
Domestic On-campus 29.9%
International On-campus 69.2%

Sources of Graduate Students
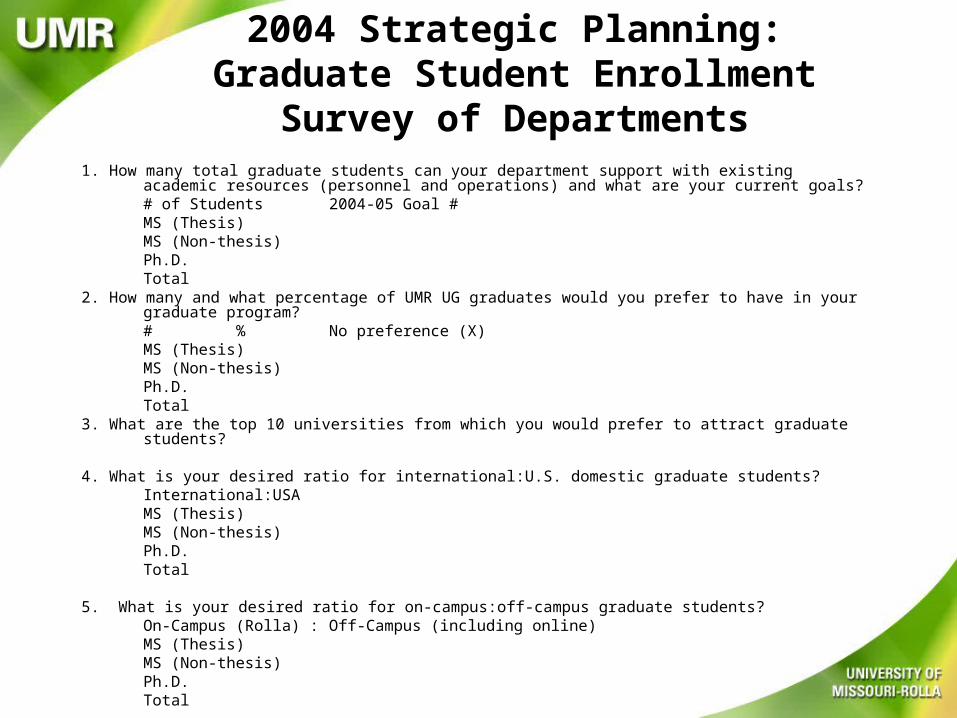
2004 Strategic Planning:Graduate Student Enrollment Survey
of Departments1. How many total graduate students can your department support with existing academic resources (personnel
and operations) and what are your current goals? # of Students 2004-05 Goal #
MS (Thesis)MS (Non-thesis)Ph.D.Total
2. How many and what percentage of UMR UG graduates would you prefer to have in your graduate program? # % No preference (X)
MS (Thesis)MS (Non-thesis)Ph.D.Total
3. What are the top 10 universities from which you would prefer to attract graduate students?
4. What is your desired ratio for international:U.S. domestic graduate students? International:USA
MS (Thesis)MS (Non-thesis)Ph.D.Total
5. What is your desired ratio for on-campus:off-campus graduate students?On-Campus (Rolla) : Off-Campus (including online)MS (Thesis)MS (Non-thesis)Ph.D.Total

Graduate Student Capacity with Current Resources
» MS (thesis): 436» MS (non-thesis): 616» PhD: 465
TOTAL: 1517 for existing programs
NEW GOAL: 1750 with new programs and expanded distance offerings
1025 on-campus graduate students 725 distance graduate students
NOTE: This survey did not include projections/goals for the new MBA, geotechnics, biomaterials, materials science & technology, technical communication, and 19 new graduate certificates.
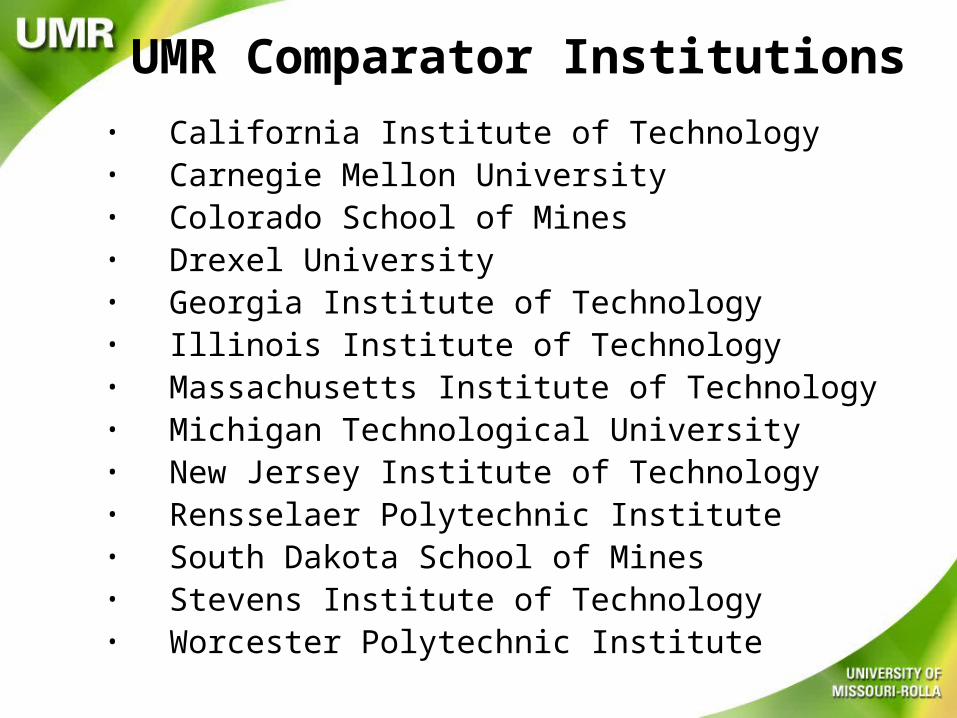
UMR Comparator Institutions• California Institute of Technology• Carnegie Mellon University• Colorado School of Mines• Drexel University• Georgia Institute of Technology• Illinois Institute of Technology• Massachusetts Institute of Technology• Michigan Technological University• New Jersey Institute of Technology • Rensselaer Polytechnic Institute • South Dakota School of Mines• Stevens Institute of Technology• Worcester Polytechnic Institute
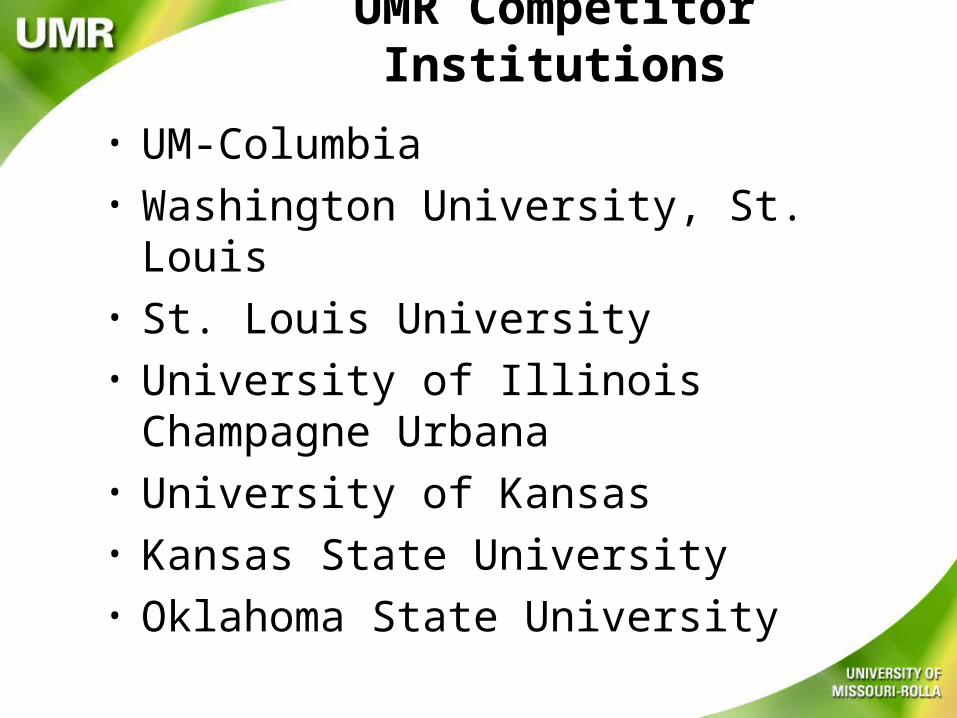
UMR Competitor Institutions
• UM-Columbia• Washington University, St. Louis• St. Louis University• University of Illinois Champagne Urbana• University of Kansas• Kansas State University• Oklahoma State University

Top 10 Colleges/Universities for Graduate RecruitmentFrom Graduate Student Enrollment Planning Survey
Spring 2004
Aerospace Engineering1. Purdue Univ. 6. Indian Institute of Technology, India2. Iowa State Univ. 7. Beijing Univ. of Aero & Astro, China3. Univ. of Kansas 8. Shanghai Jiaotong Univ., China4. SIU-Carbondale 9. USTC, China5. Rose-Hulman Institute 10.National Institute of Technology, India
Biological SciencesNo Preference
Ceramic Engineering - Did not rank in any orderIowa State Univ. (MSE) Truman State Univ. (chemistry, physics, biology)Univ. of Illinois (MSE) SMSU (chemistry, physics, biology)Alfred Univ. (MSE) Rutgers Univ. (MSE)Penn State Univ. (MSE) Coe College (physics, chemistry)UM-Columbia (physics, chemistry, engineering)

Colleges/Universities for Graduate Recruitment
Chemistry
1. Saint Louis Univ. 6. MIT
2. UM-Columbia 7. CalTech
3. UMSL 8. Washington Univ.
4. UMKC 9. Univ. of Kansas
5. SMSU 10. Truman State Univ.
Civil Engineering
1. UT-Austin 6. Kansas State Univ.
2. Purdue 7. Univ. of Kansas
3. UM-Columbia 8. Univ. Wisconsin-Madison
4. Univ. of Illinois 9. Univ. of Arkansas
5. Iowa State Univ. 10. Penn State
6. Univ. of Iowa 11. Georgia Tech

Colleges/Universities for Graduate Recruitment
Computer Engineering
1. Rose-Hulman 6. Univ. of Illinois
2. Harvey Mudd College 7. Univ. of Wisconsin
3. Arkansas Tech 8. Milwaukee School of Engineering
4. Marshall Univ. 9. Gannon Univ.
5. Purdue 10. Arkansas State
Electrical Engineering
1. Rose-Hulman 6. Univ. of Illinois
2. Harvey Mudd College 7. Univ. of Wisconsin
3. Arkansas Tech 8. Milwaukee School of Engineering
4. Marshall Univ. 9. Gannon Univ.
5. Purdue 10. Arkansas State

Colleges/Universities for Graduate Recruitment
Computer Science
1. Univ. of Iowa 6. Grinnell College
2. Iowa State Univ. 7. Michigan Tech
3. Kansas State Univ. 8. Buena Vista Univ.
4. Univ. of Kansas 9. Harding Univ.
5. Univ. of Wisconsin 10. Truman State Univ.
Engineering Management
1. Stanford 6. UM-Columbia
2. MIT 7. Purdue
3. Univ. of Illinois 8. Rose-Hulman
4. Univ. of Texas 9. USC
5. UM-Roll 10. Washington Univ.

Colleges/Universities for Graduate Recruitment
Geological Engineering1. Purdue2. Colorado School of Mines3. Texas A & M4. Univ. of Texas5. Michigan Tech
Geology & GeophysicsNo preference; do not consider such a rating important.
Information Science & TechnologySmall private, regional colleges; did not specify.
Manufacturing Engineering1. UM-Rolla 5. Zhejiang Univ.2. SIU-Edwardsville 6. Shanghai Jiaotong Univ.3. IIT Schools, India 7. National Taiwan Univ.4. Tsinghua Univ. 8. National Cheng-Kung Univ.

Colleges/Universities for Graduate RecruitmentMechanical Engineering1. Purdue 6. Indian Institute of Technology, India2. Iowa State Univ. 7. Tsinghua Univ., China3. Univ. of Arkansas 8. Shanghai Jiaotong Univ., China4. SIU-Carbondale 9. USTC, China5. Rose-Hulman 10. National Institute of Technology, India
Metallurgical Engineering1. Colorado School of Mines 6. Michigan Tech2. Univ. of Texas-El Paso 7. Indian Institute of Technology, India3. Montana Tech 8. Any Big 10 University4. New Mexico Tech 9. Any Big 12 University5. South Dakota School of Mines
Mining EngineeringNo preference.
Petroleum EngineeringNo preference.
PhysicsOnly get students from small Midwestern schools; Fort Hays State has been good.
Systems EngineeringDid not specify colleges/universities, but companies.

Graduate Studies Info Needs1. What are the numbers of GRAs (domestic/international) in
each department?
2. What are the numbers of GTAs (domestic/international) in each department?
3. What budgeted G.O. Dollars go to support GTAs? 4. What budgeted G.O. Dollars go to support GRAs? 5. How does UMR compare with regional competitor institutions
in support with GTAs, GRAs, Fellowship dollars? 6. How does UMR compare with comparator institutions in
support with GTAs, GRAs, Fellowship dollars? 7. Can UMR be competitive if it paid a graduate student fee
waiver and reduced the student stipend so the student wouldn’t be taxed by the IRS? We’ve debated this in the past. I suspect it’s time to revisit this.
8. What is the number of graduate students that UMR would (could) need to attract, pay their fee waiver and increase overall revenue? What is the break-even point?
9. What is a suitable target for non-thesis masters students in each department given the current negative campus attitude about non-thesis masters?

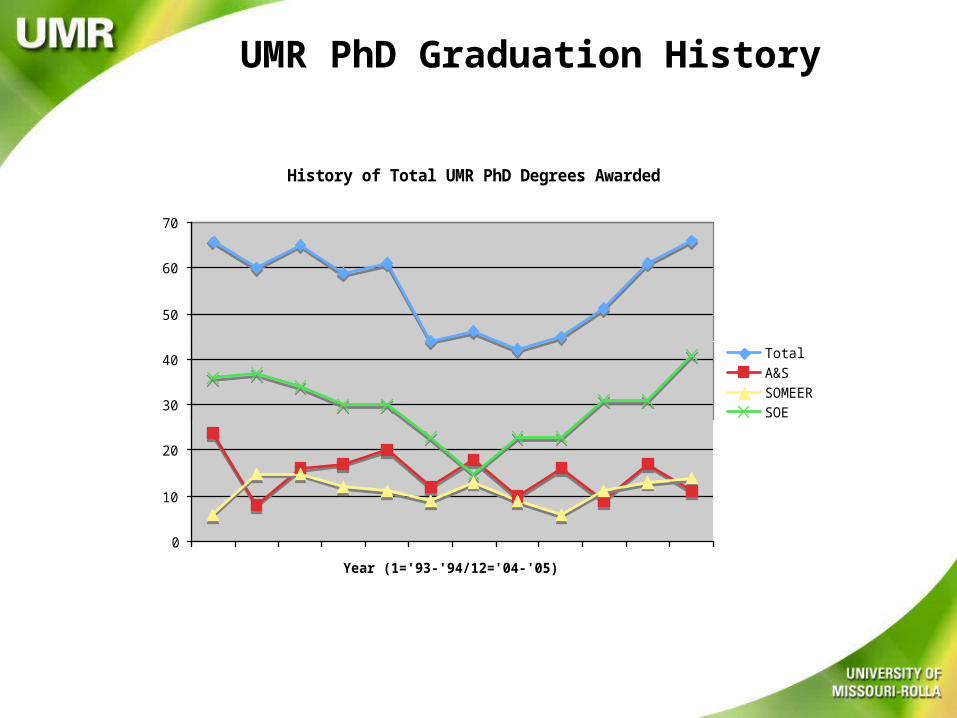
UMR PhD Graduation History
93-94 94-95 95-96 96-97 97-98 98-99 99-00 00-01 01-02 02-03 03-04 04-05
A&S 24 8 16 17 20 12 18 10 16 9 17 11
Domestic 24 4 9 10 14 3 10 6 2 2 2 5
International 0 4 7 7 6 9 8 4 14 7 15 6
SOMEER 6 15 15 12 11 9 13 9 6 11 13 14
Domestic 6 10 5 6 4 5 4 3 5 7 6 8
International 0 5 10 6 7 4 9 6 1 4 7 8
SOE 36 37 34 30 30 23 15 23 23 31 31 41
Domestic 36 17 12 14 11 14 3 4 4 12 8 5
International 0 20 22 16 19 9 12 19 19 19 23 36
Total 66 60 65 59 61 44 46 42 45 51 61 66
UMR PhD Graduation History
History of Total UMR PhD Degrees Awarded
0
10
20
30
40
50
60
70
Year (1='93-'94/12='04-'05)
Nu
mb
er
of
De
gre
es
Aw
ard
ed
TotalA&SSOMEERSOE

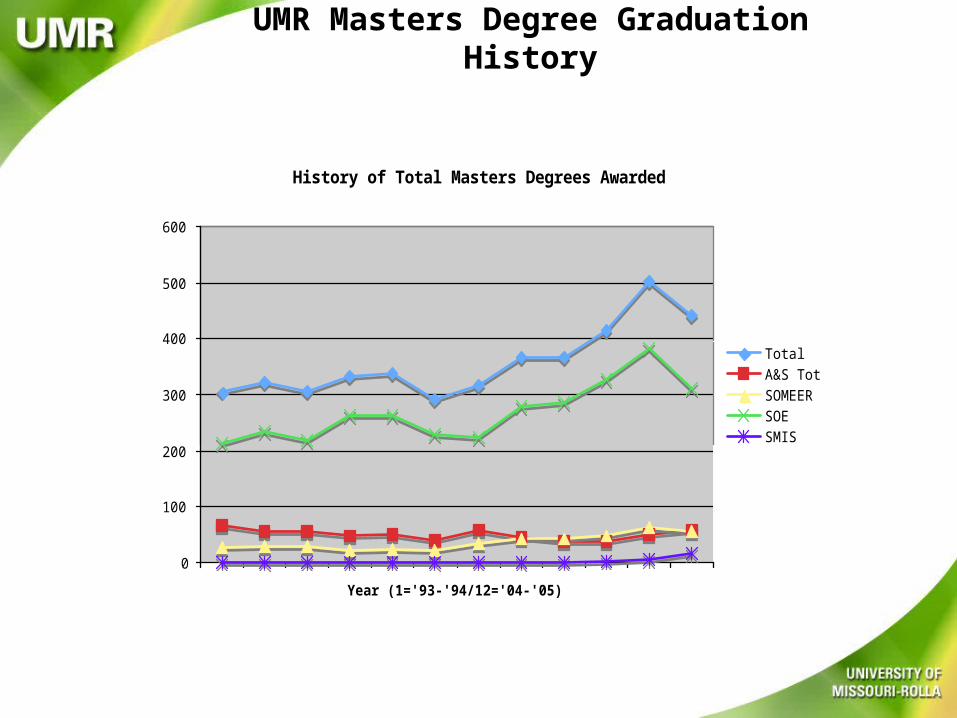
UMR Masters Degree Graduation History
93-94 94-95 95-96 96-97 97-98 98-99 99-00 00-01 01-02 02-03 03-04 04-05
A&S 67 57 55 49 51 41 58 45 37 37 50 59
Domestic 67 39 30 28 19 22 20 19 13 16 18 27
International 0 18 25 21 32 19 38 26 24 21 32 32
SOMEER 26 30 30 21 23 21 35 43 43 47 65 56
Domestic 26 21 22 17 16 16 28 37 31 37 47 51
International 0 9 8 4 7 5 7 6 12 10 18 5
SOE 212 233 219 262 264 229 224 278 286 327 381 310
Domestic 212 172 188 215 208 179 156 201 199 207 214 206
International 0 61 31 47 56 50 68 77 87 120 167 104
SMIS 0 0 0 0 0 0 0 0 0 3 6 15
Domestic 0 0 0 0 0 0 0 0 0 3 0 9
International 0 0 0 0 0 0 0 0 0 0 6 6
Total 305 320 304 332 338 291 317 366 366 414 502 440
UMR Masters Degree Graduation History
History of Total Masters Degrees Awarded
0
100
200
300
400
500
600
Year (1='93-'94/12='04-'05)
Nu
mb
er
of
De
gre
es
Aw
ard
ed
TotalA&S TotSOMEERSOESMIS
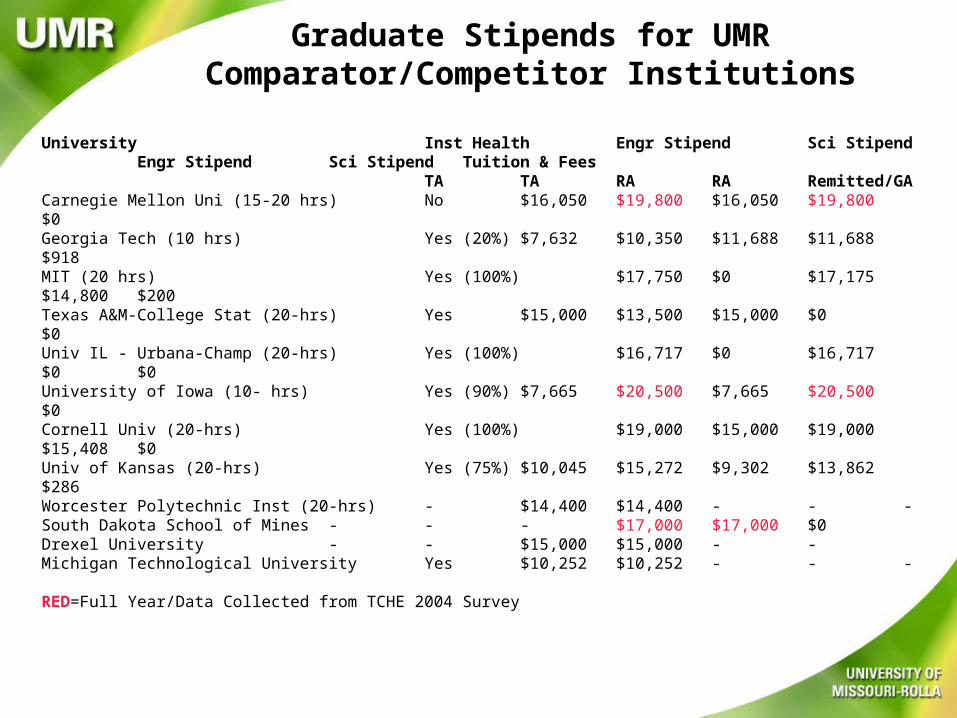
Graduate Stipends for UMR Comparator/Competitor Institutions
University Inst Health Engr Stipend Sci Stipend Engr Stipend Sci Stipend Tuition & FeesTA TA RA RA Remitted/GA
Carnegie Mellon Uni (15-20 hrs) No $16,050 $19,800 $16,050 $19,800 $0Georgia Tech (10 hrs) Yes (20%) $7,632 $10,350 $11,688 $11,688 $918MIT (20 hrs) Yes (100%) $17,750 $0 $17,175 $14,800 $200Texas A&M-College Stat (20-hrs) Yes $15,000 $13,500 $15,000 $0 $0Univ IL - Urbana-Champ (20-hrs) Yes (100%) $16,717 $0 $16,717 $0 $0University of Iowa (10- hrs) Yes (90%) $7,665 $20,500 $7,665 $20,500 $0Cornell Univ (20-hrs) Yes (100%) $19,000 $15,000 $19,000 $15,408 $0Univ of Kansas (20-hrs) Yes (75%) $10,045 $15,272 $9,302 $13,862 $286Worcester Polytechnic Inst (20-hrs) - $14,400 $14,400 - - -South Dakota School of Mines - - - $17,000 $17,000 $0Drexel University - - $15,000 $15,000 - -Michigan Technological University Yes $10,252 $10,252 - - -
RED=Full Year/Data Collected from TCHE 2004 Survey

UMR Graduate Stipends for 2005-2006
STIPEND AMOUNT: 31,200.00 9 months 3,466.67 per month at 100% FTE
EFFECTIVE DATES: 08/01/05 - 07/31/06ACADEMIC APPT YEAR: 08/15/05 - 05/13/06 (9.0 MONTHS)
ACADEMIC APPT YEAR CACLUCATION: $31,200 / 9.0 months = $3,466.67 PER MONTH AT 100% FTE
50% Appt 37.5% Appt 25% Appt
08/15/05 - 08/31/05 13/23 0.56522 979.71 734.78 489.86 09/01/05 - 04/30/06 8.0 8.00000 13,866.72 10,400.00 6,933.36 05/01/06 - 05/13/06 10/23 0.43478 753.63 565.22 376.81
9.00000 3,466.67 15,600.06 11,700.00 7,800.03
Days Worked 100% 75% 50% 37.5% 25%Dates Per Month Factor 3,466.67 2,600.00 1,733.34 1,300.00 866.67
08/15/05 - 08/31/05 13/23 0.56522 1,959.43 1,469.57 979.72 734.79 489.8609/01/05 - 09/30/05 22/22 1.00000 3,466.67 2,600.00 1,733.34 1,300.00 866.6710/01/05 - 10/31/05 21/21 1.00000 3,466.67 2,600.00 1,733.34 1,300.00 866.6711/01/05 - 11/30/05 22/22 1.00000 3,466.67 2,600.00 1,733.34 1,300.00 866.6712/01/05 - 12/31/05 22/22 1.00000 3,466.67 2,600.00 1,733.34 1,300.00 866.67Fall Semester 2005 15,826.11 11,869.57 7,913.08 5,934.79 3,956.54
01/01/06 - 01/31/06 22/22 1.00000 3,466.67 2,600.00 1,733.34 1,300.00 866.6702/01/06 - 02/28/06 20/20 1.00000 3,466.67 2,600.00 1,733.34 1,300.00 866.6703/01/06 - 03/31/06 23/23 1.00000 3,466.67 2,600.00 1,733.34 1,300.00 866.6704/01/06 - 04/30/06 20/20 1.00000 3,466.67 2,600.00 1,733.34 1,300.00 866.6705/01/06 - 05/13/06 10/23 0.43478 1,507.24 1,130.43 753.62 565.21 376.81Winter Semester 2006 15,373.92 11,530.43 7,686.98 5,765.21 3,843.49
05/15/06 - 05/31/06 13/23 0.56522 1,959.43 1,469.57 979.72 734.79 489.8606/01/06 - 06/30/06 22/22 1.00000 3,466.67 2,600.00 1,733.34 1,300.00 866.6707/01/06 - 07/31/06 21/21 1.00000 3,466.67 2,600.00 1,733.34 1,300.00 866.6708/01/06 - 08/12/06 10/23 0.43478 1,536.22 1,152.17 768.11 576.08 384.05Summer Semester 2005 10,428.99 7,821.74 5,214.51 3,910.87 2,607.25
* estimate because there may be a new stipend rate for 2006-2007 that will go into effect on 08/01/2006.est $31,200 + 600 = $31,800 = 3,533.33 3,533.33 2,650.00 1,766.67 1,325.00 883.33
08/15/05 - 12/31/05
01/01/06 - 05/13/06
05/15/06 - 08/12/06
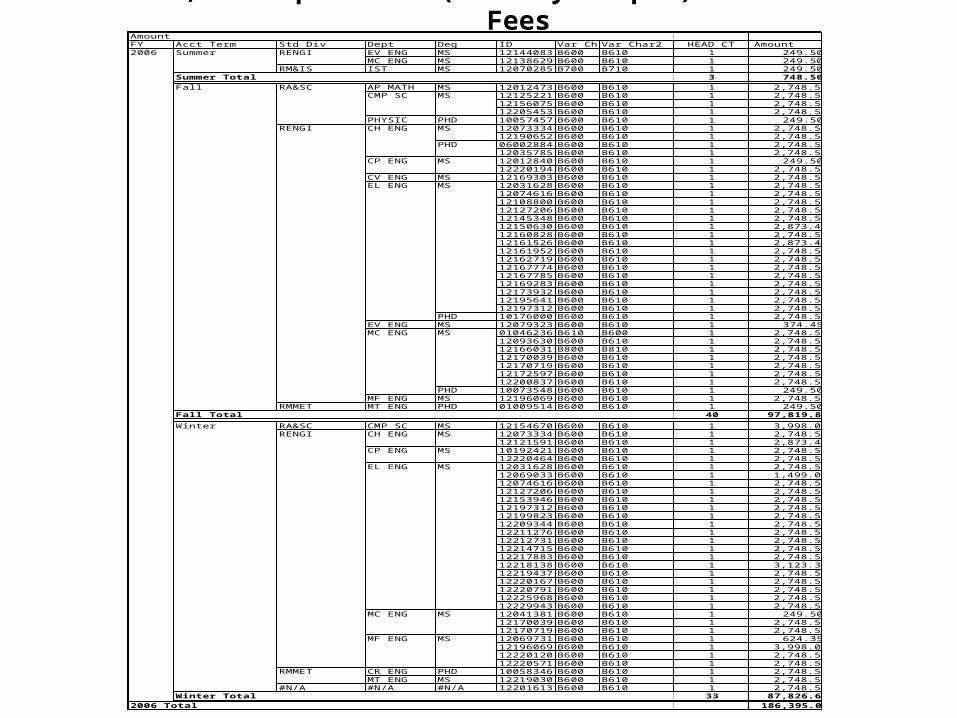
$1,000 Department (Paid By Campus) Non-Resident Fees
AmountFY Acct Term Std Div Dept Deg ID Var Char1Var Char2 HEAD CT Amount2006 Summer RENGI EV ENG MS 12144083 B600 B610 1 249.50
MC ENG MS 12138629 B600 B610 1 249.50 RM&IS IST MS 12070285 B700 B710 1 249.50
Summer Total 3 748.50
Fall RA&SC AP MATH MS 12012473 B600 B610 1 2,748.50 CMP SC MS 12125221 B600 B610 1 2,748.50
12156075 B600 B610 1 2,748.50 12205453 B600 B610 1 2,748.50
PHYSIC PHD 10057457 B600 B610 1 249.50 RENGI CH ENG MS 12073334 B600 B610 1 2,748.50
12190652 B600 B610 1 2,748.50 PHD 06002884 B600 B610 1 2,748.50
12035785 B600 B610 1 2,748.50 CP ENG MS 12012840 B600 B610 1 249.50
12220194 B600 B610 1 2,748.50 CV ENG MS 12169303 B600 B610 1 2,748.50 EL ENG MS 12031628 B600 B610 1 2,748.50
12074616 B600 B610 1 2,748.50 12108800 B600 B610 1 2,748.50 12127206 B600 B610 1 2,748.50 12145348 B600 B610 1 2,748.50 12150630 B600 B610 1 2,873.45 12160828 B600 B610 1 2,748.50 12161526 B600 B610 1 2,873.45 12161952 B600 B610 1 2,748.50 12162719 B600 B610 1 2,748.50 12167774 B600 B610 1 2,748.50 12167785 B600 B610 1 2,748.50 12169283 B600 B610 1 2,748.50 12173932 B600 B610 1 2,748.50 12195641 B600 B610 1 2,748.50 12197312 B600 B610 1 2,748.50
PHD 10176000 B600 B610 1 2,748.50 EV ENG MS 12079323 B600 B610 1 374.45 MC ENG MS 01046236 B610 B600 1 2,748.50
12093630 B600 B610 1 2,748.50 12166031 B800 B810 1 2,748.50 12170039 B600 B610 1 2,748.50 12170719 B600 B610 1 2,748.50 12172597 B600 B610 1 2,748.50 12200837 B600 B610 1 2,748.50
PHD 10073548 B600 B610 1 249.50 MF ENG MS 12196069 B600 B610 1 2,748.50
RMMET MT ENG PHD 01009514 B600 B610 1 249.50 Fall Total 40 97,819.85
Winter RA&SC CMP SC MS 12154670 B600 B610 1 3,998.00 RENGI CH ENG MS 12073334 B600 B610 1 2,748.50
12121591 B600 B610 1 2,873.45 CP ENG MS 10192421 B600 B610 1 2,748.50
12220464 B600 B610 1 2,748.50 EL ENG MS 12031628 B600 B610 1 2,748.50
12069033 B600 B610 1 1,499.00 12074616 B600 B610 1 2,748.50 12127206 B600 B610 1 2,748.50 12153946 B600 B610 1 2,748.50 12197312 B600 B610 1 2,748.50 12199823 B600 B610 1 2,748.50 12209344 B600 B610 1 2,748.50 12211276 B600 B610 1 2,748.50 12212731 B600 B610 1 2,748.50 12214715 B600 B610 1 2,748.50 12217883 B600 B610 1 2,748.50 12218138 B600 B610 1 3,123.35 12219437 B600 B610 1 2,748.50 12220167 B600 B610 1 2,748.50 12220791 B600 B610 1 2,748.50 12225968 B600 B610 1 2,748.50 12229943 B600 B610 1 2,748.50
MC ENG MS 12041381 B600 B610 1 249.50 12170039 B600 B610 1 2,748.50 12170719 B600 B610 1 2,748.50
MF ENG MS 12069731 B600 B610 1 624.35 12196069 B600 B610 1 3,998.00 12220120 B600 B610 1 2,748.50 12220571 B600 B610 1 2,748.50
RMMET CR ENG PHD 10058346 B600 B610 1 2,748.50 MT ENG MS 12219030 B600 B610 1 2,748.50
#N/A #N/A #N/A 12201613 B600 B610 1 2,748.50 Winter Total 33 87,826.65
2006 Total 186,395.00
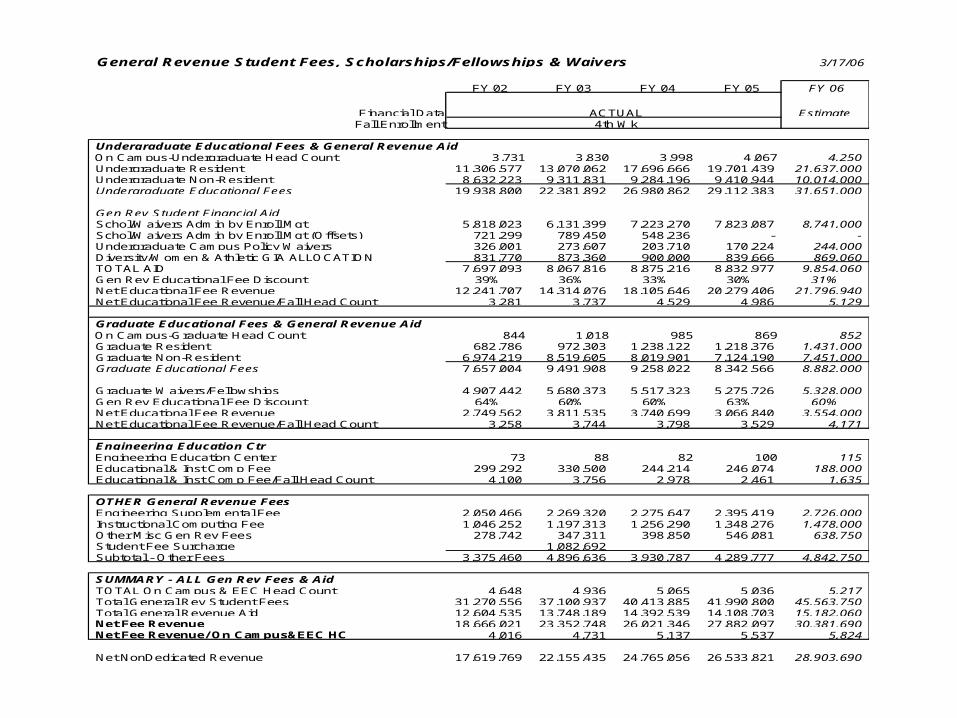
General Revenue Student Fees, Scholarships/Fellowships & Waivers 3/17/06
FY 02 FY 03 FY 04 FY 05 FY 06
Financial Data Estimate Fall Enrollment
Undergraduate Educational Fees & General Revenue Aid On Campus-Undergraduate Head Count 3,731 3,830 3,998 4,067 4,250 Undergraduate Resident 11,306,577 13,070,062 17,696,666 19,701,439 21,637,000 Undergraduate Non-Resident 8,632,223 9,311,831 9,284,196 9,410,944 10,014,000 Undergraduate Educational Fees 19,938,800 22,381,892 26,980,862 29,112,383 31,651,000
Gen Rev Student Financial AidSchol/Waivers Admin by Enroll Mgt 5,818,023 6,131,399 7,223,270 7,823,087 8,741,000 Schol/Waivers Admin by Enroll Mgt (Offsets) 721,299 789,450 548,236 - - Undergraduate Campus Policy Waivers 326,001 273,607 203,710 170,224 244,000 Diversity/Women & Athletic GIA ALLOCATION 831,770 873,360 900,000 839,666 869,060 TOTAL AID 7,697,093 8,067,816 8,875,216 8,832,977 9,854,060 Gen Rev Educational Fee Discount 39% 36% 33% 30% 31%Net Educational Fee Revenue 12,241,707 14,314,076 18,105,646 20,279,406 21,796,940 Net Educational Fee Revenue/Fall Head Count 3,281 3,737 4,529 4,986 5,129
Graduate Educational Fees & General Revenue Aid On Campus-Graduate Head Count 844 1,018 985 869 852 Graduate Resident 682,786 972,303 1,238,122 1,218,376 1,431,000 Graduate Non-Resident 6,974,219 8,519,605 8,019,901 7,124,190 7,451,000 Graduate Educational Fees 7,657,004 9,491,908 9,258,022 8,342,566 8,882,000
Graduate Waivers/Fellowships 4,907,442 5,680,373 5,517,323 5,275,726 5,328,000 Gen Rev Educational Fee Discount 64% 60% 60% 63% 60%Net Educational Fee Revenue 2,749,562 3,811,535 3,740,699 3,066,840 3,554,000 Net Educational Fee Revenue/Fall Head Count 3,258 3,744 3,798 3,529 4,171
Engineering Education Ctr Engineering Education Center 73 88 82 100 115 Educational & Inst Comp Fee 299,292 330,500 244,214 246,074 188,000 Educational & Inst Comp Fee/Fall Head Count 4,100 3,756 2,978 2,461 1,635
OTHER General Revenue FeesEngineering Supplemental Fee 2,050,466 2,269,320 2,275,647 2,395,419 2,726,000 Instructional Computing Fee 1,046,252 1,197,313 1,256,290 1,348,276 1,478,000 Other Misc Gen Rev Fees 278,742 347,311 398,850 546,081 638,750 Student Fee Surcharge 1,082,692 Subtotal - Other Fees 3,375,460 4,896,636 3,930,787 4,289,777 4,842,750
SUMMARY - ALL Gen Rev Fees & AidTOTAL On Campus & EEC Head Count 4,648 4,936 5,065 5,036 5,217 Total General Rev Student Fees 31,270,556 37,100,937 40,413,885 41,990,800 45,563,750 Total General Revenue Aid 12,604,535 13,748,189 14,392,539 14,108,703 15,182,060 Net Fee Revenue 18,666,021 23,352,748 26,021,346 27,882,097 30,381,690 Net Fee Revenue/ On Campus&EEC HC 4,016 4,731 5,137 5,537 5,824
Net NonDedicated Revenue 17,619,769 22,155,435 24,765,056 26,533,821 28,903,690
4th Wk ACTUAL
What Graduate StudentsGenerate Tuition Revenue?
MS vs PhD By Program Campus vs Distance Education