graduate school of business administration i-shou university
TRANSCRIPT
義守大學企業管理學系碩士班
Graduate School of Business Administration
I-Shou University
碩士論文
消費者忠誠度影響因素之探討
Investigating the Factors Affecting Consumer Loyalty
指導教授:蔡明智 博士
研 究 生:黎氏賢 撰
中 華 民 國 104 年 五 月

i
Acknowledgements This thesis I wrote after 2 years I study at I-shou University. During this time, I have been
exposed to the data warehouse on large thesis and direct exposed to a lot of good people. It is
pleasure, as well as gratitude for all the people I have been exposed, so I can mature as today.
First and foremost, I would like to express to deepest sincerity and respectful gratitude my
advisor Associate Prof. Ming-Chi Tsai. Remember, when you first entered the Institute, on a
teacher's statistics course, I deeply remember the teacher for the Vietnamese students' interest. At
that time, I decided to choose teacher as my guidance teacher. Teacher like my father is very
concerned about my process of writing thesis, giving a lot of advice, so I can smoothly finish this
thesis. Now graduated, I was really fortunate to can recognize such a great teacher, teacher taught
us the things I will keep in mind, after the community, good play to their strengths.
Thank you, my classmates. Two years of life in institute, very happy to be able to recognize
a group of very good students, no distance between us did not polite, very straightforward
conversation, together read along with the pain journals, or in different languages obstacle
clearance. This true friendship, I believe you understand it, even if how long not seen, we can
never forget.
Thank you, my roommate. If you have not been encouraged in me, care about me, I think at
I-Shou University really did not make sense. You've given me a lot of practical advice there, so
that I can complete this thesis.
And finally, father mother, thank you very much. You worked hard to support me so many
years. There is a little success, all you have encouraged me, gave me the best life. In the course of
my success, always have your protection. Thank you ever so love me and support me, also hopes
I can find a good job.
Because of you, let me be more perfect.
ii
Abstract This study present the relationship of the factors affecting customer loyalty at the KFC
restaurant in Vietnam, through the application of theoretical and practical, applied science and
technology. Because the main objective of this research is to give hints for planners, managers
KFC restaurants. Although not conducted on a wide range but the results also partially met the
needs to learn about the relationship between these factors and the specific analysis for the
Vietnamese market.
Thus, customer loyalty is directly studied in relation to four main factors, including Location,
Service quality, Brand image and Customer satisfaction, through questionnaire full of practical
questions. So, for this study, with the goal to better understand the factors that affect customer
loyalty, continued application of statistical software, to give the final result. For Vietnam market,
with some unique characteristics, more or less affect the study. The study has a total of 307
samples are effective, after analyzing data, the results suggest that Location has a significant
positive direct effect on Customer Loyalty, Service Quality has a significant positive direct effect
on Customer Satisfaction and has a significant a part of effect on Customer Loyalty, and finally,
is Brand Image has a significant positive direct effect on Customer Loyalty. The study presented
here has profound implications for future studies of Customer Loyalty and may be one day help
solve problem of relationship between loyalty and other factor in Vietnam market.
Keywords: location, service quality, customer satisfaction, brand image, customer loyalty.
iii
摘要
肯德基市場越來越熱鬧,特別在越南市場已經達到了穩定發展的程度。目
前有 140 多個店面同時開展。本論文的主要目的是研究影響顧客忠誠度的重要
因素,特別選擇四大因素:地點,品牌形象,服務品質與顧客滿意度。運用理
論和實踐,研究這幾個因素之間的關係。提供肯德基管理者有信度的意見。研
究可讓經營者理解五個因素之間的關係,特別是在越南市場。
透過實際的問卷了解顧客基本資料跟研究內容加上探討目前的文獻可以深
入探討這個問題。為了更了解顧客忠誠度的因素之影響,本研究運用了兩個統
計軟體:SPSS 軟體跟 LISREL 8.54 軟體,研究結果跟以前的研究有些不一樣。
對肯德基在越南市場而言,因為有不同的文化,觀念,所以也多少影響到這份
研究的結果。本研究共蒐集 307 份有效樣本,資料分析後顯示四個因素:地點、
品牌形象、跟顧客滿意度對顧客忠誠度有正向影響,唯服務品質於顧客忠誠度
沒有正面影響。另外,服務品質對顧客滿意度也有正面影響。
研究的結果對顧客忠誠度未來的研究有著深遠的影響,可對越南市場的忠
誠度等因素之間的研究有幫助。
關鍵詞:地點、服務品資、顧客滿意度、品牌形象、客戶忠誠度。
iv
Contents
Acknowledgements ................................................................................................... i
Abstract .................................................................................................................... ii
List of Figures ........................................................................................................ vii
Abbreviations and Acronyms ................................................................................ viii
Chapter 1 INTRODUCTION ................................................................................... 1
1.1Research Background .......................................................................................... 1
1.2Research Motivation ........................................................................................... 3
1.3Research Objective and Process .......................................................................... 4
1.3.1Research objective .......................................................................................... 4
1.3.2Thesis organization ......................................................................................... 4
Chapter 2 LITERATURE REVIEW ........................................................................ 7
2.1Location and Brand Image .................................................................................. 7
2.1.1Location .......................................................................................................... 7
2.1.2Brand image .................................................................................................... 8
2.2Service Quality and Customer Satisfaction ......................................................... 9
2.2.1Service quality ................................................................................................. 9
2.2.2Customer satisfaction .................................................................................... 11
2.3Customer Loyalty .............................................................................................. 12
2.3.1Location and Customer loyalty ..................................................................... 13
2.3.2Service quality and Customer loyalty ............................................................ 13
2.3.3Service quality and Customer satisfaction ..................................................... 14
2.3.4Customer satisfaction and Customer loyalty ................................................. 14
2.3.5Brand image and Customer loyalty ............................................................... 15
Chapter 3 RESEARCH METHODOLOGY ........................................................... 15
3.1Research Model ................................................................................................. 16

v
3.2Questionnaire Design ........................................................................................ 18
3.3Data Collection Methods ................................................................................... 21
3.4Data Analysis Tools and Method ...................................................................... 21
Chapter 4 DATA ANALYSIS ............................................................................... 23
4.1Results ............................................................................................................... 23
4.1.1Sample demographics ................................................................................... 23
4.1.2Descriptive statistics ...................................................................................... 26
4.1.3Structural equation modeling, SEM .............................................................. 26
4.1.4Structural Equation Model ............................................................................ 28
4.2Conclusion......................................................................................................... 29
Chapter 5 CONCLUSION AND RECOMMENDATION ..................................... 31
5.1Discussion ......................................................................................................... 31
5.1.1Impact of location on customer loyalty ......................................................... 31
5.1.2Impact of service quality on customer loyalty and customer satisfaction ..... 31
5.1.3Impact of customer satisfaction on customer loyalty .................................... 31
5.1.4Impact of brand image on customer loyalty .................................................. 32
5.2Managerial Implications .................................................................................... 32
5.3Limitations and Future Research Directions ..................................................... 34
5.3.1Limitations of this research ........................................................................... 34
5.3.2Suggestions for future research ..................................................................... 35
References .............................................................................................................. 37
Appendix A ............................................................................................................ 45

vi
List of Tables
Table 1. The main concepts of Store Location .............................................................. 8 Table 2. Model of the five assessment dimensions of Parasuraman et al .................... 11 Table 3. Summary of measurement scale .................................................................... 20 Table 4. The basic data of Respondents in the Formal Test ........................................ 23 Table 5. Covariance Matrix ......................................................................................... 26 Table 6. Factors analysis .......................................................................................... 27 Table 7. Coefficient square root of the AVE ............................................................... 28 Table 8. Hypotheses Testing Results ........................................................................... 32
vii
List of Figures Figure 1. Thesis Organization ....................................................................................... 6 Figure 2. Research Model ........................................................................................... 16 Figure 3. The result of SEM model ............................................................................. 29

viii
Abbreviations and Acronyms
KFC Kentucky Fried Chicken
SPSS Statistical Package for the Social Sciences
L Location
SQ Service Quality
CS Customer Satisfaction
BI Brand Image
CL Customer Loyalty
EFA Exploratory Factor Analysis
WTP Willingness To Pay
Chapter 1 INTRODUCTION
This chapter of mainly content is introduces the Master's thesis and specific topics for this
thesis. Originally, this is also the basis for the conduct of implementing this thesis. Then,
researchers will carry out the planning and construction of the questionnaire study, outlined the
goal of the study, through the relationship between science and practice. Finally, the process is
show to how about to conduct this research.
1.1 Research Background
For the restaurant, companies, factories need large space, enough to layout display products
and their services. So should consider products and services that businesses need to find the
location sold. If businesses want to attract customers to their restaurant, convenient location need
for customers. Therefore, the location must be easy to find, convenient transportation to
customers only need to once and remember about that place. If a company wants to know about
how often they visit the restaurant, which can conduct a market survey to know the situation and
simultaneously suggest managers should put in where their restaurant.
Therefore, the brand is to help companies build and maintain customer loyalty strategic assets.
Strong brand helps to maintain profit margins, establish barriers to entry. Brand is very important
to the company, it must continue to nurture, sustain and protect. This difficulty has been getting
bigger, higher and higher price.
The first thing after coming to dine at a restaurant that customers remember, it is the attitude
of service and quality of food. There are many customers for the quality of service that continues
to restaurant the second, third or nth order. It proves that the quality of services that affect
customer loyalty. But how much impact level, no one is sure, because for every customer, they
set out criteria are different.
There is a marketing term called the customer satisfaction, which is when a product or
service offered by a certain company, can response or surpass the expectations of customers.
Customer satisfaction is very important because it gives marketers and business owners with the
data that they can conveniently use to manage and improve their business. According to Kotler et
al (2000), studies of satisfaction and loyalty of existing customers opens up the opportunity to
acquire new customers. According to old tradition, profits from keeping old customers than to

2
find new customers, because they can save a large of marketing costs. It means keeping existing
customers, synonymous with keeping the company's sustainability. For old customers, they must
apply the appropriate marketing policies to retain clients. Generally, loyalty means that someone
on products and services, while long-term use and trust for that product. Customer loyalty is an
expression and is monitored with customer satisfaction after using the product and use the
services offered by the company, this is the way to keep the company's customers. Loyalty is a
sign to show consumers that always become the company's customers, which always brings the
power and the company has always had a positive perception. Each customer has different
definitions for loyalty. It depends on their purpose, for products and services they consume.
Loyalty show by giving some hints with other customers and keep the consumption of these
products constantly.
In each restaurant, it is important to be making a varied menu and the private with the
interior design. Besides the menu and location, customers are extremely attentive to brand.
Customers can enjoy eating delicious food, beautiful restaurant, but if that brand so far they have
not seen, maybe next time to buy food, they will not choose that restaurant again. Most restaurant
owners are not focused on the importance of food quality and service, which focuses on
decorating the outside of the restaurant, with the aim to allow customers better first impression.
But in some type of fast food restaurants such as Kentucky Fried Chicken (KFC) and many
others, the quality of food is standardized and always controlled, so the quality products will
better. In such cases, the restaurant can not only focus on quality service, but also add a location,
brand image, customer satisfaction and customer loyalty has a significant role in the sale of the
product.
Today, the change in the lifestyle of customers makes consumers find reason to criticize.
Customer always wants the good and perfect service. According to Sukarto (2011), with results
like that is because of the added value of the service in the restaurant can increase revenue, while
Walker and Lundberg (2005), said that the quality of food is important for customers, especially
when they need to choose a restaurant. The main reason that customer to go to a restaurant when
the customer is hungry. However, customers also need entertainment and identify restaurants that
provide entertainment services to create an exciting environment.
3
Today, in the era of globalization, there is a lot of competition in the country and overseas. If
food and interior of the restaurant is good, but the service was not focused, customers will leave it
immediately or later. Good restaurants will to train their staff continuously do their jobs often
include taking orders, and sell more clue on other products to add to their revenue. Restaurant
business is not like other businesses in general, because the thinking of the restaurant business is
handled "stomach and emotions of our customers", who can handle this problem is the seller or
service (waiter and waitress). In both service and sales, they recommended to the good knowledge
and ability well. There are many fast food restaurants with a large number of customers in Viet
Nam. But which, in the Vietnam market, the number of KFC restaurants have the most. KFC is a
franchise restaurant has done many promotions through TV to keep their loyalty and their survival
and development in global competition. Therefore, this study tries to know the factors that affect
the customer loyalty in Kentucky Fried Chicken restaurant. Moreover, this study may provide
some hints to help administrators of KFC understand more about their customers, which can be
given appropriate policy makes people each to consumers with higher WTP (willingness to pay).
1.2 Research Motivation
Currently, many studies concerning the relationship between locations and customer loyalty;
between brand image and customer loyalty; customer loyalty and service quality; customer
satisfaction to customer loyalty. But to tell the linker to a whole, including all of the above
factors, it is not really much. In the field of business fast food department, in addition to
maintaining and developing the relationship between service quality, satisfaction with customer
loyalty, can see the connections between location to customer loyalty, or because they like
between the customer’s logo just go to restaurant that purchase. But, with every factor mentioned,
impact strength will not similar to customer loyalty; where the cause of the expression; we can
through this study further understand the problem.
Today, fast food is trend around the world. Vietnam is a potential market because of its large
population that most of them are younger. Thus, there are many foreign brands entering to the
market and KFC is one of them. KFC is a famous brand and it launched to Vietnam for the first
time in 1997. However in recent years, the fast food market share has been divided into small
pieces because of penetration of other fast food brands. In order to survive and grow sustainably,
KFC Company needs to find out what the factors influence customer loyalty.

4
In Viet Nam, there are many restaurants to fast food and huge customer base. The main
product of KFC is fried chicken. Until today, the fast food restaurant has developed to more than
140 restaurants in Vietnam, providing jobs for over 3,000 people and has contributed
significantly to the promotion of fast food industry in Vietnam, as well as help for the formation
of a new consumer habits and food culture of the area that KFC appear. The KFC ad service is
done through the obvious, reliability, responsiveness, assurance and empathy. Therefore, the
study of the influence of location, brand image, customer satisfaction and service quality to
customer loyal customers at Kentucky Fried Chicken restaurant is so conducted to better
understand KFC's situation.
Yet previous researches which applied this model did not focus on fast food industry.
Therefore, taking a practical example of the industry – KFC Company, the research is conducted
to determine those factors influencing customer loyalty and to give suggestions for the company.
1.3 Research Objective and Process
1.3.1 Research objective
Main purpose of this research is more understand the relationship of these factors, but mainly
focuses on three themes:
To identify the determinants of users perception towards customer loyalty of KFC
To determine the important level of each element on customer loyalty of KFC.
To give several recommendations based on findings of research and individual
experience and knowledge.
1.3.2 Thesis organization
- In this study, to collect data, will be conducted using two methods is through social
networking and given questionnaire directly to customers at KFC restaurant. Data
collected will be summarized and analyzed.
- Data analysis, will use SPSS software, LISREL modeling.
5
The organization of this research
The research includes five main parts:
Introduction – Stating general background and motivation, objectives, process of this research
as well as the way of which data will be collected.
Literature Review – Explore related concepts, definitions, through previous research related to
the study and then design a research framework and hypothesized.
Questionnaire Design – Detailing the research framework, questionnaire design, sample and
collection sampling.
Data Analysis– Discussion and interpretation of the results obtained from data after being
analyzed.
Conclusion and Recommendation – Discussing the research results, offering suggestions.

6
Conclusion & Recommendation
Identify Problems
Literature Review
Research Framework
Questionnaire Design
Data Collection
Data Analysis
Figure 1. Thesis Organization
7
Chapter 2 LITERATURE REVIEW The main purpose of literature review is to understand and review the content related to
these factors and the relationship between these factors. Opening chapter is a brief introduction to
the article or the doctrine stated that the relationship of the factors. Next, the research process to
search for a better understanding of each factor. Finally, based on these literature review, given
the hypothesis and implementation of the next steps.
This study is establishing the loyalty of customer by evaluating and analyzing the marketing
strategies, through understanding the factors that affect it, that is this study’s target. This research
is used to review historical perspective of loyalty. The main purpose of implementing this
approach in the research project is to make the reader aware of the current literature, which is
related to the topic. The study materials are made using different articles, books, magazines,
etc… to research topics selected. The information is performed using various books and papers of
the researchers worked in the past and have provided a lot of information.
This study will address the current deficiencies in the documentation by increasing
understanding of what’re factors will affect customer loyalty? And more understand the impact of
each factor to customer loyalty.
2.1 Location and Brand Image
2.1.1 Location
According to Aaker (1991), other proprietary assets are considered as competitive
advantages in terms of trademarks, patents, channel relationships, etc... The forward position of
the restaurant is the biggest determinant of sales operations of a retail restaurant food quantity -
rather than the marketing strategy, staff, even the product itself. If a restaurant is not easy to reach
the target market, or is drowned out by the competition in the area, then the expectation of failure
(Lachlan James, 2011).

8
Table 1. The main concepts of Store Location
Authors Concepts
Storper and Walker (1988); Scott (1993)
The concept mainly focuses on competitive
advantages for either innovation or economic
development resulting from particular places.
Feldman, Kutay (1997)
A location advantage expresses the
cumulative investments in human and
technological capability in particular places.
While it is true to say that new technologies make physical distance less important, in fact it
is proved that innovative activity tends to focus on specific locations. It can be explained that
locations do not depend on distance and transportation costs any longer but a suitable place where
by customers can easily get access (Feldman, Kutay, 1997).
Place restaurant is an important factor of the restaurant that effect customer behavior and
customer satisfaction (Hyun, 2010).
2.1.2 Brand image
Brand is one of the signs as type names, designs, and logos, or it may be a sign of a
combination of three things above. It can be confirmed by the products of businesses or services
(Aaker, 1994). Similarly, brand quality have more valuable when the business situation faced
increasing competition, is the reduction of surprise in industrial concentration (Sundar, Kapil, &
Andre, 2011). Chiang and Jang (2007) stated that the guests will purchase of hotel services online.
They found that the brand image can affect the quality and the confidence felt by consumers.
Trust perception seems to play an important role in enhancing long-term customer value in online
services.
Brand image could possibly be a factor affecting customer loyalty business of entertainment.
Biel (1992) stated that brand image has some essential elements, namely, the image of the
manufacturers, product images, competitors and brand image. All three factors will affect
customers regarding brand image perception, but only the brand image will affect the user.
What do your customers think of your company and brand? Important is what your
customers are saying at the time. Customers are using social media groups to share their thoughts
9
about a company's product, service and brand. Branding is not just logos, color combinations, and
slogans of the company of people they think they are. So now, it is tied to the perception of
customers and what they think and say about that brand.
A general theory concerning the brand image as a good psychological preparation of the
brand, will have a positive impact on the behavior of consumers. Thence proceed manage prices
with buyers higher loyalty, and customers can make a positive ad verbally. Perhaps in the retail
business transactions, profits earned from the brand image, brand satisfaction, and brand loyalty
(Osman, 1993; Bloomer and Ruyter, 1998).
Clients hold a series of thoughts on business in their minds. According to Orth and Green
(2009), in the context of the department store reflections related primarily include intellectual
framework of the buyer of a company or shop. The brand image of the company's intangible
capital value which is very difficult to imitate, and it can help an organization to achieve a
sustainable financial performance and unsurpassed (Robert and Dowling, 2002).
2.2 Service Quality and Customer Satisfaction
2.2.1 Service quality
Zeithaml & Bitner (2003) suggested that service quality is a centralized assessment
reflecting customer perceptions about specific size of service: reliability, responsiveness,
assurance, empathy and tangible. Comprehensive review of the face satisfied, it is affected by
awareness of other factors, such as service quality, product quality, and price, while taking into
account factors and circumstances arising individual elements of the customer.
Service quality affects customer satisfaction by providing the performance (real benefits). If
consumers choose to restaurant KFC, they believe that getting in they will receive the best
service and the best products, at all of the KFC restaurant will be the same, regardless of the
location of the restaurant.
Parasuraman et al. (1985) suggested that the service quality is made more complex by the
characteristics of its service. Those authors were identified service quality is the degree of
difference between the expectations of consumers (ie, what consumers want) and their cognitive
(eg, evaluation) of care service.
10
These researchers emphasize that a service is not like a product because it is experienced as
the way it is delivered. Each provider’s service performance reflects his or her emotional
expression during the customer contact, and the customers, in turn, would develop their own
attitudes. Consequently, a consumer might expect more interaction with the provider, thus
creating a more permanent relationship (Schneider & Bowen, 1993, 1995; Mill & Morris, 1986;
Schneider et al., 1994, 1996; Norman, 1991; Stebbing, 1993).
The concept and service quality measurement has generated a lot of discussion going on in
literature, literary interest because of the service marketing, service management and
organizational psychology emphasizes the importance of service quality to attract and retain
customer satisfaction (Schneider et al., 1998; Heskett et al., 1997; Storbacka et al., 1994).
Some literatures provide evidence that the quality of service have an integrated role between
organizations and their customers. The integrating role of quality service is the result of policies
and practices of internal organization, and basic service chain affecting satisfaction and loyalty
(Cronin et al., 2000; Storbacka et al., 1994; Heskett et al., 1997; Zeithaml et al., 1996).
According to Grönroos (1998), service is an interactive process between client and service
provider. Guests traveling in assessing the "intangible" than standard security, reliability, service
quality, convenience and determined. Service quality of is one of the important factors for
re-consumption criteria. To provide high quality services, manager of recreation facilities have
focused on the expectations of the customer to pay, to the exclusion of other customer groups.
Improving the effectiveness of the results achieved and may have on the customer feedback
as a detected previously recognized in other industries (Powpaka, 1996). Customer expectations
for advisory services and then develop a scale for one person to other components of retail stores,
online stores, or directly to the quality of staff sales.
Service quality dimensions including tangible, reliability, responsiveness, assurance, and
empathy (Parasuraman et al., 1985). Or probably will assume certain service quality is tangible,
reliability, responsiveness, underwriting, and empathy (Marshall G, Murdoch L, 2001).
11
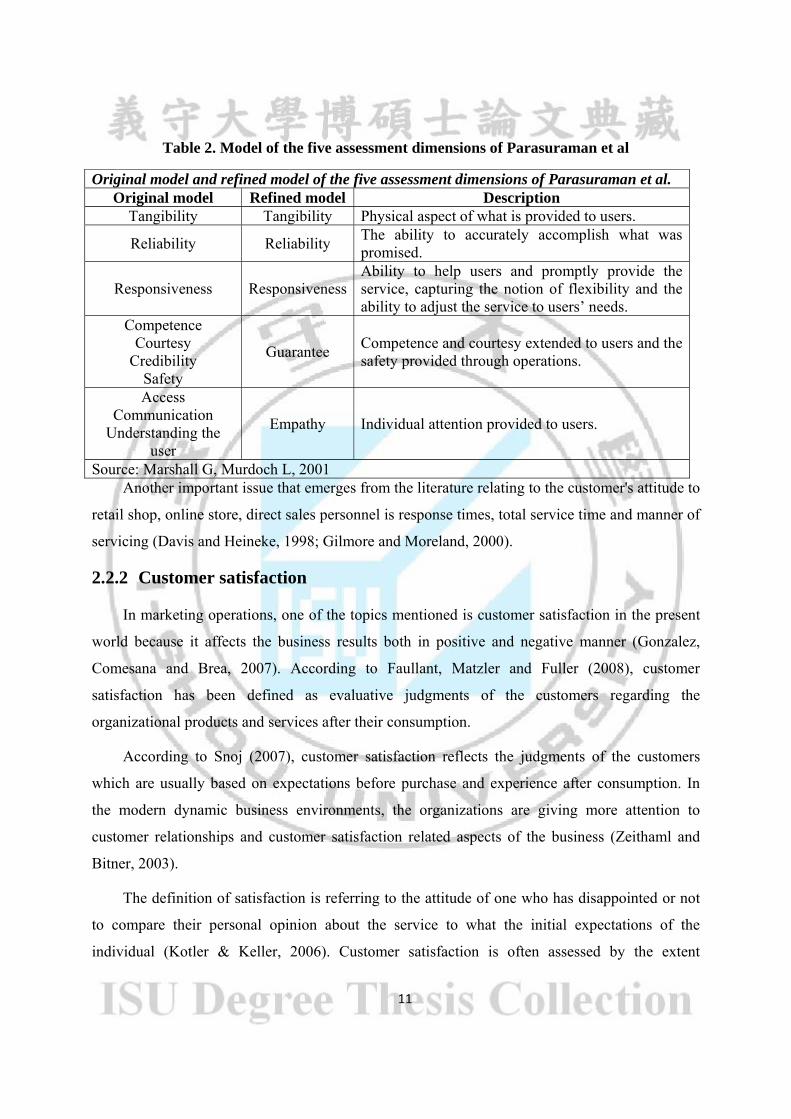
Table 2. Model of the five assessment dimensions of Parasuraman et al
Original model and refined model of the five assessment dimensions of Parasuraman et al. Original model Refined model Description
Tangibility Tangibility Physical aspect of what is provided to users.
Reliability Reliability The ability to accurately accomplish what was promised.
Responsiveness ResponsivenessAbility to help users and promptly provide the service, capturing the notion of flexibility and the ability to adjust the service to users’ needs.
Competence Courtesy
Credibility Safety
Guarantee Competence and courtesy extended to users and the safety provided through operations.
Access Communication
Understanding the user
Empathy Individual attention provided to users.
Source: Marshall G, Murdoch L, 2001 Another important issue that emerges from the literature relating to the customer's attitude to
retail shop, online store, direct sales personnel is response times, total service time and manner of
servicing (Davis and Heineke, 1998; Gilmore and Moreland, 2000).
2.2.2 Customer satisfaction
In marketing operations, one of the topics mentioned is customer satisfaction in the present
world because it affects the business results both in positive and negative manner (Gonzalez,
Comesana and Brea, 2007). According to Faullant, Matzler and Fuller (2008), customer
satisfaction has been defined as evaluative judgments of the customers regarding the
organizational products and services after their consumption.
According to Snoj (2007), customer satisfaction reflects the judgments of the customers
which are usually based on expectations before purchase and experience after consumption. In
the modern dynamic business environments, the organizations are giving more attention to
customer relationships and customer satisfaction related aspects of the business (Zeithaml and
Bitner, 2003).
The definition of satisfaction is referring to the attitude of one who has disappointed or not
to compare their personal opinion about the service to what the initial expectations of the
individual (Kotler & Keller, 2006). Customer satisfaction is often assessed by the extent

12
reasonable and based on their emotional awareness, in addition, also based on the experience
from the services that they are met (Mackenzie & Spreng, 1992; Matthew & Christine, 2000). As
identified by Martin, Ugur, and Dirk (2003), consumer satisfaction for entertainment services is a
function that the purpose is to assess the awareness and feelings of customers, where the presence
of the dominant emotions.
McColl-Kennedy and Schneider (2000) and Reichheld and Sasser (1990) pointed out that in
restaurant industry, customer’ satisfaction is one of the important keys to successful restaurants.
And according to Greywitt and Tewet (2004), customer satisfaction based on customer dining
experiences is based on four factors: environment: 24%, meal: 30%, service: 26%, and cost: 21%.
Mill (2004) has listed the attributes of customer expectations for restaurants in the order as
follows: service quality, availability of parking, food quality and fully prepared, uptime
convenient dynamic, food security, helpful staff, reasonable prices, and response to customer
complaints.
Recently, the theory of customer satisfaction, by the behavior of consumers applying for
food services has shown that customer satisfaction is the most important cause of the behavior
leading their to the re-active as consumers or continue the sponsorship (Almanza et al., 1994;
Johns and Tyas, 1996). Fornell (1992) examined some different businesses and found that loyal
customers are not necessarily satisfied customers, but satisfied customers tend to be loyal
customers. According to Jones (1990), they evaluate the results of customer satisfaction higher
than loyalty. Each a small transformation affects customer loyalty.
2.3 Customer Loyalty
With all of the competitive business strategy, the maintain customer loyalty is the most
important factor (Reichheld, 1996). A client is considered to be loyal when conducting
continuous purchase of goods or services of a certain company (Day, 1977; Griffin, 1996).
Reichheld (1996) suggested that if a customer was satisfied with a certain company, which
customers will helps advertising company in a positive way as word-of-mouth. Improving
customer loyalty means increased economic benefits for businesses. Therefore, there is always
the relentless competition in the strategy and management of the service (Dwyer, Schurr, & Oh,
1987).
13
While evaluation of customer loyalty, according to Parasuraman, Zeithaml, and Berry (1994)
which should be included, were behaviors, intent to repurchase, people’s recommendations
through positive word-of-mouth. There are many factors that affect customer loyalty, for example,
service quality, excellent brand image, and overall customer satisfaction. (Liao, 2007).
Jones and Sasser (1995) said that customer loyalty to three main categories – customer
repurchase intent, primary behavior, and secondary behavior. Customer loyalty to four main
categories—customer’ repurchase intent, word-of-mouth, participation product activity, and
selection of participation product activity (Griffin, 1996). This research mainly will through
research and observation four factors, to determine the extent of influence of customer loyalty at
the KFC restaurant in Vietnam market.
2.3.1 Location and Customer loyalty
Location as one of the factors that customers notice first when customer want to shopping,
so location maybe also be a factor directly affects customer loyalty. From the literature review,
one more time sure that restaurant location is an important factor of the restaurant that affects
customer behavior and satisfaction (Hyun, 2010).
From the above theoretical, hypothesis can be constructed as follows:
H1: Location positively affect Customer loyalty.
2.3.2 Service quality and Customer loyalty
In the restaurant always has many kinds of menus are offered with a variety of interior design.
The quality of human resources is a term of service and processing is also an important aspect. But
most of the restaurants were not focused on the importance of food quality and service. But in some
go franchise restaurants, such as Kentucky Fried Chicken (KFC) and many others, the quality of food
and service are standardized and always controlled, so the product has good quality and service gas
good quality too. In this case, may be the service has an important role in selling the product.
According Walker and Lunberg (2005), service quality is important for the customers especially
when they want to choose a restaurant.
From the above theoretical, hypothesis can be constructed as follows:
H2: Service quality positively affect Customer loyalty.

14
2.3.3 Service quality and Customer satisfaction
Customer satisfaction is a customer’s rational and emotional perception, which is based on
service experiences (Mackenzie & Spreng, 1992; Matthew & Christine, 2000). Martin, Ugur, and
Dirk (2003) said that consumer satisfaction with services was a function of both cognitive and
affective evaluations where the affective evaluations dominate. According to Jennifer and Tom
(2007), Herzberg’s theory was capable of expressing service quality dimensions and a better way
to address human satisfaction. Robert (2001) also showed that in the minds of customers, the
tangible elements of the service are the most important factors. Tangible factors can have a major
impact on the change in the overall. According to Monica (2009), the study seems to make more
sense in the field of recreation and tourism, in the context of culture and society is increasingly
diverse.
One of the important role of this study was to determine the level of customer satisfaction, and
to apply these factors to find it. When determining customer satisfaction, often will use the indicators:
total satisfaction of the performance of services, as well as measure of consumer perspective (Singh,
1991; Manfred & Grund, 2000; Dermanov & Eklof, 2001; Chang & Yuan, 2002).
From the above theoretical, hypothesis can be constructed as follows:
H3: Service quality positively affect Customer satisfaction.
2.3.4 Customer satisfaction and Customer loyalty
Tjiptono and Dianna (2000), claimed that customer satisfaction means evaluating the
product purchase while awareness to the products and services selected efficiency can make or
can supply give them hope than with before purchase.
According to Oh (1999), the reason why customer satisfaction is an important concern for
the modern organizations because it affects the loyalty level of the customers in a significant
manner. In the present corporate world, it is the main target of every firm to ensure their
customers loyalty; therefore, the management of the organization is giving particular importance
in order to provide maximum satisfaction to their customers (Snoj and Mumel, 2002).
The relationship between satisfaction and loyalty has been observed in many studies.
According Kandampully & Suhartanto (2000), now in the restaurant industry, customer
satisfaction is one of the most important results of marketing activities have been.

15
From the above theoretical, hypothesis can be constructed as follows:
H4: Customer satisfaction positively affect Customer loyalty.
2.3.5 Brand image and Customer loyalty
In normal, high brand recognition translates into loyal customers. Customer loyalty is higher
if the positive associations with the brand and the knowledge that they have about a product
before their first contact with it was confirmed completely stable and confirmed try with your
first purchase. According Biel (1992), these factors will affect customer perception of brand
image, but only the brand image will influence brand choice of customers. Therefore, it is
reasonable to hypothesize that customer loyalty has a significant direct impact on brand image.
Businesses can provide high-quality services, establish brand image and provide satisfaction to
their clients in order to maintain competitiveness and improve the level of customer retention
(Grewal, Krishnan, Julie, & Norm, 1998; Parasuraman, Zeithaml, & Berry, 1996; Etzel, Walker,
& Stanton, 2001; Jo. Lee, Ja. Lee, & Feick, 2001).
Huber and Herman (2001) demonstrated a significant relationship between the positive and
the product brand image and customer loyalty (clotty et al, 2008).
From the above theoretical, hypothesis can be constructed as follows:
H5: Brand image positively affect Customer loyalty.
In summary, this chapter presents the literature review analysis. The study has reviewed
different literatures which have been written on the topics of location and brand image in order to
undertake this chapter. This research has first explained the concept of location and has discussed
its importance in the present world. This research has also discussed the concept of client loyalty
and the discussion reflects that customer loyalty is defined as a repeat purchase behavior of the
customers due to their favorable attitudes towards the organizational products and services. The
relationship between customer satisfaction and loyalty also has been identified and the analysis of
different literature shows that there is a direct link between client satisfaction and loyalty.
Therefore, it is one of the considerations necessary and important for companies are operating in
the fast food industry. It aims to ensure that the companies that still have the appropriate
measures to enhance the loyalty of targeted customer groups.

16
Chapter 3 RESEARCH METHODOLOGY
3.1 Research Model
Based on the purpose of the study, the research background, research motivation, plus
literature review and analytical papers, this study given the research framework, was introduced
immediately below. First, this model represents the relationship between brand image, service
quality, location, customer satisfaction and customer loyalty. The model shown in Fig. 2 explains
that the location, service quality, customer satisfaction and brand image, all the factors affecting
customer loyalty, as well as demonstrating the relationship between service quality with customer
satisfaction.
H1
H2
H3 H4 H5
Figure 2. Research Model
First, this study based on the theory of location, brand image, service quality, satisfaction
and customer loyalty along with previous studies to select the scale levels accordingly. After that,
the study was conducted in two phases:
LOCATION
SERVICE QUALITY
CUSTOMER SATISFACTION
BRAND IMAGE
CUSTOMER LOYALTY
17
1. Conducting exploratory research by qualitative methods.
There are different types of approaches which can be used by the researchers in order to
conduct the research (Bryman and Bell, 2011). These approaches include quantitative approach
to research, qualitative approach to research, pragmatic research approach and participatory
approach to research (Collis and Hussey, 2003). This case can select any approach considering
the study objectives and the main targets of the research (Gill and Johnson, 2010). The
quantitative approach to research is associated with positivist paradigm (Smith Lowe and Thorpe,
2002). While using the quantitative research approach, the researchers are collecting and
converting the research information into numbers with an intention to do the statistical
calculations and generate the research results. In order draw the conclusions while using the
quantitative research, it is important to have more than one hypothesis (Saunders, Lewis and
Thornhill, 2009). The data is collected by using different methods and procedures and statistical
analysis is conducted by the researchers which is also helpful in identifying the relationships
between two and more variables (Scheyvens and Donovan, 2003).
2. Conducting descriptive research by quantitative methods in the form of purposive
sampling. Research was conducted through questionnaire which has sent to KFC’ customer in
Vietnam. The self-answered questionnaire would be used as a tool to gather information and data
needed for the quantitative analysis above. Questionnaire were sent to surveyed customer via
social network link to the questionnaires form designed on the internet and a part is direct to the
customers when customers to dine at KFC. The official questionnaire can be found in the
Appendix A of study case.
The qualitative approach to research is also commonly used by the researchers all over the
world and it is linked with constructivist paradigm (Wilkinson and Birmingham, 2003). This
approach of research is usually considered by the information seekers who are conducting the
research on any social problem (Yin, 2003). The qualitative research approach helps to get deeper
understanding of the research problem and the human behaviors, beliefs, and experiences can
also be analyzed with the help of this research approach (Bryman and Bell, 2011). While using
this research approach, the researchers do not base their entire study on pre-determined
hypothesis. However, they are focused on identifying the solution of the research problem which
is guided by different theoretical aspects (Collis and Hussey, 2003). The in depth interviews,

18
observation and focus groups are the most commonly used methods of collecting the research
data while undertaking the qualitative approach to research (Gill and Johnson, 2010). The data
collected by using this approach of research is usually very huge and it is time consuming to
interpret that data but it also allows greater flexibility as compare to quantitative research (Smith
Lowe and Thorpe, 2002).
The pragmatic approach to research is linked with both quantitative and qualitative research
approaches (Silverman, 2004). The participatory research approach is adopted by the researchers
who believes that the existing approaches to research do not respond to their needs and helpful
for them to conduct the research effectively (Yin, 2003). The researchers can use any methods to
collect the desired research data which include face to face interviews, questionnaires, focus
groups and observations. The most discussed benefit of using the pragmatic approach to research
is that it helps the researchers to enjoy the benefits of both qualitative and quantitative approach
of research. For this particular research, the researcher has selected the quantitative approach to
research. The questionnaire method has been used in order to collect the data for the purpose of
generating the research outcomes.
In the end of the questionnaire, after getting suitable copies as required, data would be coded,
put into the system, cleaned and analyzed.
3.2 Questionnaire Design
First of all, the questionnaire is designed to collect the data from users. Closed-ended
questions are used where users could decide to rate the situation in along the scale continuum.
The questionnaire is divided into two parts. The first one includes 22 questions on all of
factors. Although in service quality factors are more than five questions, but only this topic
choices represent 5 questions and matching regional nature of Vietnam. And similar are also
explained on factors of customer satisfaction. The second one consists of several demographic
questions in order to collect users’ basic information. The Likert scale is used to measure the
power of each element. The Likert scale is a commonly used tool to assess summated scales.
Respondents were asked to assess the agreement between 5 to express either a favorable or an
unfavorable attitude to the object of interest, such as:
1 = Strongly Disagree; 2 = Disagree; 3 = Neutral; 4 = Agree; 5 = Strongly Agree.

20
Table 3. Summary of measurement scale
CODE Variables Sources
LOCATION L1
The KFC’s are conveniently located to customers.
Feldman, Kutay (1997)
L2 I easily to found a KFC everywhere. Feldman, Kutay (1997)L3 I choose KFC because of its location. Feldman, Kutay (1997)
SERVICE QUALITY
SQ1 My bill has never been miscalculated. Parasuraman (1986)
SQ2 I do not have to wait for a long time after ordering.
Parasuraman (1986)
SQ3 KFC’s employees will follow my personal requirements.
Parasuraman (1986)
SQ4 Public environment is clean. Parasuraman (1986)
SQ5 When I ask about the price and menu, KFC’s employees are consistently courteous.
Parasuraman (1986)
CUSTOMER SATISFACTION
CS1 I am satisfied with the menu of KFC. Yeh (2009)
CS2 I am satisfied with the explanation by the staff at the restaurant when I have questions.
Yeh (2009)
CS3 I am satisfied with KFC’s brand, image and logo.
Yeh (2009)
CS4 I am satisfied with the prices. Yeh (2009) CS5 I am satisfied with foods of KFC. Yeh (2009)
CS6 I think KFC restaurants are better than the other fast food restaurant.
Yeh (2009)
BRAND IMAGE
BI1 I easily remember the logo, images of KFC.
(Keller 2008)
BI2 I think of KFC when I think about fast food.
(Keller 2008)
BI3 KFC’s image is very unique compared to other fast food brands on the market.
(Keller 2008)
BI4 KFC is a premium brand in the market. (Keller 2008)
CUSTOMER LOYALTY
CL1 I go to KFC restaurant when I want to use fast food.
Assael (1992); Sanvik (1997)
CL2 I frequently eat at KFC restaurants. Assael (1992); Sanvik (1997)
CL3 I do not care about the other brands but KFC.
Assael (1992); Sanvik (1997)
CL4 I am willing to buy KFC despite of its higher price, as long as in the acceptable range.
Assael (1992); Sanvik (1997)
21
3.3 Data Collection Methods
This study will be conducted to collect data in two main ways:
- To create a text file with the name of the content questions: "QUESTIONNAIRE
SURVEY" by Google doc software, hosted on Google drive. Through social network page,
upload a linked and send invitations to friends, friends of friends, organizations online. And the
results will be displayed on the right in an excel file in Google drive.
- Directly at fast food restaurants, and recovery conducting questionnaires. In this case,
the result will be collected manually enter all data and classify the sheets investigation invalid.
Results were collected into excel and continue next steps.
- Sample size & sampling technique
Sampling is concerned as the selection of a group of individuals from a statistical
population to draw the characteristics of that entire population (Parasuranaman et al., 2004,
p.356). A conclusion results from the sample of the population may have the ability to achieve
the research objectives (Saunders et al., 2007).
According Hair (2006), to ensure the reliability of the study, the sample size required is > =
100.
The target group of respondents for this survey is customers who had eaten at KFC. This
study is predicted to collect about 400 samples. Afterwards, all acceptable questionnaires were
entered and analyzed with the SPSS software version 20 and LISREL modeling version 9.1.
3.4 Data Analysis Tools and Method
Data that put into the SPSS would be used through 4 kinds of tests.
- Descriptive statistics
Descriptive statistics was initially conducted to describe main features of the sample. It
would transform the process of raw data to a completed form which provides information for
describing a set of factors under the same condition. It also provides frequencies as well as
measures central tendency and dispersion.
22
- Reliability test
The reliability test is evaluated by using Cronbach’s alpha. With reference to Canvana et al.
(2001), Cronbach alpha coefficient is an internal consistency. It is often used to estimate the
reliability of a sample. The theoretical alpha value varies from 0 to 1. According to Nunnually
and Bernstein (1994), if the reliability of scale varies from 0.70 to 0.8, it was good. The
Cronbach’s alpha >= 0.60, scale is acceptable in terms of reliability. An observed variable is
accepted if its item-total correlation is greater than 0.30. If the variables are lower than 0.3, they
would be removed (Nunnally & Bernstein, 1994). Data were firstly tested with reliability test and
the retained variables, afterwards, were put into EFA.
In research process, factor loading means the correlation of each item and the factor. The
loadings are considered practically significant if it is from +/-0.50 or greater. Otherwise, all
loadings (<0.5) are deleted (Hair et al., 1998). After conducting EFA, the Cronbach’s alpha
was recalculated for the factor whose items were eliminated.
Data that put into the LISREL would be used through:
- Analyzing the factors, finding errors and basic indicators in statistics.
- Factor analysis can be: exploration - the computer will determine the basic elements
are; confirmed - the researchers determined the structural fundamentals of such measures, and
then check the data consistent with the hypothesis.
- The measurement model shows how the observed indicators linked to the underlying
latent variable.
- The structural model shows how the latent variables are linked together.

23
Chapter 4 DATA ANALYSIS
In this chapter, the research findings and final results of the study are presented. The
researcher has conducted the analysis of the information in order to generate the main findings of
the study. In order to undertake this particular study, the results and information has been
collected through the questionnaire survey method. The researcher has conducted the survey
with different customers who were visiting the fast-food restaurant in order to identify the
relationship between location, service quality, customer satisfaction, brand image and customer
loyalty.
4.1 Results
4.1.1 Sample demographics
This study will analyze the composition of the structure of the questionnaire collected data
through a descriptive statistical sample method to sort out the basic properties of the model
number and percentage distribution status. By measuring the object of this study is mainly
related to the competent authorities of the main administration, the subject's basic information,
including: gender, age, income, occupation, often the degree to restaurants to offer. Sample
distributions are shown in Table 4 below. There were totally 390 questionnaires sent to users.
The returned questionnaires were 359, yielding a response rate of 92.05%. In the analysis
process, there were 52 questionnaires not usable for data analysis because of missing answers, so
they had been deleted. Afterwards, all acceptable 307, as rate of 85.52% questionnaires were
entered and analyzed with modeling LISREL 8.54 and the SPSS software version 20.
Table 4. The basic data of Respondents in the Formal Test
Variable Frequency Percentage (%) 1. Age
Under 20 years 79 25.7321 – 30 years old 212 69.0631 – 40 years old 14 4.5641 – 50 years old 2 0.65Over 51 years old 0 0
2. Gender Male 102 33.22Female 205 66.78
3. Status
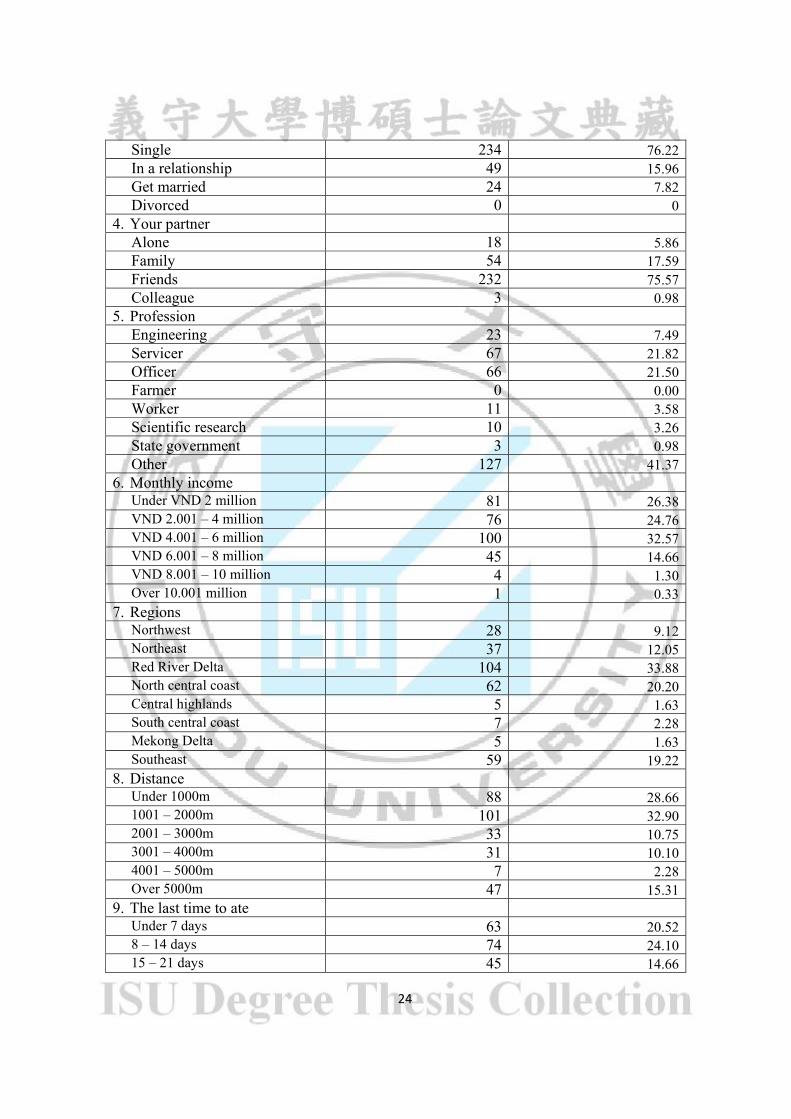
24
Single 234 76.22In a relationship 49 15.96Get married 24 7.82Divorced 0 0
4. Your partner Alone 18 5.86Family 54 17.59Friends 232 75.57Colleague 3 0.98
5. Profession Engineering 23 7.49Servicer 67 21.82Officer 66 21.50Farmer 0 0.00Worker 11 3.58Scientific research 10 3.26State government 3 0.98Other 127 41.37
6. Monthly income Under VND 2 million 81 26.38VND 2.001 – 4 million 76 24.76VND 4.001 – 6 million 100 32.57VND 6.001 – 8 million 45 14.66VND 8.001 – 10 million 4 1.30Over 10.001 million 1 0.33
7. Regions Northwest 28 9.12Northeast 37 12.05Red River Delta 104 33.88North central coast 62 20.20Central highlands 5 1.63South central coast 7 2.28Mekong Delta 5 1.63Southeast 59 19.22
8. Distance Under 1000m 88 28.661001 – 2000m 101 32.902001 – 3000m 33 10.753001 – 4000m 31 10.104001 – 5000m 7 2.28Over 5000m 47 15.31
9. The last time to ate Under 7 days 63 20.528 – 14 days 74 24.1015 – 21 days 45 14.66
25
22 – 28 days 35 11.40Longer than 29 days 81 26.38Never 9 2.93
10. Frequency Once in a month 174 56.68Twice in a month 92 29.97Once in a week 33 10.75Twice in a week 8 2.61Daily 0 0
11. Willingness to pay Under VND 100,000 62 20.20VND 101,000 – 250,000 181 58.96VND 251,000 – 400,000 41 13.36VND 401,000 – 550,000 11 3.58VND 551,000 – 700,000 8 2.61Over VND 701,000 4 1.30
Data source: This study
Look at tables, can see the most customers who had to restaurants are in 30 years old or
younger, this proved to restaurant’ customers are in the youth age, and the large number are
female customer. Because customers are under 30 years old, most are single, in a relationship or
have a family, representing 92.18% of the total number of customers are asking. Customer files
are evenly distributed in the trades, and it does not affect the results of the investigation. Reviews
relation to the consumption of this product, may refer to the income of the customer. Because
Vietnam is still a developing country, therefore, the average income of people usually below 6
million, accounting for 83.17% and earning $ 6-8 million accounted for 14.66%. This table
shows that current income levels of the Vietnamese people is above average levels, therefore,
will affect more or less to how often they visit the store and the amount for each expense. Data
collected stating that to 56.68% of customers often visit restaurants once a month, and each time
spending in the range 101-250 thousand accounted for 58.96%. In addition, because the
advantage of terrain, customers often choose the restaurant near the apartment buildings, or
where customer work, so convenient for shopping and saving time, this index makes up 58.96%
of all customers surveyed.

26
4.1.2 Descriptive statistics
Reliability test, the first to Cronbach's α coefficient of each factor impulse item internal
consistency of the question, according to the Nunally (1978), Cronbach’s α coefficient greater
than 0.7 indicates highly internally consistent scales, can be called with a high confidence, and
more than 0.5 or 0.6 is above an acceptable level, called medium degrees. Each other, the
proposed confirmatory factor analysis results can view their factor loadings, the necessity of all
the problems in the questionnaire to determine, on the basis of this study literature (Hair el., 2006)
recommendations to 0.5 as a threshold value of factor loadings.
This study descriptive statistical analysis of a facet results and correlation analysis, the
average of all facets of the standard deviation and correlation coefficients were finishing with
Table 5.
Table 5. Correlation Matrix
Variable MeanStd.
Deviation1 2 3 4 5
1. Customer satisfaction 3.64 0.69 0.65 2. Customer loyalty 3.12 0.91 0.41 0.86 3. Location 3.47 0.79 0.17 0.28 0.51 4. Service quality 3.85 0.66 0.29 0.21 0.28 0.73 5. Brand image 3.73 0.69 0.34 0.41 0.23 0.33 0.76 Samples: 307 Diagonal line of the result coefficient Cronbach’s α
Cronbach’s α coefficient results showed that all the elements are displayed relationship, the
question arises are showing the impact, consistent answer - equal - every variable observed by
ladder measure. Although the location factor, the index of Cronbach’s α value lower than other
factors, but still within an acceptable range.
4.1.3 Structural equation modeling, SEM
In this study used LISREL 8.54 statistical software for testing structural equation
modeling, ̣SEM, and the idea for the study were purchased confirmation factor analysis, CFA.
Study mode analysis test divided into two modes: one for the measurement mode, the other for
the structural model. Before the pattern detection, first is must to complete the measurement
mode, the measurement mode is used to measure the reliability and validity of the scale, in order
27
to prevent errors due to measurement errors caused by the research mode, and then conducting
structural pattern analysis to verify the research model.
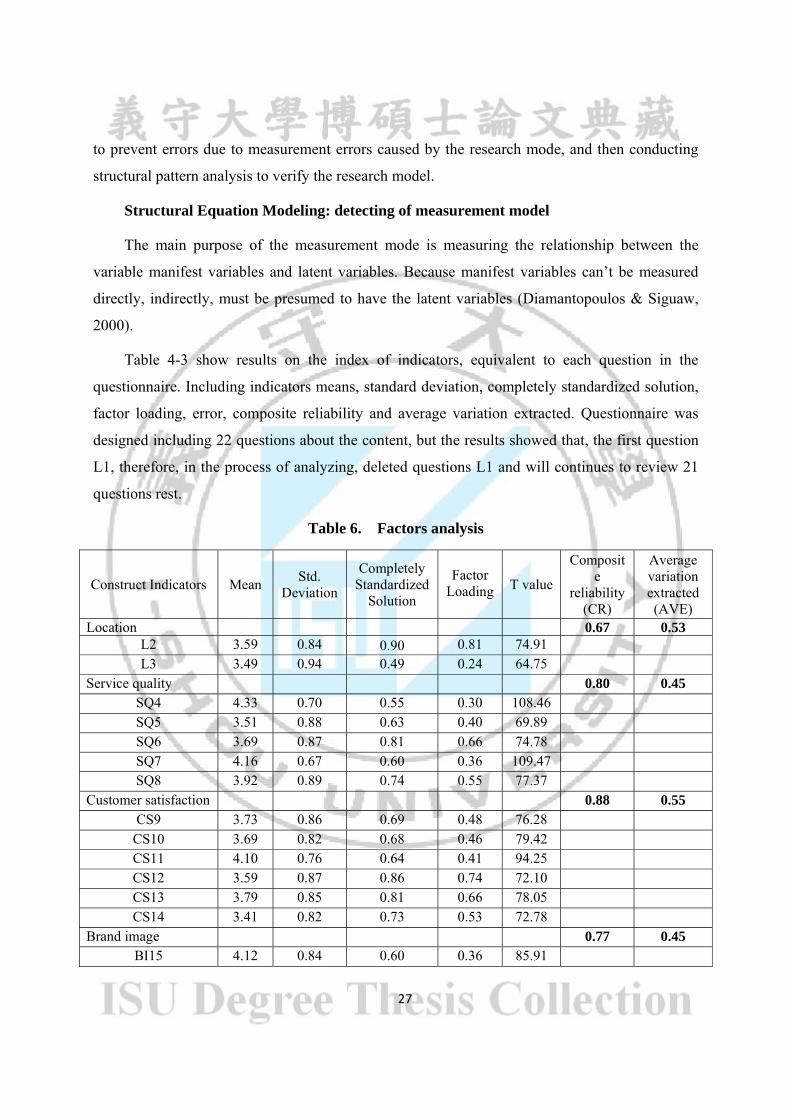
Structural Equation Modeling: detecting of measurement model
The main purpose of the measurement mode is measuring the relationship between the
variable manifest variables and latent variables. Because manifest variables can’t be measured
directly, indirectly, must be presumed to have the latent variables (Diamantopoulos & Siguaw,
2000).
Table 4-3 show results on the index of indicators, equivalent to each question in the
questionnaire. Including indicators means, standard deviation, completely standardized solution,
factor loading, error, composite reliability and average variation extracted. Questionnaire was
designed including 22 questions about the content, but the results showed that, the first question
L1, therefore, in the process of analyzing, deleted questions L1 and will continues to review 21
questions rest.
Table 6. Factors analysis
Construct Indicators Mean Std.
Deviation
Completely Standardized
Solution
Factor
Loading
T value
Composite
reliability (CR)
Average variation extracted (AVE)
Location 0.67 0.53 L2 3.59 0.84 0.90 0.81 74.91 L3 3.49 0.94 0.49 0.24 64.75
Service quality 0.80 0.45 SQ4 4.33 0.70 0.55 0.30 108.46 SQ5 3.51 0.88 0.63 0.40 69.89 SQ6 3.69 0.87 0.81 0.66 74.78 SQ7 4.16 0.67 0.60 0.36 109.47 SQ8 3.92 0.89 0.74 0.55 77.37
Customer satisfaction 0.88 0.55 CS9 3.73 0.86 0.69 0.48 76.28
CS10 3.69 0.82 0.68 0.46 79.42 CS11 4.10 0.76 0.64 0.41 94.25 CS12 3.59 0.87 0.86 0.74 72.10 CS13 3.79 0.85 0.81 0.66 78.05 CS14 3.41 0.82 0.73 0.53 72.78
Brand image 0.77 0.45 BI15 4.12 0.84 0.60 0.36 85.91

28
BI16 3.83 0.91 0.82 0.67 73.63 BI17 3.64 0.89 0.68 0.46 71.48 BI18 3.49 0.85 0.57 0.32 72.04
Customer loyalty 0.87 0.63 CL19 3.65 0.92 0.81 0.66 69.55 CL20 3.08 1.15 0.81 0.66 46.70 CL21 2.56 1.15 0.72 0.52 38.91 CL22 3.27 0.97 0.82 0.67 58.80
First of all, for construct confirmatory factor analysis Based on the analysis table, results
displays the mean value of the factors that are ≥ 3, which showed the results to be feasible, there
is reliability. About composite reliability (CR), all indices greater than 0.6, this proved composite
reliability of this scale well and be accepted. Average variation extracted in this study, with
service quality and brand image, although no greater than 0.5 but in general there are three
remaining factors correspond to greater than 0.5, so the results of two factors are acceptable.
Table 7. Coefficient square root of the AVE Variable 1 2 3 4 5
1. Customer satisfaction 0.74 2. Customer loyalty 0.41 0.79 3. Location 0.17 0.28 0.73 4. Service quality 0.29 0.21 0.28 0.67 5. Brand image 0.34 0.41 0.23 0.33 0.67 Samples: 307 Diagonal line of the result coefficient square root of the AVE
Results of the factors obtained after analysis are greater than 0.5, indicating good of this
scale and are acceptable. Results showed that all indicators are satisfied and fully consistent with
this model.
4.1.4 Structural Equation Model
With appropriate indicators criterion linear structural equation modeling aspects, (Bagozzi
& Yi, 1988) proposed based on the index as a benchmark: ratio chi-square value of its degrees of
freedom (χ2/d.f) should be less than 5; Adjusted goodness-of-fit index (AGFI) should be greater
than 0.80; Comparative fit index (CFI); normed fit index (NFI) and non-normed fit index (NNFI)
should be greater than 0.90; standardized root mean square residual (SRMR) should be greater
than 0.08 , it is present the model with degree of the appropriate.
29
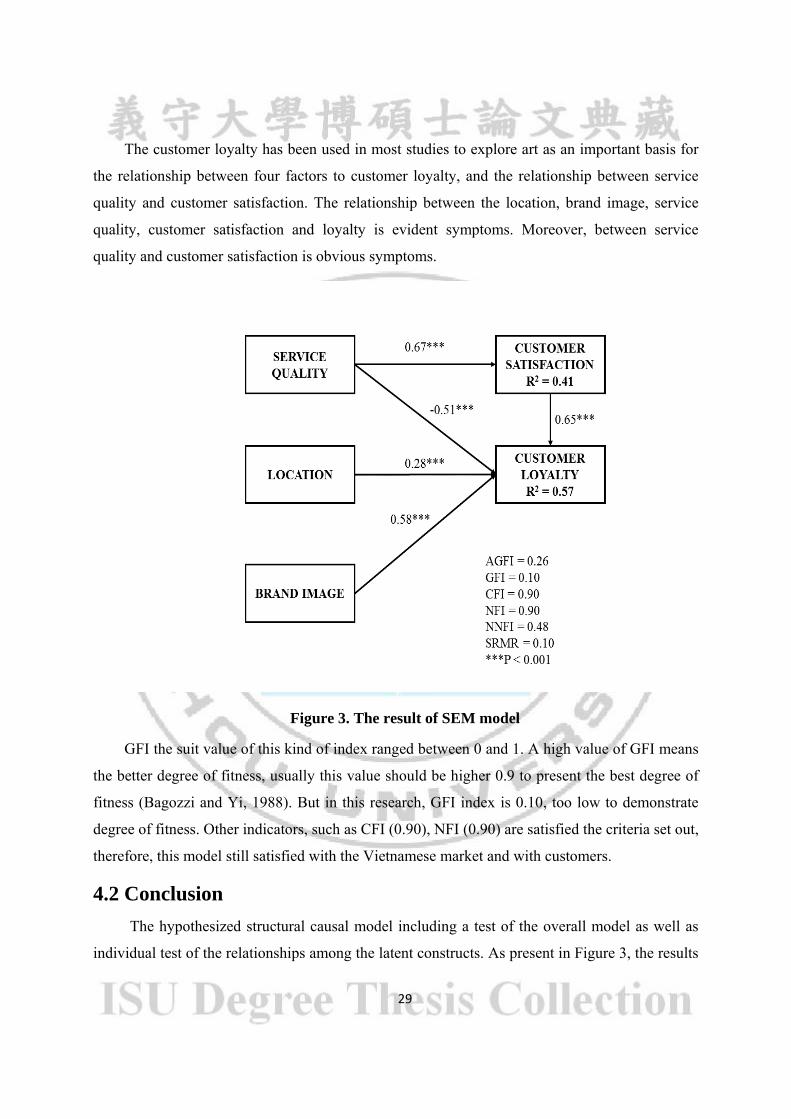
The customer loyalty has been used in most studies to explore art as an important basis for
the relationship between four factors to customer loyalty, and the relationship between service
quality and customer satisfaction. The relationship between the location, brand image, service
quality, customer satisfaction and loyalty is evident symptoms. Moreover, between service
quality and customer satisfaction is obvious symptoms.
Figure 3. The result of SEM model GFI the suit value of this kind of index ranged between 0 and 1. A high value of GFI means
the better degree of fitness, usually this value should be higher 0.9 to present the best degree of
fitness (Bagozzi and Yi, 1988). But in this research, GFI index is 0.10, too low to demonstrate
degree of fitness. Other indicators, such as CFI (0.90), NFI (0.90) are satisfied the criteria set out,
therefore, this model still satisfied with the Vietnamese market and with customers.
4.2 Conclusion
The hypothesized structural causal model including a test of the overall model as well as
individual test of the relationships among the latent constructs. As present in Figure 3, the results

30
offered support for the relationship between Location and Customer Loyalty at a significant level
0.28 (p<0.001). Consequently, Customer Loyalty was found to be direct influenced by Brand
Image, coefficient of 0.58 (p<0.001). Moreover, Service Quality is positively affected Customer
Satisfaction, as indicated by the completely standardized coefficient of 0.67 (p<0.001), but
Customer Loyalty was found to negatively influence by Service Quality (completely
standardized coefficient of -0.51 and p<0.001). And the results offered support for the
relationship between Location and Customer Loyalty at a significant level 0.65 (p<0.001).

31
Chapter 5 CONCLUSION AND RECOMMENDATION
Main content of this chapter is yet concluded for this study, while pointing out the limits of
thesis. Firstly stated conclusions about the research framework and accept or reject the
hypothesis. Simultaneously, from the results obtained, this study need to find the cause of theory
and implication to confirm the reasonableness of the study. From the limitations of this essay,
clues and resolve outlined orientations for the subject. With the content contained in the basic
program, this research hopes to continue to promote the practical application and orientation for
graduate students want to use reasoning from this thesis.
5.1 Discussion
After analyzing the 307 samples, we have reached the following conclusions:
5.1.1 Impact of location on customer loyalty
Hyun (2010) says that the restaurant location is one of the key feature of the restaurant that
affect customer behavior and satisfaction. And the results in this study supported that Location
positively affect Customer Loyalty (H1). When restaurant with locations closer, will leading to
customer loyalty higher.
5.1.2 Impact of service quality on customer loyalty and customer satisfaction
According to Walker and Lunberg (2005), the quality of food is very important for the
customers especially when they choose a restaurant. The results of this study are not exactly the
same previous studies. There are close relationships between service quality and customer
loyalty. Hypothesis two (H2) that service quality positively affects customer loyalty has a direct
influence particularly significant customer loyalty.
According to the study by Singh (1991); Manfred & Grund (2000); Dermanov & Eklof (2001);
Chang & Yuan (2002), defines satisfaction include the satisfaction of performance and service in the
perspective of consumers and national conditions. Results from this study showed that there is close
relationship between service quality and customer satisfaction as well as specify interactions between
two factors.
5.1.3 Impact of customer satisfaction on customer loyalty
In studying customer behavior, the relationship between satisfaction and loyalty have been
found out (Kandampully & Suhartanto, 2000). And one of the main goals of this study was to
32
explore the relationship between customer satisfaction and customer loyalty. Under the previous
thesis, higher satisfaction created greater loyalty significantly. The experimental results show
that the KFC restaurant in the Vietnamese market, if customer satisfaction is higher, loyal
customers will be higher. As well as, Customer satisfaction positively affect Customer loyalty
(H4).
5.1.4 Impact of brand image on customer loyalty
According to research by Huber and Herman (2001), the relationship between positive brand
image and product and customer loyalty has always existed (clotty et al, 2008). Customer loyalty
is a true measure of brand image. The result shows that Brand image positively affect Customer
loyalty (H5).
This study references identifiable correlation relationship between factors: location, brand
image, service quality, customer satisfaction to customer loyalty, and also the relationship between
service quality and customers’ satisfaction in the Vietnamese segment. This research directions not
the same as most other markets, because Vietnam is a tropical country, whose economy is on the rise,
and lead to differences is the relationship between service quality and customer loyalty. If in a large
of previous thesis, will show clearly show the relationship between the two factors, but is here, only a
few parts of the services that affect loyalty, not completed quite right about the relationship of its. We
can conclusions as follow:
Table 8. Hypotheses Testing Results
Hypotheses Results H1 Location positively affect Customer loyalty. Supported H2 Service quality positively affect Customer loyalty. Not supported H3 Service quality positively affect Customer satisfaction. Supported H4 Customer satisfaction positively affect Customer loyalty. Supported H5 Brand image positively affect Customer loyalty. Supported
5.2 Managerial Implications
That is a set of recommendations to management. This study developed the correlations
between factors at KFC in Vietnam market. The problem is how to build Customer Loyalty has been
discussed by many scholars. This study synthesized American Customer Loyalty model, Asian
Customer Loyalty model as the theoretical basis. Moreover, it used a multiple indicator approach to

33
measure overall Customer Loyalty as a latent variable. It is essential to improve the quality of the
following factors in order to enhance the Customer Loyalty.
Large numbers of all previous studies have demonstrated the relationship between service
quality and loyalty. In this study, the average value of the questions getting are greater than 3,
indicating that customers are seeing the benefits of using the service at KFC restaurants. But the
direct relationship between service quality and loyalty are not displayed, shows that the mean scores
of loyalty and service quality are not high. Besides, different quality of service will affect the
different management policies. Mostly of customers in the restaurant KFC said that food is very good,
but the service is not really good, but that would lead to their loyalty to the low quality of service. We
can say that, with few customers, their loyalty from the appropriate restaurant locations with their
request, or come from that brand. Under certain conditions, sometime, customers will be based on
the expected future to evaluate the quality of a product (Cardozo, 1965).
The key to the success of the management how to be able to entice the customers to serve them
with the best quality service and makes customer loyalty on the increase.
Improve customers' perceived value
According Lee, Lee and Yoo (2000), customers can not necessarily buy the best quality service,
but instead they can buy services provide more satisfaction. There are several factors that affect
customer satisfaction on service quality, which affect customer loyalty. In addition, KFC restaurant
manager can improve service quality, and maintain the value achieved in customer satisfaction. This
not only allows them to earn immediate profits, but can also predict future profitability.
Therefore, the first step to enhance customer loyalty is to understand the customer in order to
improve the original value, and increase the value that customer want. Grewal, Monroe and Krishnan
(1998) proposed the factors that affect the customer perceived value as different group will vary. So
the customer can classify and make policies consistent with their needs, at the same time increasing
the satisfaction and loyalty of customers.
Managerial implications
If the menu and the food in the restaurant KFC is not the main reason leading to service quality
and customer satisfaction is not high, so it is possible through manifestations and how to respond to
the questionnaire ask for reforming business strategy. In order to retain bill, KFC restaurant should
34
understand the interests and how much customer willingness to pay. Based on the research finding;
therefore, the following recommendations are forwarded:
1. Customers to the restaurant, there are 93.16% of customers traveling with friends and
relatives. Therefore, from this characteristic, may consider building appropriate menus,
multiple categories so that customers can choose.
2. Most consumers are aged under 30 year olds, therefore, they are often interested in
eating as much food and hope the restaurant features that attract the attention of customers.
Therefore, managers should consider, develop promotional strategies to attract customers.
3. Service quality can perfect start from the restaurant manager, then to the restaurant
staff. Management should treat its employees, from which staff also used the way that
management treat yourself, treat customers.
4. Manager actively monitor customer satisfaction, aim for satisfaction when responding
to the question and concern because (1) these ten to be highly customer loyalty and (2) these
customer will influence others through word-of-mouth after the contact. Managers also
understand the roots of dissatisfaction because of the potential for negative outcomes such as
negative word-of-mouth communication, complaint and profit (Hoyer and Marcinnis, 2009).
5. Vietnam's economy is growing the economy, therefore the income of the people than
the world thought to be low. Consumer demand of people so that also heavily constrained.
With income of less than 6 million, consumer hope the money they spend per consumer is
not too high, only 250 thousand or less. Therefore, the managers need to consider how the
construction menu, and appropriate to the needs of customers, while ensuring profits for
restaurants.
5.3 Limitations and Future Research Directions
5.3.1 Limitations of this research
There are also few limitations of this research which are important to mention because they are
helpful in understanding the factors which are affecting the ability of this research to conclude the
research in the desired manner and achieve the already established research objectives (Saunders,
Lewis and Thornhill, 2009). The main limitation of this research is that it is focused on collecting the
35
primary data from the customers who are visiting the KFC restaurants. The data collected, therefore,
may not have fully reflected reality due the fact that some respondents may not have remembered
those information well.
Another limitation of this research is that the investigator is the student and lack of sufficient
financial resources have restricted the ability of the researcher to visit fast food restaurants in
different regions and interact with different types of customers in order to get the questionnaires
filled.
Third, this study used random sampling, although the samples size up to more than 307
respondents, but it may still be based compared to the population.
Finally, this study did not show the differences of KFC restaurant and other fast food restaurant
in the level of service quality, satisfaction/dissatisfaction and other factors.
5.3.2 Suggestions for future research
On the one hand, this study was a measure of customer loyalty of KFC. If the company wants to
get closer to customers, they should study other customers on some specific aspects such as attention
purchases, customer satisfaction, service quality, location and brand. More specifically, restaurant
managers can focus on developing a menu with high attractiveness. Improve quality of service is also
extremely important, should implement reforms from the apparatus at the restaurant staff. This is
very practical and should be done immediately, so bring new changes in the customer's perception of
the services and products of the restaurant.
On the other hand, with the limitation of time and ability, this research is just adopted the model
of Aaker (1991). To improve this problem, the following topics can manipulate individual
advantages to minimize the disadvantages for their research, including research performed by
observing the activities of customer in a certain period, determines how often the customer to shop
and a deeper understanding of customer satisfaction through the construction of a more detailed
questionnaire. In addition, may conduct interviews with the managing of the restaurant, to find out
the situation of consumption in restaurants, in future, be able to plan to implement the policy how to
raise the amount of guests customers are willing to pay each time to the restaurant.
With regard to the research limitations, in future should be provide more dimension of five
factors: Location, Service quality, Customer satisfaction, Brand image and Customer loyalty.

36
Moreover, it is also advisable for future researches to focus on loyalty. Besides, future research can
center on the differences between KFC restaurant and other fast food restaurant in Vietnam in the
level of customer loyalty and others factors.

37
References Aaker, D. A. (1991), Managing brand equity, New York: The Free Press.
Aaker, D.A., R. Jacobson. (1994) Study shows brand-building pays off for stockholders.
Advertising Age.
Assael, H. (1992). Consumer behavior and marketing action. Boston: PWS-Kent Publishing.
Bagozzi, Richard P. and Youjae Yi (1988). “On the Evaluation of Structural Equation Models,”
Journal of the Academy of Marketing Science, 74-94.
Bagozzi, R. P. (1993). “Assessing construct validity in personality research: Applications to
measures of self-esteem”, Journal of Research in Personality, 27, pp.49–87.
Bell, J. and Opie, C. (2002), Learning from Research: Getting More from your Data,
Buckingham: Open University Press.
Berry, Parasuraman and Zeithaml, "Improving Service Quality in America: Lessons Learned,"
Academy of Management Executive, May 1994, pp. 32-52.
Biel, A.L. (1992), How brand image drives brand equity, Journal of Advertising Research,
November/December: 9.
Bloemer, J. & De Ruyter, K. (1998). On the relationship between store image, store satisfaction
and store loyalty. European Journal of Marketing, 499–513.
Bryman, B. and Bell, E. (2011) Business Research Methods, 3rd ed., Oxford: Oxford University
Press.
Cavana, R., Delahaye, B., and Sekaran, U. Applied Business Research: Qualitative and
Quantitative Methods, (3rd ed.) John Wiley & Sons Australia, Ltd, 2001.
Cardozo, R. N., 1965, An Experimental Study of Customer Effort, Expectation, and Satisfaction,
Journal of Marketing Research, Vol. 2, No. 3, pp.244-249.
Chang, C. H., & Yuan, S. J. (2002). Service-oriented industrial management. Taipei: Yang-Chih
Book Co. Ltd.
38
Chiang, C. F., & Jang, S. S. C. (2007). The effects of perceived price and brand image on value
and purchase intention: Leisure travelers’ attitudes toward online hotel booking. Journal of
Hospitality Marketing and Management, 49-69.
Chi, C. and Qu, H. (2008), Examining the structural relationships of destination image, tourist
satisfaction and destination loyalty: An integrated approach, International Journal of
Tourism Management, Vol. 29, pp. 624-636.
Churchill G. A. Jr & Surprenant, C. (1982), An investigation into the determinants of customer
satisfaction, Journal of Marketing Research, Vol.19, No.4, pp491-504.
Clottey, T.A., Collier, D.A., & Stodnick, M. (2008). Drivers of customer loyalty in a retail store
environment. Journal of Service Science, 35-48.
Cooper, P., 2006. Adapting Management Accounting Knowledge Needs to Functional and
Economic Change. Accounting Education 15(3), 287-300.
Cronin, J.J., Jr., Brady, M.K. and Hult, G.T.M. (2000) ‘Assessing the Effects of Quality, Value,
and Customer Satisfaction on Consumer Behavioral Intentions in Service Environments’,
Journal of Retailing 76(2): 193–218.
Day, R.L. (1977). Extending the Concept of Consumer Satisfaction. Advances in Consumer
Research, 4(1), 149-154.
Dermanov, V., & Eklöf, J. (2001). Using aggregate customer satisfaction index: Challenges and
problems of comparison with special reference to Russia. Total Quality Management and
Business Excellence, 1054-1063.
Diamantopoulos, A. and Siguaw, J.A. (2000), Introducing LISREL. London: Sage Publications.
Dimitriades, S. (2006), Customer satisfaction, loyalty and commitment in service organizations –
Some evidence from Greece, Management Research News, Vol. 29 No. 12, pp. 782-800.
Feldman, Maryann P. and Ali S. Kutay. 1997. "Innovation and Strategy in Space: Towards a
New Location Theory of the Firm," in C.S. Berluglia, S. Lombardo, P. Nijkamp (eds.),
Innovative Behavior in Space and Time, Springer, Berlin Heidelberg New York.
Faullant, R., Matzler, K. and Fuller, J. (2008), The impact of satisfaction and image on loyalty:
the case of Alpine ski resorts, Managing of Service Quality, Vol. 18 No. 2, pp. 163-178.

39
Gill John and Phil Johnson (2010), Research Methods for Managers, Fourth edition, London:
Sage.
Grewal, D., Monroe, K. B. and Krishnan, R., 1998, The Effects of Price-Comparison Advertising
on Buyers’ Perceptions of Acquisition Value, Transaction Value, and Behavioral Intentions,
The Journal of Marketing, Vol. 62, No.2, pp.46-59.
Griffin, J. (1996), “The internet’s expanding role in building customer loyalty”, Direct
Marketing, 59(7), pp. 50-3.
Grönroos, C. (1998), Marketing service: the case of the missing product. The journal of Business
& Industrial Marketing, 13 (4/5), 322-332.
Haahti, Antti & Yavas, Ugur (2005), The effect of Customer Satisfaction with Leisure Services on Behavioral Intentions, Services Marketing Quarterly, 26(3), 1-12.
Hair Jr., J. F., Anderson, R.E., Tatham, R.L. and Black, W.C. (1998), Multivariate data analysis,
Prentice Hall, New Jersey.
Hair, Jr., J.F., Black, W.C., Babin, B.J., Anderson, R.E., Tatham, R.L., 2006. Multivariate data
analysis (6th Ed.), Pearson-Prentice Hall, Upper Saddle River, NJ.
Heskett, J., Sasser, W. E. J., & Schlesinger, L. (1997). The service profit chain: How leading
companies link profit and growth to loyalty, satisfaction, and value. New York.
Hoyer,W.D. and Macinnis,D.J.(2009), Consumer behavior. 5 th ed. USA: Cengage learning.
Huber F., Herrmann A., Morgan R.E. (2001): Gaining competitive advantage through customer
value oriented management. Journal of Consumer Marketing, Vol. 18, No. 1, pp. 41-53.
Hyun SS (2010). Predictors of relationship quality and loyalty in the chain restaurant industry.
Cornell Hosp. Q., 51(2): 251-267.
Ibrahim, H. & Najjar, F. (2008), Relationship bonding tactics, personality traits, relationship
quality and customer loyalty: Behavioral sequence in retail environment, The Icfai
University Journal of Services Marketing, 6(4), 1-37.
Jennifer, K. L. C., & Tom, B. (2007). Researching consumer satisfaction: An extension of
Herzberg’s motivator and hygiene factor theory. Journal of Travel and Tourism Marketing,
23(1), 71-83.

40
Jones, Thomas O. and W. Earl Sasser Jr. (1995), “Why Satisfied Customer Defect”, Harvard
Business Review, 73 (November/December) 88-99.
Kandampully, J. & Suhartanto, D. (2000), Customer loyalty in the hotel industry: the role of
customer satisfaction and image, International Journal of Contemporary Hospitality
Management, 12(6), 346-351.
Kotler, Philip (2000): Marketing Management. The Millenium Edition. Prentice Hall.
Kotler, P. & Armstrong, G. (2008). Principles of Marketing (12th ed.). Upper Saddle River, NJ:
Prentice Hall.
Kotler, P and Keller, K.L., (2006) Marketing Management 12th Ed, Upper Saddle River,
Pearson.
Kuo, Y.F. (2004). Integrating Kano’s Model into Web- community Service Quality. Total
Quality Management and Business Excellence, 15(7), 925-939.
Kapil Rajendra Kumar TULI, Sundar BHARADWAJ, and Andre BONFRER, 2011, "The
Impact of Brand Quality on Shareholder Value", Journal of Marketing, American Marketing
Association, 88-104, United States Of America.
Liao, K.H. (2007). The Study of Causal Relationships among Telecommunication Service
Quality, Customer Satisfaction, and Loyalty-Samples of customers in the Taiwan Area.
Industrial Engineering & Management System & 2007 Chinese Institute of Industrial
Engineers, 53.
Lee, H., Lee, Y., and Yoo, D., 2000, The determinants of perceived service quality and its
relationship with satisfaction, Journal of Service Marketing, Vol. 14, No. 3, pp.217-231.
Lee, M.S., Hsiao, H.D. and Yang, M.F. (2010), The study of the relationships among
experimental marketing, service quality, customer satisfaction and customer loyalty,
International Journal of Organizational Innovation , Vol. 3 No. 2, pp. 353-379.
Lee, E.J. & Overby, J.W. (2004), Creating value for online shoppers: Implications for
satisfaction and loyalty, Journal of Consumer Satisfaction, Dissatisfaction and Complaining
Behavior, 17, 54-67.
41
Mackenzie, S. B., & Spreng, R. A. (1992). How does motivation moderate the impact of central
and peripheral processing on brand attitudes and intentions? Journal of Consumer Research,
18(4), 519-529.
Manfred, B., & Grund, M. A. (2000). Theory, development and implementation of national
customer satisfaction indices: The Swiss Index of Customer Satisfaction (SWICS). Total
Quality Management and Business Excellence, 1017-1028.
Martin, B., Ugur, Y., & Dirk, F. (2003). Emotional and cognitive antecedents of customer
satisfaction in leisure services: The case of the rostock zoo. Journal of Hospitality
Marketing and Management, 173-184.
Matthew, C. H., & Christine, T. E. (2000). From customer satisfaction to profitability. Journal of
Strategic Marketing, 8(4), 313-326.
McColl-Kennedy, J., & Schneider, U. (2000). Measuring customer satisfaction: why, what and
how. Total Quality Management, 11 (7), 1-14.
Mills, P. K., and Morris, J. H. (1986), "Clients as “Partial” Employees of Service Organizations:
Role Development in Client Participation", The Academy of Management Review, Vol. 11
No. 4, pp. 726–735.
Mohammad Haghighi, Ali Dorosti, Afshin Rahnama & Ali Hoseinpour (2012), Evaluation of
factors affecting customer loyalty in the restaurant industry, African Journal of Business
Management Vol. 6(14), pp. 5039-5046.
Norman, D.A. (1991), Cognitive Artifacts. In Carroll (Ed.), Designing interaction: psychology at
the human computer interface. Cambridge: CUP. p. 17-38.
Nunnally, J. C. (1978). Psychometric theory (2nd ed.). New York: McGraw-Hill.
Nunnally, J. C., & Bernstein, I. H. (1994). Psychometric theory (3rd ed.). New York:
McGraw-Hill.
Oh, H. (1999). Service quality, customer satisfaction and customer value: A holistic perspective.
International Journal of Hospitality Management, 67-82.
42
Orth, U.R. & Green, M.T. (2009). Consumer loyalty to family versus non-family business: The
roles of store image, trust and satisfaction. Journal of Retailing and Consumer Services,
16(4), 248-259.
Osman, M.Z. (1993). A conceptual model of retail image influences on loyalty patronage
behaviour. The International Review of Retail, Distribution and Consumer Research,
133–148.
Parasuraman, A., Zeithaml, V. A., & Berry, L. L. (1985).A conceptual model of service quality
and its implications for future research. Journal of Marketing, 12–40.
Powpaka, S. (1996), “The role of outcome quality as a determinant of overall service quality in
different categories of services industries: an empirical investigation”, Journal of Services
Marketing, Vol. 10 No. 2, pp. 5-25.
Parasuraman, Zeithaml and Berry (1985), A Conceptual Model of Service Quality and Its
Implications for Future Research, Journal of Marketing, Vol 49, pp. 41-50.
Reichheld, F.F. (1996). The Loyalty Effect. The Hidden Forces Behind Growth, Profits, and
Lasting Value, MA: Harvard Business School Press, Boston.
Reichheld, F. & Sasser, W.E., Jr. (1990). Zero defections: Quality comes to services. In J.J.
Sviokla & B.P. Shapiro (Eds.), Keeping customers (pp.311-324). Boston: Harvard Business
Review.
Roberts, PW and Dowling, GR (2002) Corporate reputation and sustained superior financial
performance. Strategic Management Journal, 23, pp. 1077-1093.
Saunders, M., Lewis, P., and Thornhill, A. (2007), Research methods for business students (4th
edition) Harlow: Pearson Education.
Saunders, M.N.K., Lewis, P., & Thornhill, A. (2009). Research Methods for Business Students
(5th ed.). Harlow, United Kingdom: FT Prentice Hall.
Schneider, B. and D. E. Bowen (1993), “The Servive Organization: Human Resource
Management Is Crucial”, Organizational Dynamics, Vol. No. Spring, pp 39-52.
Schneider, B. and D. E. Bowen (1993), Winning the Service Game, Havard Business School
Press, Boston, Massachusetts.

43
Schneider, B., Paul, M. C., & White, S. S. (1998). Too much of a good thing: A
multiple-constituency perspective on service organization effectiveness. Journal of Service
Research, 1, 93–102.
Scott, A. J. (1993), Technoplis: High Technology Industry and Regional Development in
Southern California. University of California Press Berkeley.
Singh, J. (1991). Understanding the Structure of Consumers Satisfaction Evaluation of Service
Delivery. Journal of the Academy of Marketing Science, 223-234.
Snoj, B. & Mumel, D. (2002). The measurement of perceived differences in service quality -the
case of health spas in Slovenia. Journal of Vacation Marketing, 8(4): 362-379.
Stebbing L. (1993). Quality assurance 3 rd edition. Ellis Horwood: Chichester, UK.
Storbacka, K., Strandvik, T., & Grönroos, C. (1994). Managing customer relationships for profit:
The dynamics of relationship quality. International Journal of Service Industry Management,
5, 21–38.
Storper, M. and Walker, R. (1988), The Capitalist Imperative: Territory, Technology and
Industrial Growth. Basil Blackwell Oxford.
Szymanski, D. M. and Henard, D. H. (2001), Customer satisfaction: A meta-analysis of the
empirical evidence, Journal of Academic of Marketing Science, Vol. 29, pp. 16–35.
Xiang, L., & James, F. P. (2010). Towards an integrative model of loyalty formation: The role of
quality and value. Leisure Sciences: An Interdisciplinary Journal, 32(3), 201-221.
Yin, Robert K. (2003). Case study research, design and methods (3rd ed., vol. 5). Thousand
Oaks: Sage.
Zeithaml, V.A., Berry, L.L. and Parasuraman, A. (1996), “The behavioral consequences of
service quality”, Journal of Marketing, Vol. 60, pp. 31-46.
Zeithaml, V. and Bitner, M. (2003), Service Marketing: Integrating Customer Focus across the
Firm, McGraw-Hill, New York.
Zeithaml, V. A., Parasuraman, A., and Malhotra, A. (2002), Service quality delivery through
Web sites: A critical review of extant knowledge, Journal of the Academic of Marketing
Science , Vol. 30, pp. 362–375.
44
Walker, J. R., & Lundberg, D. E. (2005). The Restaurant: From Concept to Operation (4th ed.).
Hoboken, NY: John Wiley & Sons, Inc.
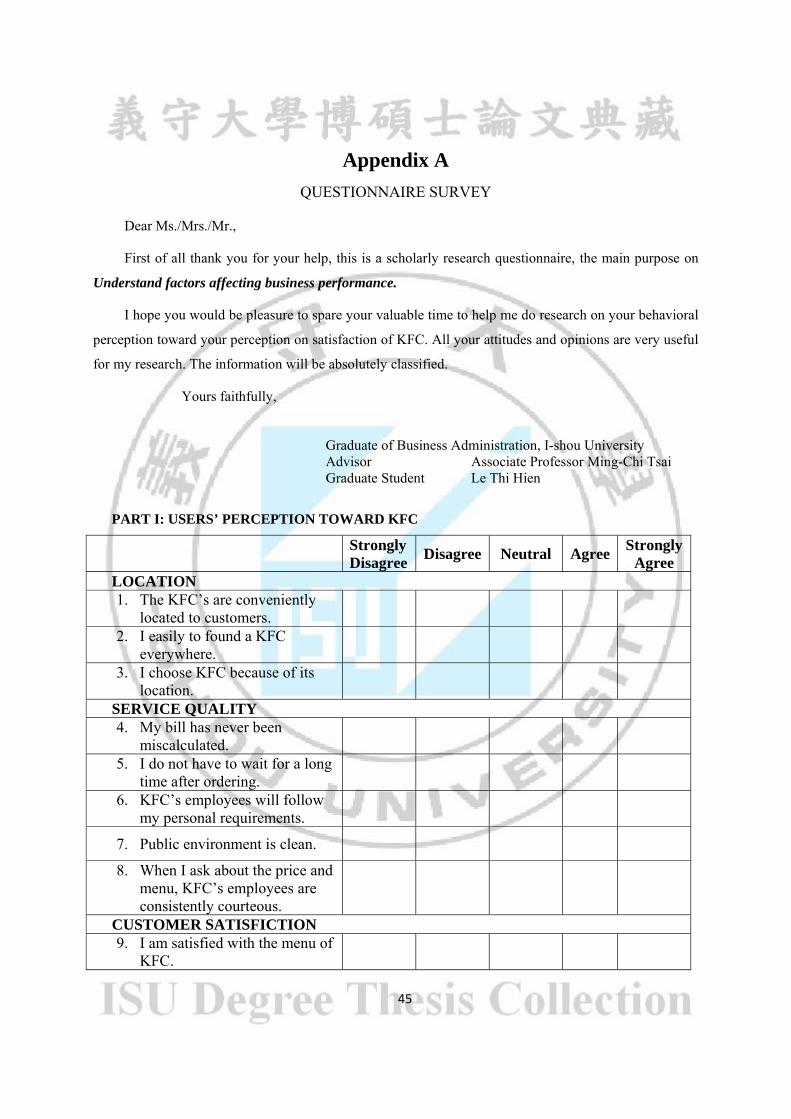
45
Appendix A
QUESTIONNAIRE SURVEY
Dear Ms./Mrs./Mr.,
First of all thank you for your help, this is a scholarly research questionnaire, the main purpose on
Understand factors affecting business performance.
I hope you would be pleasure to spare your valuable time to help me do research on your behavioral
perception toward your perception on satisfaction of KFC. All your attitudes and opinions are very useful
for my research. The information will be absolutely classified.
Yours faithfully,
Graduate of Business Administration, I-shou University Advisor Associate Professor Ming-Chi Tsai Graduate Student Le Thi Hien
PART I: USERS’ PERCEPTION TOWARD KFC
Strongly Disagree
Disagree Neutral Agree Strongly
Agree LOCATION 1. The KFC’s are conveniently
located to customers.
2. I easily to found a KFC everywhere.
3. I choose KFC because of its location.
SERVICE QUALITY 4. My bill has never been
miscalculated.
5. I do not have to wait for a long time after ordering.
6. KFC’s employees will follow my personal requirements.
7. Public environment is clean.
8. When I ask about the price and menu, KFC’s employees are consistently courteous.
CUSTOMER SATISFICTION 9. I am satisfied with the menu of
KFC.
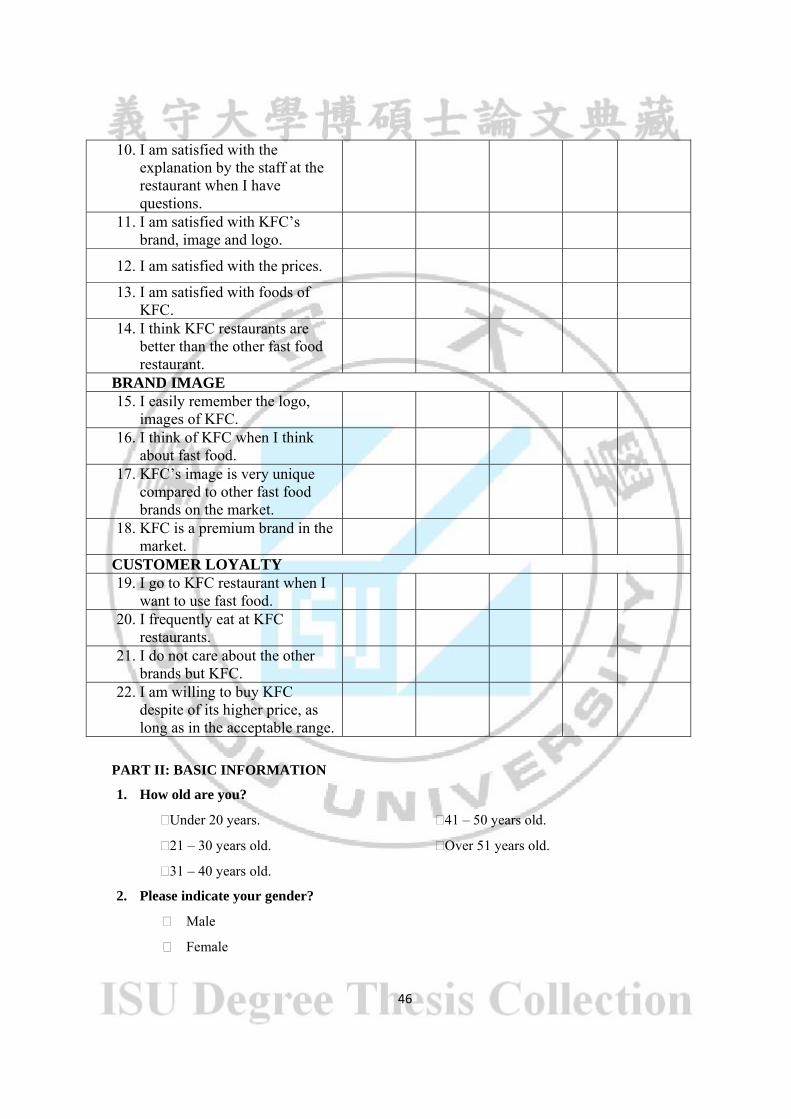
46
10. I am satisfied with the explanation by the staff at the restaurant when I have questions.
11. I am satisfied with KFC’s brand, image and logo.
12. I am satisfied with the prices.
13. I am satisfied with foods of KFC.
14. I think KFC restaurants are better than the other fast food restaurant.
BRAND IMAGE 15. I easily remember the logo,
images of KFC.
16. I think of KFC when I think about fast food.
17. KFC’s image is very unique compared to other fast food brands on the market.
18. KFC is a premium brand in the market.
CUSTOMER LOYALTY 19. I go to KFC restaurant when I
want to use fast food.
20. I frequently eat at KFC restaurants.
21. I do not care about the other brands but KFC.
22. I am willing to buy KFC despite of its higher price, as long as in the acceptable range.
PART II: BASIC INFORMATION
1. How old are you?
Under 20 years. 41 – 50 years old.
21 – 30 years old. Over 51 years old.
31 – 40 years old.
2. Please indicate your gender?
Male
Female

47
3. Please indicate your status?
Single In a relationship
Get married Divorced
4. When you go to KFC restaurants, you will come with?
Alone. Your family.
Your friends. Your colleague.
5. Please indicate your profession?
Engineering. Servicer
Officer Farmer
Worker Scientific research
State government. Other.
6. Please indicate your monthly income?
Under VND 2 million. VND 2.001 – 4 million.
VND 4.001 – 6 million. VND 6.001 – 8 million.
VND 8.001 – 10 million. Over VND 10.001 million.
7. Where is your regions?
Northwest Northeast
Red River Delta North central coast
Central highlands South central coast
Mekong Delta Southeast 8. How far is it from your home to KFC?
Under 1000m 1001 – 2000m
2001 – 3000m 3001 – 4000m
4001 – 5000m Over 5001m
9. How long since the last time you ate at KFC?
Under 7 days.
8 – 14 days.
15 – 21 days.
22 – 28 days.
Longer than 29 days.
Never.

48
10. How often you visit KFC food restaurants?
Once in a month.
Twice in a month.
Once in a week.
Twice in a week.
Daily.
11. How much will you spend in KFC?
Under VND 100,000.
VND 101,000 – 250,000.
VND 251,000 – 400,000.
VND 401,000 – 550,000.
VND 551,000 – 700,000.
Over VND 701,000.
Questionnaire ended.
Thank you for taking the time to fill in this questionnaire and ask you to check for omissions, thank
you for your support of academic research.
Best wish for you!